Discrepancy between Jun/Fos Proto-Oncogene mRNA and Protein Expression in the Rheumatoid Arthritis Synovial Membrane


1
Experimental Rheumatology Unit, Department of Orthopedics, Jena University Hospital, Waldkliniken Eisenberg GmbH, 07607 Eisenberg, Germany
2
Institute of Clinical Chemistry, Hannover Medical School, 30625 Hannover, Germany
3
Department of Rheumatology and Clinical Immunology, Charité University Hospital, Humboldt University Berlin, 10117 Berlin, Germany
*
Author to whom correspondence should be addressed.
J 2020, 3(2), 181-194; https://0-doi-org.brum.beds.ac.uk/10.3390/j3020015
Submission received: 13 March 2020
/
Revised: 27 April 2020
/
Accepted: 1 May 2020
/
Published: 5 May 2020
Abstract
:Rheumatoid arthritis (RA) is a chronic inflammatory and destructive joint disease characterized by overexpression of pro-inflammatory/pro-destructive mediators, whose regulation has been the focus of our previous studies. Since the expression of these proteins commonly depends on AP-1, the expression of the AP-1-forming subunits cJun, JunB, JunD, and cFos was assessed in synovial membrane (SM) samples of RA, osteoarthritis (OA), joint trauma (JT), and normal controls (NC) using ELISA and qRT-PCR. With respect to an observed discrepancy between mRNA and protein levels, the expression of the mRNA stability-modifying factors AU-rich element RNA-binding protein (AUF)-1, tristetraprolin (TTP), and human antigen R (HuR) was measured. JunB and JunD protein expression was significantly higher in RA-SM compared to OA and/or NC. By contrast, jun/fos mRNA expression was significantly (cjun) or numerically decreased (junB, junD, cfos) in RA and OA compared to JT and/or NC. Remarkably, TTP and HuR were also affected by discrepancies between their mRNA and protein levels, since they were significantly decreased at the mRNA level in RA versus NC, but significantly or numerically increased at the protein level when compared to JT and NC. Discrepancies between the mRNA and protein expression for Jun/Fos and TTP/HuR suggest broad alterations of post-transcriptional processes in the RA-SM. In this context, increased levels of mRNA-destabilizing TTP may contribute to the low levels of jun/fos and ttp/hur mRNA, whereas abundant mRNA-stabilizing HuR may augment translation of the remaining mRNA into protein with potential consequences for the composition of the resulting AP-1 complexes and the expression of AP-1-dependent genes in RA.
1. Introduction
Rheumatoid arthritis (RA) is characterized by chronic inflammation and destruction of multiple joints, perpetuated by an invasive pannus tissue. Activated fibroblast-like synoviocytes (FLS) are a major component of the pannus and contribute to joint destruction by secretion of pro-inflammatory cytokines and tissue-degrading enzymes [1]. In former studies, our group analyzed the expression and regulation of proteins involved in the inflammatory, destructive, and fibrotic processes observed in RA, e.g., cytokines [2,3,4], proteases [2,5], or collagens [6]. A variety of these proteins is regulated by the transcription factor activating protein (AP)-1, e.g., matrix metalloproteases 1, 3, and 13, interleukin (IL)-1β, IL-6, and tumor necrosis factor (TNF) [7]. Consistently, AP-1—classically a homo-/heterodimer of proteins of the Jun and Fos proto-oncogene families [8]—appears strongly involved in the activation of RA-FLS [9,10] and is considered as critically involved in RA pathogenesis [7,11]. Moreover, cJun and cFos are regarded as activating AP-1 subunits, whereas JunD and JunB mediate predominantly deactivating/inhibitory effects [12]. Genetic deletion of cjun, for instance, led to the amelioration of arthritis in a murine arthritis model [13]. Therefore, and to expand a former study focusing on the junB expression in the synovial membrane (SM) of patients with rheumatic diseases [14], the expression of AP-1 subunits in the RA-SM was analyzed. As controls, samples from osteoarthritis (OA) and joint trauma (JT) patients were used, as well as postmortem normal controls (NC).
In the course of our analyses, a remarkable discrepancy between the mRNA and protein levels of certain jun and fos genes was detected, leading to the consideration of mRNA stability-regulating proteins. In their 3′-untranslated regions (3′-UTR), jun and fos mRNA molecules contain U-/AU-rich elements (ARE), which play an important role in the regulation of mRNA stability [15]. ARE-binding, mRNA stability-modifying proteins such as mRNA-stabilizing human antigen R (HuR) or destabilizing AU-rich element RNA-binding protein (AUF)-1 and tristetraprolin (TTP) influence the mRNA decay or stabilize deadenylated mRNA intermediates [16]. HuR is known to inhibit cfos and (to a lesser extent) cjun mRNA decay [17] and is expressed in elevated levels in RA synovium [18]. TTP shows distinct but overlapping binding specificities with HuR [15]. Though generally regarded as an anti-inflammatory regulator [19], TTP has also been detected in enhanced levels in RA [20], as observed in both the synovial tissue [21,22] and specific synovial cell types (e.g., macrophages, FLS, and vascular endothelial cells) [21]. Interestingly, among the mRNA stability-modifying proteins with mutual or autoregulatory capacity [23], TTP and HuR were also characterized by discrepancies between their mRNA and protein levels in the RA-SM, suggesting broader alterations of the mRNA metabolism in rheumatic diseases.
2. Materials and Methods
2.1. Tissue Collection and Preparation
The SM samples used in this study were obtained during joint replacement/synovectomy from RA and OA patients (n = 24 each, Clinic of Orthopedics, Eisenberg). Tissue samples from JT surgery (Department of Traumatology, University Jena; n = 9) were used as disease controls, and samples from postmortem biopsy (Humboldt University Berlin, n = 5) were used as normal controls (Table S1). After removal, tissue samples were frozen and stored at −70 °C. RA and OA patients were classified according to the respective criteria of the American College of Rheumatology [24,25] valid in the period of sample collection. Written informed patient consent was obtained from all participating patients or (in the case of postmortem samples) relatives. The study was approved by the ethics committees of the Friedrich Schiller University Jena ((i) code: 0256-5/99, date: 15.05.1999 and (ii) code: 1154/-07/03, date: 30.06.2004) and the Humboldt University Berlin (code: EA1/193/10, date: 26.04.2012) in accordance with the declaration of Helsinki.
2.2. Purification of Total RNA and cDNA Synthesis
Tissue homogenization, total RNA isolation, treatment with RNase-free DNase I (Qiagen, Hilden, Germany), and cDNA synthesis were performed in accordance with [14]. mRNA integrity was confirmed using an Agilent 2100 Bioanalyzer (Agilent Technologies Deutschland GmbH, Waldbronn, Germany). DNA concentrations were determined using a Nanodrop ND-1000 system (PeqLab, Erlangen, Germany).
2.3. Real-Time RT-PCR
For real-time RT-PCR, a LightCycler 2.0 was used (Roche Diagnostics, Mannheim, Germany). PCR reactions were performed as previously described [14]. In order to normalize the amount of cDNA in each sample and to guarantee comparability of the calculated proto-oncogene mRNA expression in all analyzed samples, the housekeeping gene glyceraldehyde 3-phosphate dehydrogenase (GAPDH) was amplified, and the samples were diluted for quantitation using the respective dilution factors [14]. The general amplification protocol (50 cycles) was set as follows (for details, see Table S2): initial denaturation: 3 min, 95 °C; gene-specific settings for denaturation, primer annealing, amplification, and additional heating step (heating/cooling speed 20 °C/s). The general settings for the melting curve protocol (1 cycle) were as follows: denaturation: 0 s, 95 °C; gene-specific settings for cooling; heating: 0 s, 95 °C (speed 0.1 °C/s); final cooling: 5 min, 40 °C; speed: 0.1 °C/s.
The fluorescence emitted by dsDNA-bound SYBR-Green was measured once at the end of each additional heating step and continuously during the melting curve program. The concentrations of cDNA present in each sample were calculated by the LightCycler software using external standard curves (generated using 10-fold dilutions of plasmids containing the respective target sequence). Quality controls containing only water were consistently negative.
2.4. Preparation of Nuclear Extracts and Whole-Cell Extracts from Tissue Samples
Nuclear extracts (for Jun and Fos protein expression analyses) and whole-cell extracts (for AUF-1, TTP, and HuR protein expression analyses) were prepared from RA-SM samples (n = 13 for Jun/Fos proteins; n = 6 for AUF-1, TTP, and HuR), OA-SM samples (n = 13 and n = 6, respectively), JT samples (n = 6 and n = 3, respectively), and postmortem NC (n = 5 and n = 2, respectively) as previously described [26].
2.5. ELISA-Based Jun/Fos Protein Quantitation
For cJun protein detection, the ELISA-based BD Mercury TransFactor cJun Kit (Clontech laboratories, Palo Alto, CA, USA) with AP-1 consensus sequence-coated wells was used in accordance with the manufacturer´s instructions (double determinations), including the following deviations from the manual: The primary cJun antibody (mouse mAb, 0.5 μg/μL) was diluted 1:50 in 1 × TransFactor buffer/blocking reagent. The secondary Ab (goat anti-mouse IgG-HRP, 1 μg/μL) was diluted 1:100 in 1 × TransFactor buffer/blocking reagent. Subsequently, tetramethyl-benzidine (TMB) substrate (Clontech) was added, and the samples were incubated for 2 h at room temperature.
For JunB, JunD, and cFos protein detection, the TransAM AP-1 Family Kit (ELISA-based, AP-1 consensus sequence-coated wells; Active Motif, Rixensart, Belgium) was used in accordance with the manufacturer´s instructions (single determinations). Each sample was incubated with TMB substrate (Active Motif) for 20 min. In all cases, nuclear extract of phorbol 12-myristate 13-acetate-stimulated K4IM cells [27] served as a positive control.
After stopping the color development reaction by adding 1 M H2SO4 (cJun) or stop solution (JunB, JunD, and cFos; Active Motif), the absorbance of each sample was measured at 450 nm using a Fluostar Optima (BMG Labtechnologies GmbH, Offenburg, Germany). Quantitation analyses were performed using mathematical correction factors for the protein content as determined by the bicinchoninic acid assay (Pierce, Rockford, IL, USA).
2.6. Antibodies, SDS-PAGE, and Western Blot Analyses
For Western blot analyses of HuR, AUF-1, and TTP, the following antibodies were used: a mouse monoclonal anti-HuR-antibody (Santa Cruz Biotechnology, Santa Cruz, CA, USA), a rabbit polyclonal anti-AUF-1-antibody (Upstate, Lake Placid, NY, USA), and a rabbit polyclonal anti-TTP-antibody (Dartmouth Hitchcock Medical Center, Lebanon, NH, USA). All horseradish peroxidase conjugated secondary antibodies were purchased from Santa Cruz Biotechnology.
The protein content in nuclear or whole-cell extracts was determined using the bicinchoninic acid assay (Pierce). Subsequently, protein samples were adjusted to equal protein concentrations. For HuR, AUF-1, and TTP protein detection, SDS-PAGE (10%) with 10 μL of each adjusted cell extract sample was performed, followed by Western blot analysis. HuR was detected by anti-HuR antibody, diluted 1/250. Anti-AUF-1 and anti-TTP antibodies were diluted 1/4000 and 1/2500, respectively. All antibodies were diluted in Tris buffered saline with Tween 20 (TBS-T)/5% milk (Carl Roth GmbH, Karlsruhe, Germany). Integrated density of protein bands was analyzed using the Scion Image 4.0.2 software (Scion Corporation, Frederick, MD, USA) and corrected for background intensity.
2.7. Immunohistology/In Situ Hybridization
For immunohistochemical studies, polyclonal antibodies against cFos were raised, prepared, and purified as described in [14]. Immunohistochemical detection of cFos protein in cryostat sections, nuclear counterstaining by hematoxylin, and in situ hybridization using specific RNA probes for cfos were performed as previously described [14].
2.8. Statistical Analysis
Data were represented as box plots with median, confidence intervals (25% and 75%), and whiskers (min to max) using GraphPad Prism 5 (GraphPad Software Inc., San Diego, CA, USA). The Mann–Whitney U-test was applied to analyze differences among mRNA and protein levels in RA, OA, JT, and postmortem NC samples. Significant differences were accepted for p-values ≤ 0.05.
As the mRNA expression in JT and postmortem NC did not significantly differ, these groups were pooled for the purpose of correlation analyses. Correlation analyses among experimental results and between the results and the clinical features of the patients were performed using the Spearman rank test. In the latter case, only differences with a lower significance level (p ≤ 0.01) were regarded as statistically significant, in order to correct for multiple comparisons. The analyses were performed using the SPSS 12.0 software (SPSS Inc., Chicago, IL, USA).
Power analyses (G*power [28]) for significant differences among RA, OA, JT, and postmortem NC confirmed that: (i) For cjun mRNA the significant differences (alpha error probability of 0.05; power (1-β error probability) of 0.8) reached effect sizes of 0.72 and 0.82 (medium to large effect; as defined according to [29]); (ii) for JunB and JunD protein, the significant differences reached effect sizes of 1.07, 1.07, and 0.89, respectively (large effect); (iii) for ttp and hur mRNA, the significant differences reached effect sizes between 0.72 and 1.79 (medium to large effect; except for one case with 0.28; small); and (iv) for TTP protein, the significant differences reached effect sizes of 2.21 and 3.37 (huge effect; as defined according to [30]).
3. Results
3.1. Quantitation of Jun and Fos mRNA Expression in the SM
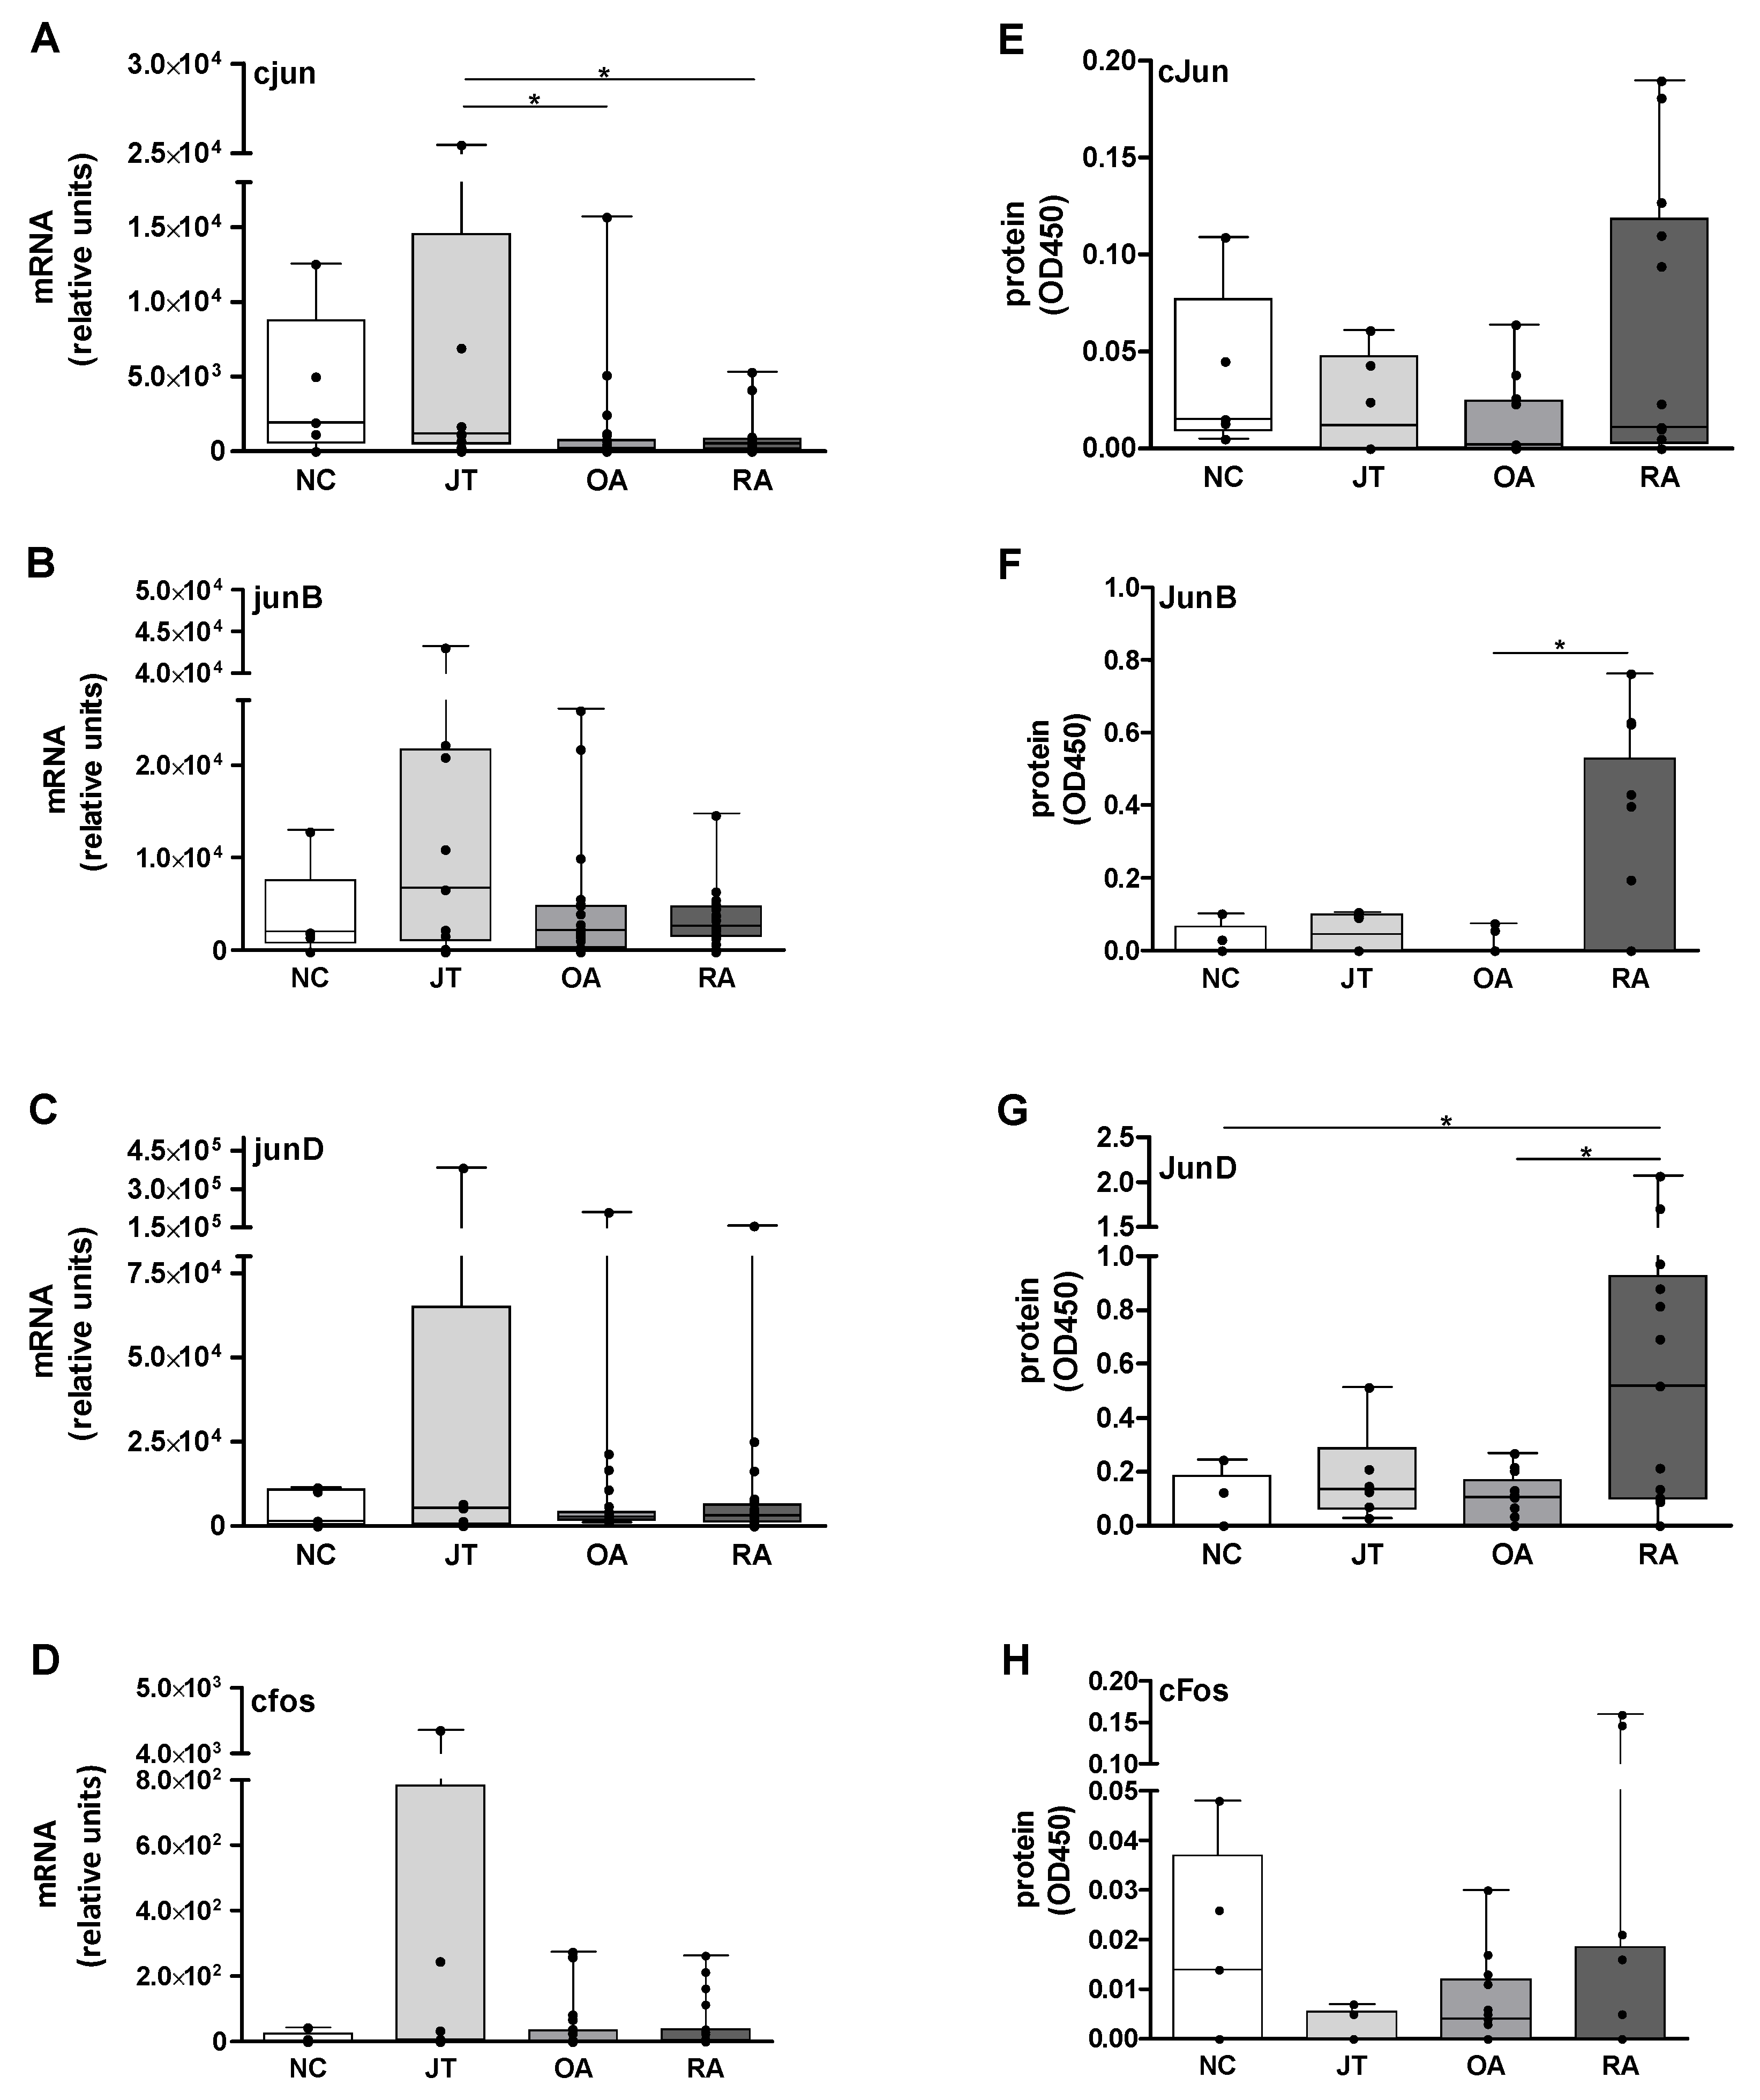
The median mRNA expression levels of cjun mRNA were elevated in NC-SM samples in comparison to all other groups, though without significant differences. JT samples showed significantly higher cjun amounts than in OA (6-fold) and RA (2-fold; Figure 1A). The junB levels were roughly comparable in RA-, OA-, and NC-SM, but numerically increased in JT (2.5-3-fold; Figure 1B). Comparable junD mRNA amounts were detected in OA and RA. While both groups had higher junD mRNA levels than in NC (approx. 2-fold), the amounts were numerically lower when compared to JT (0.5-0.6-fold; Figure 1C). Levels of cfos were roughly comparable in NC, OA, and RA, whereas JT showed a numerically higher expression (3-fold; Figure 1D). Power analysis revealed that for cjun RNA, the significant differences reached effect sizes representing medium to large effects (see Section 2.8). Artificially low mRNA expression levels due to degradation or RNase contamination were excluded by RNA quality analysis.
3.2. Quantitation of Jun and Fos Protein Expression
Median cJun levels were comparable in NC, JT, and RA, but numerically lower in OA (approx. 0.15-fold; Figure 1E). JunB protein amounts were comparable in NC and OA, numerically increased in JT versus both NC and OA, and significantly elevated in RA when compared to OA (due to the median values of 0 in NC, OA, and RA, no fold changes are provided; Figure 1F). Comparable median JunD levels were observed in JT and OA samples. In RA, JunD levels were significantly higher than in OA (5-fold) and NC, which were characterized by very low protein values (median optical density (OD) 0.1 and 0, respectively; Figure 1G). For cFos, higher amounts were measured in NC and OA in comparison to both JT- and RA-SM samples, which in turn showed comparable median expression levels of 0 (Figure 1H). Power analysis revealed that the significant differences all reached effect sizes representing large effects (see Section 2.8).
3.3. Analysis of cfos mRNA and cFos Protein Expression by In Situ Hybridization and Immunohistology
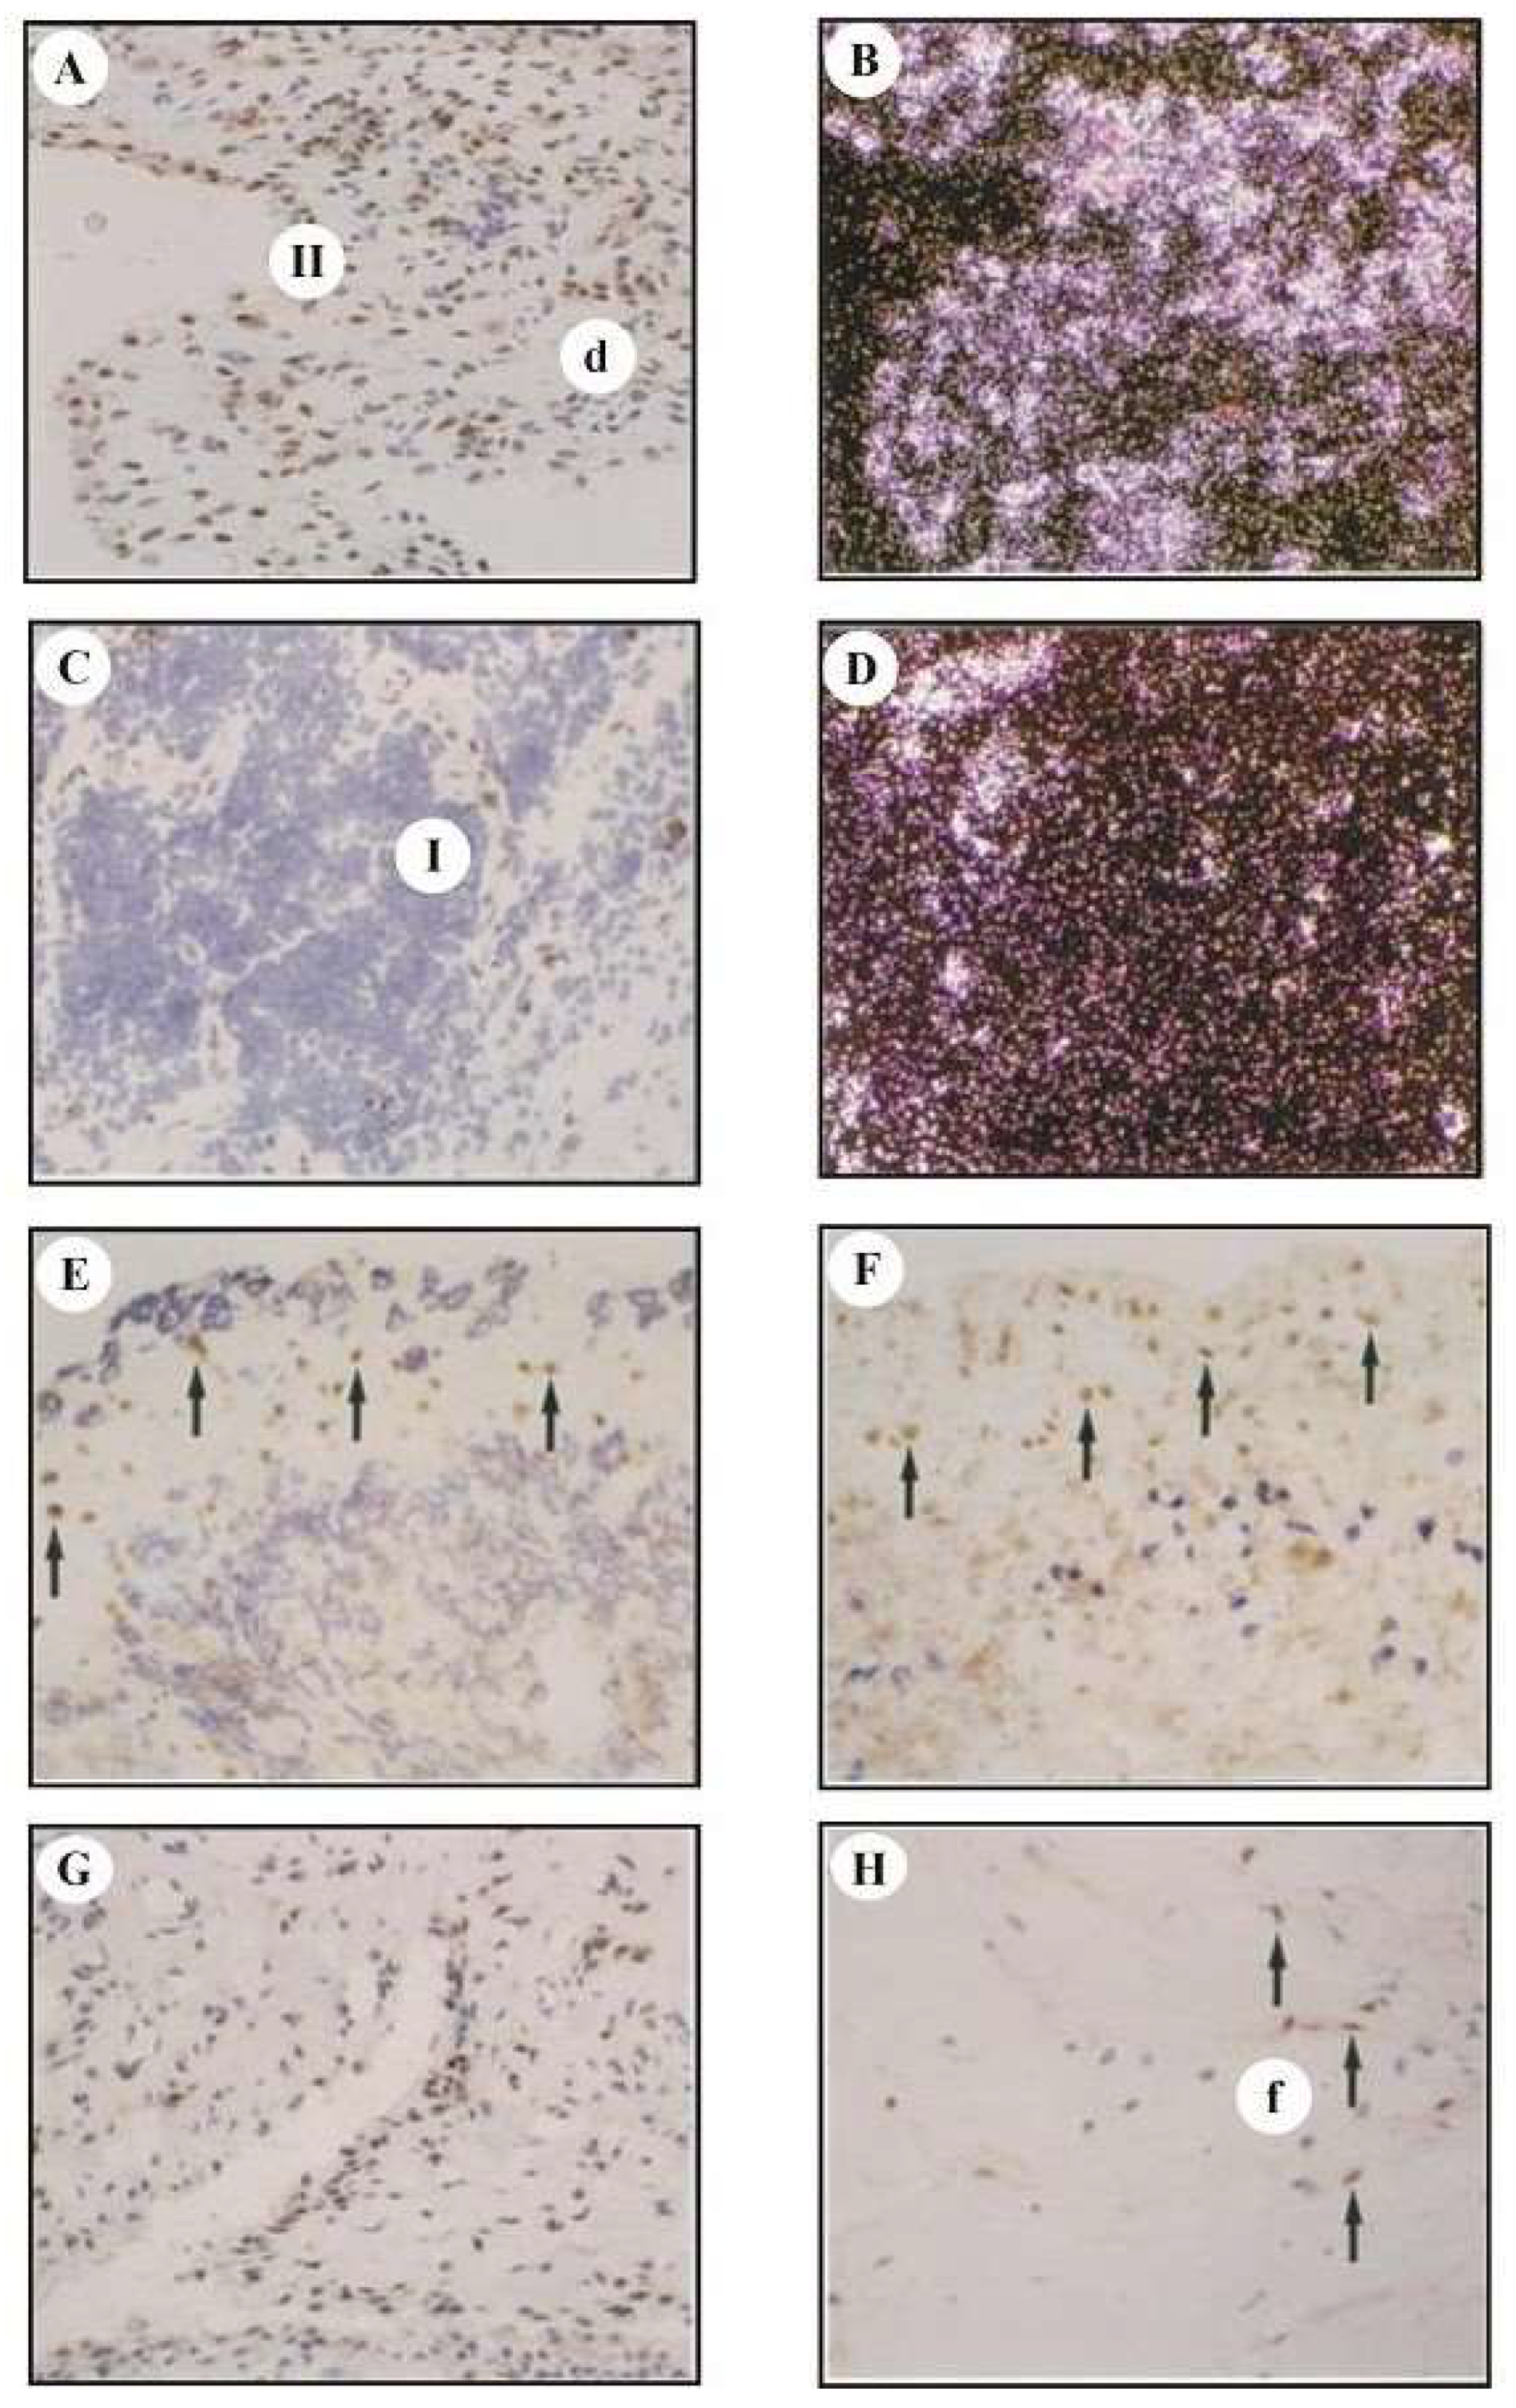
In RA-SM, a high number of cells in the lining layer (Figure 2(II in A)) and diffuse infiltrates in the sublining area (d in A) were positive for cFos protein (Figure 2A) and cfos mRNA (Figure 2B). Double-staining experiments revealed that these cells were CD14- and CD3-negative (Figure 2E,F), but collagen III-positive (data not shown), thereby assigning the signal mainly to FLS. cFos was also expressed in nonlymphoid cells close to vessels penetrating stromal lymphoid follicles (I in 2C). By contrast, cfos mRNA was only detected in a few cells in stromal lymphoid follicles containing predominantly T- and B-lymphocytes (Figure 2D). In OA- and JT-SM, the expression of cFos protein was detected in a lower number of cells (Figure 2G,H) due to the presence of large fibrous areas (Figure 2G(f in H)). For immunohistochemistry of Jun proteins, see [12,27].
3.4. Quantitation of auf-1, ttp, and hur mRNA Expression
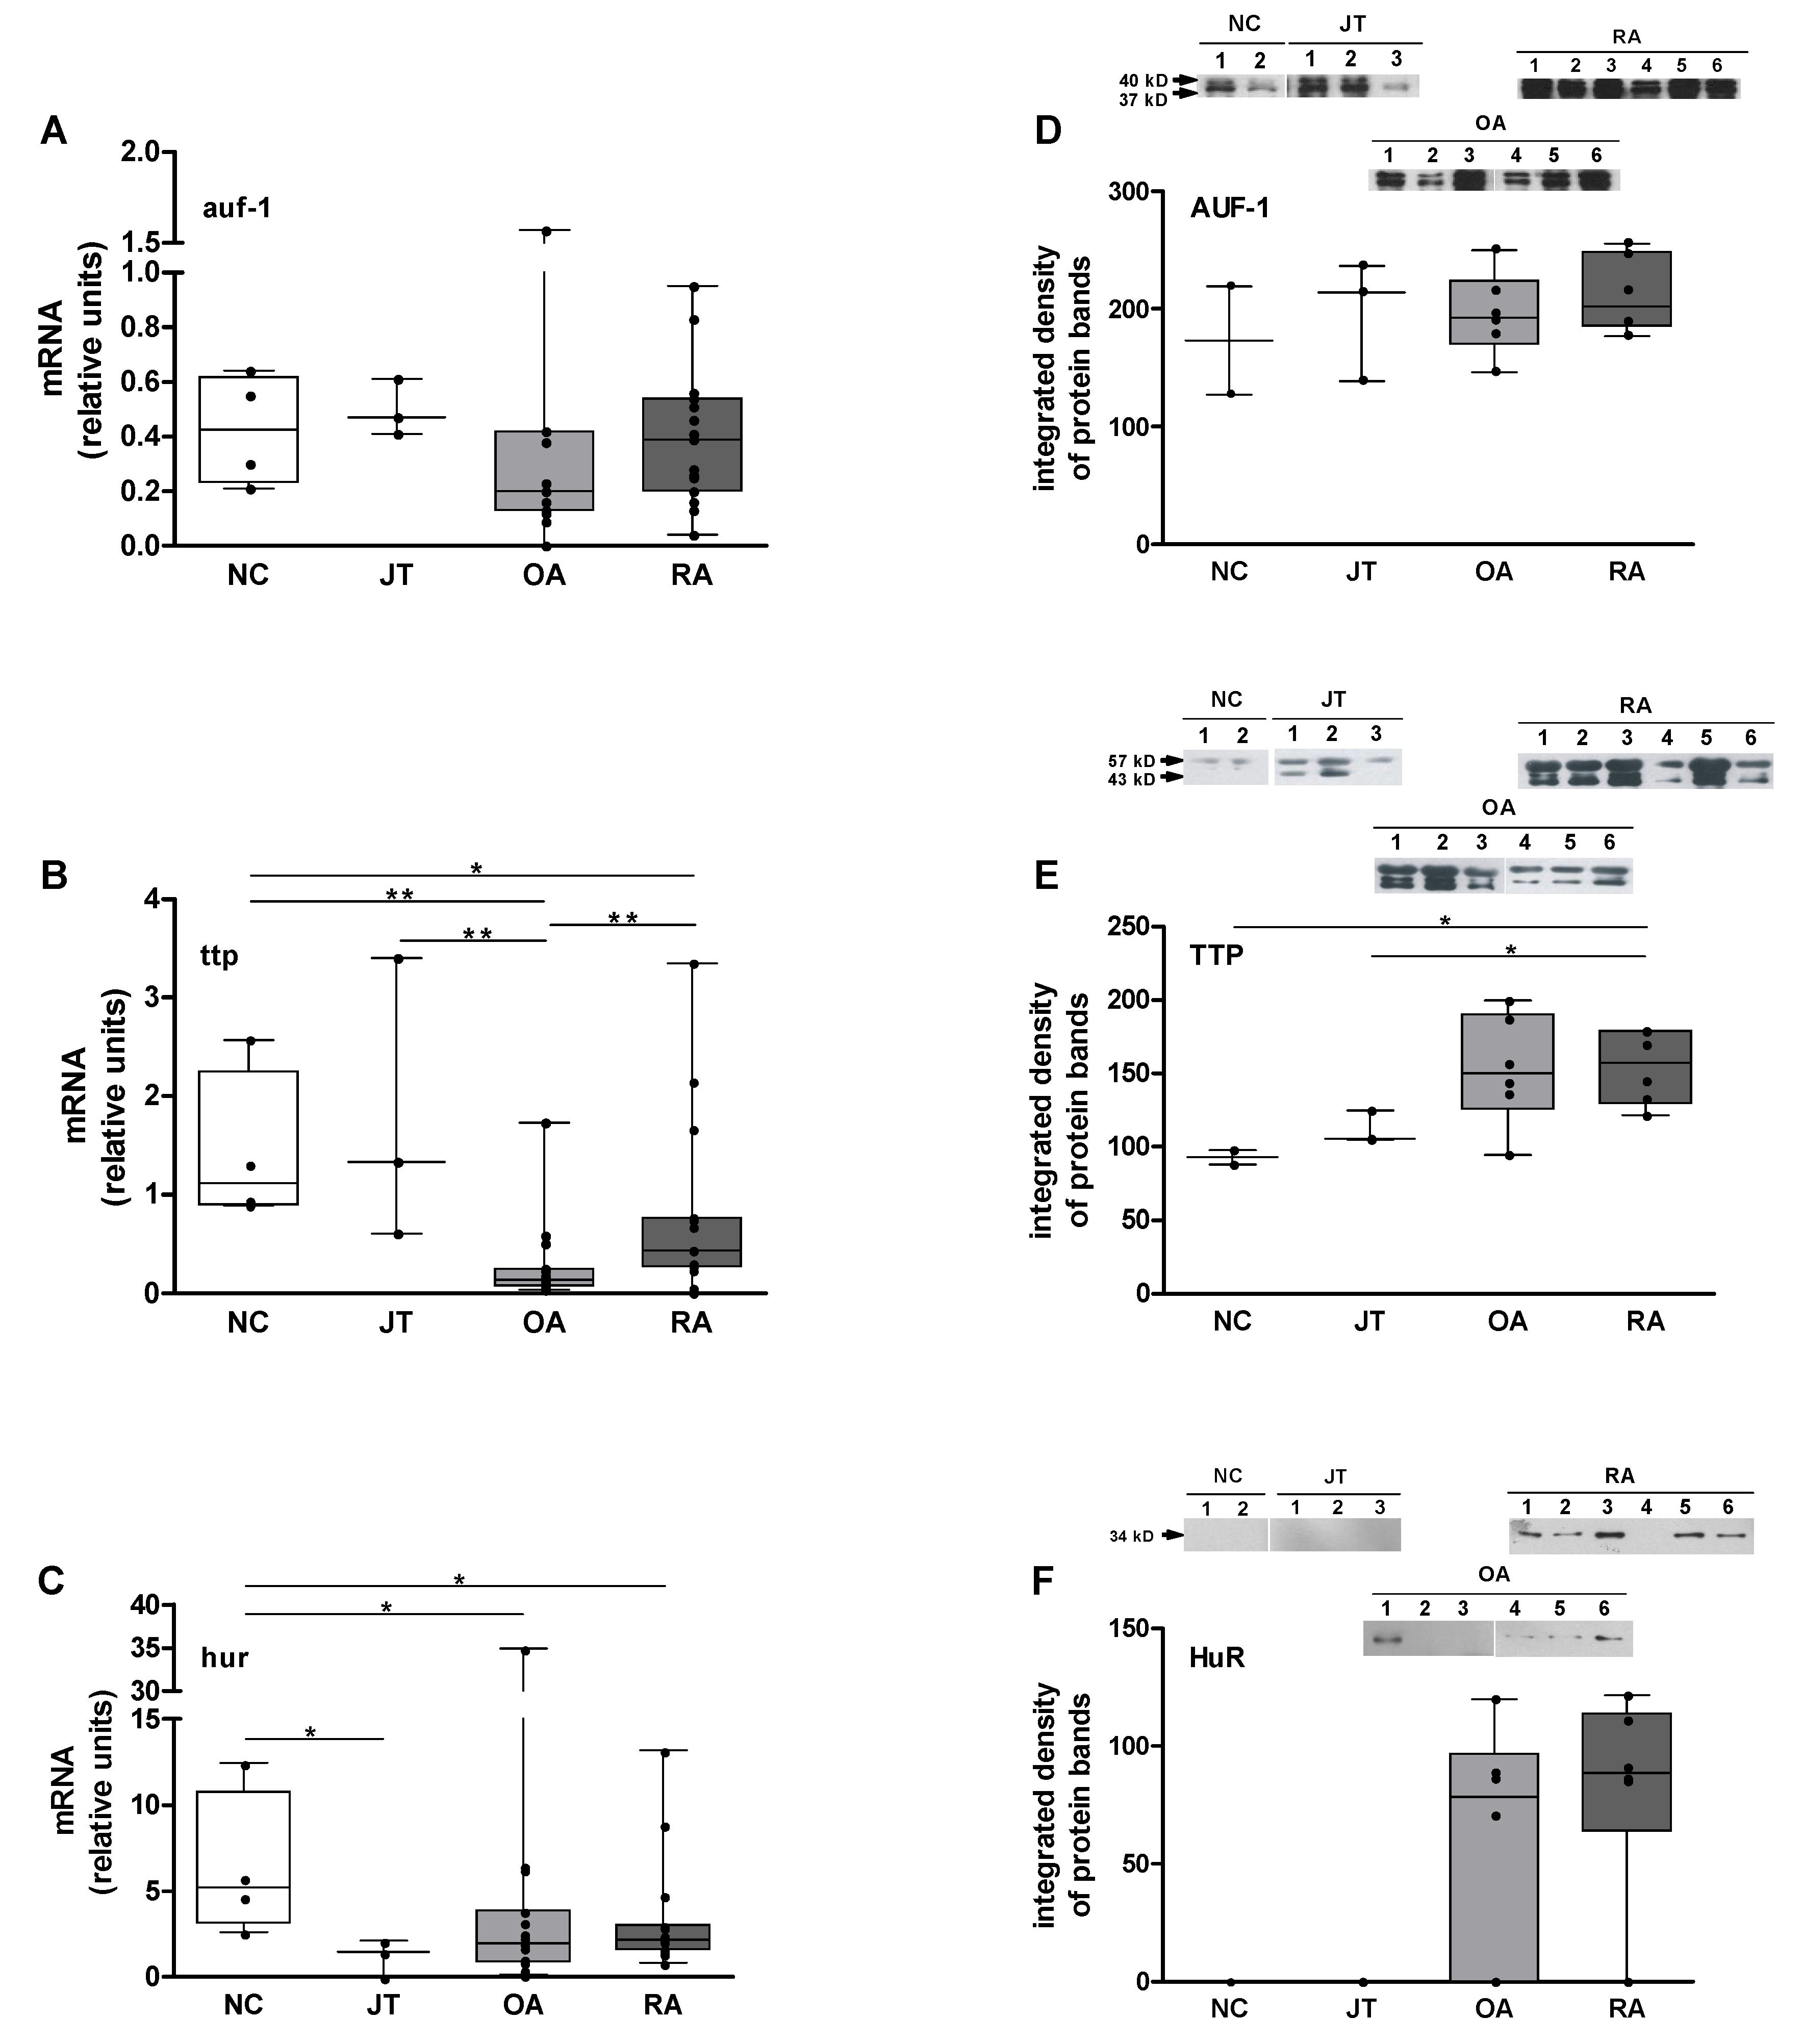
The median auf-1 mRNA expression was comparable in NC, JT, and RA samples and lower in OA (0.5-fold; Figure 3A). Median levels of ttp were comparable in JT and NC and significantly increased when compared between NC or JT and OA (approx. 8.5-fold) and between NC and RA (2.5-fold). Significantly higher ttp levels were also observed in RA versus OA (3-fold; Figure 3B). The hur mRNA expression in JT, OA, and RA was roughly comparable. NC samples, however, showed significantly elevated hur mRNA levels in comparison to all other groups (2.5- to 3.5-fold, Figure 3C). Power analysis revealed that the significant differences all reached effect sizes representing medium to large effects (see Section 2.8).
3.5. Quantitation of AUF-1, TTP, and HuR Protein Expression
The median expression level of AUF-1 was roughly comparable in all groups (Figure 3D). Median levels of TTP were comparable in RA and OA, but significantly increased in RA compared to both JT (1.5-fold) and NC (1.7-fold; Figure 3E). HuR protein was not detectable in NC and JT, but RA- and OA-SM samples showed detectable and comparable HuR protein amounts (Figure 3F). Power analysis revealed that significant the differences for TTP reached effect sizes representing huge effects (see Section 2.8).
3.6. Correlation Analyses
To identify potential co-expression patterns, correlation analyses were performed. In the SM of both OA and NC/JT, significant correlations were observed between the levels of cfos and cjun, cfos and junD, as well as cjun and junD mRNA (Table S3A/B). By contrast, levels in the RA-SM showed significant correlations of cfos with junB, cfos with junD, and junB with junD mRNA(Table S3C), indicating that in RA a shift in the normally observed co-expression patterns occurs.
Correlation analyses among protein expression levels revealed a significant correlation between JunB and JunD protein expression when analyzing SM samples of all groups together (r = 0.788, p < 0.001, n = 17). In RA-SM samples, a significant correlation was observed between cJun and cFos (r = 0.857, p < 0.05, n = 6). Moreover, RA-SM samples showed significant correlations of both JunB and JunD proteins with the age of the respective patients (both: r = 1.0, p < 0.001, n = 6). Significant negative correlations were observed in RA between JunB/JunD proteins and C-reactive protein (CRP; r = −1.0, p < 0.001, n = 6 each), as well as between JunB/JunD proteins and rheumatoid factor positivity (RF; r = −1.0, p < 0.001, n = 6 each).
4. Discussion
Using real-time RT-PCR, decreased cjun, junB, junD, and cfos mRNA expression in comparison to JT was observed in the RA-SM (see also [14]). In acute JT, the enhanced mRNA expression of all AP-1 components is compatible with the occurrence of joint bleeding [31] or mechanical stress [32]. On the other hand, the RA-SM showed roughly equal levels of jun/fos mRNA in comparison to SM from OA and postmortem NC. Though a number of studies have reported an elevated expression level of jun/fos mRNA in synovial tissue [33,34], other studies [14,35,36] have shown no increased jun/fos expression in RA. Moreover, equal levels of cfos and cjun have been observed in OA-SM [37], in good agreement with the present data.
In contrast to the mRNA levels, interestingly, RA-SM showed significantly/numerically increased Jun and Fos protein expression compared to OA, JT, and NC samples, thus matching reports on the enhanced protein expression of Jun proto-oncogenes in RA [38]. Elevated cFos protein expression in correspondence to local cfos mRNA expression was confirmed by immunohistochemical analyses/in situ hybridization in the lining layer and diffuse infiltrates of the RA-SM, reflecting previous reports on synovial Fos protein expression [33,38].
As cFos and cJun protein expression levels are numerically increased in RA, these activating AP-1 components could contribute to the aggressive development of RA by: (i) elevation of AP-1 levels and transcriptional activity in general; (ii) enhancement of the binding activity of the resulting AP-1 complexes [39], possibly in cooperation and/or competition with JunB and JunD; and (iii) stabilization of the AP-1 formation through Jun/Fos heterodimerization [40]. This could be mediated by altered mRNA expression levels of the jun and fos proto-oncogenes in general, as well as by a different pattern of jun/fos mRNA co-expression, specifically observed for RA in the present study (Table S3). Enhanced transactivation activity of the resulting AP-1 complexes via post-translational phosphorylation, e.g., by Jun N-terminal kinase 2, which is more active in RA synovial tissue and FLS than in OA [34,41], may also play a role in this assumption.
The significant overexpression of JunB and JunD proteins in RA reported in this study is in conflict with their known deactivating influence on cellular functions [12]. However, increased expression of other transcription factors and the dependence of the functional effects of AP-1 complexes on their composition [40] may modify the effects of JunB and JunD in RA-SM. For instance, JunB- and Fos-related antigen 1-containing AP-1 complexes have been shown to promote collagen-induced arthritis [42]. Nevertheless, a deactivating influence of JunB and JunD is supported by the present negative correlation between their expression and the inflammatory clinical status of the respective RA patients (as represented by RF and CRP), whereas AP-1 activity in general shows a positive correlation with the CRP level in RA [39].
The discrepancy between proto-oncogene protein and mRNA expression observed in RA in this study fits other results indicating that protein synthesis of certain cytokines also does not adequately reflect changes in mRNA transcription in rat antigen-induced arthritis [3], suggesting a broader occurrence of these discrepancies in different arthritides. However, discrepancies between Jun/Fos mRNA and protein were almost exclusively observed in RA, indicating a disease-specific alteration. In the case of JunB, strikingly, JT also shared such discrepancy, although in an inverted fashion (mRNA >> protein).
For all samples examined in this study, artificially low mRNA expression levels due to postmortem RNA degradation or RNase contamination can be excluded by RNA quality analysis. A direct mechanistic link between mRNA transcription and protein translation was excluded as an underlying reason since there was no correlation between mRNA and protein data. Thus, uncoupling of transcriptional and translational activity in RA appears plausible.
The mRNA stability-modifying proteins TTP and HuR are known to play an important role in the post-transcriptional regulation of proto-oncogene and cytokine mRNA half-life [43], including TNF [44] and IL-6 [45]. On the other hand, cytokines such as TNF themselves may contribute to the dynamic regulation of the mRNA stabilome [46]. Both TTP and HuR have been reported to be present in elevated levels in the inflamed RA-SM [18,21,22] and increased levels of TTP protein in both RA and OA may contribute to the low levels of jun/fos mRNA in the respective synovial tissues. By contrast, significantly increased levels of the mRNA-stabilizing protein HuR in RA are paralleled by increased levels of Jun/Fos protein in the RA-SM. This indicates post-transcriptional alterations (including the competition of TTP and HuR for mRNA binding [15,23]) with a previously unreported specificity for RA. Remarkably, TTP and HuR also showed discrepancies between mRNA and protein levels in both OA and RA, i.e., increased protein amounts despite decreased mRNA levels in comparison to the control groups JT and/or NC. This may be due to the known mutual and autoregulatory influence of these mRNA stability-modifying proteins on their mRNA species [23]. For instance, TTP is able to target hur mRNA [47] but also its own mRNA [48]. HuR, in turn, may auto-stabilize hur mRNA strands [47]. As a consequence, the deregulation of one player may unsettle the system of mRNA stability-modifying proteins, as described for TTP deficiency-associated HuR overexpression [49]. The broad occurrence of uncoupled mRNA and protein levels for different gene groups in RA suggests specific alterations of key processes regulating the mRNA metabolism.
One obvious mechanism may involve the destabilization of jun/fos and ttp/hur mRNA strands by TTP, whereas the stabilization of the remaining mRNA strands by HuR (including the stabilization of its own mRNA [23]) potentially contributes to the increased translation into Jun/Fos and TTP/HuR proteins. The potential participation of further RNA-binding proteins [23], their post-transcriptional modification [20], and other regulatory factors, e.g., miRNAs [49,50] or long noncoding RNAs such as H19 [51] will have to be elucidated in future studies. Interestingly, in IL-1β-stimulated RA-FLS, increased TTP mRNA and protein levels were also associated with the enhanced expression of pro-inflammatory cytokines and chemokines (such as IL-6 and IL-8) [52]. Additionally, monocyte-derived dendritic cells differentiated in the presence of CXC-motif ligand 4 showed combined induction of TTP, IL-6, and TNF in response to polyI:C-stimulation [53]. In other inflammatory diseases such as periodontal or kidney disease, HuR appears to modulate the inflammatory response by stabilizing pro-inflammatory mRNAs [54]. Moreover, it has been proposed that the HuR-TTP-axis may have a balancing influence on pro-inflammatory cytokine expression in endometriosis patients [55], reflecting well the assumed competition between HuR and TTP in the present study. Abundant but comparable expression of AUF-1 in NC and different joint diseases presently excludes a link between the mRNA/protein discrepancy in RA and the level of this mRNA-destabilizing protein. In addition to the alterations of the mRNA metabolism, broad intragroup and interindividual expression variances have been observed in RA in a number of disease-relevant or even disease-specific pathways/complexes. Thus, RA pathogenesis in different individuals may be less dependent on common alterations of the expression of specific key genes, but rather on individual-specific alterations of gene expression and mRNA stability, resulting in common disturbances of key pathways [56].
Beyond the mechanisms suggested in this study, further processes may exert a decisive influence on the observed discrepancies. For instance, it is conceivable that an increase in protein stability or translation efficiency contributes to the elevated protein levels observed in arthritides. In other biological settings, e.g., monocytic differentiation, accumulation of transcriptions factors due to increased protein production and stability has already been demonstrated [57]. Moreover, stabilized pro-inflammatory transcripts such as IL-6 and IL-8 are efficiently translated into proteins in RA-FLS following TNF stimulation [46]. Thus, a variety of potential regulators of mRNA and protein levels and their specific role in diseases such as RA will have to be assessed (also including a deeper analysis of mRNA stability-modifying proteins). Finally, a comprehensive mechanistic model of the complex regulatory network steering mRNA and protein levels remains to be established.
5. Conclusions
The striking discrepancy between Jun and Fos mRNA and protein expression in the RA-SM (potentially created by a competing influence of mRNA-stabilizing and -destabilizing proteins such as HuR and TTP) may contribute to inflammation and joint destruction. Further studies will have to address the mechanistic links between the mRNA/protein discrepancy in RA and the levels and/or functionality of mRNA stability-modifying proteins, including a detailed analysis of the composition of the AP-1 complexes and their resulting functional activity in different synovial cell populations (both spontaneously and following antirheumatic treatment).
Supplementary Materials
The following are available online at https://0-www-mdpi-com.brum.beds.ac.uk/2571-8800/3/2/15/s1, Table S1: Clinical characteristics of the patients at the time of synovectomy/sampling, Table S2: Primer sequences and gene-specific qPCR conditions, Table S3: Spearman–Rank correlation among the mRNA expression of different proto-oncogenes.
Author Contributions
Conceptualization, R.W.K.; methodology, R.H., B.S., and E.K.; formal analysis, R.H., E.K., and R.W.K.; investigation, R.H. and B.S.; resources, E.K.; writing—original draft preparation, R.H; writing—review and editing, R.H., B.S., E.K., and R.W.K.; visualization, R.H., B.S., and R.W.K.; supervision, R.W.K.; project administration, R.W.K.; funding acquisition, R.H. and R.W.K. All authors have read and agreed to the published version of the manuscript.
Funding
This research was funded by the Interdisciplinary Center of Clinical Research Jena, grant numbers FKZ 01ZZ9602 and FKZ 01ZZ0105, and the Jena Centre for Bioinformatics, grant number FKZ 0312704B. R.H. was funded by the German Academic Scholarship Foundation. We acknowledge support by the German Research Foundation (DFG) and the Open Access Publication Fund of Hannover Medical School (MHH).
Acknowledgments
We thank Ernesta Palombo-Kinne for critical reading of the manuscript and Bärbel Ukena, Juliane Prechtel, Anja Wachtel, and Sabine Wachsmuth for excellent technical assistance. The RSV-junD plasmid used for junD qPCR standard curve generation was kindly provided by Yosef Shaul (The Weitzmann Institute of Science, Rehovot, Israel), the K4IM cells by Hermann Eibel (Clinical Research Unit for Rheumatology, Freiburg, Germany), and the anti-TTP antibody by William F. C. Rigby (Dartmouth Hitchcock Medical Center, Lebanon, NH, USA). We are grateful to Andreas Roth, Rando Winter, Renée Fuhrmann, and Rudolf-Albrecht Venbrocks (Departments of Orthopedics and Traumatology, FSU Jena), as well as Axel Pruss (Institute for Transfusion and Immune Haematology, Tissue Bank, Charité University Hospital, Humboldt University Berlin) for providing patient/donor material.
Conflicts of Interest
The authors declare no conflict of interest. The funders had no role in the design of the study; in the collection, analyses, or interpretation of data; in the writing of the manuscript, or in the decision to publish the results.
Abbreviations
| AP | activator protein |
| ARE | AU-rich elements |
| AUF | AU-rich element RNA-binding protein |
| CRP | C-reactive protein |
| FLS | fibroblast-like synoviocytes |
| GAPDH | glyceraldehyde 3-phosphate dehydrogenase |
| HuR | human antigen R |
| IL | interleukin |
| JT | joint trauma |
| NC | normal controls |
| OA | osteoarthritis |
| RA | rheumatoid arthritis |
| RF | rheumatoid factor |
| SM | synovial membrane |
| TNF | tumor necrosis factor |
| TTP | tristetraprolin |
References
- Bottini, N.; Firestein, G.S. Duality of fibroblast-like synoviocytes in RA: Passive responders and imprinted aggressors. Nat. Rev. Rheumatol. 2013, 9, 24–33. [Google Scholar] [CrossRef] [PubMed] [Green Version]
- Alsalameh, S.; Amin, R.J.; Kunisch, E.; Jasin, H.E.; Kinne, R.W. Preferential induction of prodestructive matrix metalloproteinase-1 and proinflammatory interleukin 6 and prostaglandin E2 in rheumatoid arthritis synovial fibroblasts via tumor necrosis factor receptor-55. J. Rheumatol. 2003, 30, 1680–1690. [Google Scholar]
- Pohlers, D.; Siegling, A.; Buchner, E.; Schmidt-Weber, C.B.; Palombo-Kinne, E.; Emmrich, F.; Brauer, R.; Kinne, R.W. Expression of cytokine mRNA and protein in joints and lymphoid organs during the course of rat antigen-induced arthritis. Arthritis Res.Ther. 2005, 7, R445–R457. [Google Scholar] [CrossRef] [PubMed] [Green Version]
- Kunisch, E.; Chakilam, S.; Gandesiri, M.; Kinne, R.W. IL-33 regulates TNF-alpha dependent effects in synovial fibroblasts. Int. J. Mol. Med. 2012, 29, 530–540. [Google Scholar] [CrossRef] [PubMed]
- Pohlers, D.; Beyer, A.; Koczan, D.; Wilhelm, T.; Thiesen, H.J.; Kinne, R.W. Constitutive upregulation of the TGF-b pathway in rheumatoid arthritis synovial fibroblasts. Arthritis Res.Ther. 2007, 9, R59. [Google Scholar] [CrossRef] [Green Version]
- Wollbold, J.; Huber, R.; Pohlers, D.; Koczan, D.; Guthke, R.; Kinne, R.W.; Gausmann, U. Adapted Boolean network models for extracellular matrix formation. BMC Syst. Biol. 2009, 3, 77. [Google Scholar] [CrossRef] [Green Version]
- Shiozawa, S.; Tsumiyama, K. Pathogenesis of rheumatoid arthritis and c-Fos/AP-1. Cell Cycle 2009, 8, 1539–1543. [Google Scholar] [CrossRef] [PubMed] [Green Version]
- Eferl, R.; Wagner, E.F. AP-1: A double-edged sword in tumorigenesis. Nat. Rev. Cancer 2003, 3, 859–868. [Google Scholar] [CrossRef]
- Yamanishi, Y.; Firestein, G.S. Pathogenesis of rheumatoid arthritis: The role of synoviocytes. Rheum. Dis. Clin. North Am. 2001, 27, 355–371. [Google Scholar] [CrossRef]
- Kinne, R.W.; Boehm, S.; Iftner, T.; Aigner, T.; Vornehm, S.; Weseloh, G.; Bravo, R.; Emmrich, F.; Kroczek, R.A. Synovial fibroblast-like cells strongly express jun-B and C-fos proto-oncogenes in rheumatoid- and osteoarthritis. Scand. J. Rheumatol. Suppl. 1995, 101, 121–125. [Google Scholar] [CrossRef]
- Lu, W.; Li, G. Identification of Key Genes and Pathways in Rheumatoid Arthritis Gene Expression Profile by Bioinformatics. Acta Reumatol. Port 2018, 43, 109–131. [Google Scholar] [PubMed]
- Papoudou-Bai, A.; Hatzimichael, E.; Barbouti, A.; Kanavaros, P. Expression patterns of the activator protein-1 (AP-1) family members in lymphoid neoplasms. Clin. Exp. Med. 2017, 17, 291–304. [Google Scholar] [CrossRef]
- Hannemann, N.; Jordan, J.; Paul, S.; Reid, S.; Baenkler, H.W.; Sonnewald, S.; Bauerle, T.; Vera, J.; Schett, G.; Bozec, A. The AP-1 Transcription Factor c-Jun Promotes Arthritis by Regulating Cyclooxygenase-2 and Arginase-1 Expression in Macrophages. J. Immunol. 2017, 198, 3605–3614. [Google Scholar] [CrossRef] [PubMed] [Green Version]
- Huber, R.; Kunisch, E.; Gluck, B.; Egerer, R.; Sickinger, S.; Kinne, R.W. Comparison of conventional and real-time RT-PCR for the quantitation of jun protooncogene mRNA and analysis of junB mRNA expression in synovial membranes and isolated synovial fibroblasts from rheumatoid arthritis patients. Z. Rheumatol. 2003, 62, 378–389. [Google Scholar] [CrossRef]
- Ostareck, D.H.; Ostareck-Lederer, A. RNA-Binding Proteins in the Control of LPS-Induced Macrophage Response. Front Genet. 2019, 10, 31. [Google Scholar] [CrossRef] [PubMed] [Green Version]
- Colombrita, C.; Silani, V.; Ratti, A. ELAV proteins along evolution: Back to the nucleus? Mol. Cell Neurosci. 2013, 56, 447–455. [Google Scholar] [CrossRef] [PubMed]
- Peng, S.S.; Chen, C.Y.; Xu, N.; Shyu, A.B. RNA stabilization by the AU-rich element binding protein, HuR, an ELAV protein. EMBO J. 1998, 17, 3461–3470. [Google Scholar] [CrossRef]
- Liu, Y.; Wei, W.; Wang, Y.; Wan, C.; Bai, Y.; Sun, X.; Ma, J.; Zheng, F. TNF-alpha/calreticulin dual signaling induced NLRP3 inflammasome activation associated with HuR nucleocytoplasmic shuttling in rheumatoid arthritis. Inflamm. Res. 2019, 68, 597–611. [Google Scholar] [CrossRef]
- Patial, S.; Blackshear, P.J. Tristetraprolin as a Therapeutic Target in Inflammatory Disease. Trends Pharmacol. Sci. 2016, 37, 811–821. [Google Scholar] [CrossRef] [Green Version]
- Yamasaki, S. Recent advances in the role of RNA-binding protein, tristetraprolin, in arthritis. Immunol. Med. 2018, 41, 98–102. [Google Scholar] [CrossRef] [Green Version]
- Ross, E.A.; Naylor, A.J.; O’Neil, J.D.; Crowley, T.; Ridley, M.L.; Crowe, J.; Smallie, T.; Tang, T.J.; Turner, J.D.; Norling, L.V.; et al. Treatment of inflammatory arthritis via targeting of tristetraprolin, a master regulator of pro-inflammatory gene expression. Ann. Rheum. Dis. 2017, 76, 612–619. [Google Scholar] [CrossRef] [PubMed] [Green Version]
- Tsutsumi, A.; Suzuki, E.; Adachi, Y.; Murata, H.; Goto, D.; Kojo, S.; Matsumoto, I.; Zhong, L.; Nakamura, H.; Sumida, T. Expression of tristetraprolin (G0S24) mRNA, a regulator of tumor necrosis factor-alpha production, in synovial tissues of patients with rheumatoid arthritis. J. Rheumatol. 2004, 31, 1044–1049. [Google Scholar] [PubMed]
- Garcia-Maurino, S.M.; Rivero-Rodriguez, F.; Velazquez-Cruz, A.; Hernandez-Vellisca, M.; Diaz-Quintana, A.; De la Rosa, M.A.; Diaz-Moreno, I. RNA Binding Protein Regulation and Cross-Talk in the Control of AU-rich mRNA Fate. Front Mol. Biosci. 2017, 4, 71. [Google Scholar] [CrossRef] [PubMed]
- Arnett, F.C.; Edworthy, S.M.; Bloch, D.A.; McShane, D.J.; Fries, J.F.; Cooper, N.S.; Healey, L.A.; Kaplan, S.R.; Liang, M.H.; Luthra, H.S. The American Rheumatism Association 1987 revised criteria for the classification of rheumatoid arthritis. Arthritis Rheum. 1988, 31, 315–324. [Google Scholar] [CrossRef]
- Altman, R.; Asch, E.; Bloch, D.; Bole, G.; Borenstein, D.; Brandt, K.; Christy, W.; Cooke, T.D.; Greenwald, R.; Hochberg, M. Development of criteria for the classification and reporting of osteoarthritis. Classification of osteoarthritis of the knee. Diagnostic and Therapeutic Criteria Committee of the American Rheumatism Association. Arthritis Rheum. 1986, 29, 1039–1049. [Google Scholar] [CrossRef]
- Pohlers, D.; Schmidt-Weber, C.B.; Franch, A.; Kuhlmann, J.; Brauer, R.; Emmrich, F.; Kinne, R.W. Differential clinical efficacy of anti-CD4 monoclonal antibodies in rat adjuvant arthritis is paralleled by differential influence on NF-kappaB binding activity and TNF-alpha secretion of T cells. Arthritis Res. 2002, 4, 184–189. [Google Scholar] [CrossRef]
- Haas, C.; Aicher, W.K.; Dinkel, A.; Peter, H.H.; Eibel, H. Characterization of SV40T antigen immortalized human synovial fibroblasts: Maintained expression patterns of EGR-1, HLA-DR and some surface receptors. Rheumatol. Int. 1997, 16, 241–247. [Google Scholar] [CrossRef]
- Faul, F.; Erdfelder, E.; Buchner, A.; Lang, A.G. Statistical power analyses using G*Power 3.1: Tests for correlation and regression analyses. Behav. Res. Methods 2009, 41, 1149–1160. [Google Scholar] [CrossRef] [Green Version]
- Cohen, C. Statistical Power Analysis for the Behavioral Sciences, 2nd ed; Routledge: England, UK, 2013. [Google Scholar]
- Sawilowsky, S. New effect size rules of thumb. J. Mod. Appl. Statist. Method. 2009, 8, 467–474. [Google Scholar] [CrossRef]
- Nozaki, K.; Boccalini, P.; Moskowitz, M.A. Expression of c-fos-like immunoreactivity in brainstem after meningeal irritation by blood in the subarachnoid space. Neuroscience 1992, 49, 669–680. [Google Scholar] [CrossRef]
- Shiu, Y.T.; Li, S.; Yuan, S.; Wang, Y.; Nguyen, P.; Chien, S. Shear stress-induced c-fos activation is mediated by Rho in a calcium-dependent manner. Biochem. Biophys. Res. Commun. 2003, 303, 548–555. [Google Scholar] [CrossRef]
- Asahara, H.; Hasunuma, T.; Kobata, T.; Inoue, H.; Muller-Ladner, U.; Gay, S.; Sumida, T.; Nishioka, K. In situ expression of protooncogenes and Fas/Fas ligand in rheumatoid arthritis synovium. J. Rheumatol. 1997, 24, 430–435. [Google Scholar] [PubMed]
- Han, Z.; Boyle, D.L.; Aupperle, K.R.; Bennett, B.; Manning, A.M.; Firestein, G.S. Jun N-terminal kinase in rheumatoid arthritis. J. Pharmacol. Exp. Ther. 1999, 291, 124–130. [Google Scholar] [PubMed]
- Aicher, W.K.; Dinkel, A.; Grimbacher, B.; Haas, C.; Seydlitz-Kurzbach, E.V.; Peter, H.H.; Eibel, H. Serum response elements activate and cAMP responsive elements inhibit expression of transcription factor Egr-1 in synovial fibroblasts of rheumatoid arthritis patients. Int. Immunol. 1999, 11, 47–61. [Google Scholar] [CrossRef] [PubMed] [Green Version]
- Grimbacher, B.; Aicher, W.K.; Peter, H.H.; Eibel, H. Measurement of transcription factor c-fos and EGR-1 mRNA transcription levels in synovial tissue by quantitative RT-PCR. Rheumatol. Int. 1997, 17, 109–112. [Google Scholar] [CrossRef] [PubMed]
- Roivainen, A.; Soderstrom, K.O.; Pirila, L.; Aro, H.; Kortekangas, P.; Merilahti-Palo, R.; Yli-Jama, T.; Toivanen, A.; Toivanen, P. Oncoprotein expression in human synovial tissue: An immunohistochemical study of different types of arthritis. Br. J. Rheumatol. 1996, 35, 933–942. [Google Scholar] [CrossRef] [Green Version]
- Han, Z.; Boyle, D.L.; Manning, A.M.; Firestein, G.S. AP-1 and NF-kappaB regulation in rheumatoid arthritis and murine collagen-induced arthritis. Autoimmunity 1998, 28, 197–208. [Google Scholar] [CrossRef]
- Asahara, H.; Fujisawa, K.; Kobata, T.; Hasunuma, T.; Maeda, T.; Asanuma, M.; Ogawa, N.; Inoue, H.; Sumida, T.; Nishioka, K. Direct evidence of high DNA binding activity of transcription factor AP-1 in rheumatoid arthritis synovium. Arthritis Rheum. 1997, 40, 912–918. [Google Scholar] [CrossRef]
- Ryseck, R.P.; Bravo, R. c-JUN, JUN B, and JUN D differ in their binding affinities to AP-1 and CRE consensus sequences: Effect of FOS proteins. Oncogene 1991, 6, 533–542. [Google Scholar]
- Foletta, V.C.; Segal, D.H.; Cohen, D.R. Transcriptional regulation in the immune system: All roads lead to AP-1. J. Leukoc. Biol. 1998, 63, 139–152. [Google Scholar] [CrossRef]
- Moon, Y.M.; Lee, S.Y.; Kwok, S.K.; Lee, S.H.; Kim, D.; Kim, W.K.; Her, Y.M.; Son, H.J.; Kim, E.K.; Ryu, J.G.; et al. The Fos-Related Antigen 1-JUNB/Activator Protein 1 Transcription Complex, a Downstream Target of Signal Transducer and Activator of Transcription 3, Induces T Helper 17 Differentiation and Promotes Experimental Autoimmune Arthritis. Front Immunol. 2017, 8, 1793. [Google Scholar] [CrossRef] [PubMed] [Green Version]
- Wang, H.; Ding, N.; Guo, J.; Xia, J.; Ruan, Y. Dysregulation of TTP and HuR plays an important role in cancers. Tumour. Biol. 2016, 37, 14451–14461. [Google Scholar] [CrossRef] [PubMed]
- Carballo, E.; Lai, W.S.; Blackshear, P.J. Feedback inhibition of macrophage tumor necrosis factor-alpha production by tristetraprolin. Science 1998, 281, 1001–1005. [Google Scholar] [CrossRef] [PubMed] [Green Version]
- Zhao, W.; Liu, M.; D’Silva, N.J.; Kirkwood, K.L. Tristetraprolin regulates interleukin-6 expression through p38 MAPK-dependent affinity changes with mRNA 3’ untranslated region. J. Interferon. Cytokine. Res. 2011, 31, 629–637. [Google Scholar] [CrossRef] [PubMed] [Green Version]
- Loupasakis, K.; Kuo, D.; Sokhi, U.K.; Sohn, C.; Syracuse, B.; Giannopoulou, E.G.; Park, S.H.; Kang, H.; Ratsch, G.; Ivashkiv, L.B.; et al. Tumor Necrosis Factor dynamically regulates the mRNA stabilome in rheumatoid arthritis fibroblast-like synoviocytes. PLoS ONE 2017, 12, e0179762. [Google Scholar] [CrossRef] [PubMed] [Green Version]
- Al-Ahmadi, W.; Al-Ghamdi, M.; Al-Haj, L.; Al-Saif, M.; Khabar, K.S. Alternative polyadenylation variants of the RNA binding protein, HuR: Abundance, role of AU-rich elements and auto-Regulation. Nucleic Acids Res. 2009, 37, 3612–3624. [Google Scholar] [CrossRef] [PubMed] [Green Version]
- Tchen, C.R.; Brook, M.; Saklatvala, J.; Clark, A.R. The stability of tristetraprolin mRNA is regulated by mitogen-activated protein kinase p38 and by tristetraprolin itself. J. Biol. Chem. 2004, 279, 32393–32400. [Google Scholar] [CrossRef] [Green Version]
- Al-Ahmadi, W.; Al-Ghamdi, M.; Al-Souhibani, N.; Khabar, K.S. miR-29a inhibition normalizes HuR over-expression and aberrant AU-rich mRNA stability in invasive cancer. J. Pathol. 2013, 230, 28–38. [Google Scholar] [CrossRef] [Green Version]
- Semaan, N.; Frenzel, L.; Alsaleh, G.; Suffert, G.; Gottenberg, J.E.; Sibilia, J.; Pfeffer, S.; Wachsmann, D. miR-346 controls release of TNF-alpha protein and stability of its mRNA in rheumatoid arthritis via tristetraprolin stabilization. PLoS ONE 2011, 6, e19827. [Google Scholar] [CrossRef] [Green Version]
- Stuhlmuller, B.; Kunisch, E.; Franz, J.; Martinez-Gamboa, L.; Hernandez, M.M.; Pruss, A.; Ulbrich, N.; Erdmann, V.A.; Burmester, G.R.; Kinne, R.W. Detection of oncofetal h19 RNA in rheumatoid arthritis synovial tissue. Am. J. Pathol. 2003, 163, 901–911. [Google Scholar] [CrossRef] [Green Version]
- Angiolilli, C.; Kabala, P.A.; Grabiec, A.M.; Rossato, M.; Lai, W.S.; Fossati, G.; Mascagni, P.; Steinkuhler, C.; Blackshear, P.J.; Reedquist, K.A.; et al. Control of cytokine mRNA degradation by the histone deacetylase inhibitor ITF2357 in rheumatoid arthritis fibroblast-like synoviocytes: Beyond transcriptional regulation. Arthritis Res. Ther. 2018, 20, 148. [Google Scholar] [CrossRef] [PubMed] [Green Version]
- Silva-Cardoso, S.C.; Bekker, C.P.J.; Boes, M.; Radstake, T.; Angiolilli, C. CXCL4 is a driver of cytokine mRNA stability in monocyte-derived dendritic cells. Mol. Immunol. 2019, 114, 524–534. [Google Scholar] [CrossRef] [PubMed]
- Ouhara, K.; Munenaga, S.; Kajiya, M.; Takeda, K.; Matsuda, S.; Sato, Y.; Hamamoto, Y.; Iwata, T.; Yamasaki, S.; Akutagawa, K.; et al. The induced RNA-binding protein, HuR, targets 3’-UTR region of IL-6 mRNA and enhances its stabilization in periodontitis. Clin. Exp. Immunol. 2018, 192, 325–336. [Google Scholar] [CrossRef] [PubMed] [Green Version]
- Khalaj, K.; Ahn, S.H.; Bidarimath, M.; Nasirzadeh, Y.; Singh, S.S.; Fazleabas, A.T.; Young, S.L.; Lessey, B.A.; Koti, M.; Tayade, C. A balancing act: RNA binding protein HuR/TTP axis in endometriosis patients. Sci. Rep. 2017, 7, 5883. [Google Scholar] [CrossRef] [PubMed] [Green Version]
- Huber, R.; Hummert, C.; Gausmann, U.; Pohlers, D.; Koczan, D.; Guthke, R.; Kinne, R.W. Identification of intra-group, inter-individual, and gene-specific variances in mRNA expression profiles in the rheumatoid arthritis synovial membrane. Arthritis Res. Ther. 2008, 10, R98. [Google Scholar] [CrossRef] [PubMed] [Green Version]
- Huber, R.; Panterodt, T.; Welz, B.; Christmann, M.; Friesenhagen, J.; Westphal, A.; Pietsch, D.; Brand, K. C/EBPbeta-LAP*/LAP Expression Is Mediated by RSK/eIF4B-Dependent Signalling and Boosted by Increased Protein Stability in Models of Monocytic Differentiation. PLoS ONE 2015, 10, e0144338. [Google Scholar] [CrossRef] [PubMed] [Green Version]
Figure 1.
Quantitation of Jun/Fos mRNA and protein expression in the synovial membrane (SM). (A–D) The graph shows the median relative units (as detected by pPCR) for (A) cjun, (B) junB, (C) junD, and (D) cfos in rheumatoid arthritis (RA)- and osteoarthritis (OA)-SM (n = 24 each), joint trauma (JT)-SM (n = 9), and postmortem normal controls (NC)-SM (n = 5). All SM samples were positive for mRNA expression except for 1 RA and 1 OA sample (cjun), 2 OA samples (junB), 2 RA samples (junD), and 2 RA and 2 OA samples (cfos). (E–H) The median optical density (OD) at 450 nm (as detected by ELISA-based methods) for (E) cJun, (F) JunB, (G) JunD, and (H) cFos in RA-SM, OA-SM (n = 13 each), JT-SM (n = 6), and postmortem NC-SM (n = 5) are given. In all groups, the samples were a subgroup of the individuals used for mRNA analysis. SM samples were positive for protein expression except for 3 RA, 6 OA, and 3 JT samples (cJun), 7 RA, 11 OA, 3 JT, and 3 NC samples (JunB), 1 RA, 3 OA, and 2 NC samples (JunD), as well as 8 RA, 4 OA, and 4 JT, and 2 NC samples (cFos). Box plots are shown with horizontal lines for the respective median, boxes represent the 25th–75th percentiles, and whiskers indicate the extremes (min to max). Statistical analyses: Mann–Whitney U-test, * p ≤ 0.05. (conc.: concentration).

Figure 2.
Detection of cFos mRNA and protein in SM cryostat sections by immunohistochemistry and in situ hybridization. (A,C) Immunohistochemical detection of cFos protein in RA-SM samples. Staining for cFos was observed in numerous cell nuclei in the lining layer (II in A), diffuse infiltrates (d in A), and in individual cell nuclei in lymphoid follicles (I in C, nuclear counterstaining by hematoxylin). (B,D) In situ hybridization using specific RNA probes for cfos in RA-SM samples. The distribution pattern of cfos mRNA was similar to that of cFos protein. (E,F) Double-staining for cFos protein (peroxidase; brown) and the macrophage marker CD14 (APAAP; blue; E) or the T-cell marker CD3 (APAAP; blue; F) in RA-SM, showing a positive signal for cFos (examples indicated by arrows in E/F) mainly in CD14-negative (E), CD3-negative (F) cells, identifying these cells as non-macrophages/non-T-cells. (G) Immunohistochemical detection of cFos protein in OA-SM samples. Staining for cFos in cells of the lining layer, diffuse infiltrates, fibrous areas, and endothelia was observed in a lower number of positive cells as compared to RA (A). (H) Immunohistochemical detection of cFos protein in JT-SM samples. Staining for cFos was observed in a lower number of positive cells as compared to RA (A) in stromal fibrous areas (f in H; arrows indicate positive nuclei), interrupting small areas of infiltrating cells. Original magnification for A–H 184 ×.

Figure 3.
Quantitation of AU-rich element RNA-binding protein (AUF-1), tristetraprolin (TTP), and human antigen R (HuR) mRNA and protein expression in the SM. (A–C) The median relative units (as detected by pPCR) for (A) auf-1, (B) ttp, and (C) hur mRNA in RA- and OA-SM (n = 15 each), JT-SM (n = 3), and postmortem NC-SM (n = 4) are given. All SM samples were positive for mRNA expression except for 1 OA sample (auf-1), 1 RA sample (ttp), and 1 JT sample (hur). (D–F) The graph shows the Western blot analysis and the median integrated density of protein bands (as determined by densitometry) for (D) AUF-1, (E) TTP, and (F) HuR in RA-, OA- (n = 6 each), JT- (n = 3), and postmortem NC-SM (n = 2). In all groups, the samples were a subgroup of the individuals used for mRNA analysis. All SM samples were positive for AUF-1 and TTP protein expression. The number of HuR protein positive samples was 5/6 for RA-SM and 4/6 for OA-SM. In NC and JT, no HuR protein was detected. Box plots are shown with horizontal lines for the respective median, boxes represent the 25th–75th percentiles, and whiskers indicate the extremes (min to max). Statistical analyses: Mann–Whitney U-test, * p ≤ 0.05, ** p ≤ 0.01.

© 2020 by the authors. Licensee MDPI, Basel, Switzerland. This article is an open access article distributed under the terms and conditions of the Creative Commons Attribution (CC BY) license (http://creativecommons.org/licenses/by/4.0/).
Share and Cite
MDPI and ACS Style
Huber, R.; Stuhlmüller, B.; Kunisch, E.; Kinne, R.W. Discrepancy between Jun/Fos Proto-Oncogene mRNA and Protein Expression in the Rheumatoid Arthritis Synovial Membrane. J 2020, 3, 181-194. https://0-doi-org.brum.beds.ac.uk/10.3390/j3020015
AMA Style
Huber R, Stuhlmüller B, Kunisch E, Kinne RW. Discrepancy between Jun/Fos Proto-Oncogene mRNA and Protein Expression in the Rheumatoid Arthritis Synovial Membrane. J. 2020; 3(2):181-194. https://0-doi-org.brum.beds.ac.uk/10.3390/j3020015
Chicago/Turabian StyleHuber, René, Bruno Stuhlmüller, Elke Kunisch, and Raimund W. Kinne. 2020. "Discrepancy between Jun/Fos Proto-Oncogene mRNA and Protein Expression in the Rheumatoid Arthritis Synovial Membrane" J 3, no. 2: 181-194. https://0-doi-org.brum.beds.ac.uk/10.3390/j3020015