1. Introduction
People buy and sell human remains online. This is not necessarily illegal in all jurisdictions (for the United States, see [
1]); in jurisdictions where it is illegal, there are very rarely prosecutions (a notable exception is the State of Louisiana). In recent years, work led by researchers affiliated with the Trafficking Culture project and others [
2,
3] have applied criminological and ethnographic lenses to the broader trade in antiquities. Research by Tsirogiannis and Tsirogiannis [
4] have developed and applied novel techniques from network analysis to ‘fill in the gaps’ in our understanding of how antiquities move from source to consumption points; work by Hardy, Al-Azm and Paul, and Altaweel [
5,
6,
7] have shone needed light on various social networks as platforms for buying and selling antiquities. Our own prior research [
8,
9,
10] has looked at the patterns of discourse in tens of thousands of Instagram posts, and what people involved in the trade in human remains
say they are doing, in their posts. In this paper, we are not applying criminological lenses since, broadly, policy makers and prosecutors have not seen fit to criminalize this trade. Instead, we are presenting an experiment in ‘distant viewing’ that instead tries to understand collectors’ collections as they are presented on Instagram, to see if useful patterns emerge that will help us understand the attraction(s) of owning human remains. We develop a perspective that marries machine vision with a kind of ‘sensorial’ or ‘affective’ archaeology, in the spirit of Skeates and Day or Hamilakis [
11,
12,
13].
The key to doing this is to recognize that when people buy and sell human remains, they create new assemblages and put the human remains and other materials into new contexts and relationships. The archaeological biography of these remains
continues. How can we study these new assemblages, these new ‘sites’, and what might they mean for the construction of the past in the present? Are these sites of an ‘enchantment’ for these collectors (see [
14])?
Our research project wants to understand, amongst other things, what this contemporary archaeology suggests for how people form their relationships to the past (see for instance [
15,
16]). The digital ‘places’ in which we find these archaeological materials require a literal digital field archaeology and survey strategy. Most studies to date of social media in the broader realm of archaeology have dealt with the texts of posts, with minimal attention drawn to issues of privacy and the potential for abuse, drawn from sociological analysis (see [
17] for a critical survey of work to date). Our previous research [
18] has suggested that part of what buyers and sellers value in the posts surrounding the trade is the story, the aesthetic, of the heroic collector. They value the story of the exotic, the macabre. Not only are there discourses of text that seem to ‘unify’ this trade, but our in-progress research in terms of mapping ‘visual similarity’ suggests that there are visual tropes and influences that can be mapped as they spread from one photo to another (this technique represents an image as a mathematical vector and computes its distance in Euclidean space from other image vectors; see [
19] on mapping visual influence using vectors, and also [
20] (p. 626) on the ways that ‘professional vision’ in archaeology ‘shape[s] events in the domain of its scrutiny into the phenomenal objects around which the discourse of the profession is organized’).
Turning to the photographs that accompany the posts, archaeological studies of social media have not to any large degree considered these. Morgan [
21] and Baird [
22] manually examined the site archives for Çatal Höyük and Dura Europos, respectively, categorizing photographs with regard to the presence or absence of fieldworkers, the gaze of individuals depicted, the arrangement of the individual features, and so on, in order to trace the development of archaeological theory through photography. At Dura Europos, these early archaeological photographs, for instance, served to reinforce and justify the expedition’s colonialist underpinnings, especially to the audience ‘back home’. We might say that photography is the original ‘remote sensing’ of archaeology, providing a distant view that is somehow intimate and more ‘real’ because it directs our attention to precisely
this thing over
that thing, this pattern of darker soil; it is a ‘discursive practice’ sensu Goodwin [
20]. It creates authority because its results (the images) hide its processes (the intensely physical prospect of getting the camera set up just right, of manipulating the scene and the lighting). In this tension between the seen and the unseen, Hamilakis proposes that there is a tension, an opportunity, for a synaesthetic entangling of vision with our other senses [
23] (p. 9). Papadopolous and colleagues write,
“…the photographic process is structured by the sensorial photographic assemblage […] which includes the things to be photographed and their specific affordances, the photographers, the various technological apparatuses, direct and ambient light, photographic memories and the photographic canon, the affectivity of the surroundings, and the desire to produce specific renderings of an object or thing. The inter- and intra-actions amongst the various agents partaking of the relational, sensorial field of photography, including the human actors, shape the photographic outcomes.”
We cannot study and contextualize every photograph we collect manually; to date, we have collected over 100,000 individual photographs and associated metadata from Instagram alone, in addition to separate large image corpuses from Facebook groups, Marktplaats.nl, and the web pages of several brick and mortar stores; see [
25,
26]. However, what if we were to treat these individual accounts as archaeological ‘sites’ in a system of relationships interpenetrating and intertwined with the physical world (in the sense that the author of [
13] deploys, articulating his take on ‘assemblages’ of the kind promoted by Deleuze and Guattari [
27]), and treated tagged posts as ‘features’ within them? Here, we describe an approach to dealing with the problem of exploring the data we collect using machine vision, automatic tagging using Microsoft Azure’s ‘cognitive services’ engine, and network analysis to characterize the ‘sensory affect’ that these digital places exhibit. We suggest that the human remains trade online via social media (primarily, Instagram photos and posts) is an activity that leaves archaeological traces in a digital matrix and that, by exploring automatic tagging, we are able to do a kind of ‘remote sensing’ of this digital world. Like potsherds on the surface that the archaeologist studies and maps and from which they develop an (informed) imaginative idea of what lies beneath, these tags become our sherds, evocative descriptions of ‘scenes’ through which we can use our imaginations and our own experiences to approach something of the synaesthetic impact on the collector of having these human remains. In our research to date, we have asked what we can learn from the text, and from the images, as individual artefacts. However, what we are trying to do here instead is to consider their photographic practice as emerging out of relationships between the people involved, their own (real-world and virtual) places, and ‘their’ things. As Frieman and Gillings write, criticizing ‘view sheds’ and other ways of ‘extracting and compartilizing vision’ in the past,
“[…]what is needed is an archaeology that is sensitive to the rich and complex way in which individual sensory threads are woven together, their interdependencies and the tensions that can arise between them. Put simply, having successfully extracted vision from the sensorium we need to rise to the challenge of putting it back, and in so doing explore more fully the role played by the senses in shaping and structuring understandings (both past and contemporary)”
This means that, just as in sensory archaeology (e.g. [
11,
12,
23,
28,
29,
30]), we also have to engage in ‘evocative writing’, a writing that draws on our own mnemonic and autobiographical accounts (as [
23] p11 puts it), to sense and make sense of the results of this digital remote vision, this remote sensing. Tringham and Danis [
29] (p. 52) draw our attention to Skeates’ methodological suggestions [
31] (p. 4) for how to do this—reflexivity, inventory, experimentation, thick description, and creative writing. What follows is offered in that spirit.
Retrieving Sensory Affect
This is Shawn’s memory.
Our house was in the woods, about two hundred feet from the road. The bush was all tall white pine, their crowns spread out and touching one another, but otherwise long tall poles with dead branches all the way down. It was always dark, underneath the pine. The floor was littered with pine needles; sometimes I would try to dig down to the sand underneath (a former bank of the Champlain sea), but in the bush, it was just pine needles all the way down, a black acidic mass woven with mycological threads. The air was always dry and dead in the bush, sometimes broken by the crash of falling branches when the turkey vultures took flight, their long wings smashing through the trees. Our house stood in a little clearing; our lawn was mostly green moss and lichen. We had a shed around the back, sitting deeper amongst the pines. If I opened the door, I could smell the warm smell of pine boards, the cold damp of the dead pine needles, oil and gas from the lawnmower (why did we have a lawn mower?) and the chainsaw (much more useful). On a shelf made of rough pine there was a box; in the box, the skull of a Percheron workhorse. The skull came from a farm up by town; they were digging a new foundation for a barn and came across the burial pit for this workhorse. Somebody thought I’d find it interesting, and had brought it down to us. Horses were last used up there around the 1930s, so the sandy acidic soil had done its work quite quickly. The skull, as I remember it, had no smell at all, in that shed in the bush. But I now associate the contrasting smells of that space with the non-smell of the skull, if that makes any sense: Cold + damp + oil + gas + rough_textured_wood = horse_skull.
You have to also understand how dead the bush was. Very little light, comparatively, makes it to the forest floor. Squirrels might live up in the green branches sixty feet above, and sometimes a pinecone falls, but aside from that and the turkey vultures, the bush is always very still.
And yet… in the summertime, the heat makes it to the floor, and warms up those needles, and there is an overwhelming scent of pine. The June bugs sing, if it gets hot enough, and in the mornings and the evenings the whine of the clouds of mosquitoes is loud enough to hear at a distance (they grow in the damp of the needles, or in small pools of stagnant water left over from the rain). So this too is the smell of that skull in my father’s shed. This is the sound of the smell of the bleached skull in my father’s shed.
As far as I know, that horse’s skull is still in that shed. I didn’t take it with me when I moved. I’m not interested in owning bones. But as I look at the posts of vendors and collectors on Instagram, I wonder what the sensory impact is for them of owning this material. My own brief ‘ownership’ of that horse skull is bound up within a complicated sensory experience, tied to memory, that also connects to my own family’s farming history, my relationship with my father, and where/how I grew up.
A lot of work, for a single skull.
We do not believe one should own or collect human remains. We are not interested in praising the trade. But we want to know, given this example of SG’s own entanglement with that horse’s skull, can we understand something similar of the sensory experience implied by these photographs for these people who collect or sell? Whatever else this trade is, it is an engagement with human history and the past. Thus, we need to try to understand what being in this trade does for these people, if we are ever to hope to persuade them not to do this.
A social scientist might interview these people (and archaeologists have: See [
3]), but it is very difficult as an archaeologist to transparently arrange interviews with a collecting community actively engaged in highly suspect behavior (journalists have; see [
32], for instance; Reference [
33] discusses the ethics of concealing one’s archaeological identity from informants). But we want to approach this as digital archaeologists. If we treat the assemblage of photographs created by an individual vendor or collector as a ‘site’, if we treat each photo as an archaeological context, we can use various digital methods to explore from a sensory perspective the meanings of these sites. The resulting method could then be used for other archaeological investigations, both of the past and in contemporary settings.
3. Results
3.1. What Does the Machine See?
The output of the first step in the process, the assignment of tags, produces files that look somewhat like this (actual filenames contain Instagram identifiers that could conceivably be used to backtrack to the original account, and thus will not be shared here):
1.jpg,indoor,97.5464642
1.jpg,statue,95.50700188
1.jpg,skull,89.82856274
2.jpg, wall,98.99296761
2.jpg,person,98.31568003
2.jpg,indoor,96.4451313
Azure hedges its bets with its statement of probability, which is a function of its original training set or a measurement of the input photograph against the ‘platonic’ ideal for a ‘person’ that it knows.
We may make some observations on the output at this stage:
- Azure seems to be very good at identifying ‘skulls’, even when these are partial fragments, and it seems to mean ‘human skulls’ for the most part. It will qualify ‘skull’ with ‘mammal’, ‘primate’, or ‘anthropological’ when the skull has had cultural modifications or additions made to it.
- While there are very few actual reptiles in the photo collections, Azure frequently tags a photo with ‘reptile’ or ‘dinosaur’. Examining images tagged like this shows an interesting example of a kind of machinic pareidolia. The vendors will display and sell partial bones—parts of the knee, or a quarter of a pelvis with a bit of thigh bone, for instance, which they mount and light as they will other more complete bones. These photos, if you squint at them, can look like a long saurian neck with a head.
- For Vendor B, the photo with the strongest ‘museum’ assignment (>90%) depicts in the foreground an apparently Dayak skull, on a coffee table, with a display case containing more skulls in the background. The display case contains other skulls in bell jars, arranged across four shelves. Other images with strong ‘museum’ assignments show close-ups of adult or infant skulls, arranged on glass shelving. One shows a skeleton laid out on what looks like hessian cloth, taken from an oblique angle looking along from the feet towards the head—an angle of display that would not be out of place in a museum. In any event, the presence of a display case, glass shelving, or a stand seems to be one of the strongest indicators for ‘museum’ to Azure. Other images with the ‘museum’ tag, but not as strongly assigned, seem to have dramatic lighting in common, an object sharply defined in the foreground, and a uniform background, which seems to recall museum or auction house catalogue photography.
- Vendor B also has a curious ‘doughnut’ tag, which, in the network of tags (see next section), is part of the constellation of connections describing bones and their origins. Examining the tags for individual images that have the ‘doughnut’ assignment, we find patterns like this: Doughnut, 99.70; indoor, 96.43; museum, 61.36; stone, 37.83; wall, 98.31. This particular image depicts a skull, heavily damaged by root action and with a dark patina, displayed on a wood block against a beige wall, and with a large square hole in the left parietal bone. Azure has done a good job describing the scene, even if it has misunderstood some of the particulars. Other ‘doughnuts’ include more skulls with similar cuts in them, but also skulls in dramatic lighting that highlight one eye socket over another.
- With regard to the photos created by Vendor C, Azure sees ‘artifacts’ with more probability than in the other collections. What is an ‘artifact’ to the machine? Looking at the thusly assigned images, we see that this vendor constructs their photos such that the background is a soft-blurred table, slightly angled to take up 1/3 of the field, with black matte walls/background, and the skulls (or other bones) in 3/4 profile on wooden lacquered stands. When Azure assigns the tags to these images, it also can be read as describing the scene: Table, 98.42; indoor, 98.14; museum, 97.16; skull, 96.91; sitting, 95.47; art, 93.88; animal, 84.43; artifact, 75.47; bone, 74.01; wooden, 72.25; sculpture, 70.25; vase, 66.45.
- In the collection of photos retrieved from a search of Instagram for ‘humanskullsforsale’, there is a curious tag, ‘arthropod’. Arthropods are invertebrate creatures with exoskeletons. This is another case of mechanic pareidolia. Examining these images, we actually find depictions of human remains in or on the ground, sometimes articulated and apparently in situ, sometimes disturbed and scattered. We see skeletons in the earth; the machine sees exoskeletons. The associated posts largely come from a single vendor (who was hitherto unknown to us) who advertises that they will obtain remains to order.
NB. In the discussion that follows, the results discussed are post filtering of the original assignments returned by the Azure service for just the most probable tags.
3.2. Results by Individual ‘Sites’
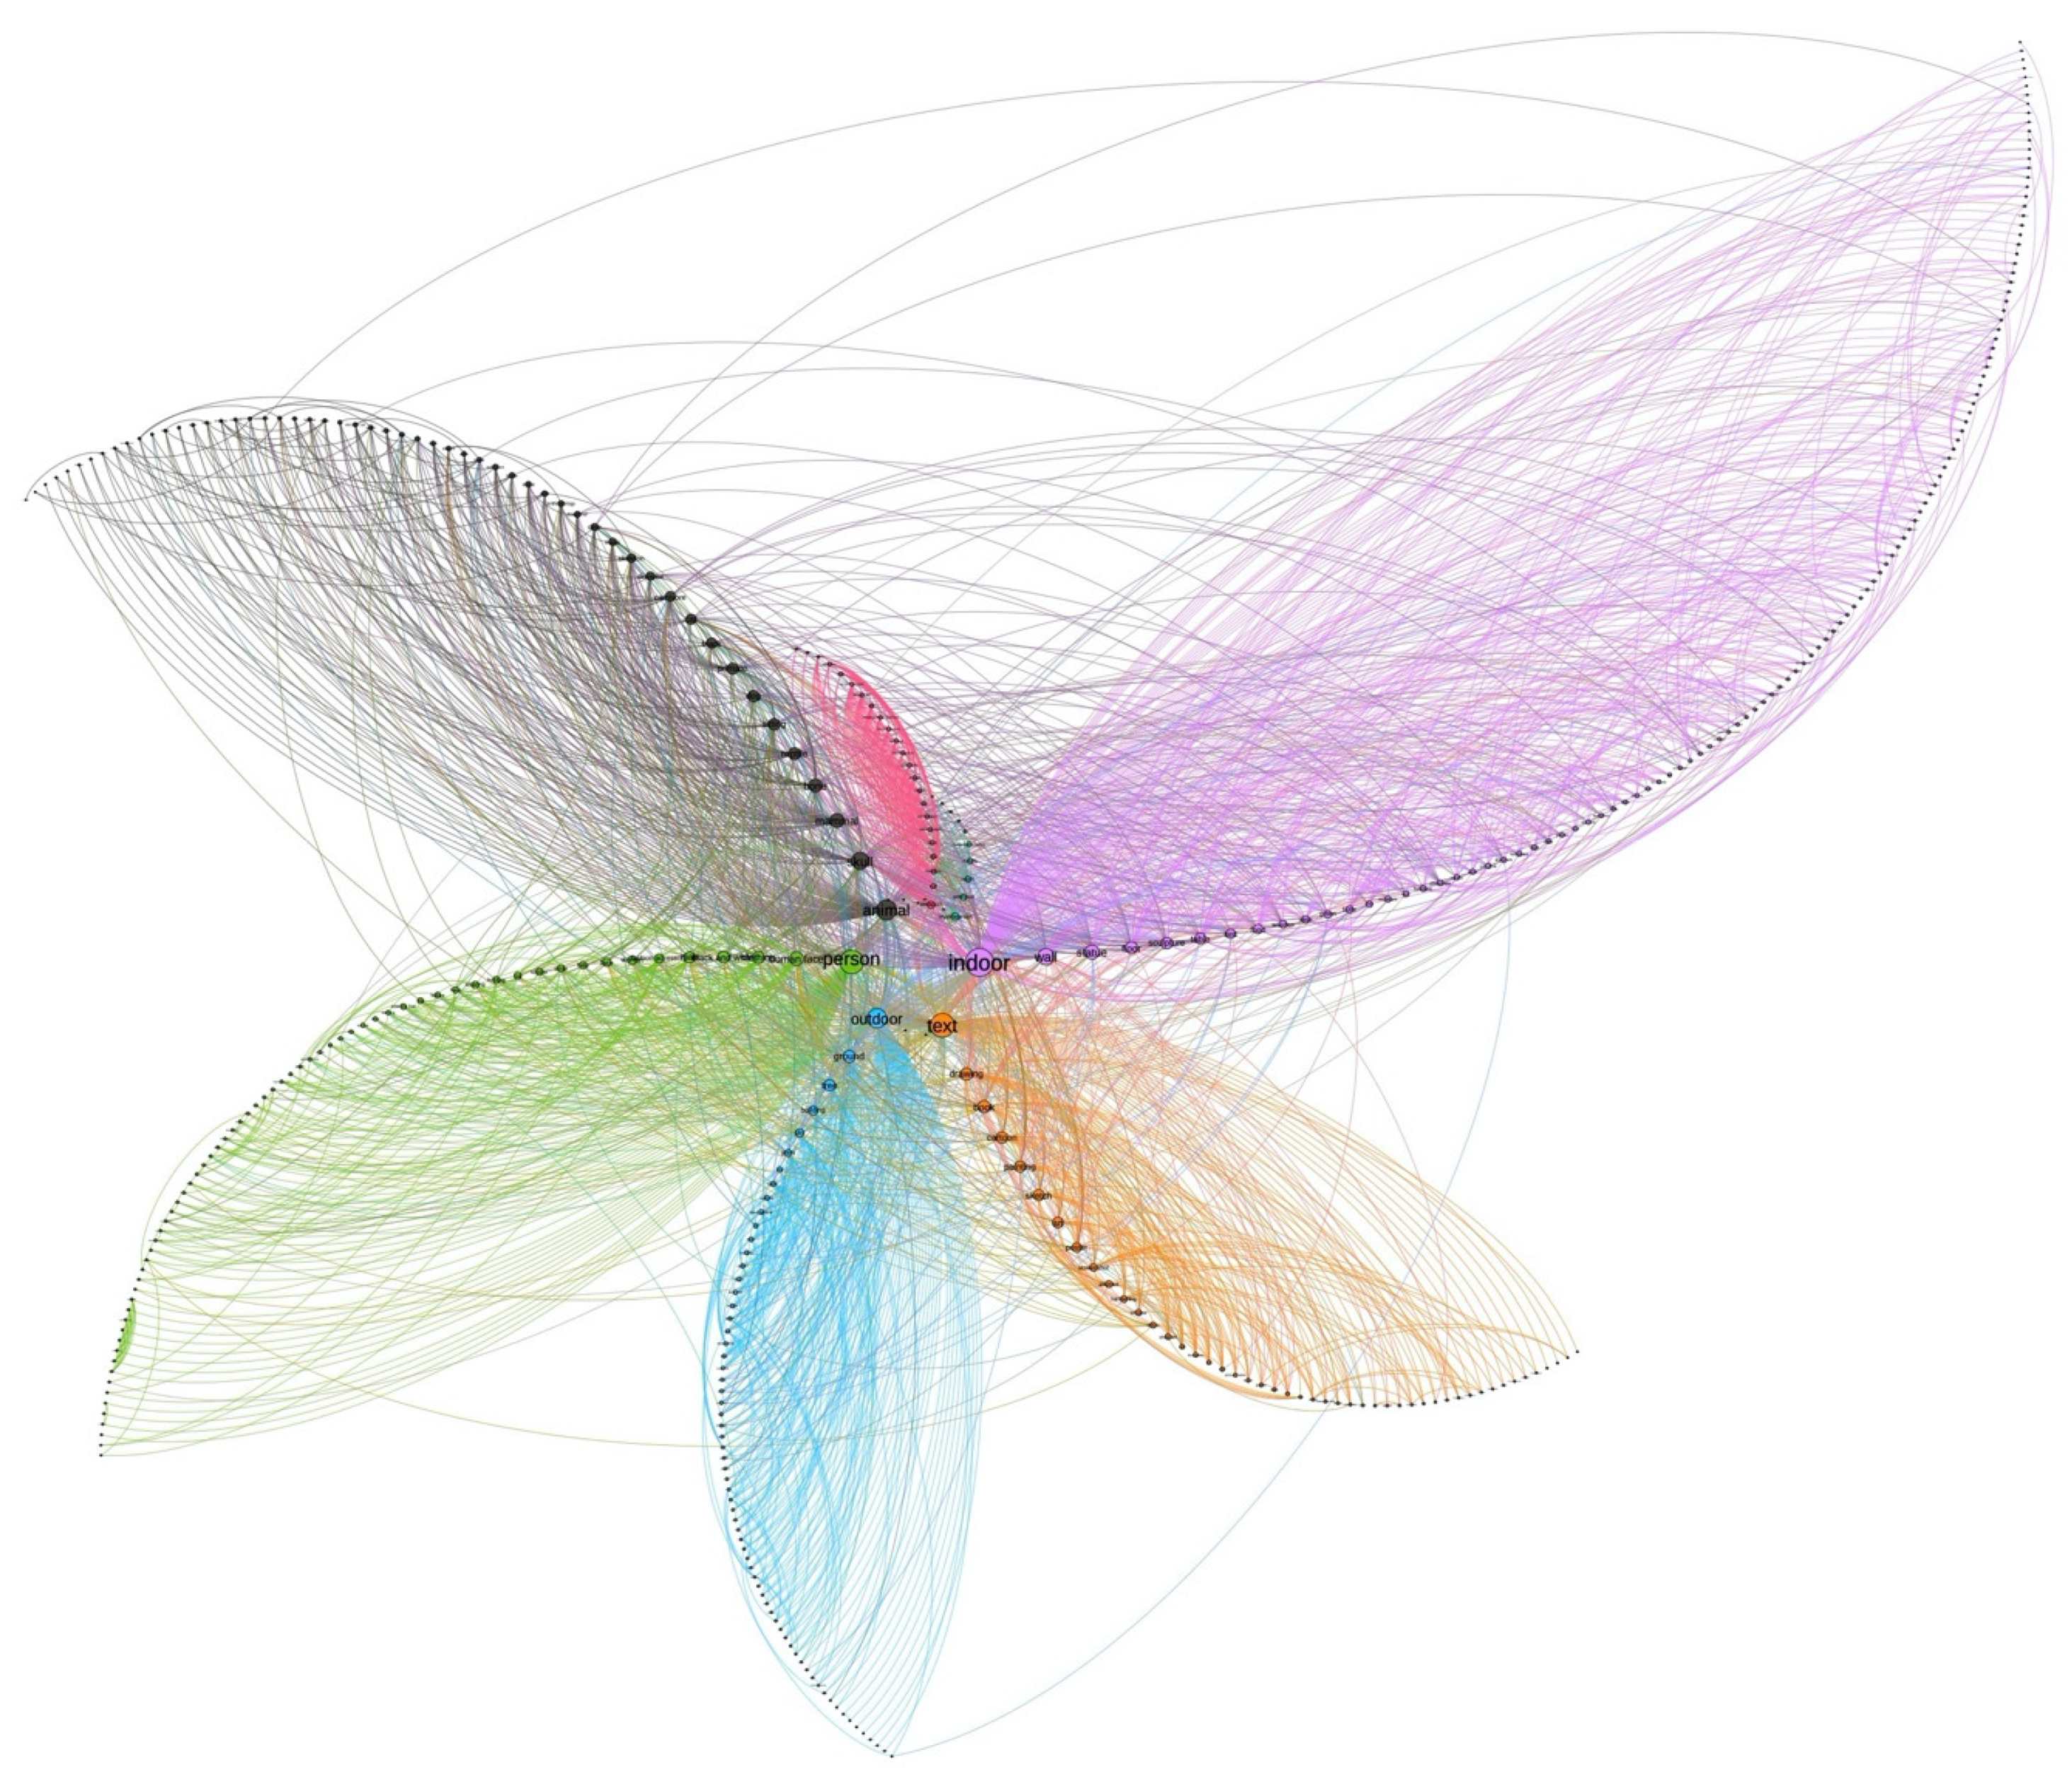
3.2.1. Vendor A
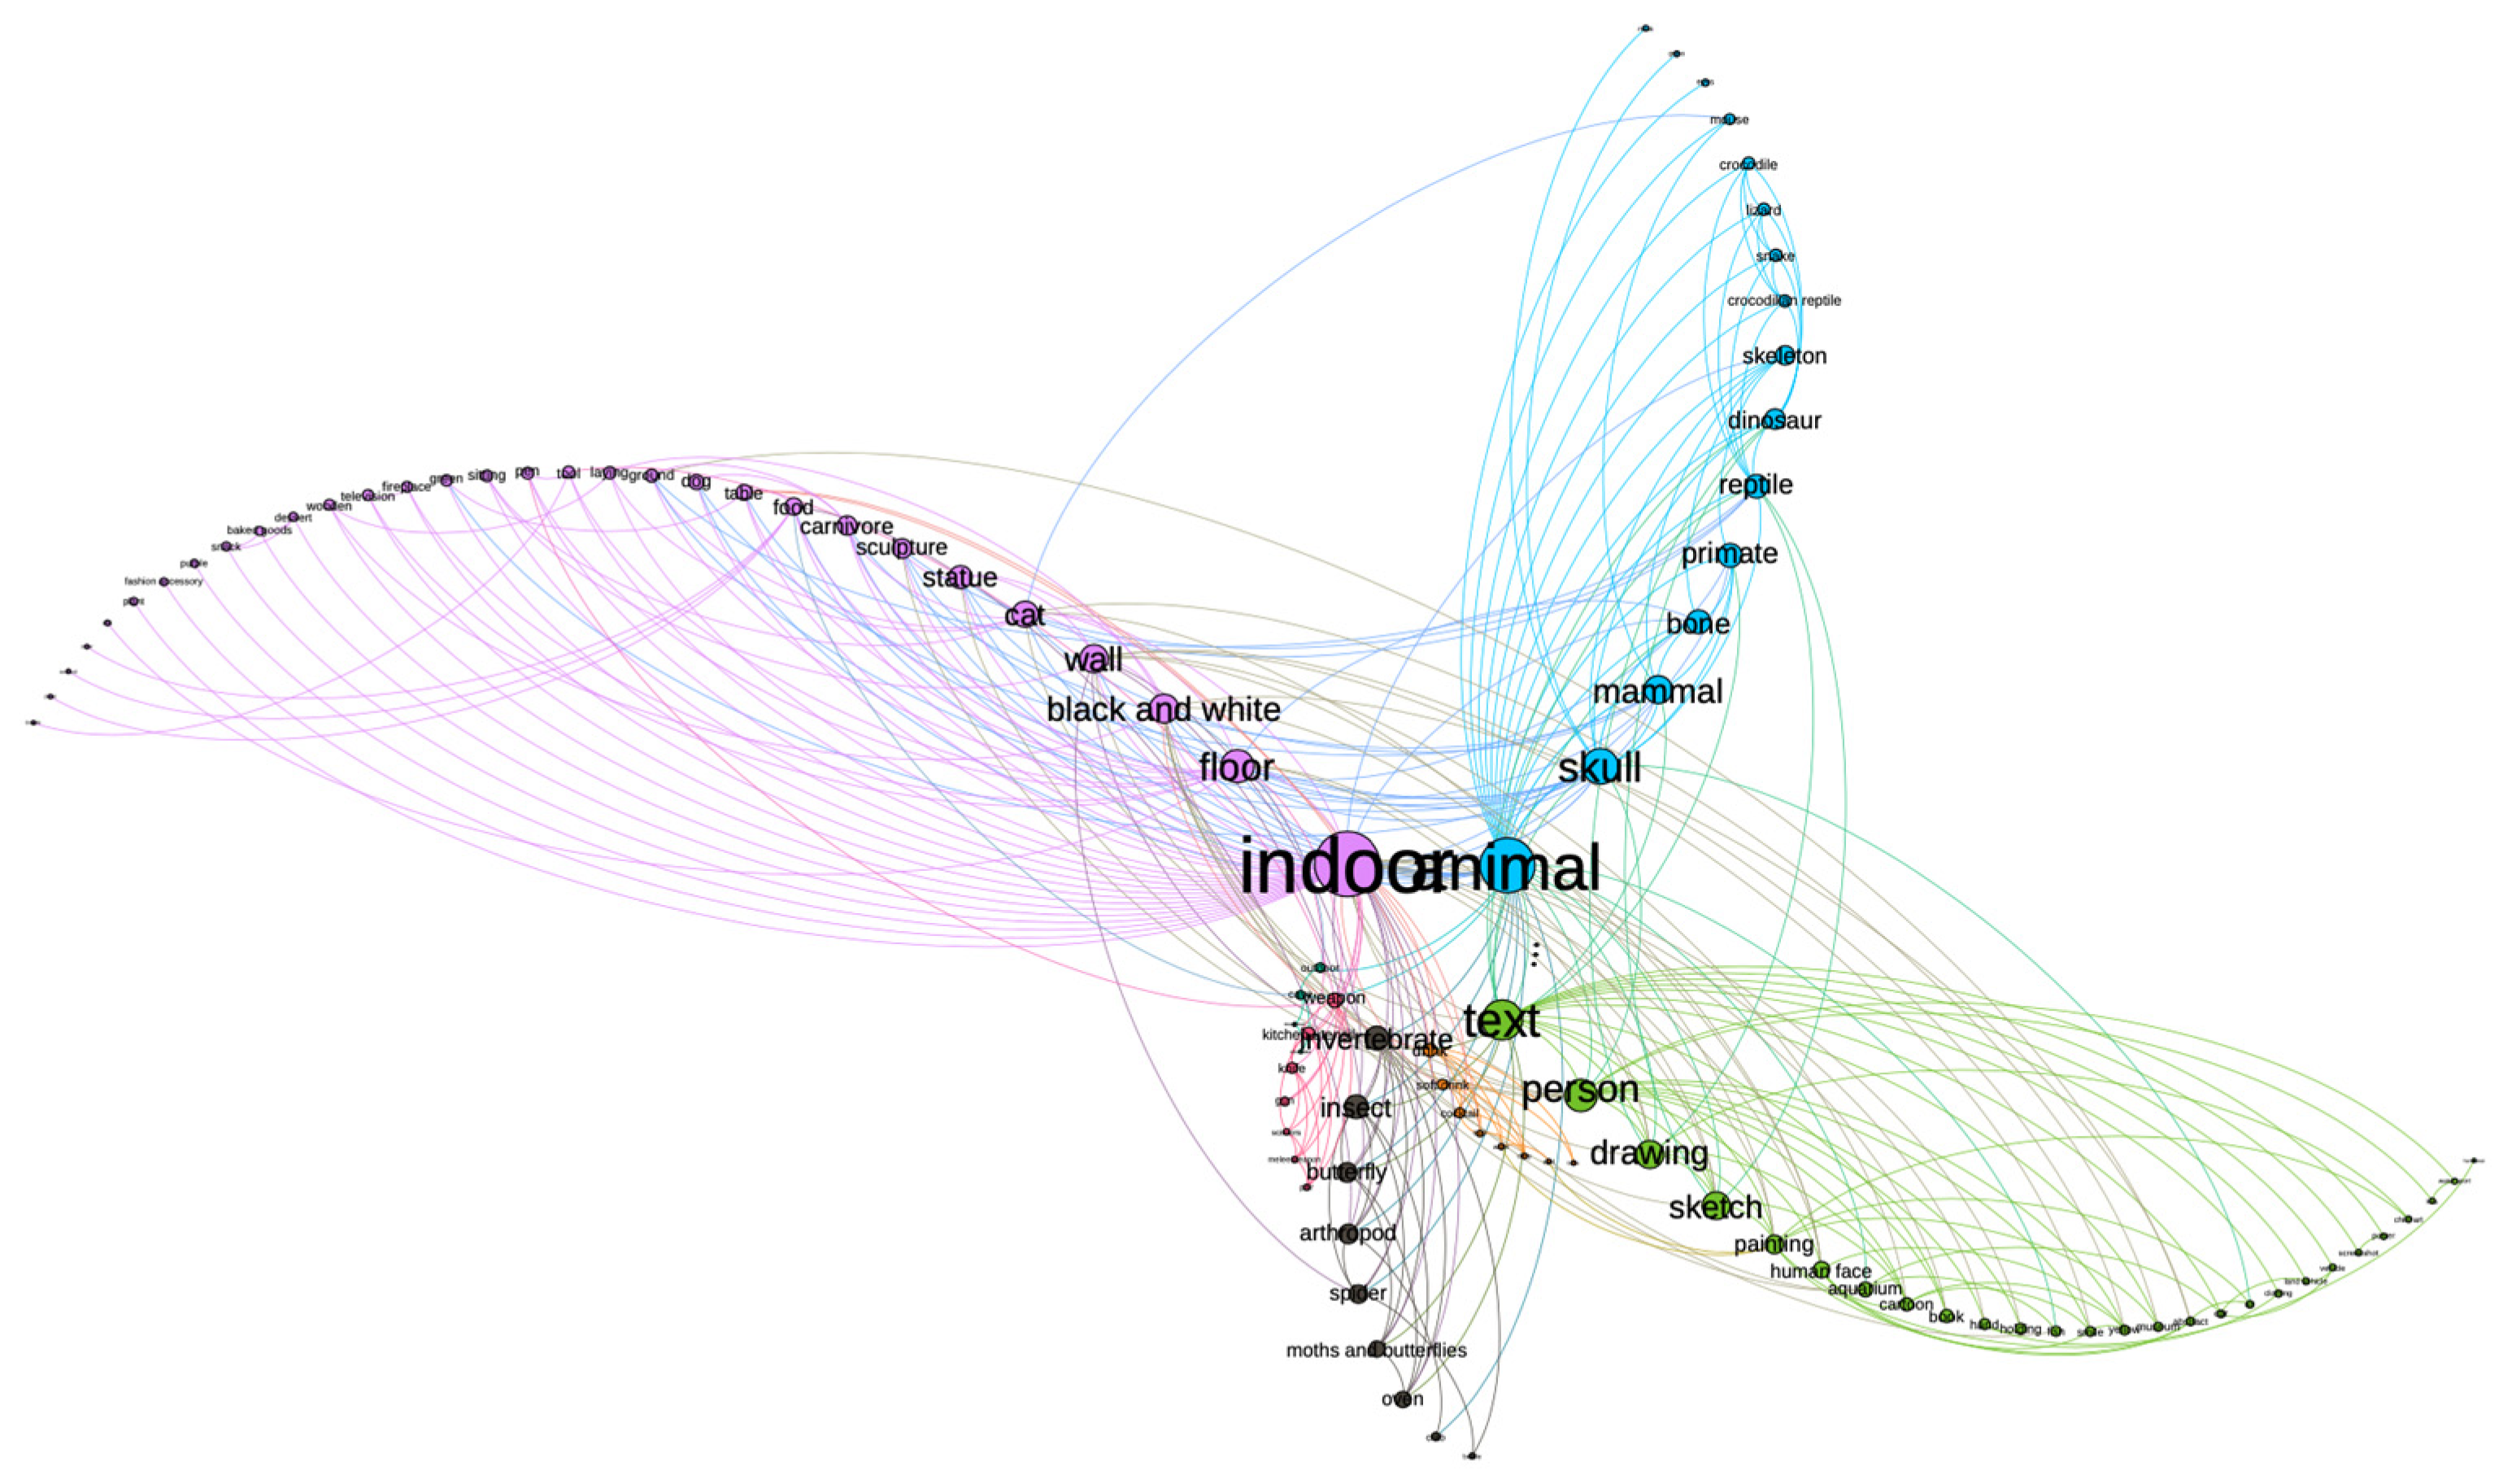
Vendor A has well over 3000 followers. The tags for this vendor are fully connected: There are no isolates, indicating a singularity of purpose (see
Figure 1). Overall top tags by eigenvector and module:
Indoor 11, text 3, person 11, animal 0, outdoor 1, skull 0, wall 11, statue 7, mammal 0, human face 11.
Six distinct sub-communities of tags (out of 25) account for >90% of the unique tags (
Table 2). There are 408 unique machine-assigned tags describing this vendor’s images.
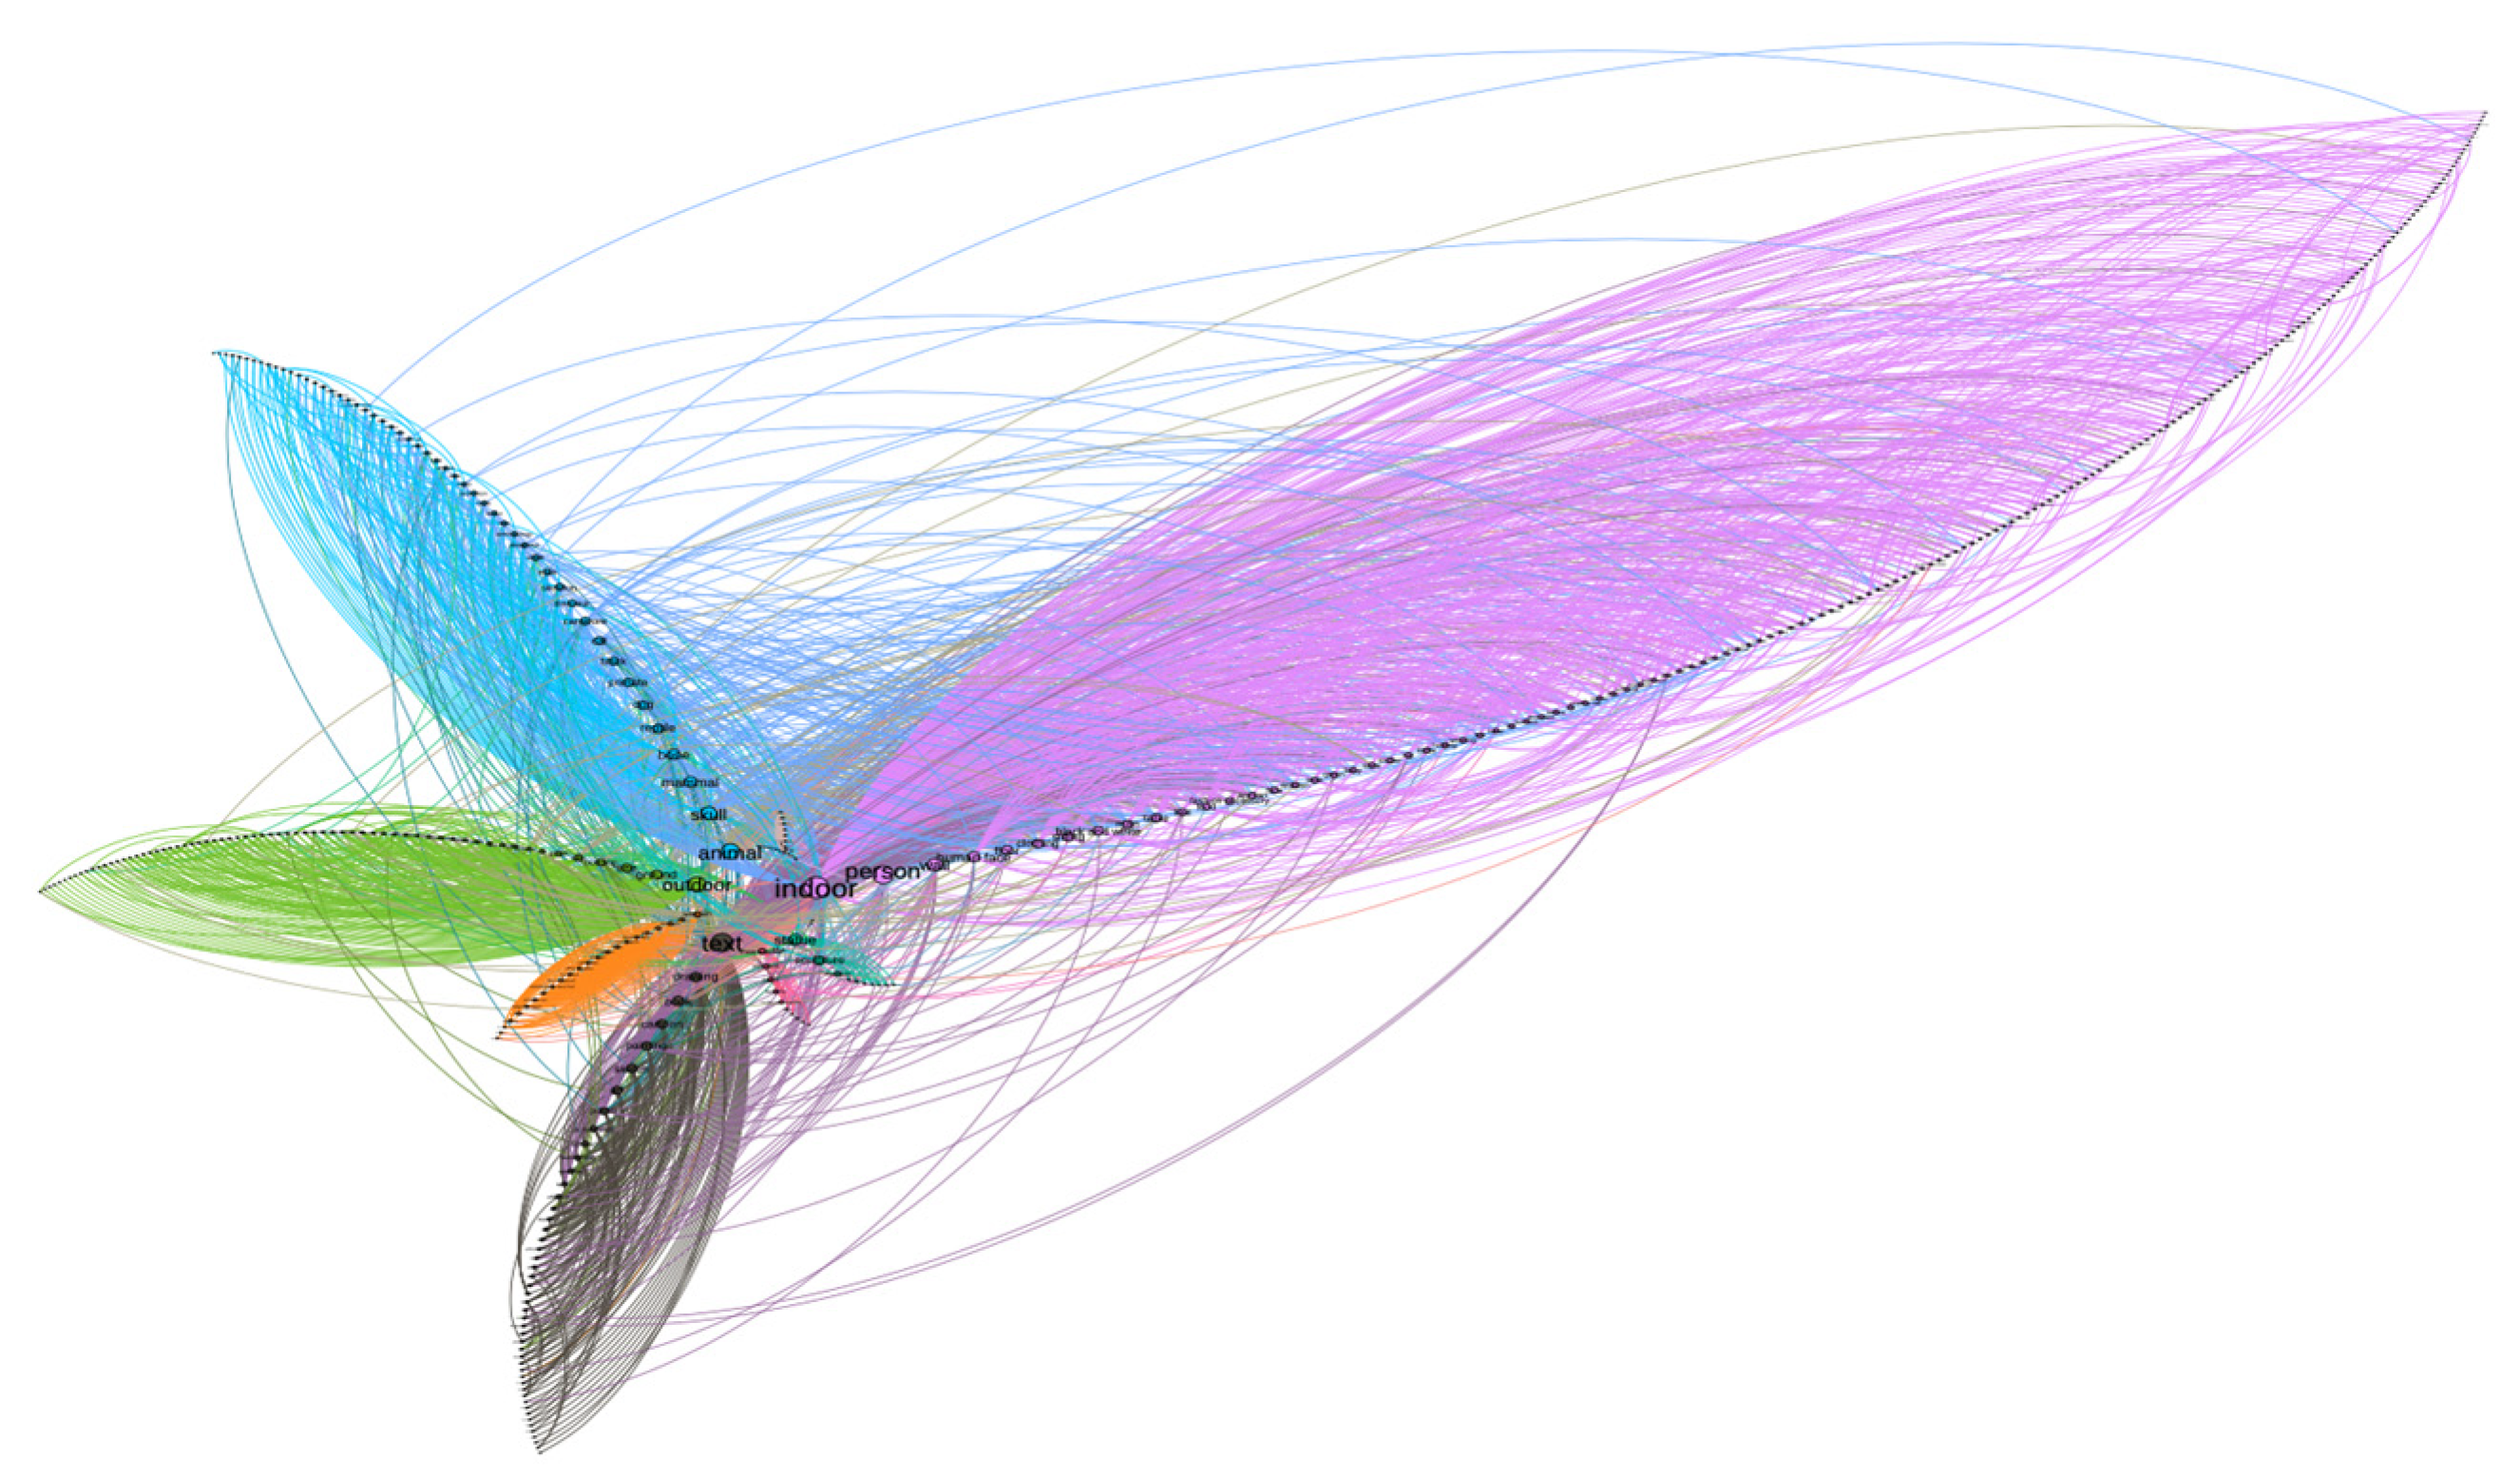
3.2.2. Vendor B
This vendor has over 10,000 followers.
Figure 2 visualizes the network of tags in this vendor’s photographs. The overall top tags by eigenvector and module:
Indoor 0, person 0, animal 4, skull 4, statue 0, bone 4, outdoor 1, sculpture 2, mammal 4, clothing 1.
Six distinct sub-communities of tags (out of 16) account for >90% of the unique tags (
Table 3). There are 126 unique machine-assigned tags describing this vendor’s images.
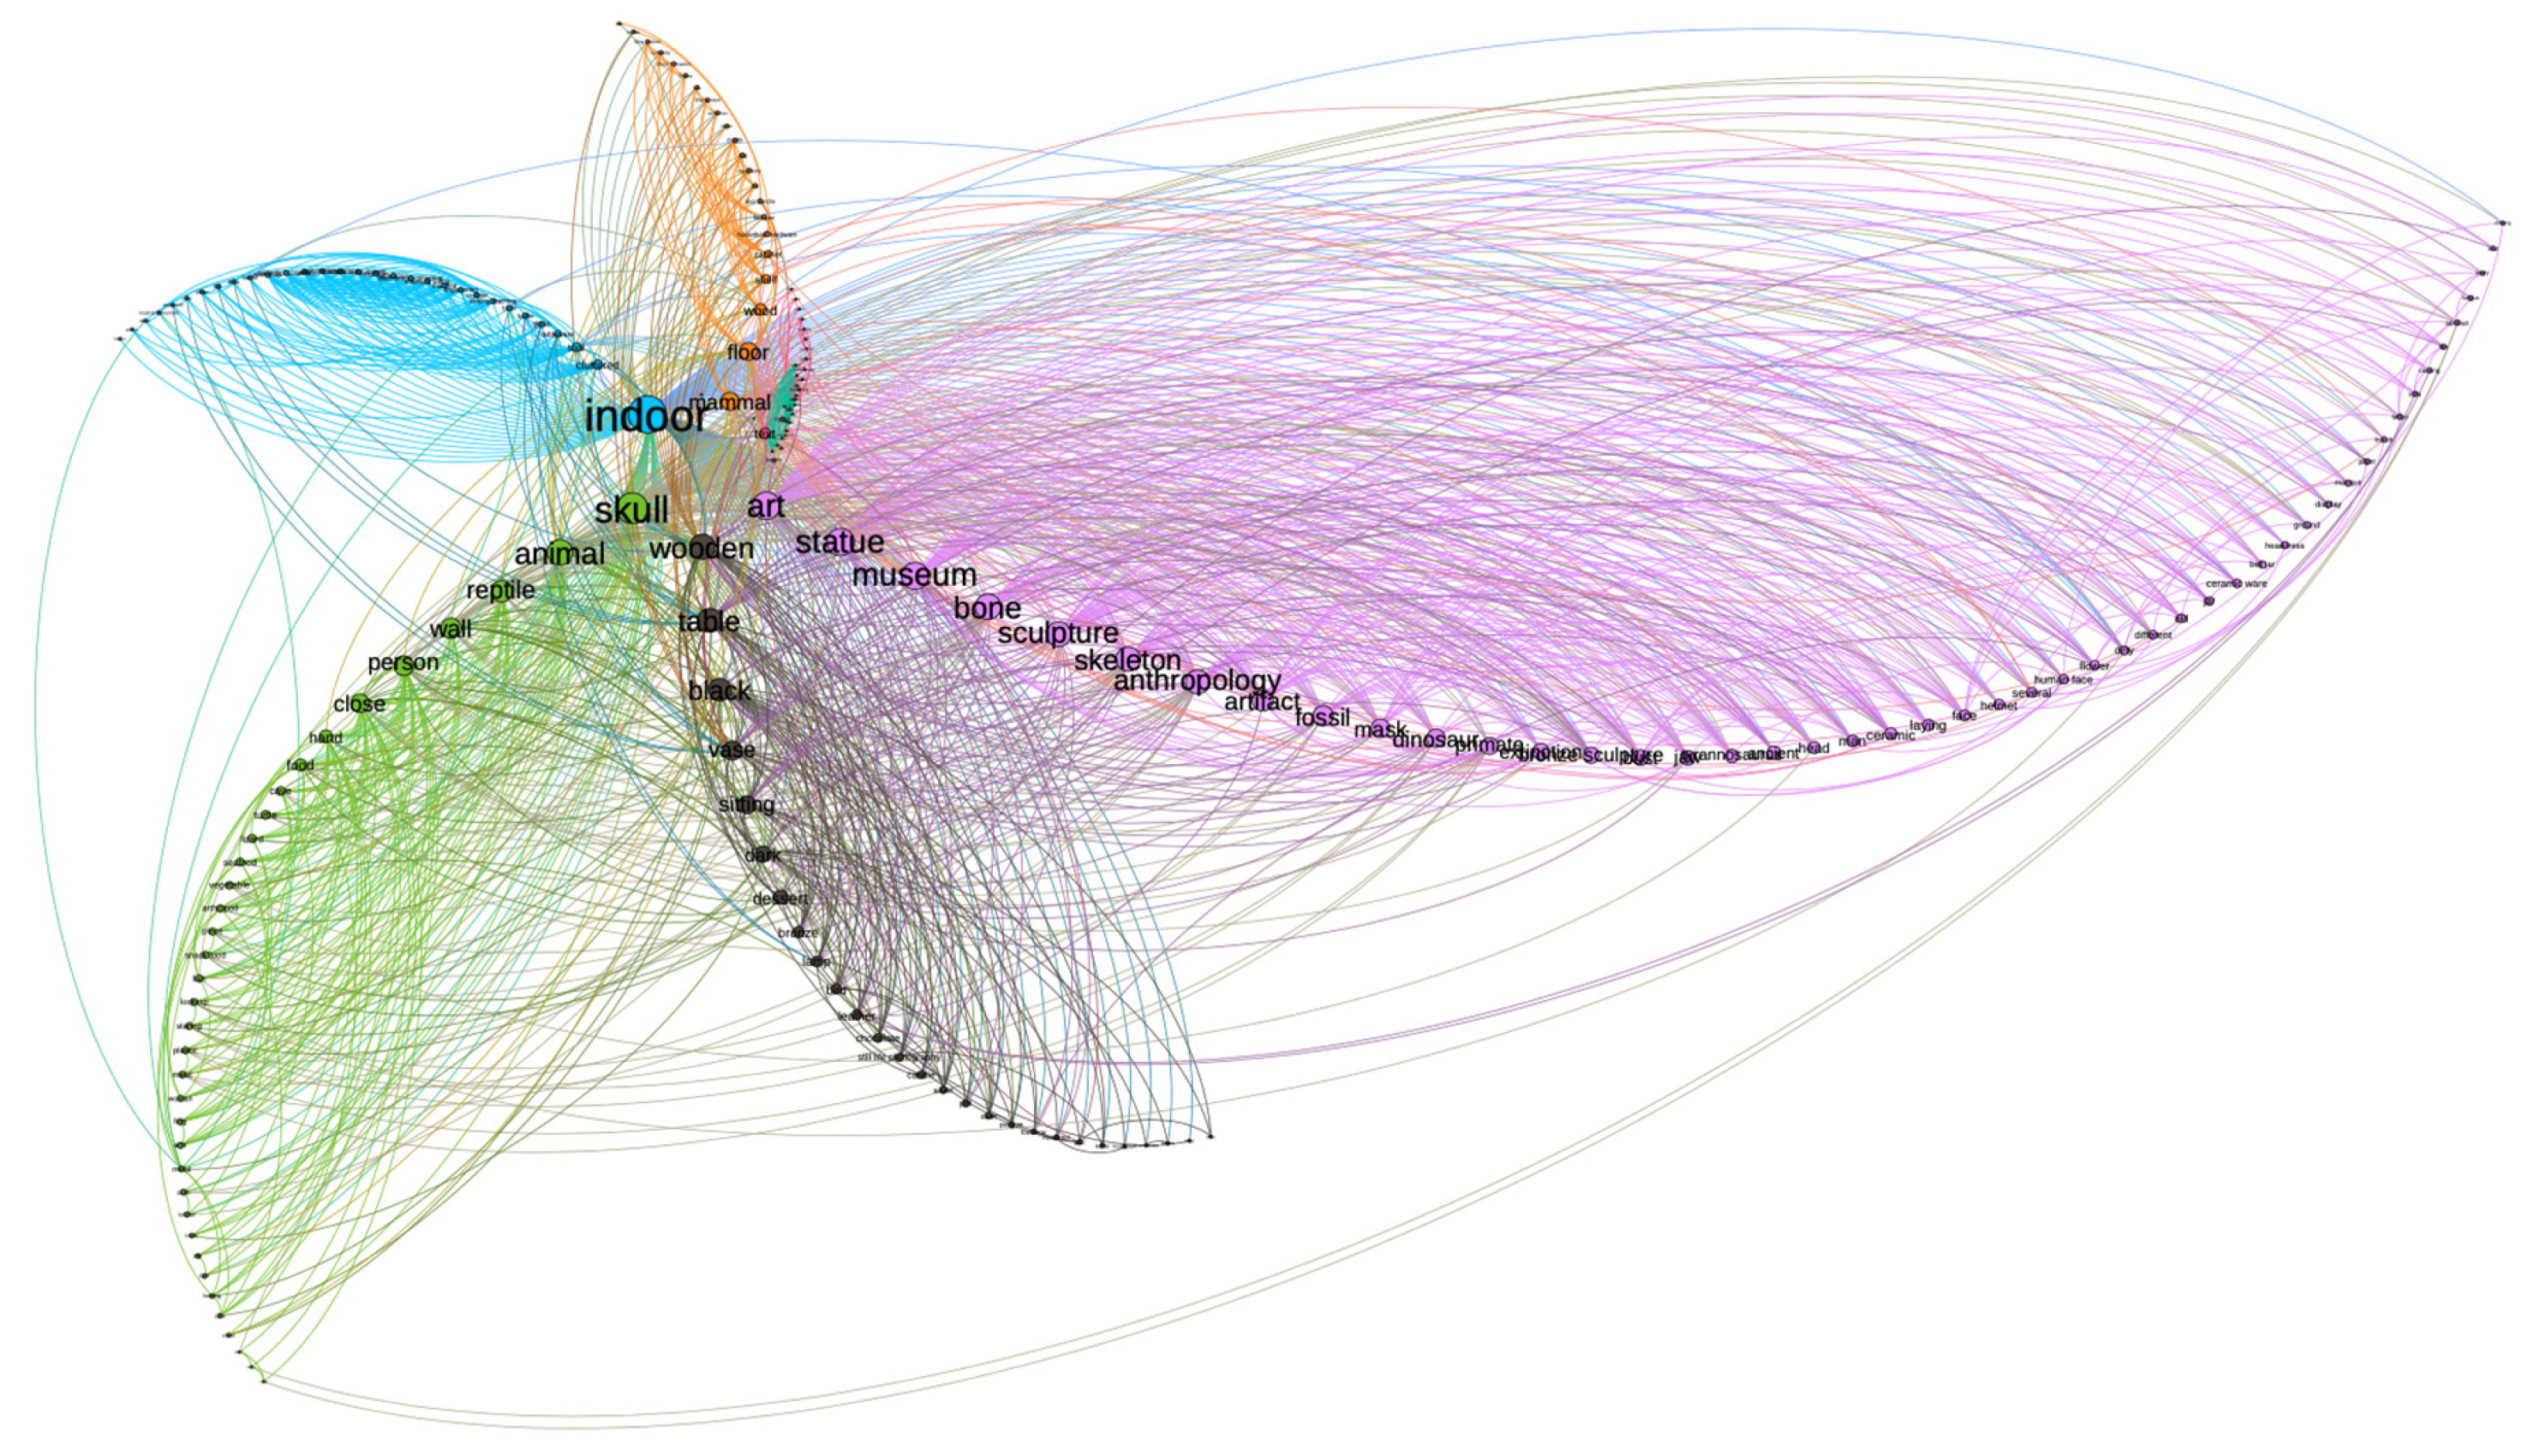
3.2.3. Vendor C
This vendor has just over 1000 followers. The tags for this vendor are in two broad clumps, indicating two very distinct interests (
Figure 3). Overall top tags by eigenvector and module:
Indoor 0, skull 1, art 3, statue 3, museum 3, bone 3, animal 1, wooden 2, sculpture 3, skeleton 3.
Six distinct sub-communities of tags (out of 10) account for >90% of the unique tags (
Table 4). There are 197 unique machine-assigned tags describing this vendor’s images.
3.2.4. Vendor D
This vendor has just over 1000 followers. The tags for this vendor are fully connected (
Figure 4). Overall top tags by eigenvector and module:
Indoor 1, animal 0, text 6, skull 0, floor 1, person 6, black and white 1, wall 6, drawing 6, mammal 0.
Six distinct sub-communities of tags (out of 10) account for >90% of the unique tags (
Table 5). There are 105 unique machine-assigned tags describing this vendor’s images.
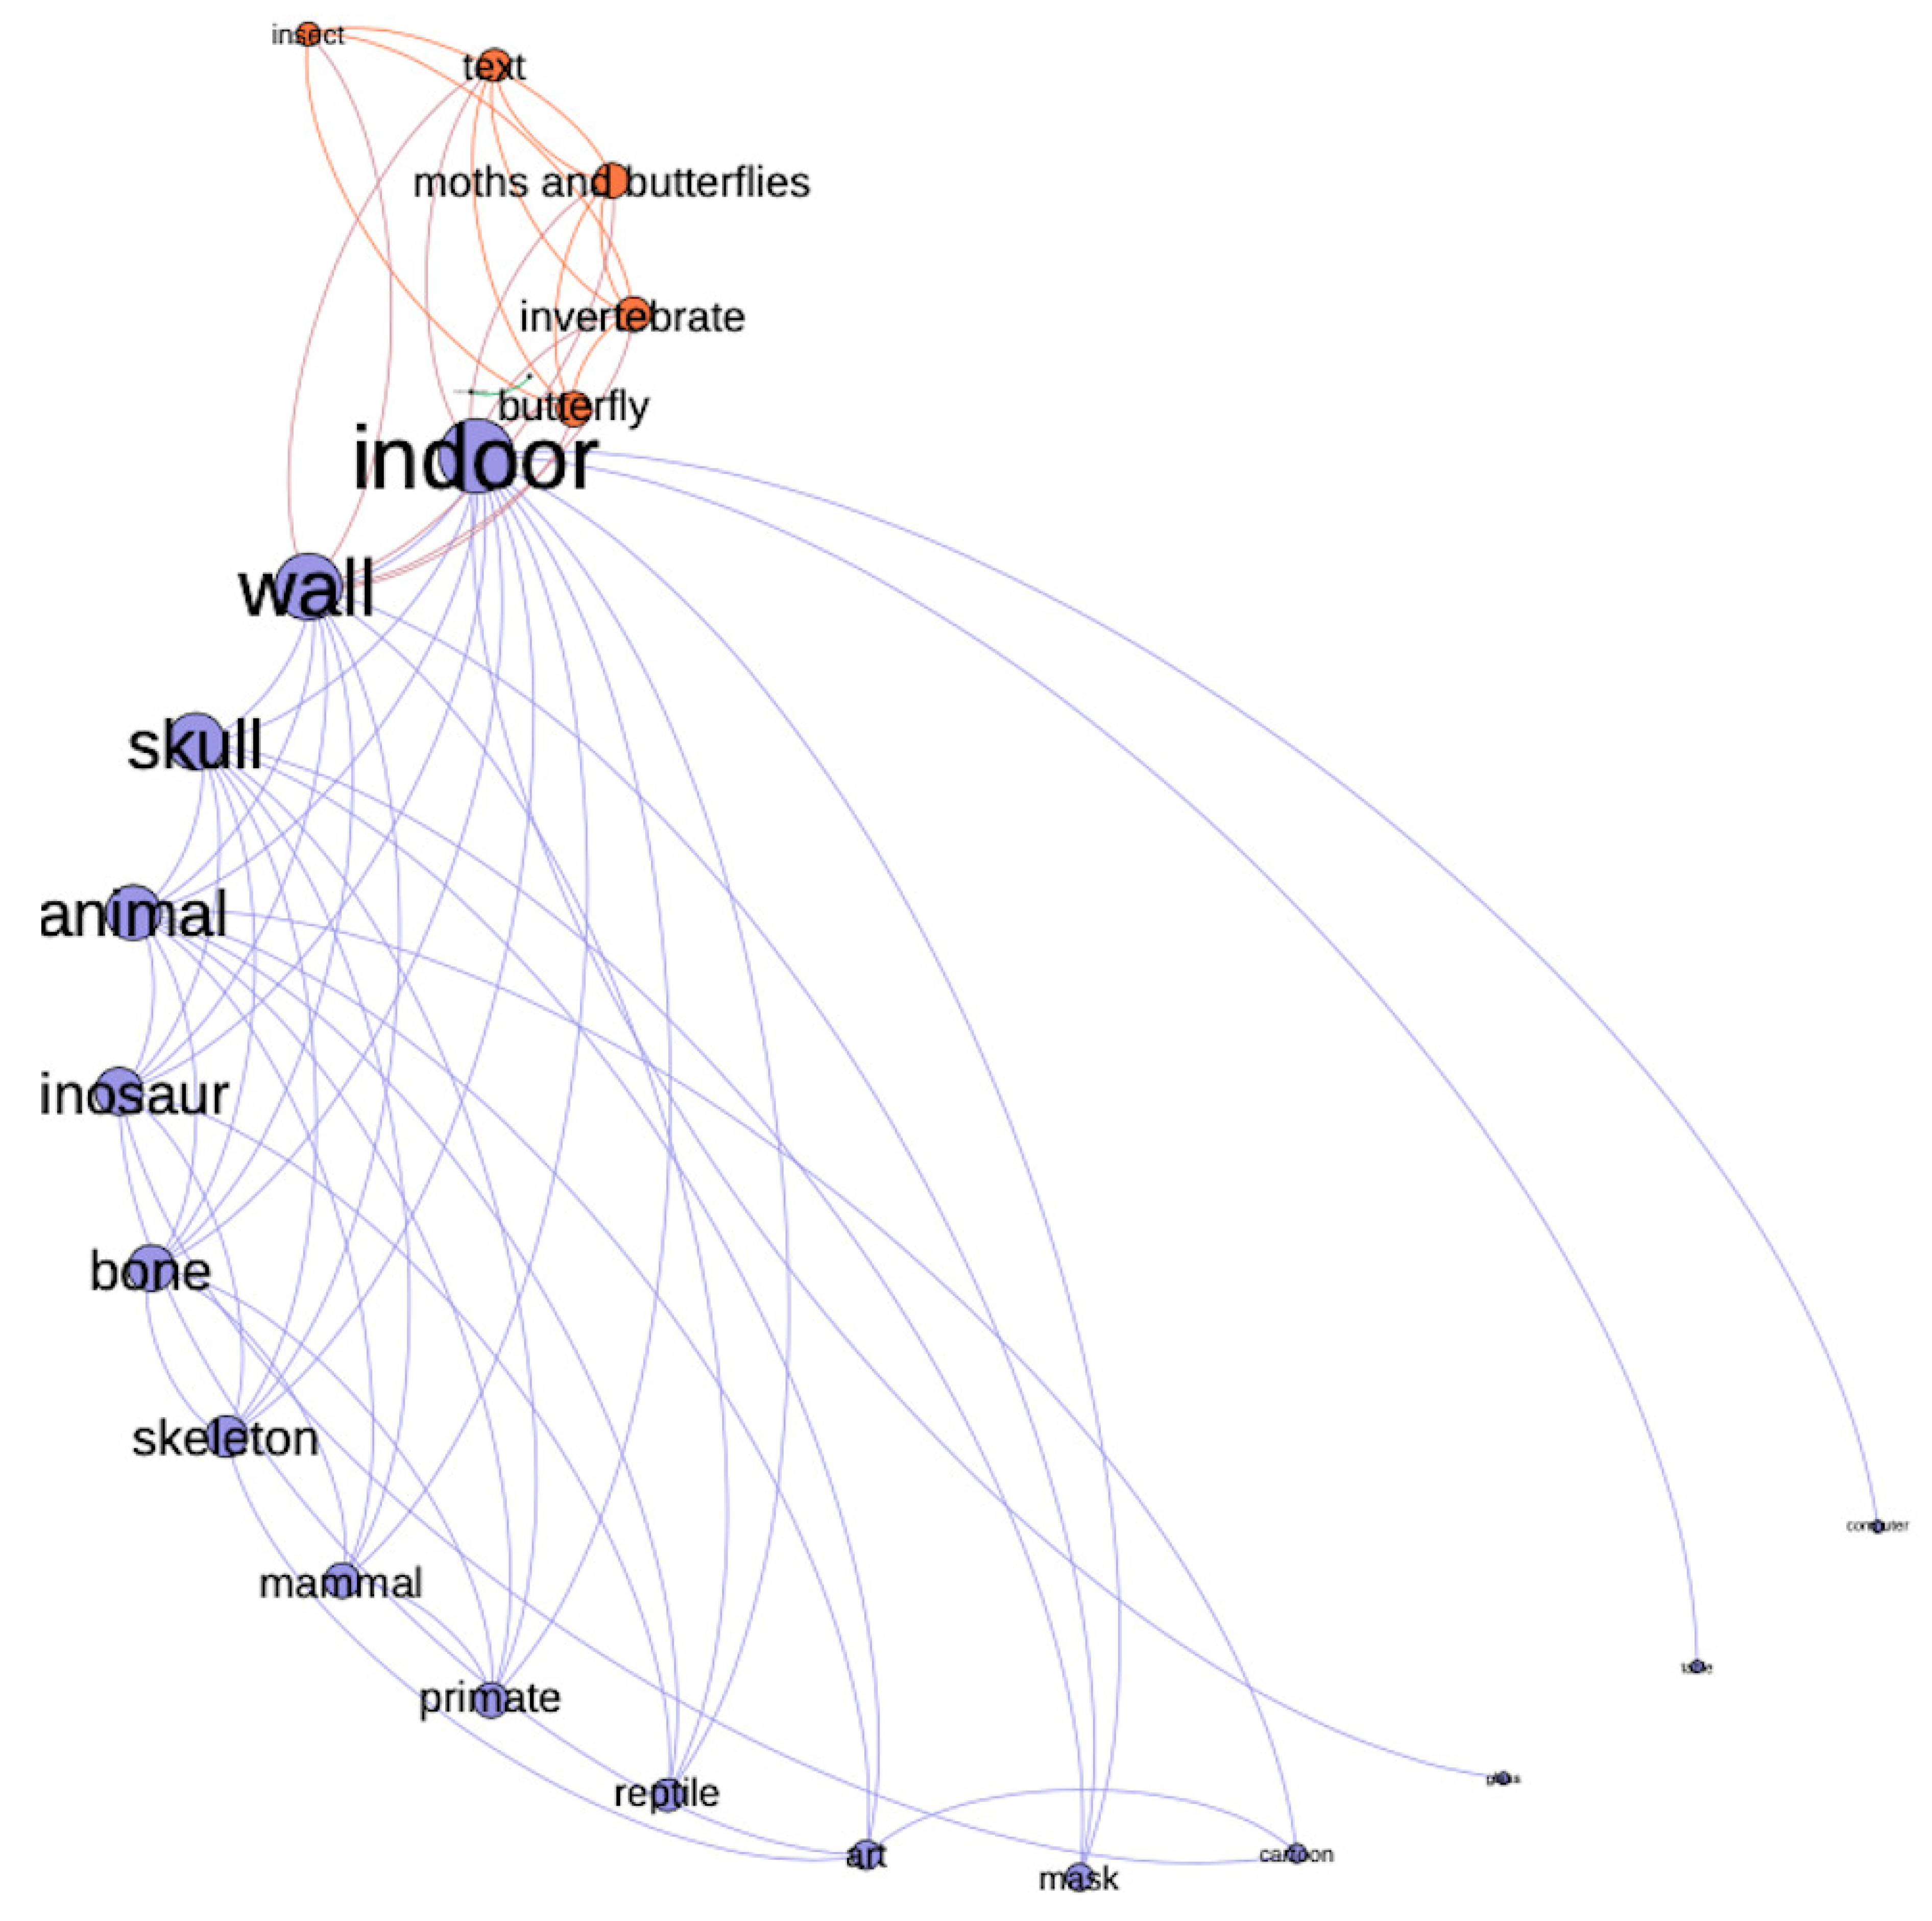
3.2.5. Vendor E
This vendor has less than 100 followers. The tags for this vendor are fully connected (
Figure 5): There are no isolates, indicating a singularity of purpose. Overall top tags by eigenvector and module:
Indoor 0, wall 0, skull 0, animal 0, dinosaur 0, bone 0, skeleton 0, mammal 0, primate 0, butterfly 1.
Two distinct sub-communities of tags (out of 3) account for >90% of the unique tags (
Table 6). There are 23 unique machine-assigned tags describing this vendor’s images.
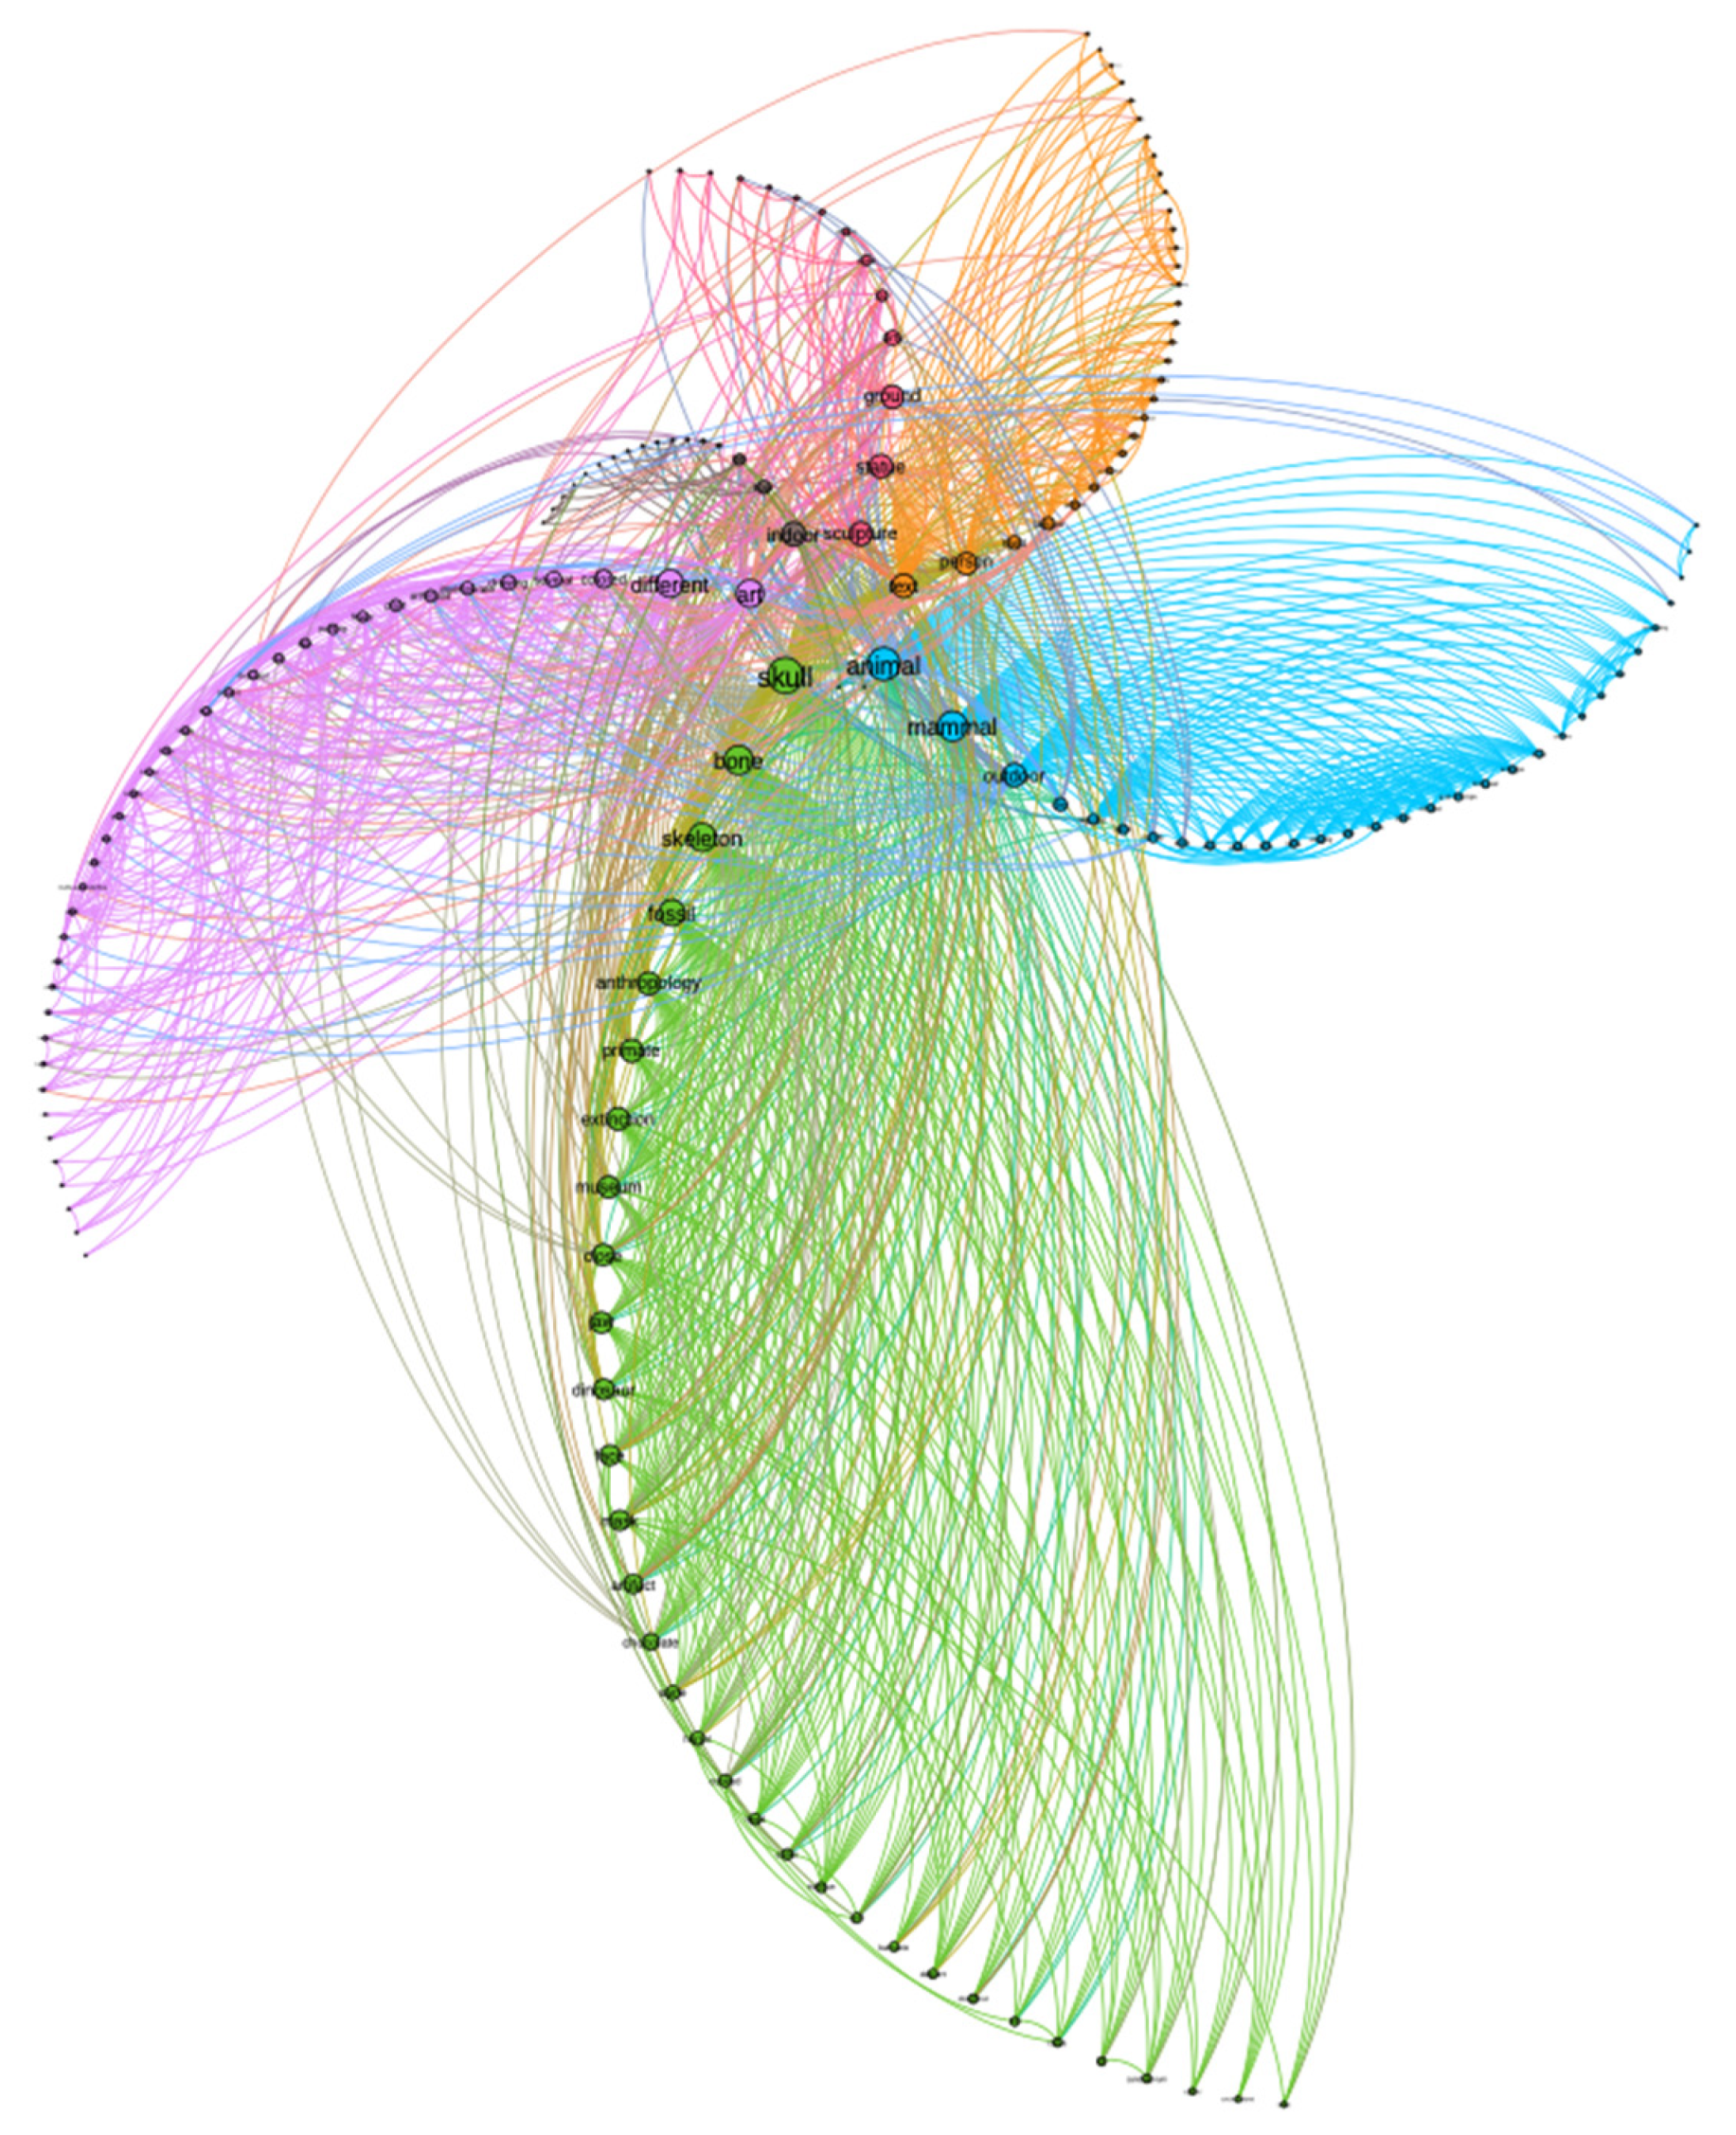
3.2.6. Instagram Search Results for ‘humanskullsforsale’
On 5th February, 2020, a scrape of the Instagram hashtag ‘humanskullsforsale’ retrieved 116 unique posts.
Figure 6 visualizes the network of tags in this vendor’s photograph. There are 166 unique machine-assigned tags describing the images returned by a search for the Instagram hashtag. There were seven modules in one connected component. Overall top tags by eigenvector and module:
Skull 2, animal 4, mammal 4, bone 2, skeleton 2, art 1, different 1, fossil 2, indoor 0, sculpture 6.
Six distinct sub-communities of tags (out of 7) account for >90% of the unique tags (
Table 7).
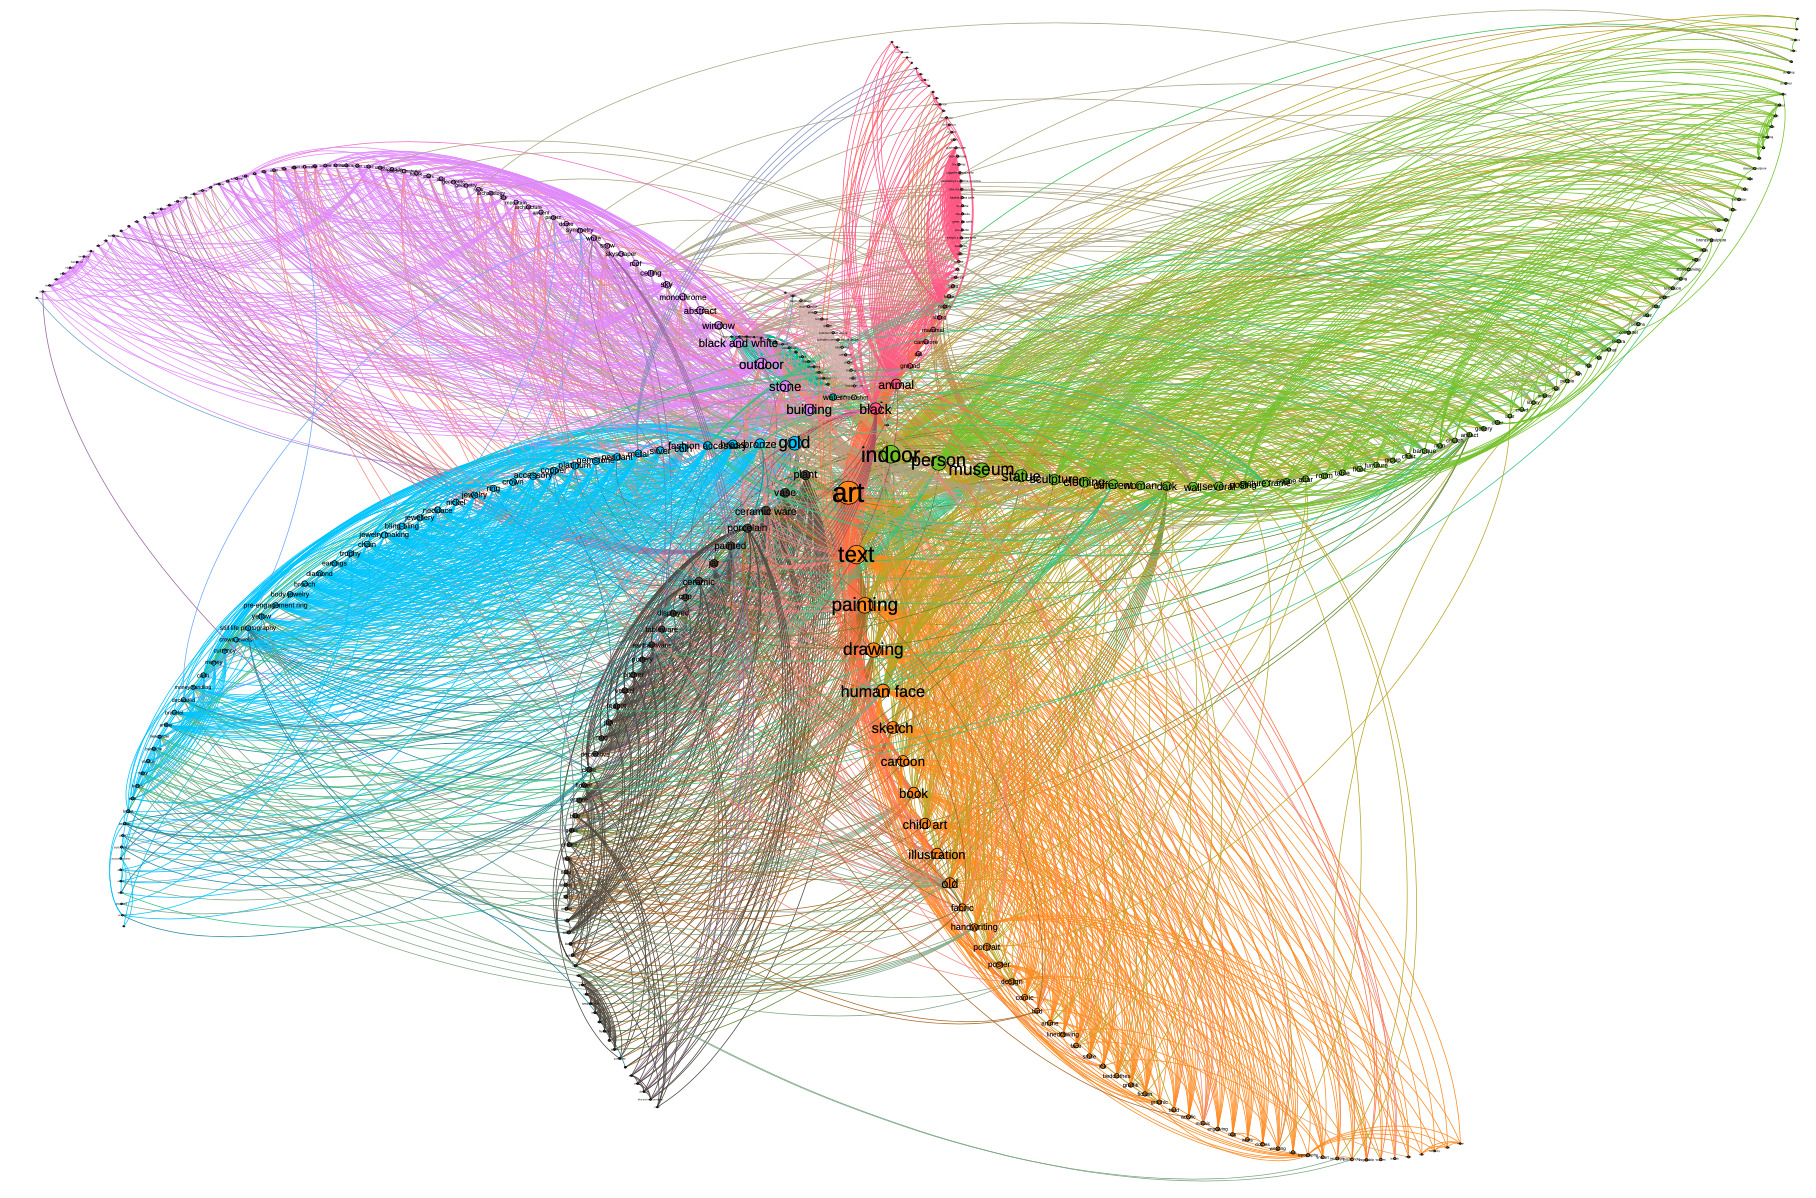
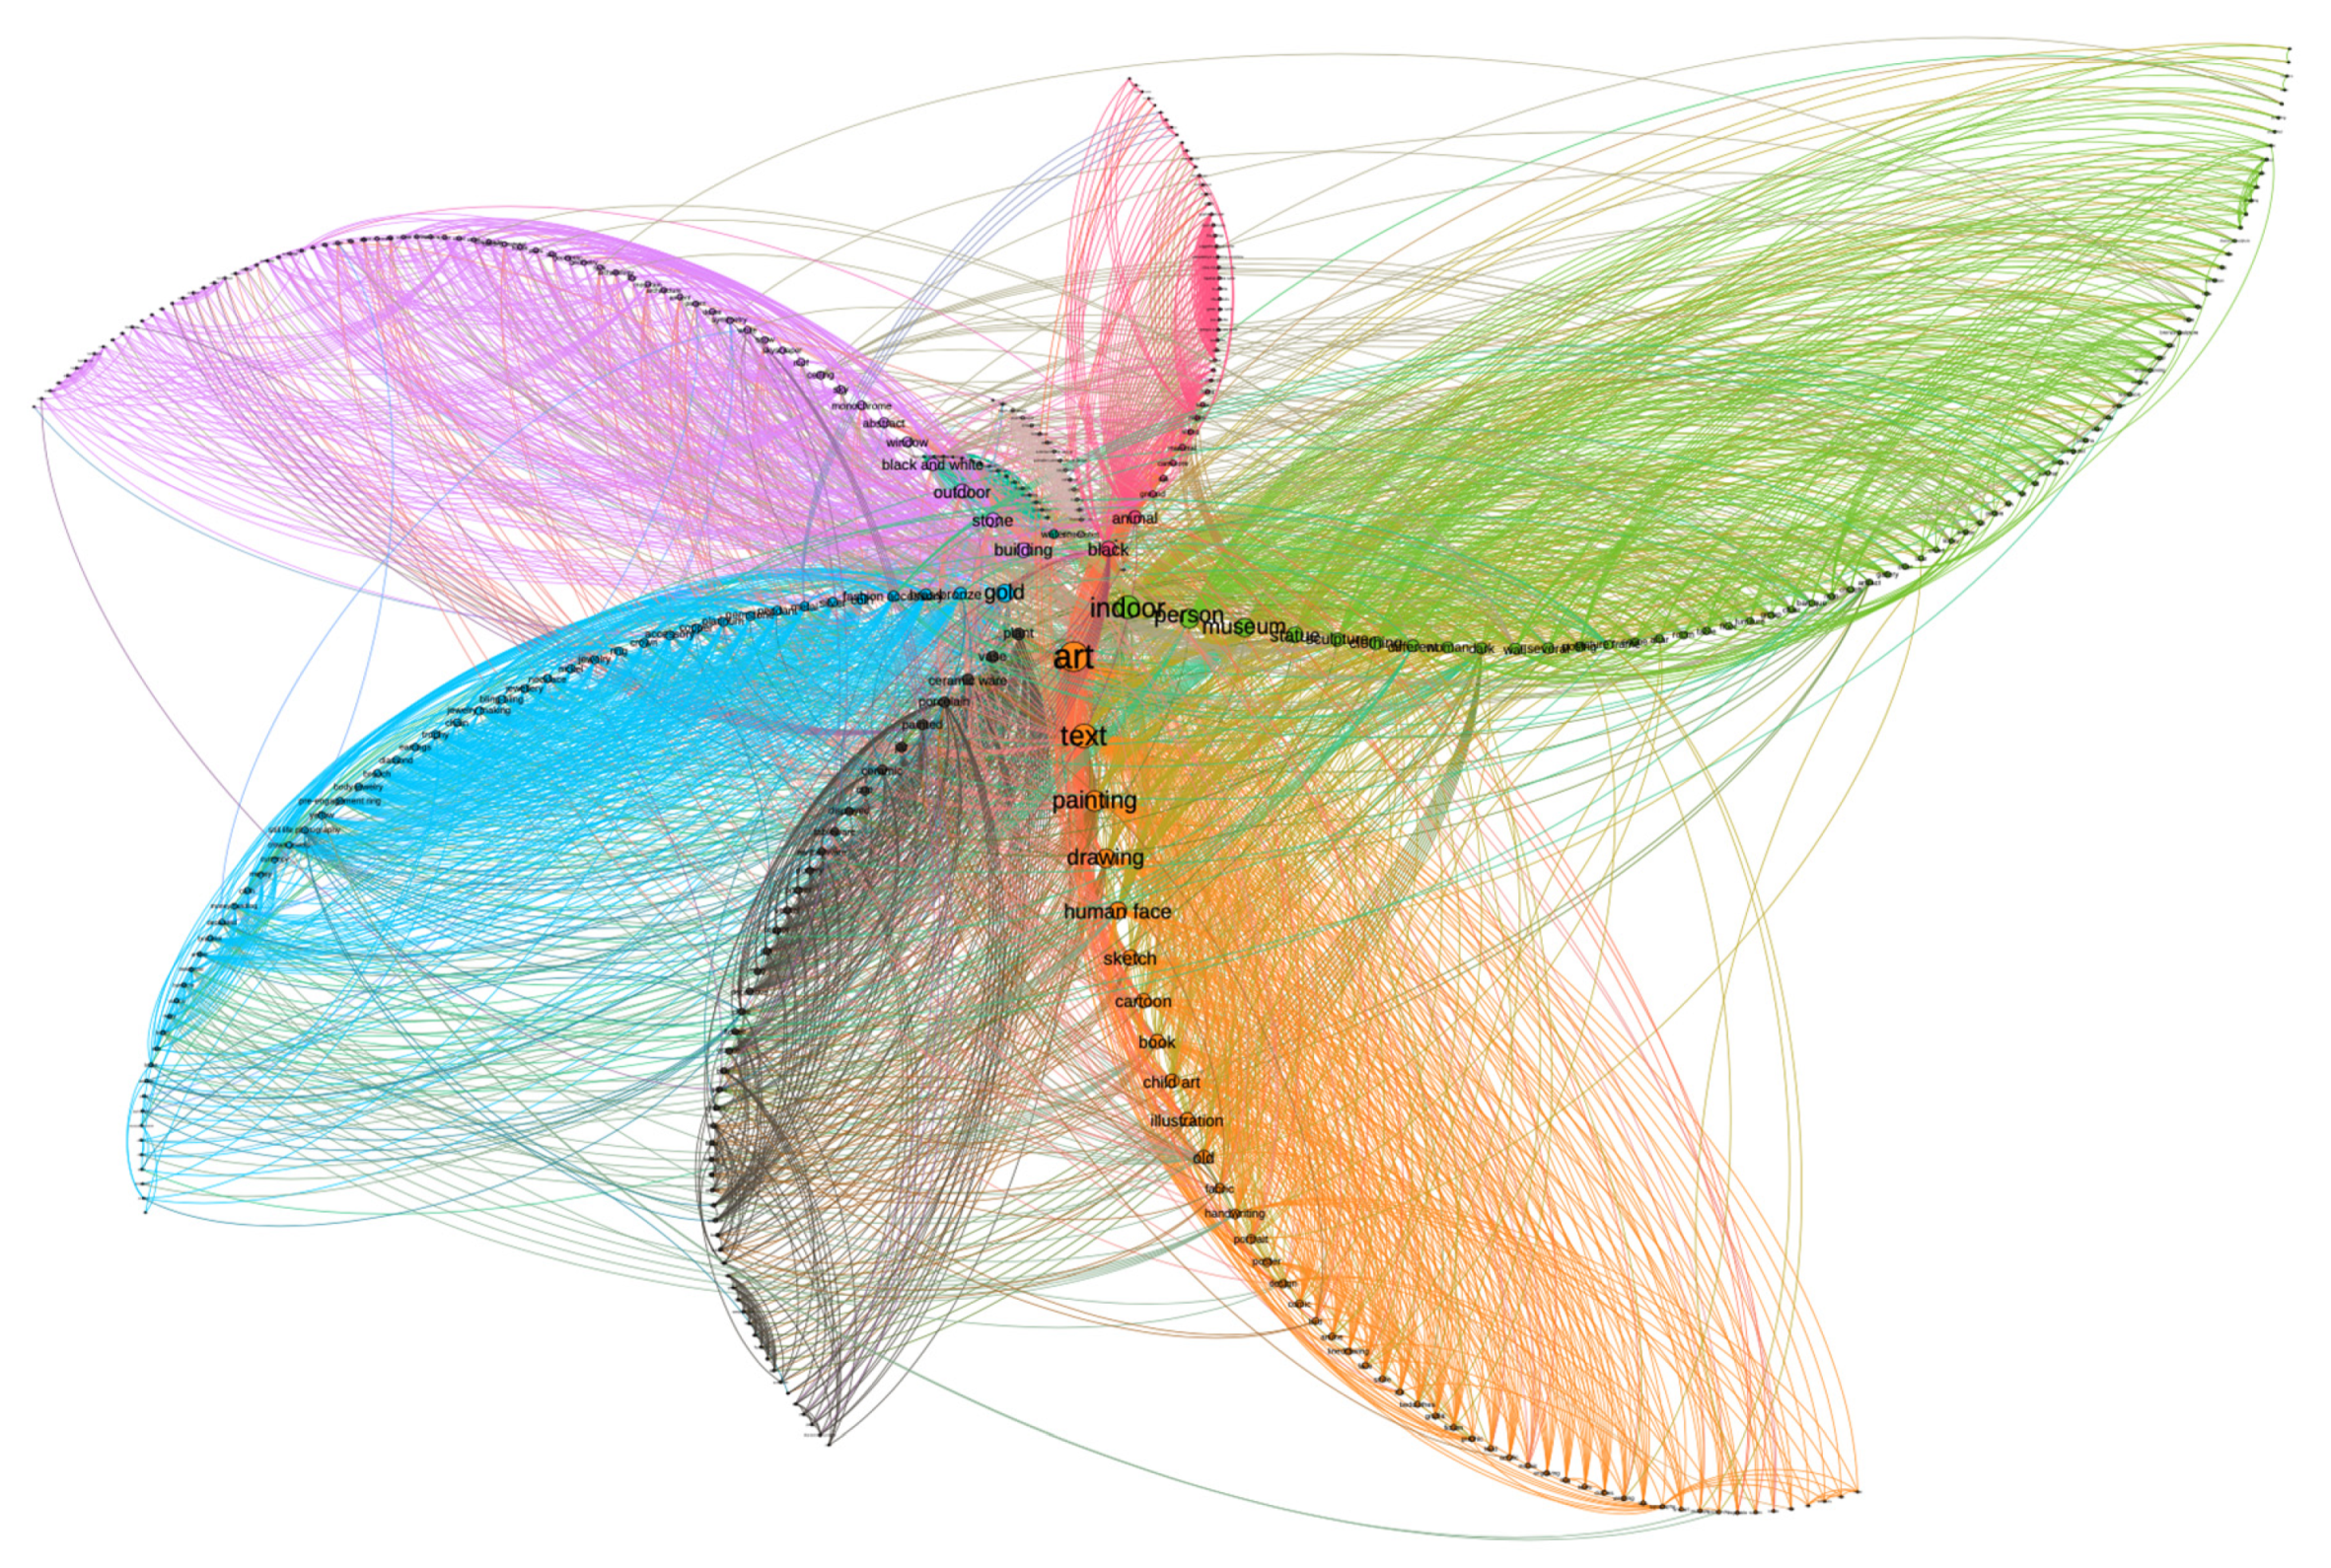
3.2.7. The British Museum Instagram User Page
The British Museum has over 1 million followers on Instagram. On 28th February, 2020, a scrape of the Instagram user account for the British Museum downloaded 462 unique posts. There are 373 unique machine-assigned tags describing the images. There were 10 modules in one connected component (
Figure 7). Overall top tags by eigenvector and module:
Art 4, text 4, indoor 5, painting 4, person 5, drawing 4, museum 5, gold 2, human face 4, statue 5.
Seven distinct sub-communities of tags (out of 10) account for >90% of the unique tags (
Table 8).
3.2.8. Network Metrics
Intuitively, when we look at the visualizations of the networks in
Figure 1,
Figure 2,
Figure 3,
Figure 4,
Figure 5,
Figure 6 and
Figure 7, we can see by eye that the subcommunities within each network are distributed in what appear to be interesting ways. Recall that these networks are formed by projecting the most probable image–tag pairs and their probability into a network where tags are connected to other tags by virtue of being assigned to the same photograph. The metrics listed in
Table 9 capture the topologies of these networks.
‘Average degree’ means the average number of connections for any one node; here, we can understand that as the average number of photographs that any one tag will be associated with. ‘Density’ is the proportion of existing edges against the total number of edges that could exist (i.e., if every node is connected to every other node, then density = 1). The ‘diameter’ of a network is the longest of all of the possible shortest paths between every pair of nodes in the network; that is to say, if one picked any two nodes at random, no shortest path between them would be longer than the diameter. The ‘average path length’ is the average length of all those shortest paths.
Average degree might on first blush appear to not be a very useful measure for us, since one might expect it to be a function of the number of photos originally analyzed in the first place. This does not seem to be the case—for instance, Vendor A and the Search Results network were generated from 6381 and 245 photos, respectively, which suggests to us that average degree is a reflection of visual richness within photographs.
When we search Instagram for ‘humanskullsforsale’, we get back a page of results where every post—whether or not it actually depicts a human skull—has been marked up that way deliberately. It is striking that the network topology for the results for the search are identical to those of Vendor A and Vendor B, the major vendors. Vendors D and E, the two smallest vendors in terms of numbers of followers, have networks that differ dramatically in terms of density. We might interpret this to mean that Vendor E’s photos, while not visually rich (as indicated by average degree), are thematically tight (density of connections).
Diameter and average path length are two different facets of the same action, that of traversing the network; we might think of these as being expressions of the way the different tags start to cohere into ‘scenes’ or descriptive sentences. In which case, Vendor E (while having more photos than Vendors C and D and the Search Results network) has photos that are semantically sparse.
4. Discussion
The machine sees different elements in an image, and composes rich sets of tags for each image to capture the objects it identifies, the nouns, and sometimes adjectives. It can clarify what it means by collating nouns together, e.g., painting, abstract, monochrome, outside, atmosphere. The machine sometimes experiences a kind of pareidolia, which, when we unpack it, might also point to a way to automatically flag images for human inspection (the ‘doughnuts’ or the ‘arthropods’). We can then treat these assignments as a kind of network, and begin to pair nouns together tied by their co-assignment to photographs; the emergent clusters give us an affective sense of what this site (this Vendor, the results of this Search, this museum) is like, what effect or feeling is evoked when visiting the site.
The absolute number of assigned tags indicates the visual richness of the collection. The clumping—or not—into single connected components, as well as smaller diameter or shorter average path lengths, may indicate thematic unity in the vendor’s presentation. The number and composition of submodules indicates internal variety within that composition. The disconnected component in Vendor C’s materials accounts for 6% of the tags: Sky, outdoor, mountain, cloud, nature, desert, landscape, area, and stone, and clearly indicates that the vendor uses their account to also post their personal interests or holiday pictures, which are sufficiently distinct that they do not interconnect with the vendor’s business; this contrasts well with all of the other vendors whose tags all cycle back to their business interests. Remember, this is apparent to a human eye, but the machine makes this distinction as well, which is an important consideration as we scale up to the tens of thousands of photographs and posts that we have collected. This might also be useful for comparing vendors’ behaviors across platforms, for we know that these vendors are active on Facebook and other social media platforms, and we might hypothesize that they compose sales images differently for different audiences or platforms.
It is worth pointing out that some of the
least eigencentric words (that is, words that do the least work in holding the network together) might be worth looking at too, since these might be the words that Azure adds to provide context to its most likely labels, e.g., in module 2 for Vendor C, some of the least important words are
collection, display case, lots, drawer, chest of drawers, cabinetry, and
filing cabinet, which tells us something about the way this Vendor displays their materials. Considering the least central words reminds us of discussions in the Digital Humanities regarding text analysis techniques, such as topic modelling or term frequency—inverse distribution frequency about whether or not to include stop-words. Stop-words are the very frequent words such as ‘the, of, and’ which seemingly do not carry much weight for determining larger patterns, yet are very telling when we do work such as author attribution or stylometry (see, for instance, [
47,
48]). Is what we are doing closer in concept to topic modeling, or closer in concept to stylometry? We do not have an answer for this yet.
The frequent tag ‘text’ is interesting. Vendor A’s module 3 and Vendor C’s module 6, for instance, point to the ways in which vendors embed text within the images to indicate items for sale, a practice that hides posts from the more usual practice of analyzing the text of captions for materials for sale. The permanent embedding of text into and onto the image itself seems to convince the machine that the text is an artistic embellishment, design motif, or perhaps some sort of signature.
We will conclude by asking, “what is a ‘museum’ to the machine?” And, what is the sensory affect thusly created? The result we get also tells us something of how individual sites (user pages, search pages) on Instagram portray themselves:
Vendor A: Statue, sculpture, museum, bronze sculpture, metalware, dark, ceramic, ancient, chain, monochrome.
Vendor B: Statue, sculpture, art, drawing, museum, bronze sculpture, sketch, painting, mask, cartoon.
Vendor C: Art, statue, museum, bone, sculpture, skeleton, anthropology, artifact, fossil, mask.
Vendor D: Text, person, drawing, sketch, painting, human face, aquarium, cartoon, book, hand.
Vendor E: Indoor, wall, skull, animal, dinosaur, bone, skeleton, mammal, primate, reptile.
Instagram Search: Skull, bone, skeleton, fossil, anthropology, primate, extinction, museum, close, jaw.
British Museum: Indoor, person, museum, statue, sculpture, clothing, different, woman, dark, wall.
The only actual museum in this experiment has a far more equal distribution in terms of the size of its subcommunities, representing much more varied content, but at the same time, these subcommunities are all still interconnected, suggesting an overarching ideal guiding what gets posted (e.g., the underwater pictures depict underwater archaeology). This more equal distribution is most likely an artefact of the museum’s social media pages being perhaps curated by several employees, perhaps each from different departments of the museum, and each given individual reign to select representative photographs. This approach to digital outreach is common throughout the museum world. When vendor tags do not mesh into one connected whole, this seems to indicate the mixing of professional (bone trade) and personal interests in a single account. Thus, Vendor A represents a more disciplined or ‘professional vision’ than some of the other vendors.
In terms of the sensory affect, Vendor C leaves us with a tactile impression of an artist at their craft, working with materials and showing off the process that culminates in an artwork for sale. This work takes place in busy workshops, but also sometimes in the open air. However, this affect is subsumed underneath the construction of something that the machine recognizes as a ‘museum’. Nevertheless, Vendor C’s images are disconnected, and are interspersed with images that create an image of the person, their holidays, and their other interests. Vendor A’s pictures are interconnected into one whole, but that whole portrays a ‘site’ that is in some ways darker and more gothic, more dangerous, and yet still signals a ‘museum’; that it is dangerous, exotic, and somehow a forbidden thrill to own, hold, and display these materials (contrasting human remains with pictures of weaponry, in dark velvets and dramatic lighting).
An actual museum, the British Museum, leaves a sensory affect that is more equitably distributed than in the ‘museum’ created by the vendors. That is to say, none of the clusters dominate, and we get a sense of a rich storehouse of treasure and artworks of all kinds. A search for a particular Instagram hashtag, one devoted explicitly to selling human remains, also brings up the idea of a ‘museum’, but it is very much a ‘museum’ affect of the ‘dry, dusty bones’ -like trope. We might see this as circumstantial evidence that many bone sellers going for a ’museum’ look seem to collectively choose the style of an old-school Victorian era museum, more akin to the Wunderkammer, but not seemingly au-courant with the aesthetic of more recent museological trends for the display of human remains. In the text alongside many of the posts, many vendors voice a love for the beauty of the remains, and sometimes suggest that they are ‘saving’ the dead for study and appreciation. Perhaps by choosing the aesthetic of the ‘dusty museum’ trope, they project the message that they can help new buyers begin their own ’timeless’ collection?
5. Conclusions
This paper presents an experiment in trying to create an affective digital archaeology through machine vision. By focusing on the system of interrelationships in the machine-determined tags, we present not so much a rigorous scientific method, but a digital humanities heuristic, a co-creation of meaning between the human investigator and the machine viewer.
By getting the machine to contextually tag thousands of images with what it sees, we get a sense of the ’sensory’ experience that these vendors are trying to create for their online store. This online sense is partly a function of how their actual physical store is arranged. However, the online traces are to the physical world of lived experience as the archaeological traces in the ground are to the physical world of lived experience of the past. In neither case is it actually feasible for us to go there. What counts is the look, feel, and experience created by the online space.
Roopika Risam [
49] (p. 136) asks us to consider what kind of human is envisioned in the ‘digital humanities’, especially when we use tools, like machine vision, that are the creations of corporations with huge corporate power. In this case, the way the machine looks (which presumably is a function of the Western, male gaze, given that Microsoft is an American company emerging out of California and now based in Redmond, WA), we would argue, is also aligned with the gaze that created a market for human remains in the first place [
50]. By considering what the machine sees, and assuming that creators on Instagram are intentional in their use of that platform, we can understand user pages and search result pages as a kind of digital archaeological site. Thus, we end up with a method allowing a kind of digital field-walking, a remote-sensing of the digital construction of identity. The results presented here indicate that it is possible to draw insights that speak to the question of why and how people collect and display human remains online. Researchers concerned with other illegal or illicit trades online over social media might find our method useful for understanding something of the consumption side of the transaction, especially for those kinds of items where there is an aesthetic dimension to the material. The next step is to field walk the larger ‘geography’ of human remains sellers online—not just Instagram, but web stores, Facebook pages, and wherever else the dead may be found for sale.


