
How Online Sales Promotions via Social Networks Affect the Brand Equity of a Heritage Destination

Department of Marketing and Market Research, Faculty of Economics and Business Administration, Campus de Cartuja, University of Granada, s/n, 18071 Granada, Spain
*
Author to whom correspondence should be addressed.
Heritage 2022, 5(3), 2547-2564; https://0-doi-org.brum.beds.ac.uk/10.3390/heritage5030133
Submission received: 19 July 2022
/
Revised: 29 August 2022
/
Accepted: 1 September 2022
/
Published: 6 September 2022
(This article belongs to the Collection Feature Papers)
Abstract
:Social media marketing communication is among the current strategies used to provide visibility to cultural heritage, sales promotions being especially relevant. Nevertheless, despite the fact that social media has now built significant momentum, there is still a dearth of research on the relationship between social marketing activities and brand equity. In this context, this study seeks to determine how the use of promotional discounts and free gifts on social media contributes to building heritage brand equity. To pursue this research aim, a quasi-experimental study was designed and carried out among online users, based on two promotional stimuli (discount vs. free gift). The findings suggest that gifts perform better in terms of increasing brand equity, except where the user presents a high level of sales promotion-proneness, in which case promotional discounts are more effective.
1. Introduction
Cultural heritage is now considered one of the key factors in the strategic development of territories, as a recognized driver of economic growth, wealth creation, and employment [1,2,3]. Moreover, there are several studies (e.g., [4,5,6,7]) that have addressed the ability of heritage sites to generate wealth via the brand equity of a heritage brand.
Building strong brands, with high brand equity, is one clear way to establish competitive advantage. Researchers and marketing specialists therefore consider brand equity a key strategic asset for organizations [8]. However, the first research on brand equity in relation to tourist destinations was carried out by [9] in 2007 [10]. Since then, tourist destinations have been operating in an increasingly competitive environment; hence, they are obliged to generate competitive advantages. Therefore, research on destination brand equity should be expanded [10].The widespread interest in brand equity since the 1990s, both from academia and the business sector, has given rise to extensive academic literature on the topic and, therefore, to a wide variety of approaches and methodologies for measuring it and identifying its antecedents and consequences [11,12,13,14,15,16].
Brand equity is a key construct in brand management [8,11]. Brand equity has been recognized as the means to differentiate a company’s products and services from its competitors [11]. Brand equity is defined as “a set of assets and liabilities linked to a brand, its name and its symbol that add to, or subtract from, the value provided by a firm’s product or service to its clients” [11]. This multidimensional model differentiates between several assets—notably, brand knowledge (awareness), perceived brand quality, brand associations, brand loyalty, and other assets specific to the brand. In general, studies regarding a destination brand consider the consumer-based brand equity model (CBBE) based on the work developed by [11].
When classifying heritage marketing, some doubts about its classification may be encountered from the perspective of the intention to make a profit. In this respect, it instead is classified as a form of non-profit marketing and it is argued that the primary motivation for its implementation should be the preservation or renewal of cultural and natural heritage. The production of profit in a commercial sense (expressed as a monetary benefit) is considered as a means to help achieve this goal. Therefore, many non-profit organizations working in the field of cultural and natural heritage conservation are forced to “generate profit” through additional commercial activities such as providing retail activities (most often the sale of souvenirs), restaurants, catering stalls, the organization of various commercial events, or other paid services clearly belonging to the field of profit marketing. The dichotomy of profit and non-profit objectives of heritage marketing represents its key problem area when setting the marketing mix. It turns out that the sustainability of the development of a tourist destination in such a case depends on the ability to optimize the intensity of development in such a way that the balance of the whole tourist destination system is not disturbed. Maximizing benefits (usually at the cost of excessive visitation) in this case can lead to the devaluation of or irreversible damage to, or even to the complete destruction of, the main tourist attraction—a cultural monument, natural area, or specific object [17].
Previous studies have suggested that the elements of the marketing mix are key variables in the creation of brand equity (for example, [8,18]). More specifically, among these variables advertising and sales promotion emerge as specially interesting. In fact, the investments they gather in comparison with other forms of marketing activities are significantly higher. For example, in Spain in 2018, the estimated true investment in the advertising market stood at EUR 12.83 billion, or 1.06% of GDP [19].
Despite the importance of the respective effect of both advertising and promotions on brand equity, academics stress that more research efforts into the role of such factors is needed [20]. These authors also found distinctive effects of monetary vs. non-monetary promotions on brand equity.
On the other hand, according to [21,22,23], social networks have become a key element in the promotion of heritage tourism destinations. These authors focus their studies on the effect that the use of social networks exerts on the generation of the knowledge and awareness of heritage destinations with the aim of attracting tourists. Refs. [24,25] called for further research on the impact that social networks have on the development and competitiveness of the tourist destination and its brand equity.
However, the literature review has revealed that the research on the impact of sales promotions through social networks in terms of the brand equity of a tourism destination in general is scarce [26], and with respect to a destination associated with a heritage site it is even scarcer; thus, more research efforts are required to better understand its effect on the formation of brand equity. In addition, few studies have analyzed this effect on each of the dimensions of brand equity. Ref. [27] showed that social media-based communication activities exert a significant influence on brand image, Ref. [28] found that they are related to brand loyalty, and Ref. [29] found that they rely on awareness. However, these studies do not analyze their effect on a brand of a heritage destination nor differentiate between the type of promotions. A recent study by [30] found a relevant effect of sales promotions on perceived quality in relation to a brand associated with a heritage destination.
Nevertheless, despite the rise of social media in recent years and its increasing relevance, research dealing with the relationship between marketing activities performed via social media and brand equity is still scarce [26,27,28]. With these premises in mind, this paper pursues two main research aims. First, it aims to examine a key driver of brand equity, namely, online sales promotion, focusing on promotions delivered via social networks. Second, the study investigates the effects of two types of online sales promotions—monetary and non-monetary—on brand equity, dealing with the specific case of a brand associated with a tourist destination featuring a heritage site.
Therefore, this paper attempts to fill important gaps in the academic literature in relation to sales promotions through social networks and their effect on the construction of the brand equity of a brand associated with a heritage destination, analyzing its effect on each of the dimensions of brand equity. On the one hand, we analyze the effect of the types of sales promotions (monetary and non-monetary) through social networks on each of the dimensions that make up the brand equity. On the other hand, we analyze the moderating effect of the consumer’s propensity to promote on the effect of the types of promotions on each of the dimensions of the brand equity.
To sum up, we advance in the theoretical knowledge of the effect of sales promotions through social networks on the dimensions of heritage brand equity and provide managers of heritage tourism destinations with tools to increase the brand equity of the destination, increasing its competitiveness.
2. Literature Review
2.1. Cultural Tourism and Heritage Tourism
Ref. [31] (p.4) conceptualized heritage tourism as referring to “travelers seeing or experiencing built heritage, living culture or contemporary arts.”
According to [32], cultural tourism would include heritage tourism, artistic and creative tourism, and other forms of culture consumption. In this regard, Ref. [33] defined cultural tourism as a tourism form that is based on the values of the cultural heritage of a destination and transforms them into products that tourists can consume. It is one of the oldest forms of tourist interest, and yet it remains one of the most misunderstood types.
Likewise, Refs. [31,34] consider cultural tourism to be essentially a synonym of heritage tourism, which is often described as involving the travelers who visit, experience, or participate in a living culture, art, performance, music, or other component of contemporary culture, motivated by an interest in the historical, artistic, scientific, or heritage offerings of a community, region, or institution.
Cultural tourism has not stopped growing, in such a way that in 2017 the cultural tourism market made up more than 39% of international arrivals worldwide [32]. European statistics also show that cultural heritage attractions gather a great deal of interest. According to a report published by [35], cultural tourism represents 40% of overall European tourism activities.
The marketing of heritage has also progressed at a good pace, growing thanks to word of mouth, the publication of popular guidebooks, and marketing initiatives designed to “sell” tourist destinations. In this regard, the selection of an activity related to cultural heritage is regarded in a similar way to the intention or decision to purchase a specific brand for a tangible product. Thus, this phenomenon affects the decision-making process of individuals when it comes, for example, to choosing a monument to visit and discarding another. The examination of the behavior in space focuses on the reasons for that apparent action to understand the processes of decision-making, choice, spatial cognition and mapping, acquisition of spatial skills, risk aversion, uncertainty, habits, searching and learning, emotional states, relationships, representations of knowledge, values, and beliefs [36]. Therefore, as suggested by [37], not only countries but also regional areas and cities are competing aggressively to persuade tourists to visit their heritage attractions.
2.2. Brand Equity and Cultural Tourism
The brand equity concept originated in the 1980s as a key construct in brand management [8,11]. According to [11,38], brand equity has been recognized as the means to differentiate a company’s products and services from its competitors. Brand equity is defined as “a set of assets and liabilities linked to a brand, its name and its symbol that add to, or subtract from, the value provided by a firm’s product or service to its clients” [11]. This multidimensional model differentiates between several assets, notably, brand knowledge (awareness), perceived brand quality, brand associations, brand loyalty, and other assets specific to the brand.
In general, studies regarding destination brands consider that the consumer-based brand equity model (CBBE) based on the work developed by [11,38] is the appropriate tool to measure and evaluate the performance of the destination and customer perceptions about the brand associated with the destination [9,15].
With these premises, Ref. [39] developed a five-dimensional brand equity model for a cultural destination on the basis of the BE dimensions defined by [11,38]. According to [39], the assets associated with the cultural destination brand are the cultural assets associated with the destination, such cultural assets having a positive impact on the destination BE, which in turn leads to competitive advantages.
In addition, Ref. [40] developed a brand equity model applied to museums. In their study they establish the relationships between the BE dimensions, including the value perceived as a mediator of these relationships. Ref. [13] introduced the concept of cultural brand equity (CBE) and proposed five determining factors that affect the formation of BE in artistic and cultural exhibitions, confirming a positive link between brand equity and visitors’ satisfaction and their willingness to pay.
The present study uses a measure of CBBE comprising five dimensions: brand awareness, perceived quality, brand image, brand loyalty, and perceived brand value.
2.3. Social Media and Heritage Brand Equity
The ability to engage directly with the consumer via social networks provides the organization with an opportunity to heighten brand awareness, recognition, and recall [32]. The “consumers” of the cultural heritage are perceived as active recipients of important messages [41].
The findings of the empirical studies by [26,28] also showed that the implementation of marketing activities via social media is positively related to a greater brand equity and, in particular, to a more favorable brand image. Similarly, other authors demonstrate that the use of social media positively influences brand trust [42] and brand loyalty [28,42,43,44] through the creation of brand communities, and therefore positively enhances brand equity [26,29].
Ref. [45] suggest that, thanks to the more dynamic, ubiquitous, and immediate interaction they offer, social media can significantly influence the performance and success of a brand. Social media-based marketing actions in general, and communications activities in particular, are likely to affect the generation and maintenance of brand equity [46]. This influence derives from their ability to affect each of the dimensions of the brand equity concept itself (awareness, image, loyalty, perceived quality, and value) [38,46].
In the tourism sector, the results obtained by [47] showed that sharing information about the destination through social networks had a positive effect on destination brand awareness and on the quality of service at the destination. Moreover, their findings indicate that destination brand awareness positively influences tourists’ perceptions of both the quality of service associated with the destination and the destination itself.
Some studies on the effect of social media on destination choice decisions suggest that there is a positive link between perceived quality, electronic word of mouth (e-WOM), brand image, and brand performance [48].
More specifically, Ref. [49] examined the impact of social networks on museums’ brand equity and found that there is a link between social networks and the dimensions of brand equity: brand loyalty, perceived quality, brand identity, brand awareness, and value.
Ref. [47] note in their study that tourist destination managers should use tools that increase awareness of the destination brand at an optimal level, via both traditional media and social networks. However, these authors point out that social networks should be taken into consideration beyond traditional channels, as they allow faster communication with the target market and are financially much more advantageous by comparison.
2.4. The Influence of Discounts and Free Gifts Offered via Social Networks on Heritage Brand Equity
Promotion through social media and other digital marketing tools provides a wide range of customer and work in multi-dimensional approach using digital self-promotional tools, products reviews, price-based promotion campaign, loyalty programs, drop-shopping incentives, and reseller promotion [50]. In this regard, several authors have demonstrated that sales promotions on social networks are able to affect destination brand equity [51] and engagement [52].
Sales promotions can generate both hedonic and utilitarian benefits, but the latter are found especially when a monetary incentive is used, whereas the former are more evident when a non-monetary incentive is in place [53]. The academic literature suggests that the hedonic benefits are similar to the emotions experienced by individuals, such as pleasure and self-esteem. As a consequence, it is to be expected that those promotions triggering these types of benefits will be related to feelings and emotions, with the non-monetary ones fostering more and favorable brand associations, thus enhancing brand equity [20,54,55].
Brand image refers to the associations that consumers link to a brand [38]. Ref. [27] observed that social media-based communication activities exert a significant influence on brand image. Regarding monetary promotions implemented online, they have a negative impact on brand image [54,56].
Refs. [57,58] defined perceived quality as the consumer’s judgment of the excellence or overall superiority of a product/service relative to the available alternatives. Refs. [11,59] positioned perceived quality as an intangible, general feeling about a brand, and an important element in brand equity generation. Consequently, perceived quality is a subjective evaluation of a particular product or service, with such perceptions potentially differing from one individual to another [60].
Moreover, online monetary promotional campaigns can result in negative perceptions of the brand, mostly due to the fact that they are in place for a relatively short period and lead consumers to think of the price instead of the brand. This phenomenon could negatively affect both perceived quality and brand associations [20].
Turning to loyalty, according to [11], this is a measure of the relationship between the customer and the brand, and it often constitutes the very heart of brand equity. Indeed, such is the importance of loyalty that other measures, such as perceived quality, image, and associations, are based on their ability to influence it [11].
In short, loyalty represents a favorable attitude toward a brand. This loyal attitude is the result of the repeated purchase of the brand over time, during which the consumer learns that the brand can help them make the right decisions regarding the fulfillment of their needs—that is, that the brand enables them to meet their needs [61,62].
Refs. [28,42,44,63] conducted a study in the field of tourism, which confirmed the effect of social media marketing on customer loyalty. On the topic of online promotions, Refs. [64,65] found that these significantly affect loyalty to the destination, and that they provide detailed and relevant information that helps travelers choose certain tourist destinations. These authors hold that a reliable online promotion can encourage potential travelers to make repeat purchases. Regarding cultural heritage, Ref. [66] shows the positive effect of social networks on heritage destination promotion.
The Moderating Effect of Sales Promotion Proneness
There are several studies that show that promotion proneness is one of the primary moderators of consumer response to sales promotions [67,68,69]. Consumers who are prone to promotion modify their purchasing behavior to benefit from the temporary incentive offered by the sales promotion. This implies that the consumer’s propensity to take advantage of discounts is a result of their intention—at a cognitive level—to redeem that discount [70].
Various authors suggest that sensitivity to different promotion types may explain the different responses consumers present when exposed to a promotional activity [71,72]. Those consumers who are more promotion prone will display more interest and greater motivation to process them. Refs. [72,73,74] concluded that promotion-prone consumers are the most “expert” buyers of all, as they appear to evaluate the benefits of the promotion and integrate them into the information they process for the purpose of decision-making. Other authors, however, claim that it is precisely promotion-prone individuals who process such information via the peripheral route, as they are willing to judge an offer as appealing solely on the basis of promotional signals [75]. According to [76], promotion proneness is negatively correlated with the need for cognition, such that more prone individuals will present less information processing, and the mere fact of the existence of the promotion will be sufficient reason to acquire the product in question. Thus, promotion proneness moderates the effect of social-network sales-promotion type on the variables of brand equity (brand awareness, brand image, perceived brand quality, brand loyalty, and brand value), affecting the way in which consumers process the promotional stimulus and the capacity of the promotion to motivate the user to process it.
In light of this literature review, the following working hypotheses are proposed:
H1.
Non-monetary sales promotion on social networks will generate greater heritage brand awareness than monetary sales promotion.
H1a.
The effect of social-network sales-promotion type on heritage brand awareness is moderated by promotion proneness.
H2.
Non-monetary sales promotion on social networks will generate greater perceived heritage brand quality than monetary sales promotion.
H2a.
The effect of social-network sales-promotion type on perceived heritage brand quality is moderated by promotion proneness.
H3.
Non-monetary sales promotion on social networks will generate a better heritage brand image than monetary sales promotion.
H3a.
The effect of social-network sales-promotion type on heritage brand image is moderated by promotion proneness.
H4.
Non-monetary sales promotion on social networks will generate greater heritage brand loyalty than monetary sales promotion.
H4a.
The effect of social-network sales-promotion type on heritage brand loyalty is moderated by promotion proneness.
H5.
Non-monetary sales promotion on social networks will generate greater perceived heritage brand value than monetary sales promotion.
H5a.
The effect of social-network sales-promotion type on perceived heritage brand value is moderated by promotion proneness.
3. Empirical Study
3.1. Independent Variables
To test the proposed hypotheses, an experimental design was conducted among Internet users based on two different promotional stimuli (discount vs. free gift).
Ref. [77] defines social media as “a group of Internet-based applications that build on the ideological and technological foundations of Web 2.0, and that allow the creation and exchange of user-generated content.” Ref. [78] classifies social media according to the nature of the connections and interactions they provide—that is, “user-oriented” vs. “content-oriented” social media. The former (such as Facebook or Twitter) focuses on individual members, and the main objective is to encourage users to connect with specific information about a particular individual (profile). In contrast, the latter (Flickr or YouTube, for instance) focuses on the content, conversations, and comments generated by a publication, and the main objective is to connect with the content provided by a certain social media platform. The present study centers on Facebook, as this social network focuses on the profile of the user. It is also the most widely used and well-known social network internationally.
Within this platform, we used the profile of the Spanish heritage site known as the “Carmen de la Fundación Rodríguez-Acosta,” to which we attached the promotional incentives. The experimental design recorded the user’s behavior through observation, and was completed with an online survey. The final sample comprised 869 volunteer subjects.
3.2. Creation of Experimental Stimuli
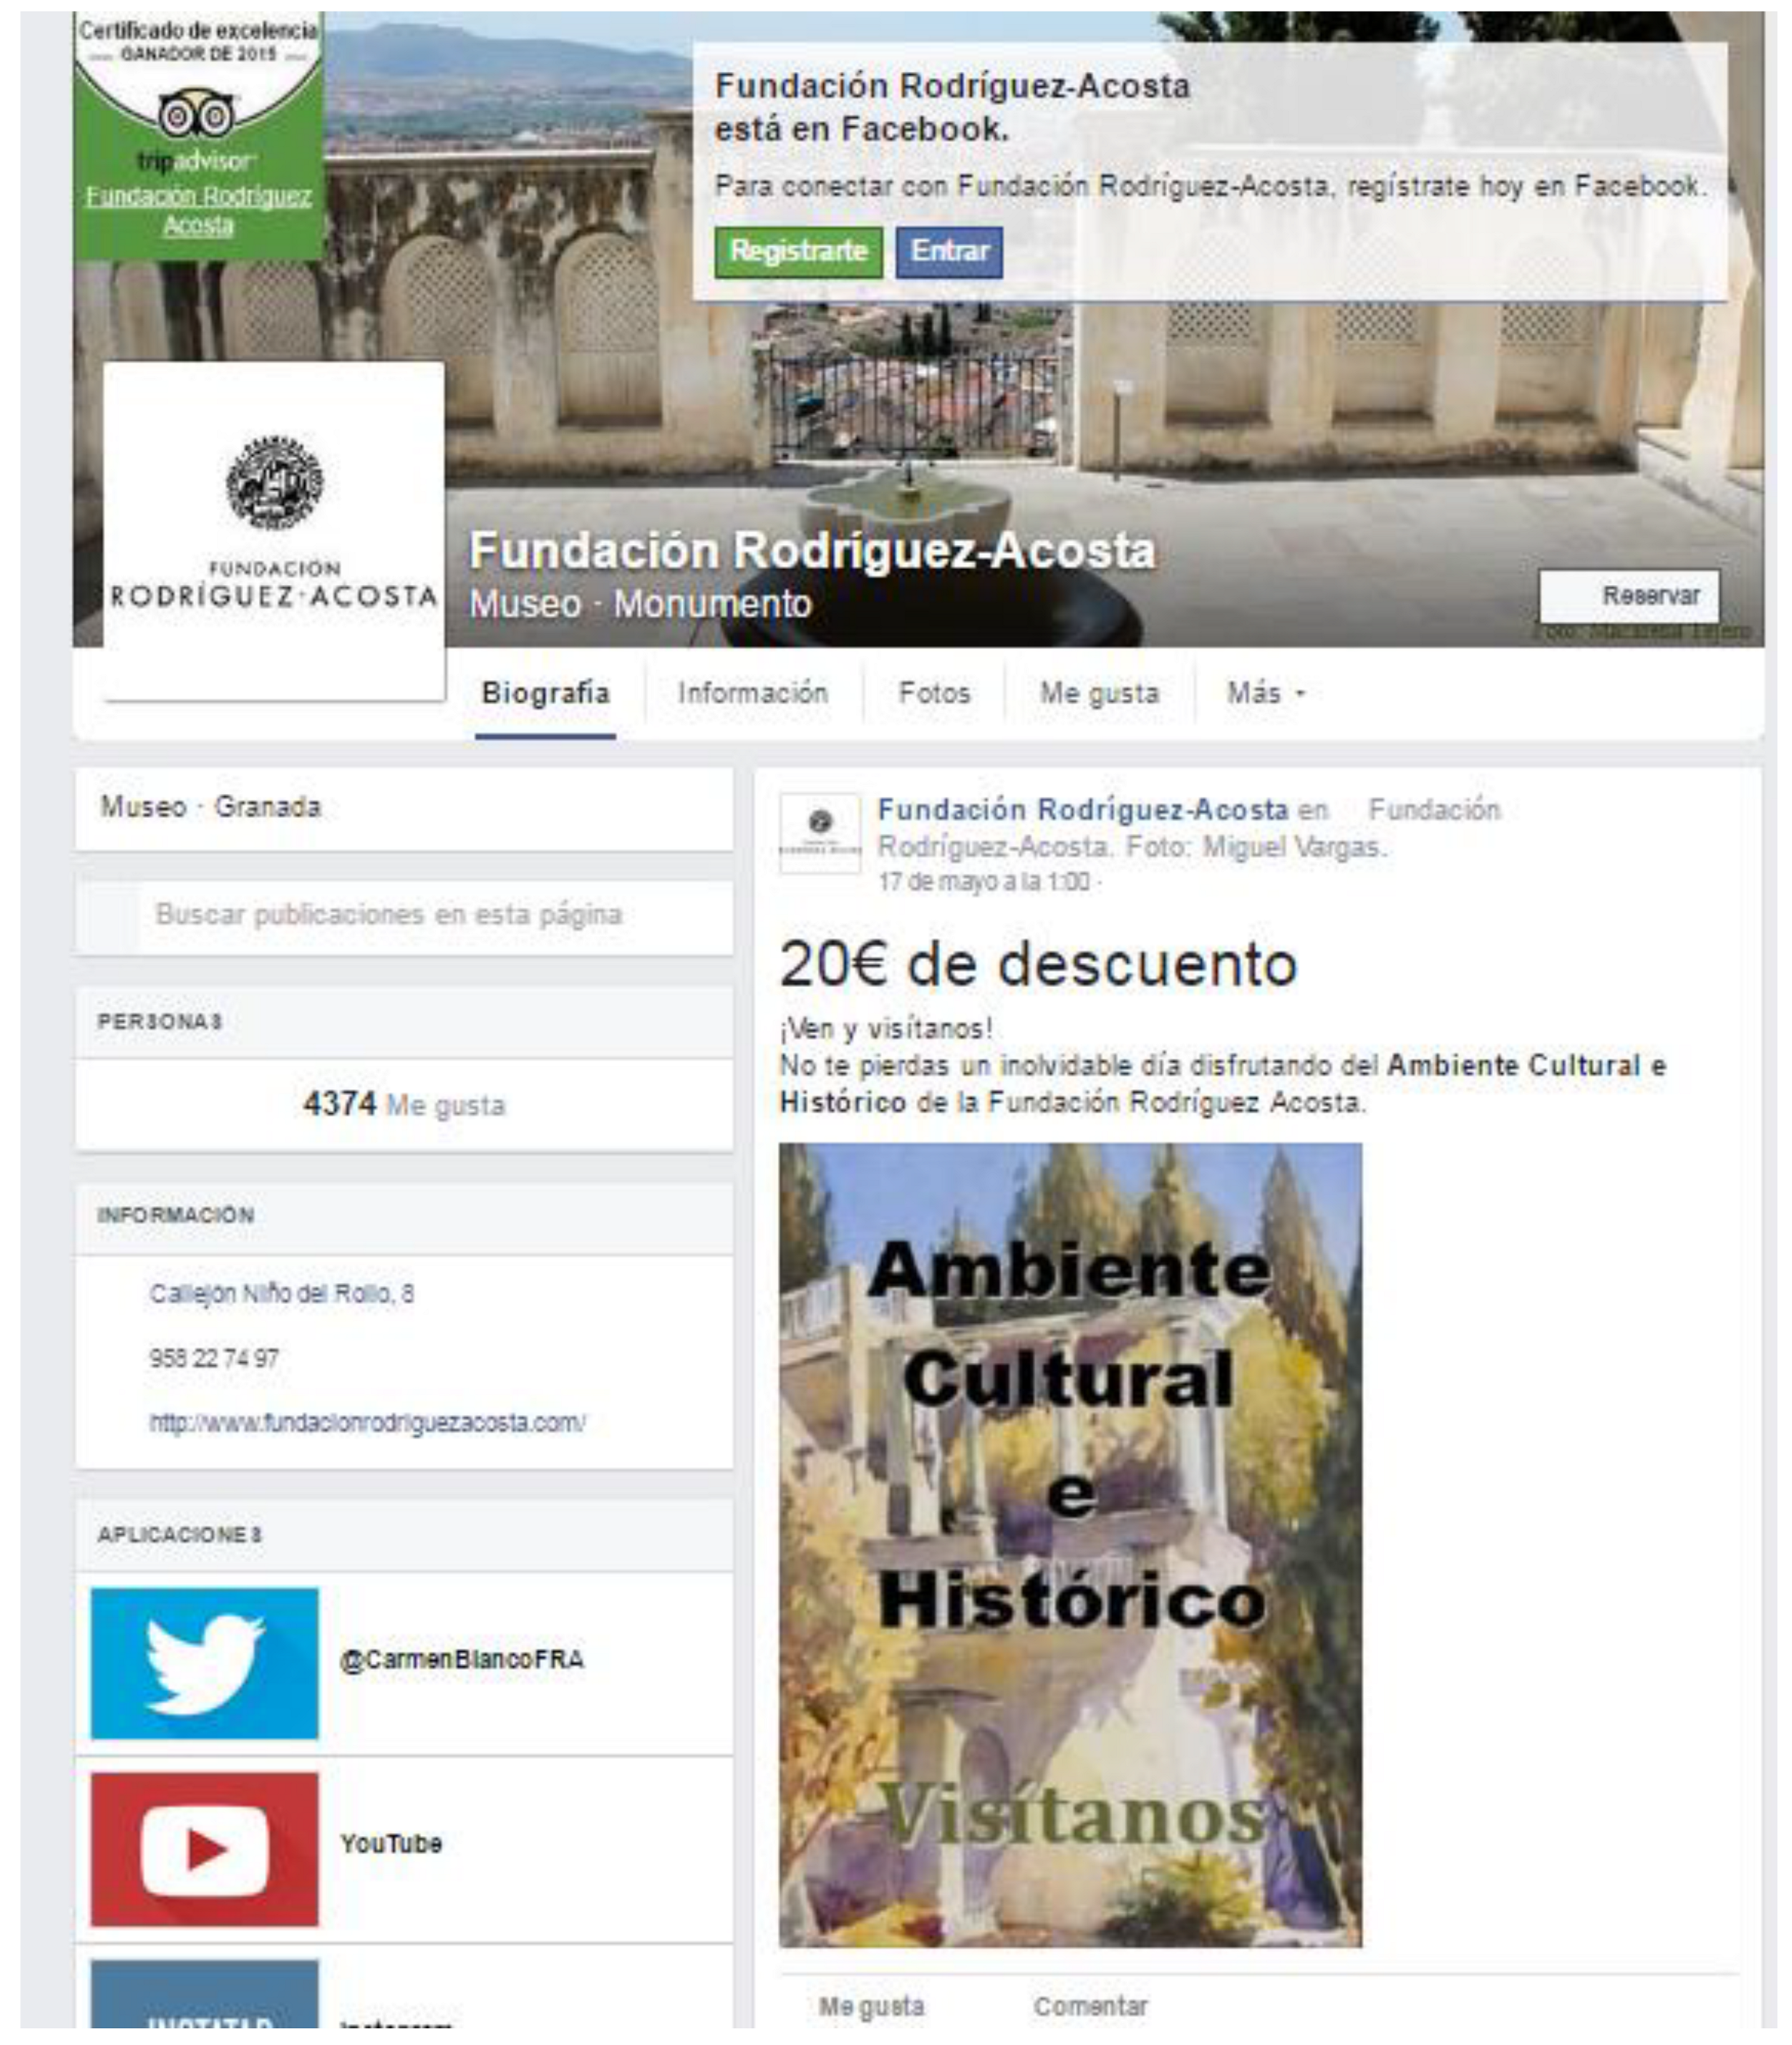
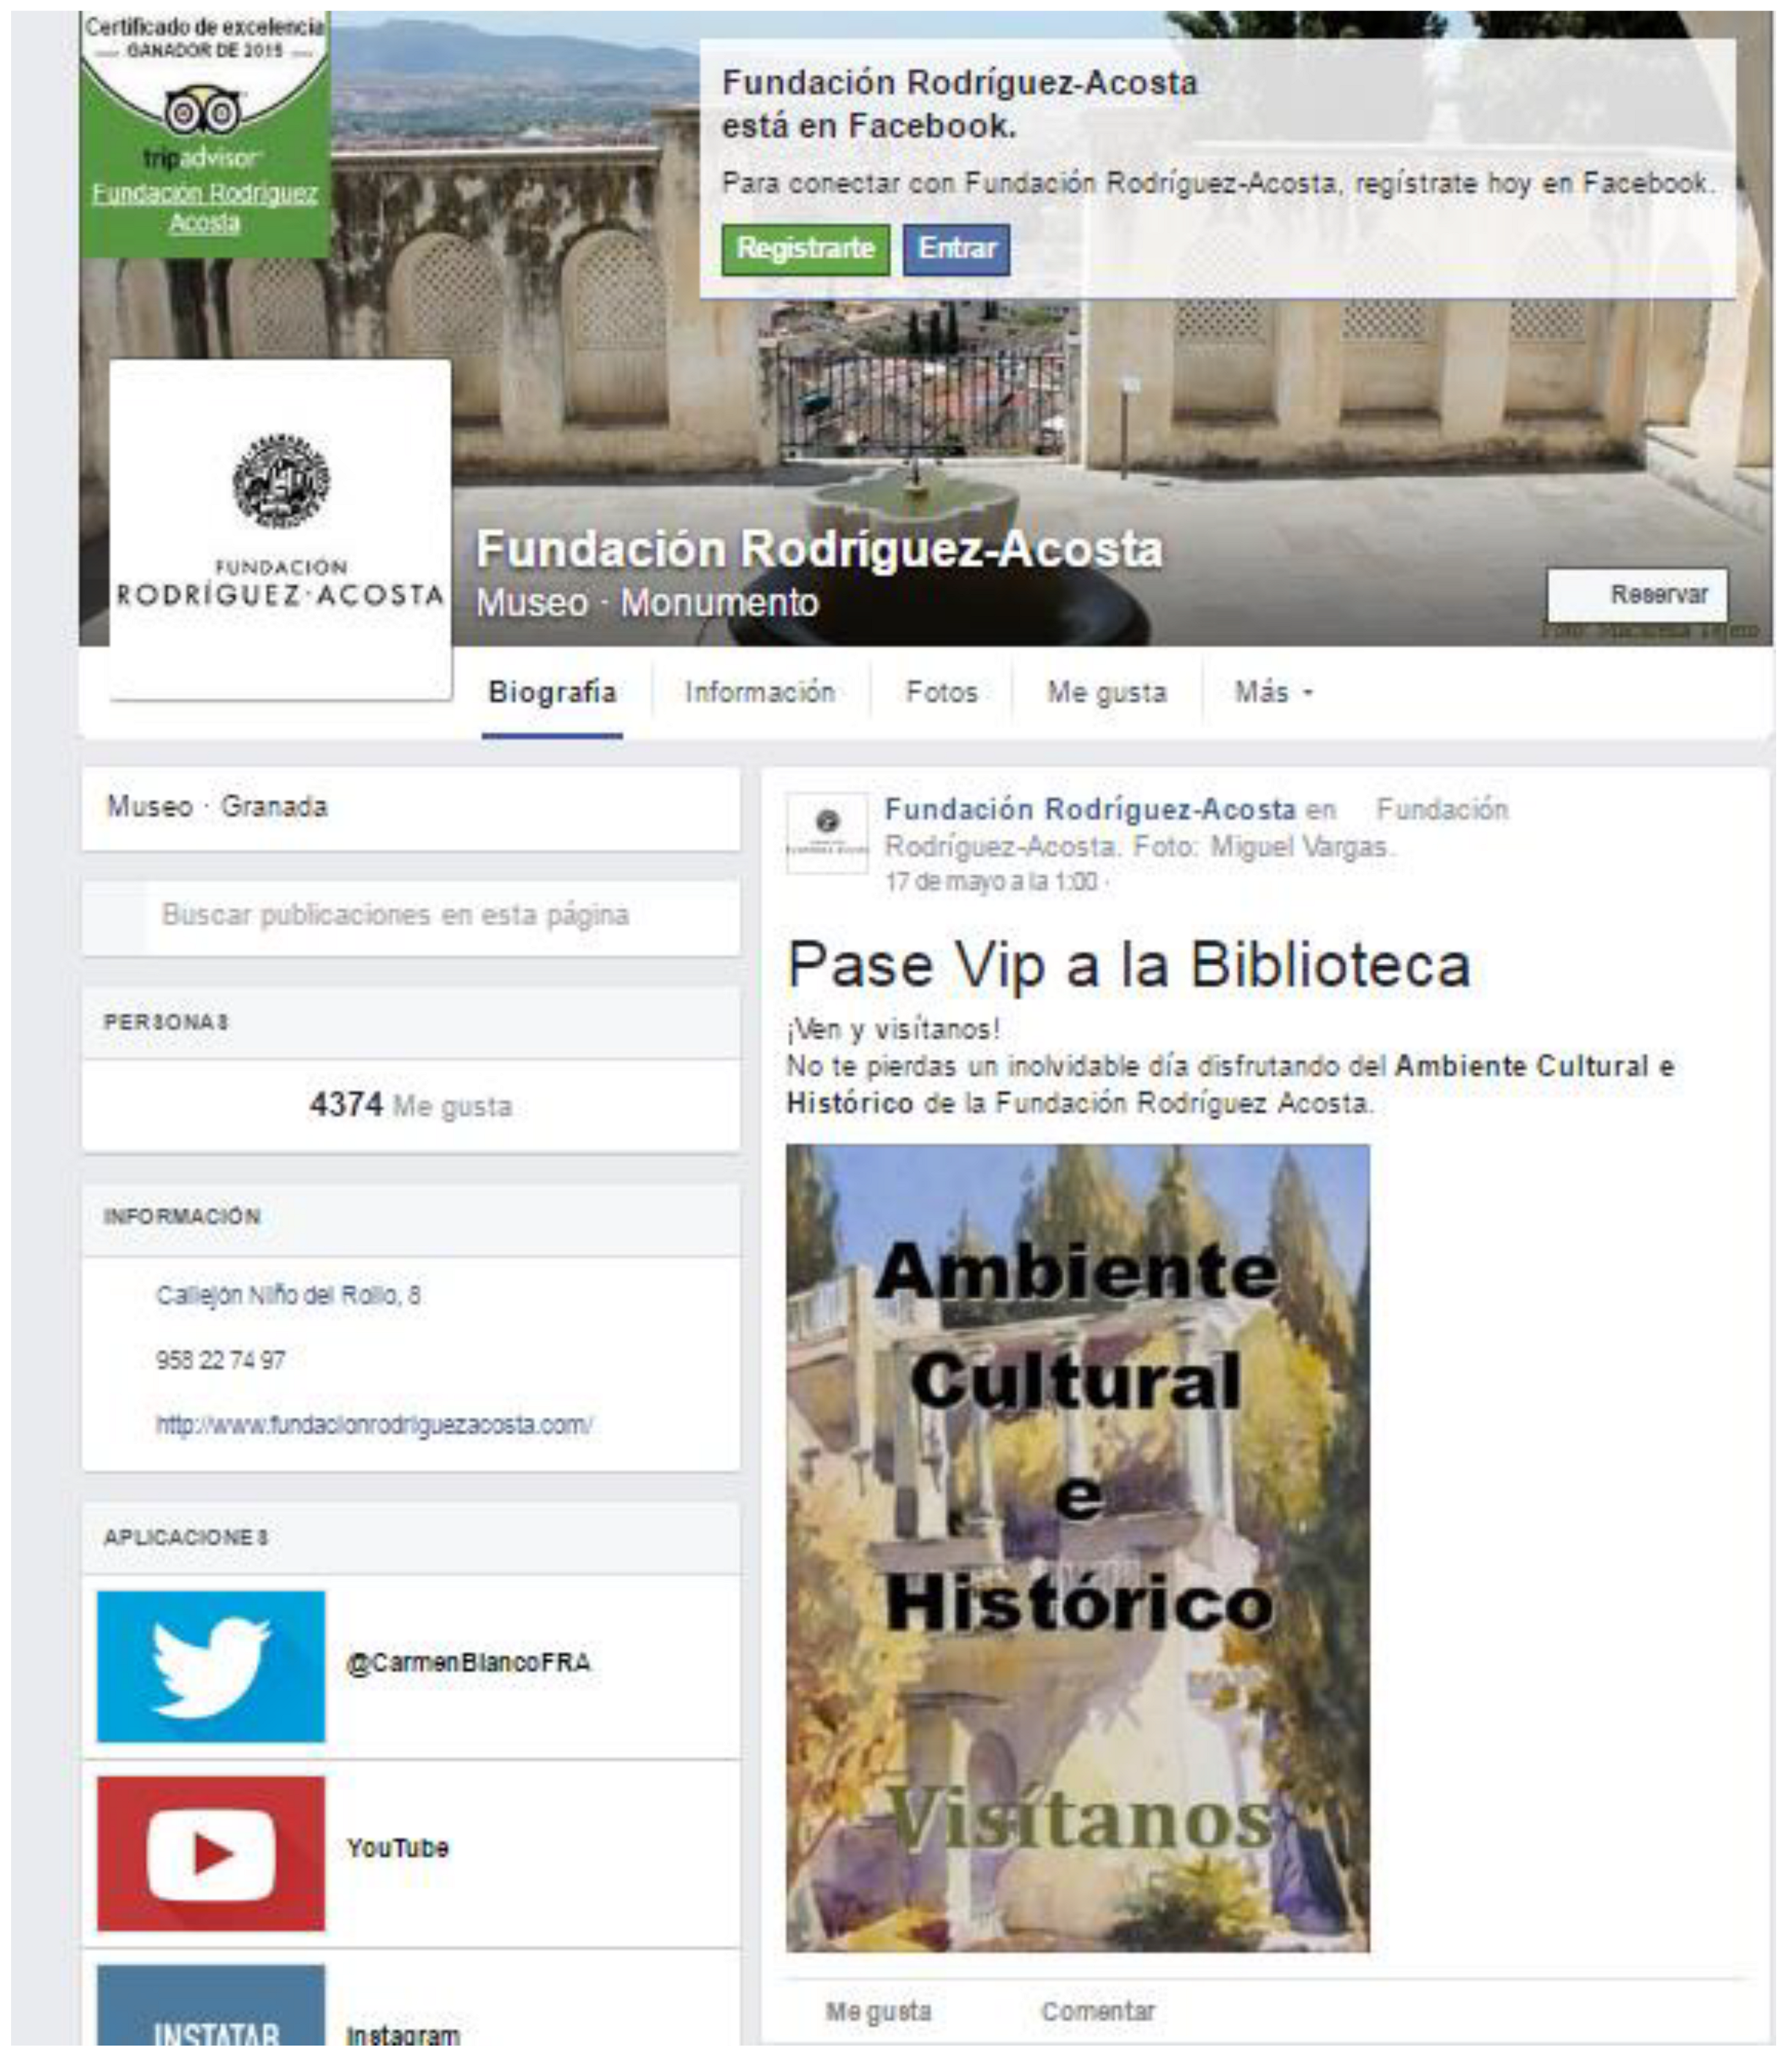
Two types of promotional stimuli were created to examine the extent to which heritage organizations’ use of discounts and free gifts on social networks affects brand equity (see Appendix Figure A1 and Figure A2). To select the promotional incentives, the recommendations of different authors were followed, establishing the monetary value of the incentive at between 20% and 50% of the product price (the product being an entry ticket to the Fundación Rodríguez-Acosta heritage site) [79]. Once the monetary value had been set, incentives that were consistent with the benefits sought by the user and with the product [80] were selected, following the principle of compatibility [68,80]. On this basis, a 2-for-1 offer on entry tickets to the Fundación Rodríguez Acosta complex was initially chosen for the Utilitarian incentive of the experiment, and a free VIP pass to its on-site library was selected for the Hedonic incentive.
To verify that both incentives were perceived by users to be of equal monetary value, a pre-test was performed on 147 university students. After showing one of the promotional incentives to the participants, they were asked what monetary value they believed the offer to have. Data analysis of the pre-test results showed that the two incentives were not perceived to be of equal value, as the average perceived value of the Hedonic incentive was EUR 20, whereas the 2-for-1 Utilitarian offer was attributed an average value of EUR 14. A hypothesis test was performed to check whether these values were different, and it was confirmed that they were significantly different from one other (p < 0.05). For this reason, the Utilitarian incentive was redesigned by adjusting its monetary value to a discount of EUR 20 off the price of an entry ticket.
Following the redesign, a second pre-test was performed on a sample of 250 university students, following the same procedure as before. This time, the equivalence between the monetary value associated with the Hedonic and Utilitarian incentives was verified. The results obtained in this pre-test showed that the gift was perceived as having the same monetary value as the discount, on the basis of a t-test performed on a sample with a reference value of EUR 20 (p > 0.05). The associations between the Hedonic incentive and hedonic values, and between the Utilitarian incentive and utilitarian values, were also verified. To ascertain the hedonic or utilitarian character that participants assigned to each gift, the scale proposed by [53] was used. To calculate the score assigned to each benefit, the average of the scores obtained in the items referring to that benefit was used. Finally, to determine whether it was perceived as a mainly hedonic or utilitarian gift, we added the average scores obtained by the benefits associated with each group and calculated a mean difference test for independent samples. Analysis of the results indicated that there were significant differences between the Utilitarian and Hedonic indices associated with the monetary discount (p < 0.05) and also for the gift of the free VIP pass (p < 0.05). The discount was perceived as primarily associated with utilitarian values, whereas the gift was associated with clearly hedonic values.
Finally, the user’s perception of the nature of the underlying product (entrance to the heritage site) was checked. To test whether individuals perceived the product as utilitarian or hedonic, we opted for the measurement instrument developed by [81] and subsequently applied in a number of studies (e.g., [53,82]). Next, a mean difference hypothesis test for paired samples was performed to ensure that both values were significantly different from one another (p = 0.00). Whereas negative scores in this index stand for the perception of the product as mainly hedonic, positive scores indicate that it was mainly utilitarian. In this case the resulting score was −0.4754; thus, hedonic components turned out to have a greater weight for the selected product category.
3.3. Subject Selection and Fieldwork
Once the experimental stimuli had been established, the design was implemented using Qualtrics software for the data collection. The sample was obtained via a panel of Internet users provided by Sondea Internet SL. The procedure was as follows:
Users were recruited by the panel and directed to one of the two URLs corresponding to the different questionnaires and each of the experimental stimuli. Once they had accessed the URL, the user was presented with an initial paragraph giving them instructions for participating in the experiment. Next, to ensure that their level of prior knowledge about the Fundación Rodriguez-Acosta would not affect the results, they were required to answer a series of questions on this topic. Third, the user watched a two-minute promotional video about the heritage site to enable them to form an image of it, should they not have come across it previously. The mentioned video was composed of iconic images of the heritage site (Iconic Signals) [41].
Fourth, the individual was asked to view the Facebook profile of the Fundación Rodríguez Acosta, which contained the relevant promotional stimulus. The tool contained in the Qualtrics software to add a pop-up to the questionnaire was used for this purpose. The pop-up was visible for two minutes, during which time the participant could browse the profile freely, at their own pace. To create the pop-up, a computer expert created a fictional Facebook profile, copied in real time from the Foundation’s authentic profile. This was identical to the real one (and identical in the two cases), except for the fact that the dummy version included the experimental stimulus selected in each case. Participants were not aware at any time that they were browsing a fake profile, and it was a fully functioning site. After two minutes, the pop-up closed automatically and took the participants back to the survey. Here they were asked to respond to questions relating to their sociodemographic profile, the different dimensions of brand equity, and the manipulation check.
3.4. Measures
3.5. Sample
The sample comprised 869 valid responses with demographic characteristics in line with the user profiles of the social networks ([85]) in terms of both gender (464 women vs. 401men) and age (37.5% were between 19 and 29 years old; 37.5% between 30 and 44 years old, and 24.9% between 45 and 64 years old).
3.6. Validation of Scales and Manipulation Check
To verify that the incentives used were perceived as being of equal monetary value, the procedure developed by [86] and later used by [55] was adopted. The t-test corroborated the absence of significant differences in the perceived value of the different incentives, which confirmed that the gift-based incentive was perceived as being worth approximately EUR 20 (p > 0.05), thus corresponding to the value of the monetary incentive. It was also confirmed that the experimental groups were equally distributed in terms of composition and size (discount, 434; gift, 435). The results of a Kolmogorov–Smirnov test showed that there were no significant differences between the two groups (p > 0.05).
To verify the proposed hypotheses, first the validity and reliability of the multi-item scales needed to be verified. A confirmatory factor analysis (CFA) was performed, the results of which indicated that the scales had good psychometric properties. All parameters were significant, and the variance extracted, Cronbach’s alpha, and composite reliability were all within the recommended thresholds. The fit indices were also within the recommended ranges [87].
4. Testing the Hypotheses
To test the proposed hypotheses and analyze the influence of discounts and gifts on each of the dimensions of brand equity in an online context, a moderation model proposed by [88] was carried out for each hypothesis on 5000 samples obtained via bootstrapping. This method does not make any baseline assumptions regarding the form of the sample distribution. In addition, in all cases the variable “nationality” was controlled, as this has been found to potentially distort the results obtained via its relationship with culture.
Hypotheses H1 and H1a held that social network-based non-monetary sales promotion generates greater heritage brand awareness than monetary sales promotion, and that this effect could be moderated by the consumer’s sales promotion proneness. To test this, a moderation model was used. This model explains 33% of the variability of the “brand awareness” variable, thus providing relevant information for its estimation (see Table 1 and Table 2). The data analysis shows that sales-promotion type exerted a quasi-significant influence on awareness of the heritage site (β1: −0.66; p-value: 0.05), with non-monetary promotion generating the greatest brand awareness. The results also show that, when the individual’s level of promotion proneness is taken into account, the effect of promotion type on brand awareness is modified. In the case of high promotion-proneness values, it was monetary sales promotion that generated the most awareness, compared to non-monetary, whereas in the case of intermediate or low promotion-proneness values, there was no such moderating effect. These results provide evidence indicating that neither H1 nor H1a can be rejected. According to the data, non-monetary promotions, in general, generated greater brand awareness scores, except in the case of high promotion proneness, where monetary promotion had the greatest effect.
Hypotheses H2 and H2a proposed that non-monetary social network-based sales promotion generates greater perceived brand quality and that this effect is moderated, once again, by the consumer’s sales promotion proneness. The proposed model explains 30% of the variability in the “perceived brand quality” variable, providing relevant information for its estimation (see Table 3 and Table 4). The data analysis shows that sales-promotion type exerted a significant influence on perceived brand quality (β1: −1.16; p-value: 0.0 0), with non-monetary promotion generating the highest quality. Again, promotion proneness exerted a moderating effect: Among individuals with low levels of promotion proneness, non-monetary promotion generated higher perceived quality, whereas it was monetary promotion that achieved higher perceived quality in the case of individuals presenting high levels of promotion proneness. These results provide evidence indicating that neither H2 nor H2a can be rejected. According to the data, non-monetary promotions, in general, generated higher “perceived quality” scores, except in the case of high promotion proneness, where monetary promotion had the greatest effect.
Hypotheses H3 and H3a held that social network-based non-monetary sales promotion generates a better brand image than monetary promotion, and that this effect is moderated by the consumer’s sales promotion proneness. The proposed model explains 32% of the variability of the “brand image” variable, providing relevant information for its estimation (see Table 5 and Table 6). The data analysis shows that sales-promotion type exerted a significant influence on brand image (β1: −0.98; p-value: 0.01), with non-monetary promotion generating the best image. Again, promotion proneness exerted a moderating effect, being significant only among consumers with high levels of promotion proneness, in which case it was monetary promotion that generated the best brand image. These results provide evidence indicating that neither H3 nor H3a can be rejected. According to the data, non-monetary promotions, in general, generated better “brand image” scores, except in the case of high promotion proneness, where monetary promotion had the greatest effect.
Hypotheses H4 and H4a held that social network-based non-monetary sales promotion generates greater brand loyalty than monetary promotion and that this effect is, once more, moderated by sales promotion proneness. The proposed model explains 30% of the variability of the “brand loyalty” variable, providing relevant information for its estimation (see Table 7 and Table 8). The data analysis shows that sales-promotion type exerted a quasi-significant influence on brand loyalty (β1: −0.62; p-value: 0.05). Furthermore, promotion proneness was shown to exert a moderating effect on this relationship, with higher levels of monetary promotion proneness generating greater loyalty than non-monetary promotion. These results provide evidence indicating that neither H4 nor H4a can be rejected. According to the data, among consumers with a high level of promotion proneness, it was monetary incentives that had the greatest effect on loyalty to the heritage site in question.
Hypotheses H5 and H5a held that social network-based non-monetary sales promotion generates greater perceived brand value than monetary promotion, and that this effect is moderated by consumer’s sales promotion proneness. The proposed model explains 31% of the variability of the “perceived brand value” variable, providing relevant information for its estimation (see Table 9 and Table 10). The data analysis shows that sales-promotion type did not exert a significant influence on perceived brand value (β1: −0.64; p-value: 0.07). However, again, sales promotion proneness exerted a moderating effect on this relationship, such that, among consumers with higher levels of promotion proneness, monetary incentives generated a greater influence on perceived brand values than non-monetary ones. These results provide evidence indicating that H5 has to be rejected and H5a cannot be totally rejected. The results show that there was an indirect effect of sales-promotion type on brand equity. That is, the direct effect of the type of sales promotion on brand equity was not significant, so it cannot be assured that non-monetary sales promotions were better at generating greater brand equity than monetary ones in all cases. However, as observed in the model, the effectiveness of the use of both types of sales promotion depended on the propensity of the user to promote. When users were promotion prone, monetary promotions generated better brand equity than non-monetary ones.
5. Conclusions and Managerial Implications
Cultural heritage is, undeniably, a driver of economic growth, wealth, and employment ([1,2,3]); hence, its preservation, management, and improvement are all topics that feature heavily in international research. Countries, regions, and cities all around the world compete for the attention of tourists to attract them to their heritage offer [37,89].
In this context, this research presents the following theoretical implications. As a main theoretical contribution, this research aims to help cultural heritage site managers decide how to best implement a promotional strategy that contributes not only at an economic level but also to shaping and reinforcing the image of the site. Thus, on the one hand, this study fills the existing gap regarding the use of promotions implemented through social networks and their effect on the brand equity dimensions of a brand associated with a cultural heritage destination. On the other hand, it deepens the knowledge of the type of promotions (monetary and non-monetary) and their effect on brand equity.
The use of sales promotions for a cultural heritage destination via social networks enable to increase brand equity, these results being consistent with those previously found in the literature [26,28].
It has also been corroborated that social media-based marketing actions are likely to affect the generation and maintenance of brand equity [46]. Its effect is materialized through the influence of sales promotion on each of the dimensions of brand equity, this result being congruent with extant knowledge [38,46].
In this regard, firstly, the results corroborate that the use of different types of sales promotion on social networks positively affected the construction of brand equity for a brand associated with a heritage destination through their effect on each of its dimensions (awareness, image, perceived quality, loyalty, and perceived value), in line with the extant literature [51].
Secondly, the results show that it was non-monetary sales promotions that, in this case, most influenced each of the dimensions of brand equity, as opposed to the monetary option, thus corroborating the findings of the extant literature [20,54,55]. The free gift offered to internet users in the present experiment registered higher values for awareness, perceived quality, and brand image than the discount.
Thirdly, this study shows that the effect exerted by sales promotions on heritage brand equity dimensions was moderated by the online user’s promotion proneness, but the moderation effect was not the same on each of the dimensions. In this line, we found that this effect occurred only among users with an intermediate or low level of promotion-proneness, whereas for highly promotion-prone users, monetary promotions exerted a greater effect on heritage brand equity. On its own, promotion type was unable to affect either brand loyalty or perceived value. Its influence was activated in interaction with the “promotion proneness” variable and affected only those users presenting high promotion proneness. Such users generated greater heritage brand equity when exposed to monetary promotions than to non-monetary promotions. For any other level of proneness, sales-promotion type was found not to affect brand loyalty or perceived value.
The results obtained have important practical implications. On the one hand, they contribute to improving the management of heritage brands, since it has been shown that the use of communication tools—specifically, sales promotion—in social networks contributes to generating and building heritage brand equity. In this sense, our findings provide managers of cultural heritage sites with heritage-marketing tools that help to enhance the competitiveness of the heritage destination and the sustainable development of the heritage destination, in line with the work of [17], who point out that the right choice of marketing communication tools are an appropriate way to address target audiences, contributing to the development of heritage destinations. On the other hand, sales promotion—in particular, implemented via social networks—can deliver benefits to the consumer that lead them to generate positive associations linked to the brand, to evoke distinctive brand attributes, and to improve, in turn, brand equity [20,54,55,65]. Social networks act as an international “loudspeaker” that can help heritage resources increase their visibility and improve brand equity, thus attracting more tourists to the destination.
The results obtained in this study are especially relevant in the present time. The COVID-19 pandemic outbreak has led to a significant decrease in the number of tourists, international tourism having been particularly damaged. The struggle of destinations to attract the few tourists who dare to challenge the infection risks is fierce. Undoubtedly, a destination with greater brand equity is more attractive and better differentiated from competitors. These findings provide useful tools to enhance the destination’s brand equity both in terms of increasing the capacity of the destination to attract tourists and to make it the top destination chosen by tourists.
As with any research, this study has some limitations that need to be acknowledged, which in turn generate opportunities for future research directions that can be suggested. Performing an experiment implies the development of an artificial context, even if the researchers made efforts in designing the experiment to ensure that the conditions of promotional stimuli and exposure were as likely as possible. This first limitation can be overcome via further research; thus, we call for future studies to corroborate the proposed model and test the relationships proposed in this study by applying the same and other methodological approaches to examine alternative service categories and types to enhance the external validity of the results. Another limitation derives from the fact that some variables were not taken into account, such as the individuals’ attitude towards the advertisement. Therefore, we call for future research on the examination of mediating and moderating variables that can affect the relationships and the model proposed and tested in this study. In this regard, the respondents’ attitudes (towards the ad and/or the specific platform, such as Instagram) are likely to play a key role.
Author Contributions
Conceptualization, E.C.-A. and M.B.P.-P.; methodology, E.C.-A.; software, E.C.-A.; validation, M.B.P.-P., E.C.-A. and L.P.; formal analysis, E.C.-A.; investigation, M.B.P.-P.; resources, E.C.-A.; data curation, M.B.P.-P.; writing—original draft preparation, L.P.; writing—review and editing, L.P. All authors have read and agreed to the published version of the manuscript.
Funding
This study was funded by the Campus of International Excellence BioTic Granada (grant number 20F12/43) and the Spanish National Research Programme (R+D+i Research Project ECO2017-88458-R).
Institutional Review Board Statement
Not applicable.
Informed Consent Statement
Not applicable.
Data Availability Statement
Not applicable.
Conflicts of Interest
The authors declare no conflict of interest.
Appendix A
Figure A1.
Facebook page and promotional stimuli (discount). http://s225081138.mialojamiento.es/fra/s2.html.
Figure A1.
Facebook page and promotional stimuli (discount). http://s225081138.mialojamiento.es/fra/s2.html.

Figure A2.
Facebook page and promotional stimuli (gift). http://s225081138.mialojamiento.es/fra/s4.html.
Figure A2.
Facebook page and promotional stimuli (gift). http://s225081138.mialojamiento.es/fra/s4.html.

References
- Bowitz, E.; Ibenholt, K. Economic impacts of cultural heritage. Research and perspectives. J. Cult. Herit. 2008, 10, 1–8. [Google Scholar] [CrossRef]
- Greffe, X. Is heritage an asset or a liability? J. Cult. Herit. 2004, 5, 301–309. [Google Scholar] [CrossRef]
- Tuan, T.H.; Navrud, S. Capturing the benefits of preserving cultural heritage. J. Cult. Herit. 2008, 9, 326–337. [Google Scholar] [CrossRef]
- Hall, C.M.; Piggin, R. World Heritage sites: Managing the brand. In Managing Visitor Attractions: New Directions; Fyall, A., Garrod, B., Leask, A., Eds.; Routledge: London, UK, 2003; pp. 203–219. [Google Scholar]
- Poria, Y.; Reichel, A.; Cohen, R. World heritage site—Is it an effective brand name? A case study of a religious heritage site. J. Travel Res. 2011, 50, 482–495. [Google Scholar] [CrossRef]
- Del Barrio-García, S.; Prados-Peña, M.B. Do brand authenticity and brand credibility facilitate brand equity? The case of heritage destination brand extension. J. Destin. Mark. Manag. 2019, 13, 10–23. [Google Scholar] [CrossRef]
- Ryan, J.; Silvanto, S. The World Heritage List: The making and management of a brand. Place Branding Public Dipl. 2009, 5, 290–300. [Google Scholar] [CrossRef]
- Keller, K.L.; Lehmann, D.R. Brands and branding: Research findings and future priorities. Mark. Sci. 2006, 25, 740–759. [Google Scholar] [CrossRef]
- Konecnik, M.; Gartner, W.C. Customer-based brand equity for a destination. Ann. Tour. Res. 2007, 34, 400–421. [Google Scholar] [CrossRef]
- Tran, V.T.; Nguyen, N.P.; Tran, P.T.K.; Tran, T.N.; Huynh, T.T.P. Brand equity in a tourism destination: A case study of domestic tourists in Hoi An city, Vietnam. Tourism Review 2019, 74, 704–720. [Google Scholar] [CrossRef]
- Aaker, D. Managing Brand Equity Capitalizing on the Value of Brand Name; The Free Press: New York, NY, USA, 1991. [Google Scholar]
- Bianchi, C.; Pike, S.; Lings, I. Investigating attitudes towards three South American destinations in an emerging long haul market using a model of consumer-based brand equity (CBBE). Tour. Manag. 2014, 42, 215–223. [Google Scholar] [CrossRef] [Green Version]
- Camarero, C.; Garrido-Samaniego, M.J.; Vicente, E. Determinants of brand equity in cultural organizations: The case of an art exhibition. Serv. Ind. J. 2012, 32, 1527–1549. [Google Scholar] [CrossRef]
- Chekalina, T.; Fuchs, M.; Lexhagen, M. Customer-Based Destination Brand Equity Modeling: The Role of Destination Resources, Value for Money, and Value in Use. J. Travel Res. 2018, 57, 31–51. [Google Scholar] [CrossRef]
- Kumail, T.; Qeed, M.A.A.; Aburumman, A.; Abbas, S.M.; Sadiq, F. How Destination Brand Equity and Destination Brand Authenticity Influence Destination Visit Intention: Evidence from the United Arab Emirates. J. Promot. Manag. 2022, 28, 332–358. [Google Scholar] [CrossRef]
- Kim, H.; Stepchenkova, S.; Yilmaz, S. Destination Extension: A Faster Route to Fame for the Emerging Destination Brands? J. Travel Res. 2018, 58, 440–458. [Google Scholar] [CrossRef]
- Matlovičová, K.; Husárová, M. Heritage marketing a možnosti jeho využitia pri rozvoji turistickej destinácie: Prípadová štúdia hradu Cicva (Heritage marketing and the possibilities of its use in the development of a tourist destination: A case study of Cicva Castle). Folia Geogr. 2017, 59, 5–35. [Google Scholar]
- Yoo, B.; Donthu, N.; Lee, S. An examination of selected marketing mix elements and brand equity. J. Acad. Mark. Sci. 2000, 28, 195–211. [Google Scholar] [CrossRef]
- Infoadex. 2019. Available online: https://www.infoadex.es/home/wp-content/uploads/2019/03/Estudio-InfoAdex-2019-Resumen.pdf (accessed on 21 March 2019).
- Chu, S.; Keh, H.T. Brand value creation: Analysis of the Interbrand-Business Week brand value rankings. Mark. Lett. 2006, 17, 323–331. [Google Scholar] [CrossRef]
- Gül, K.; Gül, M. The Role of Industry Museums in Promoting Industrial Heritage Tourism. In Heritage Tourism Beyond Borders and Civilizations; Springer: Singapore, 2020; pp. 139–146. [Google Scholar]
- Hausmann, A.; Schuhbauer, S. The role of information and communication technologies in cultural tourists’ journeys: The case of a World Heritage Site. J. Herit. Tour. 2021, 16, 669–683. [Google Scholar] [CrossRef]
- Timothy, D.J. Making sense of heritage tourism: Research trends in a maturing field of study. Tour. Manag. Perspect. 2018, 25, 177–180. [Google Scholar] [CrossRef]
- Lund, N.F.; Cohen, S.A.; Scarles, C. The power of social media storytelling in destination branding. J. Destin. Mark. Manag. 2018, 8, 271–280. [Google Scholar] [CrossRef]
- Saeed, M.; Shafique, I. Customer-based brand equity and destination visit behaviour in the tourism industry: The contingent role of social media. Qual. Quant. 2020, 54, 1491–1512. [Google Scholar] [CrossRef]
- Ajanthan, D. The Role of a Social Media Marketing in Building Brand Equity-A Special Reference to Travel and Tourism Industry in Sri Lanka. Glob. J. Manag. Bus. Res. 2017. [Google Scholar]
- Bruhn, M.; Schoenmüller, V.; Schäfer, D.; Heinrich, D. Brand authenticity: Towards a deeper understanding of its conceptualization and measurement in NA. Adv. Consum. Res. Vol. 2012, 40, 567–576. [Google Scholar]
- Godey, B.; Manthiou, A.; Pederzoli, D.; Rokka, J.; Aiello, G.; Donvito, R.; Singh, R. Social media marketing efforts of luxury brands: Influence on brand equity and consumer behavior. J. Bus. Res. 2016, 69, 5833–5841. [Google Scholar] [CrossRef]
- Gunelius, S. Content Marketing for Dummies; John Wiley & Sons: Hoboken, NJ, USA, 2011. [Google Scholar]
- Crespo-Almendros, E.; Prados-Peña, M.B.; Porcu, L.; Alcántara-Pilar, J.M. Influence of the perceived benefit of a social network-based sales promotion on the perceived quality of a heritage complex. Acad. Rev. Latinoam. Adm. 2022, 35, 148–162. [Google Scholar] [CrossRef]
- Timothy, D.J. Cultural Heritage and Tourism: An introduction; Channel View Publications: Bristol, UK, 2011; Volume 4. [Google Scholar]
- Richards, G. Cultural tourism: A review of recent research and trends. J. Hosp. Tour. Manag. 2018, 36, 12–21. [Google Scholar] [CrossRef]
- McKercher, B.; Du Cros, H. Cultural Tourism: The Partnership between Tourism and Cultural Heritage Management; Routledge: London, UK, 2002. [Google Scholar]
- Kim, S.; Whitford, M.; Arcodia, C. Development of intangible cultural heritage as a sustainable tourism resource: The intangible cultural heritage practitioners’ perspectives. J. Herit. Tour. 2019, 14, 422–435. [Google Scholar] [CrossRef]
- European Commission. Cultural Tourism. 2018. Available online: https://ec.europa.eu/growth/sectors/tourism/offer/cultural_en (accessed on 21 March 2019).
- Mocák, P.; Matlovičová, K.; Matlovič, R.; Pénzes, J.; Pachura, P.; Mishra, P.K.; Kostilníková, K.; Demková, M. 15-Minute City Concept as a Sustainable Urban Development Alternative: A Brief Outline of Conceptual Frameworks and Slovak Cities as a Case. Folia Geogr. 2022, 64, 69–89. [Google Scholar]
- Paskaleva-Shapira, K.A. New paradigms in city tourism management: Redefining destination promotion. J. Travel Res. 2007, 46, 108–114. [Google Scholar] [CrossRef]
- Keller, K.L. Conceptualizing, measuring, and managing customer-based brand equity. J. Mark. 1993, 57, 1–22. [Google Scholar] [CrossRef]
- Kladou, S.; Kehagias, J. Assessing destination brand equity: An integrated approach. J. Destin. Mark. Manag. 2014, 3, 2–10. [Google Scholar] [CrossRef]
- Liu, C.R.; Liu, H.K.; Lin, W.R. Constructing customer-based museums brand equity model: The mediating role of brand value. Int. J. Tour. Res. 2015, 17, 229–238. [Google Scholar] [CrossRef]
- Matlovičová, K.; Tirpáková, E.; Mocák, P. City brand image: Semiotic perspective a case study of Prague. Folia Geogr. 2019, 61, 120–142. [Google Scholar]
- Laroche, M.; Habibi, M.R.; Richard, M.O.; Sankaranarayanan, R. The effects of social media based brand communities on brand community markers, value creation practices, brand trust and brand loyalty. Comput. Hum. Behav. 2012, 28, 1755–1767. [Google Scholar] [CrossRef]
- Coelho, P.S.; Rita, P.; Santos, Z.R. On the relationship between consumer-brand identification, brand community, and brand loyalty. J. Retail. Consum. Serv. 2018, 43, 101–110. [Google Scholar] [CrossRef]
- Kumar, P.; Kumar, V.; Mishra, J.M. Social media: A tool for tourism marketing. Int. Res. J. Bus. Manag. 2015, 8, 1–6. [Google Scholar]
- Gensler, S.; Völckner, F.; Liu-Thompkins, Y.; Wiertz, C. Managing brands in the social media environment. J. Interact. Mark. 2013, 27, 242–256. [Google Scholar] [CrossRef]
- Kim, A.J.; Ko, E. Do social media marketing activities enhance customer equity? An empirical study of luxury fashion brand. J. Bus. Res. 2012, 65, 1480–1486. [Google Scholar] [CrossRef]
- Dedeoğlu, B.B.; Van Niekerk, M.; Weinland, J.; Celuch, K. Re-conceptualizing customer-based destination brand equity. J. Destin. Mark. Manag. 2019, 11, 211–230. [Google Scholar] [CrossRef]
- Barnes, S.J.; Mattsson, J.; Sørensen, F. Destination brand experience and visitor behavior: Testing a scale in the tourism context. Ann. Tour. Res. 2014, 48, 121–139. [Google Scholar] [CrossRef]
- Belenioti, Z.C.; Tsourvakas, G.; Vassiliadis, C.A. Do Social Media Affect Museums’ Brand Equity? An Exploratory Qualitative Study. In Strategic Innovative Marketing and Tourism; Springer: Cham, Switzerland, 2019; pp. 533–540. [Google Scholar]
- Valos, M.J.; Habibi, F.H.; Casidy, R.; Driesener, C.B.; Maplestone, V.L. Exploring the integration of social media within integrated marketing communication frameworks. Mark. Intell. Plan. 2016, 34, 19–40. [Google Scholar] [CrossRef]
- Prasad, K.B.; Kumar, S.R.; Varghese, N.; Narayan, S.V. Integrating social media and digital media as new elements of integrated marketing communication for creating brand equity. J. Content Community Commun. 2020, 11, 52–64. [Google Scholar]
- Yung, W.; Yang, S.; Kim, H. Design of sweepstakes-based social media marketing for online customer engagement. Electron. Commer. Res. 2020, 20, 119–146. [Google Scholar] [CrossRef]
- Chandon, P.; Wansink, B.; Laurent, G. A benefit congruency framework of sales promotion effectiveness. J. Mark. 2000, 64, 65–81. [Google Scholar] [CrossRef]
- Montaner, T.; Pina, J.M. The effect of promotion type and benefit congruency on brand image. J. Appl. Bus. Res. (JABR) 2008, 24, 15–28. [Google Scholar] [CrossRef]
- Palazón-Vidal, M.; Delgado-Ballester, E. Sales promotions effects on consumer-based brand equity. Int. J. Mark. Res. 2005, 47, 179–204. [Google Scholar] [CrossRef]
- Martinez, S.E.; Montaner, G.T.; Pina, P.J.M. Estrategia de promoción e imagen de marca: Influencia del tipo de promoción, de la notoriedad de la marca y de la congruencia de beneficios. Rev. Española Investig. Mark. 2007, 11, 27–51. [Google Scholar]
- Zeithaml, V.A. Consumer perceptions of price, quality, and value: A means-end model and synthesis of evidence. J. Mark. 1988, 52, 2–22. [Google Scholar] [CrossRef]
- Parasuraman, A.; Zeithaml, V.A.; Berry, L.L. Servqual: A multiple-item scale for measuring consumer perceptions of Service Quality. J. Retail. 1988, 64, 12–40. [Google Scholar]
- Agarwal, M.K.; Rao, V.R. An empirical comparison of consumer-based measures of brand equity. Mark. Lett. 1996, 7, 237–247. [Google Scholar] [CrossRef]
- Kim, J.H.; Hyun, Y.J. A model to investigate the influence of marketing-mix efforts and corporate image on brand equity in the IT software sector. Ind. Mark. Manag. 2011, 40, 424–438. [Google Scholar] [CrossRef]
- Grover, R.; Srinivasan, V. Evaluating the multiple effects of retail promotions on brand loyal and brand switching segments. J. Mark. Res. 1992, 29, 76–89. [Google Scholar] [CrossRef]
- Villarejo Ramos, Á.F. Modelos multidimensionales para la medición del valor de marca. In Investigaciones Europeas en Dirección y Economía de la Empresa; Universidad de Sevilla: Seville, Spain, 2002; Volume 8, pp. 13–44. [Google Scholar]
- Maggon, M.; Chaudhry, H. Is it really making an impact? Examining the effect of social media marketing participation benefits on perceived value and behavioural intention: Evidences from India. Int. J. Leis. Tour. Mark. 2015, 4, 189–206. [Google Scholar] [CrossRef]
- Lai, W.H.; Vinh, N.Q. Online promotion and its influence on destination awareness and loyalty in the tourism industry. Adv. Manag. Appl. Econ. 2013, 3, 15–30. [Google Scholar]
- Melania, K.; Ellyawati, J. The Role of Online Promotion and Its Effect on Destination Loyalty. KINERJA 2018, 22, 126–141. [Google Scholar] [CrossRef]
- Azazz, A.M. The Role of Social Media in Promoting Tourist and Heritage Sites” A case study of Al-Mu’izzLedin Allah Street”. J. Fac. Tour. Hotel. 2018, 15, 43–55. [Google Scholar]
- Del Vecchio, D.; Henard, D.H.; Freling, T.H. The effect of sales promotion on post-promotion brand preference: A meta-analysis. J. Retail. 2006, 82, 203–213. [Google Scholar] [CrossRef]
- Palazón, M.; Delgado, E. The moderating role of price consciousness on the effectiveness of price discounts and premium promotions. J. Prod. Brand Manag. 2009, 18, 306–312. [Google Scholar] [CrossRef]
- Yi, Y.; Yoo, J. The long-term effects of sales promotions on brand attitude across monetary and non-monetary promotions. Psychol. Mark. 2011, 28, 879–896. [Google Scholar] [CrossRef]
- Dastidar, S.G.; Datta, B. A Theoretical Analysis of the Critical Factors Governing Consumers’ Deal Responsive Behavior. South Asian J. Manag. 2008, 15, 76–97. [Google Scholar]
- Henderson, C. Sales Promotion Segmentation: Refining the Deal-Proneness Construct. Documento de Trabajo; The Amos Tuck School of Business Administration, Dartmouth College: Hanover, NH, USA, 1987. [Google Scholar]
- Schneider, L.G.; Currim, I.S. Consumer purchase behaviors associated with active and passive deal-proneness. Int. J. Res. Mark. 1991, 8, 205–222. [Google Scholar] [CrossRef]
- Henderson, C.M. Promotion heterogeneity and consumer learning: Refining the deal-proneness construct¡. In Advances in Consumer Research; Allen, C.T., John, D.R., Eds.; Association for Consumer Research: Provo, UT, USA, 1994; Volume 21, pp. 86–94. [Google Scholar]
- Webster, F.E., Jr. The “deal-prone” consumer. J. Mark. Res. 1965, 2, 186–189. [Google Scholar]
- Alford, B.L.; Biswas, A. The effects of discount level, price consciousness and sale proneness on consumers’ price perception and behavioral intention. J. Bus. Res. 2002, 55, 775–783. [Google Scholar] [CrossRef]
- Lichtenstein, D.R.; Burton, S.; Netemeyer, R.G. An examination of deal proneness across sales promotion types: A consumer segmentation perspective. J. Retail. 1997, 73, 283–297. [Google Scholar] [CrossRef]
- Kaplan, A.M.; Haenlein, M. Users of the world, unite! The challenges and opportunities of Social Media. Bus. Horiz. 2010, 53, 59–68. [Google Scholar] [CrossRef]
- Zhu, Y.Q.; Chen, H.G. Social media and human need satisfaction: Implications for social media marketing. Bus. Horiz. 2015, 58, 335–345. [Google Scholar] [CrossRef]
- Tan, S.J.; Chua, H.S. While stocks last Impact of framing on consumers’ perception of sales promotions. J. Consum. Mark. 2004, 21, 343–355. [Google Scholar] [CrossRef]
- Tversky, A.; Sattah, S.; Slovic, P. Contingent Weighting in Judgement and Choice. Psychol. Rev. 1988, 95, 371–384. [Google Scholar] [CrossRef]
- Batra, R.; Ahtola, O.T. Measuring the hedonic and utilitarian sources of consumer attitudes. Mark. Lett. 1991, 2, 159–170. [Google Scholar] [CrossRef]
- Spangenberg, E.R.; Voss, K.E.; Crowley, A.E. Measuring the hedonic and utilitarian dimensions of attitude: A generally applicable scale. In Advances in Consumer Research; Brucks, M., MacInnis, D.J., Eds.; Association for Consumer Research: Provo, UT, USA, 1997; Volume 24, pp. 235–241. [Google Scholar]
- Lichtenstein, D.R.; Ridgway, N.M.; Netemeyer, R.G. Price perceptions and consumer shopping behavior: A field study. J. Mark. Res. 1993, 30, 234–245. [Google Scholar] [CrossRef]
- Palazón, M.; Delgado-Ballester, E. The expected benefit as determinant of deal-prone consumers’ response to sales promotions. J. Retail. Consum. Serv. 2011, 18, 542–547. [Google Scholar] [CrossRef]
- IAB Spain. Estudio de Redes Sociales. 2019. Available online: https://iabspain.es/estudio/estudio-anual-de-redes-sociales-2019/ (accessed on 21 March 2019).
- Nunes, J.C.; Park, C.W. Incommensurate resources: Not just more of the same. J. Mark. Res. 2003, 40, 26–38. [Google Scholar] [CrossRef]
- Hair, J.F.; Anderson, R.E.; Babin, B.J.; Black, W.C. Multivariate Data Analysis: A Global Perspective; Pearson: Upper Saddle River, NJ, USA, 2010. [Google Scholar]
- Preacher, K.J.; Rucker, D.D.; Hayes, A.F. Addressing moderated mediation hypotheses: Theory, methods, and prescriptions. Multivar. Behav. Res. 2007, 42, 185–227. [Google Scholar] [CrossRef] [PubMed]
- Valls, J.F.; Sureda, J.; Valls-Tuñon, G. Attractiveness analysis of European tourist cities. J. Travel Tour. Mark. 2014, 31, 178–194. [Google Scholar] [CrossRef]

Table 1.
Moderation analysis. Dependent variable: heritage brand awareness.
| Coeff. | SE | t-Value | p-Value | 95% CI | ||
|---|---|---|---|---|---|---|
| Constant | 26.20 | 0.34 | 0.74 | 0.45 | −42,46 | 94,86 |
| Promotion proneness (W) | −13.32 | 5.94 | −2.24 | 0.02 * | −24.99 | −1.66 |
| Type of promotion (X) | −0.66 | 0.34 | −1.95 | 0.05 | −1.33 | 0.00 |
| X*W | 0.13 | 0.05 | 2.32 | 0.02 * | 0.02 | 0.25 |
Note: * p < 0.05.
Table 2.
Conditional effect of sales-promotion type on heritage brand awareness.
| Proneness Value | Coeff. | SE | t-Value | p-Value | 95% CI | |
|---|---|---|---|---|---|---|
| 3.88 | −0.13 | 0.12 | −1.08 | 0.27 | −0.38 | 0.11 |
| 5.38 | 0.06 | 0.07 | 0.89 | 0.37 | −0.07 | 0.21 |
| 6.88 | 0.26 | 0.09 | 2.70 | 0.00 * | 0.07 | 0.46 |
Note: * p < 0.01.
Table 3.
Moderation analysis. Dependent variable: perceived heritage brand quality.
| Coeff. | SE | t-Value | p-Value | 95% CI | ||
|---|---|---|---|---|---|---|
| Constant | 75.36 | 35.57 | 2.11 | 0.03 | 5.53 | 145.19 |
| Promotion proneness (W) | −20.94 | 6.11 | −3.42 | 0.00 * | −32.95 | −8.93 |
| Type of promotion (X) | −1.16 | 0.34 | −3.38 | 0.00 * | −1.83 | −0.48 |
| X*W | 0.21 | 0.06 | 3.49 | 0.00 * | 0.09 | 0.32 |
Note: * p < 0.01.
Table 4.
Conditional effect of sales-promotion type on perceived heritage brand quality.
| Proneness Value | Coeff. | SE | t-Value | p-Value | 95% CI | |
|---|---|---|---|---|---|---|
| 3.88 | −0.34 | 0.12 | −2.69 | 0.00 * | −0.59 | −0.09 |
| 5.38 | −0.02 | 0.07 | −0.32 | 0.74 | −0.18 | 0.12 |
| 6.88 | 0.29 | 0.11 | 2.57 | 0.01 * | 0.06 | 0.51 |
Note: * p < 0.05.
Table 5.
Moderation analysis. Dependent variable: heritage brand image.
| Coeff. | SE | t-Value | p-Value | 95% CI | ||
|---|---|---|---|---|---|---|
| Constant | 53.04 | 41.85 | 1.26 | 0.20 | −29.10 | 135.19 |
| Promotion proneness (W) | −18.54 | 7.01 | −2.64 | 0.00 * | −32.31 | −4.78 |
| Type of promotion (X) | −0.98 | 0.40 | −2.42 | 0.01 * | −1.78 | −0.18 |
| X*W | 0.18 | 0.06 | 2.72 | 0.00 * | 0.05 | 0.32 |
Note: * p < 0.05.
Table 6.
Conditional effect of sales-promotion type on heritage brand image.
| Proneness Value | Coeff. | SE | t-Value | p-Value | 95% CI | |
|---|---|---|---|---|---|---|
| 3.88 | −0.25 | 0.15 | −1.67 | 0.09 | −0.55 | 0.04 |
| 5.38 | 0.02 | 0.08 | 0.31 | 0.75 | −0.13 | 0.19 |
| 6.88 | 0.30 | 0.11 | 2.75 | 0.00 * | 0.08 | 0.52 |
Note: * p < 0.01.
Table 7.
Moderation analysis. Dependent variable: Heritage brand loyalty.
| Coeff. | SE | t-Value | p-Value | 95% CI | ||
|---|---|---|---|---|---|---|
| Constant | 13.80 | 33.82 | 0.40 | 0.68 | −52,58 | 80.20 |
| Promotion proneness (W) | −13.56 | 5.69 | −2.38 | 0.01 * | −24.74 | −2.37 |
| Type of promotion (X) | −0.62 | 0.32 | −1.93 | 0.05 | −1.25 | 0.00 |
| X*W | 0.13 | 0.05 | 2.45 | 0.01 * | 0.02 | 0.24 |
Note: * p < 0.05.
Table 8.
Conditional effect of sales-promotion type on heritage brand loyalty.
| Proneness Value | Coeff. | SE | t-Value | p-Value | 95% CI | |
|---|---|---|---|---|---|---|
| 3.88 | −0.08 | 0.12 | −0.71 | 0.47 | −0.32 | 0.15 |
| 5.38 | 0.12 | 0.07 | 1.56 | 0.11 | −0.03 | 0.27 |
| 6.88 | 0.32 | 0.10 | 3.06 | 0.00 * | 0.11 | 0.53 |
Note: * p < 0.01.
Table 9.
Moderation analysis. Dependent variable: perceived heritage brand value.
| Coeff. | SE | t-Value | p-Value | 95% CI | ||
|---|---|---|---|---|---|---|
| Constant | 14.17 | 37.94 | 0.37 | 0.70 | −60.30 | 88.65 |
| Promotion proneness (W) | −13.28 | 6.48 | −2.04 | 0.04 * | −26.02 | −0.55 |
| Type of promotion (X) | −0.64 | 0.36 | −1.77 | 0.07 | −1.36 | 0.06 |
| X*W | 0.13 | 0.06 | 2.12 | 0.03 * | 0.01 | 0.26 |
Note: * p < 0.05.
Table 10.
Conditional effect of sales promotion type on perceived heritage brand value.
| Proneness Value | Coeff. | SE | t-Value | p-Value | 95% CI | |
|---|---|---|---|---|---|---|
| 3.88 | −0.12 | 0.13 | −0.91 | 0.36 | −0.39 | 0.14 |
| 5.38 | 0.08 | 0.08 | 0.99 | 0.32 | −0.07 | 0.23 |
| 6.88 | 0.28 | 0.11 | 2.47 | 0.01 * | 0.05 | 0.50 |
Note: * p < 0.01.
Publisher’s Note: MDPI stays neutral with regard to jurisdictional claims in published maps and institutional affiliations. |
© 2022 by the authors. Licensee MDPI, Basel, Switzerland. This article is an open access article distributed under the terms and conditions of the Creative Commons Attribution (CC BY) license (https://creativecommons.org/licenses/by/4.0/).
Share and Cite
MDPI and ACS Style
Prados-Peña, M.B.; Crespo-Almendros, E.; Porcu, L. How Online Sales Promotions via Social Networks Affect the Brand Equity of a Heritage Destination. Heritage 2022, 5, 2547-2564. https://0-doi-org.brum.beds.ac.uk/10.3390/heritage5030133
AMA Style
Prados-Peña MB, Crespo-Almendros E, Porcu L. How Online Sales Promotions via Social Networks Affect the Brand Equity of a Heritage Destination. Heritage. 2022; 5(3):2547-2564. https://0-doi-org.brum.beds.ac.uk/10.3390/heritage5030133
Chicago/Turabian StylePrados-Peña, M. Belén, Esmeralda Crespo-Almendros, and Lucia Porcu. 2022. "How Online Sales Promotions via Social Networks Affect the Brand Equity of a Heritage Destination" Heritage 5, no. 3: 2547-2564. https://0-doi-org.brum.beds.ac.uk/10.3390/heritage5030133