Article

Analysis of Resonant Soft X-ray Reflectivity of Anisotropic Layered Materials

1
Dipartimento di Ingegneria ‘E. Ferrari’, Università di Modena e Reggio Emilia, via Vivarelli 10, 41125 Modena, Italy
2
Istituto Officina Dei Materiali—Consiglio Nazionale Delle Ricerche (IOM-CNR), Strada Statale 14, Km. 163.5 in AREA Science Park, Basovizza, 34149 Trieste, Italy
3
Department of Physics, University of Johannesburg, P.O. Box 524, Auckland Park 2006, South Africa
4
Dipartimento di Scienze, Università degli Studi Roma Tre, Via della Vasca Navale 84, 00146 Roma, Italy
5
Laboratoire d’Etude Des Microstructures (LEM), Unitè Mixte de Reserche (UMR) 104 Centre National de la Recherche Scientifique (CNRS)—ONERA, 29 Av. de la Division Leclerc, FR-92322 Chatillon CEDEX, France
*
Author to whom correspondence should be addressed.
Submission received: 15 December 2020 / Revised: 8 January 2021 / Accepted: 8 January 2021 / Published: 11 January 2021

Abstract

:
We present here a method for the quantitative prediction of the spectroscopic specular reflectivity line-shape in anisotropic layered media. The method is based on a 4 × 4 matrix formalism and on the simulation from the first principles (through density functional theory—DFT) of the anisotropic absorption cross-section. The approach was used to simulate the reflectivity at the oxygen K-edge of a 3,4,9,10-perylene-tetracarboxylic dianhydride (PTCDA) thin film on Au(111). The effect of film thickness, orientation of the molecules, and grazing incidence angle were considered. The simulation results were compared to the experiment, permitting us to derive information on the film geometry, thickness, and morphology, as well as the electronic structure.

1. Introduction

The study of surfaces and thin films often involves the use of visible, UV, and X-ray radiation as a probe. In this context, photon-in, photon-out techniques have the valuable advantage of being in general non-destructive and they can be applied either to conducting and non-conductive samples.
Non-resonant specular elastic scattering (reflectivity), in particular, is widely carried out in the hard X-ray range for the study of crystal structure and morphology, exploiting the electron density contrast among different atoms [1]. Reflectivity at resonance provides additional advantages in terms of atomic and depth-resolved investigation of the chemical, structural, and magnetic properties of a variety of systems, including polymeric and organic materials, liquid interfaces, spintronic systems, and inorganic layered materials [2,3]. Element selectivity together with high contrast between different structures is obtained. The sampling depth of reflectivity is not limited to the near-surface region, as for electron yield spectroscopies, but buried interfaces can be accessed as well (up to several tens of nanometers below the surface). Moreover, the technique is quantitative by nature and measurements are relatively simple, besides the fact that in the X-rays and at resonance they often require synchrotron radiation [4]. In contrast, reflectivity spectra can be extremely difficult to interpret without a suitable model. Several factors contribute to the energy-resolved reflectivity signal—these include the wavelength-dependent optical properties (optical constants) of the materials and the morphology of the system, including layer thickness and stacking, the quality of the interfaces, the geometrical arrangement of the constituents down to the atomic scale. These are indeed the unknowns that most likely the experiment would like to explore. The richness of information can definitely represent an obstacle for a rapid understanding of the reflectivity spectra.
We developed a protocol, as well as a related computer code, to obtain simultaneous quantitative information on the structure, interface morphology, chemical properties, magnetic properties, and optical properties with sub-nanometer depth resolution of layered materials that can present structural (lattice) and/or magnetic dichroism (in this work we restrict to “structural” dichroism). Our method can be applied in any photon energy range, both at resonant and non-resonant frequencies, and it assumes that the response is linear, that is the medium and its response are described in terms of a dielectric framework. Our method takes account materials with anisotropic optical properties, which can be determined by the specific orientation of intrinsic anisotropic crystalline layers, or by the anisotropic arrangement of microscopic constituents (molecules or molecular building blocks) inside layered structures, as for organic molecular films. The method is based on the quantitative prediction of the spectral line-shape also across specific elemental edges through (1) the numerical calculation from the first principles of the elements of the dielectric tensor of each material in a given layered system, (2) the simulation of the propagation of the electromagnetic field in the stack of layers and the computation of the optical response (i.e., specular reflectivity in the present case), and (3) the comparison (and fitting) of the simulation with the experiment.
In some previous works [5,6,7,8], the method has been successfully applied by us in the soft X-rays at resonance to study anisotropic thin and ultrathin organic films on metals and insulators to get quantitative information on chemical composition, layer-resolved molecular orientation, optical anisotropies, and overall thickness of the films, simultaneously. We addressed in particular some prototypical cases that are interesting for molecular electronics applications, focusing on reflectivity at the carbon K-edge: 1,4-benzenedimethantiol single layers on Au(111) [5], 3,4,9,10-perylene-tetracarboxylic dianhydride (PTCDA) on Au(111) [6], pentacene on SiO2 [7], and tetracene single crystal [8].
In this work, we illustrate the details of our method to calculate the optical properties of anisotropic layered materials (OPAL) and to simulate the specular reflectivity. We include an application example, referred to the simulation of the reflectivity at the oxygen K-edge of a thin film of PTCDA on Au(111). In particular, we apply here our approach for the first time to the O 1s edge, since in our previous studies [6] we concentrated specifically on the edge of C 1s.
The method transfers the knowledge gained in the years in the field of visible and infrared spectroscopy of thin anisotropic films [9,10,11] to the soft-X range. Moreover, it offers a tool of quantitative investigation in those cases where electron spectroscopy cannot be applied because of the presence of nonconductive materials, poor vacuum, or materials buried at distances from the surfaces higher than the electron-free collision path.
The approach that we implemented to simulate the optical properties of anisotropic layers is of general validity. It can be applied in any wavelength range. It allows one to calculate the propagation of light through a layered medium composed of an unlimited number of anisotropic layers interposed between vacuum on one side and a semi-infinite substrate on the other side, as represented in Figure 1a. The procedure extends to anisotropic and absorbing media the method introduced in the fundamental works of Parratt [12], Bertrand et al. [13], Berreman [14], and Yeh [15,16].
First, the simulation method assumes that each layer in the stack is represented by its specific complex dielectric tensor. The entries of the dielectric tensor can be derived either by direct measurements on the anisotropic bulk materials (i.e., by means of absorption measurements) or through simulations. Parameterized tensors can be also used in order to fit the calculation to the experiment.
Second, each layer is also characterized by its thickness (a scalar d). This implicitly corresponds to assuming each layer to have sharp and perfectly flat surfaces. Note, however, that this hypothesis can be partially relaxed by introducing effective buffers between the constituent layers.
In the present case, we deal with organic molecular films. They can present macroscopic anisotropic optical properties if they are composed by molecules arranged in an ordered manner. This is indeed the case for organic molecular crystals, but even in those cases that a crystal is not formed, as for self-assembled layers (SAMs), a preferential orientation of the molecules is often obtained, due to the interaction of the molecules with the substrate and between themselves in each layer. An effective dielectric tensor can therefore be derived, on the basis of the specific molecular arrangement in each layer and the optical properties of the single isolated molecule, assuming that these are not affected substantially by molecule–molecule interactions.

2. Materials and Methods

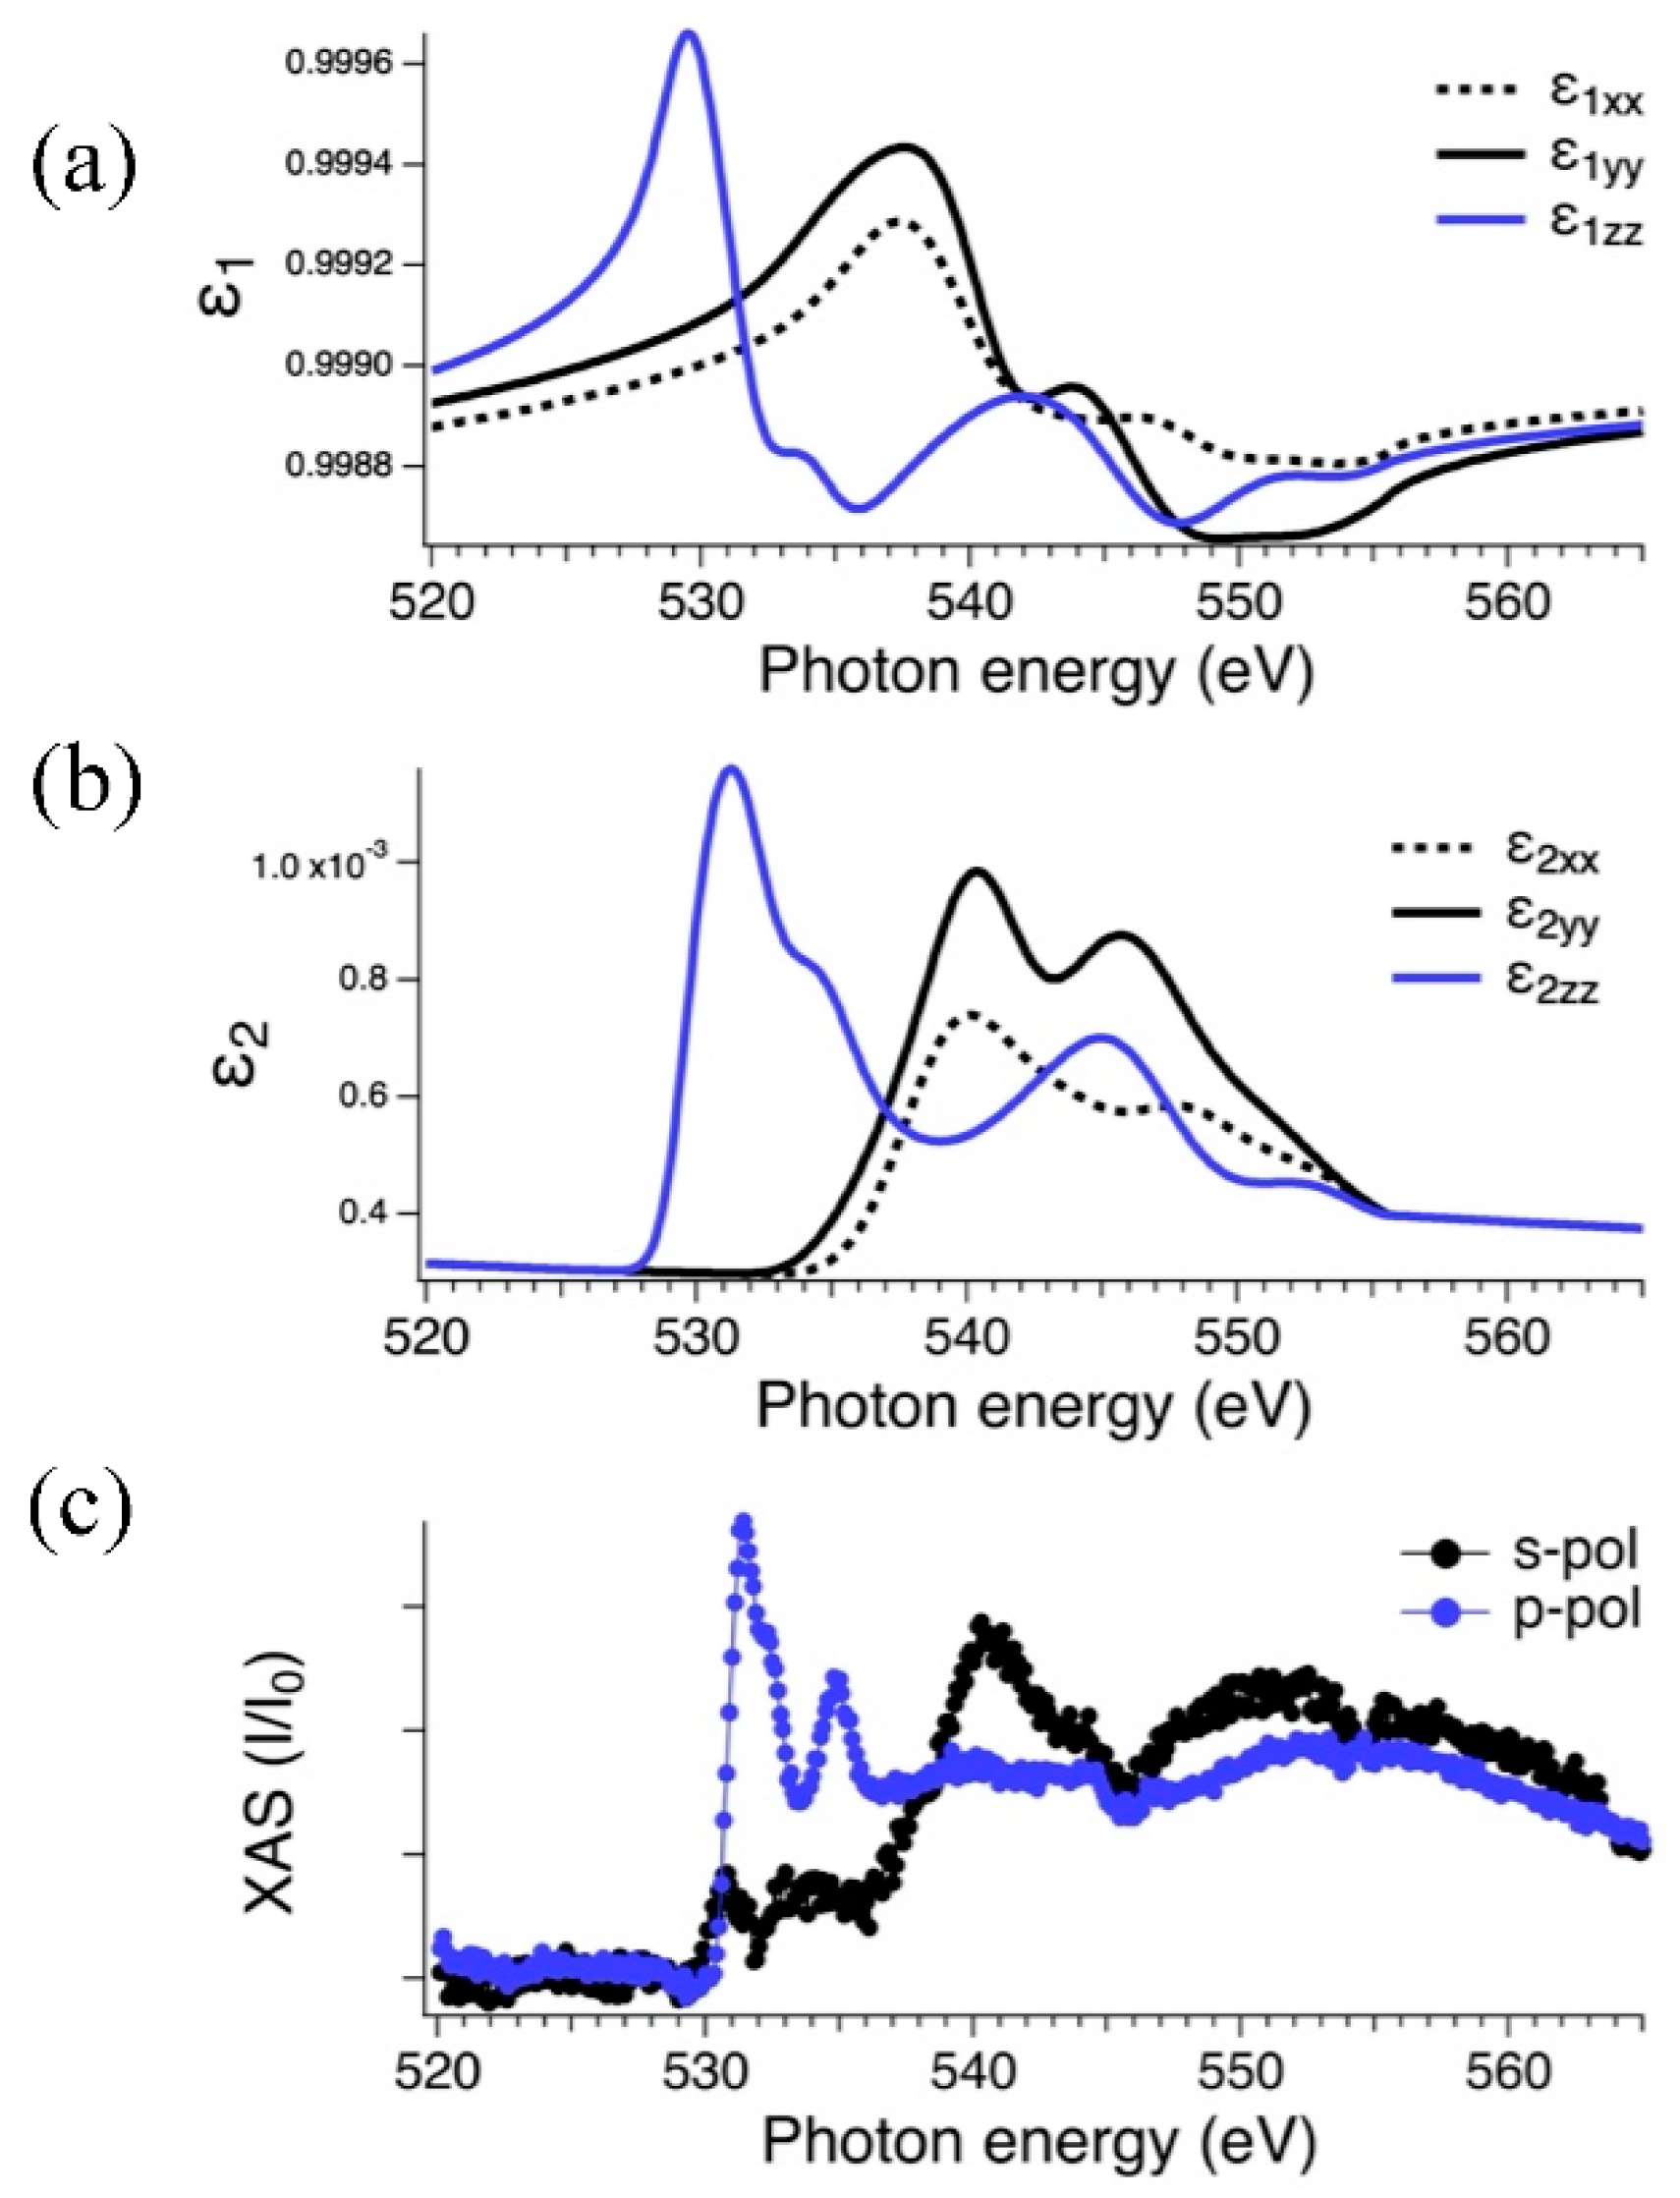
2.1. Evaluation of the Organic Film Dielectric Tensor in Correspndence of Absorption Resonances

The first step for the construction of the tensor is the calculation of the absorption cross-section of a single isolated molecule. This can be achieved thanks to density functional theoretical calculations (DFT), by computing electric dipole transitions along 3 mutually perpendicular directions that correspond to the main molecular axes. To calculate the dipole transition moments and oscillator strengths of a PTCDA-free molecule (Figure 1b), we used the code StoBe [17], applying the transition potential method [18]. The evaluation of the cross-sections along the molecular axes at the O K-edge follows closely what has been described in [6] for the C K-edge. The calculated absorption cross-sections are related to the imaginary part of the molecular scattering factors f2(ℏω) along the 3 axes, which are linked, well outside the edge, to the Henke tabulated values [19]. In doing this, the sum is considered of all contributions to f2(ℏω) of all the atomic constituents of the molecule (for PTCDA 24 C atoms, 6 O atoms, 8 H atoms), up to ℏω = 30,000 eV. The real part of the molecular scattering factors f1 is then evaluated through Kramers–Krönig (KK) integral transformations [6]. In the present case, this was achieved in practice by first constructing the odd functions f2_odd(ℏω), where f2_odd(ℏω) =f2(ℏω) and f2_odd(ℏω) = f2(ℏω), and then by calculating the Hilbert transforms of f2_odd(ℏω) on the domain from −30,000 to 30,000 eV, in steps of 0.1 eV. This procedure can be implemented straightforward in most software for data analysis (including Mathematica [20], Matlab [21], IgorPro [22]). The complex refractive index along the three principal axes is derived from f1(ℏω) and f2(ℏω):
n ˜ j = n 1 , j + i   n 2 , j = 1 r e 2 π λ 2 N ( f 1 , j i   f 2 , j )
where j = xm,ym,zm denotes the molecular axis index, re is the classical electron radius, λ is the light wavelength, and N is the density of the molecules. For PTCDA, we used a value of N = 1.37 × 10²¹ molecules/cm3 [6].
The complex dielectric constants along the main molecular axes are finally obtained:
ε ˜ j = ( n ˜ j ) 2 = ε 1 , j + i   ε 2 , j = ( n 1 , j 2 n 2 , j 2 ) + i   2 n 1 , j n 2 , j
The three dielectric constants are used to fabricate the dielectric tensor of the organic film, taking into account the possible geometrical organization of the molecules in the local environment around each molecule. In doing this, we neglect the interaction between the molecules, and we assume that the macroscopic optical properties are de facto determined by the optical properties of the single molecules and by their geometrical arrangement. This is a reasonable assumption in the soft X-ray regime, where absorption edges are mainly determined by the molecular properties and to a much less extent by solid-state effects. In the present case, it can be assumed that molecules organize in domains, in which molecules show parallel zm axes and an alternate herringbone arrangement in the xmym plane, with adjacent molecules laying nearly perpendicular to each other [23,24,25,26]. This can be described by a diagonal dielectric tensor of a film in which the xx and yy elements are taken as the azimuthal angular average (in the xmym plane) of ε ˜ x m and ε ˜ y m and the zz element is given by ε ˜ z m . This model is further supported by the fact that the beam footprint (higher than 100 μm2) in a reflectivity experiment is much larger than the domains and the experimental signal integrates over a large number of domains that are typically oriented following the threefold symmetry of the Au (111) substrate. In fact, on the (111) surface of Au, the PTCDA molecules are known to organize in equivalent threefold domains, oriented at 120° with respect to each other [23,24,25,27,28]. This results in an overall in-plane isotropy of the reflectivity, assuming that the scattered intensity from the different domains is added up incoherently. Therefore, the dielectric tensor of a PTCDA layer can be written as
ε P T C D A = ( ε ˜ x x 0 0 0 ε ˜ y y 0 0 0 ε ˜ z z ) ,   with   ε ˜ x x = ε ˜ y y
However, it is worth stressing that the method and the software we developed also permit one to handle dielectric tensors with non-vanishing off-diagonal elements (such as magnetic media, chiral, or distorted systems).

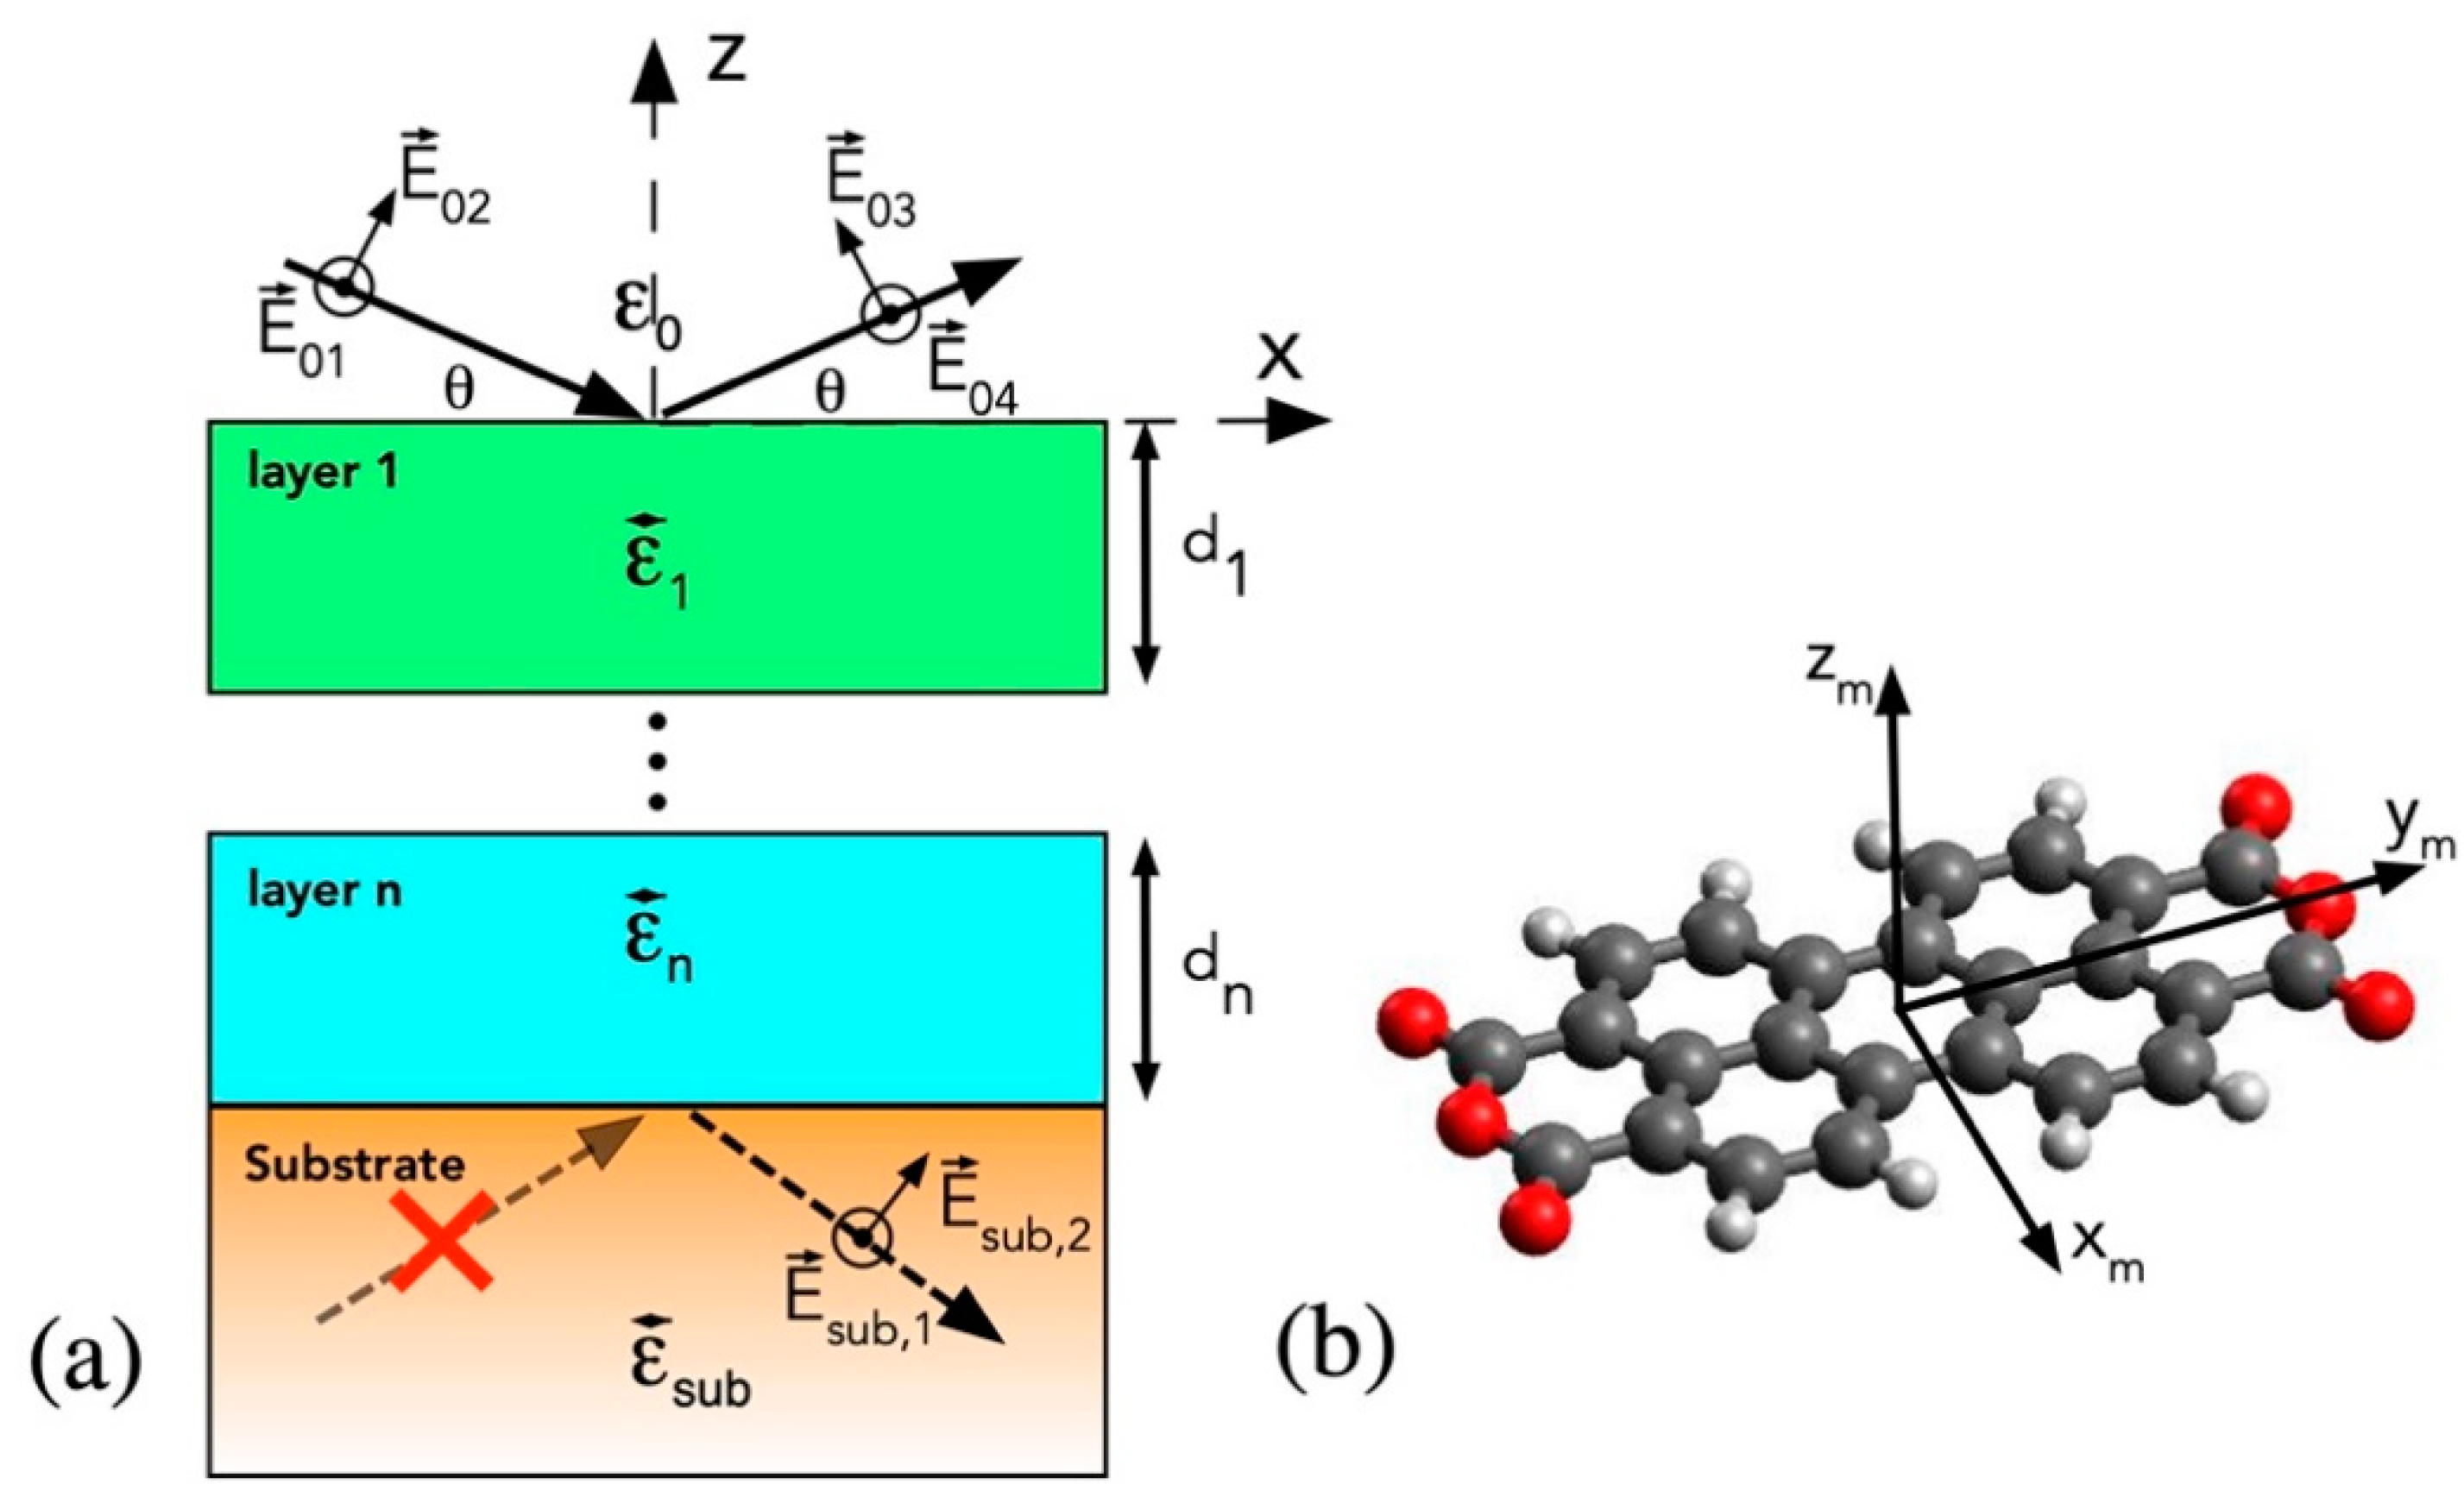
2.2. Calculation of Light Propagation in the Layered Medium

The system is treated as a sequence of layers labelled l, with l varying from 1 to n, each described by a dielectric tensor ε l and by a thickness dl. Layers are separated by flat planar and parallel interfaces. To describe a possible reorientation of the axes of each layer with respect to the x-, y-, and z-axes of the sample frame of reference (Figure 1a), we applied coordinate rotation matrices Rl in terms of the Euler angles ϕl, θl, ψl (describing a sequence of rotations around the z-x-z-axes) to the dielectric tensor so that the dielectric tensor becomes ε R l = R l ( ϕ l , θ l , ψ l ) ε R l R l 1 ( ϕ l , θ l , ψ l ) . Since Rl is orthogonal, the dielectric tensor in x-, y-, and z-coordinates must be symmetric (for non-magnetic systems). Eventually, if multiple domains with different orientations are present in each layer, an average over the possible orientation angles is also applied.
For each layer, the electric field is assumed to propagate as a plane wave E l e i ( k l · r ω t ) , and the wave equation in the momentum-frequency space yields [3,29,30]
k l × ( k l × E l ) + ω 2 μ 0 ε 0 ε R l E l = k l ( k l · E l ) k l 2 E l + ω 2 μ 0 ε 0 ε R l E l = 0
In the present case, the impinging wavevector k 0 (with k 0 2 = ω 2 μ 0 ε 0 ) is taken in the xz plane, so that, in the absence of roughness, assuming homogeneous layers in the xy plane with step-like potentials along z at each interface, in each layer k l = ( k l x , 0 , k l z ) . Moreover, k l x is conserved in the propagation through the layers and k l x = k 0 x . In matrix form, the wave equation then becomes
( k 0 2 ε R l x x k l z 2 k 0 2 ε R l x y k 0 2 ε R l x z + k 0 x k l z k 0 2 ε R l y x k 0 2 ε R l y y k 0 x 2 k l z 2 k 0 2 ε R l y z k 0 2 ε R l z x + k l z k 0 x k 0 2 ε R l z y k 0 2 ε R l z z k 0 x 2 ) ( E l x E l y E l z ) = 0 .
Non-zero solutions for E l exist if the determinant of the coefficient matrix is zero. The equation
d e t ( k 0 2 ε R l x x k l z 2 k 0 2 ε R l x y k 0 2 ε R l x z + k 0 x k l z k 0 2 ε R l y x k 0 2 ε R l y y k 0 x 2 k l z 2 k 0 2 ε R l y z k 0 2 ε R l z x + k l z k 0 x k 0 2 ε R l z y k 0 2 ε R l z z k 0 x 2 ) = 0
reduces to a 4th degree polynomial in k l z with complex coefficients. In practice, in our Matlab implementation, we directly computed the roots of this polynomial by the roots command, which calculates the roots of a polynomial by computing the eigenvalues of its companion matrix (see, e.g., https://it.mathworks.com/help/matlab/ref/roots.html). This leads to 4 complex solutions for the z-projection of the wavevector, k l z σ ( σ = 1 , 2 , 3 , 4 ) . These are grouped into 2 pairs, for wavevectors directed downwards ( σ = 1 , 2 ) and upwards ( σ = 3 , 4 ).
The four complex solutions of k l z σ are used, in turn, to solve relation (5), in order to obtain the 4 complex electric field unit vectors u ^ l σ associated to each of these wavevectors. This is because the amplitudes of the 4 fields are left undetermined by solving the homogeneous linear system represented by expression (5). Numerically, these electric field unit vectors, that is, the null-space of the coefficient matrix in (5), may be found applying singular value decomposition algorithms [20,21,22]. In this regard, we remark that we did not use the null command of Matlab, since roundoff errors may cause matrices to be considered nonsingular by the program (implying an empty null space). Instead, we explicitly employed the singular value decomposition by the svd command (which is based on the algorithms employed in LAPACK [31]) and appropriately selected the vector corresponding to the null space.
It should be noted that if the dielectric tensor is diagonal with equal components, which is the case for vacuum and isotropic media (i.e., the substrate), the k l z σ solutions are coincident in pairs (for σ = 1 , 2 and σ = 3 , 4 ) and the null-space is bidimensional, corresponding to the plane perpendicular to the propagation direction k ^ l σ . In this case, since any linear combination of the 2 degenerate propagation vectors is a solution, we are free to take u ^ l 1 and u ^ l 4 parallel to y ^ (perpendicular with the scattering plane) and u ^ l 2 and u ^ l 3 perpendicular to y ^ (parallel to the scattering plane). This is shown for vacuum in Figure 1a, where the 2 coincident incoming wavevectors relate to the 2 perpendicular E 01 (s-polarization) and E 02 (p-polarization) electric fields, while the 2 coincident outgoing wavevectors relate to E 03 and E 04 , laying in the scattering plane and perpendicular to it, respectively.
The total electric field in layer l is then given by a linear combination of the 4 solutions u ^ l σ , with
E l ( r , t ) = { σ = 1 4 C l σ u ^ l σ exp [ i k l z σ ( z z l ) ] } exp [ i ( k 0 x x ω t ) ]
where z l represents the bottom level of layer l and C l σ are the field amplitudes at z l (with z ( l 1 ) z z l ). The C l σ amplitudes have to be determined by imposing the continuity conditions of the fields at the interfaces. Without considering the exp ( i ( k 0 x x ω t ) ) factor, we can reduce expression (7) to
E l = σ = 1 4 C l σ u ^ l σ
at z = z l . This is valid for layers l = 0,…,n. The substrate is semi-infinite and therefore it is convenient to refer the amplitudes of the fields for the substrate to the interface with layer n, at z = z n . In this case, the field in the substrate becomes
E s u b ( r , t ) = { σ = 1 4 C s u b , σ u ^ s u b , σ exp [ i k s u b , z σ ( z n z ) ] } exp [ i ( k 0 x x ω t ) ]
with z z n .
In turn, the magnetic field in layer l is given by
H l ( r , t ) = ε 0 μ 0 1 | k 0 | { σ = 1 4 k l σ × C l σ u ^ l σ exp [ i k l z σ ( z z l ) ] } exp [ i ( k 0 x x ω t ) ]
with k l σ = ( k 0 x , 0 , k l z σ ) . At z = z l and without considering the factor exp ( i ( k 0 x x ω t ) ) , this is reduced to
H l = ε 0 μ 0 1 | k 0 | σ = 1 4 ( k l σ × C l σ u ^ l σ )
The magnetic field in the substrate, following the same considerations leading to expression (9), is given by
H s u b ( r , t ) = ε 0 μ 0 1 | k 0 | { σ = 1 4 k s u b , σ × C s u b , σ u ^ s u b , σ exp [ i k s u b , z σ ( z n z ) ] } exp [ i ( k 0 x x ω t ) ]
The continuity for the electric and magnetic fields E l x ,   E l y ,   H l x ,   H l y between layers l and ( l 1 ) yields
σ = 1 4 C ( l 1 ) σ u ^ ( l 1 ) σ · x ^ = σ = 1 4 C l σ u ^ l σ · x ^   exp ( i k l z σ d l ) σ = 1 4 C ( l 1 ) σ u ^ ( l 1 ) σ · y ^ = σ = 1 4 C l σ u ^ l σ · y ^   exp ( i k l z σ d l ) σ = 1 4 ( k ( l 1 ) σ × C ( l 1 ) σ u ^ ( l 1 ) σ ) · x ^ = σ = 1 4 ( k l σ × C l σ u ^ l σ ) · x ^   exp ( i k l z σ d l ) σ = 1 4 ( k ( l 1 ) σ × C ( l 1 ) σ u ^ ( l 1 ) σ ) · y ^ = σ = 1 4 ( k l σ × C l σ u ^ l σ ) · y ^   exp ( i k l z σ d l )
Exponentials in expression (13) account for the propagation of the fields trough layer l, from top interface with layer ( l 1 ) to the bottom interface of layer l. These relations can be compacted in a 4 × 4 projection matrix
P l = ( u ^ l 1 · x ^ u ^ l 2 · x ^ u ^ l 3 · x ^ u ^ l 4 · x ^ u ^ l 1 · y ^ u ^ l 2 · y ^ u ^ l 3 · y ^ u ^ l 4 · y ^ ( k l 1 × u ^ l 1 ) · x ^ ( k l 2 × u ^ l 2 ) · x ^ ( k l 3 × u ^ l 3 ) · x ^ ( k l 4 × u ^ l 4 ) · x ^ ( k l 1 × u ^ l 1 ) · y ^ ( k l 2 × u ^ l 2 ) · y ^ ( k l 3 × u ^ l 3 ) · y ^ ( k l 4 × u ^ l 4 ) · y ^ )
and a 4 × 4 transport matrix
T l = ( exp ( i k l z 1 d l ) 0 0 0 0 exp ( i k l z 2 d l ) 0 0 0 0 exp ( i k l z 3 d l ) 0 0 0 0 exp ( i k l z 4 d l ) ) ,  
so that the electric field amplitudes can be expressed as four-component vectors C l = ( C l 1 , C l 2 , C l 3 , C l 4 ) and
C ( l 1 ) = P ( l 1 ) 1 P l T l C l
This approach can be iterated to relate the fields in successive layers. For a system composed of n layers followed by a semi-infinite substrate,
C 0 = P 0 1 P 1 T 1 P 1 1 P 2 T 2 P ( n 1 ) 1 P n T n P n 1 P s u b C s u b = M C s u b where   M = P 0 1 P 1 T 1 P 1 1 P 2 T 2 P ( n 1 ) 1 P n T n P n 1 P s u b
It can be assumed that the electric fields coming upwards from the substrate are zero (Figure 1a), that is, C s u b 3 =   C s u b 4 = 0 , and that the impinging fields at the vacuum side are known ( C 0 1 and C 0 2 , with u ^ 0 1 and u ^ 0 2 corresponding to two orthogonal unit vectors parallel to y ^ and perpendicular to it, respectively). Equation (17) results in a linear system of 4 equations in 4 unknowns, the reflected fields C 0 3 and C 0 4 and the transmitted fields C s u b 1 and C s u b 2 . In this case the expression
C 0 = M C s u b   ( C 0 1 C 0 2 C 0 3 C 0 4 ) = ( M 11 M 12 M 13 M 14 M 21 M 22 M 23 M 24 M 31 M 32 M 33 M 34 M 41 M 42 M 43 M 44 )   ( C s u b 1 C s u b 2 0 0 )          
can be rewritten to obtain
( C 0 1 C 0 2 0 0 ) = ( M 11 M 12 0 0 M 21 M 22 0 0 M 31 M 32 1 0 M 41 M 42 0 1 )   ( C s u b 1 C s u b 2 C 0 3 C 0 4 )
The linear system (19) can be solved numerically, for instance, by the linsolve command of Matlab, which, for square matrices, uses LU factorization with partial pivoting (see, e.g., https://it.mathworks.com/help/matlab/ref/linsolve.html). Once the 4 unknown field amplitudes are determined, reflectivity is obtained through
R = | C 0 3 | 2 + | C 0 4 | 2 | C 0 1 | 2 + | C 0 2 | 2
which yields for s-polarization and p-polarization reflectivity
R s = ( | C 0 3 | 2 + | C 0 4 | 2 | C 0 1 | 2 ) C 0 2 = 0   and   R p = ( | C 0 3 | 2 + | C 0 4 | 2 | C 0 2 | 2 ) C 0 1 = 0
In analogy, in case that the substrate is vacuum, transmitted intensity from layer n yields
T = | C s u b 1 | 2 + | C s u b 2 | 2 | C 0 1 | 2 + | C 0 2 | 2

2.3. Experimental Methods

The X-ray absorption and reflectivity experiments were carried out at the IOM-CNR synchrotron BEAR beamline [32,33,34] at Elettra (Trieste, Italy). The Au(111) single crystal substrate (Mateck) was cleaned by repeated cycles of Ar+ sputtering (2 keV at grazing incidence for 10 min) and annealing (up to 450 °C for 20 min). Surface cleanliness was controlled by photoemission (by inspection of the Au valence band, C 1s and Au 4f core levels). The PTCDA molecules were evaporated in situ in ultra-high-vacuum (UHV), at a base pressure P = 1 × 10⁻⁹ mbar [6] from an home-made source, constituted by a tantalum pinhole source that was resistively heated at a temperature of 270 °C. An evaporation rate of 0.05–0.10 nm/min was used, which was monitored with a quartz microbalance. In particular, we focus here on a PTCDA film of 2 nm of nominal coverage, the same film studied in [6], to which the reader is addressed for further details. The specular reflectivity experiments were taken at a grazing incidence θ ≈ 8° in s- and p-polarization geometries. The photon energy was scanned across the O K-edge with a resolution of 0.2 eV, keeping fixed θ−2θ scattering conditions. The intensity of the direct (I0) and reflected (I) beams was measured with a photodiode (IRD SXUV-100) in separate scans. Possible beam instabilities were taken into account by acquiring the photocurrent drained by the last optical element of the beamline at the same time during I0 and I scans, just before the scattering chamber. The reflectivity was obtained by evaluating the ratio between I and I0, after each of the two signals was corrected (normalized) for its respective beam instabilities. The degree of linear light polarization was selected of the order of 0.9, obtained by accepting photons only from the central portion of the beam from the bending magnet, with an angular acceptance of ± 0.1 mrad with respect to the plane of the synchrotron orbit. In simulations, we assumed completely linear polarized light, as expressed by Equation (21) above. A Si window filter (thickness 0.1 µm) was placed in the beam before incidence on the sample to reduce diffuse light contribution. X-ray absorption spectra (XAS) were acquired simultaneously, along with reflectivity, in total electron yield mode, by measuring the drain current from the sample. The XAS spectra were normalized to the beam flux, measuring the total electron yield from a carbon- and oxygen-free Au sample in the same energy region of the O K-edge.

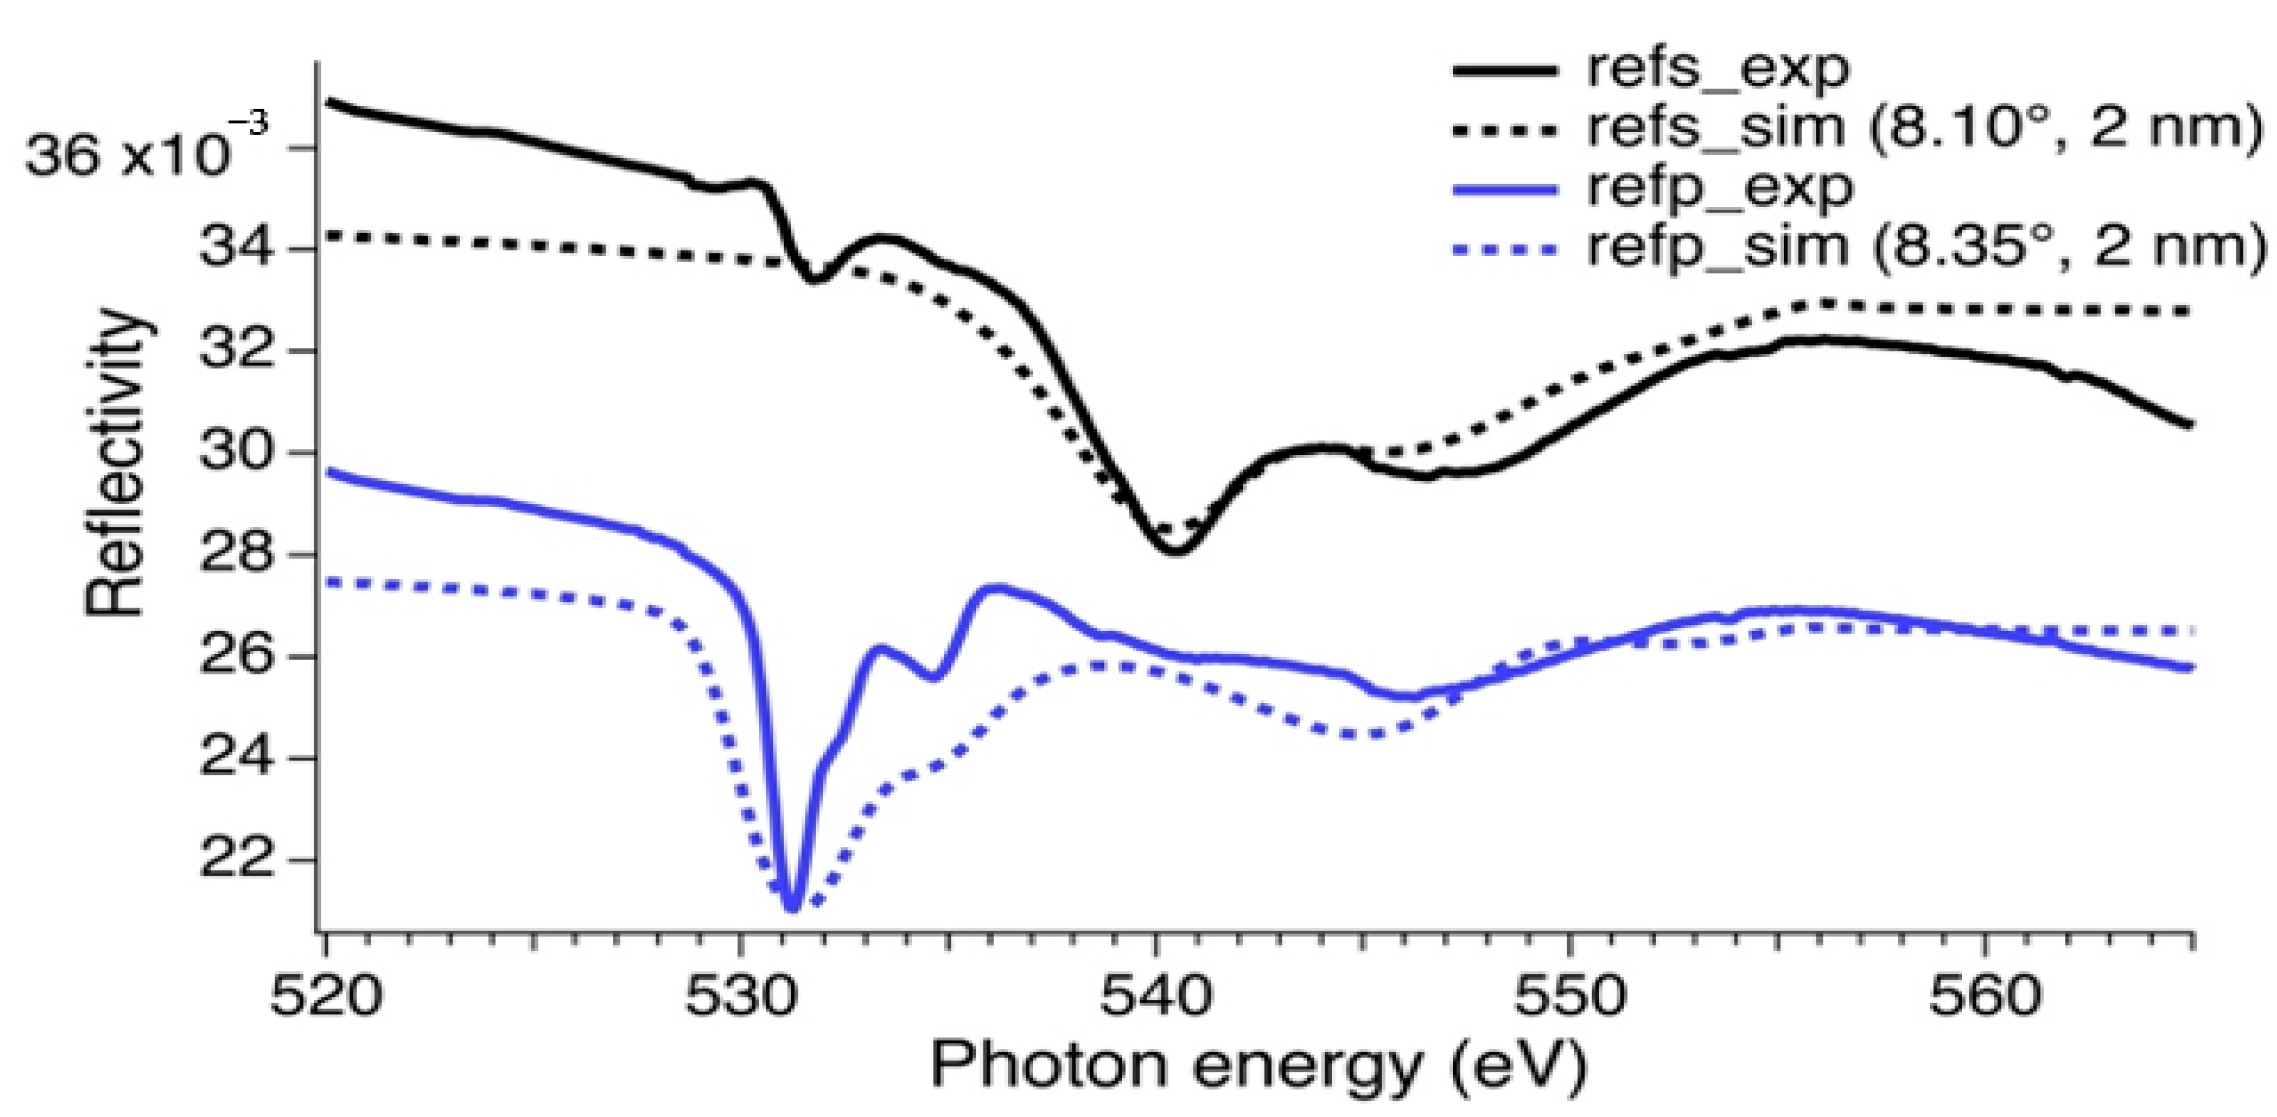
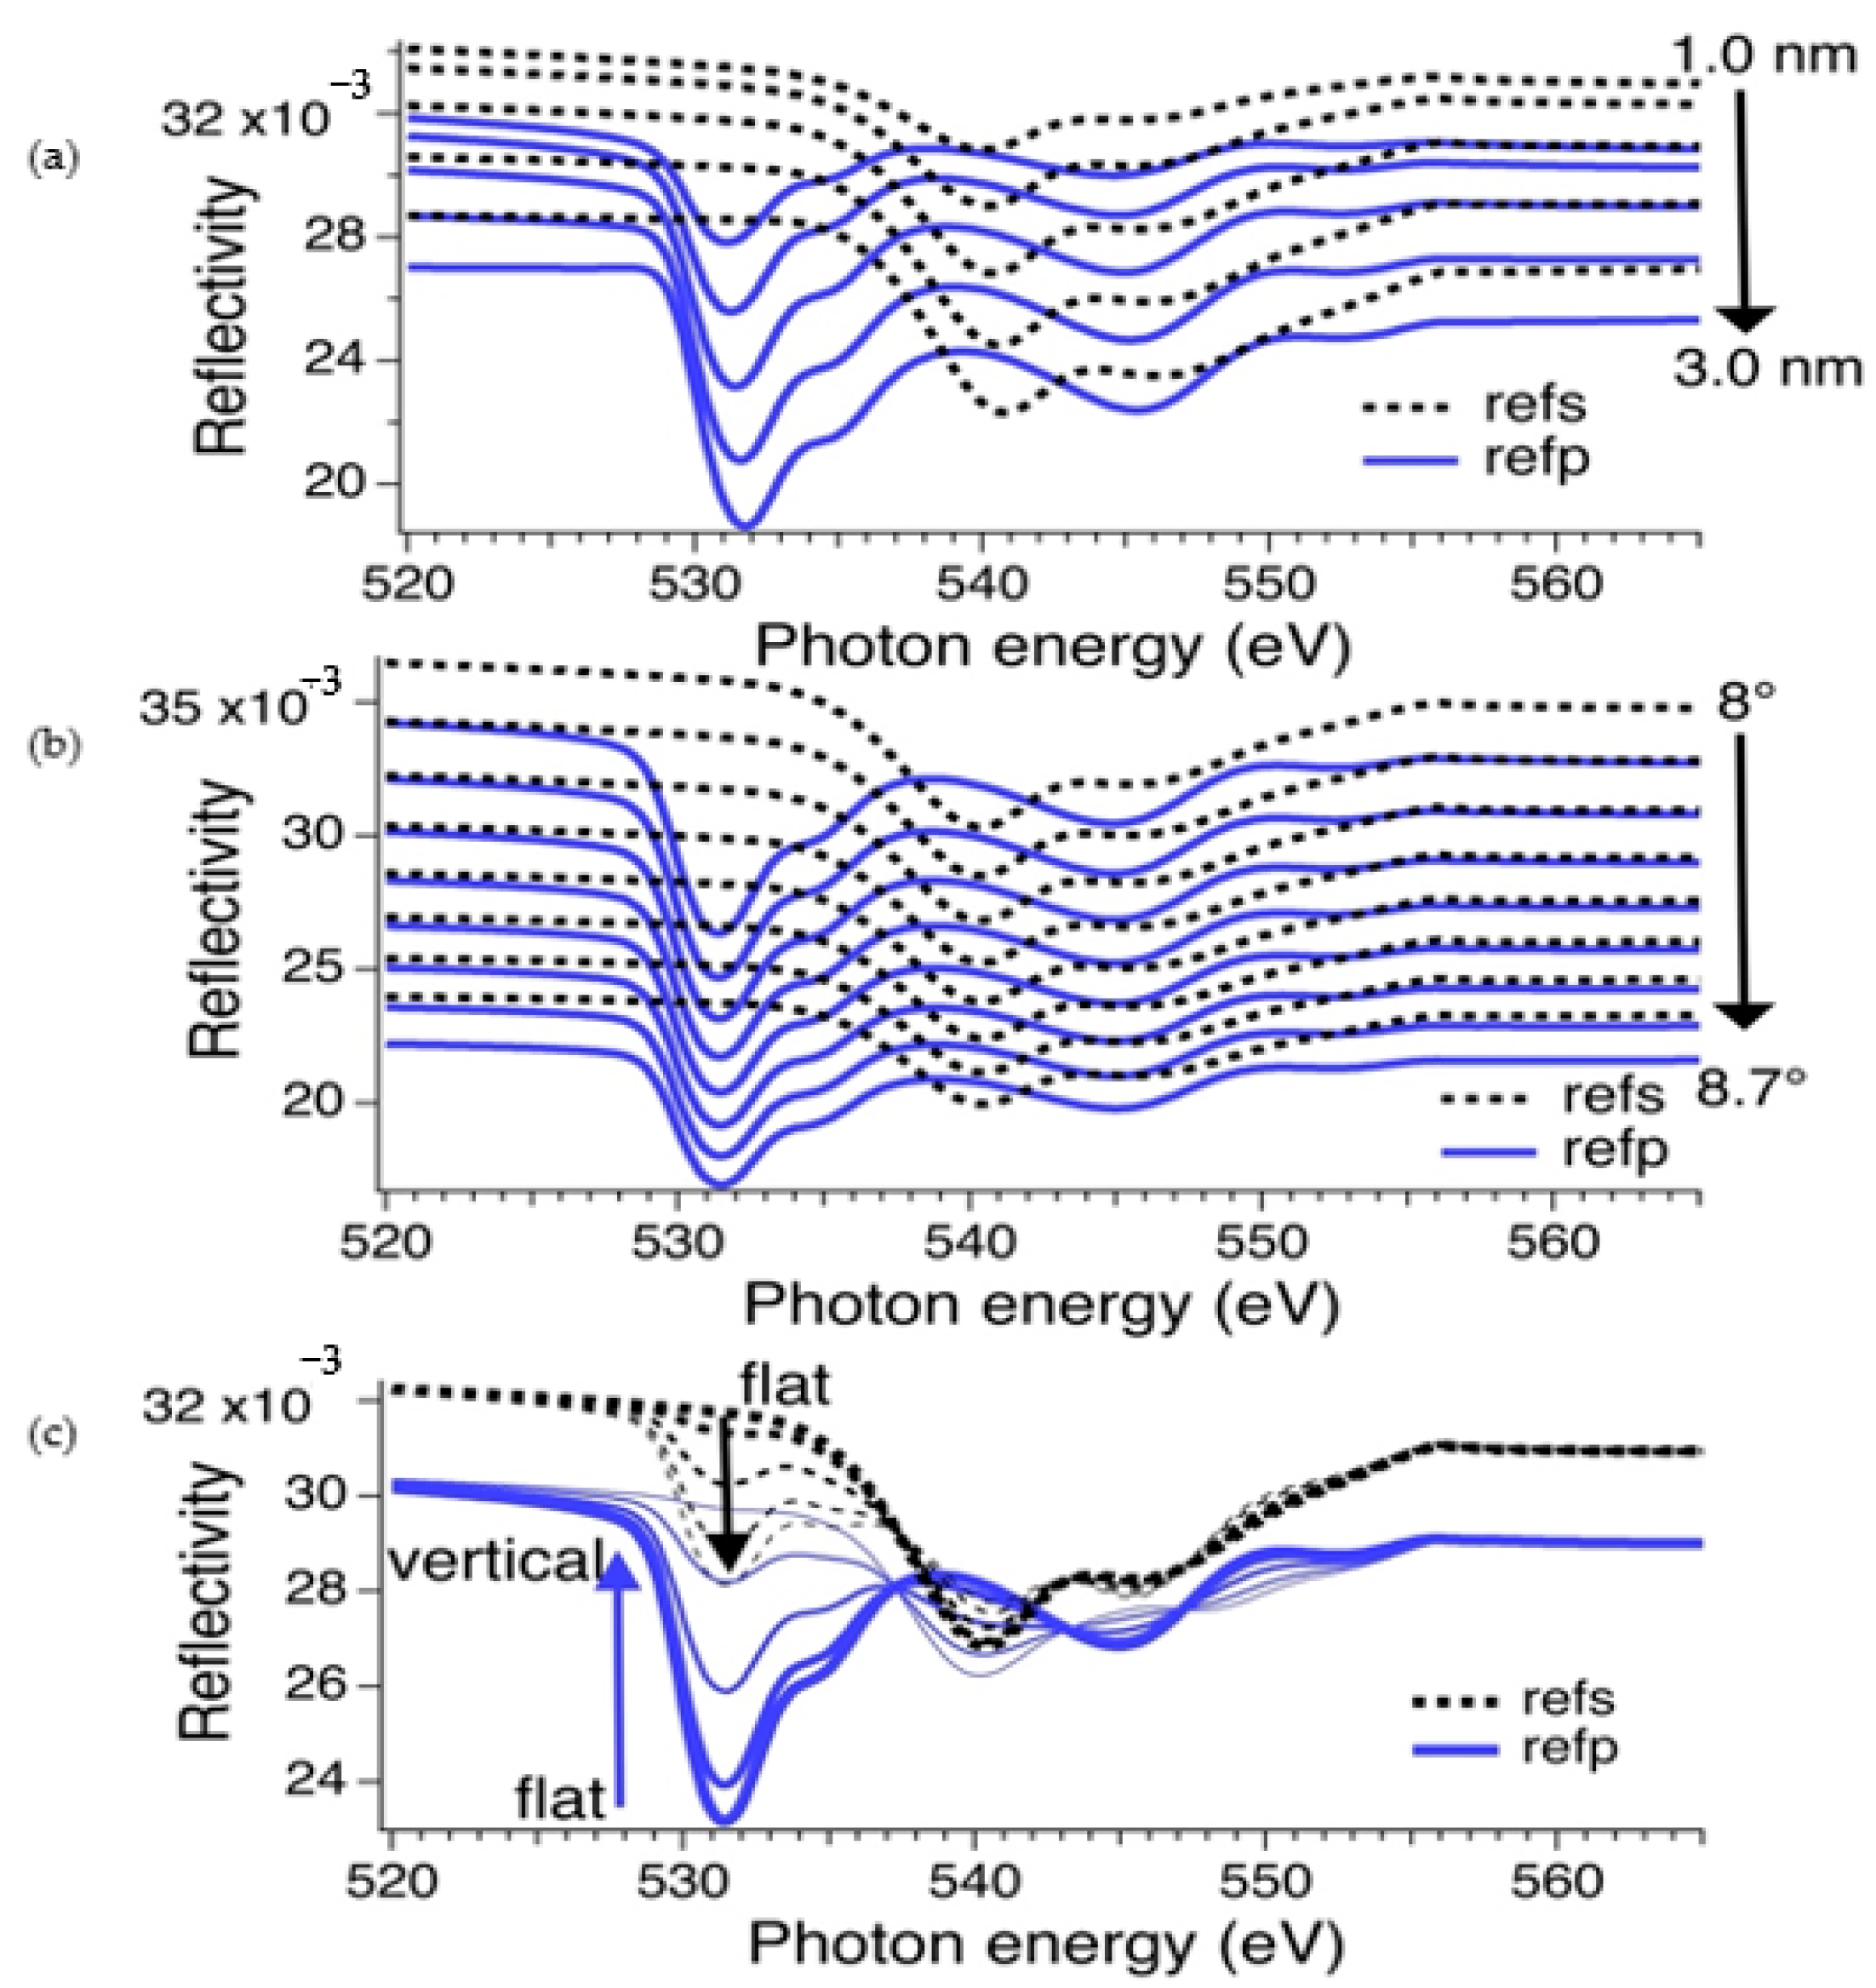
3. Results and Discussion

Carbon K-edge of PTCDA on Au(111) was investigated by our group in [6], where reflectivity was simulated as a function of different parameters, as film thickness, molecular orientation, and scattering geometry, and simulations were compared to the experimental result. Here, we followed the same scheme, focusing instead on the O K-edge. This is the first time we performed the analysis at this specific edge. This is noteworthy, since the higher the photon energy, the lower the reflectivity signal in absolute units, and the comparison between simulation and experiment may become more critical.
In Figure 2a,b, the calculated diagonal elements of the molecular film dielectric tensor are shown. This refers to the idealized case of molecules perfectly aligned to the x-, y-, and z-axes of the substrate. In Figure 2c, the experimental near-edge X-ray absorption signal is also shown, as taken on a film of 2 nm of nominal coverage in s- and p-light scattering geometries. It can be seen that all the main features of the experimental spectra are reproduced by calculations of ε 2 .
The first sharp and asymmetric resonant structure, particularly pronounced in p-polarization in Figure 2c, was associated to 1s → π* transitions involving carbonyl oxygen atoms (C=O). The second feature at about 535 eV was also ascribed to 1s → π* transitions from the bridging O atoms. Features above 538 eV, mainly pronounced in s-scattering, were related to 1s → σ* transitions [35,36].
The experimental reflectivity spectra taken in s- and p-scattering are shown in Figure 3 for the same film of 2 nm of nominal coverage. The experimental curves are compared to the results of simulations obtained for PTCDA films of 2 nm of coverage, considering a flat lying arrangement, a herringbone configuration in the xy plane, and threefold-oriented domains, due to the (111) symmetry of the substrate. Slightly different angles of incidence of the radiation had to be considered for s- and p-scattering for the best matching between experiment and theory. These findings are compatible and consistent with the results presented previously by us at the C K-edge [6]. The effective thickness evaluated at the O K-edge in particular nicely matched the nominal thickness. It is noteworthy that in order to reproduce the experimental reflectivity, we did not have to consider any roughness, suggesting that the films were particularly flat.
It can be further noticed that the experimental spectrum in s-polarization presented a small but sizable feature at about 531 eV in Figure 3, while this was not present in the simulation. This is also consistent with s-polarization NEXAFS shown in Figure 2c. We associate this to some possible degree of disorder. In principle, this effect can also be partially ascribed to the non-complete linear polarization of the incoming light.
To show the sensitivity of reflectivity to the variation of the scattering and film parameters, as we did for the C K-edge [6], we report in Figure 4 the effect of film thickness (a), the effect of the grazing incidence angle (b), and the effect of the tilt angle of the molecules (c), from flat laying to almost perpendicular configuration. These results clearly show the high sensitivity of the technique to the different parameters. While the change of the incidence angle affected the overall intensity of reflectivity, both at the edge and outside, the variation of the film thickness principally influenced the intensity of the O K-edge features. The variation of the tilt angle of the molecules instead showed the progressive rising of π* features in s-polarization together with their progressive attenuation in p-polarization, while opposite behavior occurred for σ* structures. As was apparent also at the C K-edge [6], the sensitivity to the variation of the tilt angle was less pronounced with respect to the other parameters. If PTCDA molecules were not lying completely flat, tilts below 10° would be difficult to discriminate from the comparison with the experiment. In the present case in particular, we did not associate the oscillation of the experimental spectrum at 531 eV in s-polarization (Figure 3) to the effect of the tilt in the whole film, as this would also affect p-polarization with a drastic decrease of the reflectivity dip at this same energy, which was not observed. Instead, we tended to associate this to some level of disorder, with some number of molecules adopting a more perpendicular orientation, and/or to the ellipticity of the photon, with the incoming beam not being completely linear polarized. This effect was mostly evident in s-polarization, because for perfectly flat lying molecules and perfectly linear polarization, this spectral region would otherwise give a flat, featureless signal.
In the present study, the surface and interface roughness were not taken into account. Although we believe that this was not relevant in the present case, the surface and interlayer roughness can play and important role, especially for thicker films and systems composed of multiple layers. It may be expected that roughness can affect the overall intensity but not the overall line-shape and relative intensities. The effect of roughness will be considered in further evolutions of our code.
In perspective, the matrix elements of the different optical transitions that are used to construct the dielectric tensor could also be parameterized to improve the fitting with the experiment and to single out the spectral regions where the optical properties deviate from that of free, noninteracting molecules. However, it is remarkable that in spite of the simplifications introduced in the procedure and of the lack of adjustable parameters in the evaluation of the molecular cross-sections, the experimental features were nicely reproduced by the simulation, even in absolute magnitude.

4. Conclusions

Reflectivity is a powerful tool that can give rich information on layered media, once accompanied by suitable simulations. The 4 × 4 matrix method described here can be applied in any spectral range and it is specifically conceived for anisotropic media and in correspondence of spectral resonances. The method was used in this work to interpret the experimental line-shape of grazing incidence reflectivity experiments carried out at the O K-edge of an organic ultra-thin film of PTCDA on Au(111). The simulated line-shape is based on ab initio calculation of the optical absorption of the PTCDA molecules, and, therefore, is not based on entry parameters either taken form experiments or phenomenological. At this stage, the interaction between the molecules or with the substrate are not taken into account. The good agreement that can be reached with the experiment indicates that for molecular films solid state effects have a minor influence on the overall line-shape with respect to film morphology, molecular orientation, and film thickness. At a grazing incidence of the order of 8°, the reflectivity at the O K-edge was of the order of 10−2, with oscillations in the 10−3 scale. In spite of this, high sub-nanometer sensitivity was obtained. The experimental spectra can be interpreted in terms of films of flat laying molecules, with the effective thickness obtained by simulations nicely corresponding with the nominal coverage. Small differences in the experimental spectra with respect to simulations were interpreted in terms of some level of disordered molecules, showing a more tilted alignment with respect to the rest of the film, and/or due to the effect of the non-complete linear polarization of the incoming photons.

Author Contributions

Conceptualization, L.P., A.V., L.S., N.M., and S.N.; methodology, L.P., N.M., A.V., and S.N.; software, L.P., N.M., F.M., M.B., and E.G.; formal analysis, L.P.; investigation, R.C., N.M., A.G., and L.P.; writing—original draft preparation, L.P.; writing—review and editing, all authors. All authors have read and agreed to the published version of the manuscript.

Funding

The experiments were carried out in proposal 2012012 et Elettra. This research received no other external funding.

Institutional Review Board Statement

Not applicable.

Informed Consent Statement

Not applicable.

Data Availability Statement

The data presented in this study are available free of charge from the corresponding author.

Acknowledgments

Subhrangsu Mukherjee is acknowledged for stimulating discussion and support during experiments. Bryan P. Doyle and Konstantin Koshmak are acknowledged for their support at the beamline in data acquisition and reduction.

Conflicts of Interest

The authors declare no conflict of interest. The funders had no role in the design of the study; in the collection, analyses, or interpretation of data; in the writing of the manuscript; or in the decision to publish the results.

References

  1. Tolan, M. X-ray Scattering from Soft-Matter Thin Films; Springer: Berlin/Heidelberg, Germany, 1999; ISBN 978-3-540-65182-6. [Google Scholar]
  2. Als-Nielsen, J.; McMorrow, D. Elements of Modern X-ray Physics, 2nd ed.; John Wiley & Sons Ltd.: Hoboken, NJ, USA, 2011; ISBN 9780470973950. [Google Scholar]
  3. Atwood, D. Soft X-rays and Extreme Ultraviolet Radiation; Cambridge University Press: Cambridge, UK, 1999. [Google Scholar]
  4. Berlasso, R.; Dallera, C.; Borgatti, F.; Vozzi, C.; Sansone, G.; Stagira, S.; Nisoli, M.; Ghiringhelli, G.; Villoresi, P.; Poletto, L.; et al. High-order laser harmonics and synchrotron study of transition metals M2,3 edges. Phys. Rev. B Condens. Matter Mater. Phys. 2006, 73, 115101. [Google Scholar] [CrossRef]
  5. Pasquali, L.; Mukherjee, S.; Terzi, F.; Giglia, A.; Mahne, N.; Koshmak, K.; Esaulov, V.; Toccafondi, C.; Canepa, M.; Nannarone, S. Structural and electronic properties of anisotropic ultrathin organic films from dichroic resonant soft X-ray reflectivity. Phys. Rev. B 2014, 89, 045401. [Google Scholar] [CrossRef]
  6. Capelli, R.; Mahne, N.; Koshmak, K.; Giglia, A.; Doyle, B.P.; Mukherjee, S.; Nannarone, S.; Pasquali, L. Quantitative resonant soft X-ray reflectivity of ultrathin anisotropic organic layers: Simulation and experiment of PTCDA on Au. J. Chem. Phys. 2016, 145, 024201. [Google Scholar] [CrossRef] [PubMed]
  7. Capelli, R.; Nardi, M.V.; Toccoli, T.; Verucchi, R.; Dinelli, F.; Gelsomini, C.; Koshmak, K.; Giglia, A.; Nannarone, S.; Pasquali, L. 3D reconstruction of pentacene structural organization in top-contact OTFTs via resonant soft X-ray reflectivity. Appl. Phys. Lett. 2018, 112, 031602. [Google Scholar] [CrossRef] [Green Version]
  8. Capelli, R.; Da Como, E.; Kociok-Köhn, G.; Fontanesi, C.; Verna, A.; Pasquali, L. Quantitative resonant soft X-ray reflectivity from an organic semiconductor single crystal. J. Chem. Phys. 2019, 150, 094707. [Google Scholar] [CrossRef]
  9. Chiarotti, G.; Del Signore, G.; Nannarone, S. Optical detection of surface states on cleaved (111) surfaces of Ge. Phys. Rev. Lett. 1968, 21, 1170–1172. [Google Scholar] [CrossRef]
  10. Nannarone, S.; Selci, S. Dielectric properties of the Si(111)2×1 surface: Optical constants and the energy-loss spectrum. Phys. Rev. B 1983, 28, 5930–5936. [Google Scholar] [CrossRef]
  11. Nannarone, S.; Chiaradia, P.; Ciccacci, F.; Memeo, R.; Sassaroli, P.; Selci, S.; Chiarotti, G. Surface states in Si(111)2×1 and Ge(111)2×1 by optical reflectivity. Solid State Commun. 1980, 33, 593–595. [Google Scholar] [CrossRef]
  12. Parratt, L.G. Surface Studies of Solids by Total Refiection of X-rays. Phys. Rev. 1954, 95, 359–369. [Google Scholar] [CrossRef]
  13. Bertrand, P.; Hermann, C.; Lampel, G.; Peretti, J.; Safarov, V.I. General analytical treatment of optics in layered structures: Application to magneto-optics. Phys. Rev. B 2001, 64, 235421. [Google Scholar] [CrossRef]
  14. Berreman, D.W. Optics in Stratified and Anisotropic Media: 4 × 4-Matrix Formulation. J. Opt. Soc. Am. 1972, 62, 502–510. [Google Scholar] [CrossRef]
  15. Yeh, P. Electromagnetic Propagation in Birefringent Layered Media. J. Opt. Soc. Am. 1979, 69, 742–756. [Google Scholar] [CrossRef]
  16. Yeh, P. Optics of anisotropic layered media: A new 4 × 4 matrix algebra. Surf. Sci. 1980, 96, 41–53. [Google Scholar] [CrossRef]
  17. Hermann, K.; Pettersson, L.G.M.; Casida, M.E.; Daul, C.; Goursot, A.; Koester, A.; Proynov, E.; St-Amant, A.; Salahub, D.R.; Carravetta, V.; et al. StoBe-deMon software Version 3.0 (2007). Available online: http://www.fhi-berlin.mpg.de/KHsoftware/StoBe/whatsnew.html (accessed on 2 January 2021).
  18. Triguero, L.; Pettersson, L.G.M.; Ågren, H. Calculations of near-edge X-ray-absorption spectra of gas-phase and chemisorbed molecules by means of density-functional and transition-potential theory. Phys. Rev. B 1998, 58, 8097–8110. [Google Scholar] [CrossRef] [Green Version]
  19. Henke, B.L.; Gullikson, E.M.; Davis, J.C. X-ray interactions: Photoabsorption, scattering, transmission, and reflection at E = 50–30000 eV, Z = 1-92. At. Data Nucl. Data Tables 1993, 54, 181–342. [Google Scholar] [CrossRef] [Green Version]
  20. Mathematica; Wolfram Research Inc.: Champaign, IL, USA, 2019.
  21. MATLAB; The Mathworks Inc.: Natick, MA, USA, 2020.
  22. Igor Pro; WaveMetrics: Lake Oswego, OR, USA, 2020.
  23. Chizhov, I.; Kahn, A.; Scoles, G. Initial growth of 3,4,9,10-perylenetetracarboxylic-dianhydride (PTCDA) on Au(111): A scanning tunneling microscopy study. J. Cryst. Growth 2000, 208, 449–458. [Google Scholar] [CrossRef]
  24. Mannsfeld, S.; Toerker, M.; Schmitz-Hübsch, T.; Sellam, F.; Fritz, T.; Leo, K. Combined LEED and STM study of PTCDA growth on reconstructed Au(111) and Au(100) single crystals. Org. Electron. 2001, 2, 121–134. [Google Scholar] [CrossRef]
  25. Nicoara, N.; Román, E.; Gómez-Rodríguez, J.M.; Martín-Gago, J.A.; Méndez, J. Scanning tunneling and photoemission spectroscopies at the PTCDA/Au(111) interface. Org. Electron. 2006, 7, 287–294. [Google Scholar] [CrossRef]
  26. Tautz, F.S. Structure and bonding of large aromatic molecules on noble metal surfaces: The example of PTCDA. Prog. Surf. Sci. 2007, 82, 479–520. [Google Scholar] [CrossRef]
  27. Gustafsson, J.B.; Moons, E.; Widstrand, S.M.; Gurnett, M.; Johansson, L.S.O. Thin PTCDA films on Si(001): Electronic structure. Surf. Sci. 2004, 572, 32–42. [Google Scholar] [CrossRef]
  28. Henze, S.K.M.; Bauer, O.; Lee, T.-L.; Sokolowski, M.; Tautz, F.S. Vertical bonding distances of PTCDA on Au(111) and Ag(111): Relation to the bonding type. Surf. Sci. 2007, 601, 1566–1573. [Google Scholar] [CrossRef]
  29. Yariv, A.; Yeh, P. Optical Waves in Crystals: Propagation and Control of Laser Radiation; Wiley-Interscience: New York, NY, USA, 1984. [Google Scholar]
  30. Clemmow, P.C. The Plane Wave Spectrum Representation of Electromagnetic Fields; Elsevier: Amsterdam, The Netherlands, 1966; ISBN 9780080131627. [Google Scholar]
  31. Anderson, E.; Bai, Z.; Bischof, C.; Blackford, L.S.; Demmel, J.; Dongarra, J.; Du Croz, J.; Greenbaum, A.; Hammarling, S.; McKenney, A.; et al. LAPACK Users’ Guide; Society for Industrial and Applied Mathematics: Philadelphia, PA, USA, 1999. [Google Scholar]
  32. Nannarone, S.; Borgatti, F.; DeLuisa, A.; Doyle, B.P.; Gazzadi, G.C.; Giglia, A.; Finetti, P.; Mahne, N.; Pasquali, L.; Pedio, M.; et al. The BEAR Beamline at Elettra. AIP Conf. Proc. 2004, 705, 450. [Google Scholar]
  33. Pasquali, L.; DeLuisa, A.; Nannarone, S. The UHV Experimental Chamber for Optical Measurements (Reflectivity and Absorption) and Angle Resolved Photoemission of the BEAR Beamline at ELETTRA. AIP Conf. Proc. 2004, 705, 1142. [Google Scholar]
  34. Available online: www.elettra.trieste.it/elettra-beamlines/bear.html (accessed on 2 January 2021).
  35. Cao, L.; Zhang, W.; Han, Y.; Chen, T.; Zheng, Z.; Wan, L.; Xu, F.; Ibrahim, K.; Qian, H.; Wang, J. Angular dependent NEXAFS study of the molecular orientation of PTCDA multilayers on Au (111) surface. Chin. Sci. Bull. 2011, 56, 3575–3577. [Google Scholar] [CrossRef] [Green Version]
  36. Schoell, A.; Zou, Y.; Huebner, D.; Urquhart, S.G.; Schmidt, T.; Fink, R.; Umbach, E. A comparison of fine structures in high-resolution X-ray-absorption spectra of various condensed organic molecules. J. Chem. Phys. 2005, 123, 044509. [Google Scholar] [CrossRef] [PubMed]
Figure 1. (a) Sketch of sequence of layers, each described by a complex dielectric tensor and a thickness dn. The layers are delimited by vacuum on top and by a semi-infinite substrate at the bottom, which is typically (but not necessarily) described by an isotropic material. A representation of the possible impinging and reflected electric fields are given, with xz being the scattering plane. E01 and E04 are the components of the fields parallel to the surface plane (perpendicular to the scattering plane—s-polarization for the incoming field), and E02 and E03 are the components of the fields laying in the scattering plane (p-polarization for the incoming field). (b) 3,4,9,10-Perylene-tetracarboxylic dianhydride (PTCDA) molecule with its principal axes.
Surfaces 04 00004 g001
Figure 2. Calculated real (a) and imaginary (b) parts of the molecular film dielectric tensor in correspondence of the O K-edge; experimental near-edge X-ray absorption (c) taken in s- and p-polarization scattering condition, with a grazing incidence of 8° on a film of 2 nm of nominal coverage of PTCDA on Au(111).
Surfaces 04 00004 g002
Figure 3. Experimental reflectivity (solid lines) measured at 8° of grazing incidence in s- and p-scattering geometries (labelled as refs and refp, respectively) compared with simulations (broken lines) obtained for a film of flat laying molecules of 2 nm of coverage.
Surfaces 04 00004 g003
Figure 4. Simulations of the variation of s- and p-reflectivity as a function of (a) thin thickness (in steps of 0.5 nm), with fixed grazing incidence of 8° and flat laying molecules; (b) grazing incidence angle (in steps of 0.1°), with fixed thickness of 2 nm and flat laying molecules; (c) tilt angle of the molecules with respect to flat alignment (in steps of 20°, from 0° to 80°), with fixed thickness of 2 nm and fixed grazing incidence of 8°.
Surfaces 04 00004 g004
Publisher’s Note: MDPI stays neutral with regard to jurisdictional claims in published maps and institutional affiliations.

