Electrochemical Behavior of Al–Al9Co2 Alloys in Sulfuric Acid


1
Laboratory of Applied Metallurgy, Department of Materials Science & Engineering, University of Ioannina, 45110 Ioannina, Greece
2
University Research Center of Ioannina (URCI)-Institute of Materials Science and Computing, 45110 Ioannina, Greece
*
Author to whom correspondence should be addressed.
Corros. Mater. Degrad. 2020, 1(2), 249-272; https://0-doi-org.brum.beds.ac.uk/10.3390/cmd1020012
Submission received: 25 June 2020
/
Revised: 29 July 2020
/
Accepted: 2 August 2020
/
Published: 5 August 2020
Abstract
:Al–Co alloys of various Co contents (2–20 wt.% Co) were fabricated by vacuum arc melting (VAM) with the scope to investigate the influence of cobalt on the microstructure and corrosion resistance of Al in 1 M H2SO4. The obtained microstructures were directional, consisting of Al9Co2 platelets (grown to coarse acicular plates as the Co content increased) uniformly dispersed in an Al-matrix. Alloying Al with Co did not decrease the rate of uniform corrosion of Al but it considerably increased its passivation ability. Moreover, all Al–Co alloys displayed lower uniform corrosion rate and notably higher passivation ability than market leading Al-alloys. The underlying mechanisms during anodic polarization in 1 M H2SO4 were identified and correlated with the microstructure. High Co content alloys (7–20 wt.% Co) presented superior passivation ability in 1 M H2SO4 as compared to the low Co content alloys.
1. Introduction
During the last decades, rapidly solidified (RS) or intensively cooled Al-alloys have attracted significant attention owing to improved properties, such as mechanical properties and corrosion resistance. More specifically, many works have reported that RS of Al-alloys has led to refined microstructures as compared to the conventionally cast counterparts [1,2,3], supersaturation of Al with transition metals (TM), alkaline earth metals or metalloids [1,2,4,5,6,7], formation of intermetallic compound (IC) phases (their morphology depending on the cooling rate and the content of the solute element in the alloys [1,2,4]), and formation of semi-crystalline or amorphous phases [8,9].
Although the processing and physical metallurgy of RS bulk Al-alloys have extensively been studied, their corrosion behavior is much less investigated. RS of Al-alloys is reported to lead to improved corrosion resistance, mainly due to microstructure refinement [10,11,12,13] (in terms of grain size [12] and IC dispersion [10,11,12]), microstructure homogeneity [11], reduction of the precipitate content [10,14], and supersaturation of Al with elements like Ti, Mn, Cr, Ni, Cu, Zr, and Nb [11,14,15]. However, the RS-due changes in the electrochemical characteristics of the constituent phases may negatively affect the corrosion resistance, as in the cases of supersaturation of Al with Zn [14,16], Mg and Fe [14].
Established knowledge on rapid solidification mainly addresses cooling rates higher than 104 K/s. Intensive cooling rates, as those employed in vacuum arc melting (10–150 K/s) have also been shown to lead to refined structures and non-equilibrium phenomena, such as formation of supersaturated phases, non-equilibrium transformations, and suppression of equilibrium phase diagram regimes [17,18]. Vacuum arc melting (VAM) has been employed to rapidly melt and solidify Al- and Co-based materials, such as Al alloys [19,20,21], Al [19,20], Co and Co-alloys [22,23,24]. and Co-aluminides [25,26].
Despite the high research interest in RS Al-TM systems, only few works refer to the Al–Co alloys, most likely owing to their limited application fields. Renewed interest in Al–Co alloys surfaced over the last decades mainly due to the development of non-equilibrium manufacturing processes [7], quasicrystals/complex metallic alloys (QC/CMAs), and metadislocations [27]. The good catalytic activity of the Al–Co system has also been recognized [28,29,30]. Most recently, Co has been emerged as a promising alloying element of Al in the additive manufacture field. In particular, Geng et al. [31] managed to improve the 3D-printability of aluminum by decorating the surface of Al with a small amount of high laser absorbing Co nanoparticles, through electroless plating of Al powder and 3D printing by laser powder bed fusion. Hung et al. [32] noted that Al–Co alloys synthesized by arc-melting and subjected to laser glazing can produce promising non-equilibrium microstructures with respect to hardness and lack of cracking.
Al–Co alloys have been manufactured by various techniques including melt spinning [7,33], gun quenching [7], wedge shape casting [34], vacuum arc melting [35,36], stir casting [35], powder metallurgy/sintering [35], mechanical alloying [37], and single crystal growth of CMA alloys in the Al–Co system from a melt using the Czochralski method [38].
Regarding the corrosion behavior of RS or intensively cooled Al–Co alloys, few dedicated works are available. In a series of works cited by Scully et al. [39], the corrosion properties of the Al–Co–Ce amorphous system (Co < 10 at%) have been evaluated; Co has been found responsible for large increases in open circuit and repassivation potential values. Lekatou et al. [35,40] reported that Al–7 wt.% Co and Al–32 wt.% Co, prepared by VAM, showed higher resistance to localized and uniform corrosion in aqueous NaCl, as compared to counterparts fabricated by stir casting and free sintering. The authors also claimed that Al–7 wt.% Co had a slightly higher corrosion resistance than Co-richer (≤20 wt.% Co) Al alloys, mostly owing to a dense distribution of fine Al9Co2 eutectic particles in the Al matrix [20]. It is worthwhile to note that Al–7 wt.% Co alloys (prepared by stir casting and VAM) exhibited notably higher resistance to sliding wear than market leading Al-alloys (Al1050, Al6060, Al7075-T6, A356) [40]. Palcut et al. [25,36] studied the corrosion behavior of VAM alloys totally composed of Co-aluminides (Al–(24–29) at% Co) in aqueous NaCl; they observed a galvanic effect between nobler and less noble aluminides that led to pitting. They also reported a higher corrosion resistance for Z–Al3Co as compared to Al5Co2, attributing it to the high structural complexity of Z–Al3Co [26]. Bakoulis et al. [41] prepared Al–Al9Co2 composites (2–10 vol.% Al9Co2) by powder metallurgy; they noted that the localized corrosion resistance and sliding wear resistance increased with Al9Co2 volume fraction increasing.
Considering: (a) The highest corrosion resistance exhibited by Al–7 wt.% Co amongst Co-richer alloys in 3.5 wt.% NaCl [20], (b) the marked improvement of the sliding wear behavior of Al by the addition of 7 wt.% Co [40], (c) the relatively high cost of Co, and (d) the decrease in ductility when increasing the amount of the brittle Co-aluminides in the Al–Co alloys, the present work aims at identifying low enough Co additions in Al that can result in a notable improvement of the electrochemical behavior of Al, whilst at the same time keeping costs and ductility at satisfactorily low levels. Taking into account that H2SO4 is not only the largest single product of the chemical industry, but also a common electrolyte for the anodization of Al-alloys, the present study deals with the evaluation and analysis of the electrochemical performance of a wide range of Al–Co alloys (2–20 wt.% Co) in 1 M H2SO4 and its correlation with their microstructural features.
2. Materials and Methods
Al–Co alloys (2, 5, 7, 10, 15, 20 wt.% Co) were prepared by VAM of mixtures of commercially pure powders (99.5% purity) of Al (−325 mesh) and Co (−400 mesh). Approximately 4 g of the desired powder mixture were put into the water-jacket cooled copper hearth of a VAM furnace. The furnace chamber was closed, brought to a low vacuum, and then backfilled with 99.99% pure Ar. The electric arc was created with the aid of a tungsten electrode (DC current of 120 A). A homogeneous chemical composition was ensured by three-time re-melting of each specimen. Solidified meniscuses of 17–20 mm diameter and 8–10 mm height were finally received.
Cross-sectioned surfaces of as-solidified meniscuses, ground to 1000 grit, ultrasonically cleaned, and peripherally masked by PTFE (so that a surface area of approximately 1 cm2 was left free to be exposed to the electrolyte), were subjected to potentiodynamic polarization in naturally aerated 1 M H2SO4 at 25 °C. The ACM Gill AC potentiostat/galvanostat (ACM Instruments, Cumbria, UK), connected to a standard three-cell configuration (Ag/AgCl/3.5KCl as the reference electrode, Pt-gauge as the counter electrode), was employed. After the determination of the steady state/open circuit potential (4 h immersion in the electrolyte), potentiodynamic polarization was conducted at the scan rate of 10 mV/min. The Tafel extrapolation method was used to determine the corrosion current density values. The Tafel region was extrapolated to the corrosion potential by linear regression analysis of the potential against the logarithm of the current density data (the least squares approach was used). Fair accuracy was ensured by complying with a number of restrictions, analytically reported in a previous work [42]. In summary: (a) The scan rate employed should be low enough to diminish the contribution of the current generated for charging the surface capacitance to the current generated from the electrochemical reactions; (b) a well-defined Tafel region should extend over at least one decade of current density to minimize any deviation due to concentration polarization and other extraneous effects; (c) the linear regression should be started at relatively large overpotentials (in the present case: 70–80 mV away from the corrosion potential), so as to minimize any likely deviation from the Tafel-like behavior at low current density values due to the influence of the anodic reaction on the cathodic reaction and vice-versa; (d) the linear fit would be considered acceptable only if it corresponded to a regression coefficient greater than 0.98; (e) only one reduction process should occur in the range of the linear fit (in the case of 1 M H2SO4, the reduction of hydrogen); and (f) if a region with linearity holding for at least one decade of current density existed only in the one of the two portions of the polarization curve, then the Tafel extrapolation should only be performed at this portion. Often, anodic polarization induces concentration effects and surface roughening that cause deviations from the linearity in the Tafel region.
Cyclic potentiodynamic polarization was adopted to investigate the resistance to localized corrosion. One of the main principles of this technique is that localized corrosion in the form of pitting or crevice corrosion would occur if the current density of the anodic curve of the reverse scan is greater than the current density of the forward scan at the same anodic potential. In that case, the so-called “negative hysteresis” results (more details can be sought in the works of Silverman [43] and Beavers et al. [44]). Chronoamperometry in aerated 1 M H2SO4 was performed to investigate the progress of surface film formation and its stability.
The microstructural states of the alloys, as fabricated and after the corrosion experiments, were studied by scanning electron microscopy (SEM) under secondary electron (SE) and backscattered electron composition (BEC) modes at the EOL JSM 6510 LV SEM (JEOL, Tokyo, Japan) system equipped with an Oxford Instruments X-Act energy dispersive X-ray (EDX) analyzer (Oxford Instruments, Abington, Oxfordshire, UK).
The second-phase volume fraction was estimated on polished cross-sections (×100, ×500) using the “Image J” image analysis software (2.0.0-rc-33 version). At least 10 measurements from different fields of view (SEM-SE) were conducted to extract the mean value. Image analysis was performed by thresholding the second phase in the field of view. Raman Spectroscopy at the Labram HR—HORIBA Scientific Raman system (HORIBA, Kyoto, Japan) was employed to clarify the nature of the corrosion products. The 514.5 nm line of an argon ion laser (laser power: 12 mW, power incident on the specimen surface: 2 mW, focused spot diameter: ~1 μm) was used for the Raman excitation.
3. Results and Discussion
3.1. Microstructural Analysis
The microstructures of the produced Al–Co alloys are presented in Figure 1. A detailed microstructural analysis in context with the solidification mechanisms is reported elsewhere [20]. All alloys are composed of αAl and Al9Co2, as has been identified by EDX and XRD analysis [20]. The volume fractions of the Al9Co2 phase in Al–2Co, Al–5Co, Al–7Co, Al–10Co, Al–15Co, and Al–20Co (wt.%), have been determined (by image analysis) as 19 ± 2, 30 ± 2, 36 ± 3, 41 ± 1, 50 ± 1, and 63 ± 1 vol.%, respectively. Despite the negligible solid solubility limit of Co in Al under equilibrium conditions [45], notably higher concentrations of Co have been detected within the Al-matrix that increase with Co content. They range from max 0.49 wt.% in Al–5Co to max 5.51 wt.% in Al–20Co [20]. The supersaturation of the Al-matrix with Co has been caused by the fast solidification that stretched out the solid solubility limit of Co in Al.
Although all the compositions are hypereutectic [45], primary Al9Co2 is hardly discerned in the low Co (2, 5, 7, 10 wt. % Co) microstructures. The almost entirely eutectic morphologies suggest the suppression of the pre-eutectic stage due to rapid cooling. Figure 1a–d manifests that fine plates of Al9Co2 are distributed in the Al-matrix in a uniform and directional pattern, the outcome of preferential heat extraction [40]. In the microstructures of Al–(2–10) wt.% Co, relatively coarse stripes of bright contrast are observed to delimit the boundaries of elongated colonies. These colonies include fine dispersions of Al9Co2 eutectic platelets. In the case of Al–2 wt.% Co, this dispersion is very fine, dense and uniform. This morphology is considered to be the outcome of the high cooling rates, in the following way: At the beginning of solidification, an Al9Co2 stripe is formed. Due to the high cooling rate, there is not enough time for further crystal growth, since atomic diffusion to the surface of the existing crystal is constrained. To continue their growth, the crystals must develop along new directions that are easy for an effective atom capture. These preferential directions can be screw dislocations, the density of which increases with cooling rate [46,47]. Amongst the examined alloys, Al–2 wt.% Co has the highest solidification rate, owing to the lowest content of Co.
As far as Al–15 wt.% Co is concerned, planar Al9Co2 is discerned along with the eutectic Al9Co2/Al microconstituent (Figure 1e). In Figure 1b–e, it is observed that the Al9Co2 eutectic stripes are not continuous but they comprise small building units with a directional alignment. Such directional but interrupted growth has been observed in various types of arc-melted in-situ composite materials [46,48]. It has been attributed to the different cooling rates. When solidification starts, the cooling rate is high enough to cause the formation of a continuous Al9Co2 stripe. With the progress of solidification, the cooling rate decreases and the remaining liquid around the stripe becomes impoverished in Co. Such impoverishment interrupts the mode of continuous growth resulting in a brick-like pattern.
The predominant microstructural feature of Al–20 wt.% Co is that of coarse Al9Co2 plates with acicular acmes (Figure 1f). This morphology suggests an extensive presence of primary Al9Co2, which is attributed to the much lower thermal conductivity of Al9Co2 as compared to Al (Al9Co2, as a complex metallic alloy, has very low conductivity [49]). Hence, the cooling rate of Al9Co2 is much lower than that of Al, allowing the crystallization and development of coarse pre-eutectic Al9Co2. The above considerations can justify the observed increase in the amount of coarse acicular Al9Co2 plates and the corresponding decrease in the fraction of fine Al9Co2 eutectics, with Co content increasing.
3.2. Electrochemical Performance in 1 M H2SO4
3.2.1. Cyclic Polarization
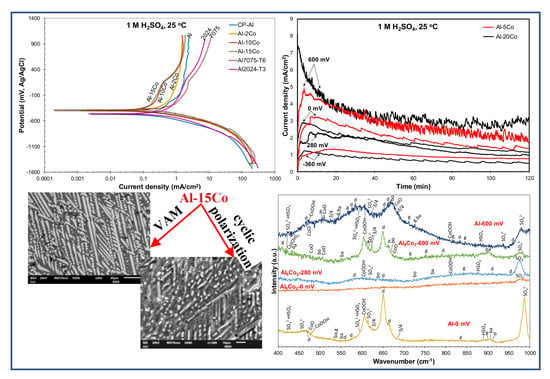
Figure 2a–c presents the potentiodynamic polarization curves of the Al–Co alloys and commercially pure (CP-Al) prepared by VAM, in 1 M H2SO4 at 25 °C. Cyclic and forward voltammograms are illustrated in Figure 2a,b, respectively. The voltammograms of two leading commercial Al-alloys (Al2024-T3, Al7075-T6), widely used in the aviation and military industries, are included in Figure 2c for comparison. Table 1 lists critical electrochemical values drawn from the polarization curves. Table 2 lists the data extracted from the Tafel extrapolation on the cathodic polarization curves. Figure 3 shows the microstructural state of the alloys after cyclic polarization in 1 M H2SO4 (surface and cross-section views).
At a first glance, Figure 2 and Table 1 and Table 2 show that the differences in the electrochemical behavior of the Al–Co alloys are small. Steep changes in the current density trends define distinct stages on the forward anodic portions of the polarization curves, noted in Figure 2b. However, on a closer observation, the alloys are classified into two groups on the basis of their anodic polarization behavior, namely:
Al–(2–5) wt.% Co: Stage 1 is due to the active corrosion of the (Al) phase, since Al is more active than Al9Co2 [35]. Electrolyte penetration through the defects of the Al-surface film (existing after 4 h of immersion under open-circuit [50]) has taken place during stage 1. The defects can be the Al9Co2/(Al) interfaces and/or (Al)-grain boundaries where AlFeSi intermetallics reside [40]. Hydrogen evolution during the preceding cathodic polarization may also have caused damage to the surface film existing at Ecorr [51,52]. More specifically, stage 1 is governed by ionic migration across the pre-existent surface film [53].
Passive-like stage 2 follows, extending for over 1000 mV (actually, no depassivation has taken place during the forward anodic scan). In the case of the Al-matrix, passivation reportedly occurs by film growth at the metal/film interface, with direct ejection of Al3+ to the film–electrolyte interface [53]. The relatively high values of current density (i > 0.1 mA/cm2) suggest pseudopassivation. The pseudopassivation of Al is justified by the formation of a film that is soluble in the outer layers [54].
The positive hysteresis loop through stage 2 (Figure 2a) indicates the efficient protectivity of the surface film (although the film on the Al-matrix is soluble at the oxide/electrolyte interface, it has a barrier effect at the metal/oxide interface [54].) However, the hysteresis turns to negative, sectioning the forward anodic scan at potentials just a couple of decades lower than the critical passivation potential (Ecp). As a consequence, Ea/c tr is less noble than Ecorr by a few decades of mVs, indicating a slightly less noble surface at Ea/c tr (upon reverse polarization) than that at Ecorr (upon forward polarization).
Al–(7–20) wt.% Co: Stage 1 corresponds to the selective dissolution of (Al), seen in Figure 3b–d. Stage 1 is followed by a passive-like stage (stage 2) extending for a potential range (Eb1 − Ecp1) of 385 to 432 mV. Unlike the low Co compositions, an increase in current density follows (stage 3), eventually leading to passive-like stage 4. The high slope of the E vs. log(i) curve during stage 3 along with the positive hysteresis upon reverse polarization through stage 3 (Figure 2a) suggest that this stage is owing to the occurrence of an oxidation process rather than a localized degradation process (the processes causing stages 3 and 4 are attempted to be clarified by chronoamperometry testing in 3.2.2). In the 25% of all the tested specimens (7–20 wt.% Co), hysteresis has remained positive through the whole reverse anodic scan resulting in an anodic-to-cathodic transition potential that is nobler than the corrosion potential by several hundred mVs (Figure 2a). The latter indicates that the surface at Ea/c tr (return scan) is nobler than the surface at Ecorr (forward scan).
In 75% of all the tested specimens (7–20 wt.% Co), the reverse polarization curves presented multiple anodic-to-cathodic transition potentials (“cathodic loop”), usually forming “spikes”, and positive hysteresis through essentially the whole reverse scan, as illustrated in Figure 4. These multiple (2–3, commonly 3) anodic-to-cathodic transition potentials correspond to the intersection points of the anodic and cathodic Evans lines and they are often observed in the reverse polarization scans in the absence of pitting [55]. Their origin is attributed to the shift of the return anodic line towards smaller current densities as compared to the forward ones due to the formation of passive films during the preceding forward anodic scanning. Hence, during reverse scanning, the unchanged cathodic line intersects the reverse anodic line at more than one intersection points [55]. Therefore, a non-susceptibility to localized corrosion is suggested. Table 1 includes the values of the uppermost and lowermost anodic-to-cathodic potentials, since these are considered the most stable ones [55]. A third of the Al–(2–5) wt.% Co tested specimens and a quarter of the CP-Al tested specimens also presented a cathodic loop. Usually, one of the two Ea/c tr potentials corresponded to the formation of a short and relatively blunt protrusion (a “nose” rather than a “spike”), as the one shown in Figure 4 (Al–5wt.% Co).
Figure 2a and Figure 4 show that the reverse cathodic currents are slightly lower than the forward cathodic currents, indicating a cathodic inhibition mechanism reportedly based on the adsorption of hydrous aluminum sulfate macromolecules to active sites on cathodic zones [51] (the adsorption of sulfates, also occurring on anodic sites, will be discussed in Section 3.2.2).
The effective protectivity of the surface film suggested by cyclic polarization is manifested by the good surface state of the Al–Co alloys in the SEM micrographs of Figure 3 (both surface view and cross-section view). Figure 3a–d also shows that the lower the Co content, and hence, the finer the Al9Co2 particles, the better defined the “cellular” morphology of the surface film. At 5 wt.% Co (Figure 3a), the film “cells” present a surface morphology resembling the well-defined hexagonal cells of the films on pure Al [53]. As the Co content increases, the cell diameter becomes smaller and is confined between the plates of Al9Co2. A closer observation of Figure 3d reveals a similar “cellular” morphology on the Al9Co2 plates.
3.2.2. Chronoamperometry
Figure 5 illustrates the chronoamperometry plots of a low Co-containing alloy (Al–5 wt.% Co) and a high Co-containing alloy (Al–20 wt.% Co) at potentials corresponding to different corrosion states (active (stage 1), passive-like (stage 2), transition (stage 3), and passive-like (stage 4)). In the case of polarization at a potential in stage 1 (−360 mV vs. Ag/AgCl), the initial rapid increase in the current density is followed by a gradual decrease in the rate of current density increase. Eventually, the current density is stabilized. The above trend signifies an active dissolution process gradually weakening due to the gradual reduction of the available active surface and/or surface deposition of corrosion products.
Al–5 wt.% Co: The current density vs. time curves of Al–5 wt.% Co at two potentials in stage 2 (a potential in the low range of “passive” potentials (0 mV vs. Ag/AgCl) and a potential in the high range of “passive” potentials (600 mV vs. Ag/AgCl)) present trends of passive-like behavior in agreement with the potentiodynamic polarization findings. More specifically, the initial steep increase in the current density (notably steeper at 600 mV) reflects fast oxidation. The subsequent current decrease (faster at 600 mV) corresponds to the growth of surface films. Eventually, current stabilization is attained signifying the stabilization of the surface films in terms of thickness and extent (after ~95 min in the case of polarization at 0 mV vs. Ag/AgCl and ~70 min in the case of polarization at 600 mV vs. Ag/AgCl). However, the high values and the oscillations of the current density, especially at 600 mV vs. Ag/AgCl, imply unstable surface products and/or metastable pitting. Metastable pitting of Al at defective sites of the oxide film in Al immersed in pure H2SO4 under open circuit has been observed by Mercier et al. [50]. The surface film on Al exposed to aqueous H2SO4 dissolves in the outer zones (film/solution interface) that are composed of Al2O3 hydrates and transitory complexes of SO42−, whereas it reforms in the inner zones that are composed of barrier anhydrous alumina [50,54]. Hence, a dynamic equilibrium is established through the simultaneous formation and dissolution of the film. The outer surface film layers are responsible for the high currents recorded during chronoamperometry (Figure 5) and potentiodynamic polarization through stages 2 and 4 (Figure 2 and Figure 4). The anhydrous inner layer provides the protection shown by the positive hysteresis loop through the passive stages in Figure 2 and Figure 4.
Through the whole range of passive-like stage 2, the Al-matrix of Al–5 wt.% Co appears oxidized (Figure 6a, spectrum 31 and Figure 6b, spectrum 29). In the case of polarization at 0 mV vs. Ag/AgCl, the Al9Co2 phase has remained free of any oxidation signs (Figure 6a, spectrum 25); hence, it is shown that oxidation has taken place only on the surface of the Al-matrix. Instead, in the case of polarization at 600 mV vs. Ag/AgCl, oxygen is detected on the surface of the Al9Co2 particles (Figure 6b, spectrum 26). Therefore, as far as the low Co Al-alloys are concerned (2, 5 wt.% Co), it is drawn that passivation in the low range of anodic potentials is exclusively caused by the formation of an Al2O3-based film on the Al-matrix; at the high range of anodic potentials, passivation of Al9Co2 also takes place.
Al–20 wt.% Co: The polarization behavior of Al–20 wt.% Co at 0 mV vs. Ag/AgCl (stage 2) and 600 mV vs. Ag/AgCl (stage 4) presents passive-like trends in agreement with the potentiodynamic polarization results. The shapes of the curves are very similar to the shapes of the respective curves of Al–5 wt.% Co. The fluctuations and high values of current density also suggest pseudopassivity and/or metastable pits. The current density values, especially in the stabilization parts, are close to the respective values of Al–5 wt.% Co. The similar curve shapes and current density values indicate similar corrosion phenomena for both the low and high Co Al-alloys. Indeed, the microstructural observations in Figure 7 confirm the above claim. Figure 7a reveals the formation of alumina-based films on the Al-phase of Al–20 wt.% Co polarized at 0 mV vs. Ag/AgCl (spectrum 53), as in the case of Al–5 wt.% Co. However, unlike Al–5 wt.% Co, the EDX spectra of the matrix surface of Al–20 wt.% Co include Co. The Al9Co2 phase has remained free of any oxidation signs (Figure 7a, spectrum 51). Therefore, it is deduced that, as in the case of the low Co Al-alloys polarized in the low range of passive potentials, stage 2 in the high Co Al-alloys has been caused by the formation of alumina-based films (containing some Co) on the Al-phase.
Regarding passive-like stage 4, Figure 7b shows that, besides passivation of the (Al) matrix, passivation of Al9Co2 has also occurred (Figure 7b, EDX elemental mapping).
The shape of the current density vs. time curve (Al–20 wt.% Co) at a potential in stage 3 (280 mV vs. Ag/AgCl) enhances the claim of an oxidation process proposed in 3.2.1. Comparing the shapes of the curves at passive-like stages 2 and 4 with the curve at stage 3, it is evident that the current initially rises at intermediate values between those of active stage 1 and those of passive-like stages 2 and 4. Then, the current density does not drop as in stages 2 and 4 but it continues to rise at a slow rate that gradually decreases with time elapsing (up to ~25 min). A stabilization trend is eventually attained. Taking into account the presence of oxygen on the surface of Al9Co2 in stage 4 (Figure 7b-EDX mapping) and its respective absence in stage 2 (Figure 7a-spectrum 51), it is drawn that intermediate stage 3 is mainly attributed to the oxidation of Al9Co2. Its distinctiveness, unlike the case of the low Co Al-alloys, is most likely due to the high surface area of the Al9Co2 plates.
Often, minor amounts or traces of sulfur have been detected on the surface of the oxidized matrix after chronoamperometry at passive potentials (Figure 6b-spectrum 29, Figure 7a-spectrum 53), as well as after cyclic polarization (Figure 8-spectrum 6). Adsorption of SO42− on the hydrous alumina can block active sites of the surface film [50]. Sulfates can rapidly displace aquo groups (Al–OH2+) or hydroxo (A–OH2+) groups on hydrous Al2O3 [56]. This blocking action does not, however, ensure inhibition of localized corrosion. The latter depends on the defects present in the structure of the surface film [50] that can be numerous [52]. This film is a porous-type anodic film, with a barrier layer at the metal/film interface and numerous imperfections [54]. Sulfur is also detected on the surface of oxidized Al9Co2 (Figure 8-spectrum 5).
To summarize, both potentiodynamic polarization and chronoamperometry experiments showed that the anodic polarization of Al–Co in 1 M H2SO4 at 25 °C proceeds via the stages: (1) Active dissolution of the Al-matrix by ionic conduction across the preexistent surface film; (2) pseudo-passivation of the Al-matrix by film formation at the metal/oxide interface and film dissolution at the film/electrolyte interface; (3) oxidation of the surface of the Al9Co2 particles; and (4) extension of pseudo-passivation to the surface of the Al9Co2 particles. Stage 3 is distinct only in the case of the high-Co alloys (7–20 wt.% Co).
3.2.3. Polarization Performance in 1 M H2SO4 Versus Co Content
Table 1 and Table 2 show that neither the corrosion potential values nor the corrosion current density values as a function of the Co content present any meaningful trends. Regarding Ecorr, on closer observation, one could claim that the high Co Al-alloys present nobler corrosion potentials as compared to the low Co Al-alloys (compare the Ecorr of Al–2 wt.% Co with the Ecorr of Al–20 wt.% Co in Table 1). This trend can be justified by the increased Co dissolution in the Al-matrix at the high Co contents, as aforementioned in 3.1 (the corrosion potential of electrolytic Co in 1 M H2SO4 has been measured by potentiodynamic polarization as (−305 ± 11) mV vs. Ag/AgCl, whereas the corrosion potential of CP-Al in 1 M H2SO4 has been measured as (−463 ± 8) mV vs. Ag/AgCl.) Anyway, this ennoblement is not conclusive, as the variations in the mean Ecorr values are small and often within experimental error.
Regarding icorr, the insignificant variations (within experimental error) in the icorr values of the various Al–Co compositions can be justified by the following competing contributions: As the Co content increases, a decrease in icorr would be expected due to the decrease in the number of interfaces per unit area (coarser microstructure) and the increase in the surface area of the noble CMA/intermetallic compound (Al9Co2). A9Co2 is a CMA with a structural complexity between B2-AlCo and QC-Al13Co4. At its surface, A9Co2 presents a pseudogap in the electron density of the states across the Fermi energy [57], which is typical for CMAs, and it is considered responsible for their low surface energy, and, consequently, their high corrosion resistance. On the other hand, as the Co content increases, an increase in icorr would be expected due to the decrease in the anode (Al)-to-cathode (Al9Co2) ratio and the increase in the size of the cathodic Al9Co2 particles.
However, a more consistent trend is observed in the current density values of pseudopassive stage 2: Figure 2, Figure 4 and Figure 5, as well as Table 1, show that, generally, as the Co content increases, the passive current (ip1) decreases (especially, as far as the 0–10 wt.% Co compositions are concerned). Although the variations are within experimental error (only in the range 10–20 wt.% Co), the decreasing trend with Co increasing is consistent. In addition, the ip1 values of the low-Co alloys appear clearly higher than the ip1 values of the high-Co alloys, classifying the studied compositions in two groups, in compatibility with the observations in 3.2.1: Al–(0–5) wt.% Co and Al–(7–20) wt.% Co. The decreasing trend of stage 2-current values with Co content can be associated with the increase in the Co dissolved in the Al matrix, causing an increasing participation of Co in the alumina surface film. Indeed, minor amounts of Co have been detected in the surface film of the (Al) phase (Figure 7, spectrum 53, Figure 8, spectrum 6). Here, it should be noted that in order to ensure the validity of the point EDX qualitative analysis, all measurements were performed at distances greater than 2–3 μm from the interfacial boundaries, abiding by the principle that the spatial resolution of EDX is 1–5 μm3 for low atomic number elements and 0.2–1 μm3 for high atomic number elements in the voltage range of 15–25 kV [58]. It has been stated that the presence of oxidized species of TMs in the alumina-based surface layer improve the corrosion resistance of Al-TM alloys, aluminides, and Al-based CMAs in chloride solutions and sulfuric acid solutions by blocking the aggressive-ion entry sites in the passive layers [59,60,61] or stabilizing the passive layers [62]. Recently, Esquivel and Gupta [63] summarized the proposed mechanisms for the contribution of TMs in the passivation ability of Al-TM alloys prepared by non-equilibrium processing techniques. Here, it should be noted that the similarity in the ip1 values of the high-Co alloys (10–20 wt.% Co), may be justified by the following reasoning: The increase in ip1 (stage 2) due to the decrease in the passive surface area, i.e., Al matrix, can to some extent counterbalance the decrease in ip1 due to the increase in the dissolved (in the matrix) Co content.
On the other hand, Figure 2 and Figure 4 and Table 1 show similar values of the current in passive-like stage 4 (ip2, 7–20 wt.% Co) and the current in the upper part of passive-like stage 2 (2–5 wt.% Co), regardless of the Co content. Moreover, despite the comparatively high Co content in the Al-matrix, Al–20 wt.% Co presents only slightly higher current densities than Al–5 wt.% Co during chronoamperometry at 600 mV vs. Ag/AgCl (Figure 5). The most likely reason for these discrepancies is that surface films after polarization at 600 mV vs. Ag/AgCl (passive-like stage 4) are heavily hydrated, thus highly conductive [35]. As such, their conductivity is rather governed by the extent of the adsorbed water molecules than the compositional differences of the anhydrous parts of the surface complex compounds.
Another data group with a consistent trend is that of Ecp1 − Ecorr (Table 1). A general trend of reduction with Co content along with small STDEV values are observed. This decreasing trend can be attributed to the increasing instability of the Al-matrix as the Co content increases due to the increasing amount of Co dissolved in Al (supersaturated state) and, consequently, the increasing ease of Al-matrix oxidation/passivation.
A moderately higher resistance to localized corrosion is suggested for the Al–(7–20) wt.% Co as compared to the Al–(2–5) wt.% Co, on the basis of positive hysteresis through the whole anodic scan (25% of tested specimens against 0% of tested specimens), cathodic looping (75% of tested specimens against 33% of tested specimens), and positive hysteresis turning to negative a couple decades of mV lower than Ecp1 (0% of tested specimens against 25% of tested specimens). This higher resistance to localized corrosion can be attributed to the mediating effect that the increased Co dissolution at the high Co contents has on the galvanic coupling between Al matrix and Al9Co2, at the Al/Al9Co2 interface.
The relatively low resistance to localized corrosion of the Al–(2–5) wt.% Co alloys in comparison with the Al–(7–20) wt.% Co alloys could also be correlated with the greater occurrence of interfacial defects in the low-Co compositions. A close observation of Figure 3a–d reveals some microcracks and inhomogeneities on the surface structure. These defects are located at the Al/Al9Co2 interphase. Their directional alignment in the case of Al–5 wt.% Co, where they are more abundant, suggests their formation along the boundaries of the long and coarse bright stripes of Al9Co2 (Figure 1b). According to Kharitonov et al. [64], the Volta potential difference between the intermetallic particles and the alloy matrix along with the interphase boundary zone that constitutes a potential gradient zone (similar to the sensitization zone) are responsible for localized microgalvanic corrosion, as well as accumulation of strain and microstructural mismatch in a multi-phase alloy. The accumulation of strain along these long, coarse Al9Co2 stripes is high even in the as-solidified state, as the stripes have grown along screw dislocations [46,47]; the density of screw dislocations is higher at higher cooling rates, namely at lower Al9Co2 contents. In the case of the low Al9Co2 compositions (Al–(2–5) wt.% Co), not only is the Volta potential difference between Al and Al9Co2 relatively high owing to the reduced dissolution of Co into the Al matrix, but the long, coarse Al9Co2 stripes constitute large cathodic zones leading to locally high cathode-to-anode ratios. The above considerations are compatible with Zhang et al. [65], who observed localized dissolution in parallel to anodic Al-oxide formation in Al-alloys containing cathodic intermetallic particles and anodic intermetallic particles.
The high resistance of the Al–Co alloys to 1 M H2SO4 also becomes evident when comparing their voltammograms with the voltammograms of market-leading Al-alloys. Figure 2c and Table 2 show that the Al–Co alloys present better performance than Al2024-T3 and Al7075-T6 in terms of lower corrosion current density values and lower passive current densities. It should be noted that the lower passive current densities of the Al-Co alloys with respect to those of CP-Al, Al2024-T3, and Al7075-T6, imply more stable passive films, a promising characteristic regarding the effectiveness of a potential anodization process.
3.2.4. Nature of Surface Films in 1 M H2SO4
Figure 9 illustrates representative Raman spectra obtained from various spots of the surface of Al–15 wt.% Co polarized at potentials in passive-like stage 2 (0 mV vs. Ag/AgCl), stage 2-to-stage 4 transition stage 3 (280 mV vs. Ag/AgCl), and passive-like stage 4 (600 mV vs. Ag/AgCl). All Raman spectra present bands (clearly to hardly discerned) characterizing alumina hydrates, Co-oxide-based structures, and sulfate/bisulfate ions. The differentiation between the various forms of hydrous alumina, as well as the various products of cobalt oxidation, is a difficult task, due to the overlapping of bands, the significant presence of amorphous phases/dispersed species, and the metallic character of the intermetallic compounds as substrates to thin films. Nevertheless, an interpretation of the main features of the spectra is further attempted. It should be noted that the assignment of low-intensity peaks abundantly found in the spectra of Figure 9 can be speculative, since there is a risk of a baseline artefact to be misinterpreted as an active Raman band. For this reason, only the most prominent features of the received spectra are herein discussed. Furthermore, Figure 10 includes the baselines of the spectra in magnification (×8 along the y-axis) to ensure the correct assignments of low-intensity peaks.
The spectra received from the surface after chronoamperometry at 0 mV vs. Ag/AgCl are classified into two groups: Type “Al-0 mV” obtained from spots on the Al-matrix surface and Type “Al9Co2-0 mV” obtained from the surface of the Al9Co2 phase. Although the humpy morphologies of the base lines, exhibited in Figure 9 and Figure 10, indicate amorphicity, intensive or weak Raman bands characteristic of vibrations in crystalline phases stand out.
Spectrum “Al-0 mV”: A hump extending from ~565 cm−1 to ~705 cm−1 forms the baseline of two broad bands peaking at 652 cm−1 and 604 cm−1 (Figure 9). The broad band extending from ~565 cm−1 to ~630 cm−1 peaks at 604 cm−1, a wavenumber corresponding to the F2g mode of CoOOH vibrations [66]. The broad band extending from ~630 to ~705 cm−1 peaks at 652 cm−1, which is the highest peak in the spectrum. It is assigned to the γ(OH) vibrations (B1g symmetry) of diaspore {α-AlOOH} [67], whereas it is accompanied by a “shoulder” peak at 662 cm−1, ascribed to the Ag symmetry/γ (OH) vibrations of diaspore [68]. High and sharp peaks at 986 cm−1 and 614 cm−1 are assigned to the v1 (SO42−) symmetric stretching vibration mode and the ν4 (SO42−) bending and antisymmetric stretching vibration mode, respectively [69,70,71]. In Figure 9, another hump is seen to extend from ~435 cm−1 to ~490 cm−1. Figure 10a shows minor peaks standing out from this hump at 456 cm−1 (v2 (SO42−) symmetric bending vibrations [70], 467 cm−1 (Al-O vibrations in the diaspore lattice [68]) and 471 cm−1 (Eg mode of CoO [66,72]). Several minor peaks have also been identified throughout the spectrum; they are caused by vibrations in the lattices of alumina hydrates (diaspore, boehmite (γ-AlOOH), bayerite {α-Al(OH)3}, gibbsite {γ-Al(OH)3} [68]), and Co-oxide-based compounds (CoO, Co3O4, CoOOH [66,72]), the exact assignments of which, are shown in Figure 10a.
Spectrum “Al9Co2-0 mV”: Peaks are very weak hardly protruding from their background. Few weak peaks (noted in Figure 10b) could be due to vibrations in the alumina hydrate lattices, respectively [68]; however, their low intensities do not allow for reliable conclusions. The only distinguishable pattern is a broad band that extends from ~926 cm−1 to ~994 cm−1 and peaks at 979 cm−1 (wavenumber ascribed to the v1 (SO42−) vibrations). The above observations enhance the indications reported in 3.2.2 that stage 2 in the Al-Co alloys of high Co content (7–20 wt.% Co) is owing to the passivation of the Al-matrix (without the participation of Al9Co2 in the passivation process).
Spectrum “Al9Co2-280 mV”: A representative spectrum received from the surface of primary Al9Co2 stripes after chronoamperometry at 280 mV vs. Ag/AgCl is included in Figure 9. Spectrum “Al9Co2-280 mV” is characterized by several very broad bands of low intensity and jagged morphology, the latter clearly seen in Figure 10c. More analytically, a broad hump extends from ~520 to ~700 cm−1, which is centered around 602 cm−1 (the characteristic wavenumber of the F2g mode of CoOOH vibrations). This broad band is typical of a dispersed Co-oxide phase [73]. Weak peaks are discerned to protrude from this hump; they are assigned to the Al–O bonding (<500 cm−1), γ(OH) translation modes (<900 cm−1), and δ(OH) deformation modes of alumina hydrates (>900 cm−1) [68]; their exact assignments are noted in Figure 10c. The high degree of amorphicity (indicated by the humpy and jagged morphology, as well as the very weak peaks of the spectrum in Figure 9) is in accordance with the evidences of the voltammograms in Figure 2 and Figure 4, and the current density vs. time curve at 280 mV vs. Ag/AgCl in Figure 5, of a transition stage governed by oxidation processes on the Al9Co2 surface. The main products of these oxidation processes (after chronoamperometry for 2 h) are dispersed Co–O species and barrier amorphous Al–O films, probably precursor phases to the phases formed during stage 4. Regarding the claim for barrier Al-oxide films, these are postulated to be “substrates” to the thin alumina hydrate layers detected. The bi-layered structure of the passive film of Al in contact with an aqueous environment, namely an amorphous Al2O3 barrier layer beneath a permeable hydrous Al2O3 layer, is long acknowledged [74].
Two main types of spectra have been obtained from various spots of the surface after chronoamperometry at 600 mV vs. Ag/AgCl. Spectrum type “Al9Co2-600 mV”, received from the surface of an Al9Co2 primary stripe, and spectrum type “Al-600 mV”, received from the surface of the Al-matrix.
Spectrum “Al9Co2-600 mV” contains major peaks assigned to characteristic vibration modes of the lattices of CoOOH (F2g: 604 cm−1), Co3O4 (F2g: 622 cm−1), and diaspore (γ(OH), B1g: 650 cm−1). Other accountable peaks, more clearly discerned in Figure 10d, are ascribed to lattice vibrations of alumina hydrates (diaspore Ag symmetry/γ(OH) at 663 cm−1 –shoulder to the B1g band-, bayerite/γ(OH) at 899 cm−1, bayerite/Al–O at 434 cm−1, gibbsite/Al–O at 410 cm−1, gibbsite/γ(OH) at 751 cm−1, gibbsite/δ(OH) at 895 cm−1, boehmite/γ(OH) at 670 cm−1) [20,68]. Some minor peaks, more clearly discerned in Figure 10d, are considered to be due to vibrations in the lattices of CoO (A1g symmetry at 674 cm−1, F2g symmetry at 507 cm−1, Eg symmetry at 470 cm−1), CoOOH (807 cm−1), and Co(OH)2 (A1g symmetry at 424 cm−1) [66,72]. Amorphicity is indicated by the hump that forms the base of the intensive bands peaking at 604 cm−1, 622 cm−1, and 650 cm−1, whilst it extends from ~545 to ~700 cm−1, as seen in Figure 9. The well-formed bands of high intensity, as compared to the “humpy” morphology of the spectrum at 280 mV vs. Ag/AgCl, suggest that the oxidation having occurred in transitional stage 3 has led to the formation of surface films on the Al9Co2 phase during potentiodynamic polarization through stage 4. The hump that forms the base of the band peaking at 604 cm−1 enhances the postulation that dispersed Co–O species are precursors to Co(OH)2, CoOOH, Co3O4, and CoO.
Figure 9 shows that Spectrum “Al-600 mV” includes three wide bands that give the impression of an overall humped morphology with numerous protruding small peaks forming a “jagged” shape: A band peaking at 510 cm−1 (F2g (CoO)), a band peaking at 584 cm−1 (B1g/γ(OH) in diaspore), 605 cm−1 (F2g/CoOOH), and 594 cm−1 (fundamental transitions of both SO42− and HSO4− [69,75]), and a band peaking at 671 cm−1 (γ(OH) translation mode in boehmite). From these bands, minor peaks stand out; their exact assignments are given in Figure 10e. More analytically, from the broad band peaking at 510 cm−1, minor peaks assigned to CoO (470 cm−1: Eg), CoOOH (474 cm−1: Eg), (Co3O4 (524 cm−1: F2g) and SO42− (460 cm−1: ν2 symmetric bending mode [70]), as well as alumina hydrates are discerned. From the broad band peaking at 584 cm−1, 605 cm−1, and 594 cm−1, peaks due to characteristic vibration modes of gibbsite (565 cm−1: γ(OH)), diaspore (574 cm−1: B2g/γ(OH) [67]), SO42− (614 cm−1: ν4(SO42−)), and Co3O4 (621 cm−1: F2g) are protruding. From the broad band peaking at 671 cm−1, peaks corresponding to characteristic vibration modes of diaspore (663 cm−1: Ag/γ(OH), 653 cm−1: B1g/γ(OH)), CoO (675 cm−1: A1g symmetry), and Co3O4 (685 cm−1: A1g symmetry) are standing out.
All Raman spectra in Figure 9 present sharp or wide bands of notable intensity peaking at 975–987 cm−1. As aforementioned, these bands are assigned to the symmetric stretching vibrations of the SO42− ion. A question arises whether the identified sulfate-due bands are due to vibrations in the electrolyte remaining in the pores of the alloys or they are due to bonding between surface metal and sulfate ions. The presence of residual H2SO4 solution is supported by the following considerations: The variety in the half-width of the v1(SO42−) band, observed in Figure 9, has been attributed to the variety in the H3O+ concentrations [69], suggesting the presence of aqueous H2SO4. Myhre et al. [69] showed that an increase in H2SO4 concentration leads to a significant decrease in the intensity and an increase in the half-width of the v1 (SO42−) band. On the other hand, the presence of sulfate salts is supported by the following considerations: The max 12 cm−1 shift observed in the v1 (SO42−) band constitutes evidence of bonding between the adsorbed sulfate and surface atoms [70,76]. According to literature, the Raman position of the v1 mode of a solid sulfate shifts to a high wavenumber compared to the aqueous solution [76,77]. According to Omori [78], “every atom of the SO4 molecule in solution vibrates freely, but in a crystal, the atom vibrates under additional influences from the cations, causing variations in the wavenumber of the absorption band”. For example, the v1 (SO42−) band of aqueous H2SO4 of various concentrations at room temperature is reported to center around 980 cm−1 [69], whereas the v1 (SO42−) band of Al2(SO4)3·xH2O has been reported to peak at 991 cm−1 [79]. As such, for hydrated sulfates, the ν1 symmetric stretching-due peak would shift to lower vibrational wavenumbers with increasing hydration [80]. Additionally, in solid salts, the vibrational wavenumber of each sulfate-due Raman band has been shown to decrease as the cation radius increases and, consequently, the cation’s polarizing power decreases [76,77]. Even in the case of sulfate salt presence, the ν1 mode can exhibit a linewidth increasing from the anhydrous to hydrated and then to aqueous solution, which can be due to the increase in the structure disordering from the solid to the liquid state [76]. Splitting of the SO42−-due Raman bands (as in spectra Al9Co2-0 mV (ν1), Al9Co2-600 mV (ν4), Al-600 mV (ν1)) may also be related to the metal cation radius in the solid sulfate salt [77]. Hence, although the possibility for the simultaneous presence of residual sulfuric acid solution or sulfuric salt solution cannot be excluded, the wide v1 (SO42−) Raman bands in spectra Al9Co2-0 mV, Al9Co2-280 mV, Al9Co2-600 mV, and Al-600 mV could also be due to sulfate salts, in hydrated forms. In fact, splitting of the SO42−-due Raman bands favor the latter consideration. The v1 (SO42−) band in spectrum Al-0 mV, presenting markedly higher sharpness and intensity and located at a higher wavenumber compared to the corresponding bands of the other spectra in Figure 9, could be due to the presence of a solid sulfate salt, most likely Al2(SO4)3·xH2O.
The different intensities of the v1(SO42−) band are owing to the different concentrations of the SO42− ions in the analyzed spots [81]. Weak peaks uniquely ascribed to HSO4− at (878–887) cm−1 (asymmetric stretching vibrations) are also observed [69]. The considerable shift in the frequency of this band is attributed to the variation of the concentration of HSO4- [69]. Two peaks at 593–594 cm−1 and 422–425 cm−1 arise from fundamental vibrations of both SO42− and HSO4− ions [69].
It should be emphasized that the studied system is complex and multicomponent; therefore, significant overlapping of bands is an additional reason for the variations in the band characteristics (intensities, peak shifts, width, etc.)
In conclusion, Raman spectra confirmed the findings reported in 3.2.1 and 3.2.2, namely:
(a) The nature of the surface films is complex, consisting of mixtures of crystalline and amorphous phases. Amorphicity is associated with dispersed Co-oxide species, alumina underlayers to alumina hydrates, and intensively hydrated surface films at high passive potentials.
(b) Al9Co2 has remained unoxidized at the low potentials of the passive stage (stage 2), for the low-Co compositions (2–5 wt.% Co), or during the first passive stage (stage 2) for the high-Co compositions (7–20 wt.% Co).
(c) Passive films on the Al-matrix contain Co-oxide based species due to the oxidation of Co dissolved in Al. (It is well established that Al alloyed with TMs forms Al2O3-based passivating layers in various electrolytes; these layers may incorporate oxidized species of the TM. Such systems include: CMAs (Al–Cu–Fe–Cr [82], Al–Cr–Fe [62,83] and Al supersaturated in TMs (W [59], Mo [59], and Ta [59,84]).
(d) Mixtures of alumina hydrates and Co-oxides (Co-oxide dispersed species, CoO, Co3O4, CoOOH) compose the films on Al9Co2 in compatibility with works on the passivation of Fe-aluminides in H2SO4 [60,85].
(e) Sulphate salts in hydrated forms may also be included in the surface films.
3.2.5. Some Comments on the Objectives of This Work
Regarding the primary objective of this work, which was to identify low enough Co additions that will satisfy the threefold: Ductility-corrosion resistance-cost of raw materials, this work produced the following data: The high Co alloys (7–20 wt.% Co) led to greater reductions of passive current, in comparison with the low Co alloys (2–5 wt.% Co), namely: During the first pseudopassive stage, a reduction of 3.5–5.0 times (as compared to pure Al) was attained for the 7–20 wt.% Co range, whereas a reduction of 1.4–2.0 times was attained for the 2–5 wt.% Co range. On the other hand, the differences in the electrochemical behaviors of the 2–5 wt.% Co and 7–20 wt.% Co compositions concerning the resistances to localized corrosion and uniform corrosion were not significant enough. Taking also into account that: (a) High Co alloys are more brittle than low Co alloys due to the high amounts of Co-aluminides [35], (b) addition of 7 wt.% Co to Al has led to higher localized and uniform corrosion resistances in 3.5 wt% NaCl, as compared to richer Co compositions [20], (c) Co additions raise the cost of the raw materials, and (d) low and high Co alloys have herein shown comparable resistances to localized corrosion and uniform corrosion in 1 M H2SO4, the present work tends to support that alloying Al with 7 wt.% Co could be a quite satisfactory option. However, safer conclusions will be drawn when the present study will be complemented with an investigation on the effect of Co on the wear resistance of Al, planned to be published in the immediate future.
As aforementioned in the Introduction, the main subject of this effort is to examine the electrochemical response of a wide compositional range of Al/Al9Co2 alloys to aqueous H2SO4, from the viewpoint of corrosion, as H2SO4 is a key substance in the chemical industry, an important agent in many industrial sectors, like mineral processing, oil refining, wastewater processing, as well as the main constituent of acid rain. For this purpose, a common commercial concentration of diluted H2SO4 was selected, which is also frequently used in electrochemical studies of Al (1 M) [86]. A wide potential range was employed including cathodic polarization, anodic polarization, and reverse polarization to gain as much information as possible (in a systematic manner) on the electrochemical performance of the Al–Al9Co2 alloys (a new combination of Al-intermetallic compound). A further objective was to evaluate whether off-equilibrium alloying Al with Co can improve the passivation ability of Al. As such, the present work can set the foundations for a future detailed investigation on the selection of the parameters of an anodizing treatment (e.g., electrolyte concentration, composition and temperature, current/potential values, time, pore sealing conditions, etc.), towards an optimum response to aggressive environments. Within the above framework, it should be emphasized that although the sulfuric acid concentration of 1 M has been employed for anodizing [87], the present effort should not be used to draw conclusions on the anodization procedure in practice.
4. Conclusions
- Al–Co alloys of various Co contents in the 2–20 wt.% Co range were produced by vacuum arc melting. The alloys were composed of Al9Co2 particles uniformly distributed in an Al matrix in a directional pattern. As the Co content of the alloy increased, the volume fraction and coarseness of Al9Co2 increased.
- Both potentiodynamic polarization and chronoamperometry experiments showed that the anodic polarization of Al–Co in 1 M H2SO4 at 25 °C proceeded via the stages: (1) Active dissolution of the Al-matrix by ionic conduction across the imperfections of the preexistent surface film; (2) pseudo-passivation of the Al-matrix by film formation at the metal/oxide interface and film dissolution at the film/electrolyte interface; (3) oxidation of the surface of the Al9Co2 particles; and (4) extension of pseudo-passivation to the surface of the Al9Co2 particles. Stage 3 was distinct only in the case of the high-Co alloys (7–20 wt.% Co).
- Different passivation behaviors were observed for the 2–5 wt.% Co and 7–20 wt.% Co alloys in 1 M H2SO4. The low-Co alloys presented one stage passivation governed by the passivation of the (Al) matrix; this stage included passivation of Al9Co2 at high overpotentials. The high-Co alloys presented passivation of two distinct stages. The first stage was governed by the passivation of the (Al) matrix. The second stage was governed by the passivation of Al9Co2. A transitional active stage separated the two passive stages; it corresponded to the oxidation of Al9Co2.
- Alloying Al with Co did not decrease the rate of uniform corrosion. Nevertheless, increasing the Co content led to a decrease in the passivation current density (during the first stage) in 1 M H2SO4, due to the increasing participation of Co in the surface layer of the (Al) matrix. Even low percentages of Co led to accountable decreases in the passive current density of Al (Al–2 wt.% Co: 1.4 times, Al–5 wt.% Co: 2 times, Al–7 wt.% Co: 3.5 times).
- All Al–Co compositions displayed greater passivation ability in 1 M H2SO4 than commercially pure Al, Al7075-T6, and Al2024-T3, in terms of passive current density and initiation of passivation at lower potentials with reference to the corrosion potential.
- All Al–Co compositions showed high resistance to localized corrosion. High Co alloys (Co ≥ 7 wt. %) did not show any susceptibility to localized corrosion.
- Mixtures of crystalline phases (Al2O3-hydrates, CoO, Co3O4, CoOOH, sulfates, bisulfates) and amorphous phases (dispersed Co-oxide species, Al2O3 underlayer to Al2O3-hydrate overlayers) composed the passive films.
- Taking into account that: (a) High Co alloys are more brittle than low Co alloys due to the high amounts of Co-aluminides, (b) addition of 7 wt.% Co to Al has previously led to higher localized and uniform corrosion resistances in 3.5 wt% NaCl, as compared to richer Co compositions, (c) Co additions raise the cost of raw materials, and (d) low and high Co containing alloys have herein shown comparable resistances to localized corrosion and uniform corrosion in 1 M H2SO4, the present work tends to support that alloying Al with 7 wt.% Co could be a quite suitable option, towards the threefold: Ductility-corrosion resistance-cost of raw materials. A planned publication on the effect of the Co content on the tribological performance of Al will further elucidate this matter.
Author Contributions
Conceptualization, A.K.S. and A.G.L.; methodology, A.K.S. and A.G.L.; validation, A.K.S. and A.G.L.; formal analysis, A.K.S. and A.G.L.; investigation, A.K.S. and A.G.L.; resources, A.G.L.; data curation, A.K.S. and A.G.L.; writing—original draft preparation, A.G.L.; writing—review and editing, A.K.S. and A.G.L.; visualization, A.G.L.; supervision, A.G.L. All authors have read and agreed to the published version of the manuscript.
Funding
This research received no external funding.
Acknowledgments
The authors would like to acknowledge Sofoklis Makridis for applying part of the arc-melting apparatus system under his patent: https://www.researchgate.net/publication/200664162, and Kiriaki Tsirka for obtaining the Raman spectra.
Conflicts of Interest
The authors declare no conflict of interest.
References
- Karakose, E.; Keskin, M. Structural investigations of mechanical properties of Al based rapidly solidified alloys. Mater. Des. 2011, 32, 4970–4979. [Google Scholar] [CrossRef]
- Liu, S.; Cui, C.; Wang, X.; Li, N.; Shi, J.; Cui, S.; Chen, P. Effect of cooling rate on microstructure and grain refining behavior of in-situ CeB6/Al composite inoculant in aluminum. Metals 2017, 7, 204. [Google Scholar] [CrossRef] [Green Version]
- Władysiak, R.; Kozuń, A.; Dębowska, K.; Pacyniak, T. Analysis of crystallization process of intensive cooled AlSi20CuNiCoMg alloy. Arch. Foundry Eng. 2017, 17, 137–144. [Google Scholar] [CrossRef] [Green Version]
- Gogebakan, M.; Uzun, O.; Karaaslan, T.; Keskin, M. Rapidly solidified Al-6.5 wt.% Ni alloy. J. Mater. Process. Technol. 2003, 142, 87–92. [Google Scholar] [CrossRef]
- Lin, Y.; Wu, B.; Li, S.; Mao, S.; Liu, X.; Zhang, Y.; Wang, L. The quantitative relationship between microstructure and mechanical property of a melt spun Al–Mg alloy. Mater. Sci. Eng. A 2015, 621, 212–217. [Google Scholar] [CrossRef]
- Lichioiu, I.; Peter, I.; Varga, B.; Rosso, M. Preparation and structural characterization of rapidly solidified Al–Cu alloys. J. Mater. Sci. Technol. 2014, 30, 394–400. [Google Scholar] [CrossRef]
- Menon, J.; Suryanarayana, C. Metallography of a melt-quenched aluminum-cobalt alloy. Metallography 1988, 21, 179–197. [Google Scholar] [CrossRef]
- Stan, K.; Litynska-Dobrzynska, L.; Ochin, P.; Garzeł, G.; Wierzbicka-Miernik, A.; Wojewoda-Budka, J. Effect of Ti, Zr and Hf addition on microstructure and properties of rapidly solidified Al–Mn–Fe alloy. J. Alloy. Compd. 2014, 615, S607–S611. [Google Scholar] [CrossRef]
- Donnadieu, P.; Ochin, P. Amorphous and crystalline phases in rapidly solidified Al-Ta and Al-Ta-V alloys. J. Alloys Compd. 2007, 434–435, 255–258. [Google Scholar] [CrossRef]
- Dorin, T.; Stanford, N.; Birbilis, N.; Gupta, B.K. Influence of cooling rate on the microstructure and corrosion behaviour of Al-Fe alloys. Corros. Sci. 2015, 100, 396–403. [Google Scholar] [CrossRef]
- Sameljuk, A.V.; Neikov, O.D.; Krajnikov, A.V.; Milman, Y.V.; Thompson, G.E.; Zhou, X. Effect of rapid solidification on the microstructure and corrosion behaviour of Al–Zn–Mg based material. Corros. Sci. 2007, 49, 276–286. [Google Scholar] [CrossRef]
- Mozhi, T.A.; Jha, S.C.; Ray, R. Technical note: Corrosion behavior of rapidly solidified Al-Ti-base alloys in chloride environment. Corrosion 1989, 45, 811–813. [Google Scholar] [CrossRef]
- Fass, M.; Itzhak, D.; Eliezer, D.; Froes, F.H. Corrosion behaviour of rapidly solidified Al-Er binary and ternary alloys in NaCl solution at room temperature. J. Mater. Sci. Lett. 1987, 6, 1227–1228. [Google Scholar] [CrossRef]
- Yoshioka, H.; Yoshida, S.; Kawasima, A.; Asami, K.; Hashimoto, K. The pitting corrosion behavior of rapidly solidified aluminum alloys. Corros. Sci. 1986, 26, 795–812. [Google Scholar] [CrossRef]
- Kim, Y.; Buchheit, R.G. A characterization of the inhibiting effect of Cu on metastable pitting in dilute Al–Cu solid solution alloys. Electrochim. Acta 2007, 52, 2437–2446. [Google Scholar] [CrossRef]
- Sundararajan, G.; Gigliotti, M.; Subramanian, P.R. Corrosion performances of rapidly solidified aluminum (RSA) alloys in chloride media. In Corrosion 2014; NACE International: Huston, TX, USA, 2014. [Google Scholar]
- Valencia, J.J.; McCullough, C.; Levi, C.G.; Mehrabian, R. Solidification microstructure of supercooled Ti-Al alloys containing intermetallic phases. Acta Metall. 1989, 37, 2517–2530. [Google Scholar] [CrossRef]
- Sakuma, T.; Yoshizawa, Y.I.; Suto, H. The microstructure and mechanical properties of yttria-stabilized zirconia prepared by arc-melting. J. Mater. Sci. 1985, 20, 2399–2407. [Google Scholar] [CrossRef]
- Osório, W.R.; Spinelli, J.E.; Ferreira, I.L.; Garcia, A. The roles of macrosegregation and of dendritic array spacings on the electrochemical behavior of an Al–4.5 wt.% Cu alloy. Electrochim. Acta 2007, 52, 3265–3273. [Google Scholar] [CrossRef]
- Lekatou, A.; Sfikas, A.K.; Petsa, C.; Karantzalis, A.E. Al-Co alloys prepared by vacuum arc melting: Correlating microstructure evolution and aqueous corrosion behaviour with Co content. Metals 2016, 6, 46. [Google Scholar] [CrossRef] [Green Version]
- Zuo, M.; Dong, Y.; Zhao, D.; Wang, Y.; Teng, X. Study on the anti-poison performance of Al–Y–P master alloy for impurity Ca in aluminum alloys. Materials 2017, 10, 1356. [Google Scholar] [CrossRef] [Green Version]
- Karantzalis, A.E.; Lekatou, A.; Evaggelidou, M. Microstructure and sliding wear assessment of Co–TiC composite materials. Int. J. Cast Metal. Res. 2014, 27, 73–79. [Google Scholar] [CrossRef]
- Vizureanu, P.; Minciună, M.G.; Achiţei, D.C.; Sandu, A.V.; Hussin, K. Mechanical Behaviour of CoCrMo Alloy with Si Content. Appl. Mech. Mater. 2015, 754–755, 1017–1022. [Google Scholar] [CrossRef]
- Yan, H.Y.; Vorontsov, V.A.; Dye, D. Alloying effects in polycrystalline γ΄ strengthened Co-Al-W base alloys. Intermetallics 2014, 48, 44–53. [Google Scholar] [CrossRef] [Green Version]
- Palcut, M.; Priputen, P.; Salgo, K.; Janovec, J. Phase constitution and corrosion resistance of Al-Co alloys. Mater. Chem. Phys. 2015, 166, 95–104. [Google Scholar] [CrossRef]
- Priputen, P.; Palcut, M.; Babinec, M.; Misik, J.; Cernickova, I.; Janovec, J. Correlation between microstructure and corrosion behavior of near-equilibrium Al-Co alloys in various environments. J. Mater. Eng. Perform. 2017, 26, 3970–3976. [Google Scholar] [CrossRef]
- Heggen, M.; Feuerbacher, M. Core structure and motion of the dislocations in the orthorhombic structurally complex alloy Al13Co4. Mater. Res. Lett. 2014, 2, 146–151. [Google Scholar] [CrossRef] [Green Version]
- Kandaskalov, D.; Fournée, V.; Ledieu, J.; Gaudry, E. Adsorption properties of the o-Al13Co4(100) surface toward molecules involved in the semihydrogenation of acetylene. J. Phys. Chem. C 2014, 118, 23032–23041. [Google Scholar] [CrossRef]
- Krajčí, M.; Hafner, J. Catalytic properties of five-fold surfaces of quasicrystal approximants. In Aperiodic Crystals; Schmid, S., Withers, R., Lifshitz, R., Eds.; Springer: Dordrecht, Germany, 2013; pp. 269–274. [Google Scholar]
- Soler, L.; Macanas, J.; Munoz, M.; Casado, J. Synergistic hydrogen generation from aluminum, aluminum alloys and sodium borohydride in aqueous solutions. Int. J. Hydrogen Energy 2007, 32, 4702–4710. [Google Scholar] [CrossRef]
- Geng, K.; Yang, Y.; Li, S.; Misra, R.D.K.; Zhu, Q. Enabling high-performance 3D printing of Al powder by decorating with high laser absorbing Co phase. Addit. Manuf. 2020, 32, 101012. [Google Scholar]
- Hung, C.J.; Nayak, S.K.; Sun, Y.; Fennessy, C.; Vedula, V.K.; Tulyani, S.; Lee, S.W.; Alpay, S.P.; Hebert, R.J. Novel Al-X alloys with improved hardness. Mater. Des. 2020, 192, 108699. [Google Scholar] [CrossRef]
- Men‘Shikova, S.G.; Shirinkina, I.G.; Brodova, I.G.; Lad‘yanov, V.I.; Suslov, A.A. Structures of thin ribbons from an Al-Co alloy under rapid cooling. Met. Sci. Heat Treat. 2016, 58, 393–399. [Google Scholar] [CrossRef]
- Adam, A.M. Dendrite refinement of Al9Co2 compound by a continuous increase of the cooling rate during solidification. UPB Sci. Bull. Ser. B 2012, 74, 289–300. [Google Scholar]
- Lekatou, A.; Sfikas, A.K.; Karantzalis, A.E.; Sioulas, D. Microstructure and corrosion performance of Al-32%Co alloys. Corros. Sci. 2012, 63, 193–209. [Google Scholar] [CrossRef]
- Palcut, M.; Priputen, P.; Kusy, M.; Janovec, J. Corrosion behaviour of Al-29%atCo alloy in aqueous NaCl. Corros. Sci. 2013, 75, 461–466. [Google Scholar] [CrossRef]
- Sui, H.X.; Zhu, M.; Qi, M.; Li, G.B.; Yang, D.Z. The enhancement of solid solubility limits of AlCo intermetallic compound by high energy ball milling. J. Appl. Phys. 1992, 71, 2945–2949. [Google Scholar] [CrossRef]
- Gille, P.; Bauer, B. Single crystal growth of Al13Co4 and Al13Fe4 from Al-rich solutions by the Czochralski method. Cryst. Res. Technol. 2008, 43, 1161–1167. [Google Scholar] [CrossRef]
- Scully, J.R.; Presuel-Moreno, F.; Goldman, M.; Kelly, R.G.; Tailleart, N. User-selectable barrier, sacrificial anode, and active corrosion inhibiting properties of Al-Co-Ce alloys for coating applications. Corrosion 2008, 64, 210–229. [Google Scholar] [CrossRef]
- Lekatou, A.G.; Sfikas, A.K.; Karantzalis, A.E. The influence of the fabrication route on the microstructure and surface degradation properties of Al reinforced by Al9Co2. Mater. Chem. Phys. 2017, 200, 33–49. [Google Scholar] [CrossRef]
- Bakoulis, G.; Lekatou, A.G.; Poulia, A.; Sfikas, A.K.; Lentzaris, K.; Karantzalis, A.E. Al-(Al9Co2- Al13Co4) powder metallurgy processed composite materials: Analysis of microstructure, sliding wear and aqueous corrosion. Mater. Sci. Eng. Adv. Res. 2017. [Google Scholar] [CrossRef]
- Lekatou, A.; Sioulas, D.; Karantzalis, A.E.; Grimanelis, D. A comparative study on the microstructure and surface property evaluation of coatings produced from nanostructured and conventional WC-Co powders HVOF-sprayed on Al 7075. Surf. Coat. Tech. 2015, 276, 539–556. [Google Scholar] [CrossRef]
- Silverman, D.C. Tutorial on cyclic potentiodynamic polarization technique. In Proceedings of the CORROSION 98 Research Topical Symposium, San Diego, CA, USA, 22–27 March 1998. [Google Scholar]
- Beavers, J.A.; Durr, C.L.; Thompson, N.G. Unique interpretations of potentiodynamic polarization technique. In Proceedings of the CORROSION 98 Research Topical Symposium, San Diego, CA, USA, 22–27 March 1998. [Google Scholar]
- Davies, R.H.; Dinsdale, A.T.; Gisby, J.A.; Robinson, J.A.J.; Martin, S.M. MTDATA—Thermodynamics and phase equilibrium software from the National Physical Laboratory. Calphad 2002, 26, 229–271. [Google Scholar] [CrossRef]
- Karantzalis, A.E.; Arni, Z.; Tsirka, K.; Evangelou, A.; Lekatou, A.; Dracopoulos, V. Fabrication of TiC-reinforced composites by vacuum arc melting: TiC mode of reprecipitation in different molten metals and alloys. J. Mater. Eng. Perform. 2016, 25, 3161–3172. [Google Scholar] [CrossRef]
- Chen, Y.; Wang, H.M. Rapidly solidified MC carbide morphologies of a pulsed laser surface alloyed γ-TiAl intermetallic with carbon. Scr. Mater. 2004, 50, 507–510. [Google Scholar] [CrossRef]
- Karantzalis, A.E.; Lekatou, A.; Tsirka, K. Solidification observations and sliding wear behaviour of vacuum arc melting processed Ni–Al–TiC composites. Mater. Charact. 2012, 69, 97–107. [Google Scholar] [CrossRef]
- Maciá, E. Thermal conductivity in complex metallic alloys: Beyond Wiedemann-Franz law. Phys. Rev. B 2009, 79, 245112. [Google Scholar] [CrossRef] [Green Version]
- Mercier, D.; Herinx, M.; Barthes-Labrousse, M.G. Influence of 1,2-diaminoethane on the mechanism of aluminum corrosion in sulfuric acid solutions. Corros. Sci. 2010, 52, 3405–3412. [Google Scholar] [CrossRef]
- Arellanes-Lozada, P.; Olivares-Xometl, O.; Guzmán-Lucero, D.; Likhanova, N.V.; Domínguez-Aguilar, M.A.; Lijanova, I.V.; Arce-Estrada, E. The inhibition of aluminum corrosion in sulfuric acid by poly(1-vinyl-3-alkyl-imidazolium Hexafluorophosphate). Materials 2014, 7, 5711–5734. [Google Scholar] [CrossRef] [Green Version]
- Takahashi, H.; Chiba, M. Role of anodic oxide films in the corrosion of aluminum and its alloys. Corros. Rev. 2017, 36, 35–54. [Google Scholar] [CrossRef]
- Curioni, M.; Skeldon, P.; Thompson, G.E. Anodizing of aluminum under nonsteady conditions. J. Electrochem. Soc. 2009, 156, C407–C413. [Google Scholar] [CrossRef]
- Curioni, M.; Scenini, F. The mechanism of hydrogen evolution during anodic polarization of aluminium. Electrochim. Acta 2015, 180, 712–721. [Google Scholar] [CrossRef]
- Kelly, R.G.; Scully, J.R.; Shoesmith, D.; Buchheit, R.G. Electrochemical Techniques in Corrosion Science and Engineering; CRC Press: Boca Raton, FL, USA, 2002; pp. 59–65. [Google Scholar]
- Rajan, S.S.S. Sulfate adsorbed on hydrous alumina, ligands displaced, and changes in surface charge. Soil Sci. Soc. Am. J. 1978, 42, 39–44. [Google Scholar] [CrossRef]
- Ledieu, J.; Gaudry, É.; Fournée, V. Surfaces of Al-based complex metallic alloys: Atomic structure, thin film growth and reactivity. Sci. Technol. Adv. Mater. 2014, 15, 034802. [Google Scholar] [CrossRef] [PubMed]
- Wille, G.; Bourrat, X.; Maubec, N.; Guegan, R.; Lahfid, A. Raman-in-SEM Studies of inorganic materials. In Spectroscopic Properties of Inorganic and Organometallic Compounds: Techniques, Materials and Applications; Yarwood, J., Douthwaite, R., Duckett, S.B., Eds.; The Royal Society of Chemistry: London, UK, 2014; Volume 45, pp. 79–116. [Google Scholar]
- Bockris, J.O’.M.; Kang, Y. The protectivity of aluminum and its alloys with transition metals. J. Solid State Electrochem. 1997, 1, 17–35. [Google Scholar] [CrossRef]
- Shankar Rao, V. Repassivation behaviour and surface analysis of Fe3Al based iron aluminide in 0.25 M H2SO4. Corros. Sci. 2005, 47, 183–194. [Google Scholar] [CrossRef]
- Kutz, T.N.; Zander, D. The influence of chromium on the passivation of Fe3Al iron aluminides, investigated via potentiodynamic polarization in 0.25 M H2SO4. Corrosion 2017, 73, 648–654. [Google Scholar] [CrossRef]
- Ura-Binczyk, E.; Homazava, N.; Ulrich, A.; Hauert, R.; Lewandowska, M.; Kurzydlowski, K.J.; Schmutz, P. Passivation of Al-Cr-Fe and Al-Cu-Fe-Cr complex metallic alloys in 1 M H2SO4 and 1 M NaOH solutions. Corros. Sci. 2011, 53, 1825–1837. [Google Scholar] [CrossRef]
- Esquivel, J.; Gupta, R.K. Review—Corrosion-resistant metastable Al alloys: An overview of corrosion mechanisms. J. Electrochem. Soc. 2020, 167, 081504. [Google Scholar] [CrossRef]
- Kharitonov, D.S.; Örnek, C.; Claesson, P.M.; Sommertune, J.; Zharskii, I.M.; Kurilo, I.I.; Pan, J. Corrosion inhibition of aluminum alloy AA6063-T5 by vanadates: Microstructure characterization and corrosion analysis. J. Electrochem. Soc. 2018, 165, C116–C126. [Google Scholar] [CrossRef] [Green Version]
- Zhang, F.; Nilsson, J.-A.; Pan, J. In Situ and Operando AFM and EIS Studies of Anodization of Al 6060: Influence of Intermetallic Particles. J. Electrochem. Soc. 2016, 163, C609–C618. [Google Scholar] [CrossRef]
- Tang, C.W.; Wang, C.; Chien, S.H. Characterization of cobalt oxides studied by FT-IR, Raman, TPR and TG-MS. Thermochim. Acta 2008, 473, 68–73. [Google Scholar] [CrossRef]
- Demichelis, R.; Noel, Y.; Civalleri, B.; Roetti, C.; Ferrero, M.; Dovesi, R. The vibrational spectrum of r-AlOOH diaspore: An ab initio study with the CRYSTAL Code. J. Phys. Chem. B 2007, 111, 9337–9346. [Google Scholar] [CrossRef] [PubMed]
- Ruan, H.D.; Frost, R.L.; Kloprogge, J.T.; Schulze, D.G.; Duong, L. FT-Raman spectroscopy and SEM of gibbsite, bayerite, boehmite and diaspore in relation to the characterization of bauxite. 2001. In A Clay Odyssey; Domínguez, E., Mas, G., Cravero, F., Eds.; Elsevier: Amsterdam, The Netherlands, 2003; pp. 545–552. [Google Scholar]
- Lund Myhre, C.E.; Christensen, D.H.; Nicolaisen, F.M.; Nielsen, C.J. Spectroscopic study of aqueous H2SO4 at different temperatures and compositions: Variations in dissociation and optical properties. J. Phys. Chem. A 2003, 107, 1979–1991. [Google Scholar] [CrossRef]
- Hope, G.A.; Woods, R. Transient adsorption of sulfate ions during copper electrodeposition. J. Electrochem. Soc. 2004, 151, C550–C553. [Google Scholar] [CrossRef]
- Knopf, D.A.; Luo, B.P.; Krieger, U.K.; Koop, T. Thermodynamic dissociation constant of the bisulfate ion from Raman and ion interaction modeling studies of aqueous sulfuric acid at low temperatures. J. Phys. Chem. A 2003, 107, 4322–4332. [Google Scholar] [CrossRef]
- Lekatou, A.; Zois, D.; Karantzalis, A.E.; Grimanelis, D. Electrochemical behaviour of cermet coatings with a bond coat on Al7075: Pseudopassivity, localized corrosion and galvanic effect considerations in a saline environment. Corros. Sci. 2010, 52, 2616–2635. [Google Scholar] [CrossRef]
- Vuurman, M.A.; Stufkens, D.J.; Oskam, A.; Deo, G.L.; Wachs, I.E. Combined Raman and IR study of MOX–V2O5/Al2O3 (MOx = MoO3, WO3, NiO, CoO) catalysts under dehydrated conditions. J. Chem. Soc. Faraday Trans. 1996, 92, 3259–3265. [Google Scholar] [CrossRef]
- Bernard, W.J.; Randall, J.J., Jr. The reaction between anodic aluminum oxide and water. J. Electrochem. Soc. 1961, 108, 822–825. [Google Scholar] [CrossRef]
- Cox, R.A.; Haldna, U.L.; Idler, K.L.; Yate, K. Resolution of Raman spectra of aqueous sulfuric acid mixtures using principal factor analysis. Can. J. Chem. 1981, 59, 2591–2598. [Google Scholar] [CrossRef]
- Mabrouk, K.B.; Kauffmann, T.H.; Arouic, H.; Marc, D.; Fontana, M.D. Raman study of cation effect on sulfate vibration modes in solid state and in aqueous solutions. J. Raman Spectrosc. 2013, 44, 1603–1608. [Google Scholar] [CrossRef]
- Qiu, J.; Li, X.; Qi, X. Raman spectroscopic investigation of sulfates using mosaic grating spatial heterodyne raman spectrometer. IEEE Photonics J. 2019, 11, 1–12. [Google Scholar] [CrossRef]
- Omori, K. Infrared diffraction and the far infrared spectra of anhydrous sulfates. Mineral. J. 1968, 5, 334–354. [Google Scholar] [CrossRef] [Green Version]
- Kloprogge, T.; Frost, R.L. Raman microscopy study of basic aluminum sulfate. J. Mater. Sci. 1999, 34, 4199–4202. [Google Scholar] [CrossRef]
- Buzgar, N.; Buzatu, A.; Sanislav, J.V. The Raman study of certain sulfates. An. Stiin. U Al I-Mat. 2009, 55, 5–23. [Google Scholar]
- Sobron, P.; Sobron, F.; Eide, U.M.; Nielsen, C.J.; Rull, F. Model-based measurements of diffusion of sulfuric acid into water using Raman spectroscopy. Appl. Spectrosc. 2009, 63, 1382–1388. [Google Scholar] [CrossRef] [PubMed]
- Pinhero, P.J.; Sordelet, D.J.; Anderegg, J.W.; Brunet, P.; Dubois, J.M.; Thiel, P.A. Room temperature oxidation of Al-Cu-Fe and Al-Cu-Fe-Cr quasicrystals. Mater. Res. Soc. Symp. Proc. 1999, 553, 263–268. [Google Scholar] [CrossRef] [Green Version]
- Beni, A.; Ott, N.; Pawelkiewicz, M.; Wardé, M.; Young, K.; Bauer, B.; Rajput, P.; Detlefs, B.; Zegenhagen, J.; McGrath, R.; et al. Hard X-ray Photoelectron Spectroscopy (HAXPES) characterisation of electrochemical passivation oxide layers on Al–Cr–Fe complex metallic alloys (CMAs). Electrochem. Comm. 2014, 46, 13–17. [Google Scholar] [CrossRef] [Green Version]
- Davis, G.D.; Shaw, B.A.; Rees, B.J.; Pecile, C.A. Electrochemical behavior and surface chemistry of nonequilibrium aluminum-tantalum alloys: Solute-rich interphase model. Surf. Interf. Anal. 1995, 23, 609–617. [Google Scholar] [CrossRef]
- Frangini, S. Corrosion rate and anodic dissolution behavior of a B2-iron aluminide alloy in sulfuric acid. Corrosion 1999, 55, 89–95. [Google Scholar] [CrossRef]
- El-Sherbini, E.E.F.; Abd-El-Wahab, S.M.; Deyab, M.A. Studies on corrosion inhibition of aluminum in 1.0 M HCl and 1.0 M H2SO4 solutions by ethoxylated fatty acids. Mater. Chem. Phys. 2003, 82, 631–637. [Google Scholar] [CrossRef]
- Dumitrascu, V.; Benea, L.; Danaila, E. Corrosion behavior of aluminum oxide film growth by controlled anodic oxidation. IOP Conf. Ser. Mater. Sci. Eng. 2016, 209, 012016. [Google Scholar] [CrossRef]
Figure 1.
Microstructures (backscattered electron composition (BEC) mode) of the Al– (2–20 wt.%) Co alloys. (a) Al–2Co; (b) Al–5Co; (c) Al–7Co; (d) Al–10Co; (e) Al–15Co; and (f) Al–20Co.
Figure 1.
Microstructures (backscattered electron composition (BEC) mode) of the Al– (2–20 wt.%) Co alloys. (a) Al–2Co; (b) Al–5Co; (c) Al–7Co; (d) Al–10Co; (e) Al–15Co; and (f) Al–20Co.

Figure 2.
Potentiodynamic polarization curves of Al–(2–20) wt.% Co, as well as CP-Al in 1 M H2SO4, 25 °C: (a) Cyclic polarization; (b) forward polarization (Numbers 1, 2, 3, 4 refer to stages 1 (active), 2 (passive-like), 3 (transitional), 4 (passive-like); (c) comparison with leading commercial alloys.


Figure 3.
SEM micrographs (secondary electron (SE) mode) after cyclic polarization in 1 M H2SO4, at 25 °C. (a–d): Exposed surface; (e,f): Cross section view.
Figure 3.
SEM micrographs (secondary electron (SE) mode) after cyclic polarization in 1 M H2SO4, at 25 °C. (a–d): Exposed surface; (e,f): Cross section view.

Figure 4.
Cyclic potentiodynamic polarization curves of Al– (2–20) wt.% Co in H2SO4 at 25 °C.

Figure 5.
Chronoamperometry plots of Al–5 wt.% Co and Al–20 wt.% Co alloys at an active potential (−360 mV vs. Ag/AgCl), a potential in passive-like stage 2 (0 mV vs. Ag/AgCl), a potential in transition stage 3 (280 mV vs. Ag/AgCl), and a potential in passive-like stage 4 for Al–20 wt.% Co or upper passive stage 2 for Al–5 wt.% Co (600 mV vs. Ag/AgCl), during immersion in 1 M H2SO4, 25 °C.

Figure 6.
Surface (SE mode) of Al–5 wt.% Co after chronoamperometry in 1 M H2SO4, 25 °C: (a) 0 mV vs. Ag/AgCl (low passive-like stage 2); (b) 600 mV vs. Ag/AgCl (upper passive-like stage 2) and typical point EDX spectra from the matrix and reinforcement.
Figure 6.
Surface (SE mode) of Al–5 wt.% Co after chronoamperometry in 1 M H2SO4, 25 °C: (a) 0 mV vs. Ag/AgCl (low passive-like stage 2); (b) 600 mV vs. Ag/AgCl (upper passive-like stage 2) and typical point EDX spectra from the matrix and reinforcement.

Figure 7.
Surface (SE mode) of Al–20 wt.% Co after chronoamperometry in 1 M H2SO4, 25 °C: (a) 0 mV vs. Ag/AgCl (pseudopassive stage 2); (b) 600 mV vs. Ag/AgCl (pseudopassive stage 4) and EDX map (red: S, yellow: O, green: Co, turquoise: Al).
Figure 7.
Surface (SE mode) of Al–20 wt.% Co after chronoamperometry in 1 M H2SO4, 25 °C: (a) 0 mV vs. Ag/AgCl (pseudopassive stage 2); (b) 600 mV vs. Ag/AgCl (pseudopassive stage 4) and EDX map (red: S, yellow: O, green: Co, turquoise: Al).

Figure 8.
Surface (SE mode) of Al–15 wt.% Co after cyclic potentiodynamic polarization in 1 M H2SO4 at 25 °C and typical point EDX spectra from the Al-matrix (right) and Al9Co2 reinforcement (left).
Figure 8.
Surface (SE mode) of Al–15 wt.% Co after cyclic potentiodynamic polarization in 1 M H2SO4 at 25 °C and typical point EDX spectra from the Al-matrix (right) and Al9Co2 reinforcement (left).

Figure 9.
Representative Raman spectra from the surface of Al–15 wt.% Co after chronoamperometry (1 M H2SO4, 25 °C). d: Diaspore, b: Boehmite, g: Gibbsite, ba: Bayerite, ¾: Co3O4.
Figure 9.
Representative Raman spectra from the surface of Al–15 wt.% Co after chronoamperometry (1 M H2SO4, 25 °C). d: Diaspore, b: Boehmite, g: Gibbsite, ba: Bayerite, ¾: Co3O4.

Figure 10.
The baselines of the spectra of Figure 9 magnified along the y-axis. Spectra from the surface of the (a,e) Al-matrix after chronoamperometry at 0 mV and 600 mV vs. Ag/AgCl, respectively; (b–d) Al9Co2 phase after chronoamperometry at 0 mV, 280 mV and 600 mV vs. Ag/AgCl, respectively.
Figure 10.
The baselines of the spectra of Figure 9 magnified along the y-axis. Spectra from the surface of the (a,e) Al-matrix after chronoamperometry at 0 mV and 600 mV vs. Ag/AgCl, respectively; (b–d) Al9Co2 phase after chronoamperometry at 0 mV, 280 mV and 600 mV vs. Ag/AgCl, respectively.


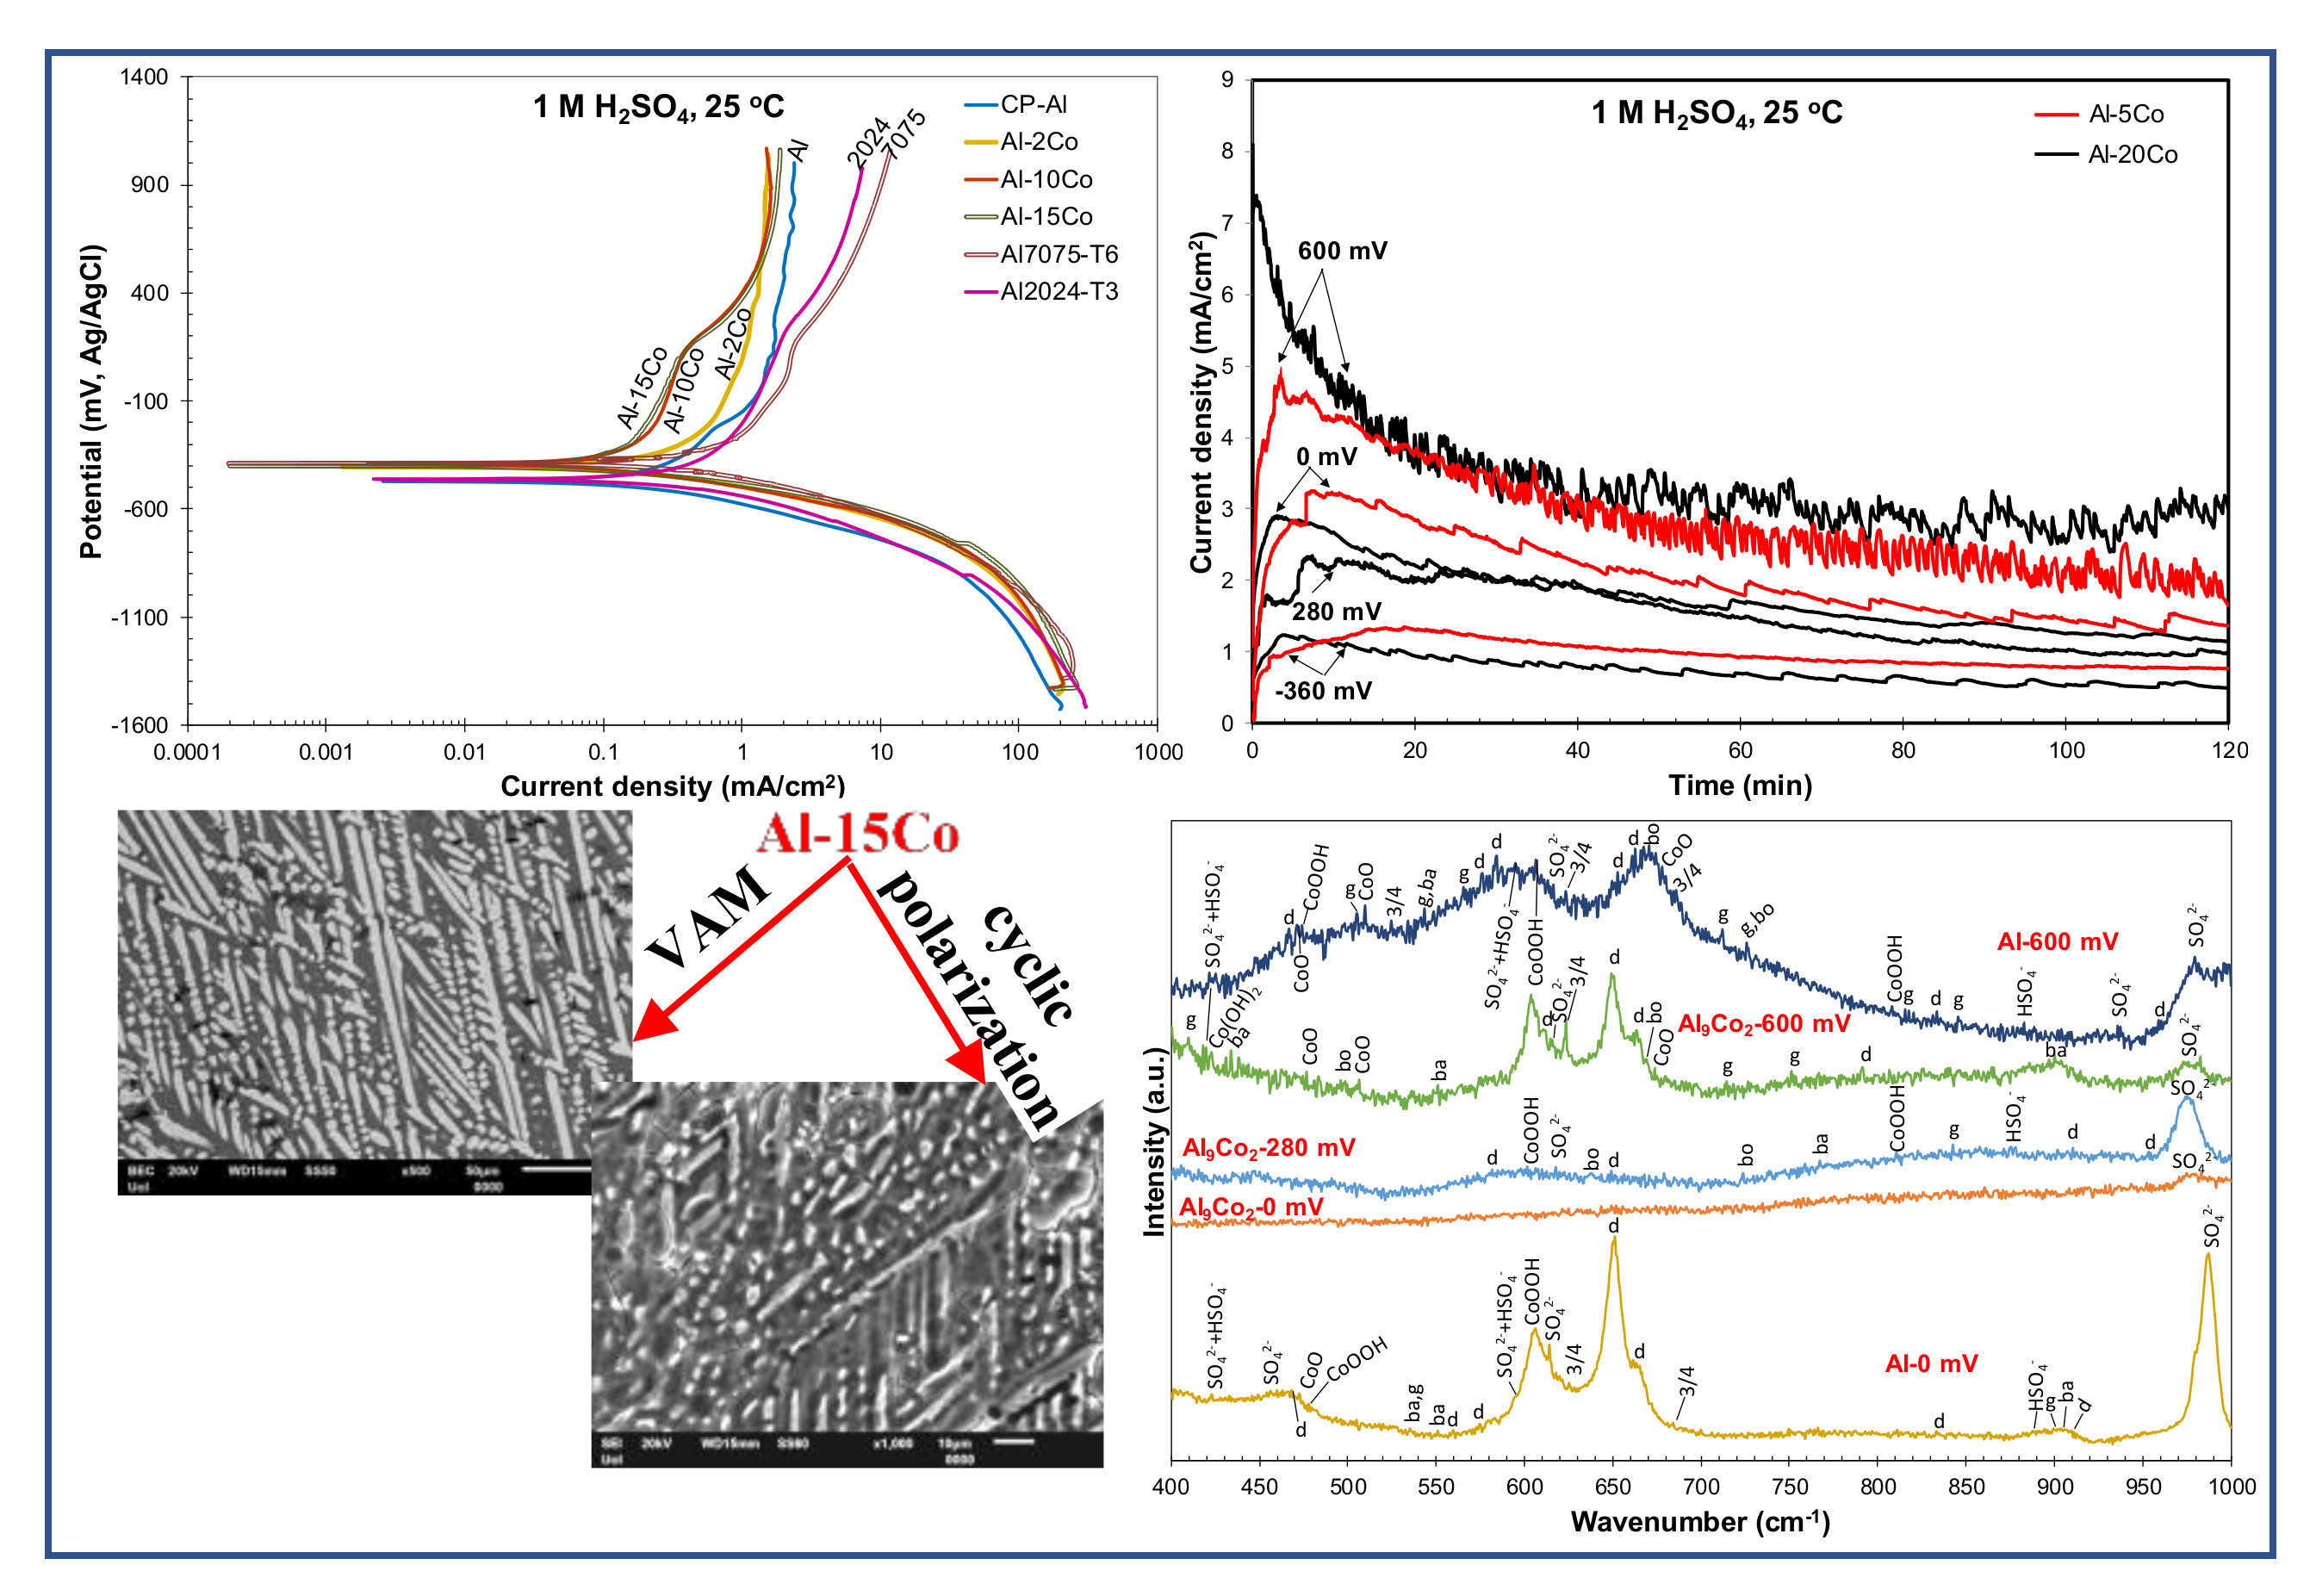
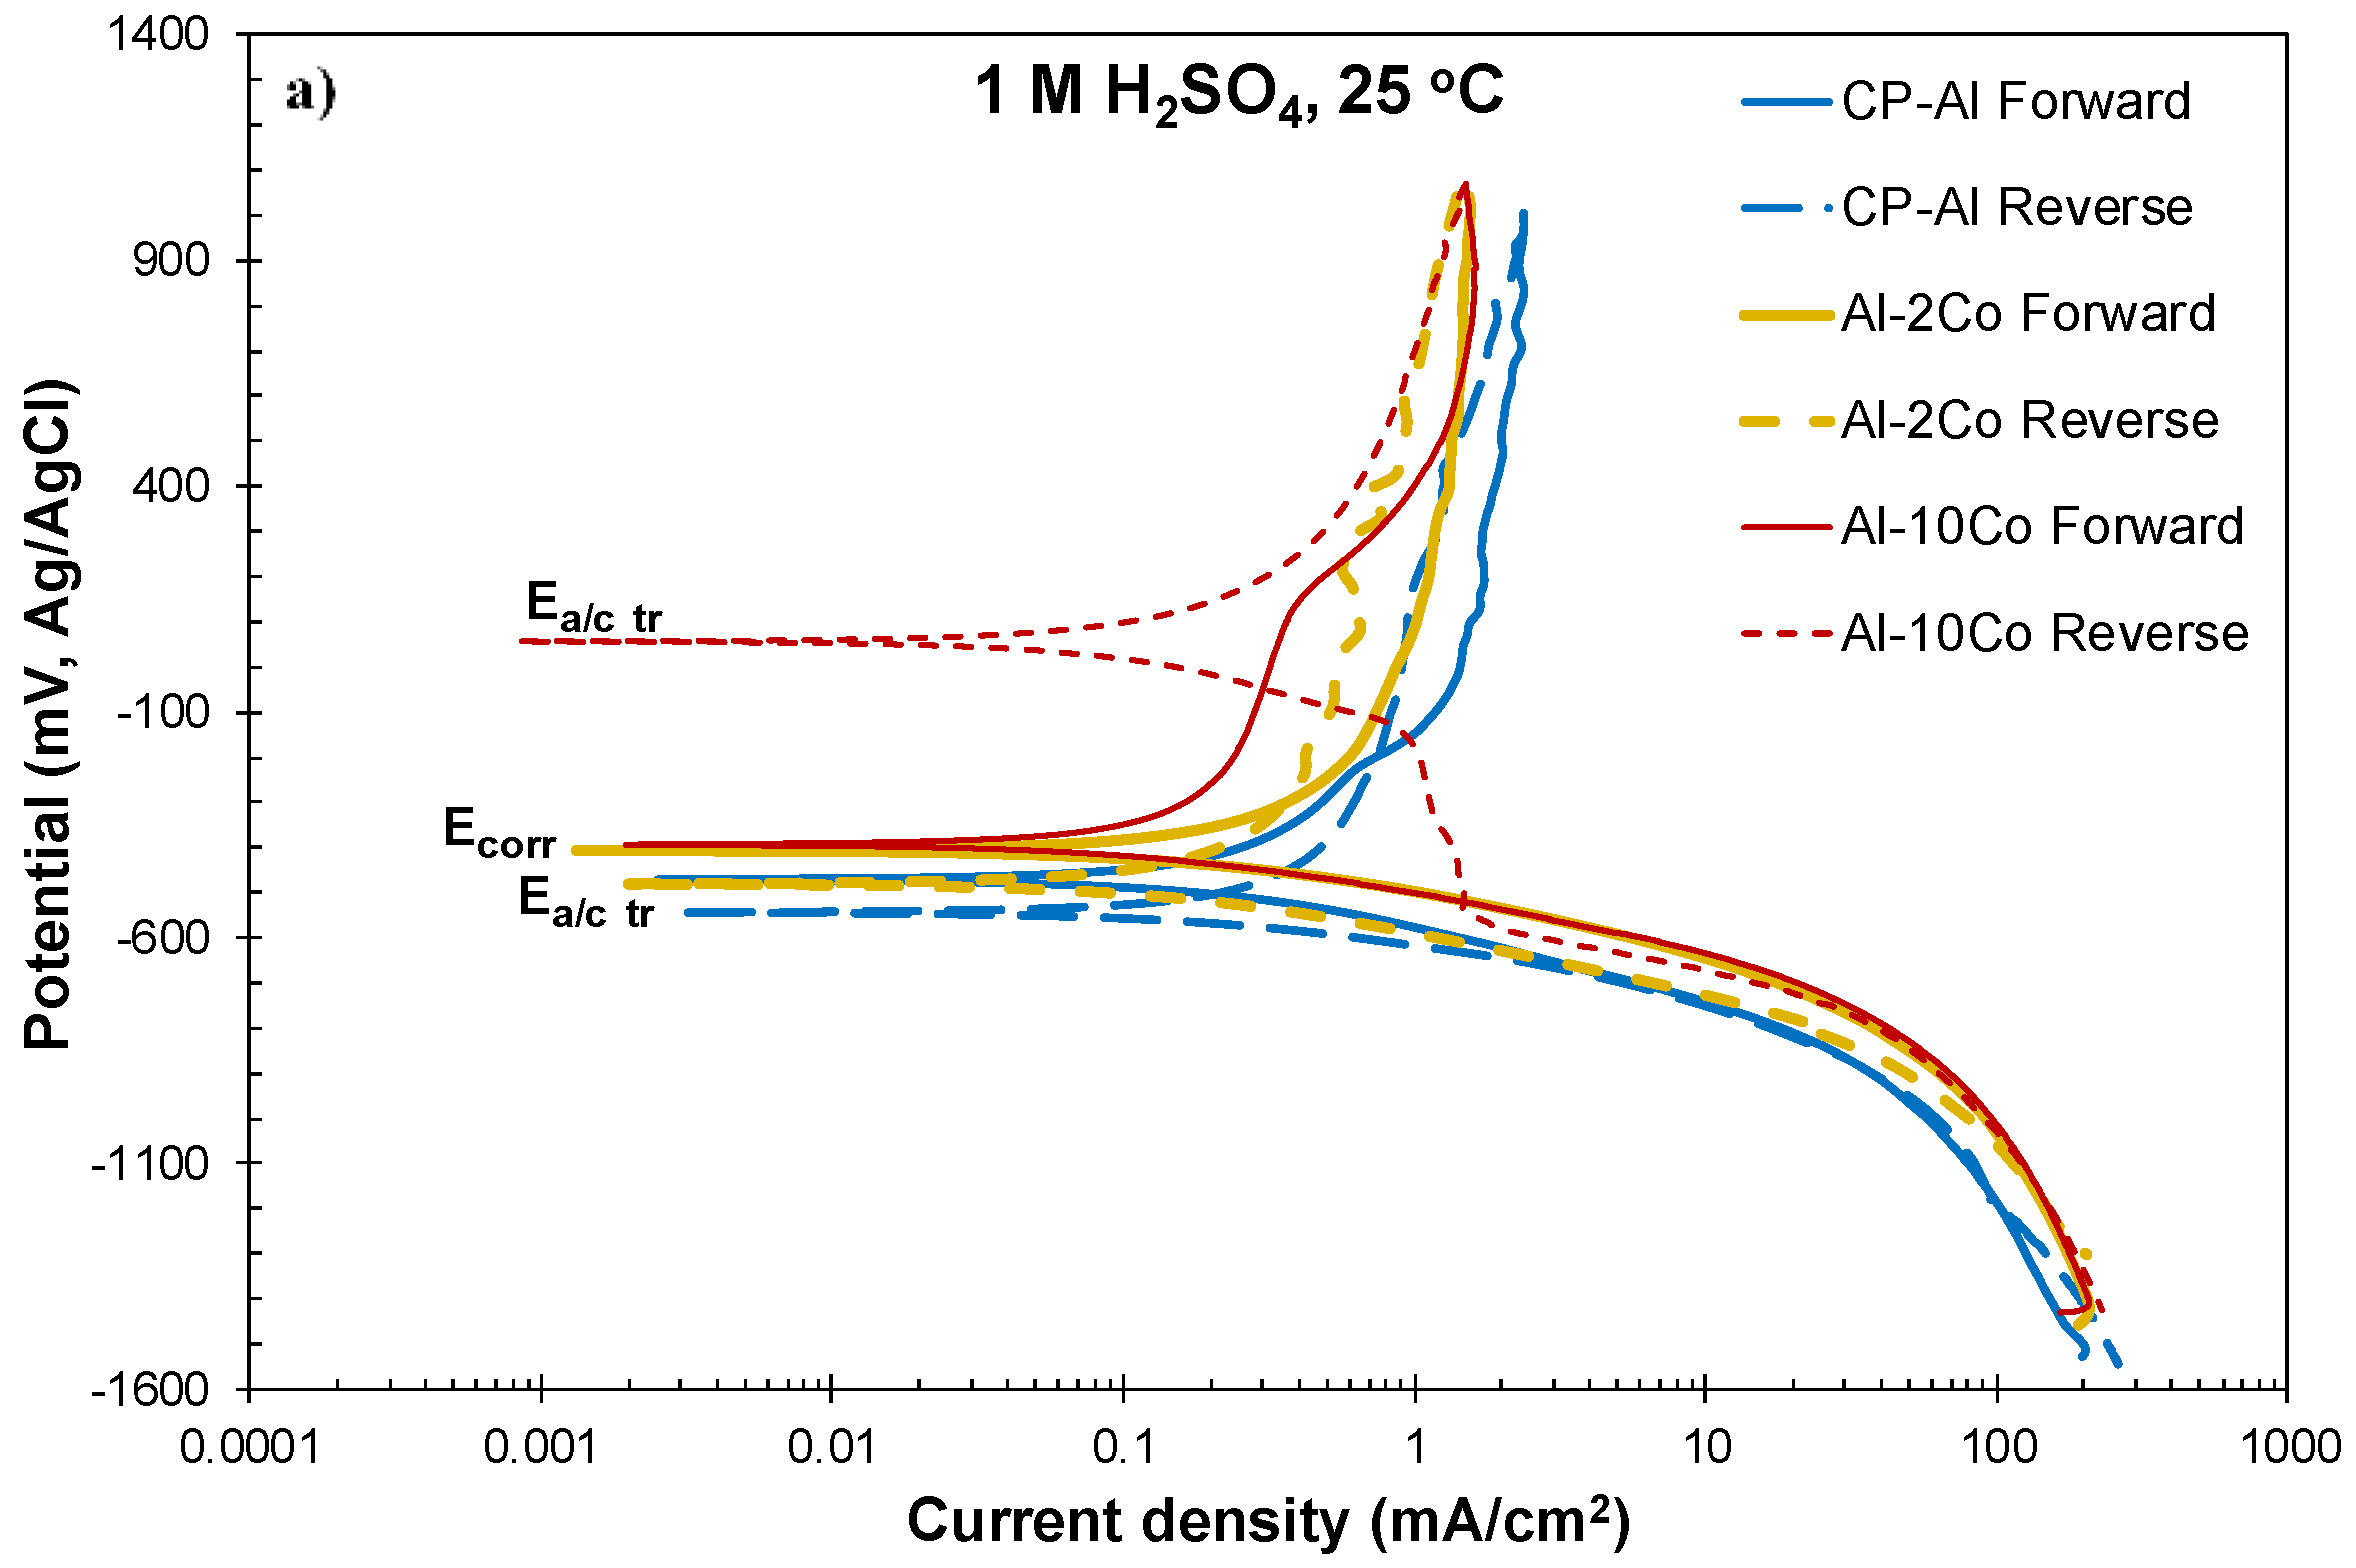
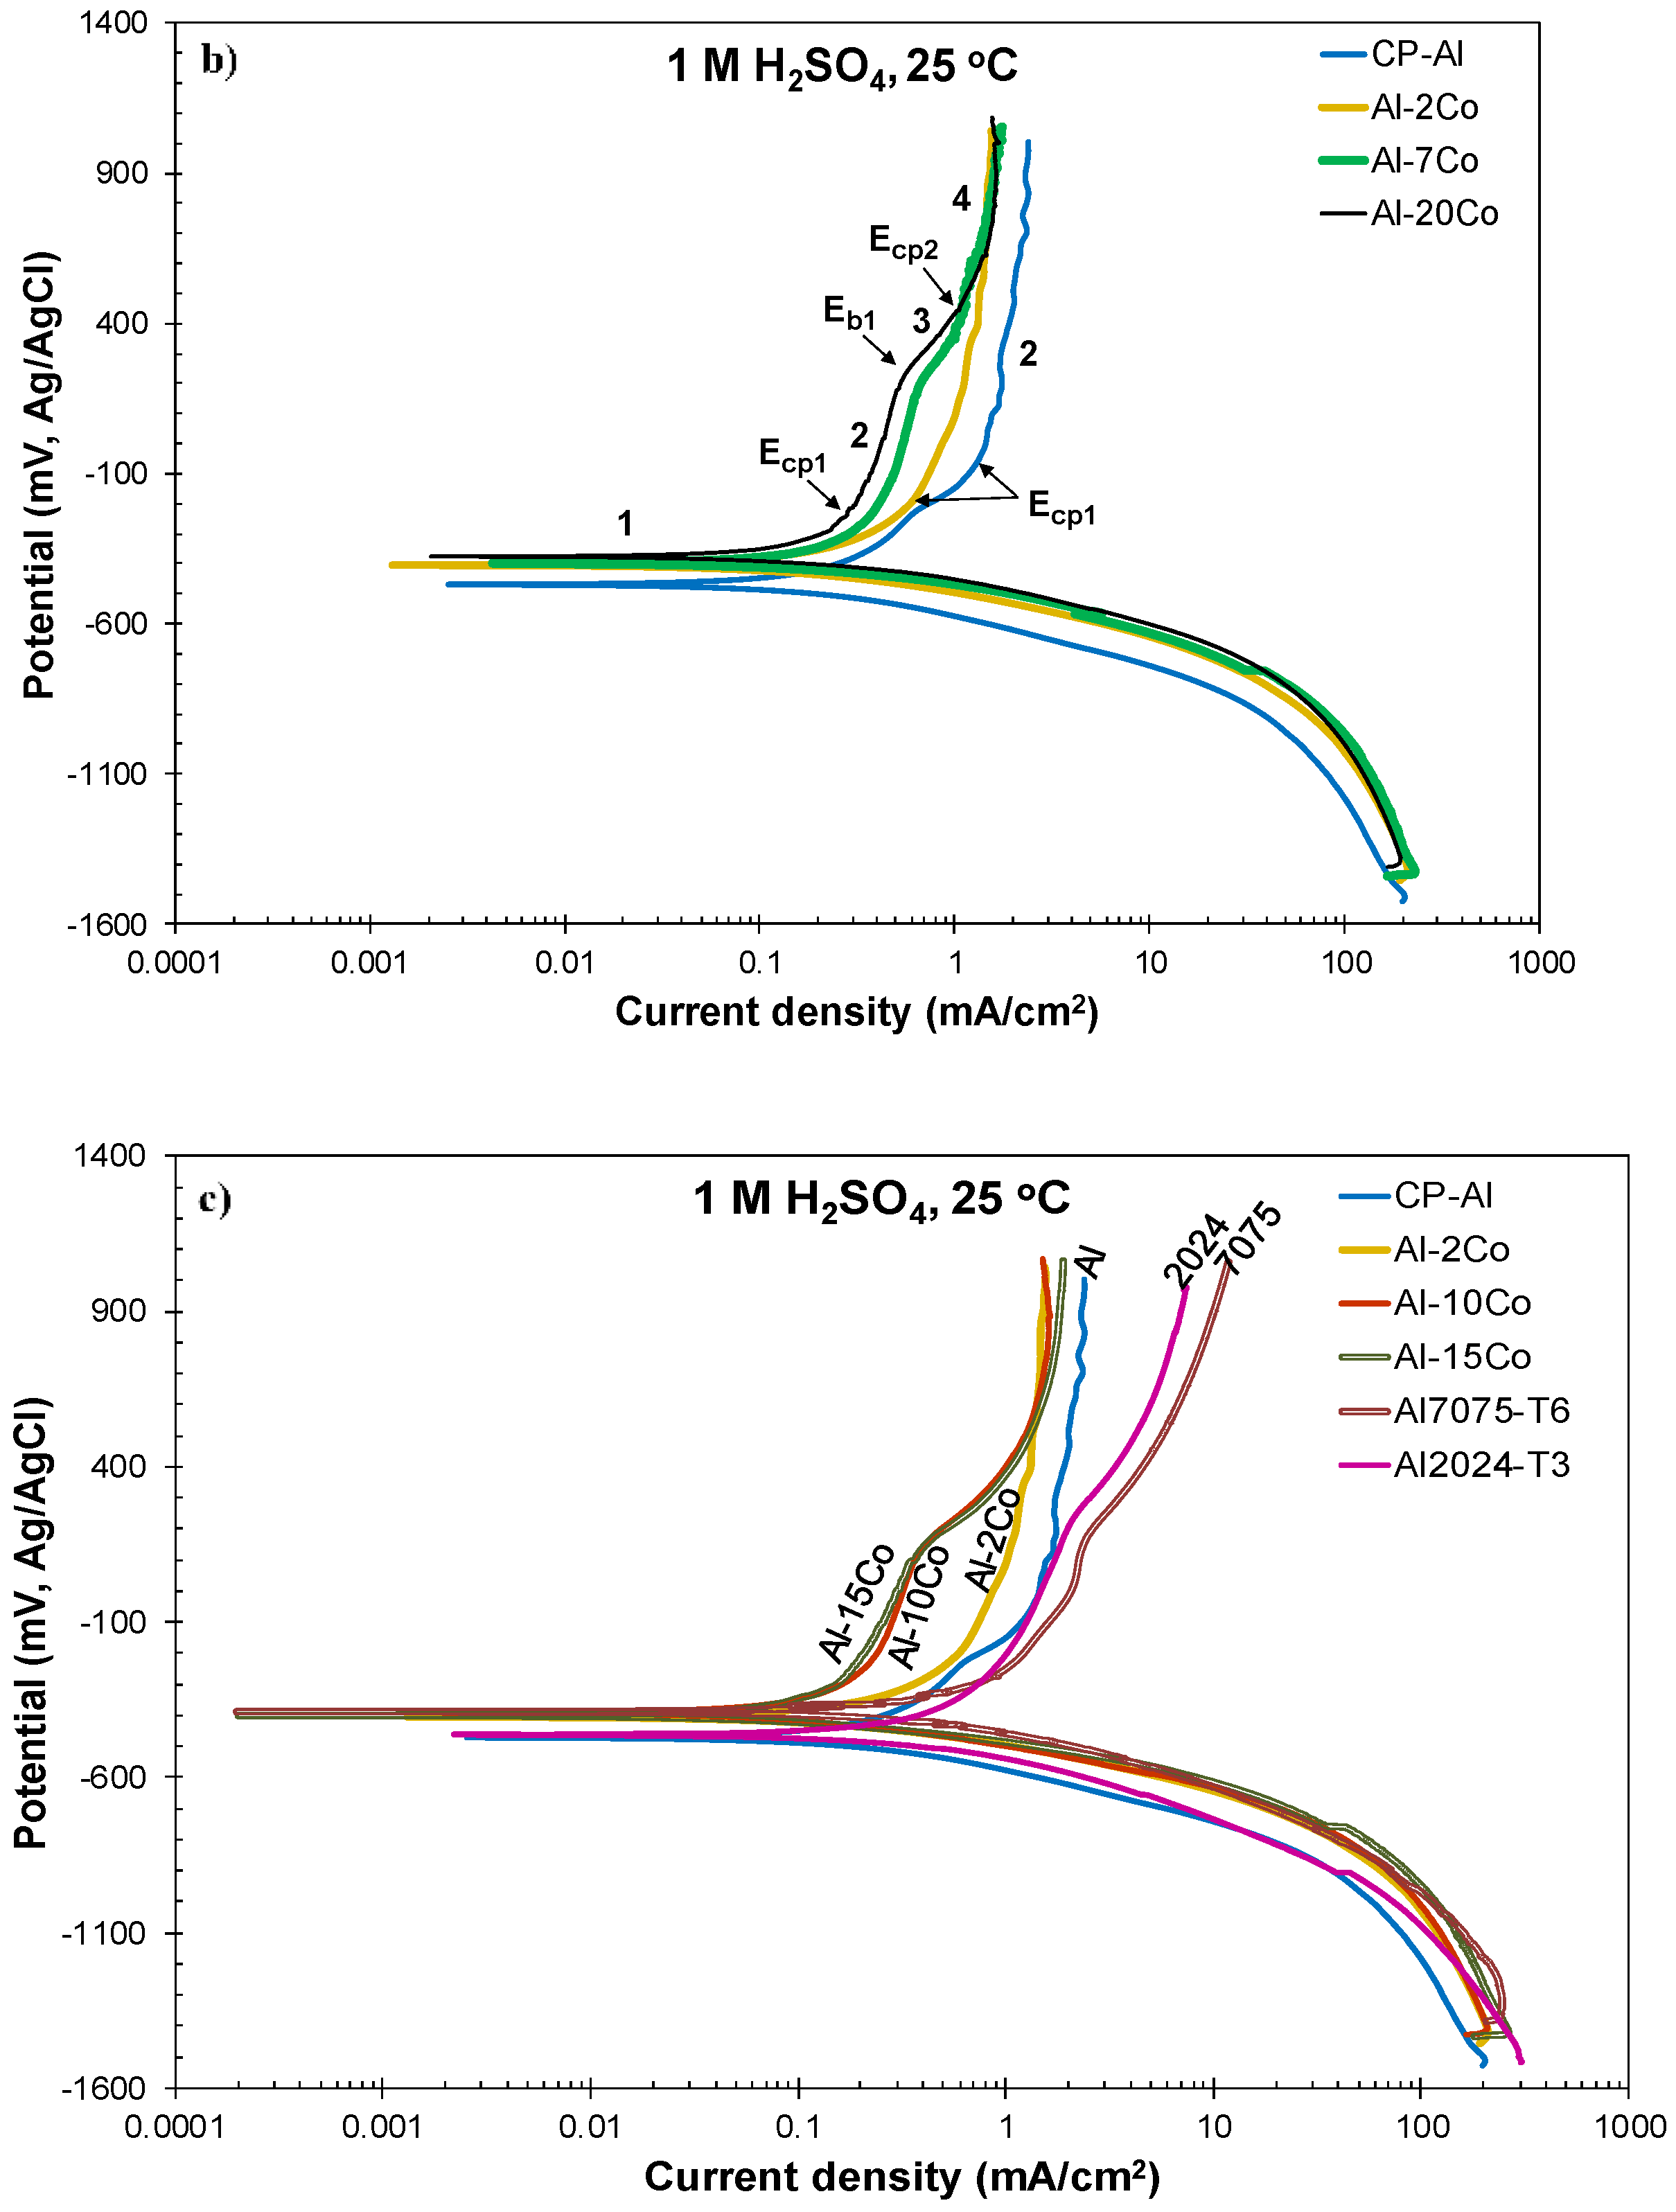
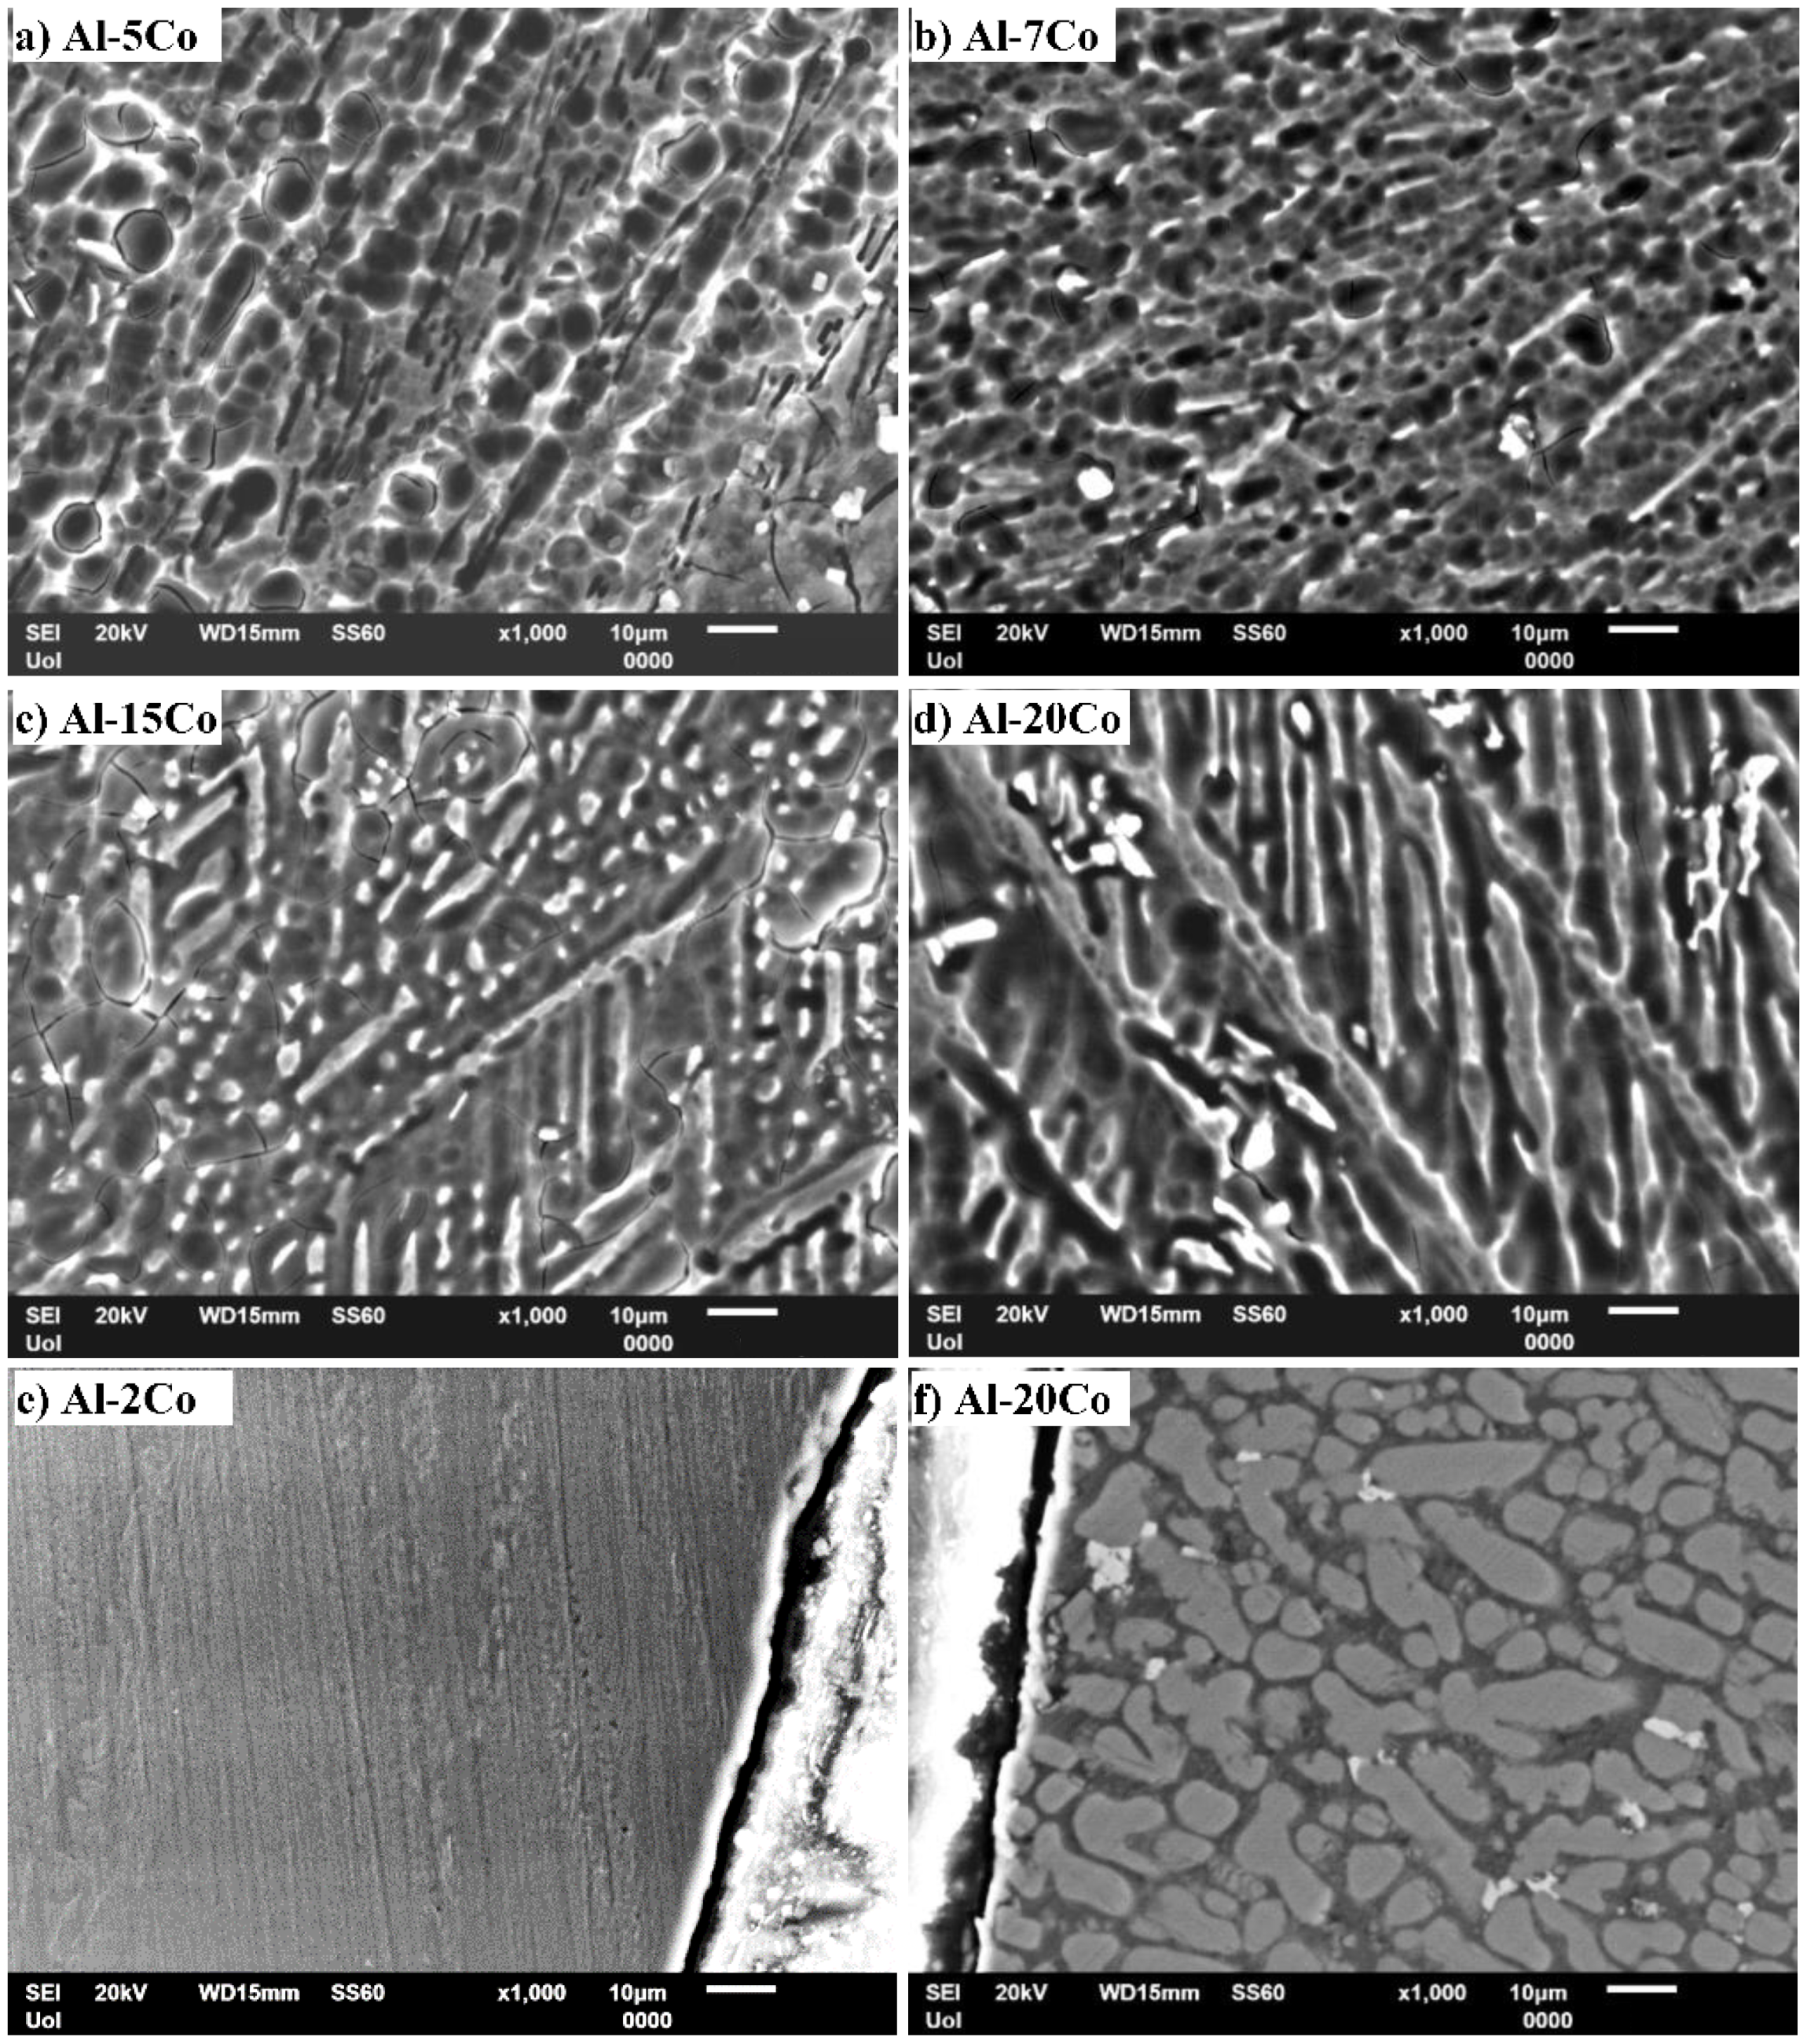
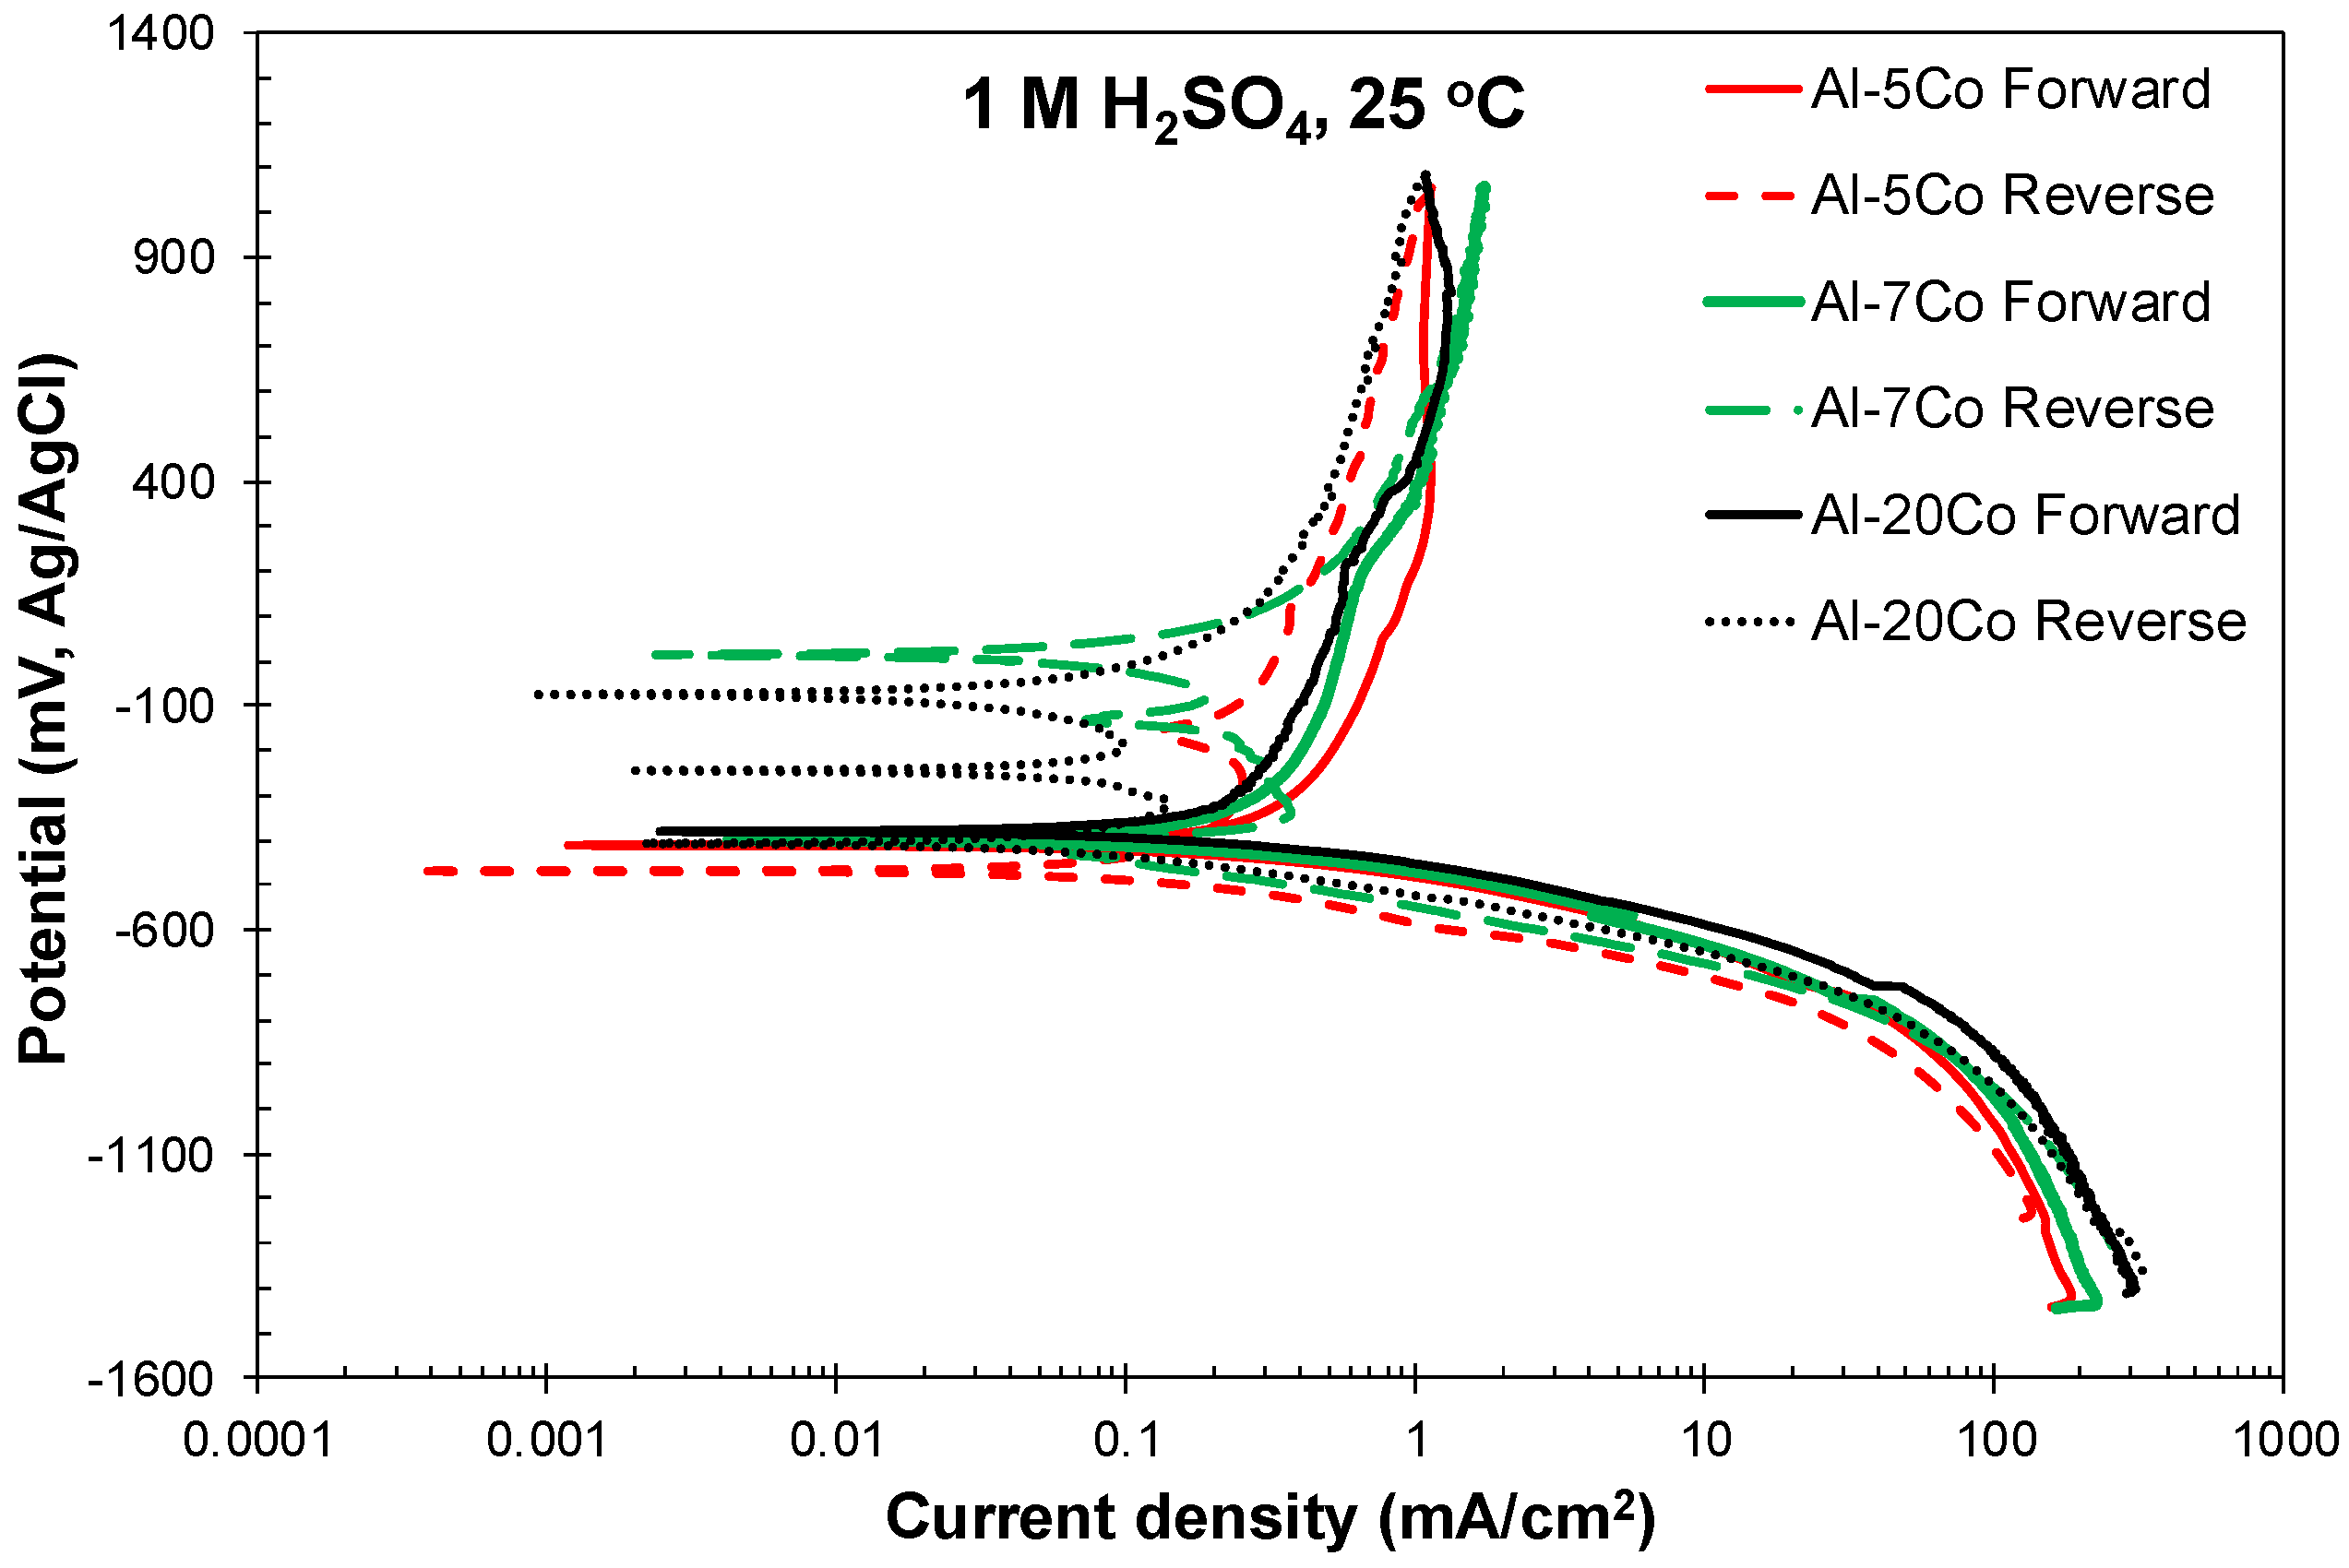
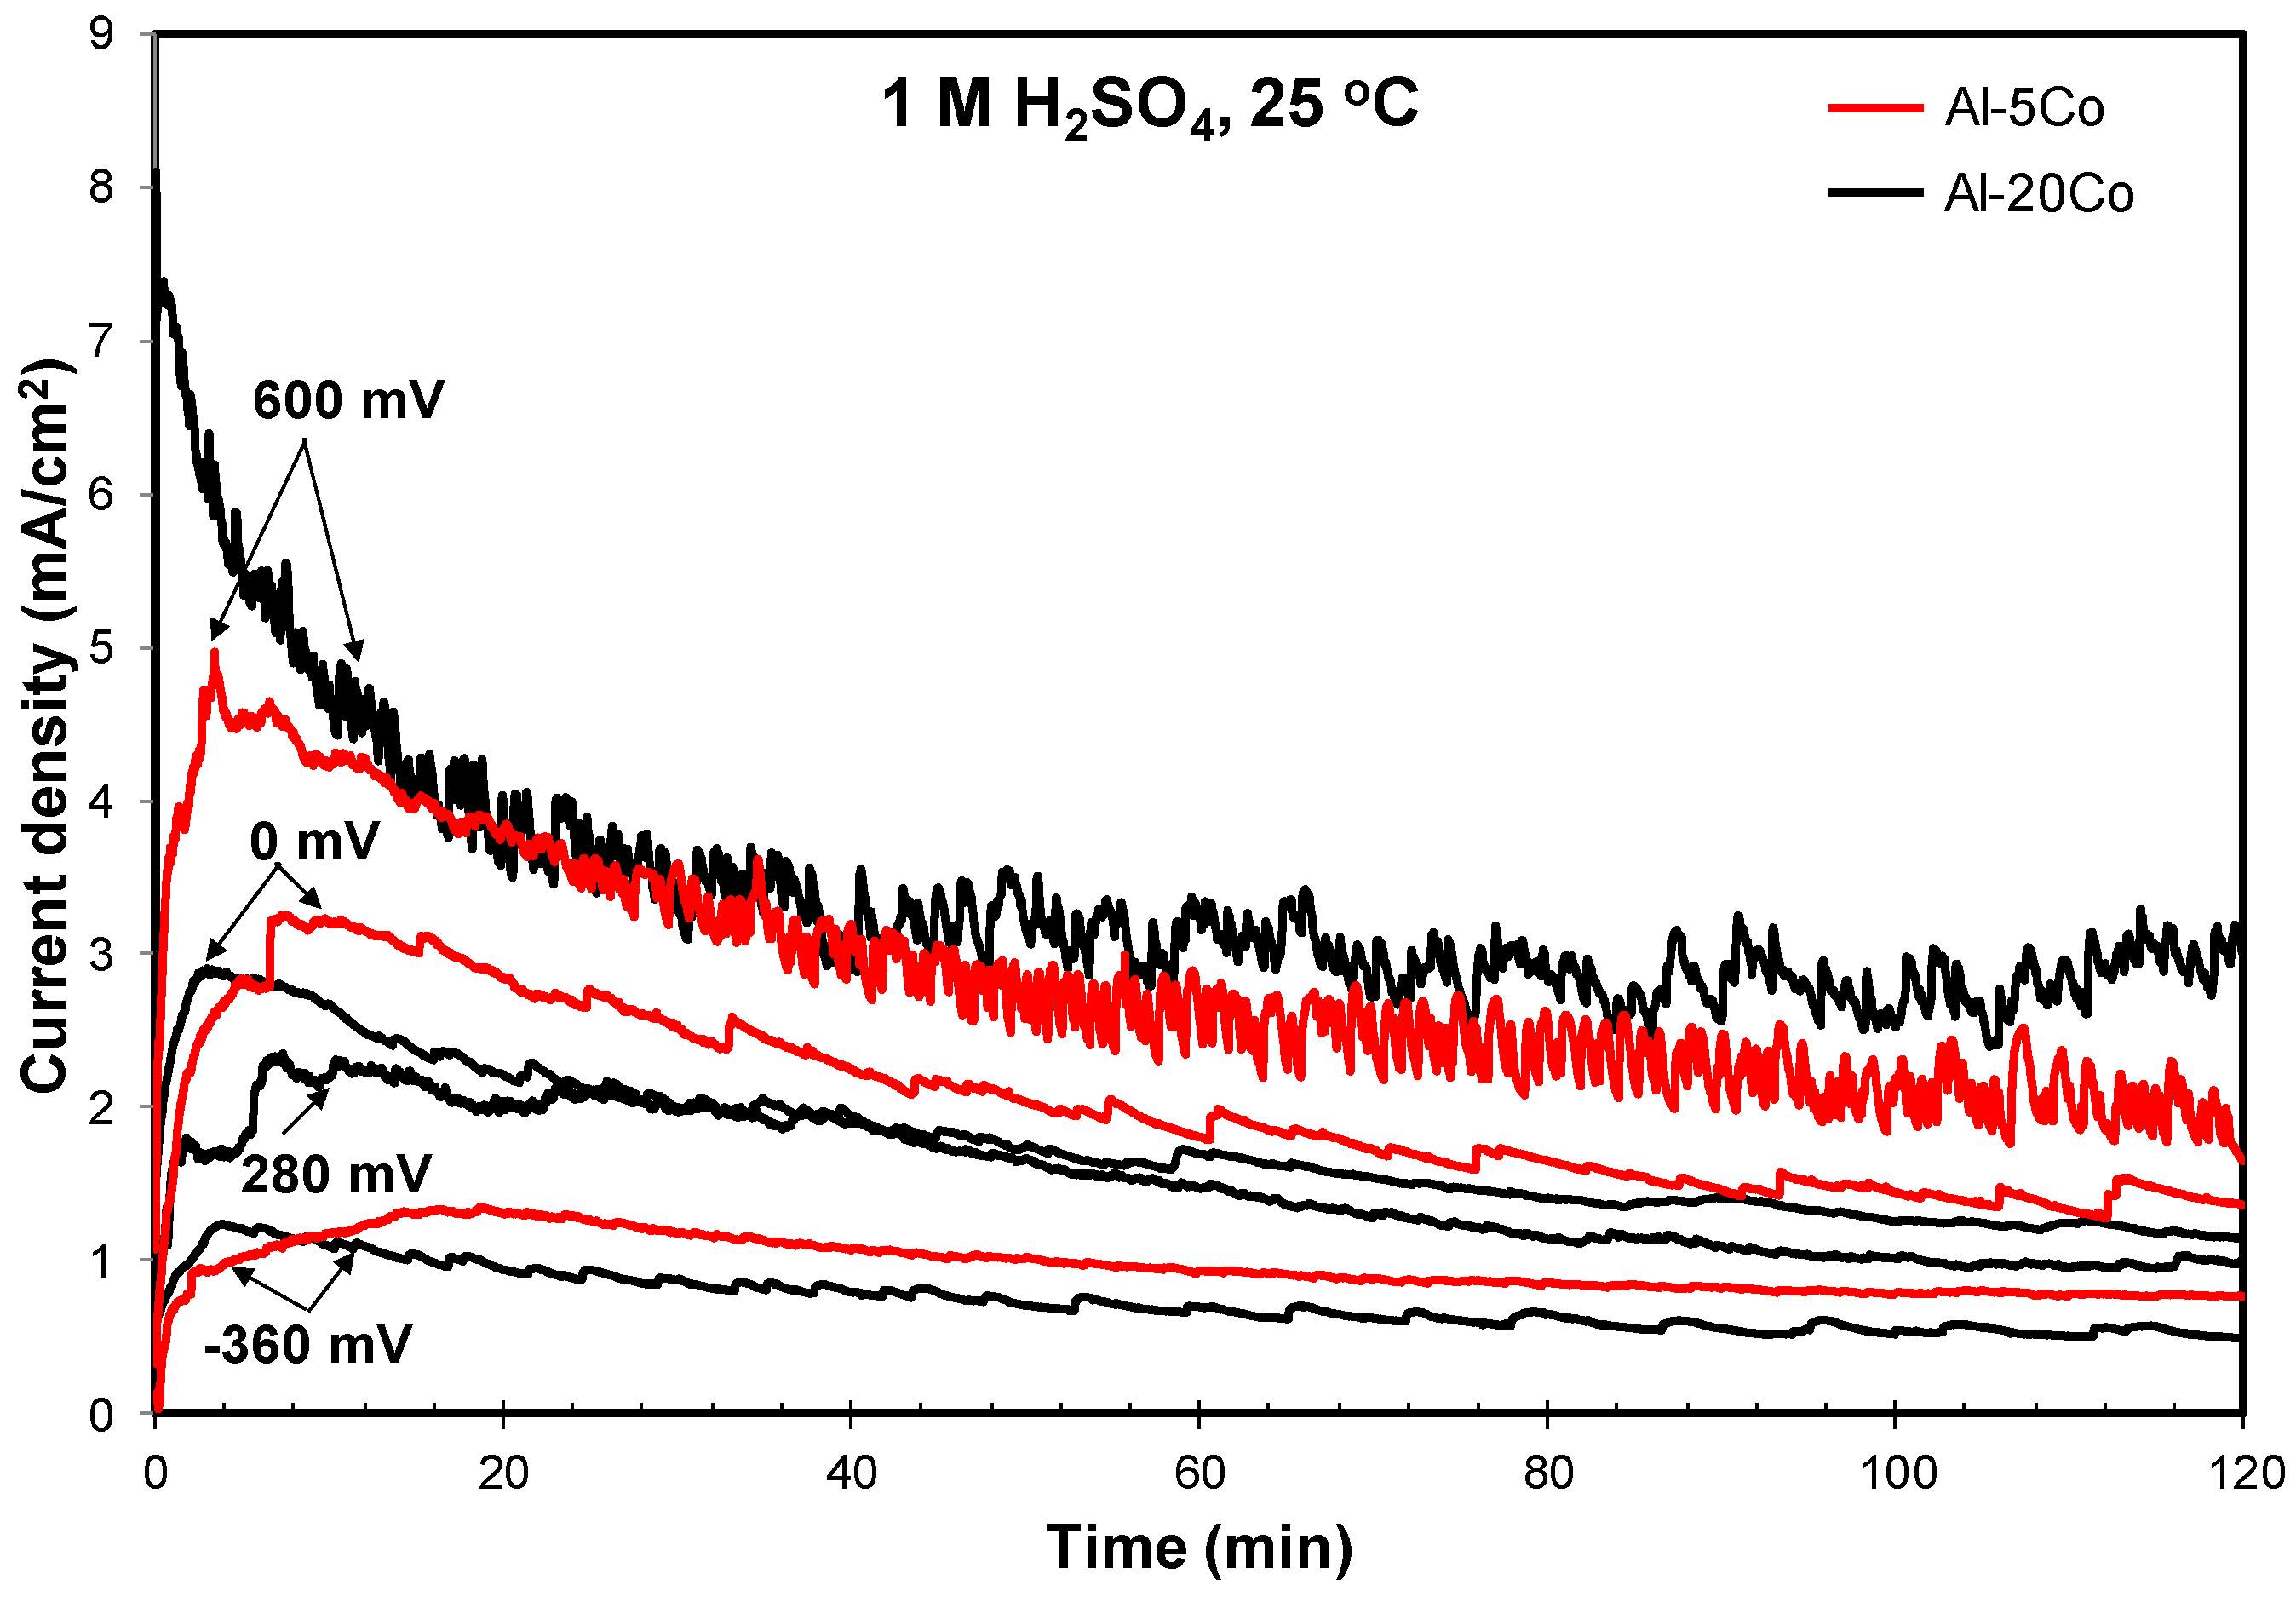
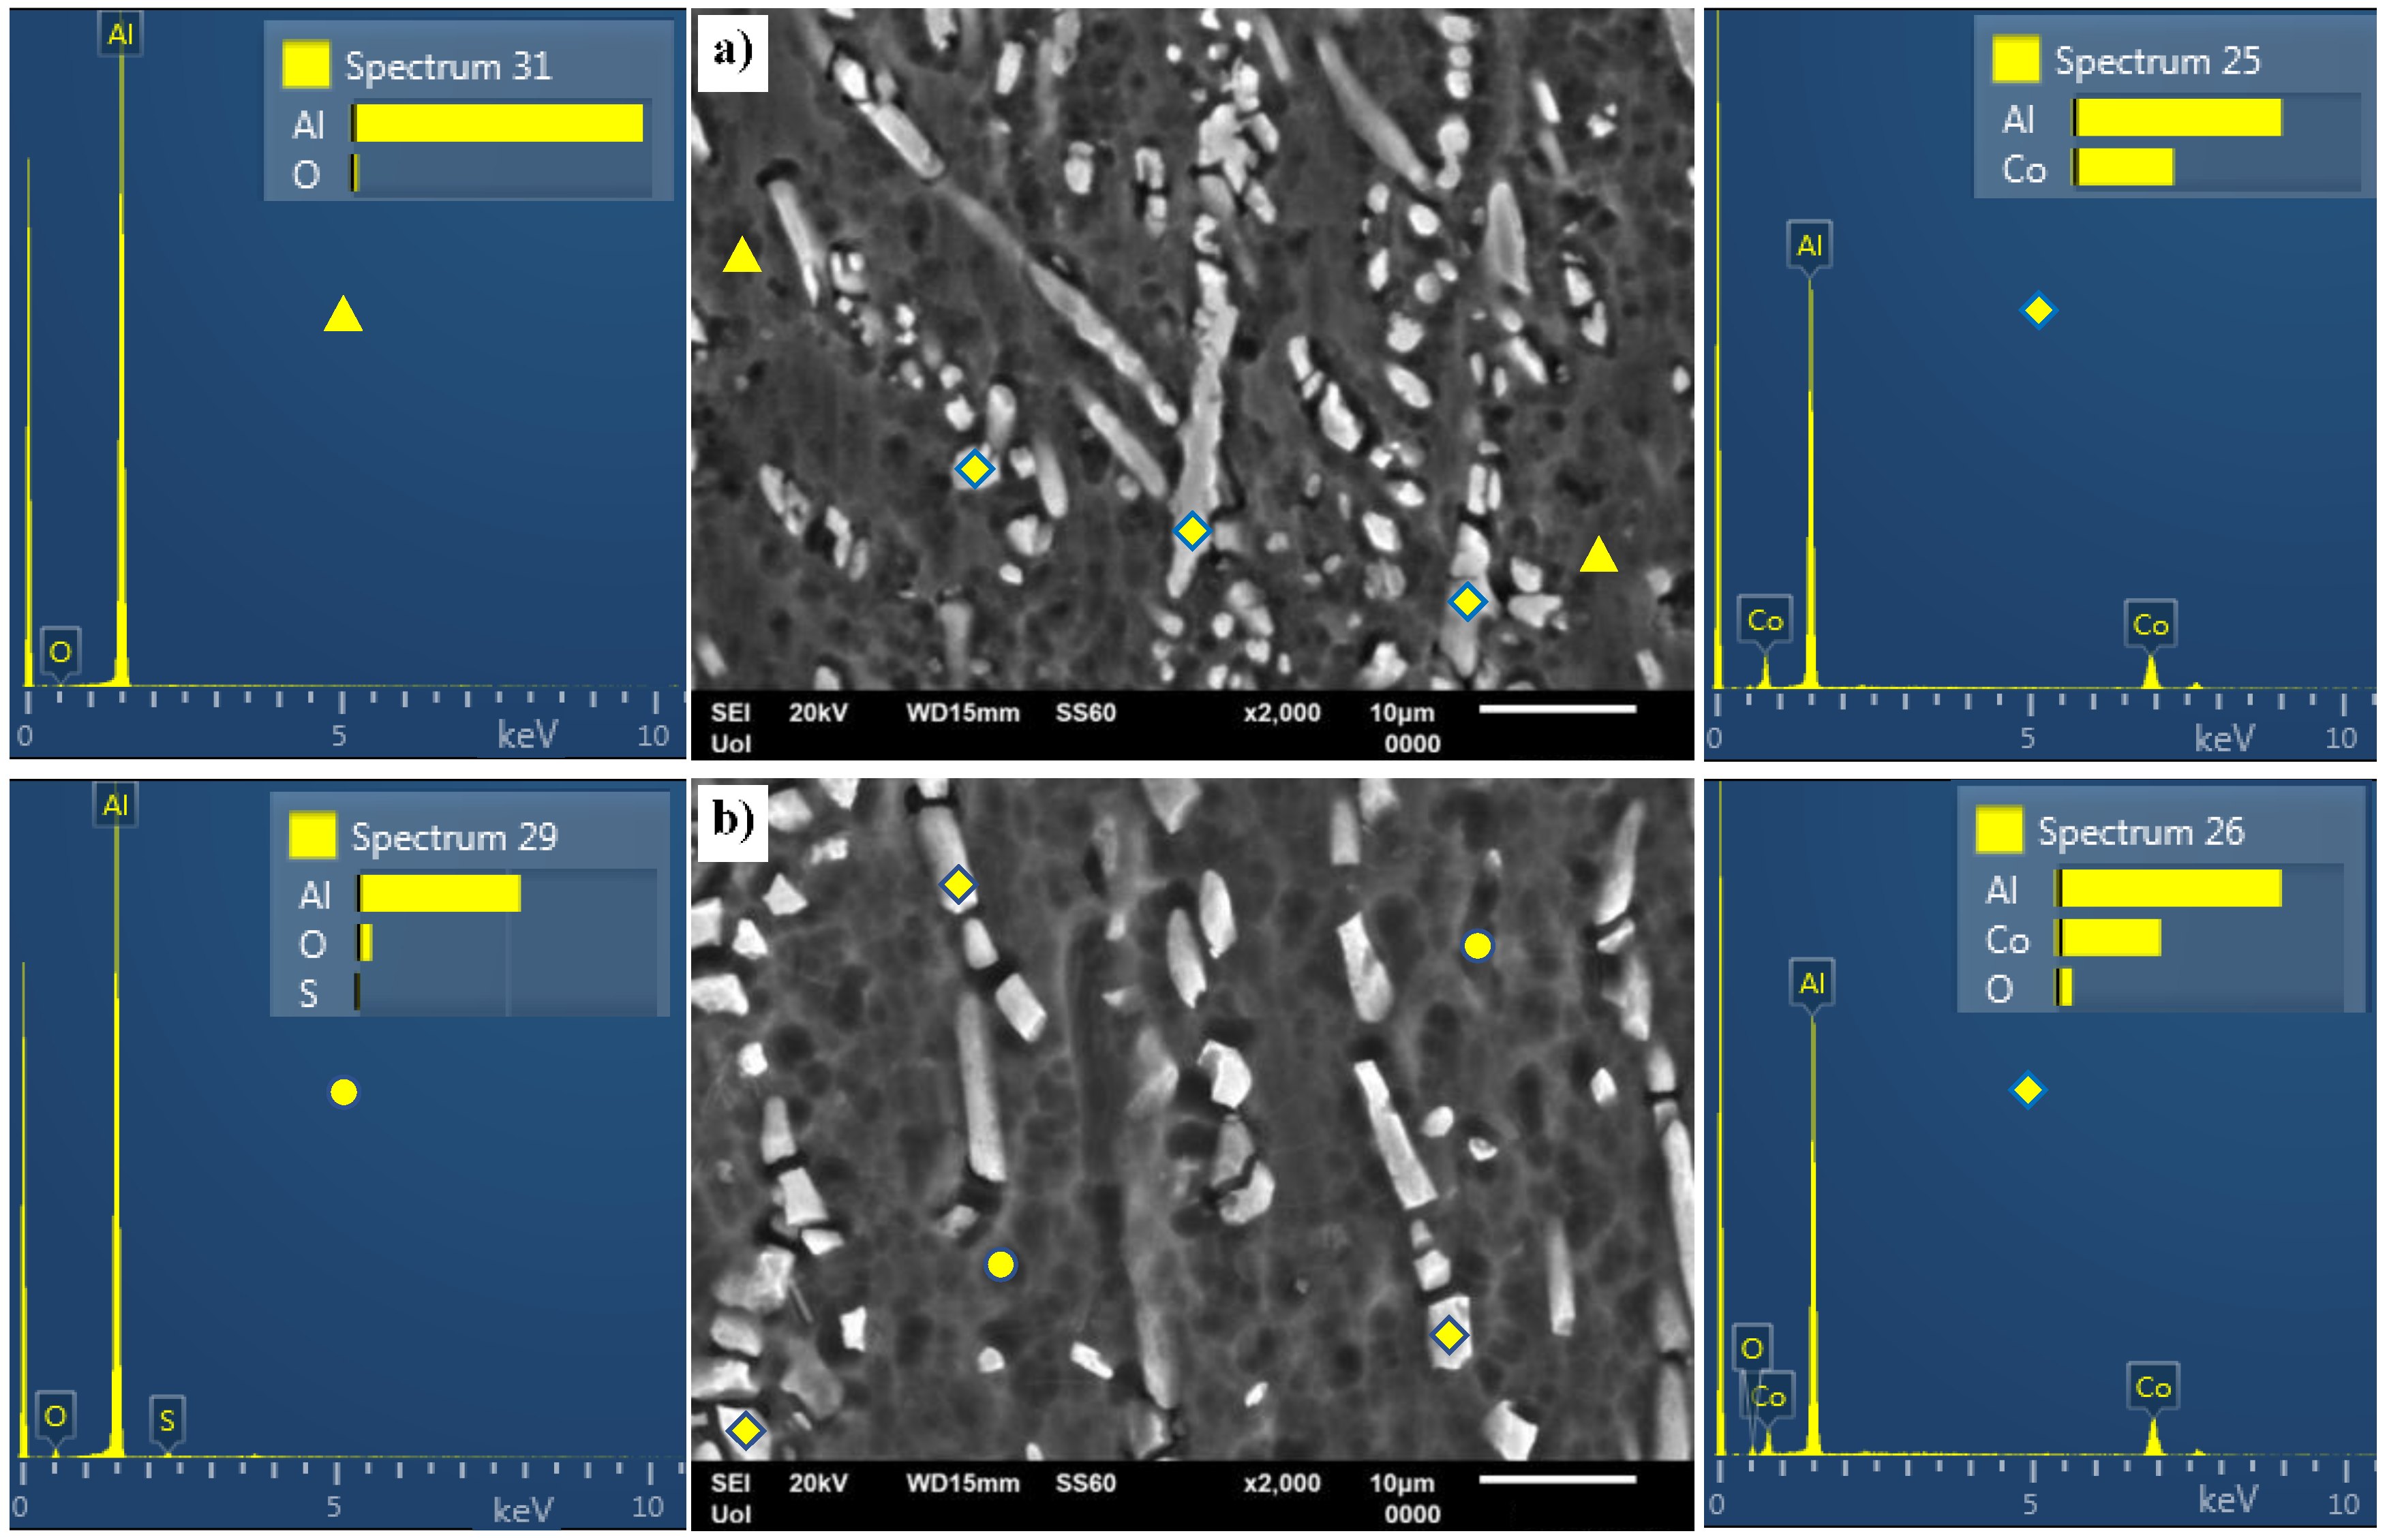
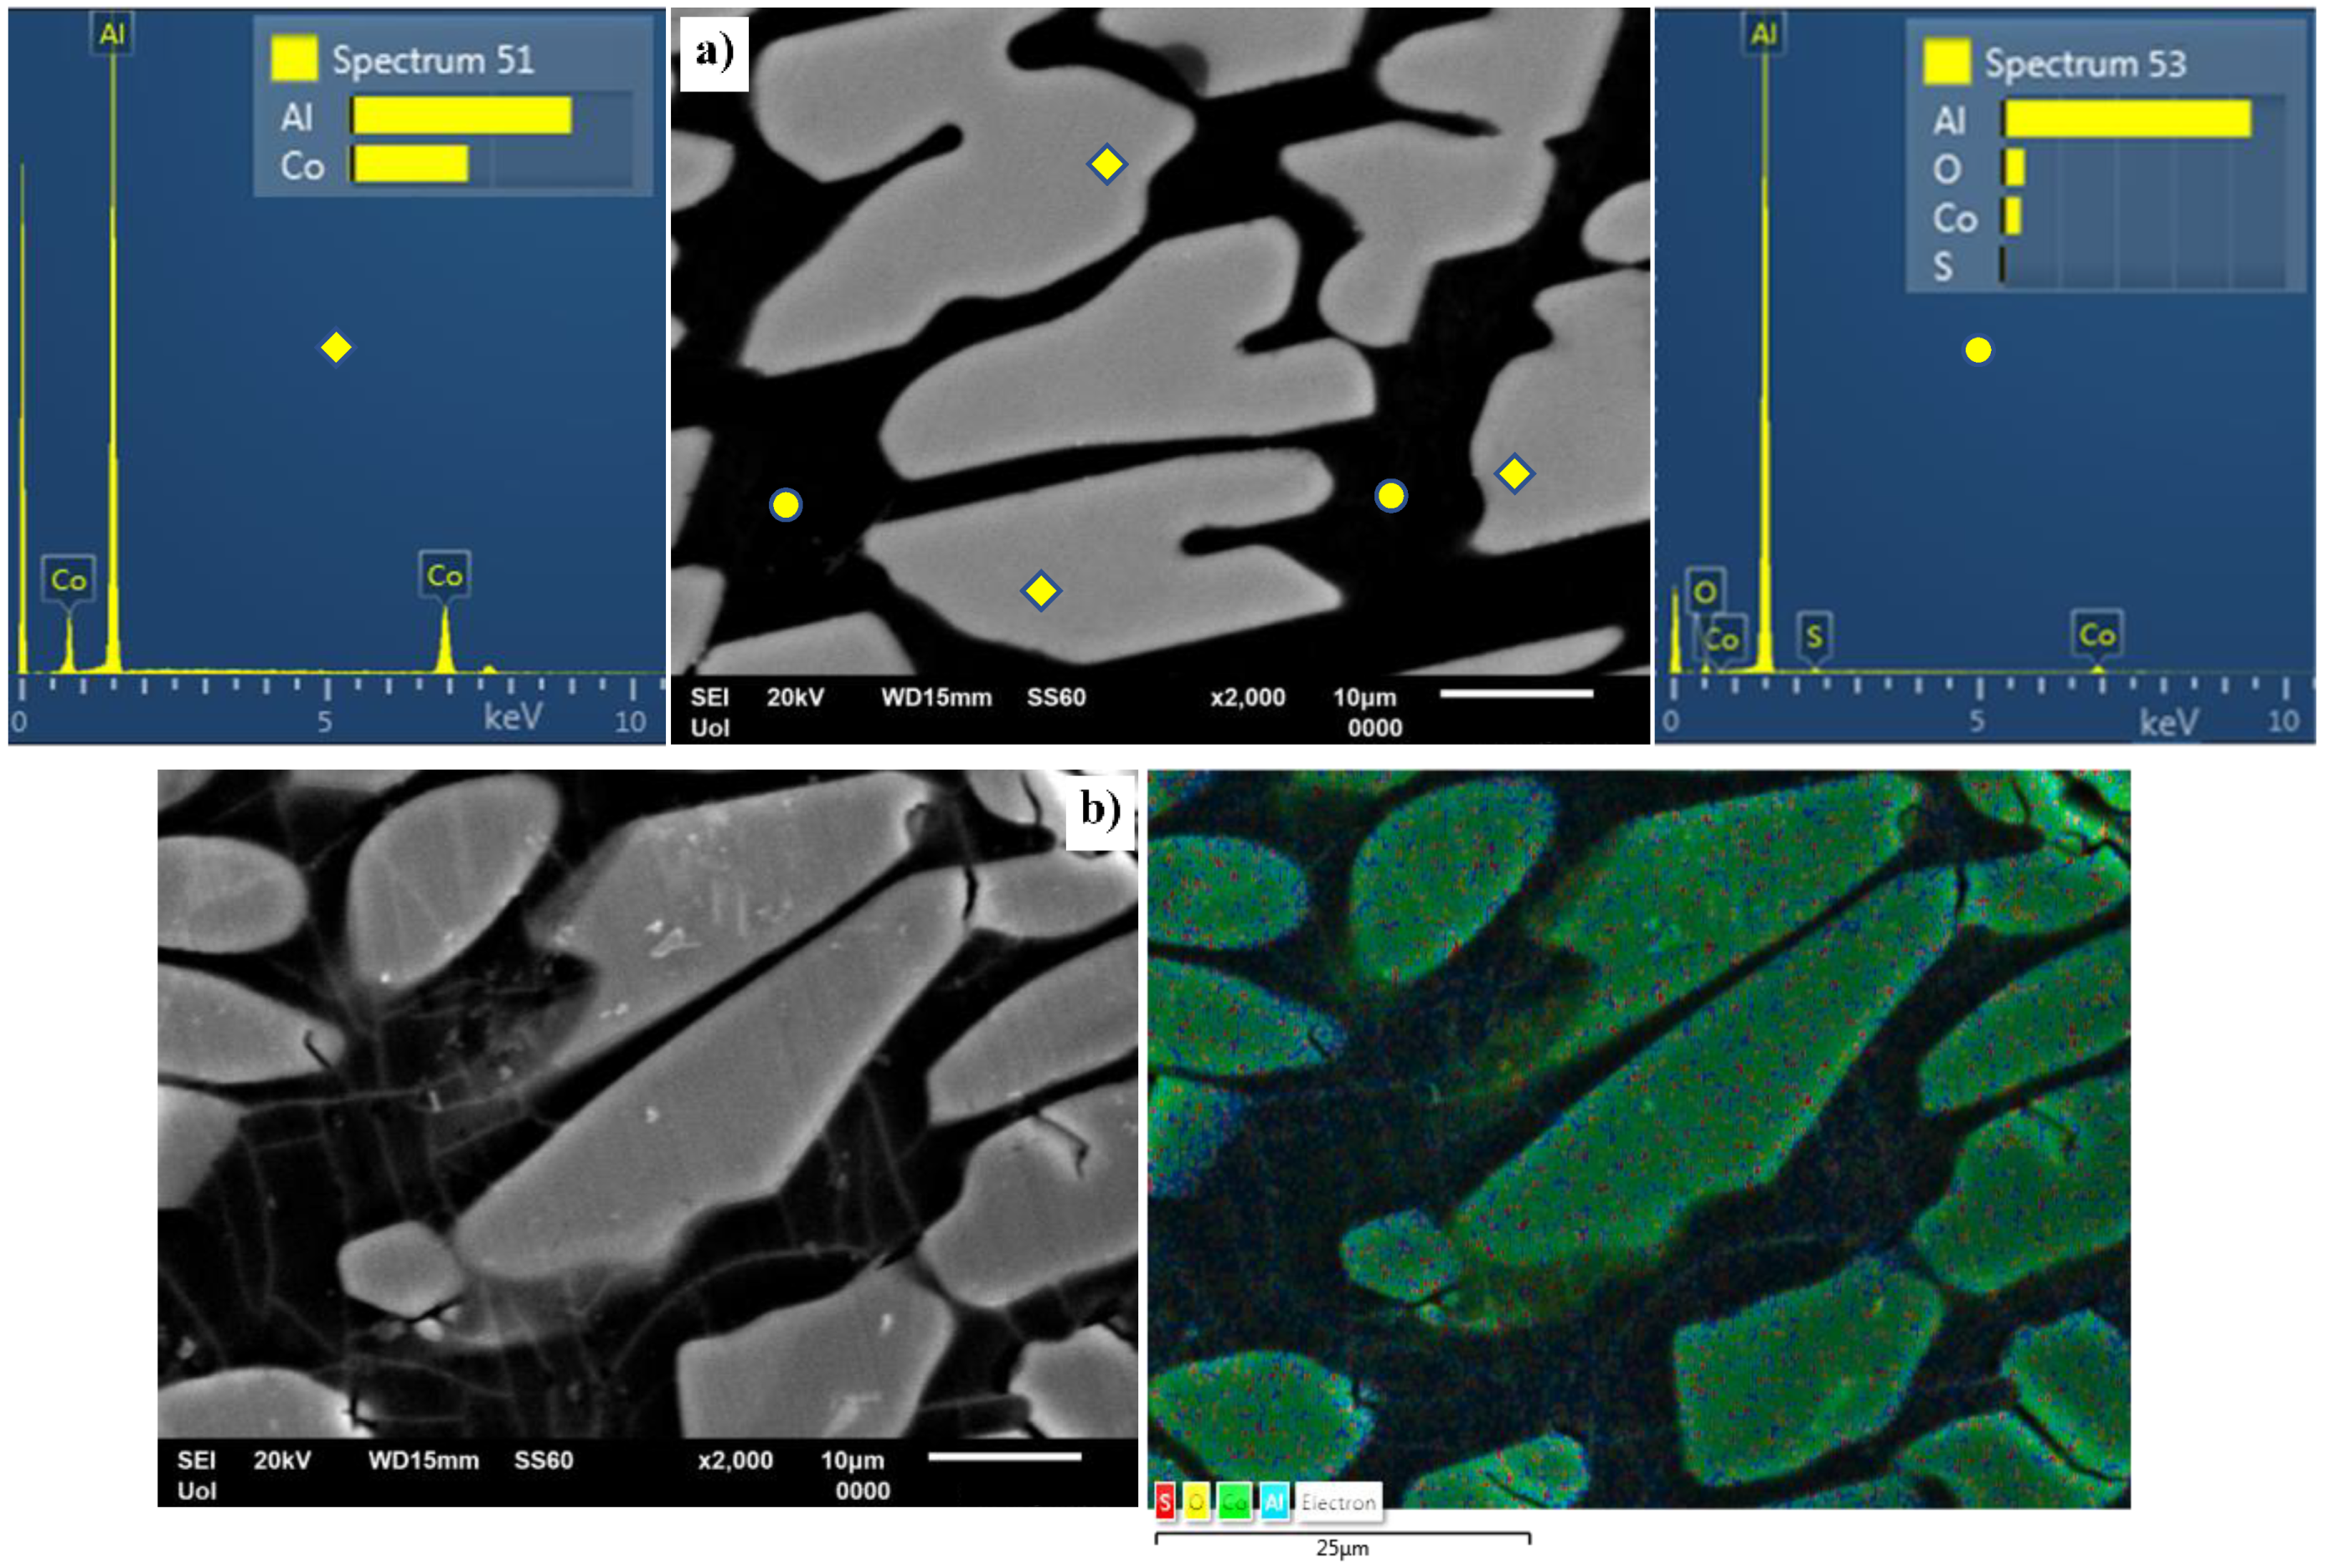
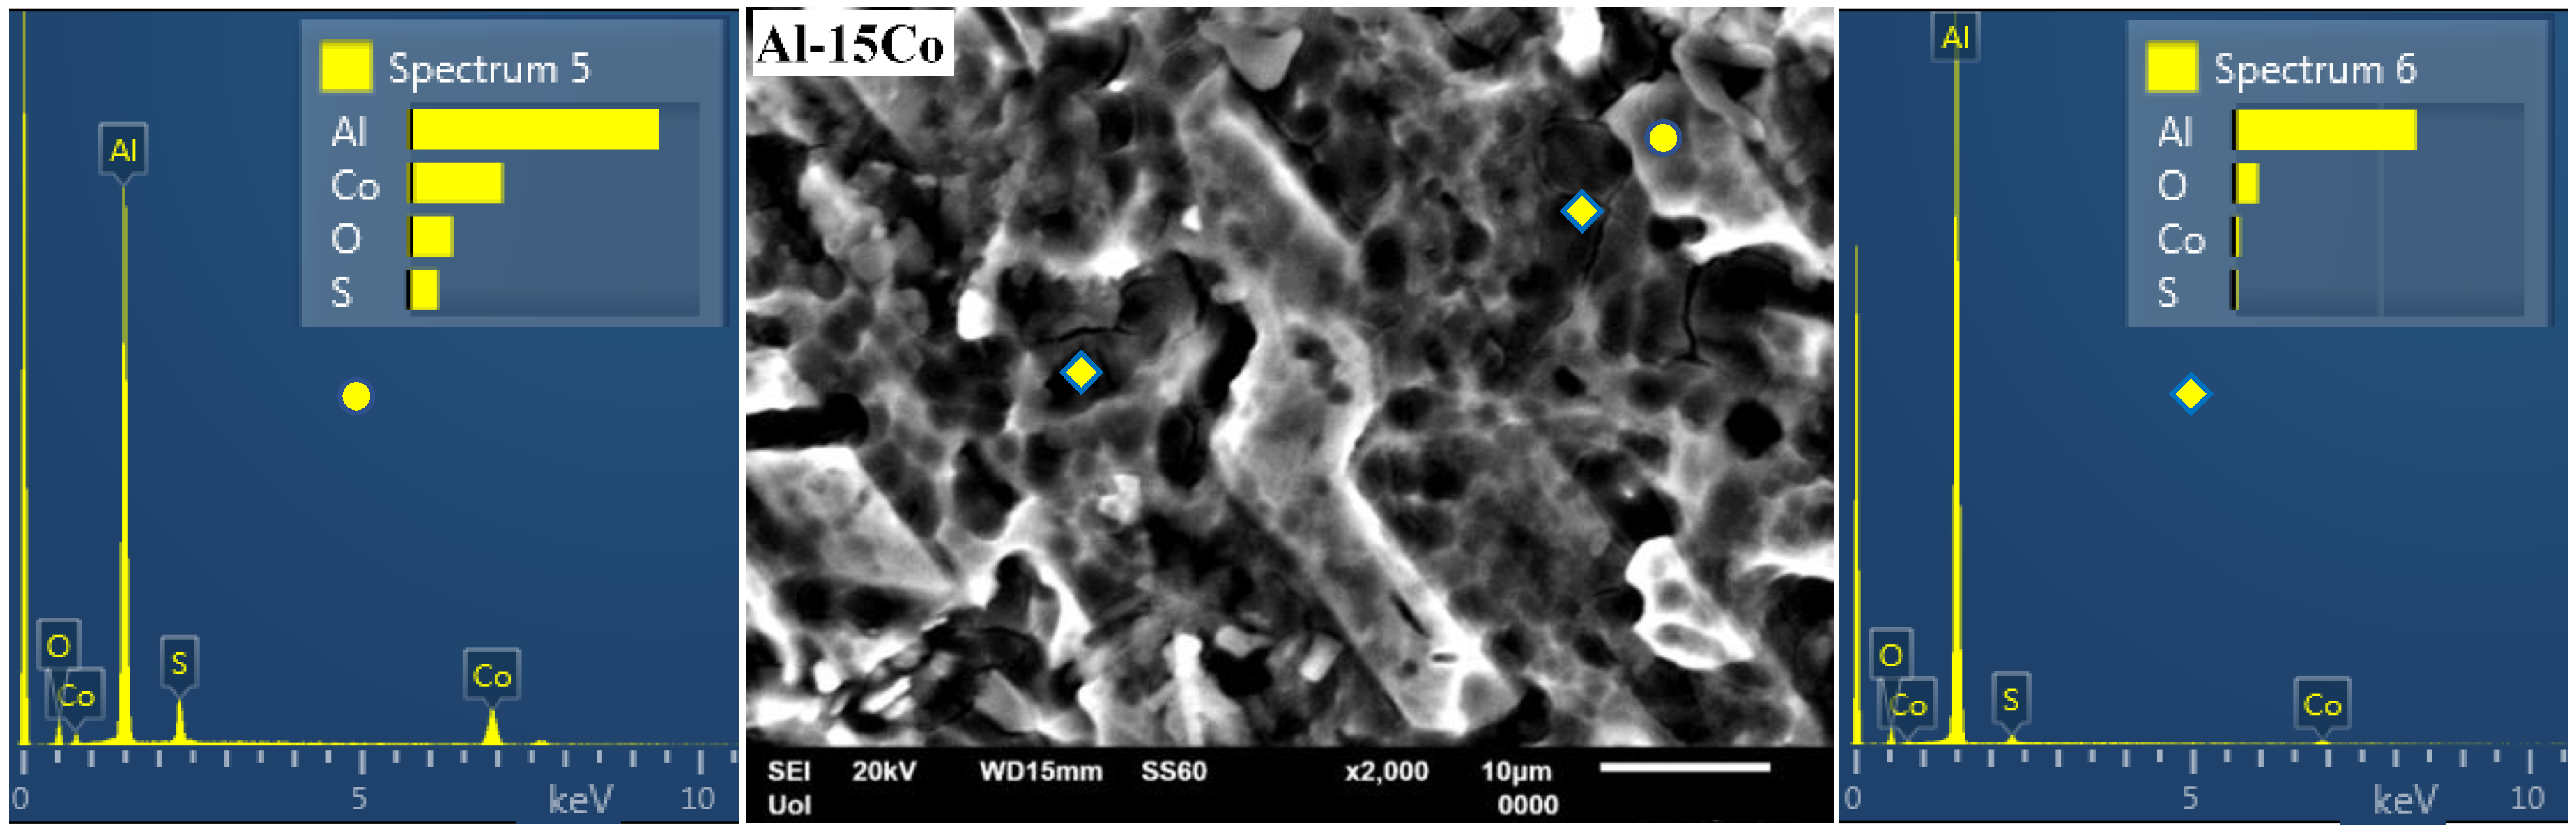
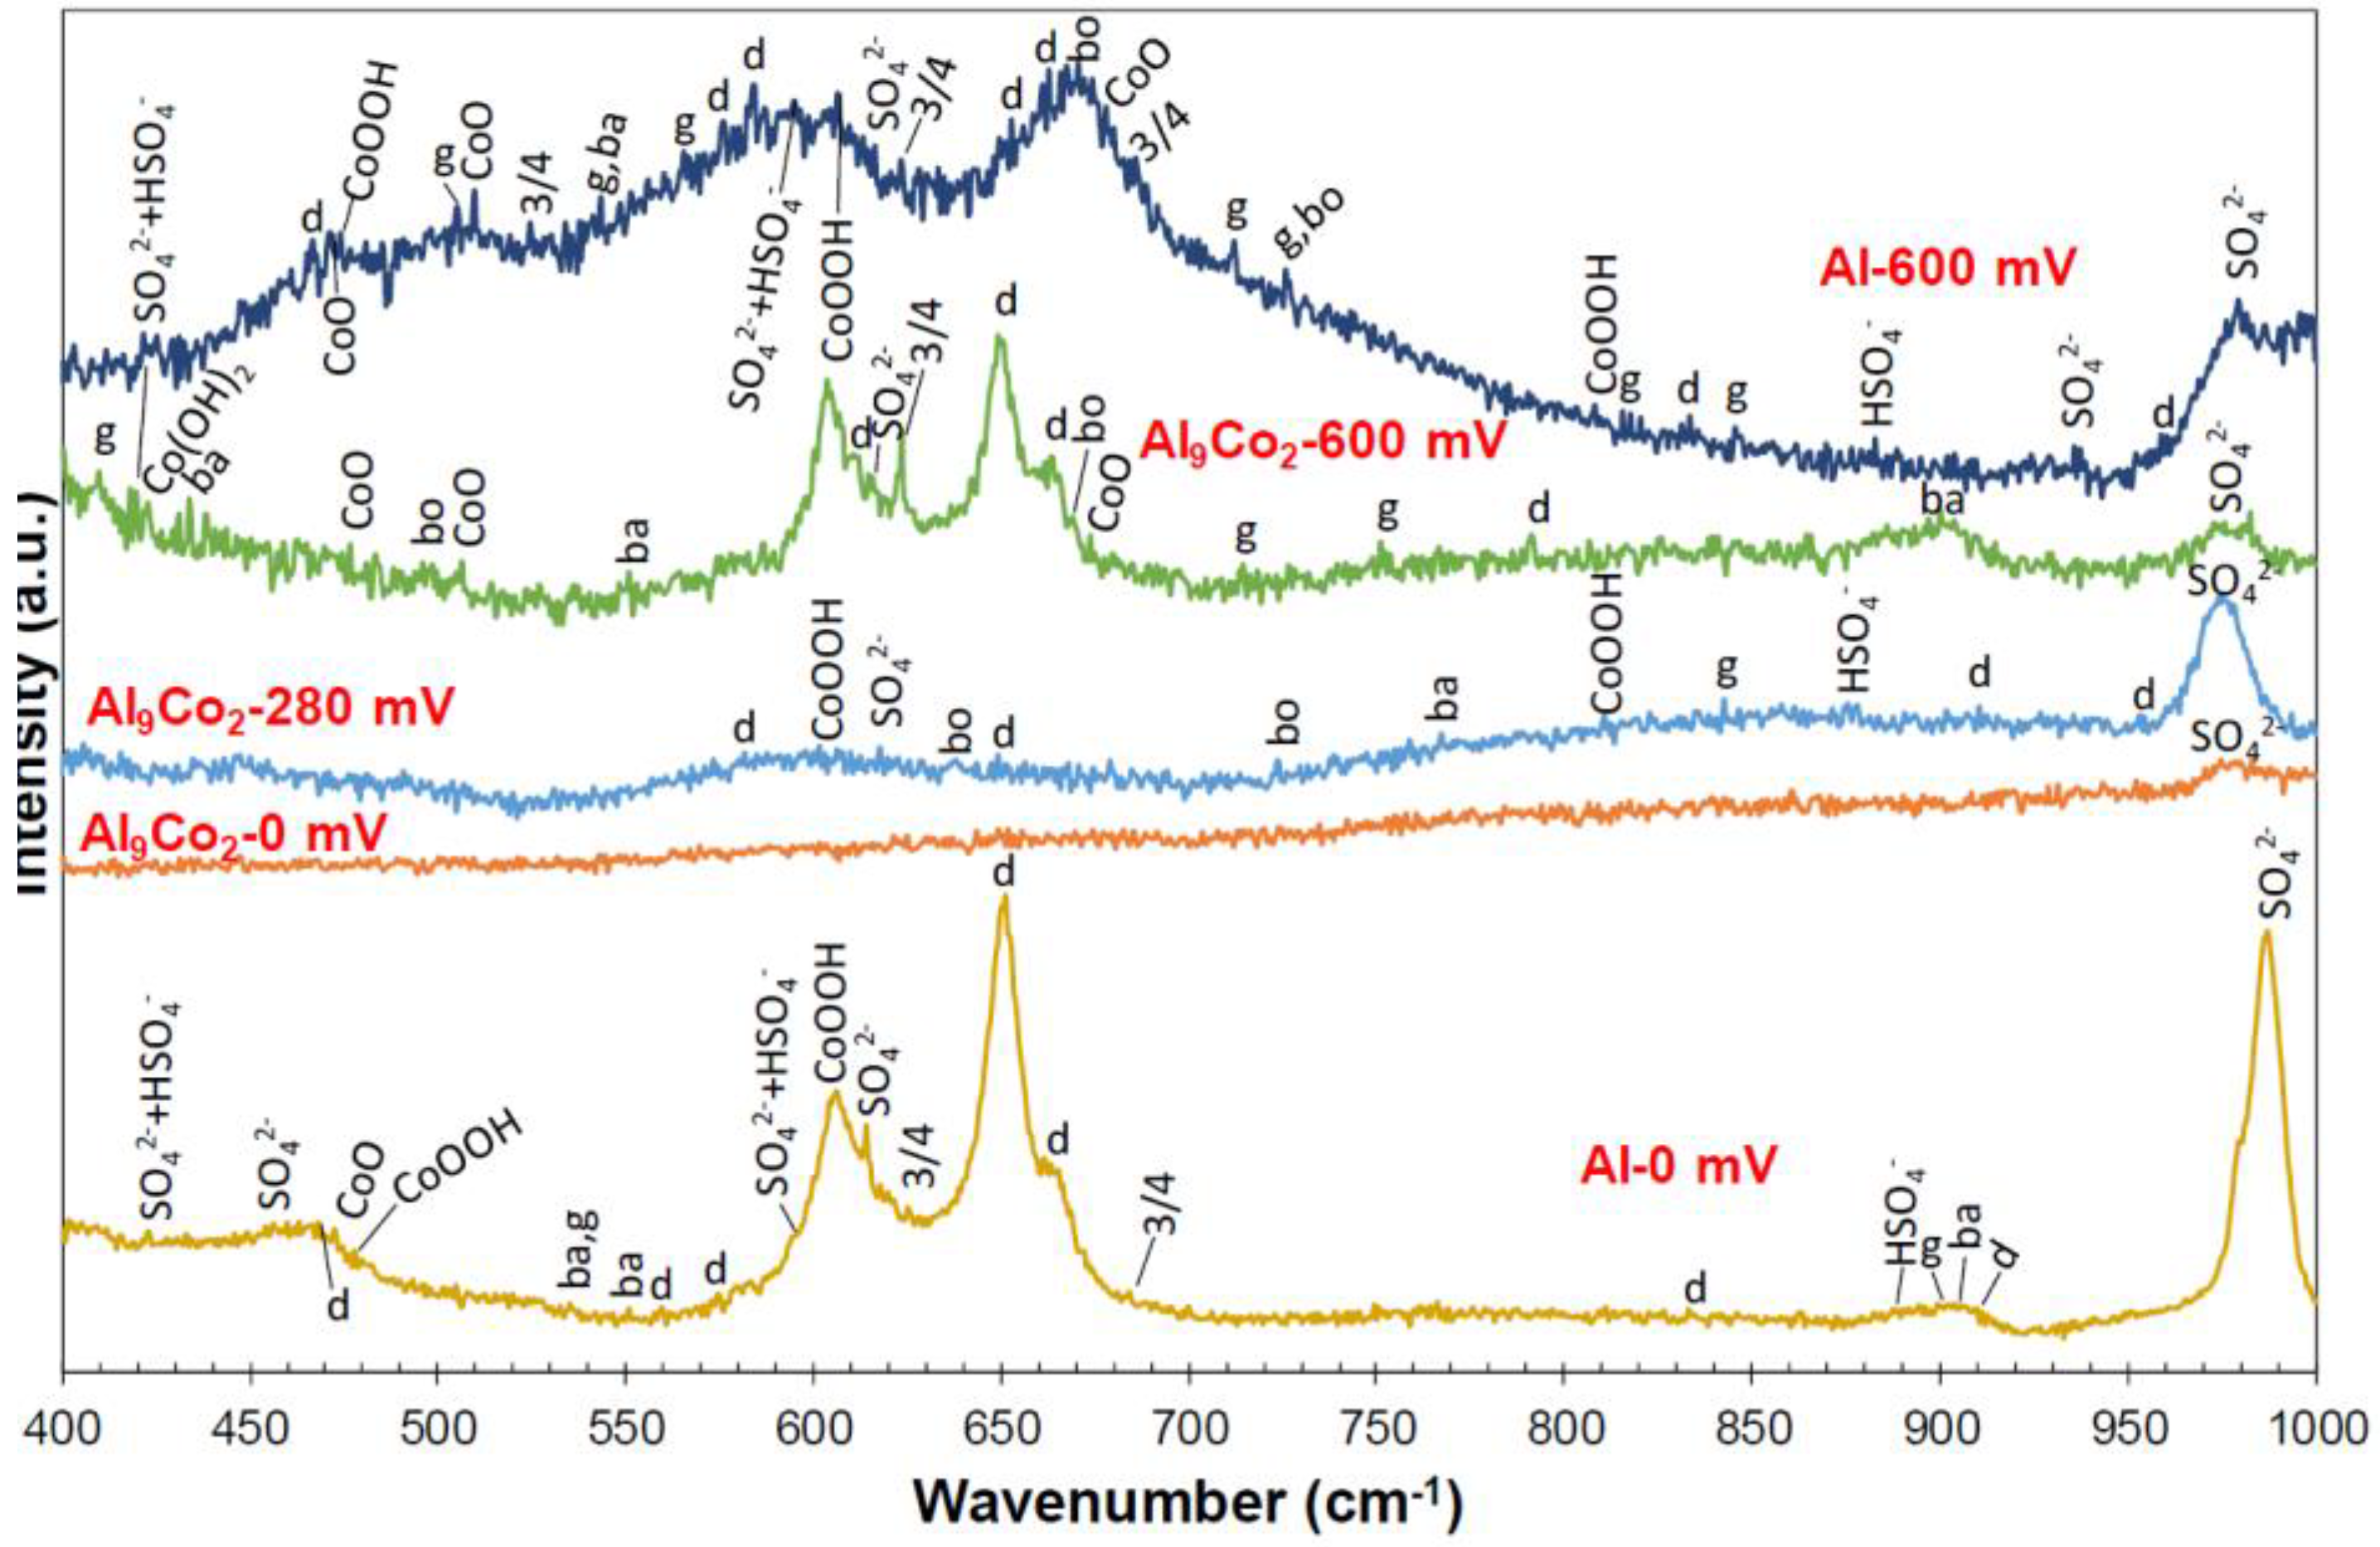
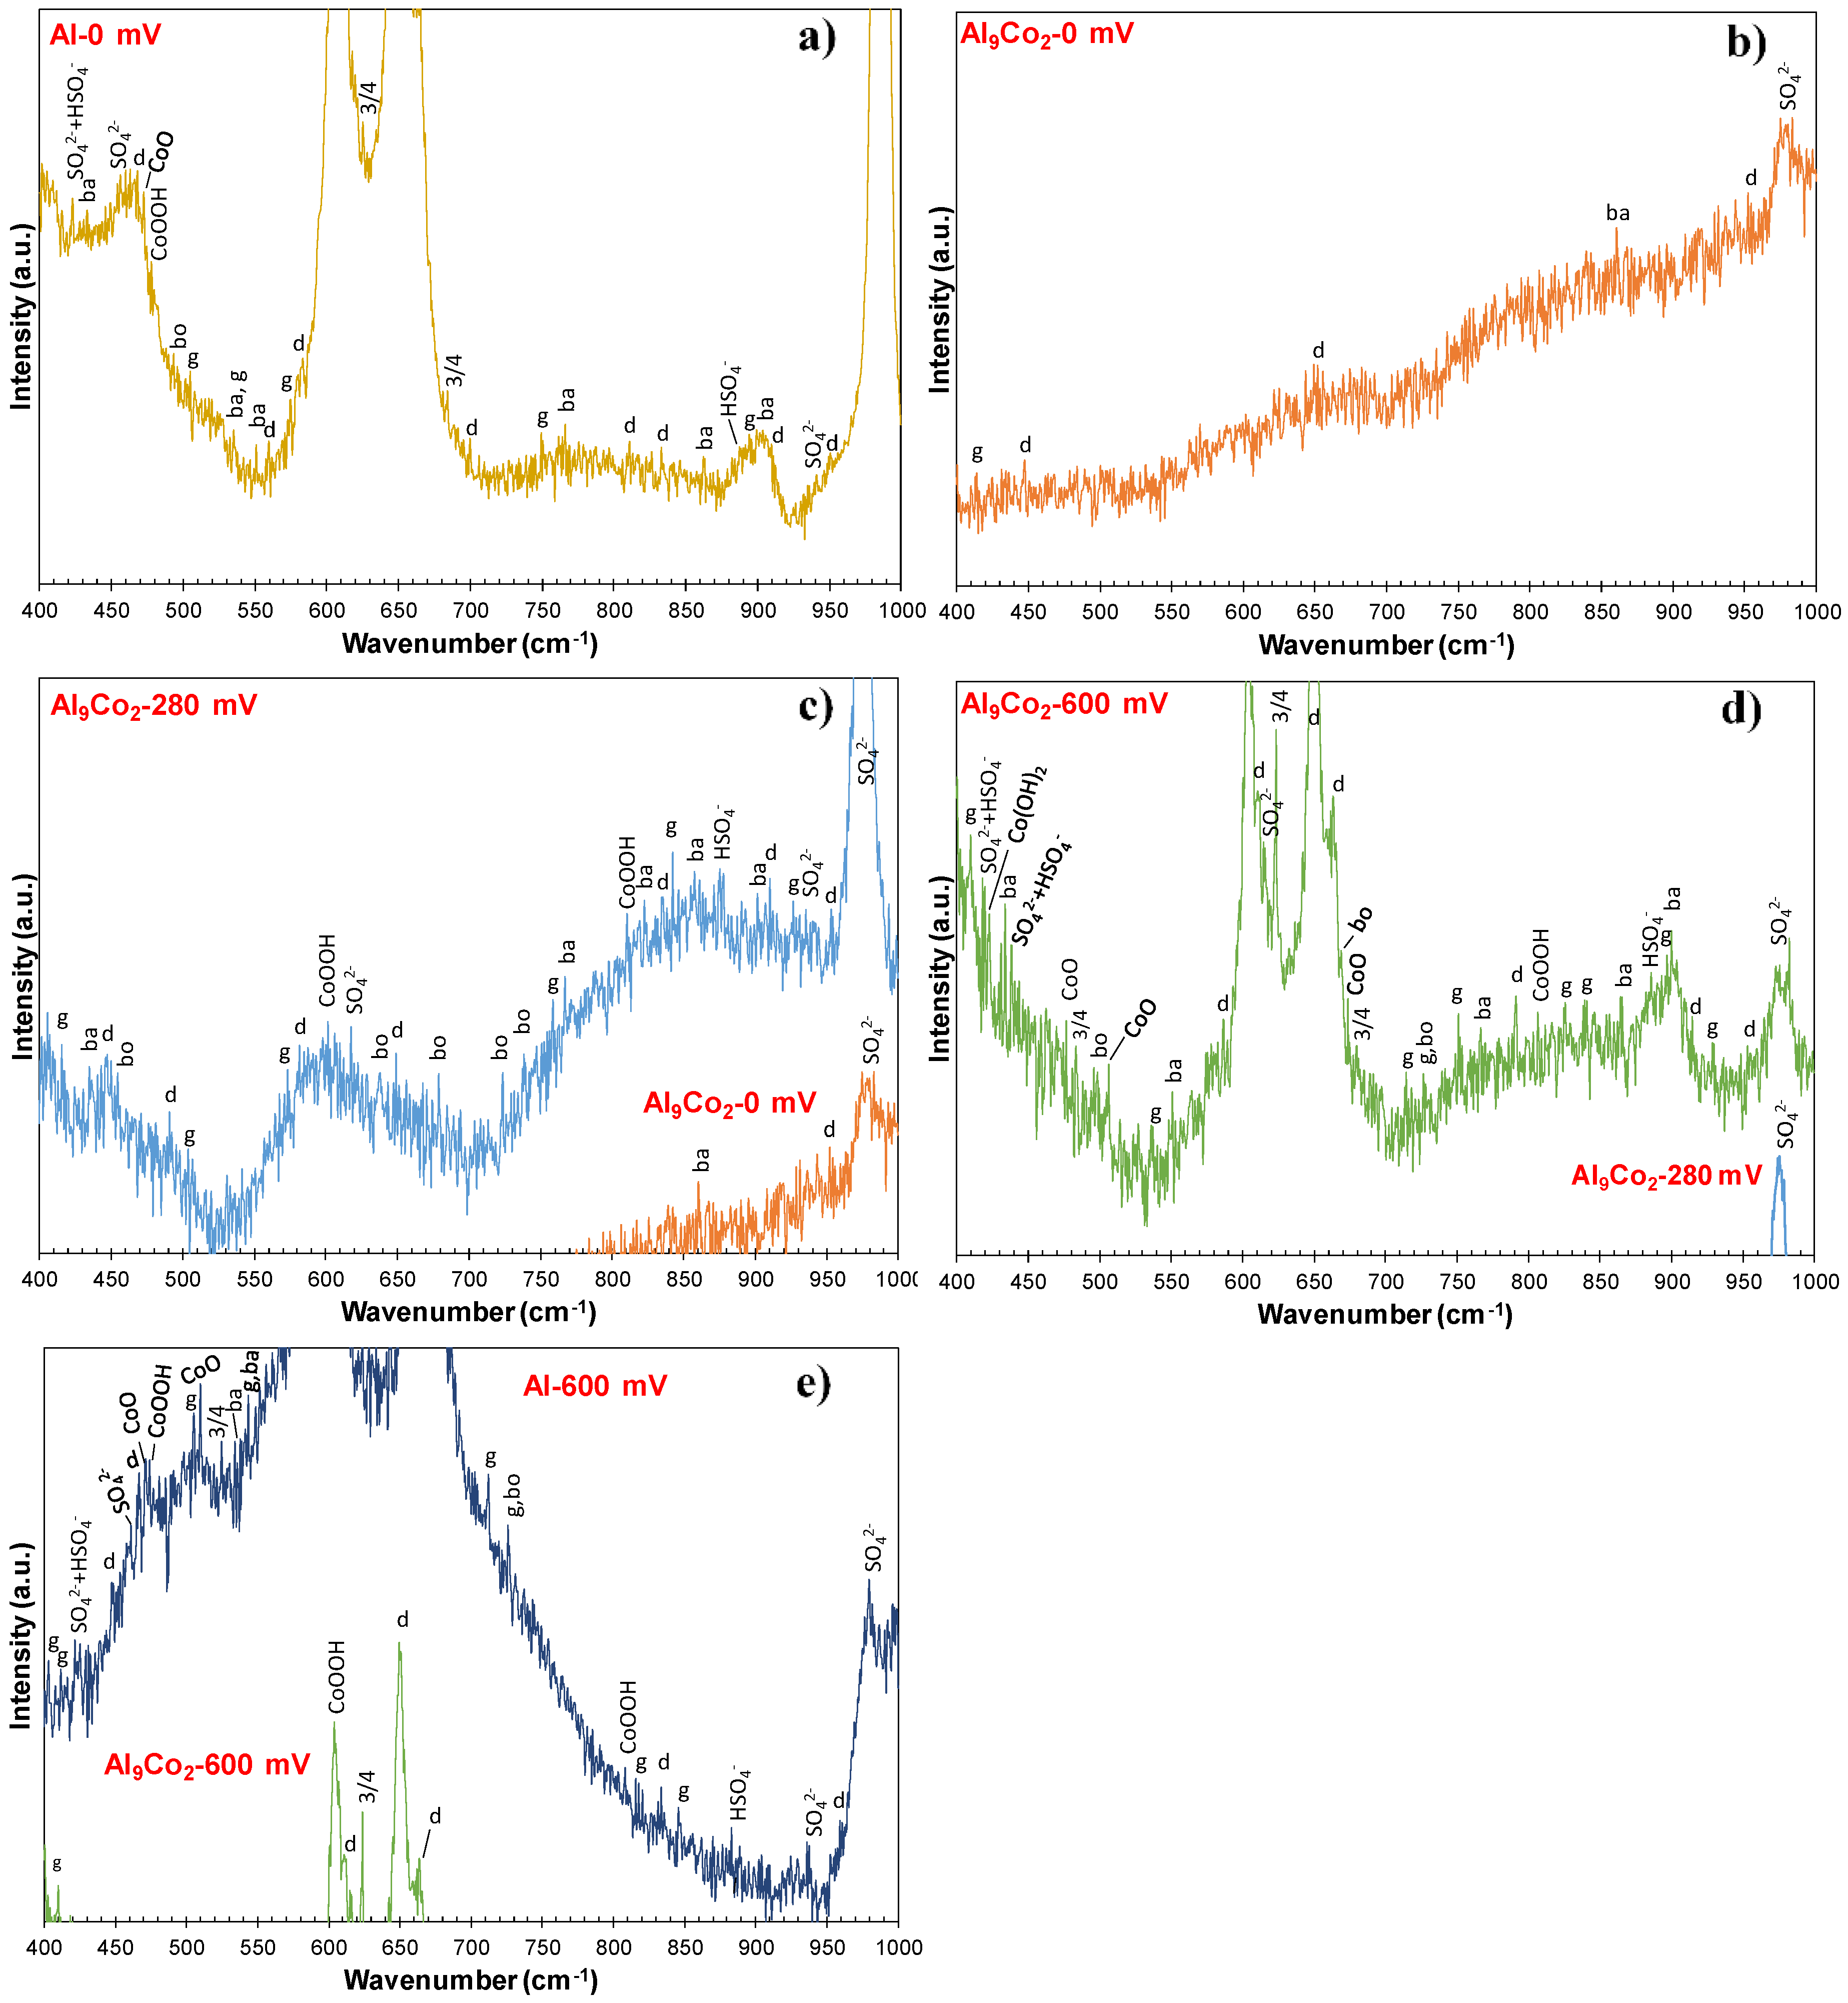
Table 1.
Electrochemical values for Al–Co alloys, CP-Al fabricated by vacuum arc melting (VAM), Al7075-T6 and Al2024-T3 (1 M H2SO4, 25 °C). Ecorr: Corrosion potential, Ecp1,2: Starting potentials for current limiting stages 2 and 4, respectively, Eb1: Breakdown potential of stage 2, Ea/c tr: Anodic-to-cathodic transition potential (Ea/c tr_1: upper Ea/c tr, Ea/c tr_2: lower Ea/c tr), ip1: Current densities in the middle of current limiting stage 2; ip2: Current densities at 750 mV vs. Ag/AgCl (upper part of stage 2 for CP–Al, Al–2Co and Al–5Co or stage 4 for the rest of the compositions); ±: 3–4 replicate runs.
| Alloy | Ecorr (mV vs Ag/AgCl) | Ecp1 (mV vs Ag/AgCl) | Ecp1 − Ecorr (mV vs Ag/AgCl) | Eb1 (mV vs Ag/AgCl) | Ecp2 (mV vs Ag/AgCl) | Ea/c tr_1 (mV vs Ag/AgCl) | Ea/c tr_2 (mV vs Ag/AgCl) | ip1 (mA/cm2) | ip2 (mA/cm2) |
|---|---|---|---|---|---|---|---|---|---|
| CP-Al | −463 ± 8 | −101 ± 18 | 363 ± 29 | – | – | – | −530 ± 21 | 1.69 ± 0.04 | 1.96 ± 0.07 |
| Al–2Co | −406 ± 7 | −193 ± 9 | 213 ± 13 | – | – | – | −436 ± 52 | 1.20 ± 0.02 | 1.62 ± 0.21 |
| Al–5Co | −412 ± 2 | −226 ± 18 | 187 ± 20 | – | – | – | −467 ± 5 | 0.85 ± 0.07 | 1.09 ± 0.15 |
| Al–7Co | −394 ± 10 | −218 ± 23 | 166 ± 19 | 213 ± 46 | 374 ± 35 | 25 ± 10 | −426 ± 16 | 0.48 ± 0.06 | 1.23 ± 0.03 |
| Al–10Co | −396 ± 5 | −227 ± 10 | 169 ± 12 | 157 ± 21 | 421 ± 21 | 9 ± 51 | −444 ± 32 | 0.36 ± 0.09 | 1.45 ± 0.24 |
| Al–15Co | −387 ± 18 | −227 ± 25 | 159 ± 16 | 179 ± 28 | 439 ± 33 | −4 ± 39 | −391 ± 23 | 0.35 ± 0.08 | 1.50 ± 0.25 |
| Al–20Co | −378 ± 7 | −248 ± 16 | 130 ± 15 | 184 ± 46 | 401 ± 48 | 22 ± 64 | −413 ± 20 | 0.34 ± 0.06 | 1.34 ± 0.19 |
| Al7075-T6 | −406 ± 25 | −191 ± 24 | 214 ± 47 | 239 ± 68 | 431 ± 17 | −50 ± 65 | −418 ± 18 | 2.42 ± 0.25 | 7.20 ± 1.56 |
| Al2024-T3 | −457± 4 | −134 ± 20 | 322 ± 16 | 193 ± 16 | 456 ± 35 | −46 ± 71 | −433 ± 60 | 1.32 ± 0.20 | 5.34 ± 1.48 |
Table 2.
Data from the Tafel extrapolation on the voltammograms of the Al–Co alloys, CP-Al fabricated by VAM, Al7075-T6 and Al2024-T3 (1 M H2SO4, 25 °C): β: Tafel slope; α: Constant in Tafel equation, r2: Regression coefficient of the linear fit, subscript “c”: cathodic, ΔE: Overpotential range for the linear fit, Δi: Current density range for the linear fit, ±: 3–4 replicate runs.
| Alloy | icorr (mA/cm2) | βc (mV/d) | αc (mV) | rc2 | ΔΕ (mV vs. Ag/AgCl) | Δi (mA/cm2) |
|---|---|---|---|---|---|---|
| CP-Al | 0.21 ± 0.01 | −159 ± 4 | −572 ± 20 | 0.998 ± 0.001 | (−687±9)–(−532±11) | (0.58±0.08)–(5.87±0.71) |
| Al–2Co | 0.19 ± 0.03 | −128 ± 16 | −500 ± 18 | 0.996 ± 0.002 | (−610±9)–(−476±7) | (0.64±0.08)–(6.45±0.89) |
| Al–5Co | 0.36 ± 0.06 | −143 ± 12 | −484 ± 15 | 0.991 ± 0.004 | (−651±21)–(−492±12) | (0.94±0.40)–(9.49±0.43) |
| Al–7Co | 0.26 ± 0.06 | −137 ± 6 | −480 ± 10 | 0.996 ± 0.002 | (−598±10)–(−464±4) | (0.75±0.17)–(7.65±1.64) |
| Al–10Co | 0.19 ± 0.06 | −121 ± 9 | −485 ± 24 | 0.995 ± 0.004 | (−585±8)–(−465±3) | (0.75±0.18)–(7.67±1.84) |
| Al–15Co | 0.31 ± 0.08 | −119 ± 7 | −448 ± 22 | 0.992 ± 0.003 | (−575±11)–(−456±17) | (1.05±0.23)–(10.56±2.26) |
| Al–20Co | 0.29 ± 0.04 | −137 ± 6 | −452 ± 10 | 0.997 ± 0.001 | (−583±9)–(−448±7) | (0.85±0.09)–(8.54±0.95) |
| Al7075-T6 | 0.66 ± 0.18 | −185 ± 12 | −438 ± 12 | 0.986 ± 0.007 | (−656±37)–(−475±24) | (1.35±0.40)–(13.41±3.74) |
| Al2024-T3 | 0.36 ± 0.08 | −183 ± 6 | −539 ± 38 | 0.994 ± 0.001 | (−707±10)–(−527±4) | (0.71±0.19)–(7.18±1.85) |
© 2020 by the authors. Licensee MDPI, Basel, Switzerland. This article is an open access article distributed under the terms and conditions of the Creative Commons Attribution (CC BY) license (http://creativecommons.org/licenses/by/4.0/).
Share and Cite
MDPI and ACS Style
Sfikas, A.K.; Lekatou, A.G. Electrochemical Behavior of Al–Al9Co2 Alloys in Sulfuric Acid. Corros. Mater. Degrad. 2020, 1, 249-272. https://0-doi-org.brum.beds.ac.uk/10.3390/cmd1020012
AMA Style
Sfikas AK, Lekatou AG. Electrochemical Behavior of Al–Al9Co2 Alloys in Sulfuric Acid. Corrosion and Materials Degradation. 2020; 1(2):249-272. https://0-doi-org.brum.beds.ac.uk/10.3390/cmd1020012
Chicago/Turabian StyleSfikas, Athanasios K., and Angeliki G. Lekatou. 2020. "Electrochemical Behavior of Al–Al9Co2 Alloys in Sulfuric Acid" Corrosion and Materials Degradation 1, no. 2: 249-272. https://0-doi-org.brum.beds.ac.uk/10.3390/cmd1020012