
Hydration and Carbonation of Alternative Binders


1
Finger-Institute for Building Materials Science, Bauhaus-Universität Weimar, 99421 Weimar, Germany
2
Institute of Building Materials Research (IBAC), RWTH Aachen University, Schinkelstr. 3, 52062 Aachen, Germany
*
Author to whom correspondence should be addressed.
Corros. Mater. Degrad. 2022, 3(1), 19-52; https://0-doi-org.brum.beds.ac.uk/10.3390/cmd3010003
Submission received: 30 December 2021
/
Revised: 28 January 2022
/
Accepted: 7 February 2022
/
Published: 10 February 2022
(This article belongs to the Special Issue Corrosion of Steel Reinforcement in Concrete: Furthering Knowledge within and beyond Boundaries)
Abstract
:The cement industry gains increasing public attention because of the high CO2 emissions for which it is accountable. One approach to improve the carbon footprint of cement production is the development of alternative binders, which can be produced with less energy consumption. These alternative binders have a reduced clinker to cement ratio or contain no Portland cement at all. For the corrosion protection of the reinforcement, the same requirements apply as for standardized types of cement. To perform this evaluation, a basic understanding is necessary of the products formed during hydration, the composition of the pore solutions and pore structure, and their influence on the resistance to carbonation. In this study, various alternative binders, such as novel types of composite cement with calcined clays or modified steel mill slag, alkali-activated materials, CA cement, and a C-S-H binder, are presented. The conducted investigations at mortars and cement pastes show the differences in hydration, microstructure development, and pH. The changes in microstructure and phase assemblage due to carbonation and the suitability of carbonation testing at an elevated CO2 content of 1 vol.-% for the different binders are also presented.
Keywords:
SCMs; calcined clays; BOF slag; CSA; geopolymers; alkali-activated slag; hybrid alkaline cement1. Introduction
Newly developed alternative binders that can be produced with lower CO2 emissions must be tested for their suitability for use in reinforced concrete components. The same durability requirements are placed on them as on standardized types of cement. In this study, various alternative binders from the groups of alternative supplementary cementitious materials (SCMs), calcium sulfoaluminate (CA) cement, calcium silicate hydrate (C-S-H) binders, and alkali-activated materials (AAMs) are investigated. To get closer to their widespread use in reinforced concrete structures, a detailed understanding of hydration and carbonation is essential. Based on the investigations presented here, further publications are planned, in particular on the influence of the various alternative binders on the corrosion behavior of embedded steel reinforcement.
In the first days after the production of a reinforced, Portland cement (OPC)-based, concrete component, the steel passivates due to the high pH value (usually between 12.5 and 13.8) of the concrete pore solution and is thus protected against corrosion, under the condition that no interfering ions, such as chloride ions, prevent the passivation [1]. The passive layer, which is only a few atomic layers thin, has a two-layer structure and consists of a dense layer of Fe3O4 on the steel side, which oxidizes further in the direction of the electrolyte, mainly to Fe2O3. The exact chemical composition depends mainly on the pH of the concrete pore solution and the availability of oxygen [2,3]. According to the Pourbaix diagram for iron in water, the oxidation products formed are only stable at a pH value approximately greater than 9 [4].
In the process of carbonation of OPC-based mortars and concretes, the CO2 from the air diffuses into the pore structure of the material and dissolves in the alkaline pore solution, forming weak acidic ionic species [5]. The dissolved carbonates react in a multistage process with the calcium ions from the hydrate phases of the cement matrix, summarized by [6] as:
In the investigation of Pu et al. [7] the pH of pore solutions of different OPC and OPC fly ash concretes drops from values between 13.0 and 13.4 to 7.2.
Once the carbonation front reaches the surface of the reinforcing steel the protective passive film breaks down and significant corrosion may be initiated [1,8].
The alkaline components of the concrete are mainly found in the pore solution, mostly in the form of sodium and potassium hydroxides. But also the solid hydration products like CaOH2 and C-S-H react with CO2 [1]. The main carbonation product is calcium carbonate, which, depending on internal and external influences (pH, temperature, supersaturation [10], humidity, CO2-concentration [11], and surface of nucleation [12]), can occur as one of three CaCO3 polymorphs: calcite, aragonite, and vaterite [13,14,15]. Furthermore, the occurrence of amorphous calcium carbonate was also observed [14]. The formation of acidic H+ causes a decrease in the alkalinity of the pore solution and dissolves the Ca-rich hydration products, such as portlandite, C-(A)-S-H phases, AFm, and ettringite. As the first hydrate phase, carbonation converts portlandite to calcium carbonate. During the carbonation of C-S-H phases, a Ca-modified silica gel is formed in addition to calcium carbonates.
For C-A-S-H phases, it was observed that an Al-enriched silicate gel is formed during carbonation [16,17]. Carbonation of ettringite releases aluminum and sulfur, which in turn is converted into aluminum hydroxide or zeolites [18] and gypsum, respectively. Monosulfate and hemicarbonate AFm phases destabilize to monocarbonate AFm. This in turn decomposes to strätlingite, which absorbs the liberated aluminum and silicon of the carbonated C-(A)-S-H phases [6,19]. Carbonation of pure N(K)-A-S-H phases has not yet been investigated. Yamazaki et al. observed for alkali-activated binders that carbonation reduced the proportion of C-(N)-A-S-H phases and calcium carbonate was formed. For high Na+ concentrations, the formation of sodium hydrogen carbonate (NaHCO3) was further observed. A change in the C-(N)-A-S-H structure was also detected by 29Si MAS NMR [20]. Bernal describes that in the decalcification of C-(N)-A-S-H phases, N-A-S-H phases were found to be the main reaction products [21].
The change in microstructure due to carbonation of OPC with and without SCMs is controversially discussed [15,22,23,24]. The conversion of portlandite to calcium carbonate leads to an increase in volume of the solids of 11 to 14%, depending on the calcium carbonate polymorphs formed [25,26]. The formation of the Ca- (and Al-) modified silica gel from C-(A)-S-H phases is accompanied by a reduction in the volume of the solids, which is also widely referred to as carbonation shrinkage [27,28]. However, the change in solids volume cannot be quantified because the reaction stoichiometry has not yet been clearly clarified [13,15,26]. These inaccuracies make it difficult to determine the change in microstructure [15]. It is however already known that the carbonation of C-(A)-S-H phases leads to a microstructural coarsening with a significant increase in capillary porosity, whereas the carbonation of portlandite rather has a microstructural densifying effect [29]. During the transformation of C-(A)-S-H, the occurrence of metastable calcium carbonates, such as vaterite and aragonite, is also frequently observed, which are obviously stabilized here by hitherto unknown processes [13,29].
The structural change of alkali-activated binders due to carbonation strongly depends on the materials used as well as activators. Contrary results of mortar and concrete samples were also found. Park et al. found a densification of the microstructure by carbonation for alkali-activated fly ashes [30]. Puertas et al. found for alkali-activated slags that the change in microstructure due to carbonation depends primarily on the activator; water glass as an activator leads to an increase in porosity, while NaOH leads to a decrease in porosity [31]. Bernal et al. observed a decrease in capillary porosity for AAS with metakaolin in mortars, while they observed an increase for concrete specimens with a similar binder composition [21].
The evolution of the carbonation depth ( of cementitious systems under standardized test conditions over time follows a —characteristic and can be described as follows [1]:
KACC is the carbonation rate in under standardized test conditions with an elevated CO2-content compared to natural carbonation and t is the test duration in days.
In the case of real exposure, Equation (4) can be extended by further factors to take into account a deviating relative humidity, the duration of curing and the influence of the degree of wetting with water [32]. To calculate the carbonation rate in air ( from test results obtained at elevated CO2, the factor , as the ratio of the CO2 content during the test to the CO2 content of the air, can be considered [32,33]:
According to [32,34], the correction factor c is necessary for strongly increased CO2 contents during the accelerated test. This considers that the accelerating effect of the increased CO2 content, is stronger than described by the factor ka at high CO2 levels. In [34], c was determined to the following values in tests on several CEM I, CEM II and CEM III concretes:
CO2 < 1% → c = 1.00
CO2 = 4% → c = 1.36
In order to apply the accelerated method and use the modeling described in Equations (4) and (5) to extrapolate the carbonation depth, two conditions must be met: The carbonation coefficient (KACC) should be constant and not time dependent and the investigated binder type should be suitable for the accelerated method.
In the following, the alternative binder types investigated here are presented and the state of research regarding their hydration and carbonation is outlined. The use of SCMs has made significant progress in reducing the clinker factor in cement. In Europe, mainly the composite materials blast furnace slag (BFS), fly ash and limestone powder are used and the cement type is referred to as CEM II. Decades of practical experience already exist for these types of cement in terms of durability and corrosion protection of steel reinforcement. However, it is expected that the conventional reactive composite materials fly ash and granulated blast furnace slag (GBFS) will not be available in sufficient quantities in the future [35,36]. Therefore, an intensive search for alternatives is being conducted worldwide. Promising materials include calcined clays and steel mill slags. The calcined clays metakaolin and metaillite belong to the natural, tempered pozzolans and are produced by calcination of kaolin and illite-based clay minerals, respectively. Metakaolin is best known because it is used industrially in large quantities (paper industry, ceramics industry, etc.). Metakaolin is also already widely used in the construction industry as a concrete additive, although its use is limited to special applications such as increased chemical resistance. Metaillite has so far been used exclusively in the research field as a composite material. Due to its good availability and favorable price, it represents a possible alternative to metakaolin [37]. It is well-known that the main hydration phases of OPC are C-S-H phases, ettringite, and portlandite. If calcined clays are added as composite materials, they react with the existing portlandite to form C-S-H and C-A-S-H phases. The portlandite consumption depends on the type of clay: metakaolin has a higher portlandite consumption than metaillite [37]. Composite cement usually has a lower carbonation resistance than OPC because the proportionate replacement reduces the portlandite content [38,39,40]. In the literature, a higher carbonation rate is also observed for SCMs containing metakaolin, especially for accelerated carbonation [38,39,40,41]. For natural carbonation, the observed carbonation rates are approximately comparable at low clinker replacement rates [40]. Lower carbonation resistance is also reported when metaillite is used [42]. With natural carbonation, Achenbach et al. [43] observe a carbonation rate equivalent to OPC.
Another alternative composite material is modified steel mill slag. It is produced in steel mills during the further processing of pig iron into steel, and potentially exhibits high hydraulicity, which usually cannot be retrieved in non-modified slags. However, the hydraulicity of steel mill slags can be activated by specific modifications so that they can be used as a reactive component in cement [44,45,46]. Most of the steel mill slag originate from the Linz-Donawitz (LD) process, also referred to as basic oxygen furnace (BOF) process. The leaching of heavy metals can be problematic when using steel mill slags [47]. However, most heavy metals are firmly bound in the cementitious system and do not pose a problem for the environment [48]. If LD slags are added as a composite material, the hydration behavior does not change compared to pure OPC, since the reactive part of LD slags consists of C2S, which mainly forms C-S-H phases during hydration [49]. Modified steel mill slags have shown low carbonation rates so far [50].
In CA cement, a calcium sulfate component is used instead of limestone. Therefore, the CO2 emissions during the burning process can be significantly reduced with this type of cement. In addition, the burning temperature is lower than for OPC, so less energy is required for production. In concrete practice, CA cement is used in particular in China. The production of CA cement requires bauxite, of which reserves worldwide are limited and which is also needed for aluminum production. Alternative sources of aluminum have not yet been established. The need to use bauxite to produce CA cement already leads to limited use because of the high price. Against this background, the classical CA concept has been increasingly modified in recent years, with particular reference to the so-called belite- CA cement, the main phase of which is belite, resulting in higher final strengths and lower aluminum requirements [51]. During the hydration of CA cement, ettringite is formed as the main hydration product of ye’elemite. X-ray amorphous Al(OH)3 is also formed, as well as monosulfate, as soon as the available calcium sulfate is used up [52]. Furthermore, Telesca et al. [53] observed that monosulfate does not form in the absence of calcium sulfate or limestone. The formation of ettringite depends on the curing conditions and therefore the total porosity of CA cement pastes. The highest porosity was observed after curing at low relative humidity and high temperatures. With curing underwater at low temperatures a very dense structure with higher content of ettringite was observed [54]. The dense microstructure is also reported in [52]. The pH of the pore solution is reported to be around 11 at an early age and increases during hydration [52]. A characteristic feature of CA cement is its tendency to self-desiccate during hydration at low water/binder ratios. This could lead to a lower amount of pore solution and thus a lower ability to dissolve CO2 and undergo carbonation [55]. However, regarding the effect of CA cement on carbonation and durability, different authors come to very different conclusions. Tan et al. [55] provide an overview of the range of different results, sometimes describing the durability of CA concretes as similar to OPC, and also indicating positive or negative effects.
Another approach of a new binder type is the group of low-temperature C-S-H binders. They are produced in a two-stage process. First, a non-reactive intermediate is produced hydrothermally. In the case of Celitement® used here, the precursor material is then mechanochemically activated by high-energy grinding. During the hydration of C-S-H binders, only C-S-H phases are formed, and no portlandite. The formed C-S-H phases rather resemble honeycombs in their structure, in contrast to the fibrous-needled C-S-H phases common for OPC [56]. Celitement® is currently only being produced on a smaller scale in a pilot plant. First results of carbonation tests show a high carbonation resistance at natural carbonation of 110 days [43].
AAMs are typically metakaolin, fly ash, or BFS, activated by an alkaline solution. The activators can be water glasses or other alkalis. AAMs are divided into geopolymers and alkali-activated slags (AAS) [57]. The differentiation is based on the fact that the geopolymers can be regarded as low in calcium and the alkali-activated slags as high in calcium, resulting in different hydration products. During the solidification of the geopolymers, an “inorganic polymer” is formed, which consists mainly of a highly disordered and strongly cross-linked alumino-silicate hydrate gel, the so-called N(K)-A-S-H phases [58]. Similarities between the gel structure and the structure of zeolites have been observed in a large number of publications [59]. When considering alkali-activated slags, a distinction must be made again as to whether it is a pure system or a hybrid system (slag and OPC) [60]. When Ca-rich slags react with an alkaline activator, primary C-A-S-H phases are formed. Secondarily, Al-rich phases are formed, such as layered double hydroxides, often resembling the hydrotalcite group, and calcium (silico-)aluminate hydrates [61]. Due to the highly alkaline activators, the pore solutions of AAMs also exhibit high pH values. General statements about the carbonation of AAMs are difficult due to the many influencing factors from different precursors, different activators, and different test methods. A broad overview has been prepared by Zhang et al. [62]. In their study of AAS and OPC [63], Bernal et al. point out that testing by rapid carbonation significantly underestimates the durability of AAS regarding carbonation. Due to the higher partial pressure of the CO2 and thus deviating alkali carbonate phase equilibria, different phases are formed than in natural carbonation and the pH drops further than it would in natural carbonation. In a round-robin test [64], the carbonation of AAS, fly ashes, and metakaolin was investigated in different laboratories, each comparatively using different test methods. The authors concluded that the accelerated method is basically suitable for comparative investigation of carbonation on the same binder type, however, natural carbonation allows a more realistic assessment of durability under real exposure, which is in accordance with [63,65]. Pouhet et al. investigated the carbonation of a pore solution of metakaolin-based geo-polymer activated by sodium silicate and reported much faster carbonation than for the pore solution of OPC. However, the pH of the naturally carbonated geopolymer pore solution only dropped to 10.5, which could still be sufficient for the passivity of embedded steel depending on the pore solution composition [65,66].
Several studies have shown that alkali-activated binders are suitable for new manufacturing techniques, especially for 3D printing [67,68].
In summary, this raises several relevant issues that are examined here in detail for the alternative binders mentioned above:
- Which products are formed during hydration/solidification and how does the pore structure develop?
- What is the pH value of the pore solution after hydration/solidification?
- Which phases are formed during carbonation?
- How is the pore structure affected by the carbonation process?
- Is the accelerated carbonation test applicable to the investigated binders?
2. Materials and Methods
This study was carried out on binders from each group mentioned above. Additionally, a standardized cement was tested as a reference material for comparison. Table 1 gives an overview of the tested binders and their w/b ratios.
The abbreviations used are summarized in Table A1 in the Appendix A.
The w/b value of alkali-activated binders is calculated from the added water plus the liquid portion of the activator. Since Celitement® is a pre-hydrated binder, the w/b value must be assessed differently than for the other binders and is therefore lower. It was produced with the addition of a superplasticizer to ensure the necessary workability.
The reference cement used was a commercial CEM I 42.5 N (Ref I). Ref I was used to producing further types of composite cement in a 70/30 ratio with calcined clays and with a steel mill slag, respectively. The calcined clays used were a self-made metaillite and a commercially available metakaolin. The steel mill slag was a modified LD slag. The CA was a commercially available CA with tartaric acid as a retarder. A fly ash based geopolymer with NaOH as activator (concentration 19.068 M) (Geo FA) and a metakaolin based geopolymer with potassium water glass as activator (silicate modulus 1.1) were prepared. AAS I was activated with sodium silicate (silicate modulus 2.0) while AAS II was activated with a mixture of CEM I and Na2SO4. AAS II thus belongs to the group of hybrid alkaline cement [60,69]. Furthermore, for AAS II limestone powder was added as filler material.
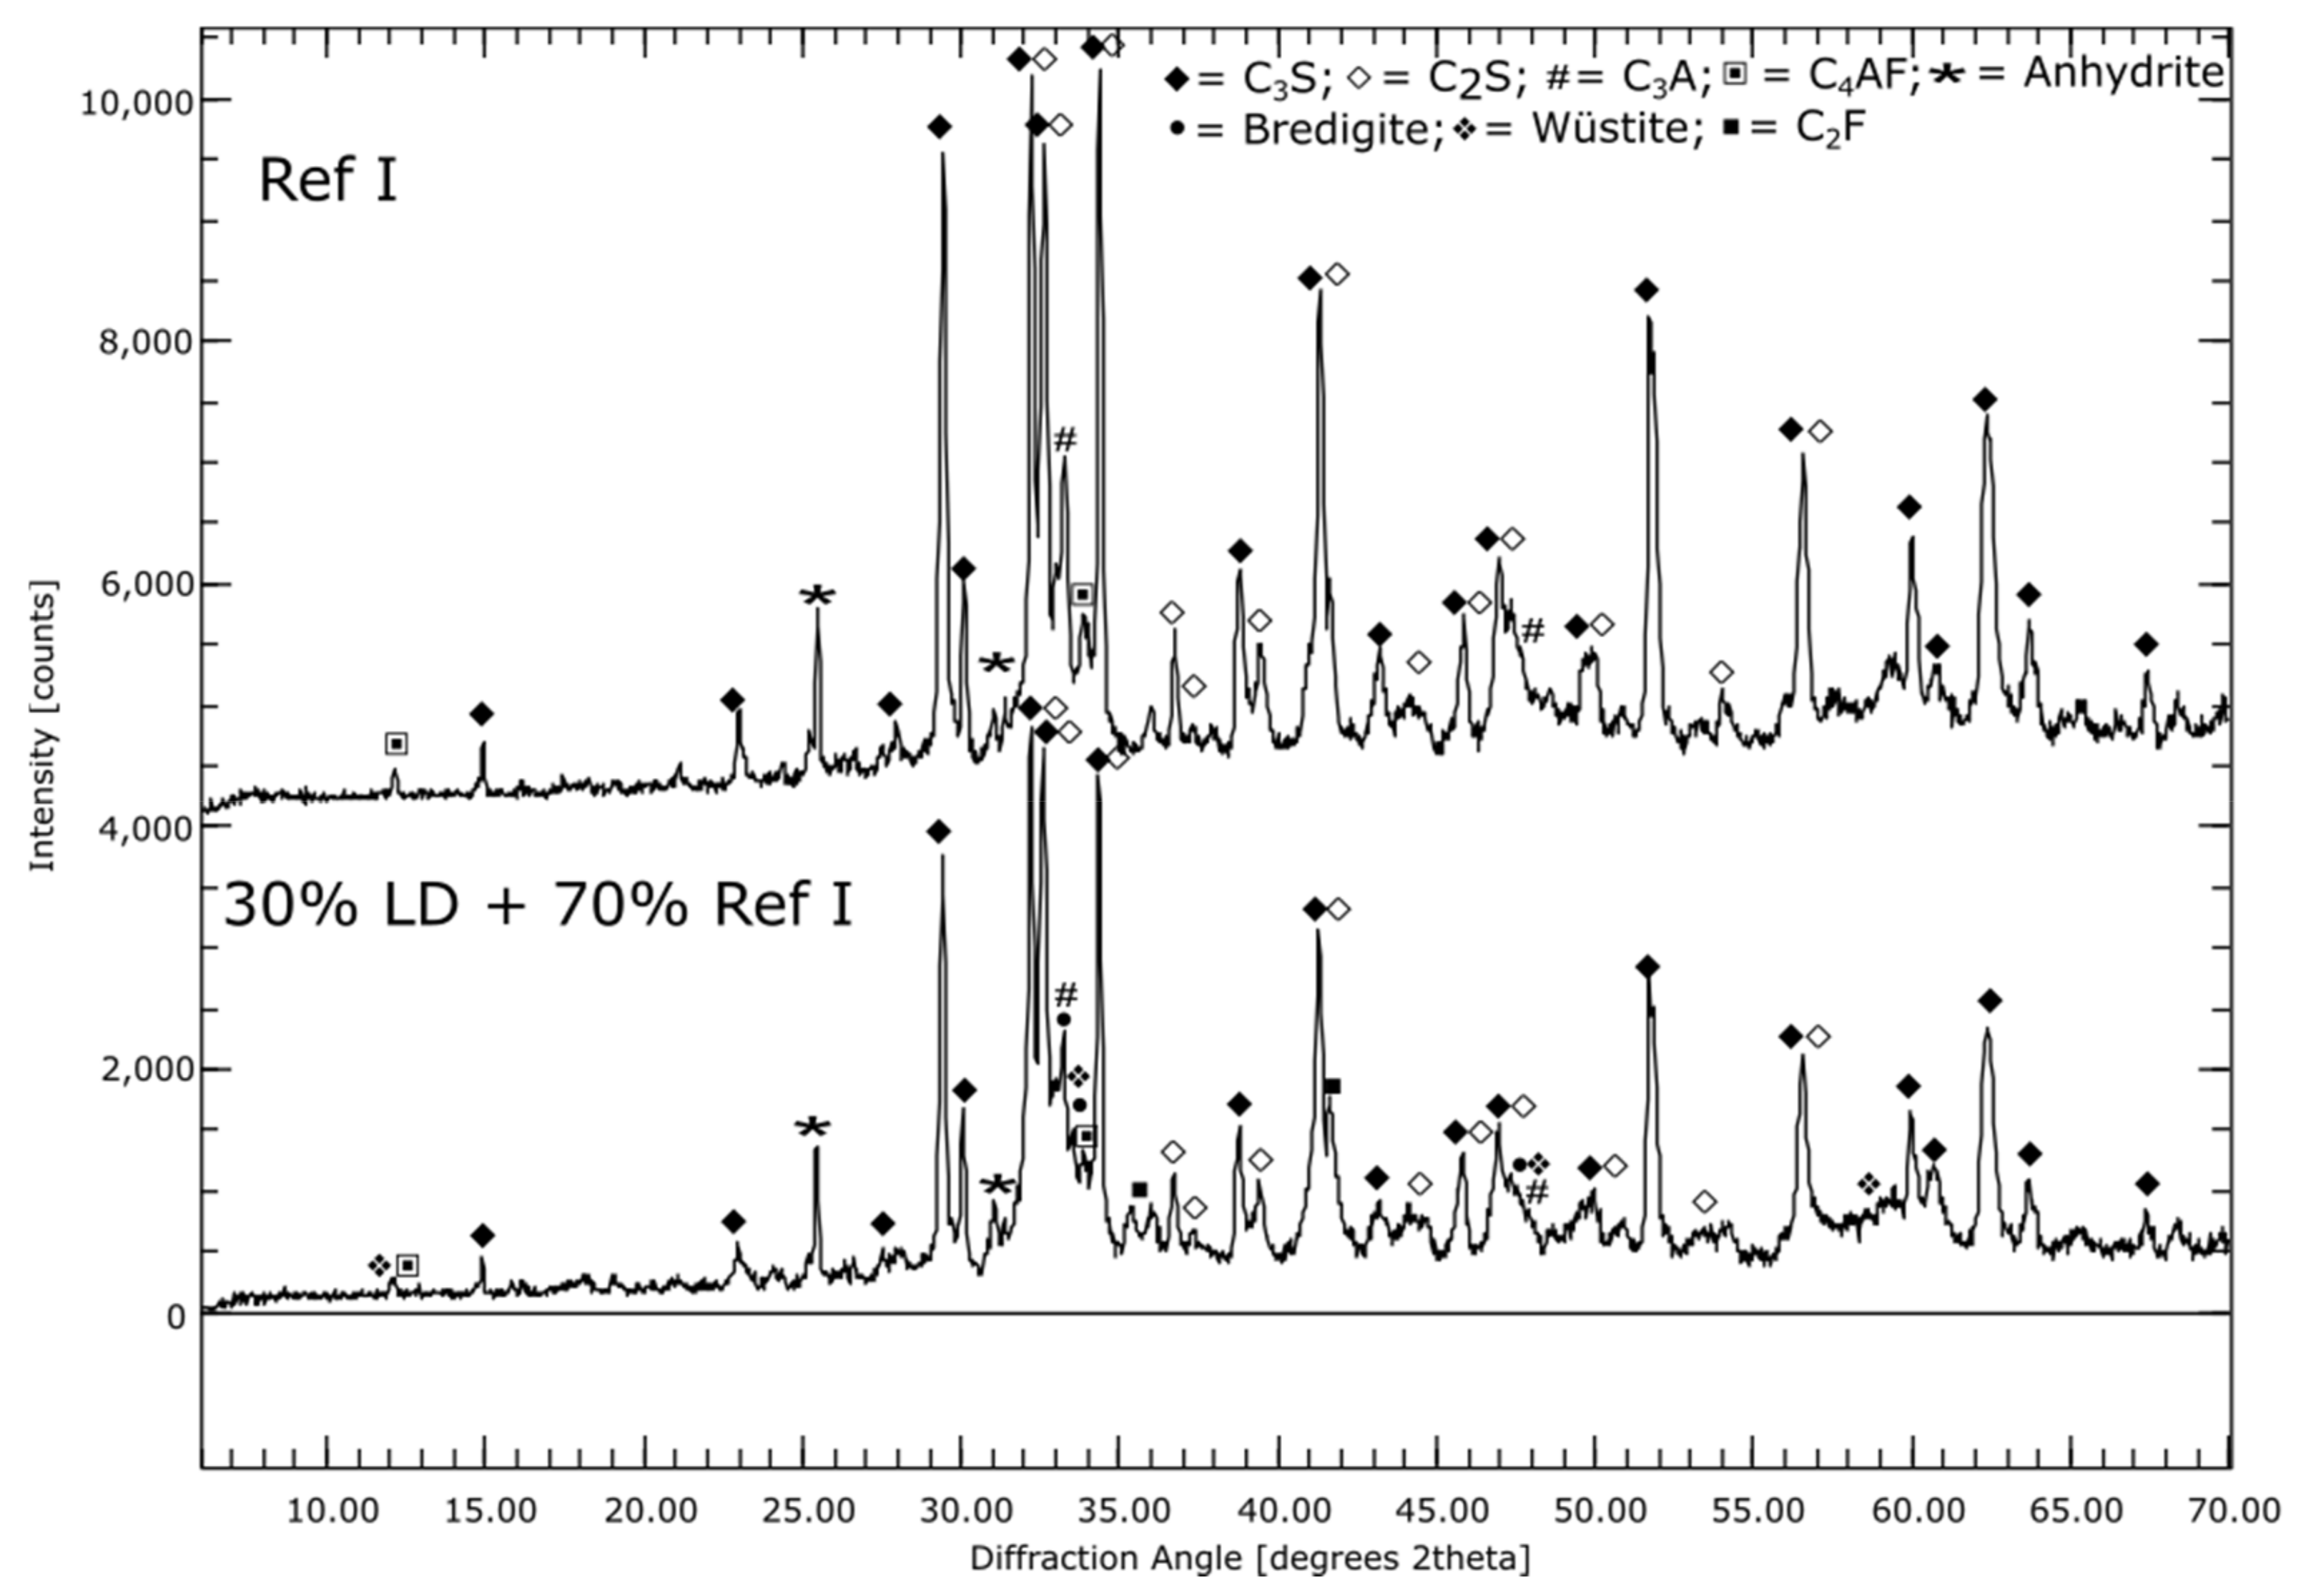
The initial materials were analyzed by X-ray diffraction (XRD) to determine the phase composition and the X-ray amorphous amount. Quantitative XRD (QXRD) analyses were performed using a Siemens D5000 diffractometer (Munich, Germany) operating with copper radiation at 40 kV and 40 mA. The scanning was done at a step width of 0.02° 2 θ over an angular range from 5 to 70° 2 θ with 4 s counting time per step. For the determination of the X-ray amorphous amount, zincite was used as an external standard. Profex (Solothurn, Switzerland) was used for Rietveld refinement.
Most of the investigations described in the following section were carried out at cement paste samples prepared with the binders shown in Table 1. For additional investigations also mortar specimens were prepared with the same w/b ratio and a binder/sand ratio of 1:3. After the analysis of the initial materials, the following investigations were carried out to study the changes in the different materials during hydration and carbonation.
2.1. Investigation of the Hydration Progress
To determine the hydration progress, cement paste samples were prepared from the different binders and stored in closed containers at laboratory temperature (20 °C, 65% relative humidity) until the time of testing. At the age of 7 and 28 days, specimens were stopped with isopropanol and then dried for 24 h at 40 °C. The dried specimens were impregnated with resin and polished stepwise mechanically with diamond oil suspensions of particle size 15, 3, 1, and 0.25 μm. A carbon coating of approximately 8–10 nm thickness was applied to the specimens (SCD 500, Baltec, Germany). The surfaces of the prepared samples were viewed by ultra-high resolution SEM (Helios Nanolab G4 UX, Thermo Fisher Scientific, Eindhoven, The Netherlands) at 12 kV.
For a quantitative evaluation of the phase change due to hydration, QXRD analyses were performed on paste samples, as described above. The paste samples were stored in sealed containers at laboratory climate. At the age of 1, 7, 28, and 56 days the hydration was stopped, and the samples were ground <63 µm for analysis.
To determine the pH values of the pore solutions of all mixtures, the pore solutions were obtained by the leaching method [70,71]. For this purpose, the cement paste samples were taken from the containers at the age of 7 and 28 days. The samples were dried for 24 h at 60 °C. When dry, they were crushed and ground in a mortar grinder <100 µm. The powder was mixed in a 1:1 ratio with deionized water for 5 min and then centrifuged. The supernatant was carefully removed, and the pH was measured.
2.2. Investigation of Carbonation Depth due to Natural and Accelerated Carbonation
Investigations of carbonation depths due to natural and accelerated carbonation were carried out on mortar prisms produced analogously to DIN EN 196-1 (2016-11) with the w/b ratios given above. The samples with alkali-activated binders (AAS I and II, Geo MK, and Geo FA) were stored at laboratory climate after demolding, as water storage at a very early hydration stage can lead to dissolution phenomena at the edges of the sample. All other samples were stored underwater until 28 days of age. The possible differences in the initial carbonation depth due to the different storage were not measured.
To determine the depth of carbonation by natural carbonation, the samples were stored after these 28 days for one year at 20 °C and 65% relative humidity.
In preparation for accelerated carbonation, after water storage, the mortar prisms were first stored for drying at laboratory climate (20 °C and 65% relative humidity) for 14 days. Then, they were stored in a storage chamber at 1 vol.-% CO2 at 20 °C and 65% rel. humidity for one year. To determine the progress of carbonation, the specimens were split, and the broken surfaces were sprayed with 1% phenolphthalein solution. Since the carbonated area is indicated by a color change from red-violet to colorless, the carbonation progress could be detected optically.
2.3. Investigation of Structural Changes due to Accelerated Carbonation at 1% CO2
To assess the structural changes of the materials due to carbonation by SEM and EDX, mortar samples were prepared. After 180 days of storage at 1 vol.-% CO2 they were sawn and prepared as described above. When sawing out, the focus was on the carbonated surfaces, which were marked beforehand.
For a quantitative evaluation of the phase change due to carbonation, QXRD analyses were performed on paste samples, as described above. The paste samples were stored in sealed containers at laboratory climate until 56 d. Subsequently, the samples were ground < 63 µm and stored at 1 vol.-% CO2 for a further 56 and 180 days respectively.
2.4. Investigation of the Pore Structures
The pore radius distribution was measured by mercury high pressure porosimetry (MIP) according to DIN ISO 15901-1. The mercury used had a density of 13.54 g/mL and a wetting angle of 141.3°. With the applied pressure range between 0.0031–206.0 N/mm2, pore radii between 244 µm and 4 nm could be detected.
The investigation of pore size distribution and density was carried out at pastes to be able to describe the influence of binder hydration and carbonation on the microstructure without effects from sands or aggregates. To determine the effect of hydration on pore structure, paste samples were stored in closed containers for 1, 28, and 56 days. The sample material was crushed into regular fragments. The material was then stopped in isopropanol for about 15–20 min and dried at 35 °C. The samples of Geo FA series could not be examined at the age of one day because the curing had not yet progressed sufficiently. For the influence of accelerated carbonation, the samples were also stored in closed containers for 56 days and then stored at 1 vol.-% CO2 for another 56 days. The further procedure was the same as for the hydration samples.
3. Results
In this section, the results from the investigations described above are shown in the same order.
3.1. Phase Compositions of the Initial Materials (XRD)
The main characteristics of the phase composition of the initial materials are given below.
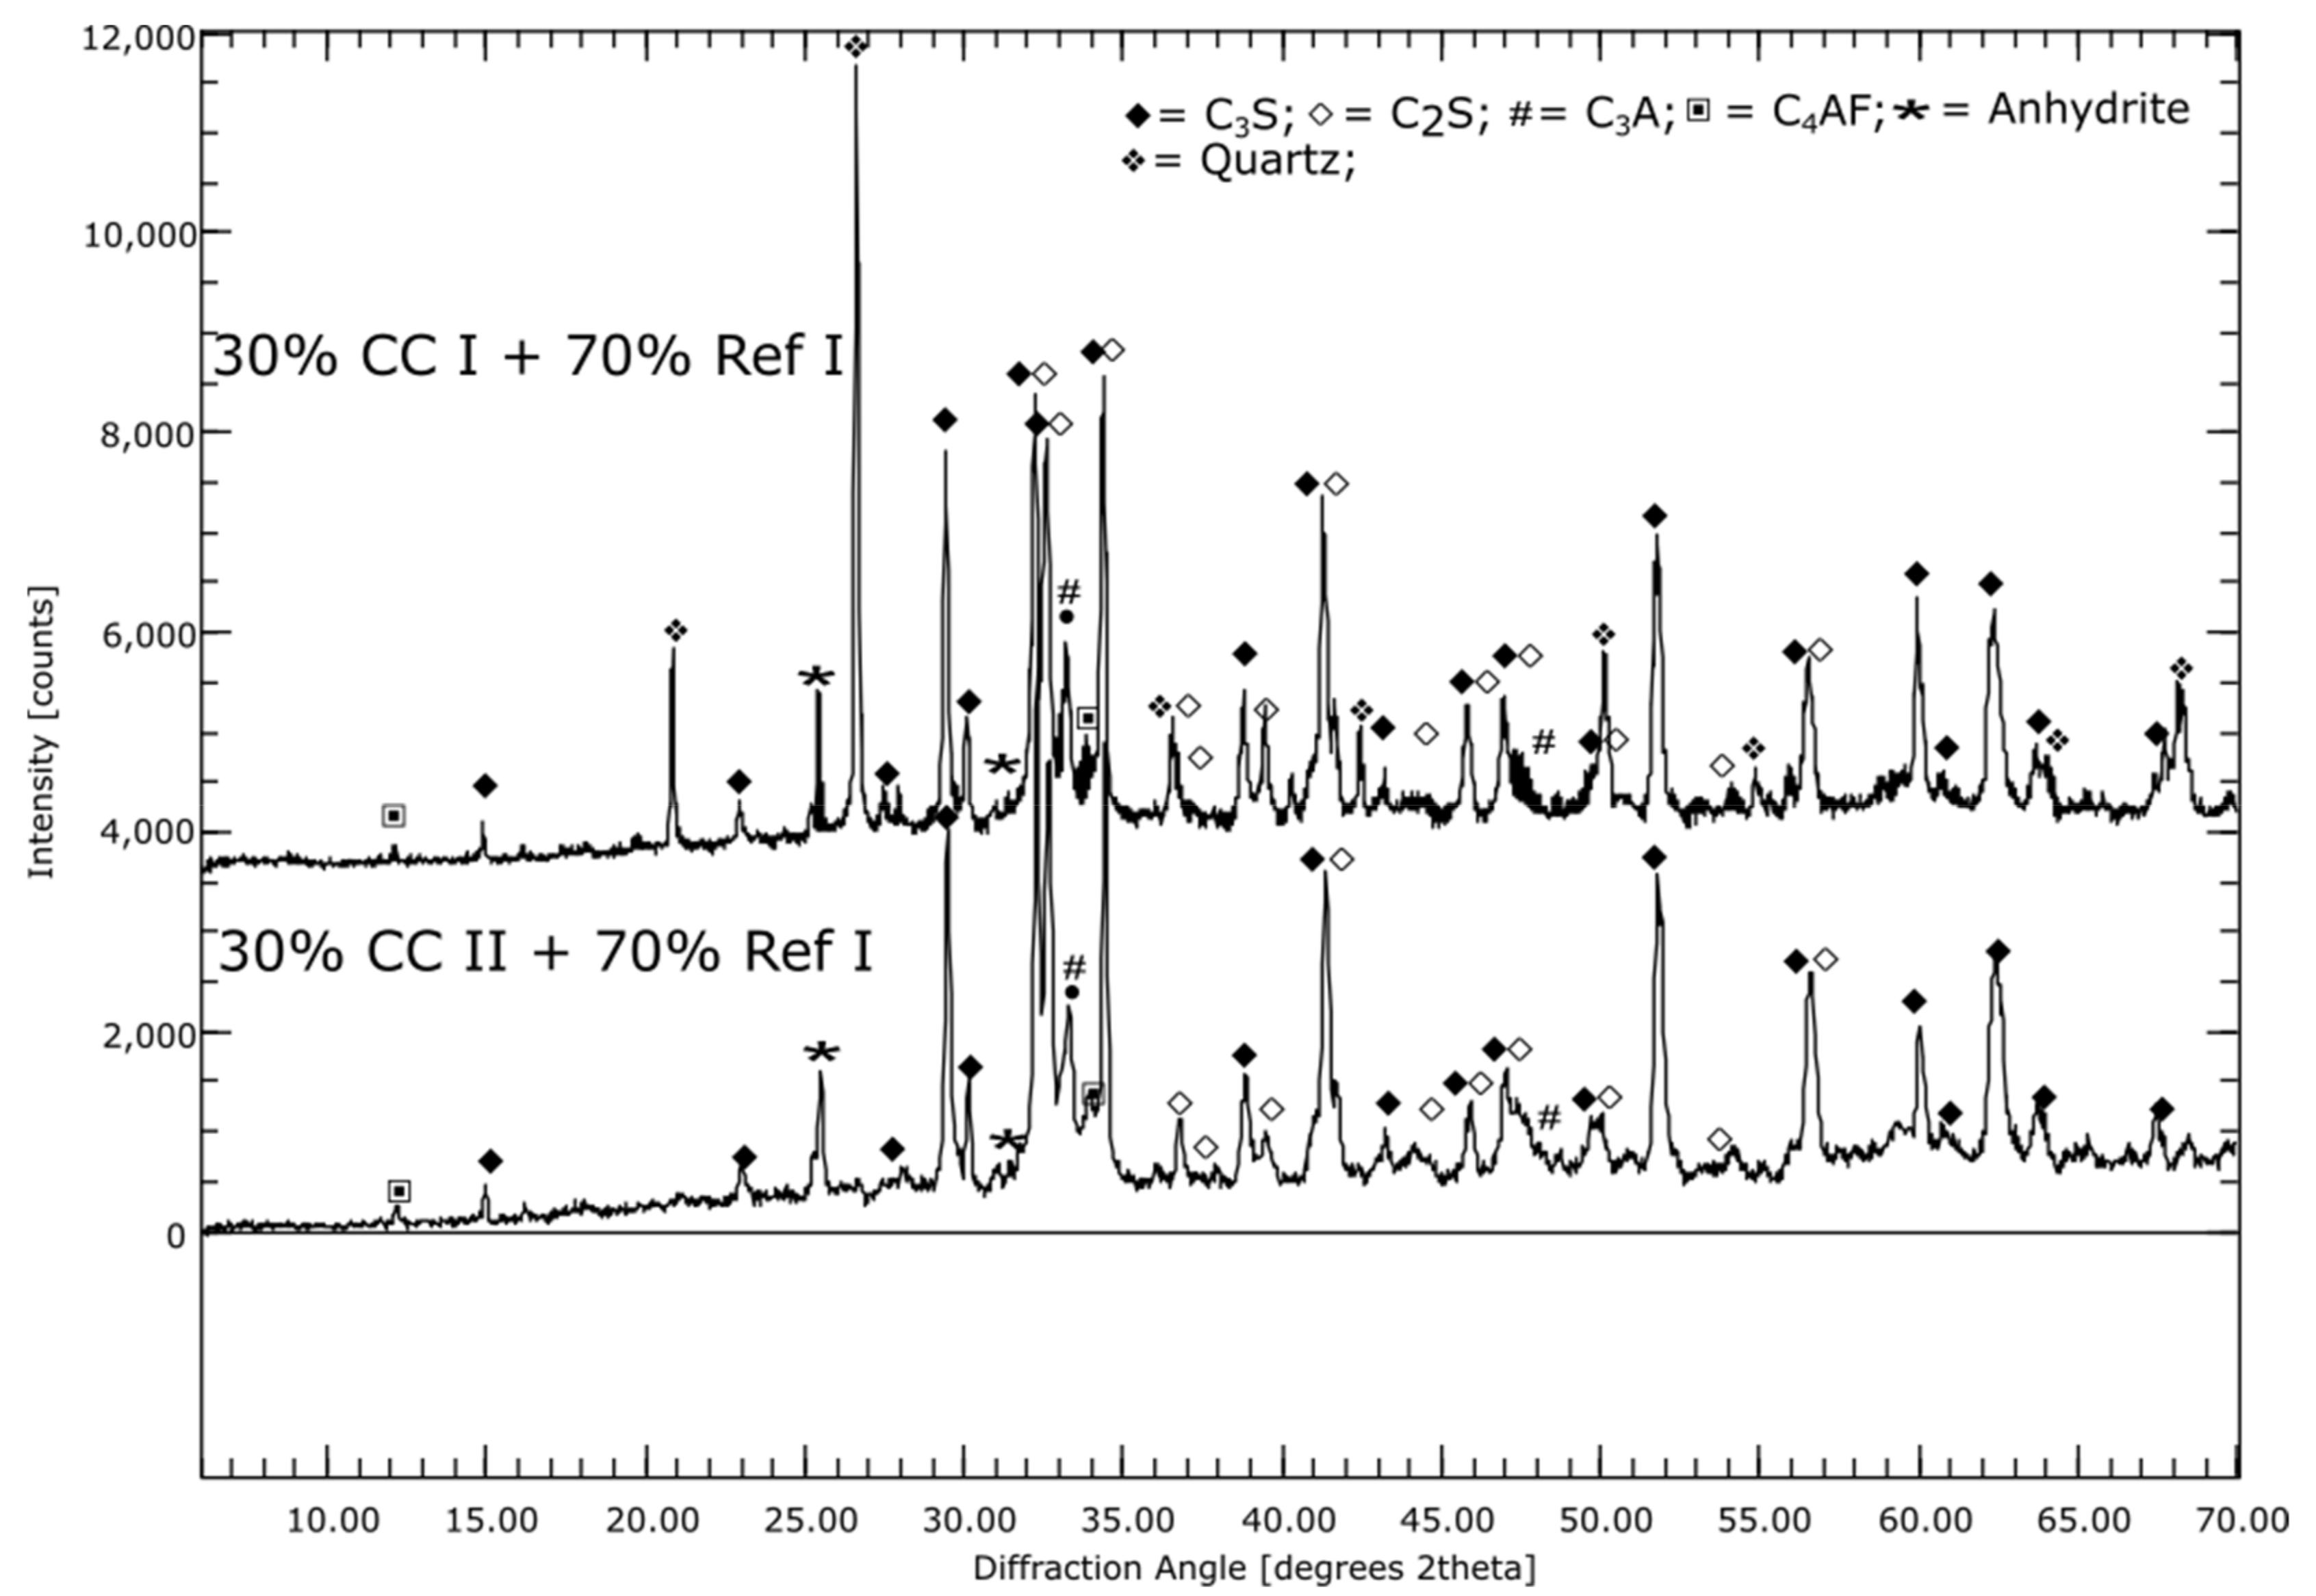
Ref I consists of about 50% C3S. The C2S content is about 20%, while C3A accounts for around 5% of Ref I. The metaillite (CC I) contains mainly quartz and X-ray amorphous phases, while the metakaolin (CC II) consists almost exclusively of X-ray amorphous phases. Half of the modified LD slag consists of C2S. Other notable constituents (>5%) are bredigite (Ca7Mg[SiO4]4), wüstite ([Mg,Fe]O) and dicalcium ferrite (CaO Fe2O3 in short: C2F).
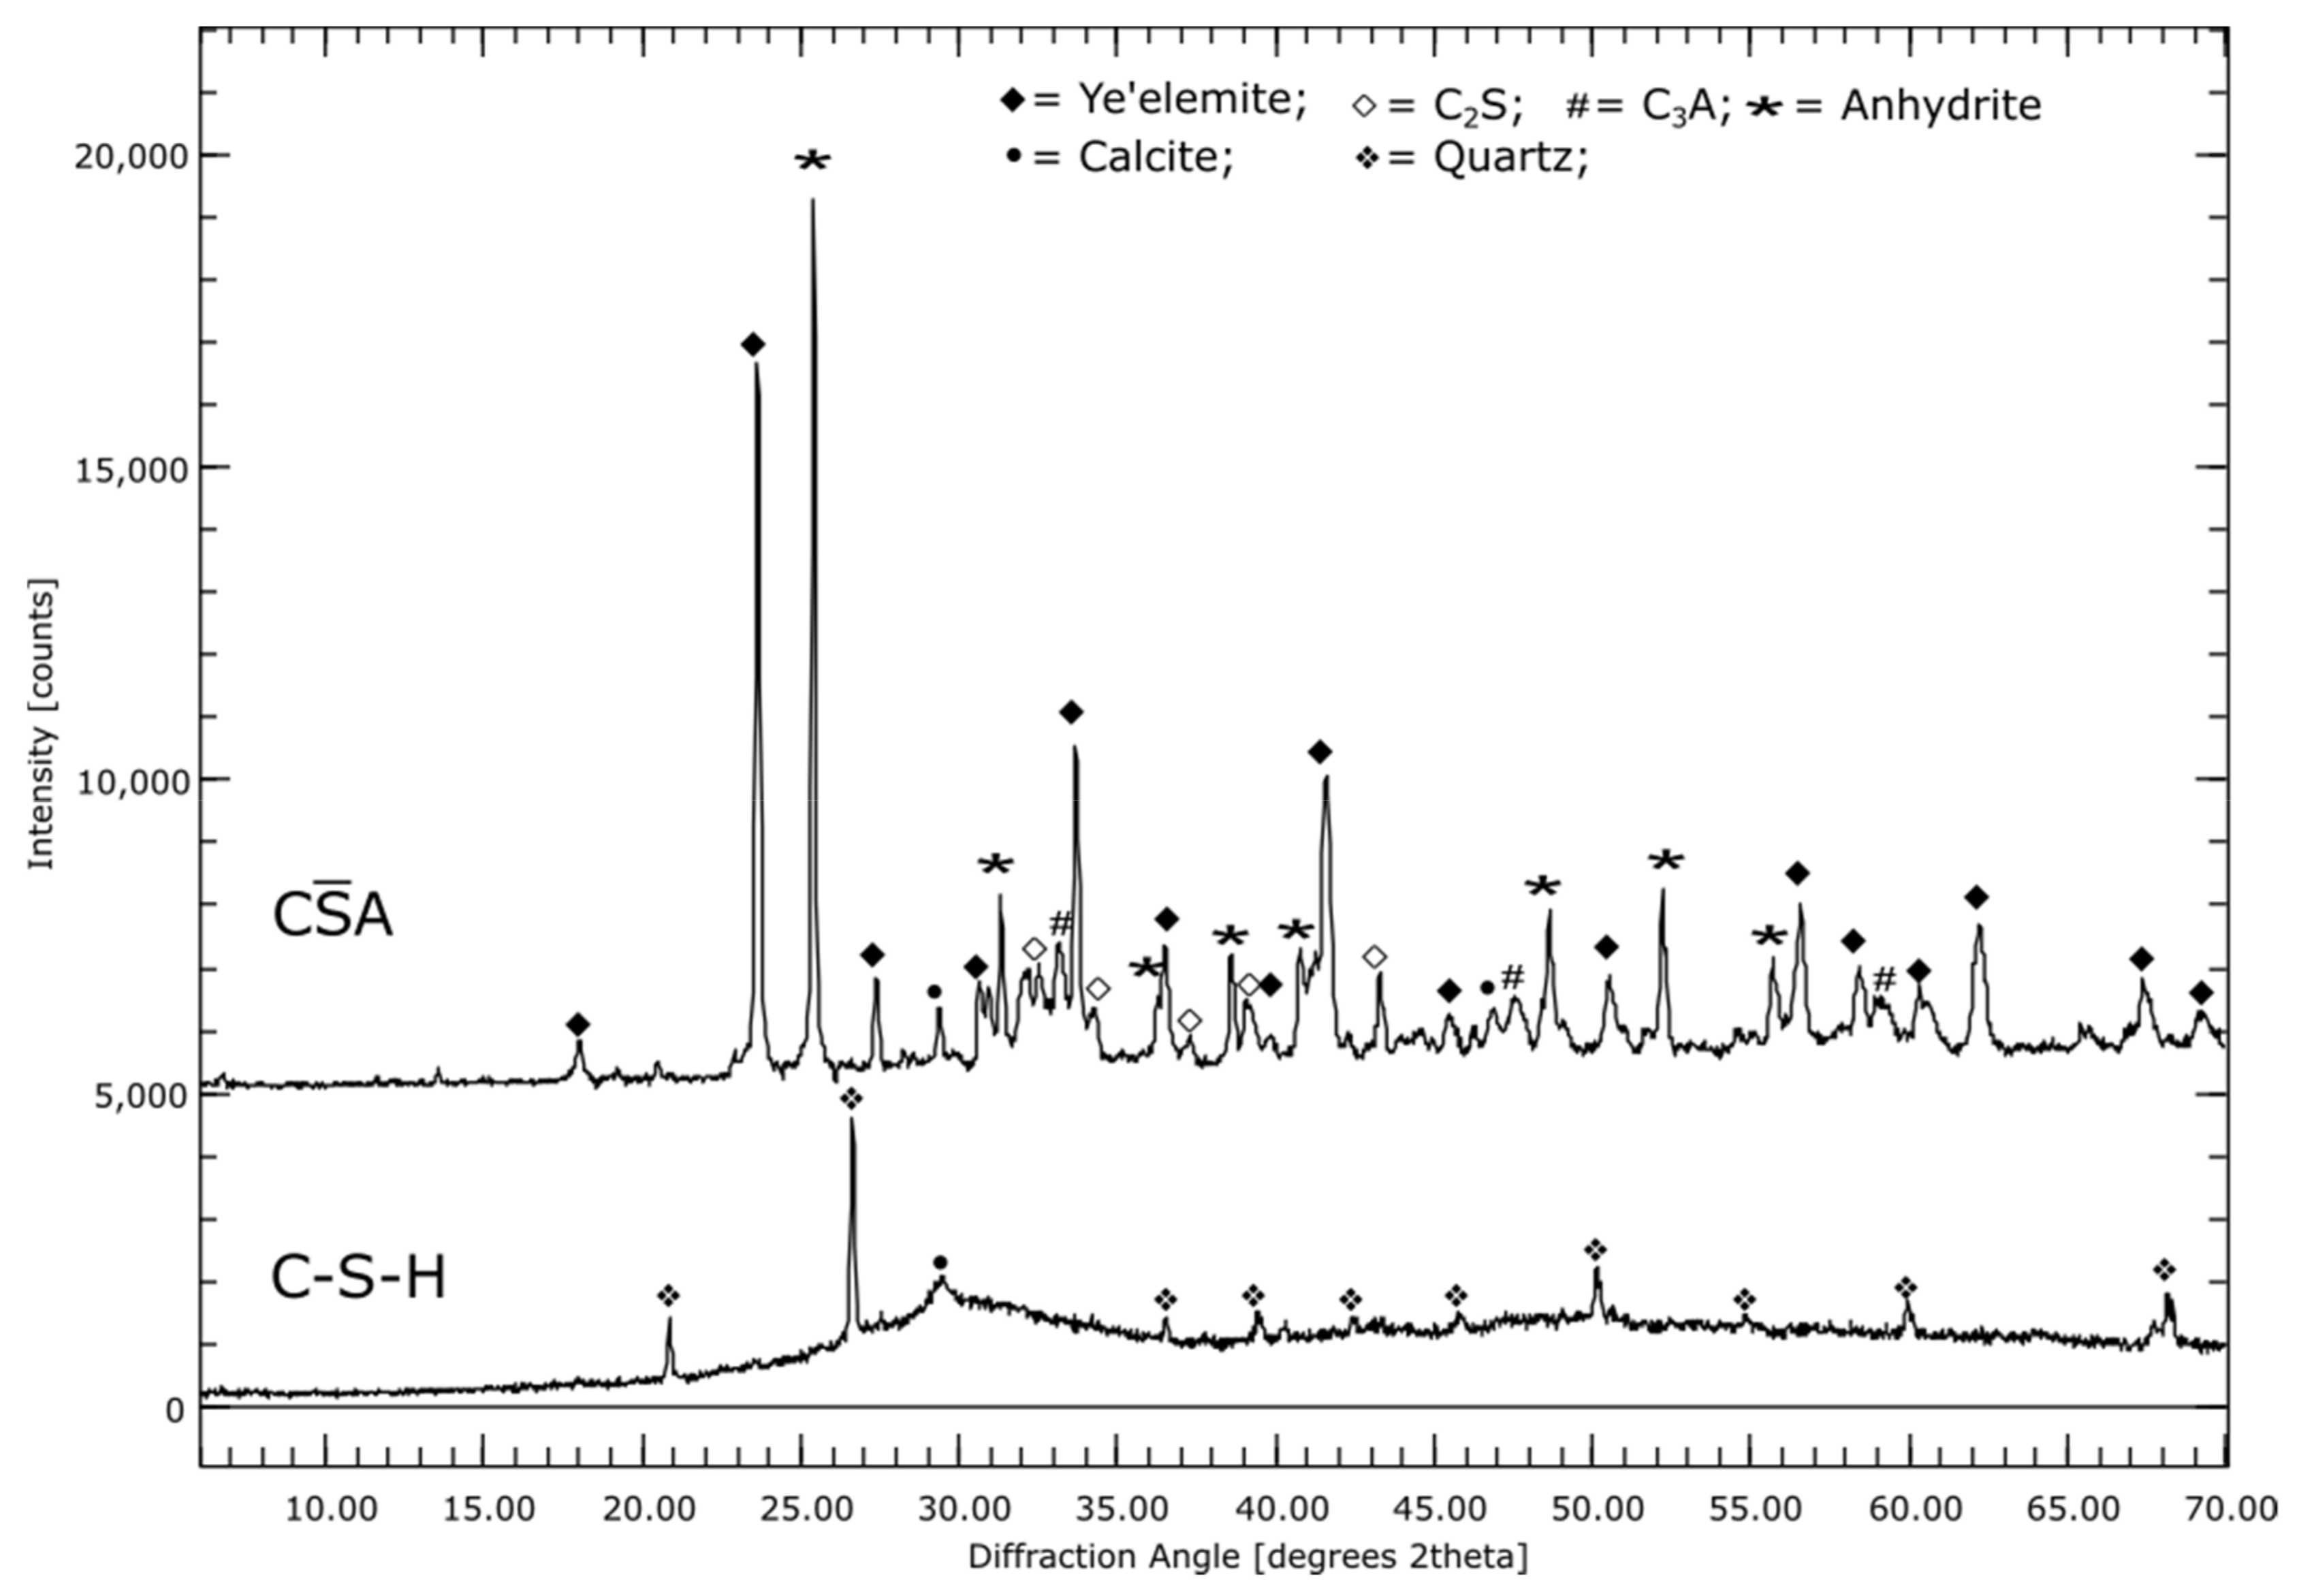
The CA cement used, consists of around 47% ye’elemite. Other constituents are anhydrite (24%), C2S (16%) and C3A (7%).
The C-S-H binder is a prehydrated binder. By means of XRD, an X-ray amorphous fraction of about 88% could be determined. Another phase constituent is quartz.
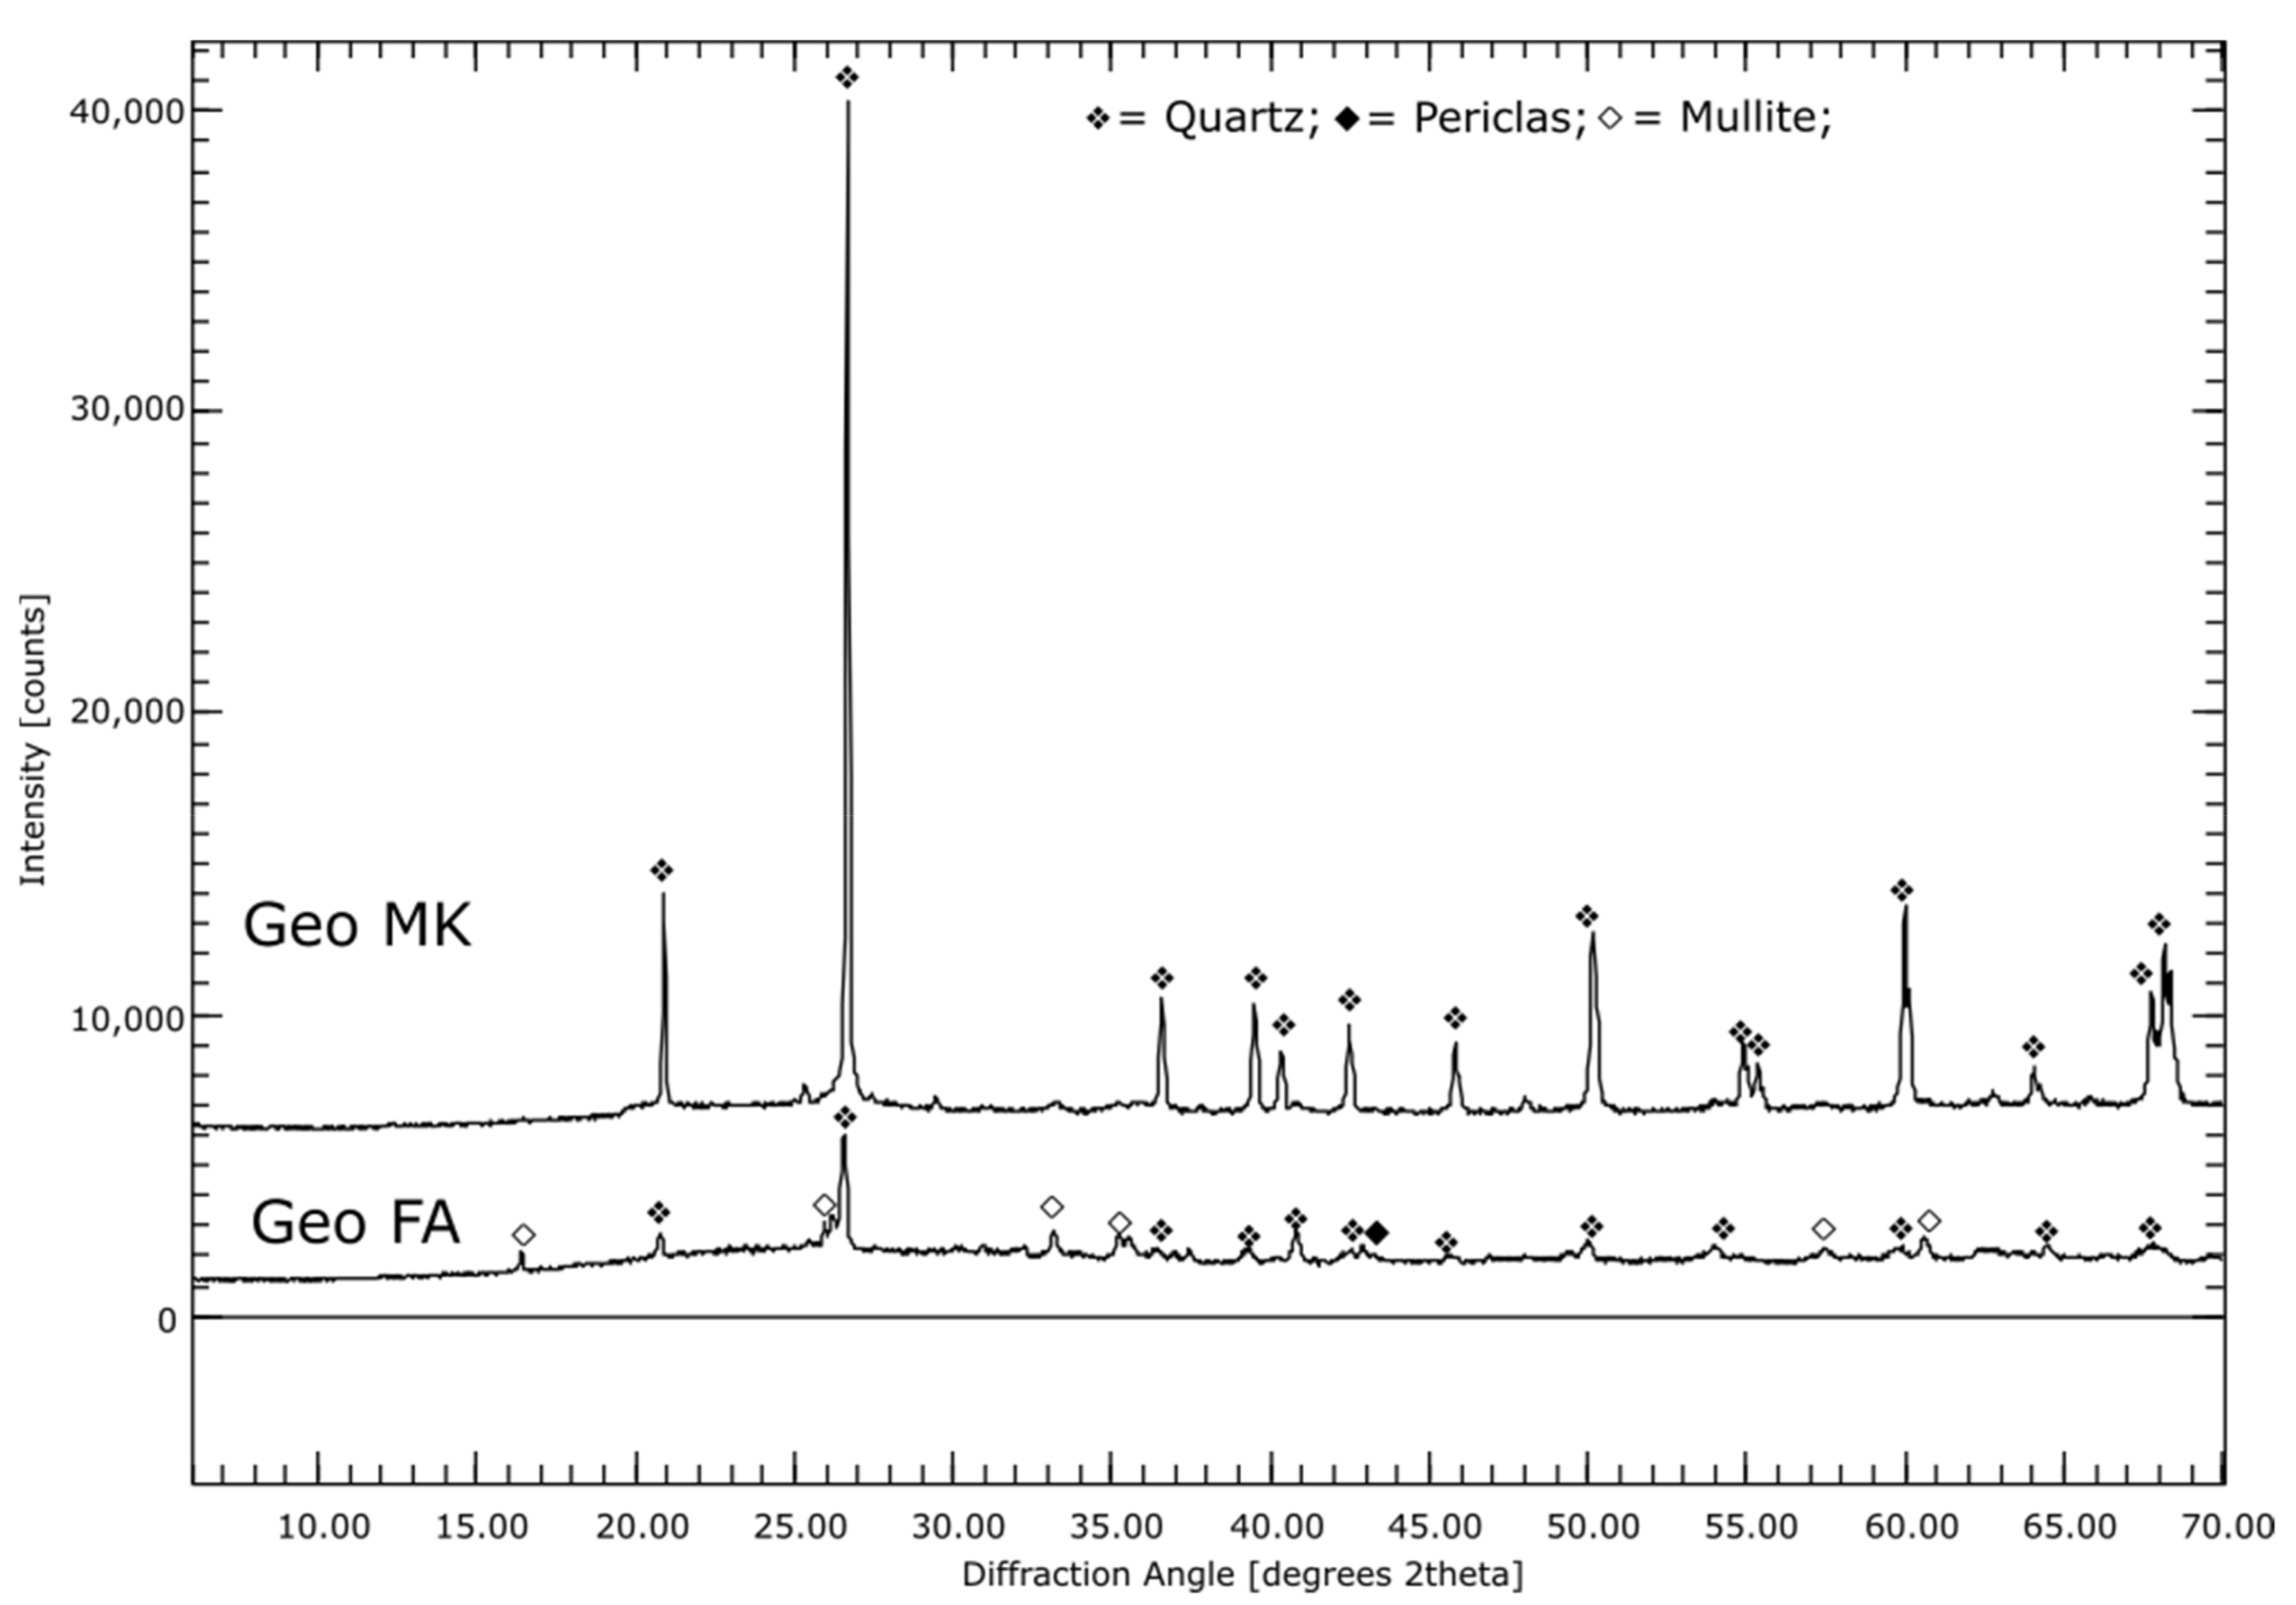
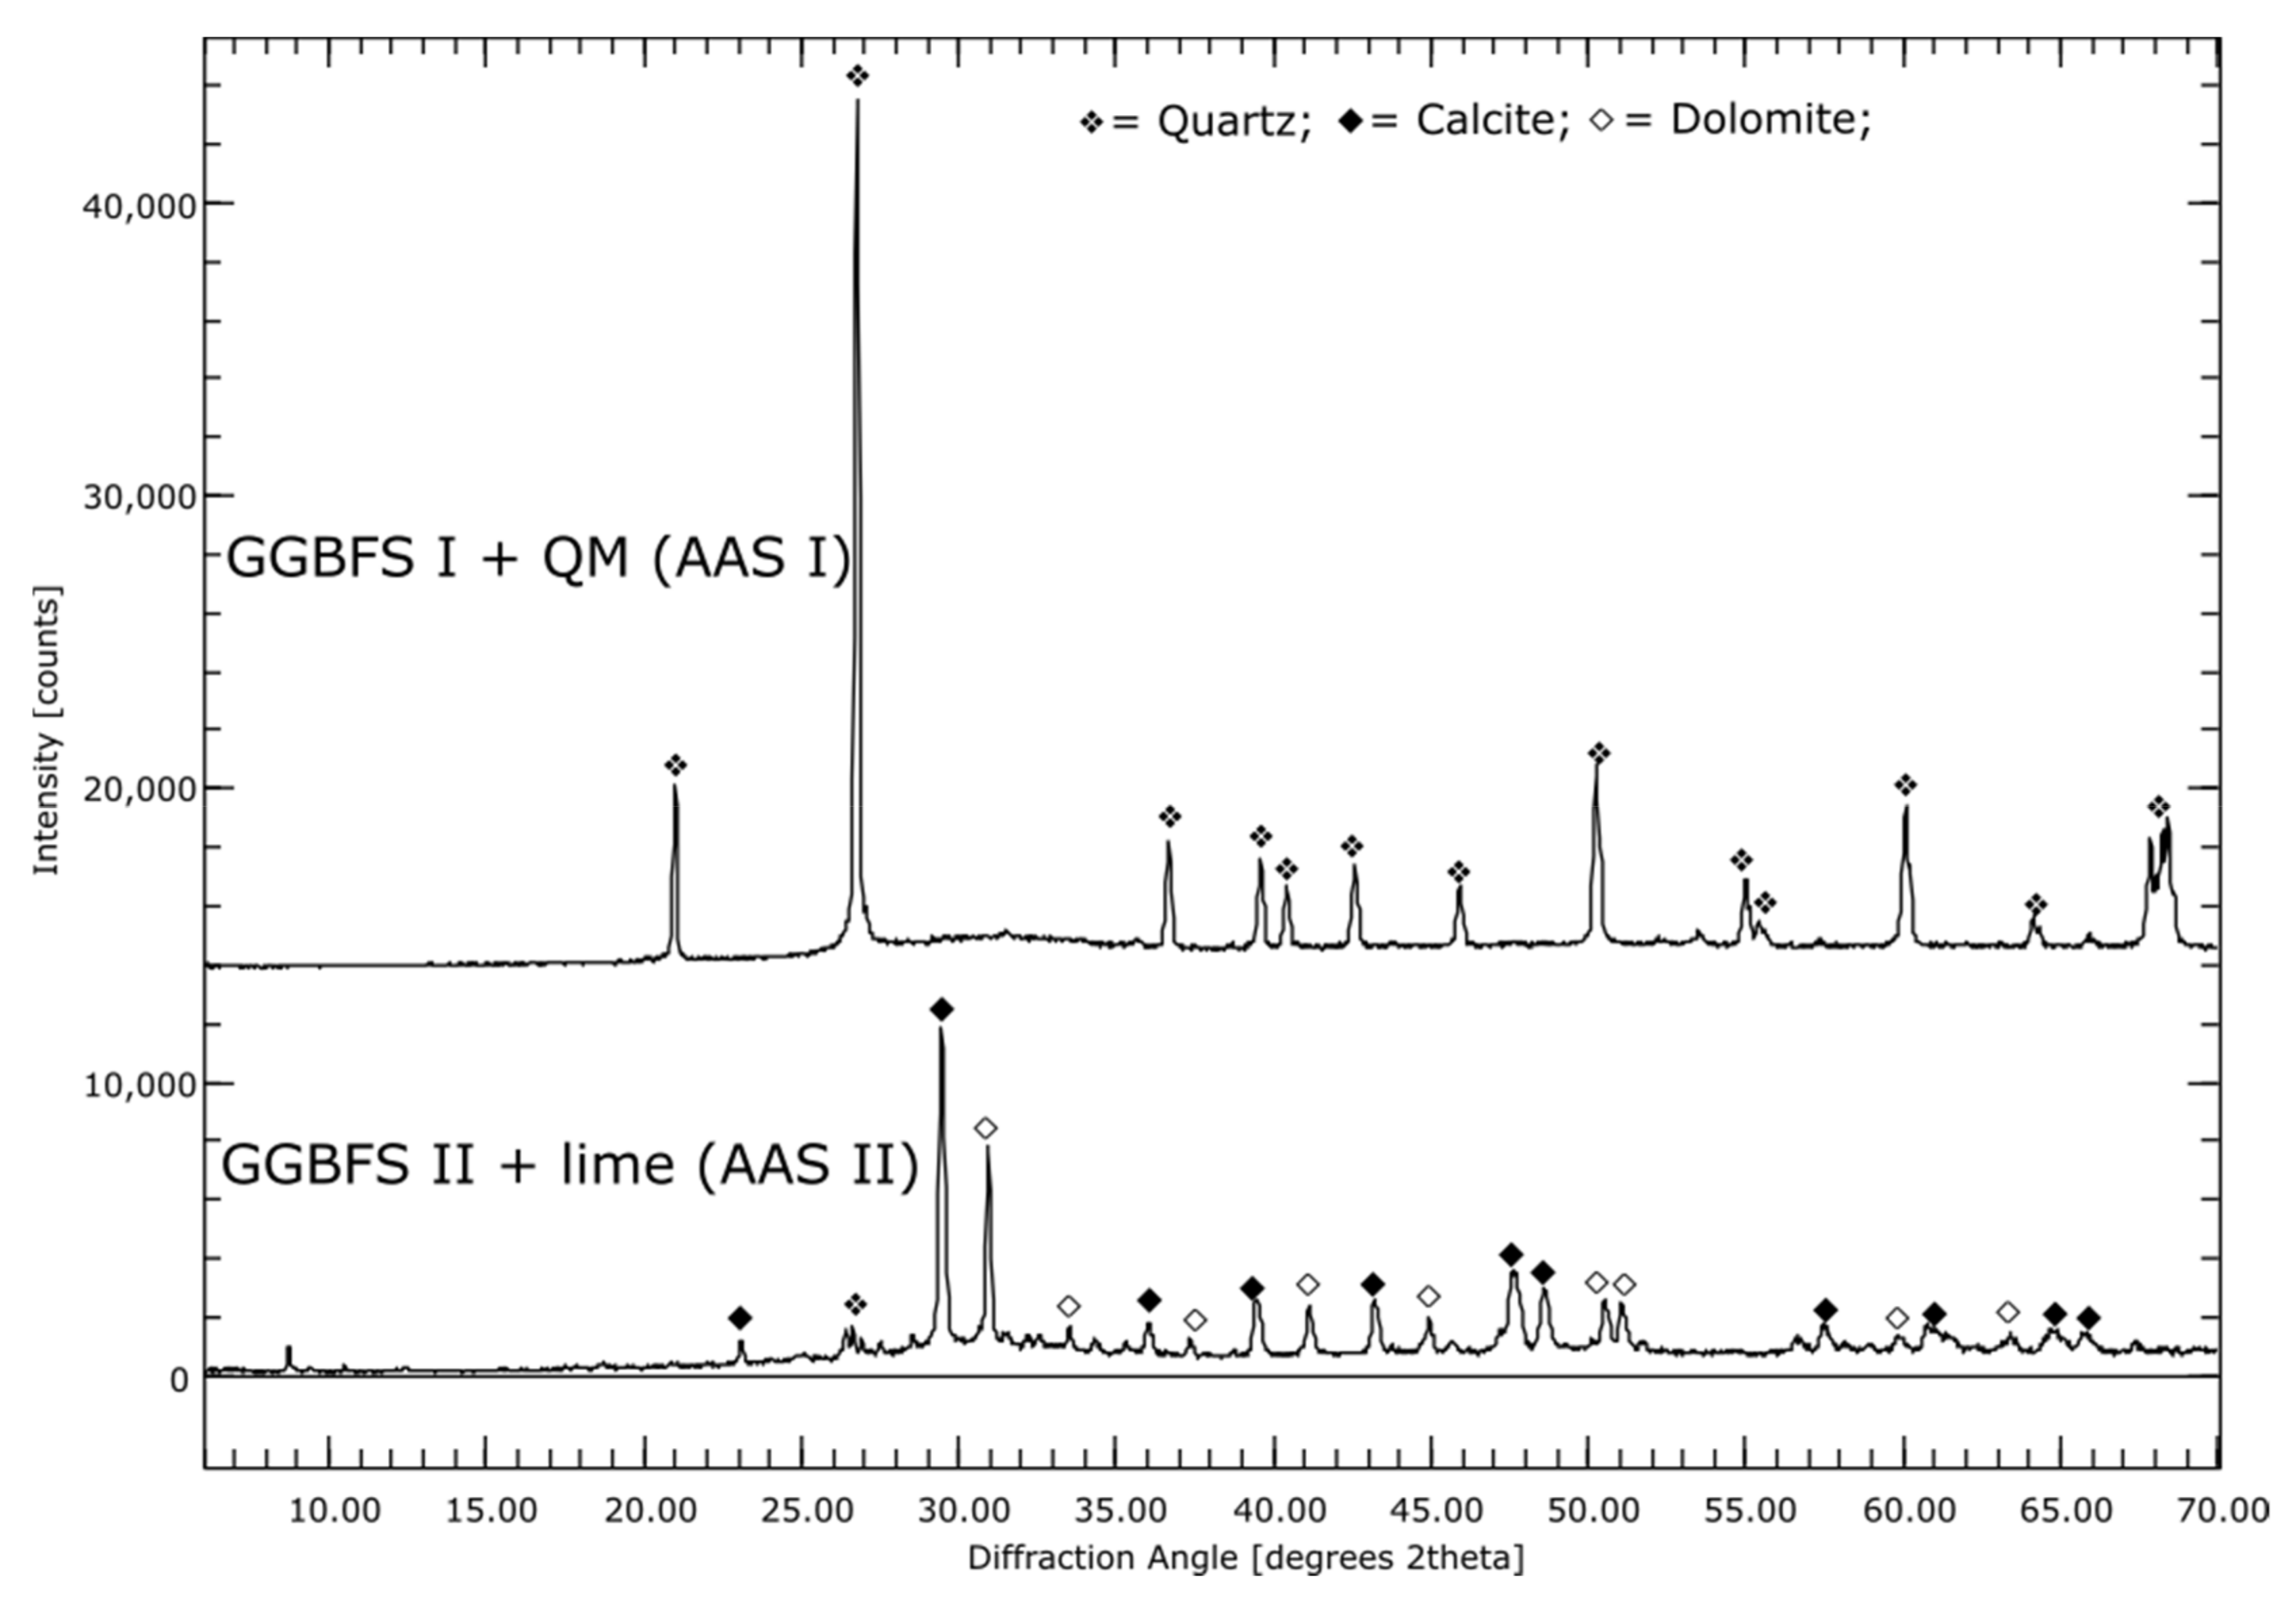
For the different AAMs the precursors were investigated: The fly ash is mainly X-ray amorphous with small amounts of quartz, periclase and mullite. Elemental analysis showed that it contains 56% SiO2, 22% Al2O3, 8% Fe2O3,6% CaO and 2% each of MgO and K2O. The metakaolin used for geopolymer production is 30% X-ray amorphous, the main component with about 70% is quartz. Both BFSs are, as expected, completely X-ray amorphous. In addition to large amounts of SiO2 and CaO, GGBFS 1 has about 20% and GGBFS 2 about 10% Al2O3. Furthermore, both BFSs contain about 6% MgO.
3.2. Hydration Process (SEM and XRD at Cement Paste Samples)
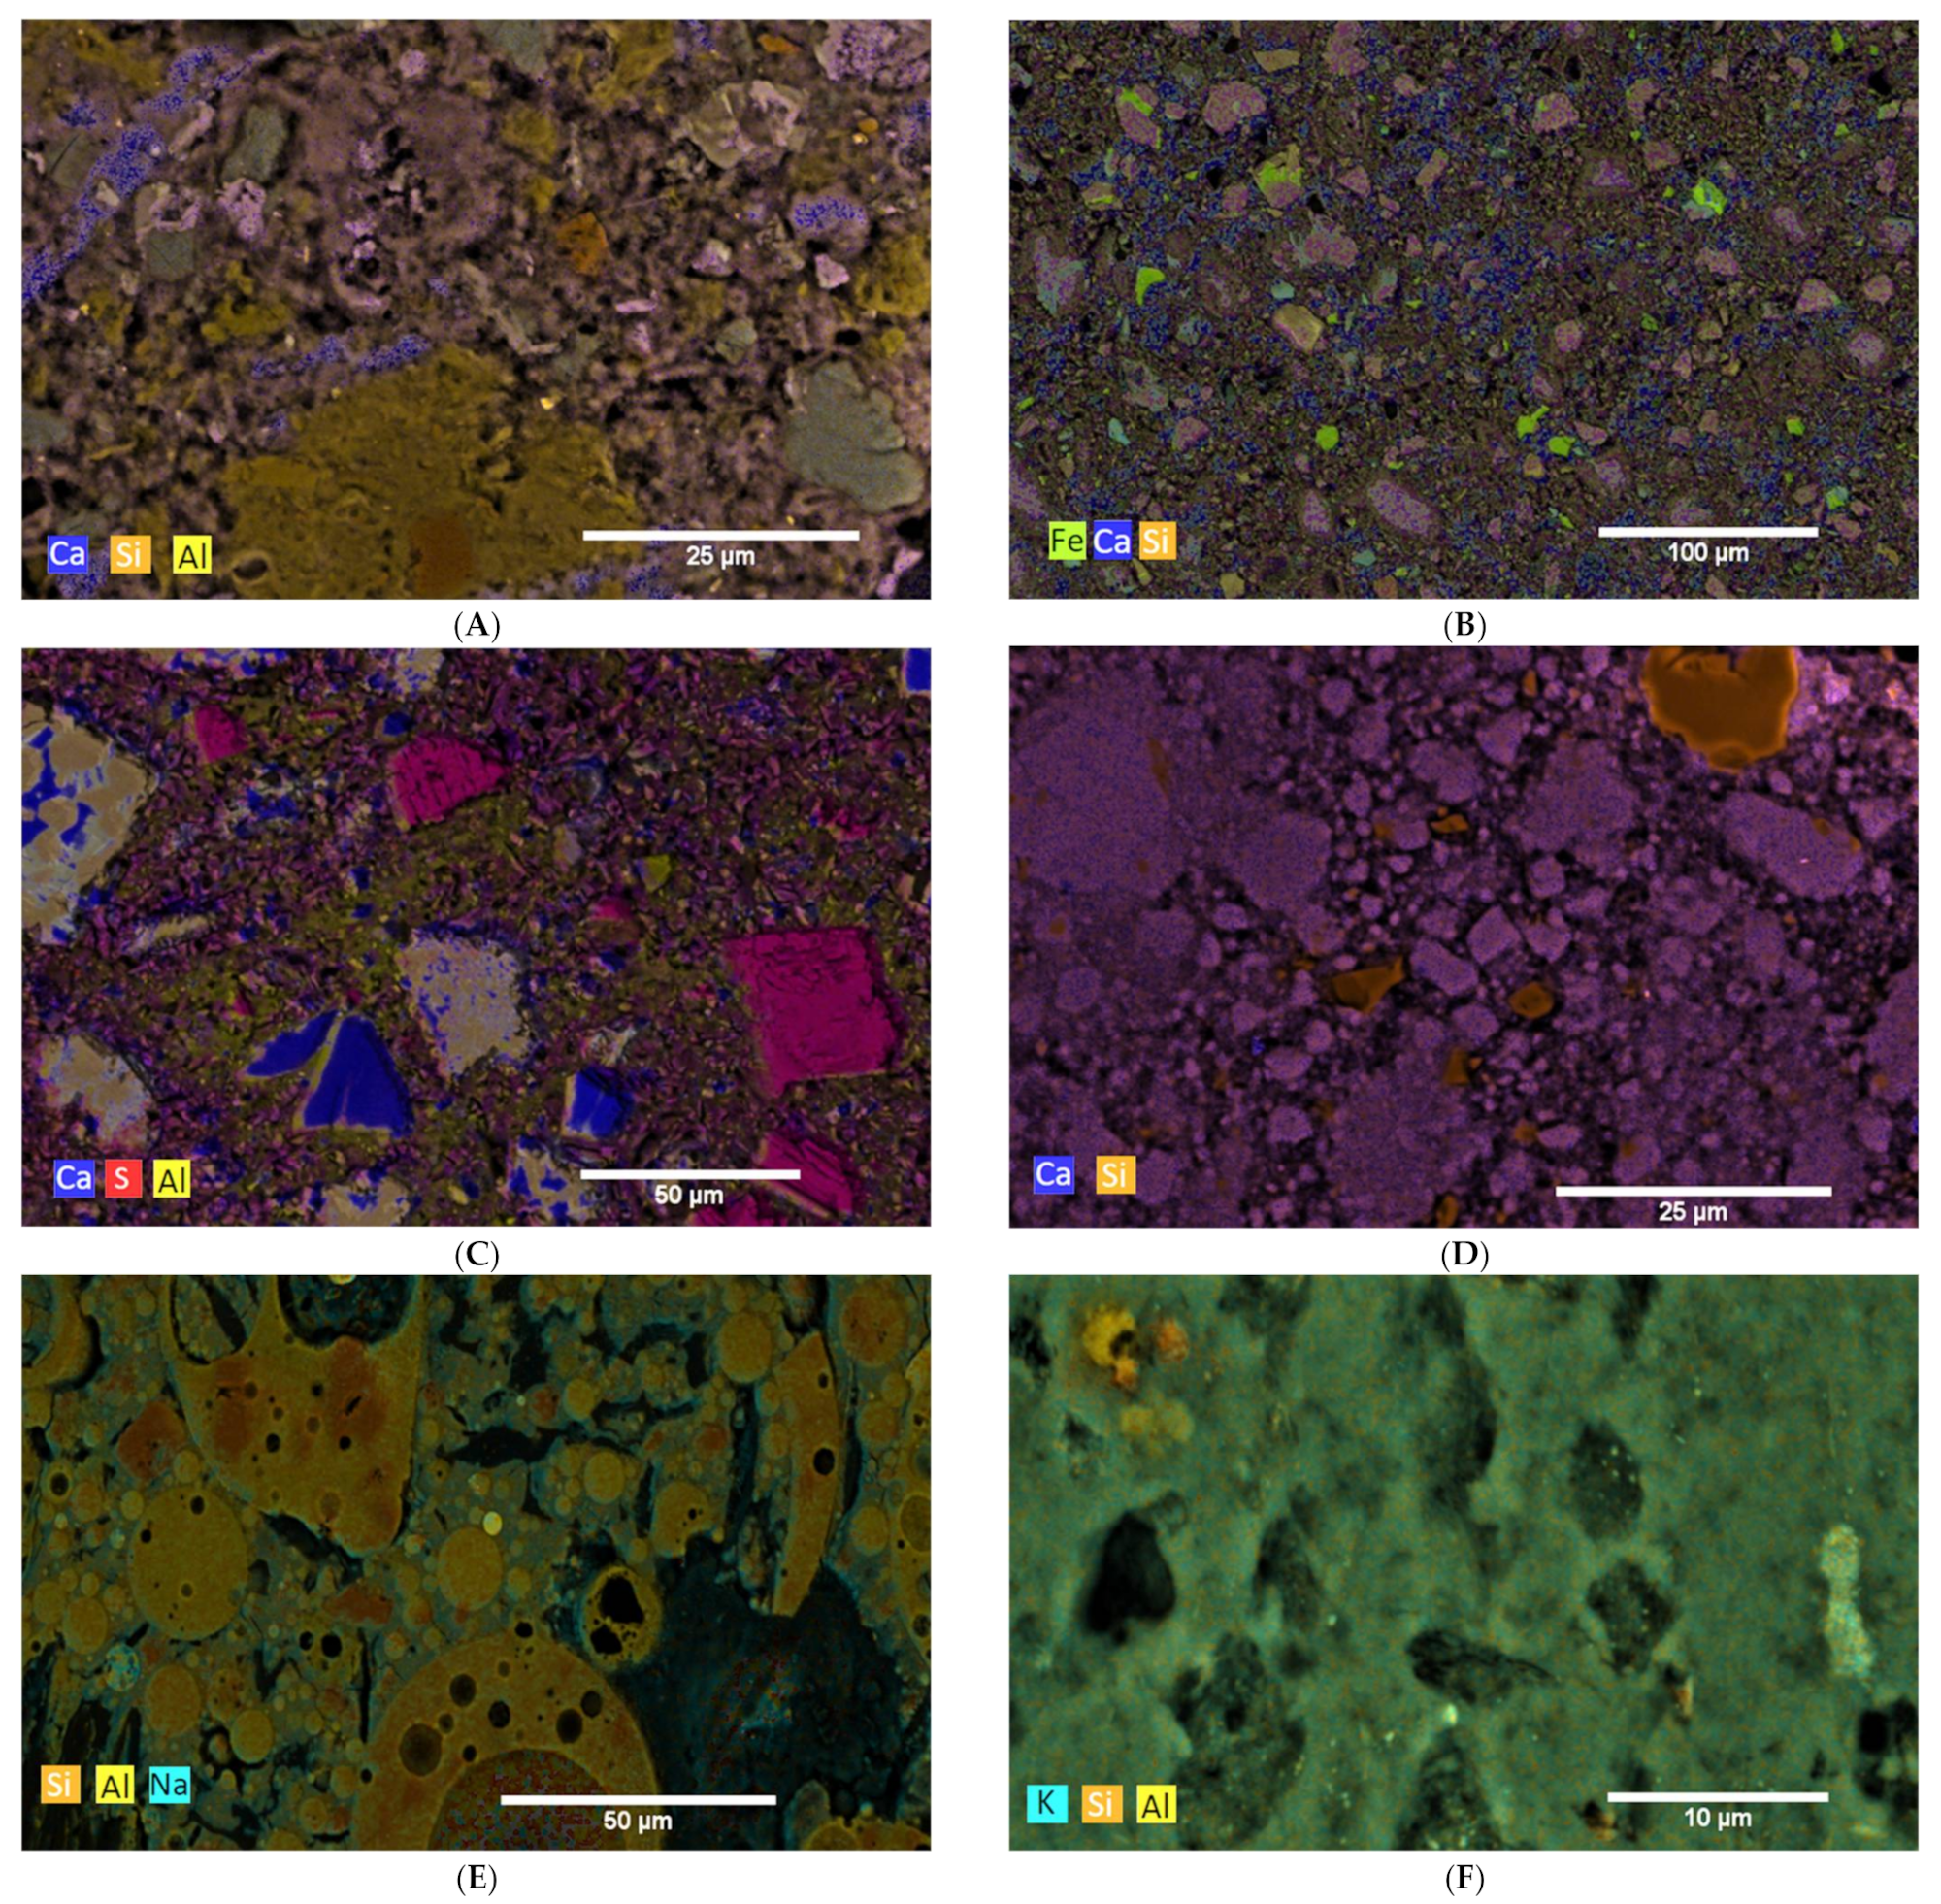
In the Figure 1, the SEM images with element mappings at the age of seven days of cement pastes of each binder are shown.
3.2.1. Reference Cements and SCMs
By means of the SEM image as well as the elemental mapping of sample CC I after seven days hydration, it was found that the space between the coarser particles appears very porous and consists mainly of Ca-Si and Ca-Si-Al-containing phases, see Figure 1. This suggests that C-S-H and C-A-S-H phases were formed during hydration. The coarser particles consist mainly of Si and Al, suggesting unreacted clay particles. The overall picture for CC II is very similar. The sample of LD shows only minor differences to Ref I. In LD, coarser particles with Al or Fe inclusions appear more frequently, indicating unreacted slag particles, see Figure 1B. Otherwise, the interparticle space consists of a mainly Ca and Si containing phase. This suggests C-S-H phases as described by Jiang et al. [49].
The reference and composite cements show streaky appearing areas of high Ca content, which were identified as portlandite also by XRD. For LD the content remains constant over the measurement period, while it decreases at CC I and CC II (Table 2). However, at the beginning of the measurement, the portlandite content in CC II is already lower at 14% than in CC I at 18%. After 56 d of hydration, sample CC I still shows 11% and sample CC II still 4% portlandite. An increase of the X-ray amorphous fraction over a hydration time of 56 days is indicates the formation of C-(A)-S-H phases. This is in good agreement with the elemental mappings.
3.2.2. CA
Element mapping of a 7-days-old CA sample revealed primarily Ca, S, and Al-bearing phases, see Figure 1C. EDX point analyses showed that ettringite, aluminum hydroxide (AH), monosulfate and anhydrite were formed. Furthermore, smaller particles containing Ca and Si can be seen. This suggests unreacted C2S.
For CA, there was a tendency for the X-ray amorphous fraction to decrease; the hydration products are mainly crystalline. Furthermore, small amounts of monosulfate are detectable in the sample already after 1 day of hydration time, which do not increase significantly over the entire measurement time. The content of portlandite was <1% independent of the degree of hydration.
3.2.3. C-S-H
In the mapping of the C-S-H sample, no difference can be seen between the individual particles and their interstitial space on the basis of the Ca and Si distribution, see Figure 1D. Sporadically, small particles are recognizable, which consist mainly of Si and a little Al. These are most likely quartz.
3.2.4. AAMs
The image of the sample from the Geo FA series clearly shows the fly ash particles, see Figure 1E. The intermediate space is filled by a strong Na-containing phase. Furthermore, Al and Si can be detected in the intermediate phase, so that N-A-S-H phases can be assumed here. In addition, a small amount of Ca was measured, which again indicates the formation of C-A-S-H phases. The mapping of the Geo MK sample shows a homogeneous picture; sporadically, strongly Si-containing particles are visible, which are probably quartz, see Figure 1F. The interstitial space contains K, Al and Si, which suggests the formation of K-A-S-H phases.
For the samples Geo MK and Geo FA no change of the phase assemblage was detected for the whole measuring period of the solidification by XRD. Quartz was the only crystalline phase detected for Geo MK. This is in agreement with the mappings and with [56,72]. Geo FA exhibits periclase and mullite in addition to quartz, which are the phases also present in the pure fly ash.
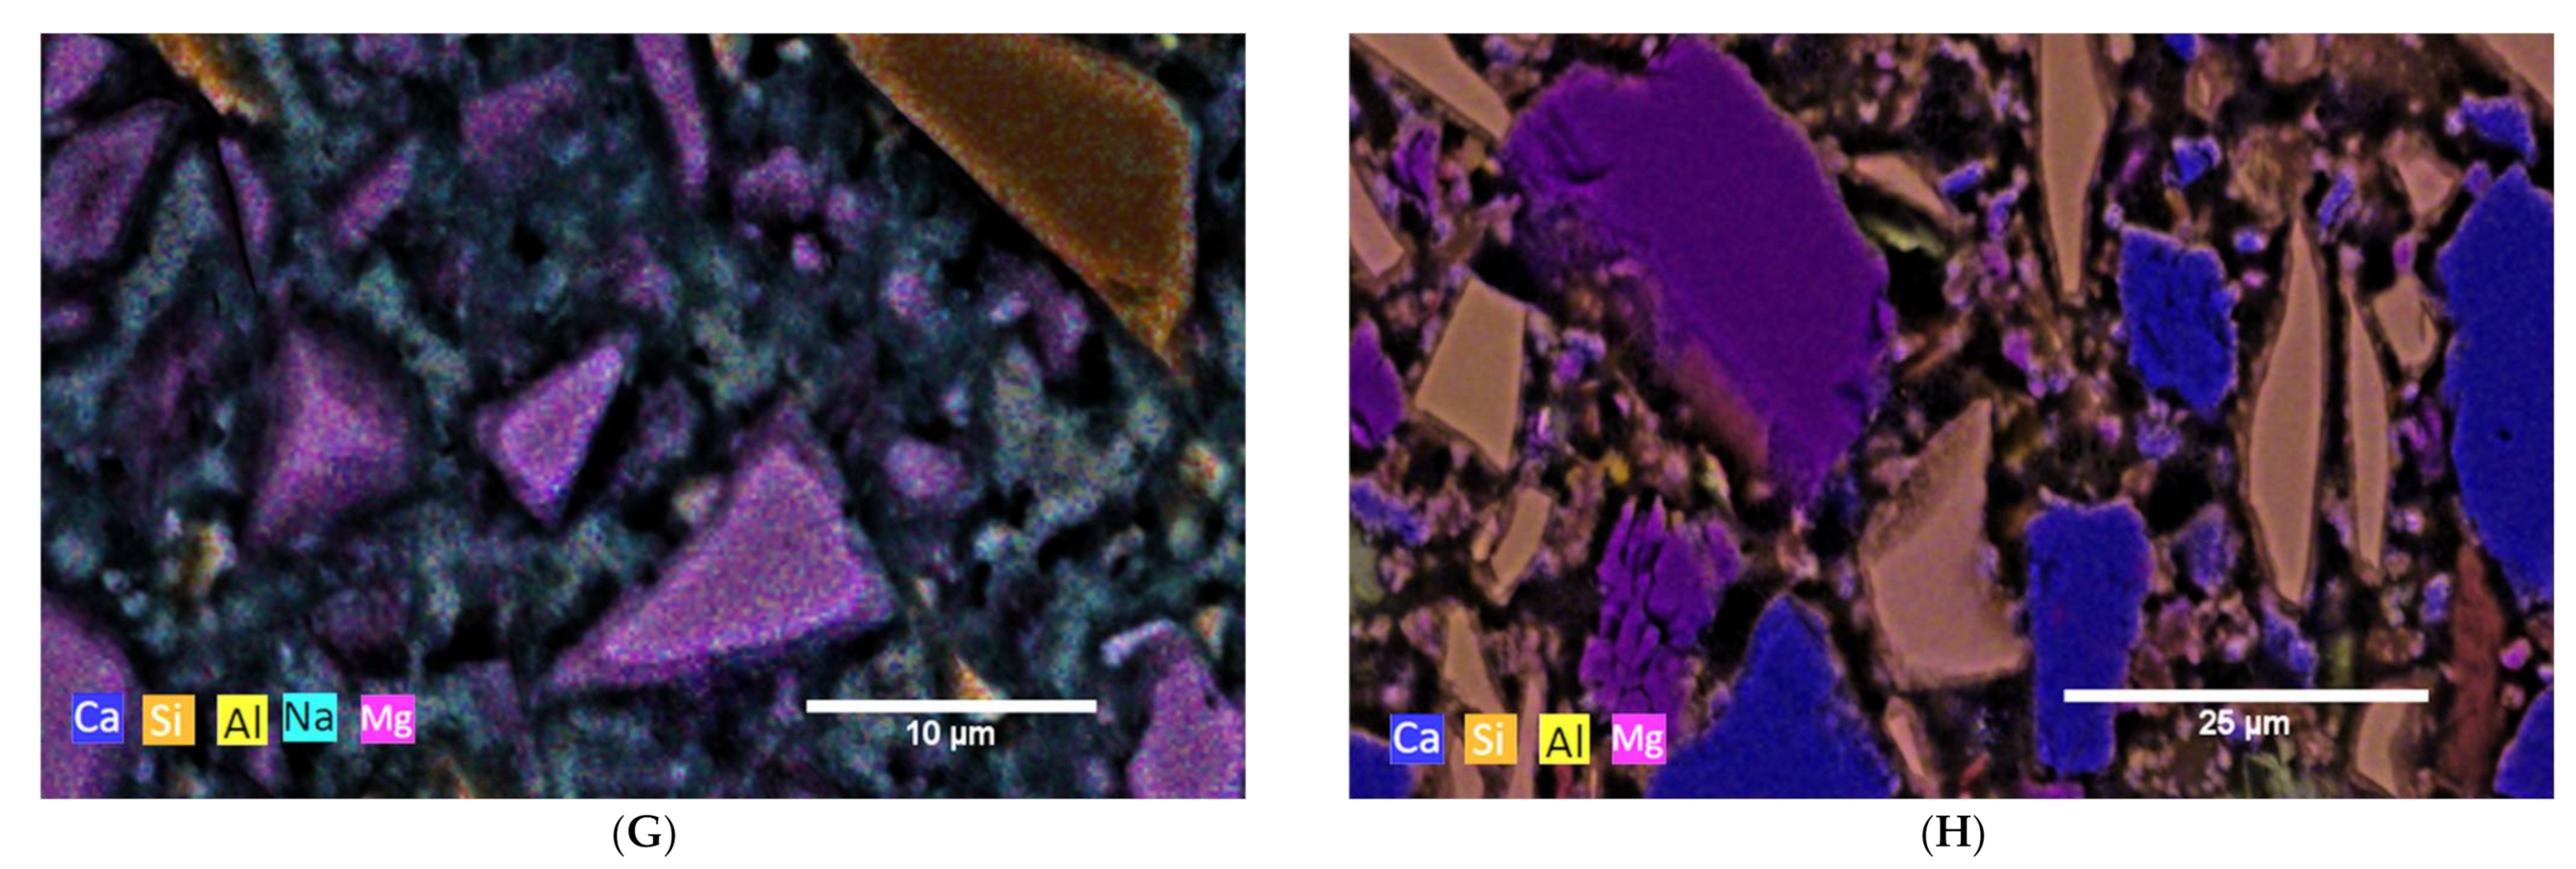
For the AAS I sample, the elemental mapping for the interstitial space between individual GBFS particles shows a composition of Ca, Al, Na, Mg, and Si, see Figure 1G. This indicates the formation of both C-A-S-H and N-A-S-H phases. A clear distinct demarcation between the individual phases is not evident. The Mg-containing regions between the GBFS particles indicate hydrotalcite. This was confirmed by XRD. 5% hydrotalcite is formed between one and seven days of hydration. This amount remains stable over the further measuring period. Quartz occurs as the main crystalline phase, with about 43%. The element mapping of AAS II, which was activated with OPC and NaSO4, shows after seven days mainly Mg, Al and Ca containing particles, which are according to the composition limestone and BFS, see Figure 1H. The interstitial spaces are very porous and only slightly Ca-, Si-, S- and Al-containing, indicating that at this time the hydrate phases are not very dominant. XRD shows the formation of ettringite. In addition, the X-ray amorphous fraction increases. In connection with the element mapping, this indicates the formation of C-(A)-S-H phases.
Table 2 shows the change in portlandite, ettringite and x-ray amorphous amount over 56 d hydration, for the benefit of clarity, further phases are not shown in Table 2 and can be taken from the previous section. Only the reference and cement pastes with SCMs show portlandite as hydration product. Note again the difference between the portlandite contents of CCI and CCII. The portlandite contents of Ref I and LD are very similar. A differentiation between X-ray amorphous starting materials and C-(A)-S-H or N-A-S-H phases is not possible with the applied method, which means that a quantification of these phases is not possible here. After 56 days, CA shows a sudden increase in the X-ray amorphous fraction. However, this does not indicate a phase transformation, but rather a destruction of the unstable ettringite in the course of sample preparation. AAS II is the only one of the AAM samples to show ettringite as a hydration product. This is due to the hydration of the cement and NaSO4 selected as activator.
3.3. Influence of Hydration on the pH of the Pore Solution
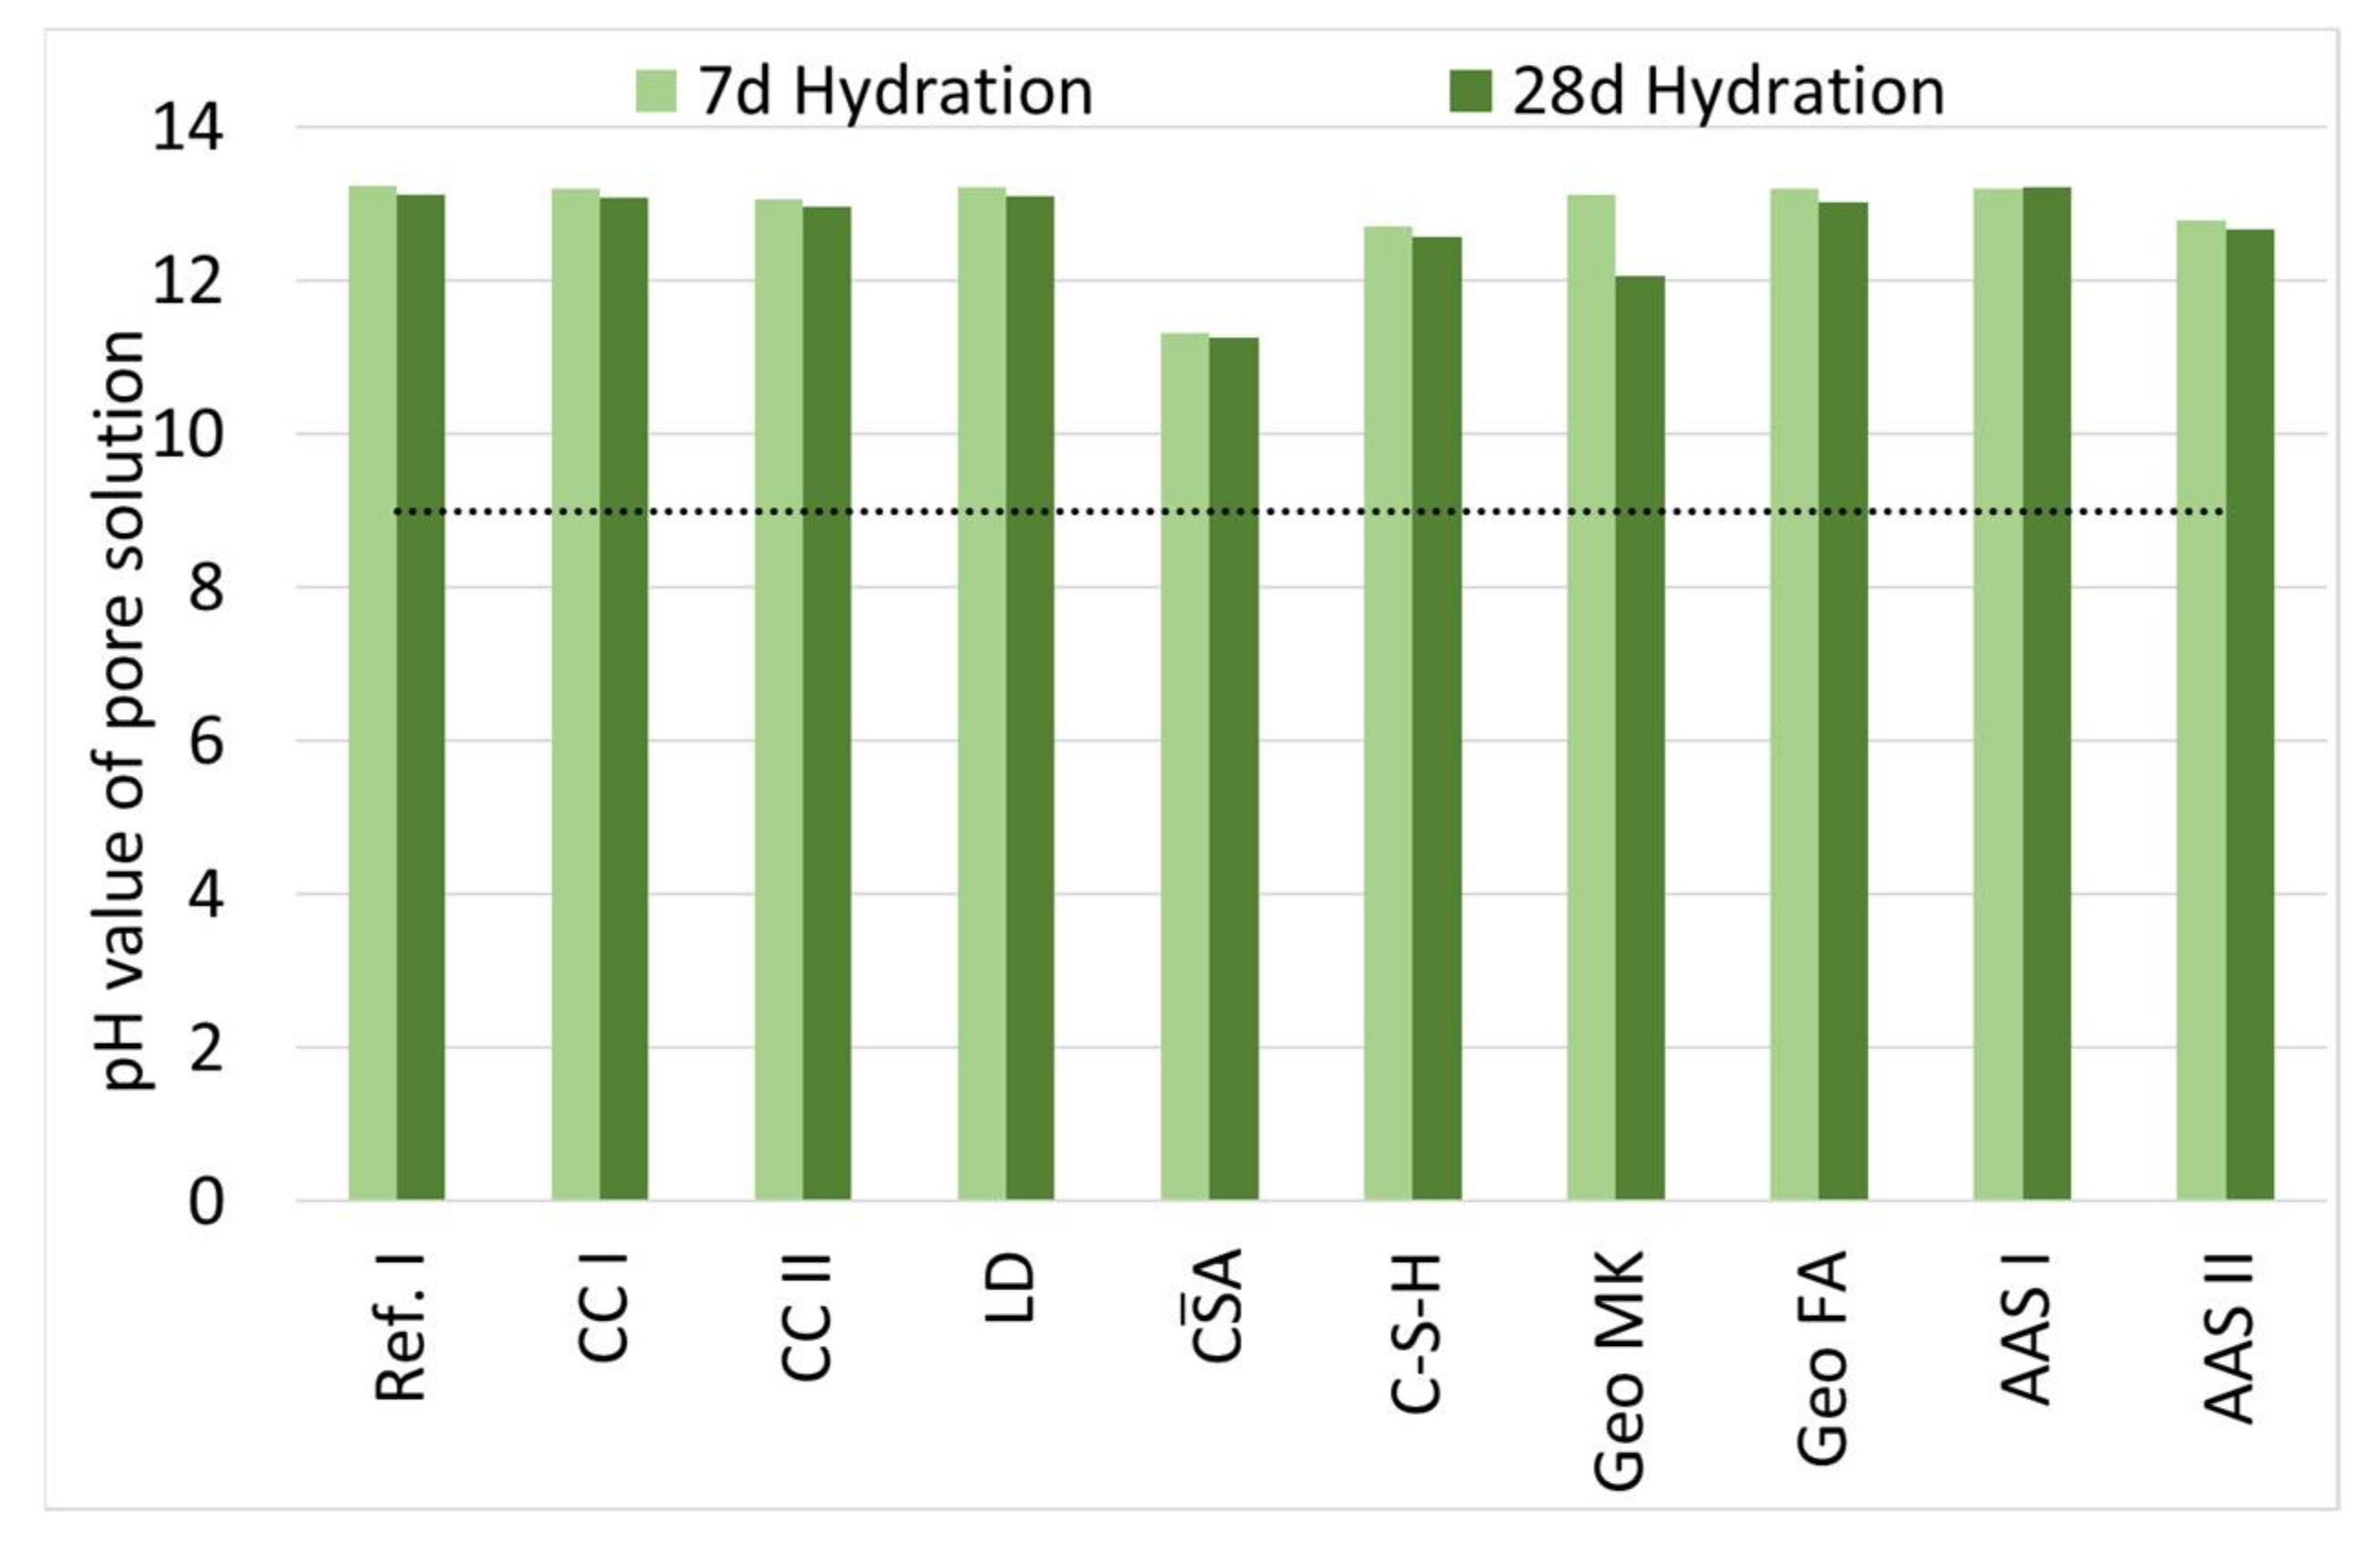
Figure 2 shows the pH values of the solutions obtained by leaching from pastes at different ages.
During hydration, there is only a slight decrease in pH for all binders, with the exception of Geo MK. The pH values of the composite cements are comparable to those of the reference sample and thus range between 12.9 and 13.9. CA shows the lowest value with a pH of 11.2, this is in good agreement with [73]. In the range between composite cements and CA, C-S-H ranks with 12.7 (7 d) and 12.6 (28 d), respectively. The alkali-activated binders all have comparable pH to those of the reference. For Geo MK, a sharp drop in pH from 13.1 to 12.1 between seven and 28 days is observed. In contrast, the pH of Geo FA remains stable over the measured period at 13.2 (7 d) and 13.0 (28 d). The same applies to the AAS, whose pH values remain equally stable at 13.2/13.2 (AAS I) and 12.8/12.7 (AAS II).
3.4. Influence of Hydration on the Pore Structure
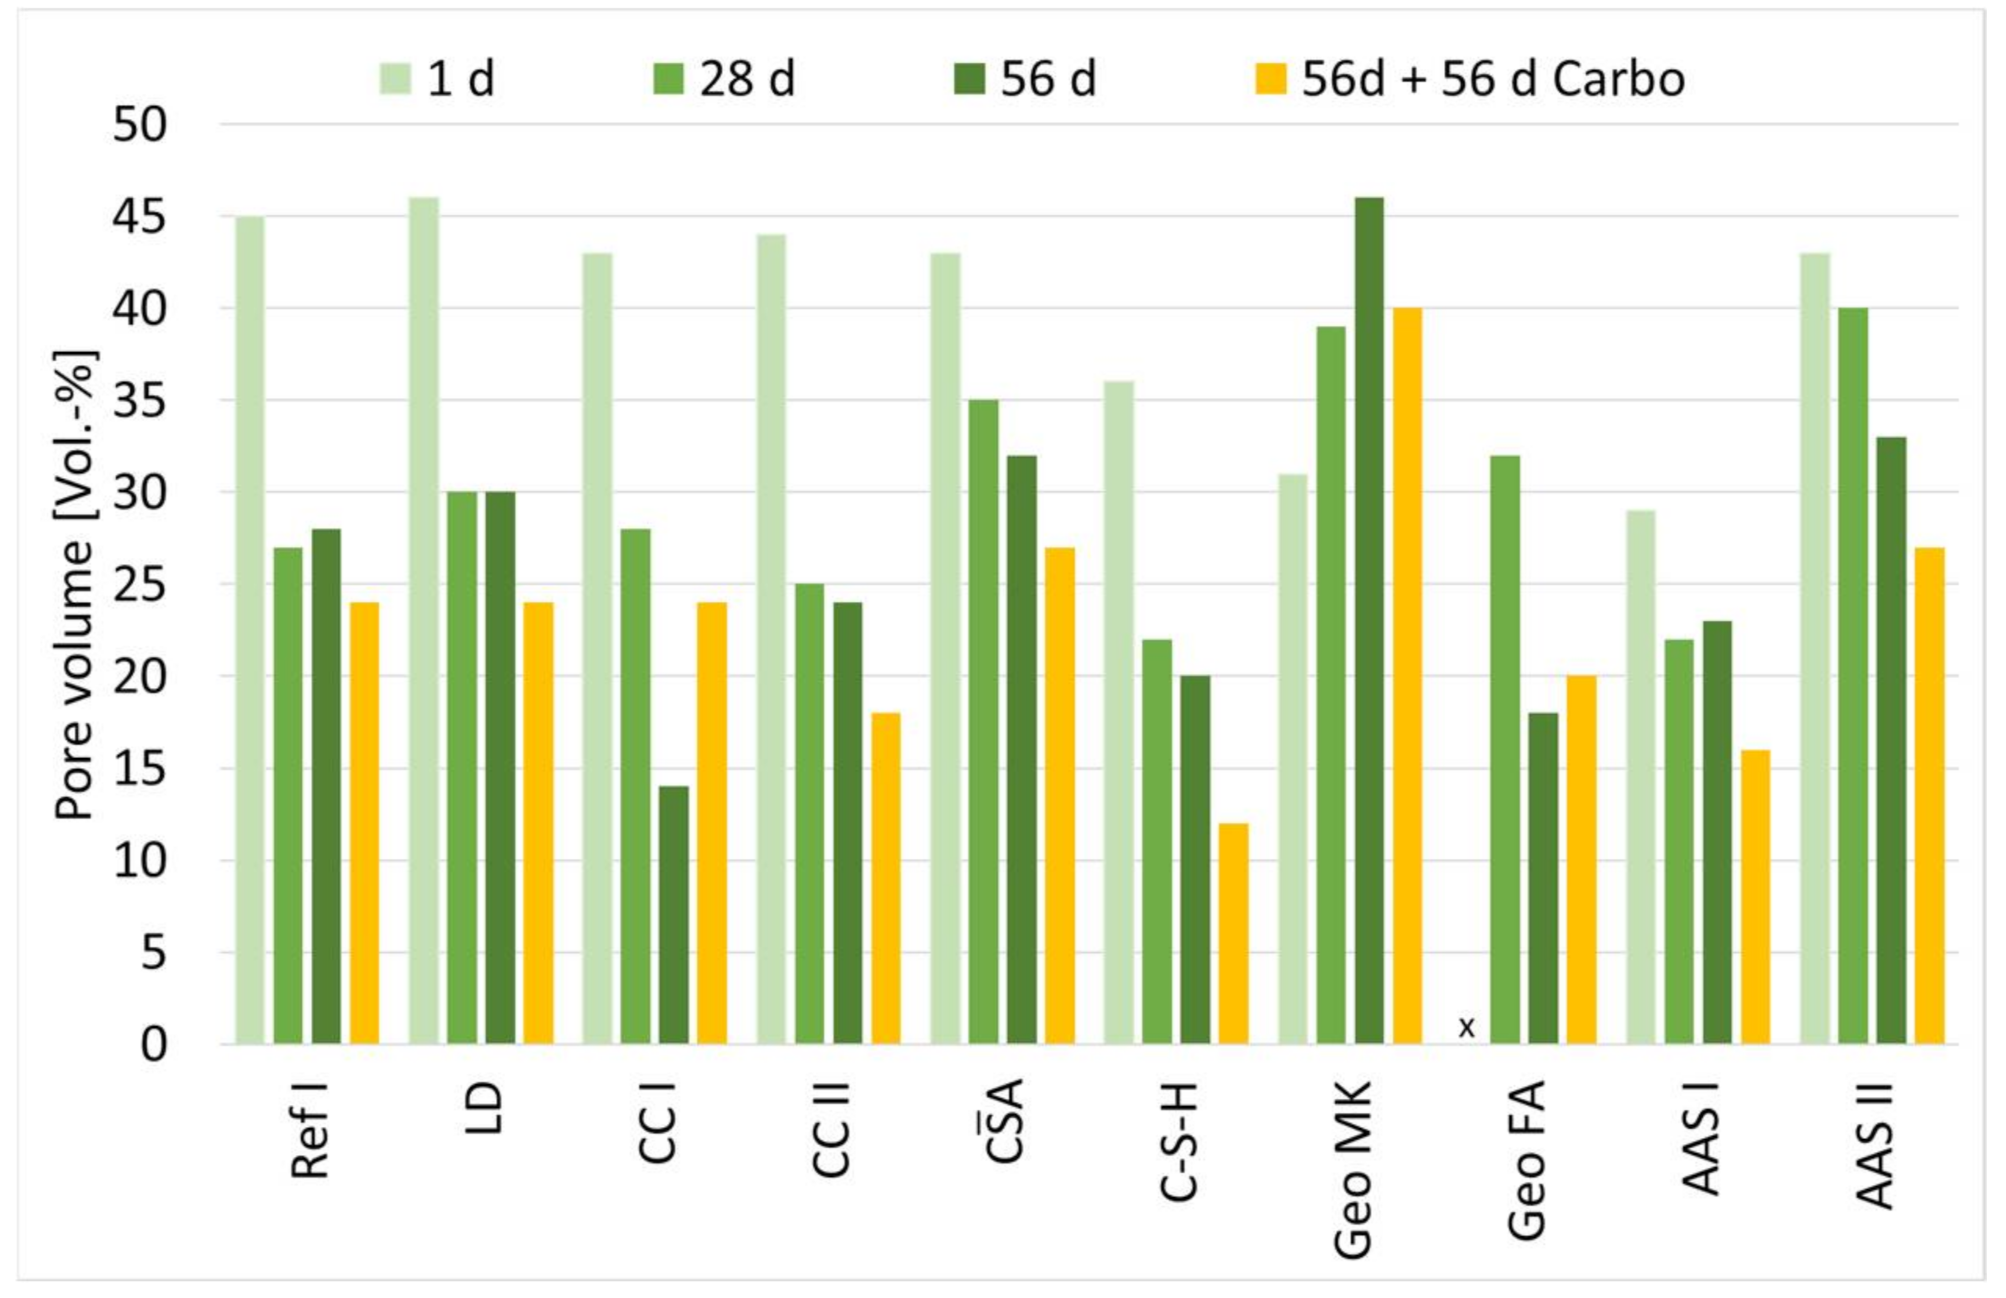
The measured pore volume at different ages is shown in Figure 3. Up to the age of 28 d, the pore volume of the investigated samples decreases continuously. After that, significant decreases are only seen for CC I, Geo FA and AAS II.
The only exception is Geo MK. For this sample, a steady increase in pore volume is observed in the period from 1 d to 56 d.
Following Setzer [74], the pore distributions are likewise divided into (meso)gel pores (<0.03 µm) and capillary pores (0.03 µm to 30 µm).
For cement-based samples, the analyses of the pore size distribution show a refinement of the pore structure between 1 and 56 days. After 56 days, most of the pore sizes are <0.03 µm.
CA has a very uniform distribution of pores that hardly changed over the 56-d period. The percentage of gel pores is 32%. In the case of C-S-H, the pore structure is refined over the entire period of observation whereas the percentage of gel pores is 60% already after 1 d. Geo MK shows an unimodal course of the pore size distribution, in this case, the proportion of gel pores is already 91% after 1d. For Geo FA, a coarsening of the microstructure is seen between 28 and 56 d, with the percentage of gel pores decreasing dramatically from 79% to 12%. For AAS I, the gel pore range between 1 d and 56 d is stable between 72% and 81%, reaching 72% after 28 d and 81% after 1 d. The structure of AAS II refines significantly between 1 and 56 days. After 56 d, half of the measured pore volume has gel pores.
The pore size distribution is given in Table 3.
3.5. Carbonation Process at Cement Paste Samples
Since C-(A)-S-H phases and N(K)-A-S-H phases are X-ray amorphous, this allows for conclusions to be made about the progress of hydration. When these phases carbonate, crystalline carbonates are formed, which in turn can be quantified by QXRD, allowing conclusions to be drawn about the carbonation processes.
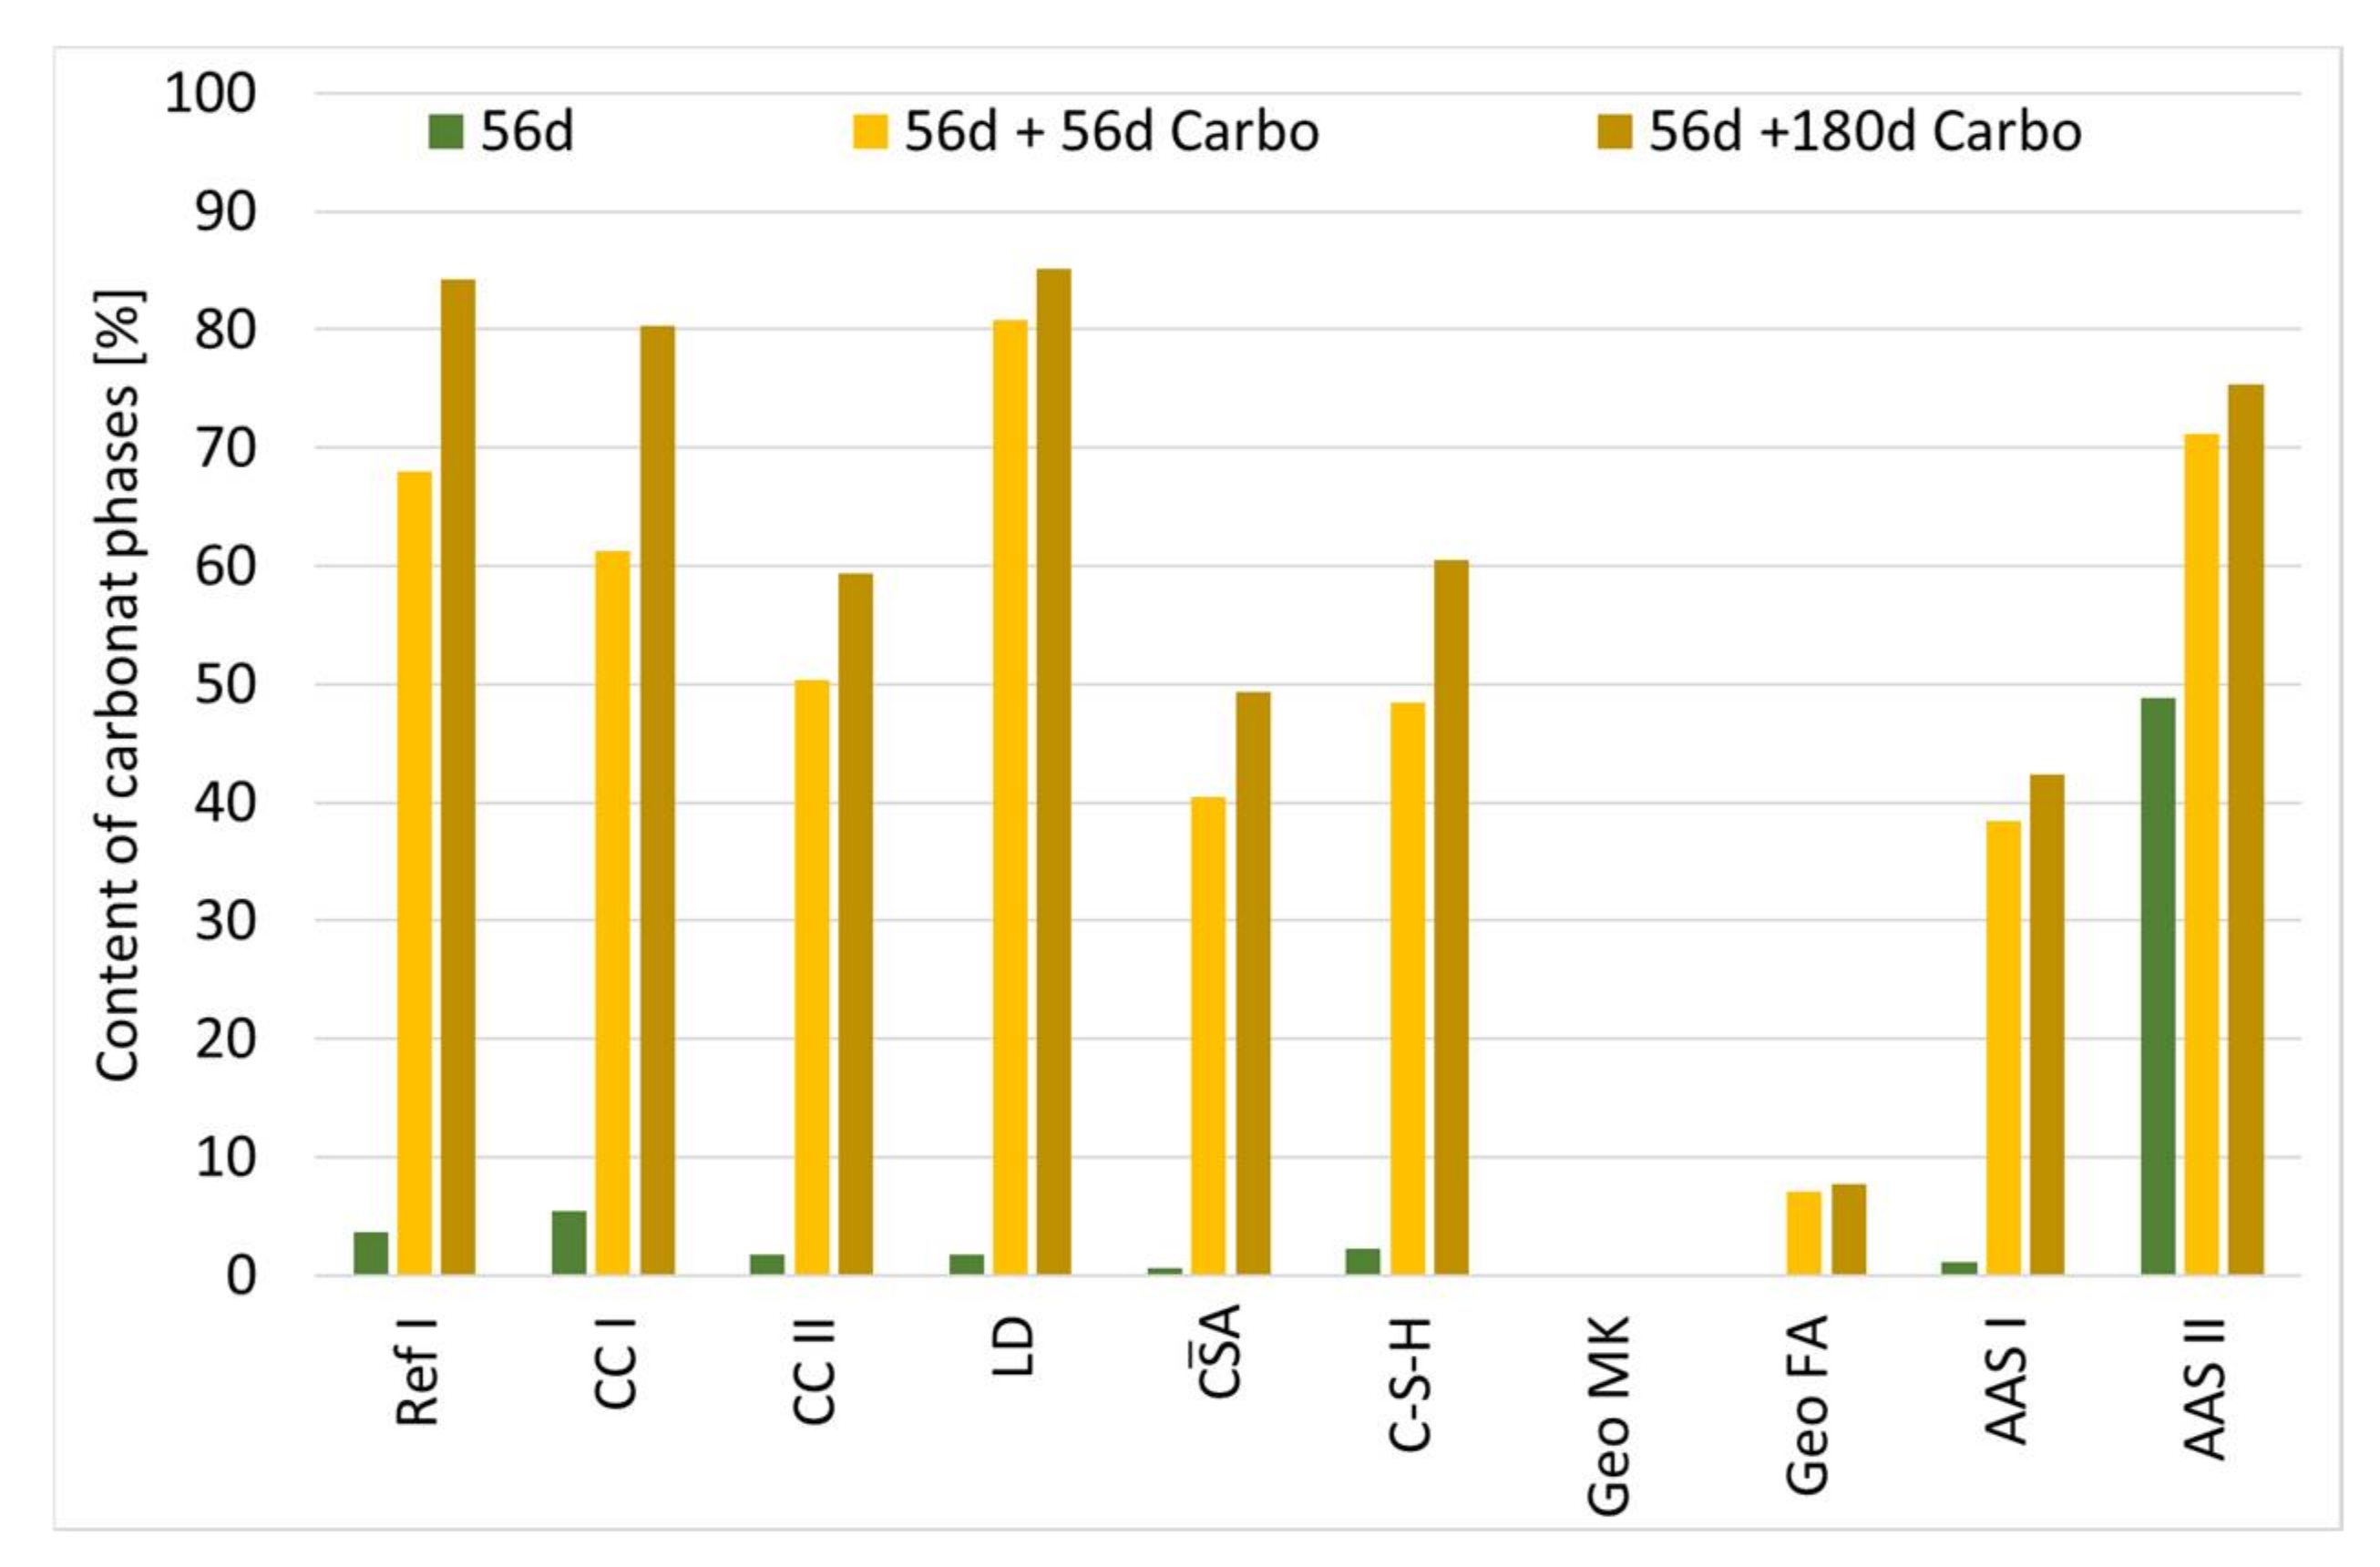
Figure 4 shows the content of carbonate phases of cement paste samples at the age of 56 days and the age of 112 and 236 days with 56 and 180 days respectively, of storage in 1% CO2 climate measured by XRD.
For all samples, except Geo MK, storage at elevated CO2 leads to an increase of the crystalline carbonate phases, as shown in Figure 4. For the sample Geo MK, no change of the phase assemblage can be observed. In the SCMs, the main crystalline carbonate phases are calcite and vaterite. It can be assumed that both the existing portlandite and the C-(A)-S-H phases carbonate. Decalcification results in calcium carbonates and amorphous SiO2 [16]. A significant increase in gypsum content was observed in the CA sample. This is indicative of carbonation of the ettringite. The water released during carbonation reacts with the anhydrite present to form further gypsum. Furthermore, the carbonate phase aragonite could be detected. For sample C-S-H, a significant increase in the carbonate phases in the form of calcite (25%), aragonite (33%) and vaterite (2%) is visible. For Geo FA, a minimal increase in carbonate phases is observed. Sodium hydrogen carbonate (NaHCO3) were detected. Furthermore, phases of unreacted FA particles were detected, as well as a small amount of calcite (2%). For AAS I, it was observed that in addition to calcite, mainly vaterite and small amounts of aragonite were formed. The hydrotalcite content remained stable. Sodium hydrogen carbonate could not be detected. AAS II exhibits a high proportion of carbonate phases in the form of calcite and dolomite even before storage at 1 vol.-% CO2. This is a result of the mixture composition. The content of dolomite and calcite remains stable during the measuring period, aragonite and small amounts of vaterite, gypsum and hydrotalcites were also formed.
3.6. Influence of Carbonation on the Pore Structure
To evaluate the influence of carbonation on the microstructure, the pore volume of the samples before exposure to elevated CO2 concentration is compared with that of the sample after 56 days of storage at 1 vol.-% CO2. Following this, the pore distribution is evaluated with respect to the development of the proportion of gel or capillary pores.
Storage at 1 vol.-% CO2 decreases the pore volume of all samples. This indicates that the phases formed by carbonation occupy a larger volume, reducing the overall pore volume [19,26,31]. CC I is an exception, where the pore volume increases significantly compared to the non-carbonated 56 d sample.
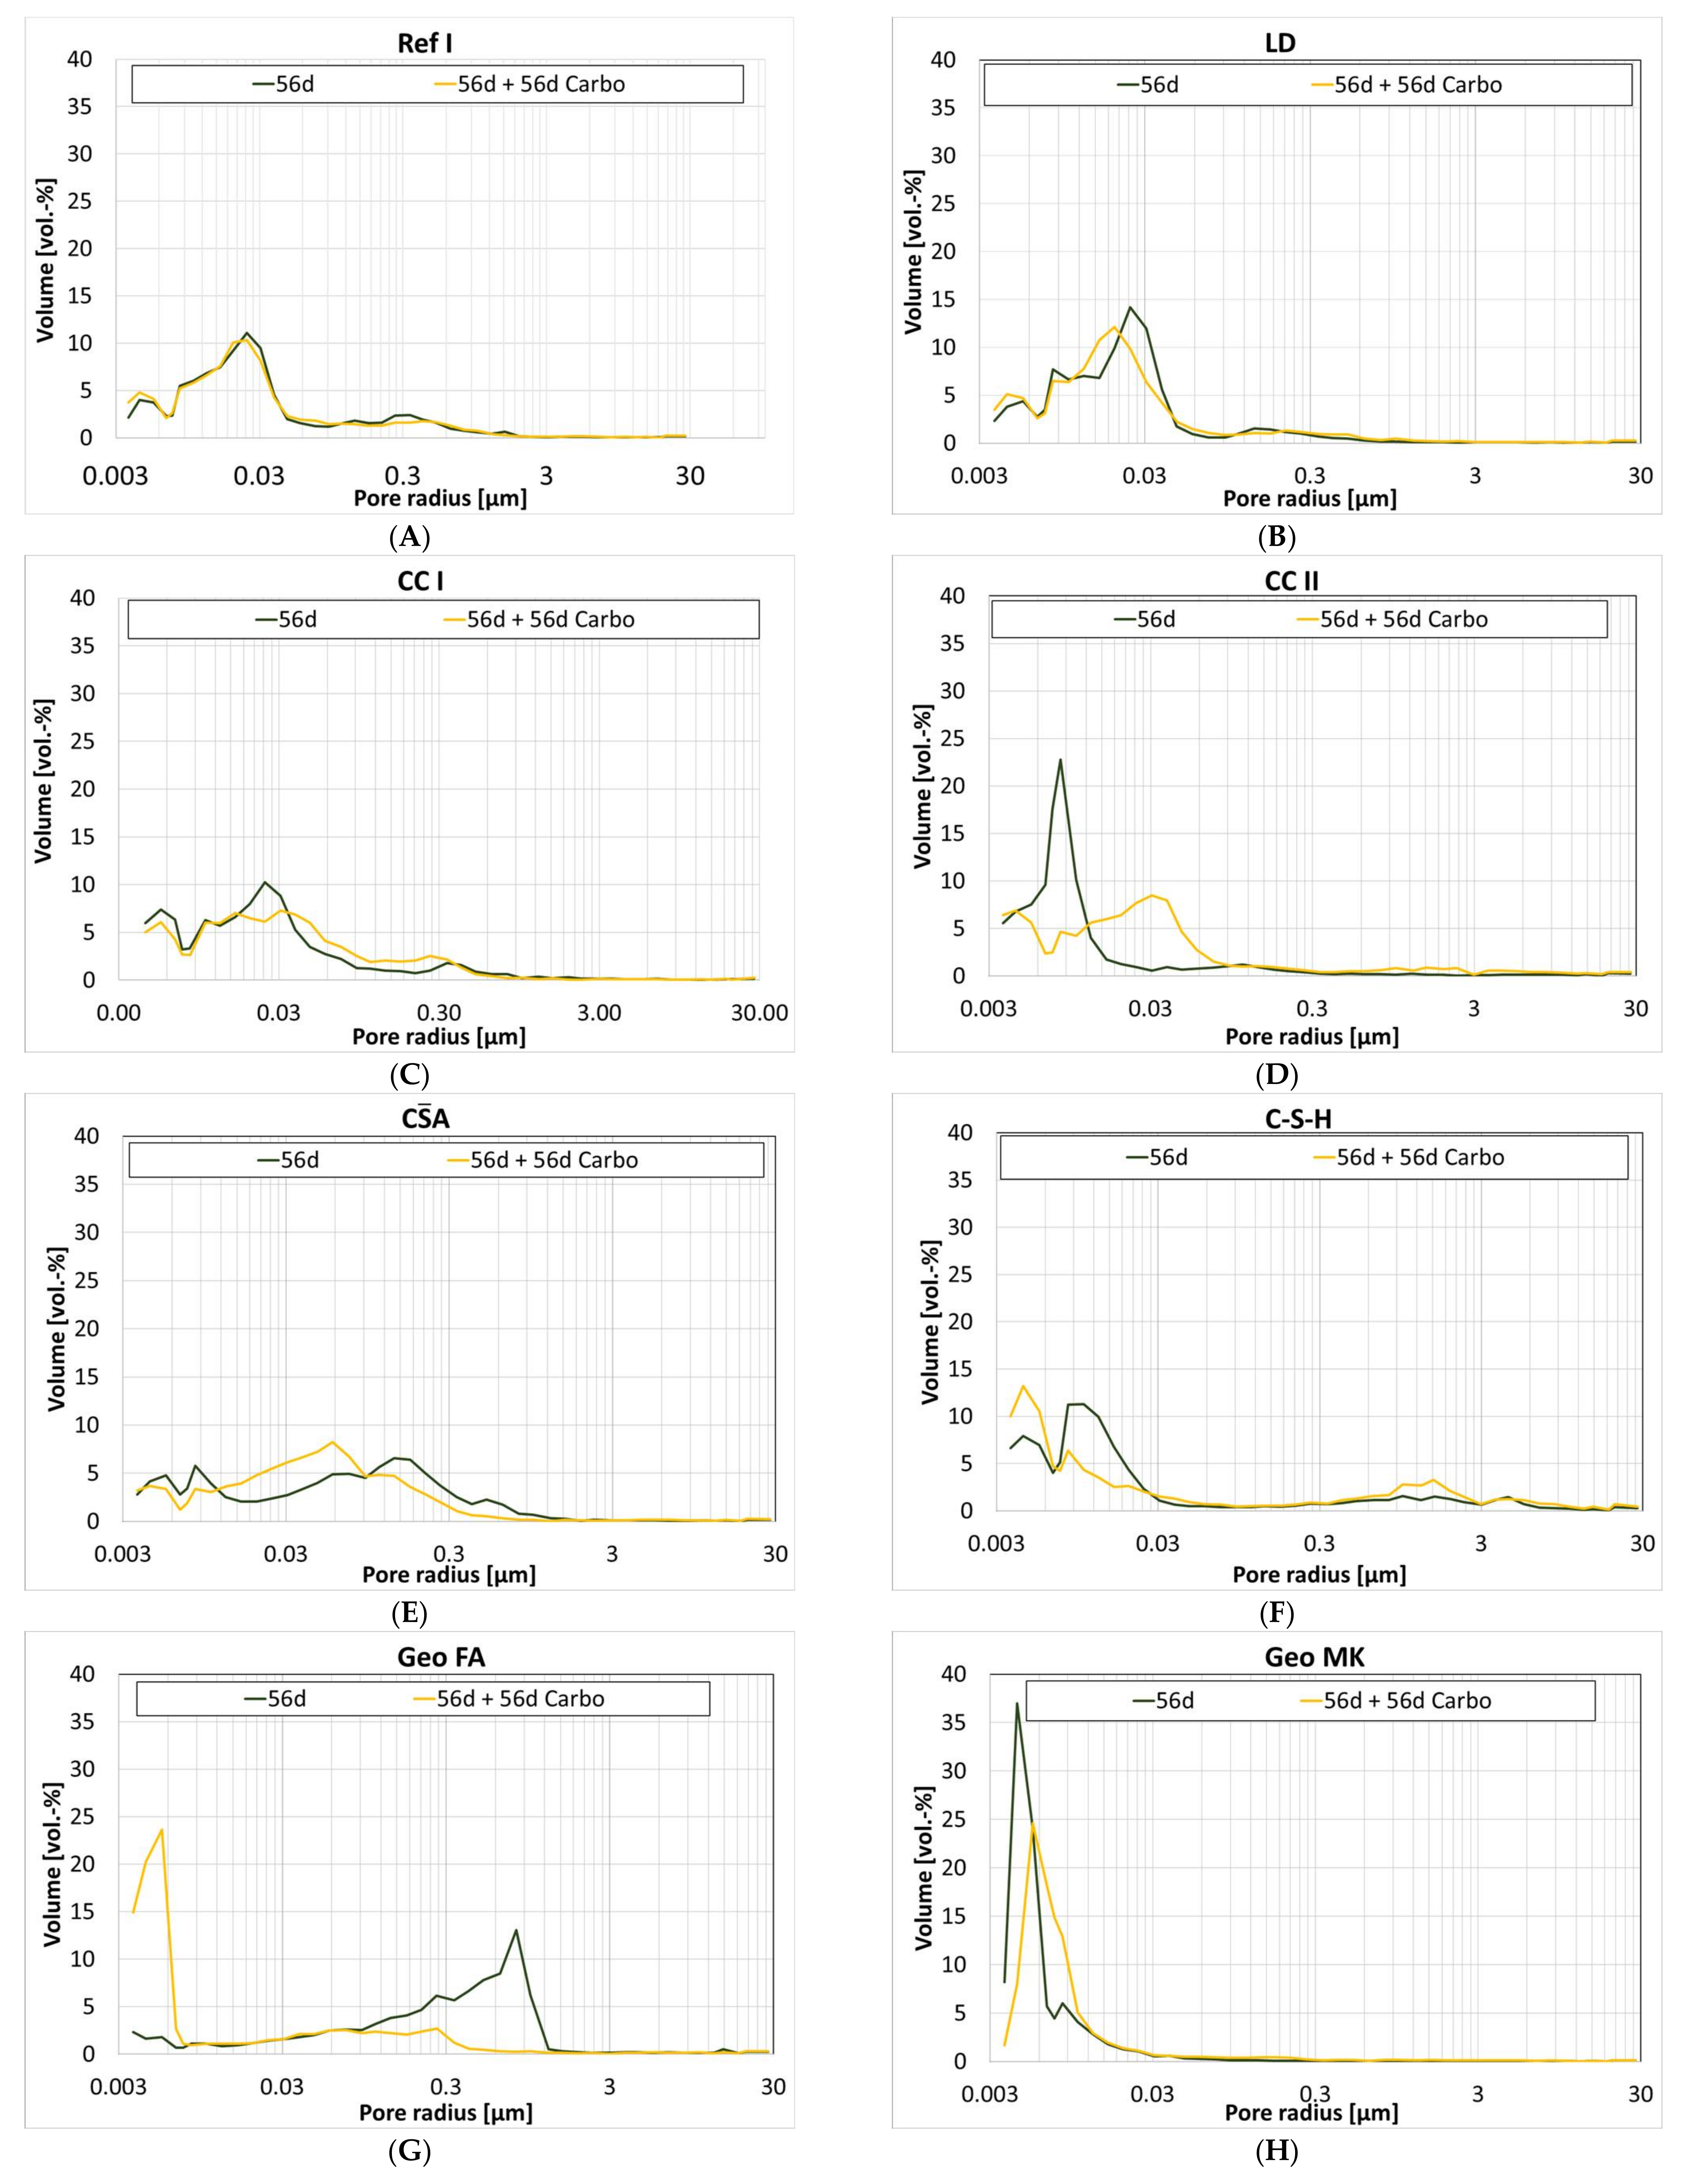
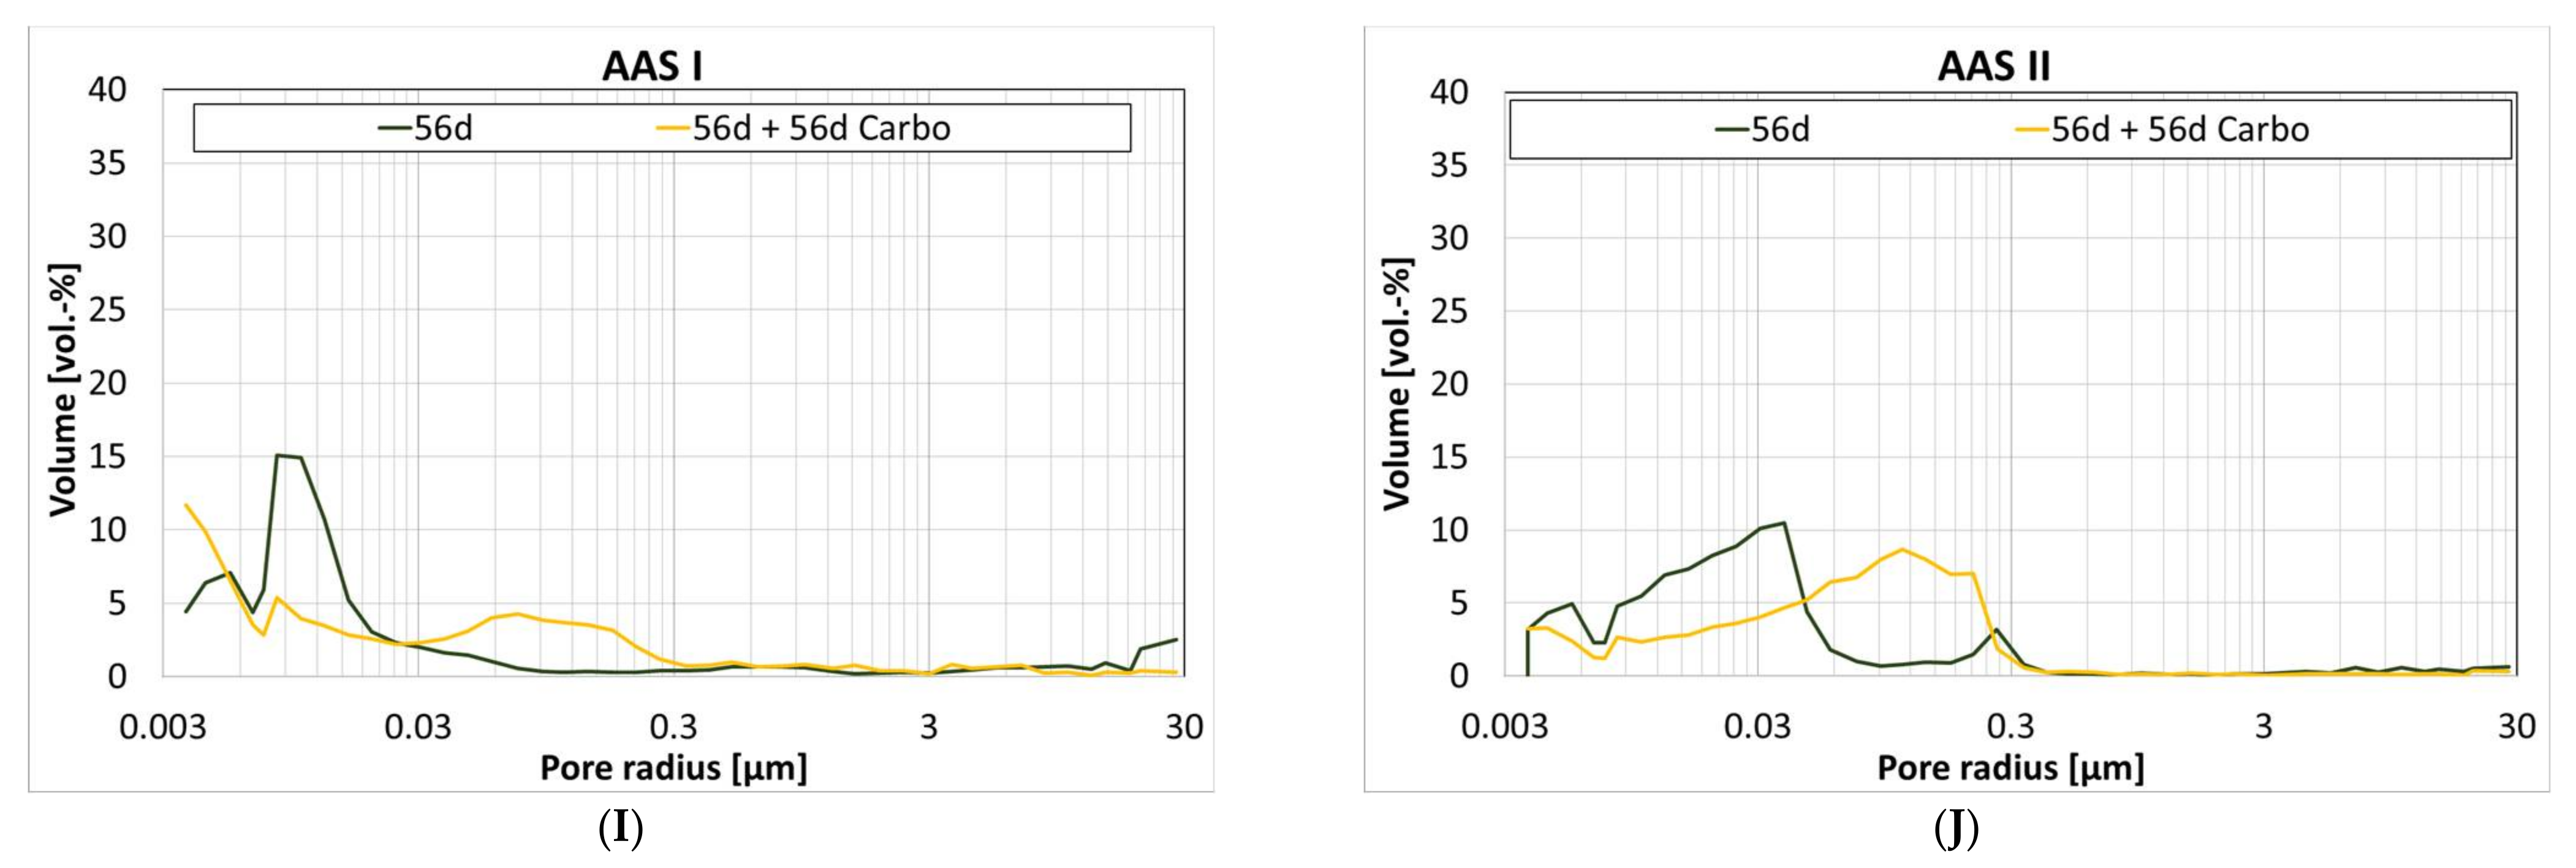
The change in pore volume is not necessarily reflected in the pore size distribution. Figure 5 shows the pore size distribution of the cement paste samples at the different ages and at additional storage at 1 vol.-% CO2 for 56 days.
Ref I and LD show similar curves of pore distribution after 56 d and after storage at 1 vol.-% CO2, see Figure 5A,B. An increase in gel pores can be observed for both series of samples.
CC II (Figure 5D) shows a coarsening of the pore structure in the range of 0.01 µm to 0.09 µm, which is also reflected in the percentage of gel pores; after 56 d, the sample shows 87%, which is reduced to 51% by storage at 1 vol.-% CO2. CC I also shows a similar course, but the proportion of gel pores changes more slightly, see Figure 5C. The uniform pore distribution of CA observed during hydration is not significantly changed by storage at 1 vol.-% CO2, see Figure 5E. The percentage of gel pores also remains stable at 32%. In the case of C-S-H, the pore structure is refined by storage at 1 vol.-% CO2, see Figure 5F. However, an accumulation of pores between 0.3 and 3 µm is observed at the same time, which is again reflected in a decrease in the proportion of gel pores. Geo MK shows a unimodal course of the pore size distribution, which slightly shifts into the coarser range, see Figure 5H. In comparison, Geo FA shows a significant refinement of the microstructure due to storage at 1 vol.-% CO2, see Figure 5G. Here, the proportion of gel pores increases from 12% to 68%. For AAS I, the structure becomes coarser due to storage at 1 vol.-% CO2, see Figure 5I. It is particularly noticeable that the pore fraction >0.01 µm increases, which is again reflected in a decrease in the proportion of gel pores. Storage at 1 vol.-% CO2 causes a coarsening of the microstructure for AAS II, see Figure 5J.
3.7. Carbonation of Mortar Specimens
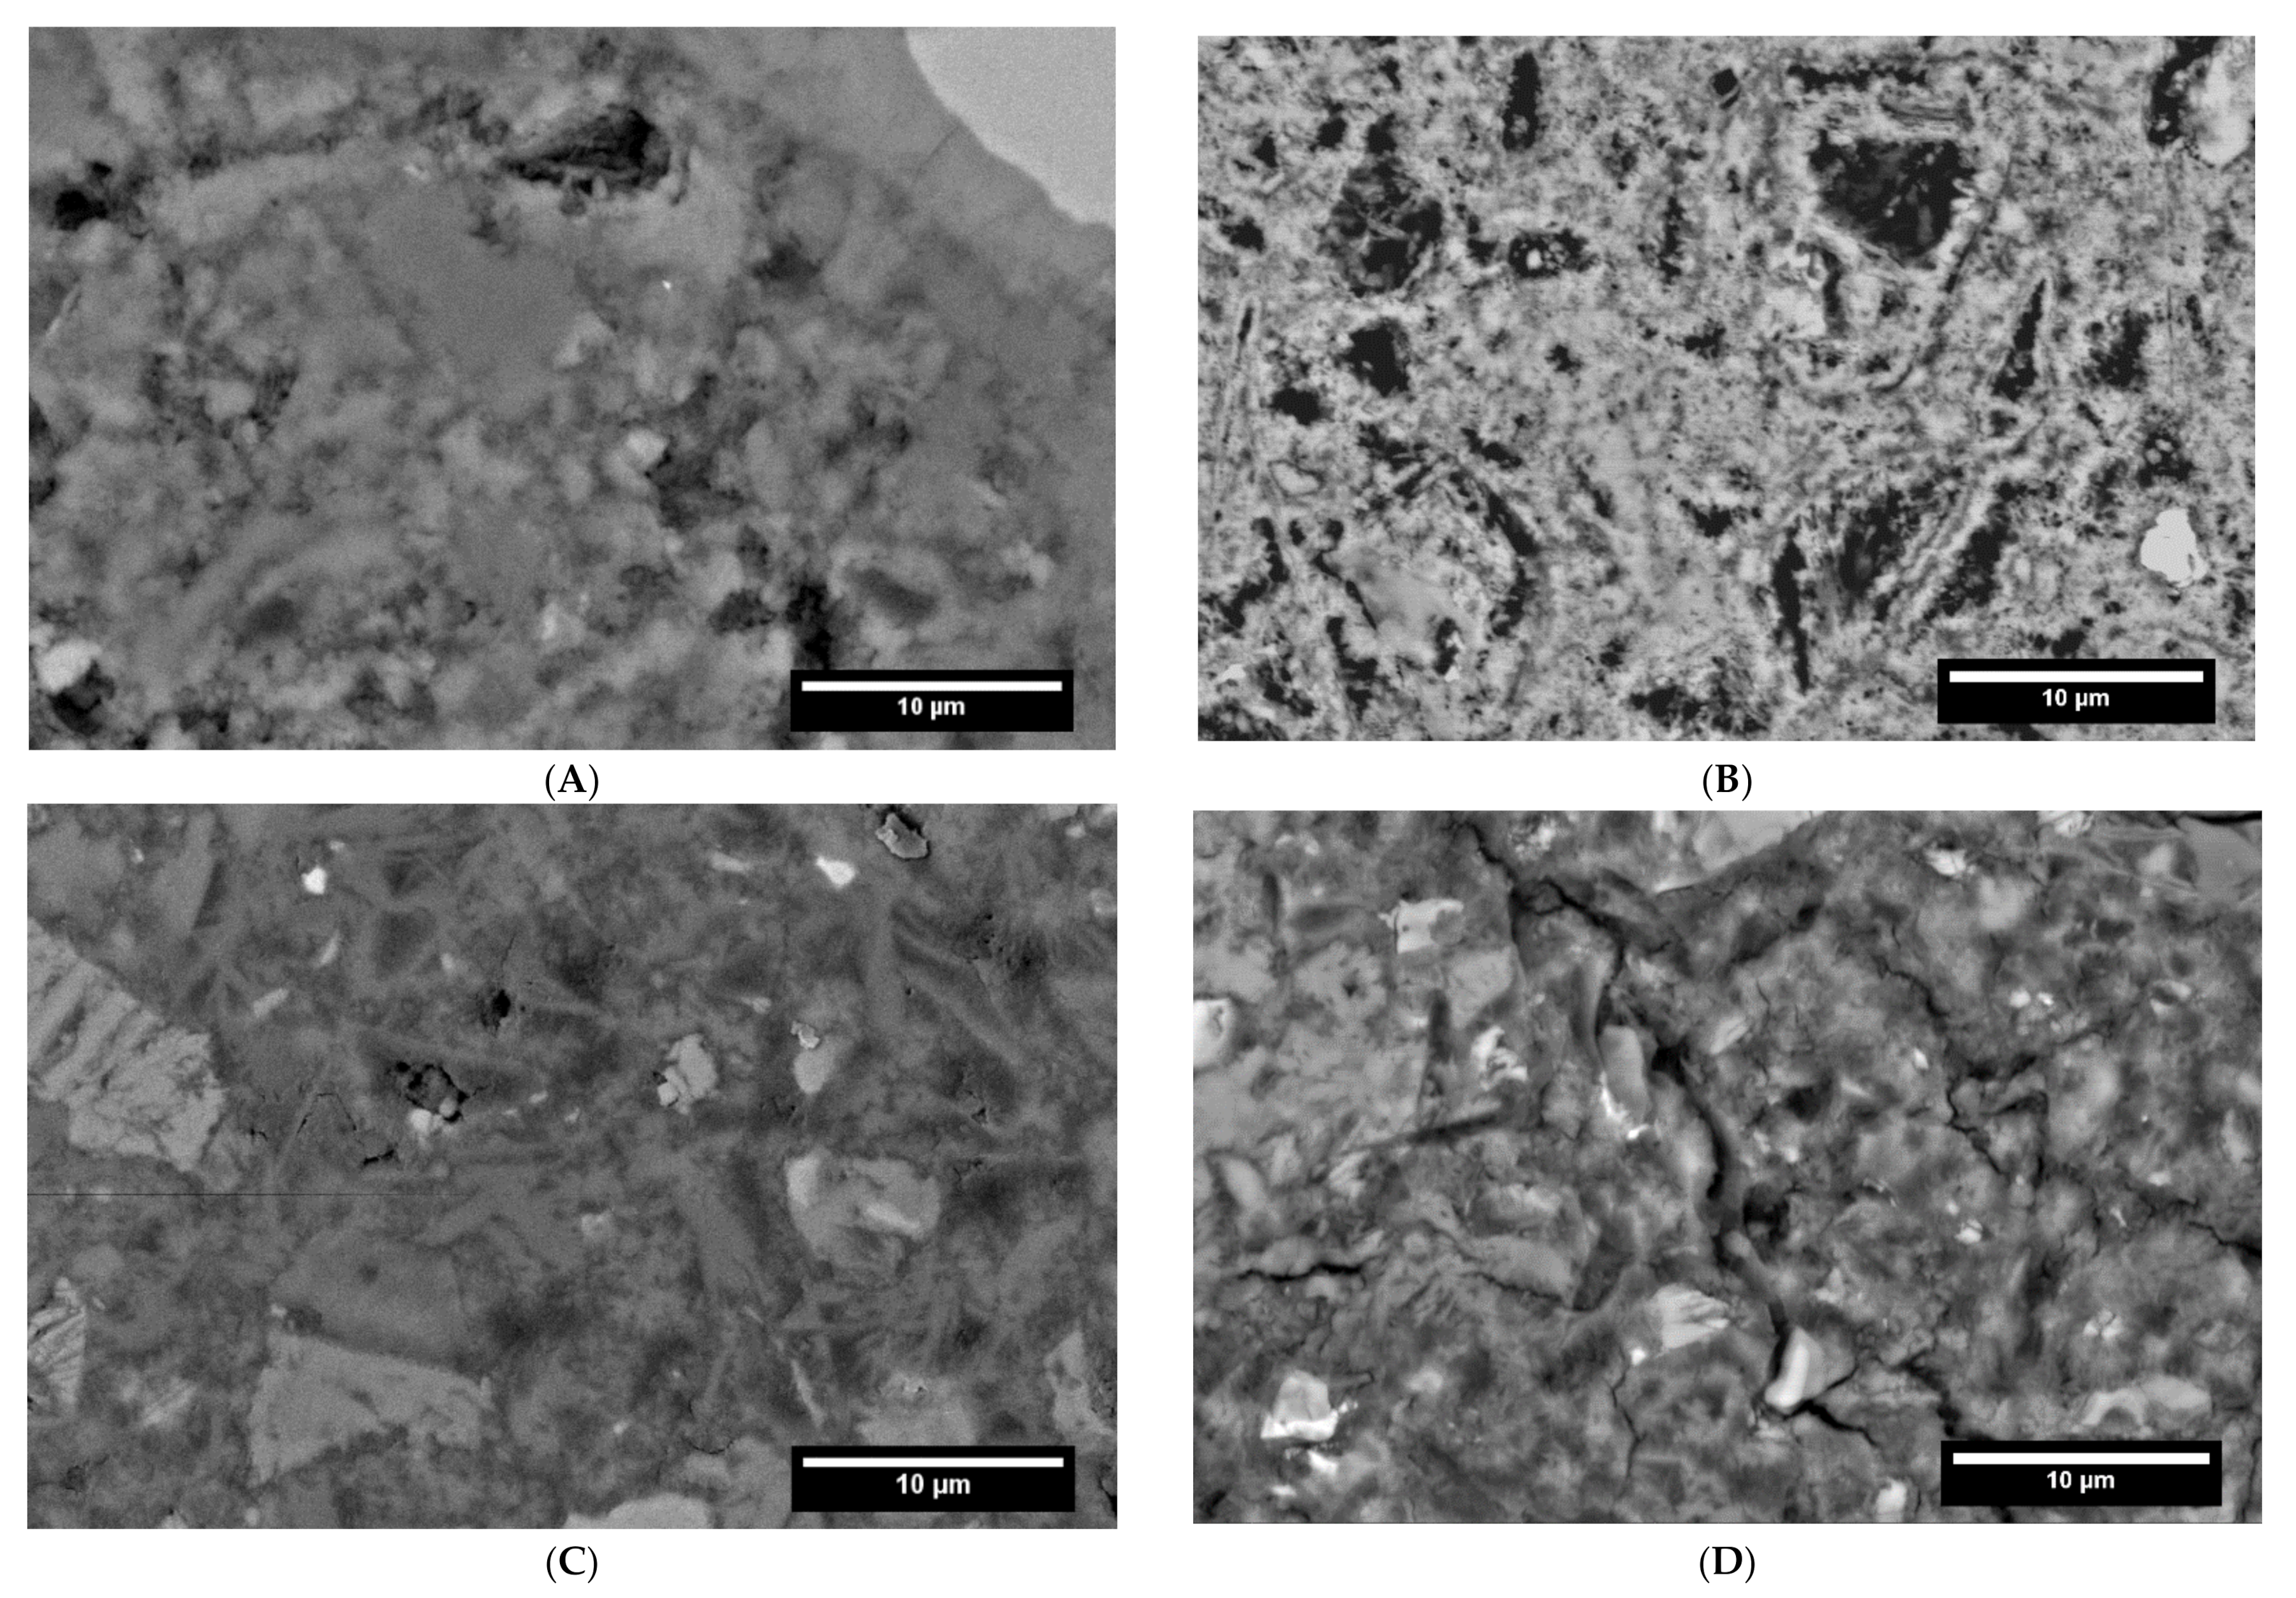
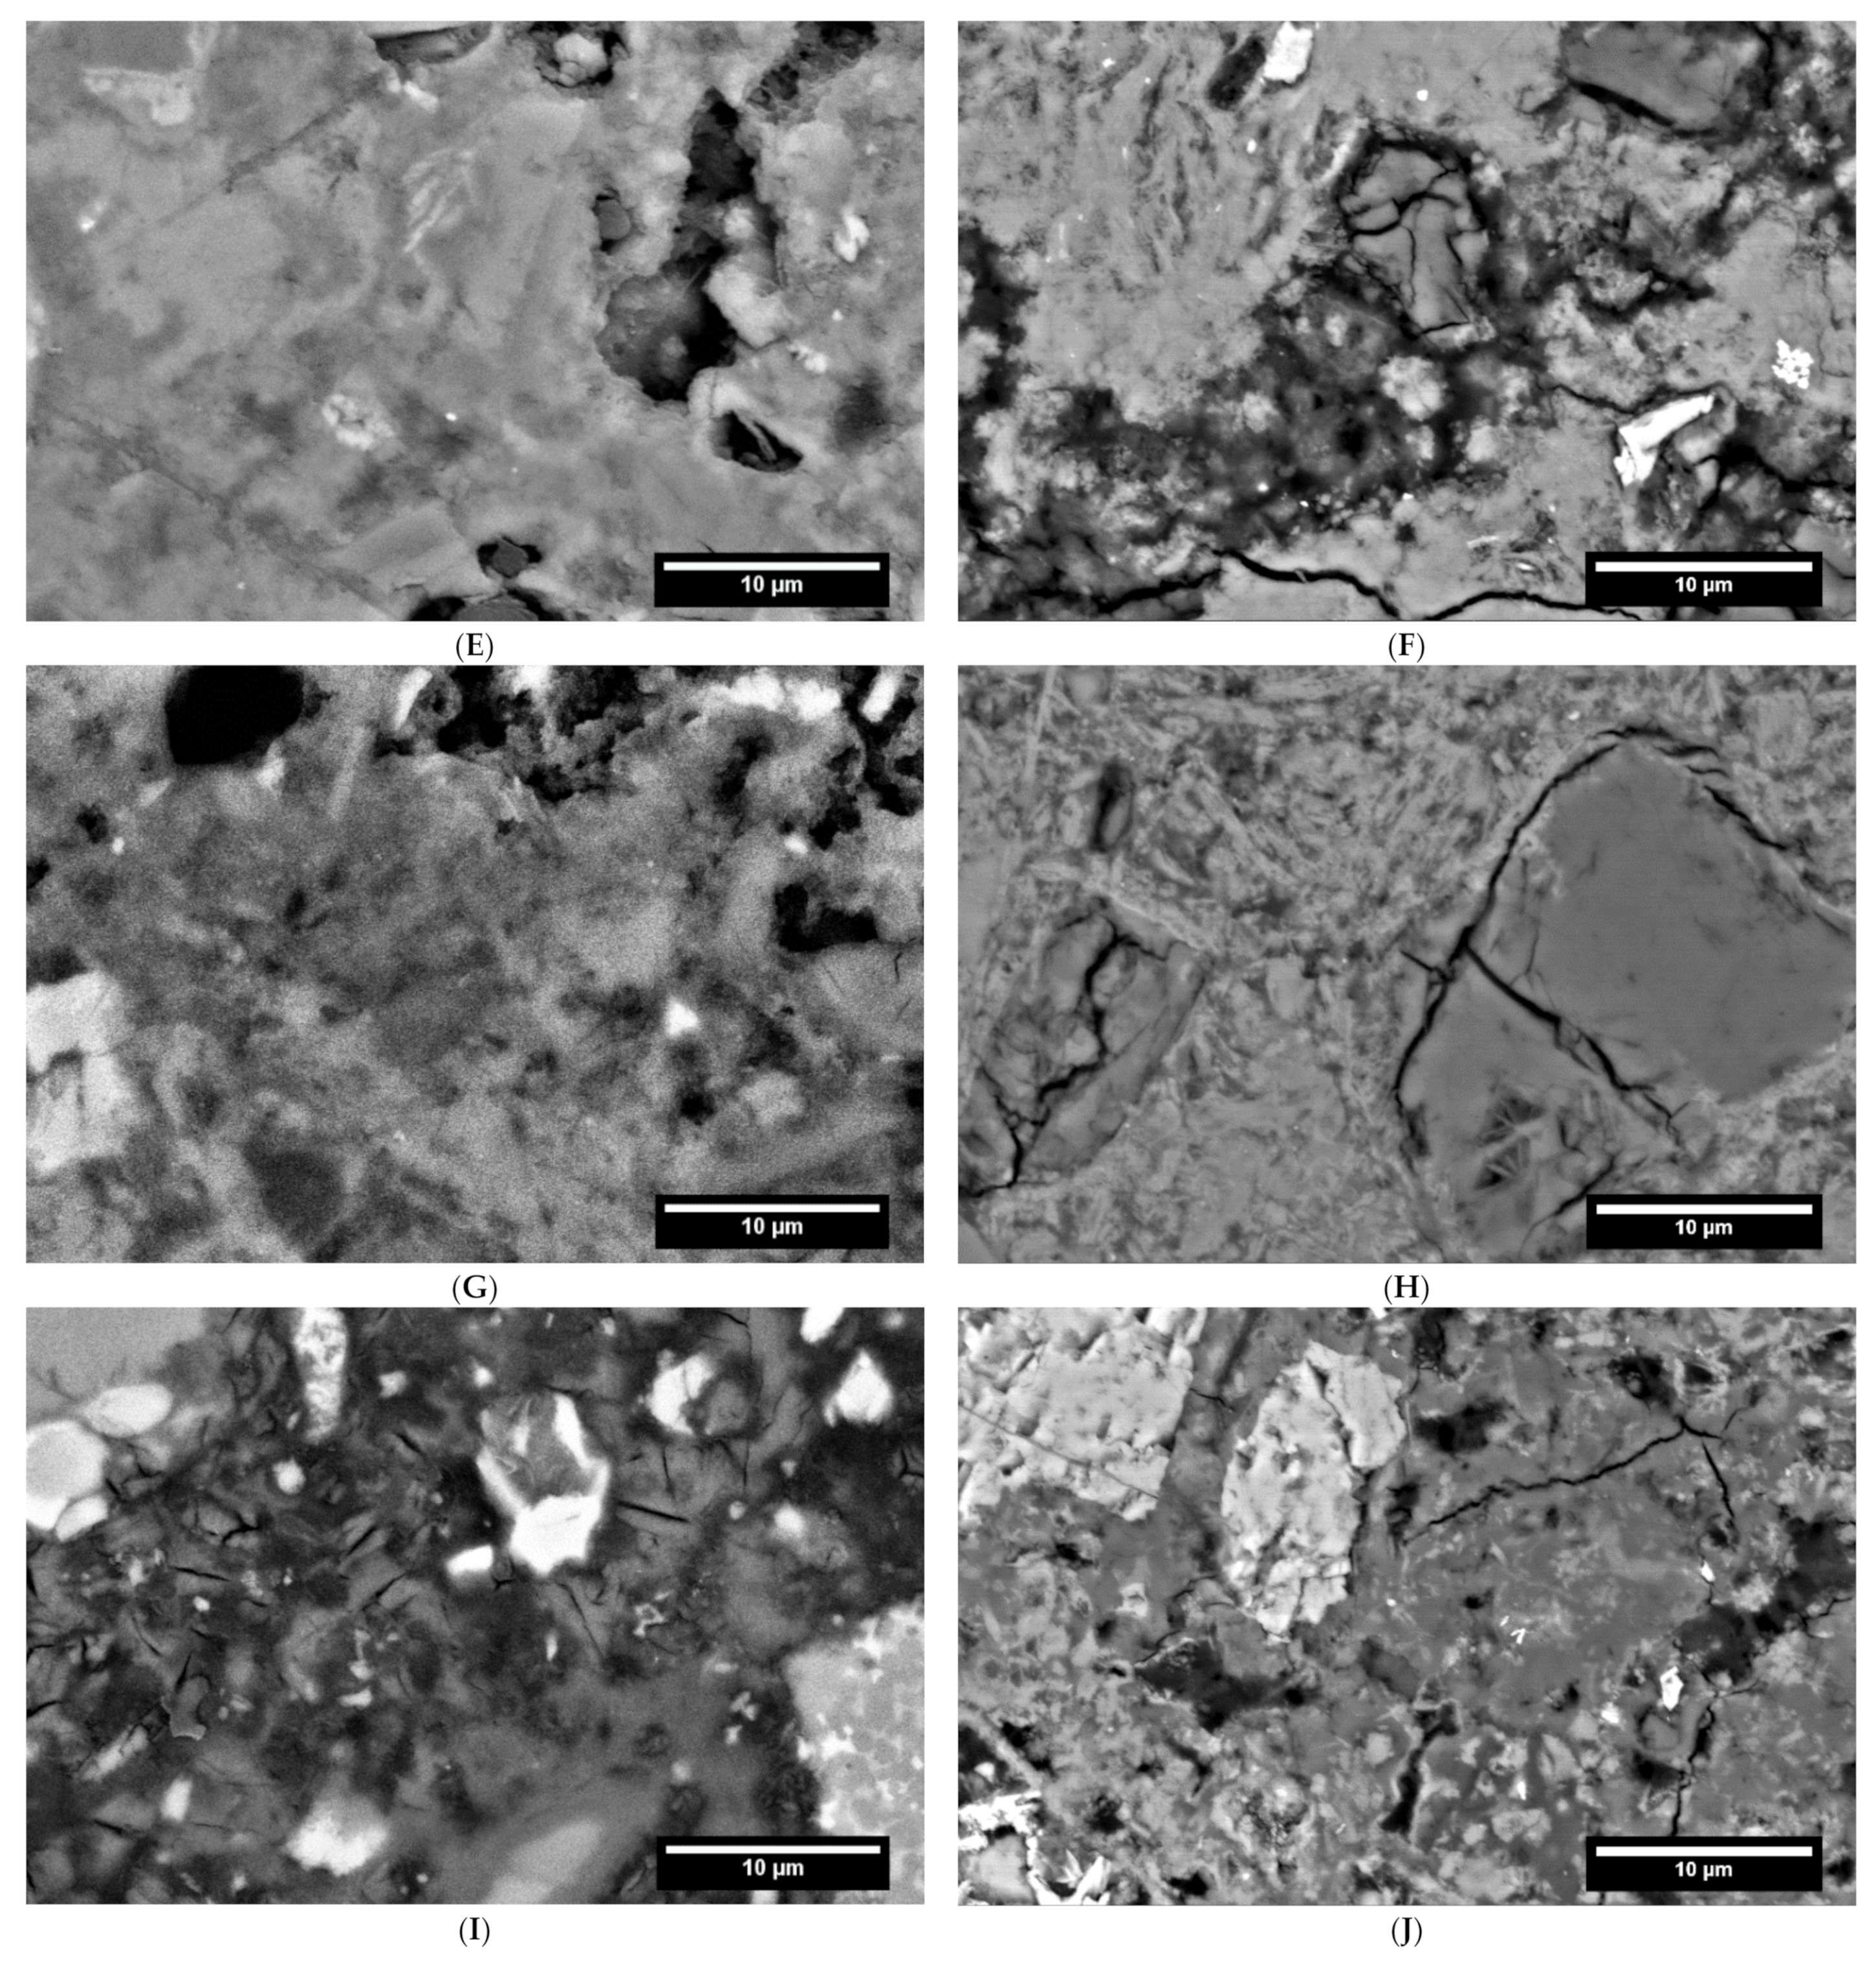
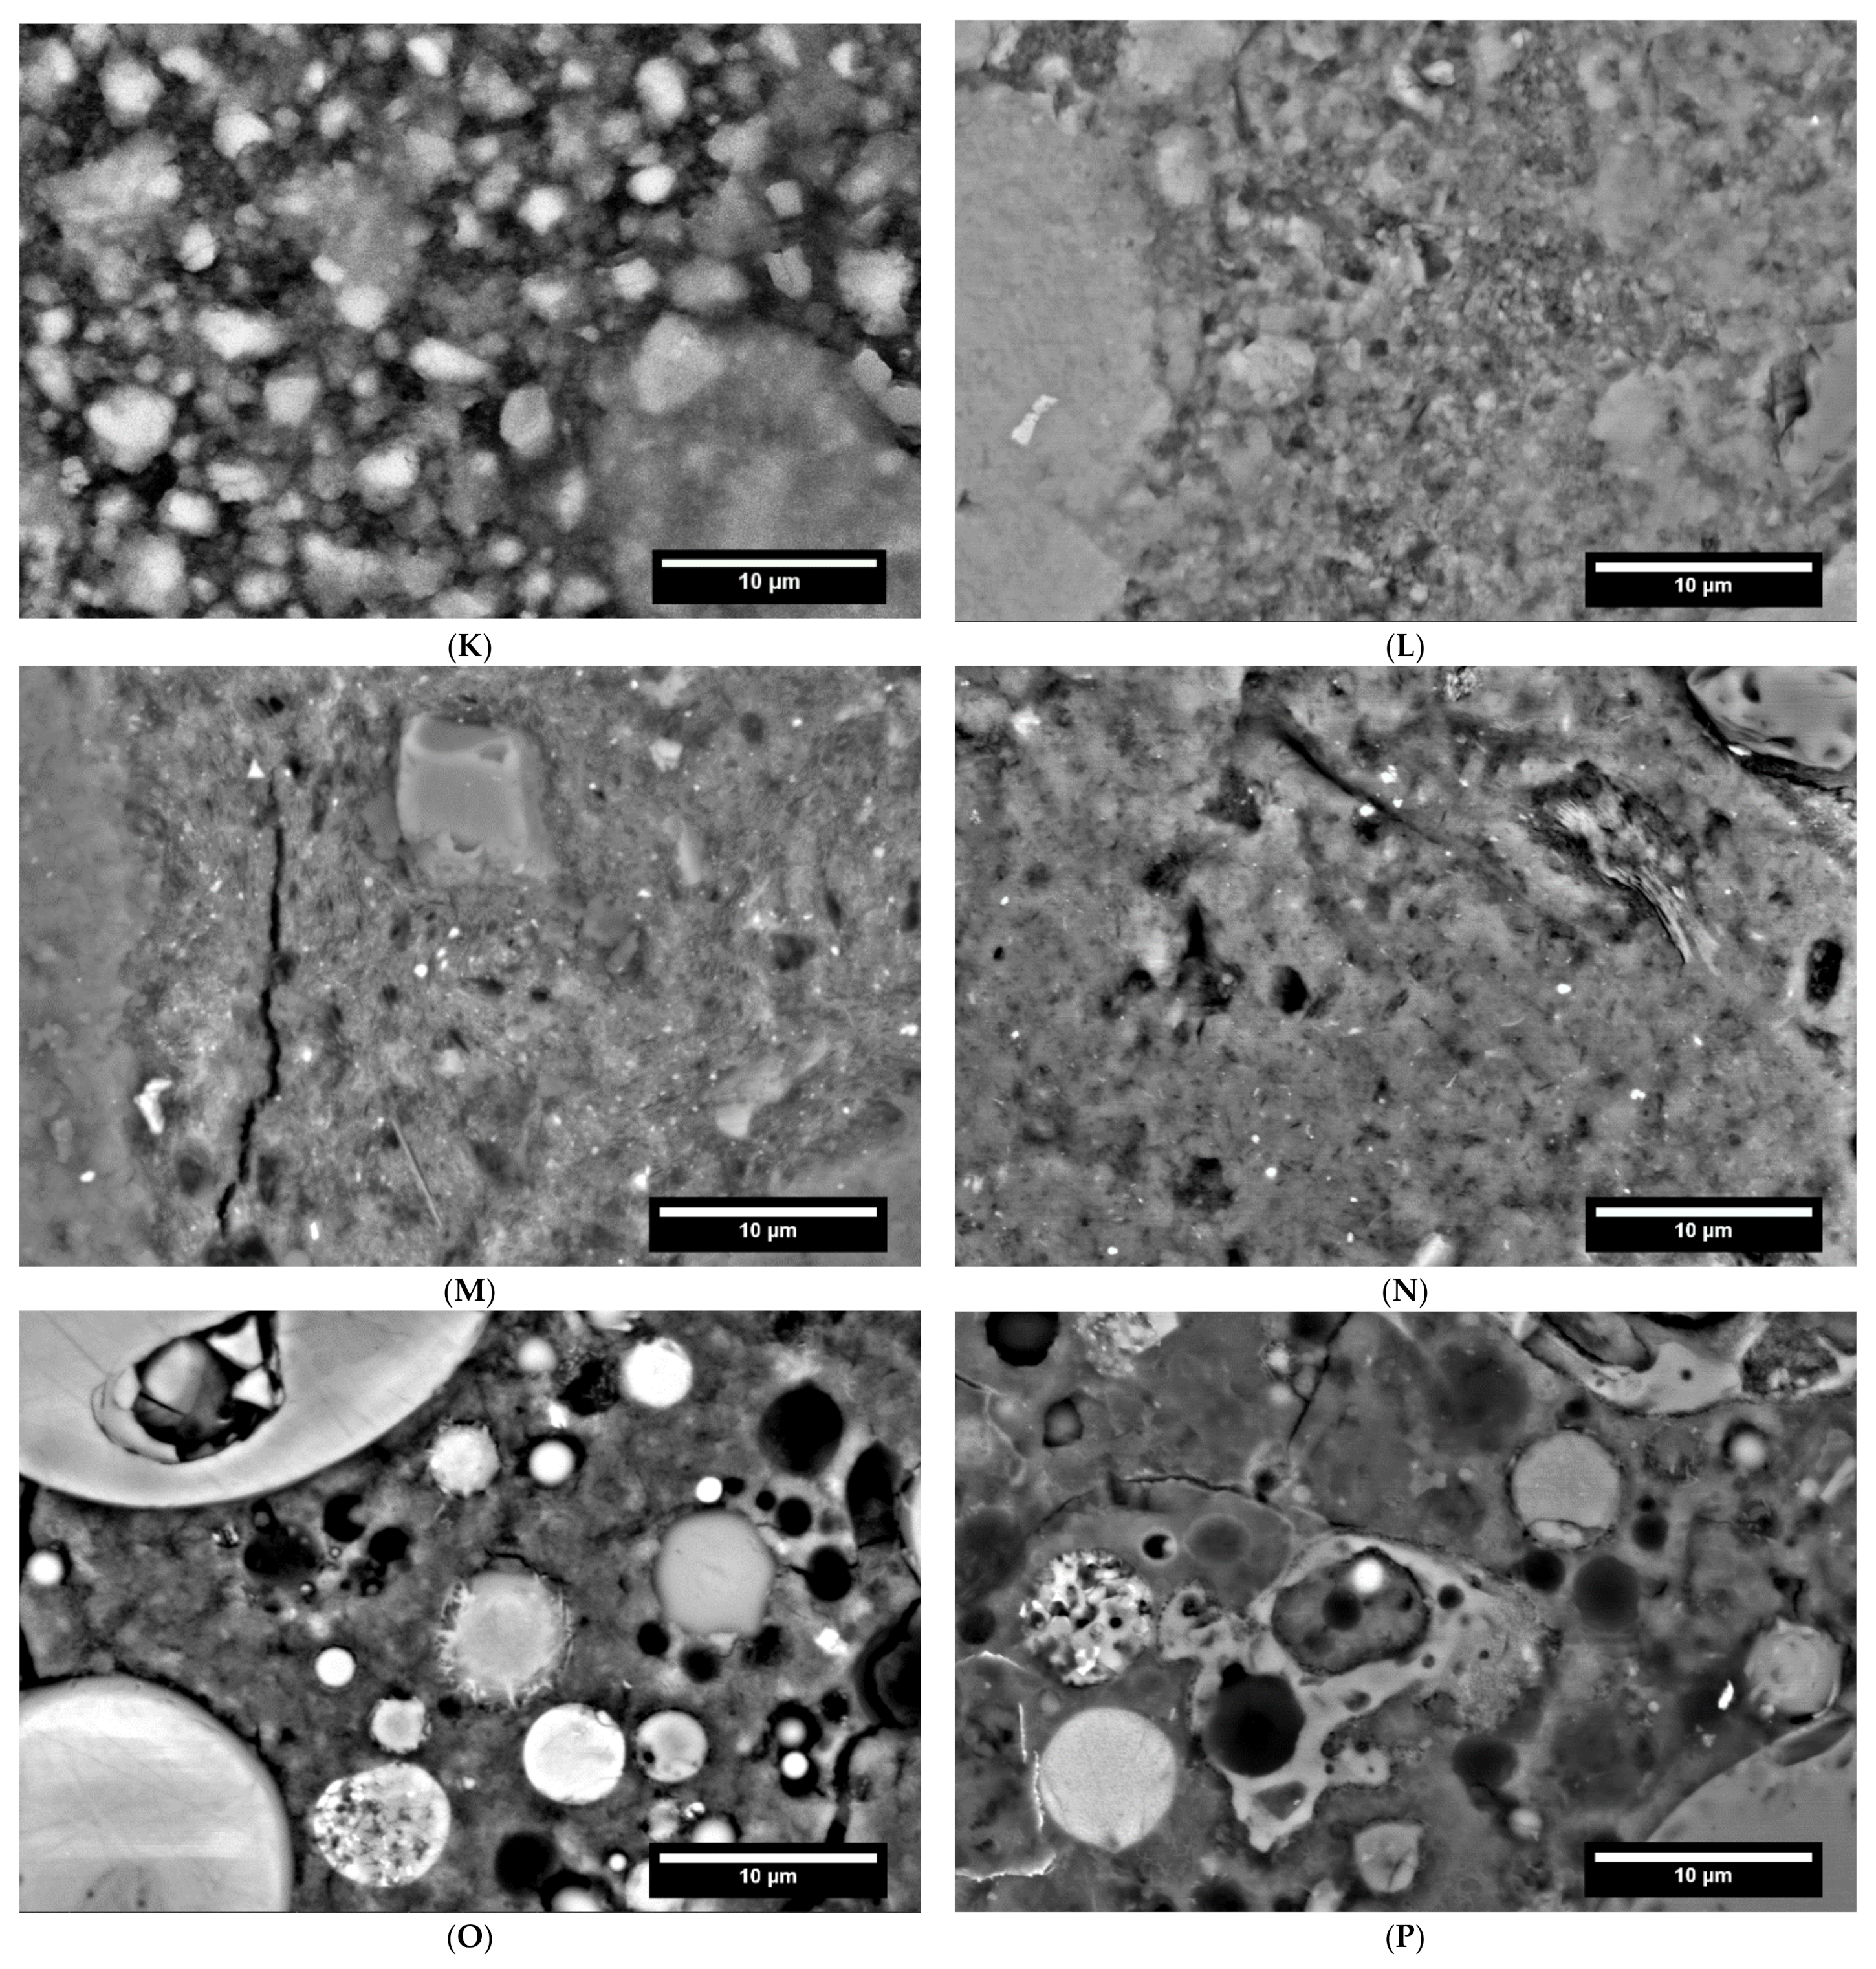
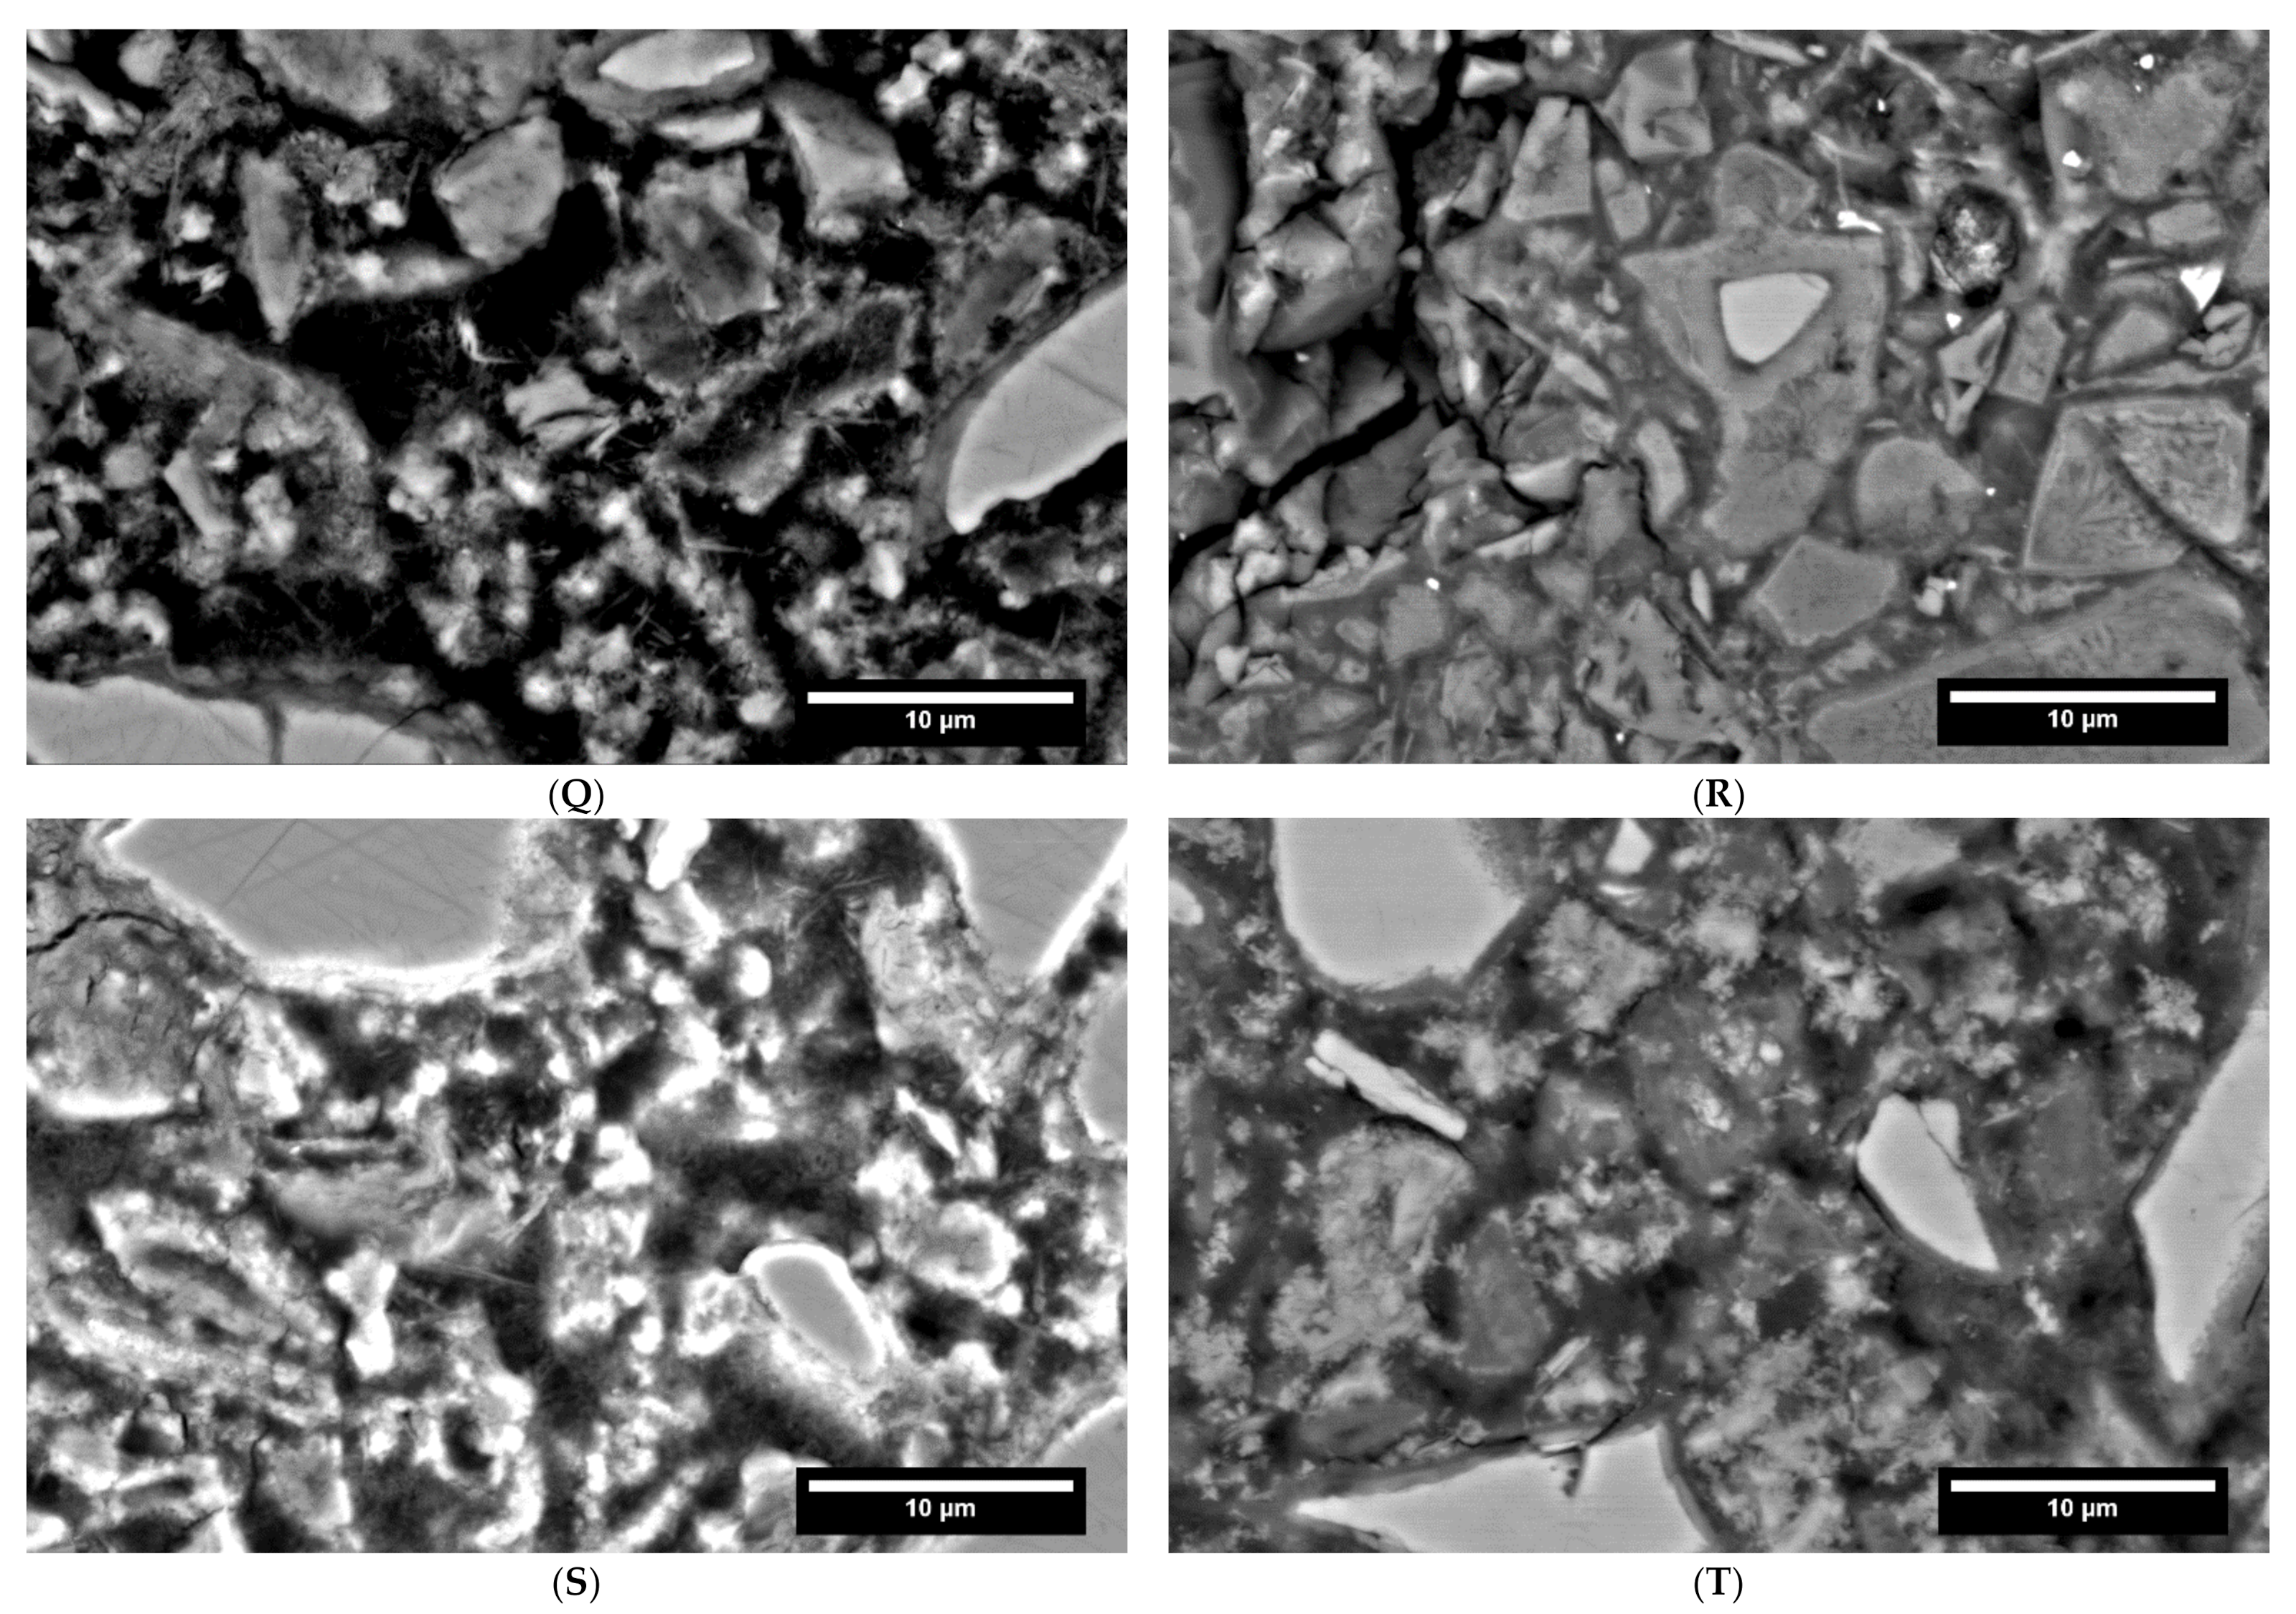
In addition, SEM images and elemental mappings were taken of the mortar samples at 28 days of age and in the carbonated state. The resulting images are shown in Figure 6.
In the carbonated reference sample (Figure 6B) the hydrate phases look more frayed compared to the 28 days old sample (Figure 6A) and the microstructure appears coarser. This indicates a decalcification of the C-(A)-S-H phases. Furthermore, streaky areas that can be assigned to portlandite are missing. In carbonated LD, frayed and intact hydrate phases can also be easily recognized (Figure 6C,D). This again suggests carbonation of the C-(A)-S-H phases. Furthermore, unhydrated C2S particles, as well as iron-containing slag particles are visible. Clay minerals are also still visible in hydrated as well as in carbonated CC I (Figure 6E,F). The matrix is composed of intact and carbonated C-(A)-S-H phases. In the case of CC I, the carbonated phases could not be determined by habit, but by chemical composition using EDX, because the visual difference to the 28 days sample is too small. Furthermore, the carbonated sample of CC I appears more porous than the 28 days old sample. Remnants of metakaolin particles are also visible in CC II (Figure 6G,H). As with the reference and LD, the hydrate phases look frayed, indicating carbonation of the C-(A)-S-H phases. For CA, mainly anhydrite, gypsum and aluminum hydroxide could be detected (Figure 6J) Furthermore, monosulfate, as well as residues of ettringite and C-(A)-S-H phases were determined by EDX. Compared to the corresponding 28-day sample (Figure 6I), a densification of the microstructure is visible. For the C-S-H sample, no effect of carbonation can be seen from the SEM images (Figure 6L) The structure of the particles in larger particles has not changed compared to 28 days (Figure 6K). When looking at Geo MK (Figure 6M,N), only a slight coarsening of the microstructure can be detected, an optical change of the hydrate phases, as for example in Ref I cannot be recognized. The situation is similar for Geo FA. Here, too, a change compared to 28 d in the microstructure is not visually detectable (Figure 6O,P). However, carbonation of C-A-S-H and N-A-S-H phases could be detected by EDX. The nahcolite measured by XRD was not found in the SEM images. Based on the SEM image, an increase in the hydrate hemming the slag particles can be detected for AAS I as well as for AAS II (Figure 6Q,T). This difference between the 28 day old and the carbonated samples can be interpreted as a progression of hydration. By EDX, N-A-S-H and C-A-S-H phases were detected for AAS I, and Mg-containing C-A-S-H phases were detected. For AAS II large amounts of calcite and dolomite could be detected, which was analogous to the XRD investigation. The hydrate phases between the individual slag particles are also not very distinct in the carbonized sample.
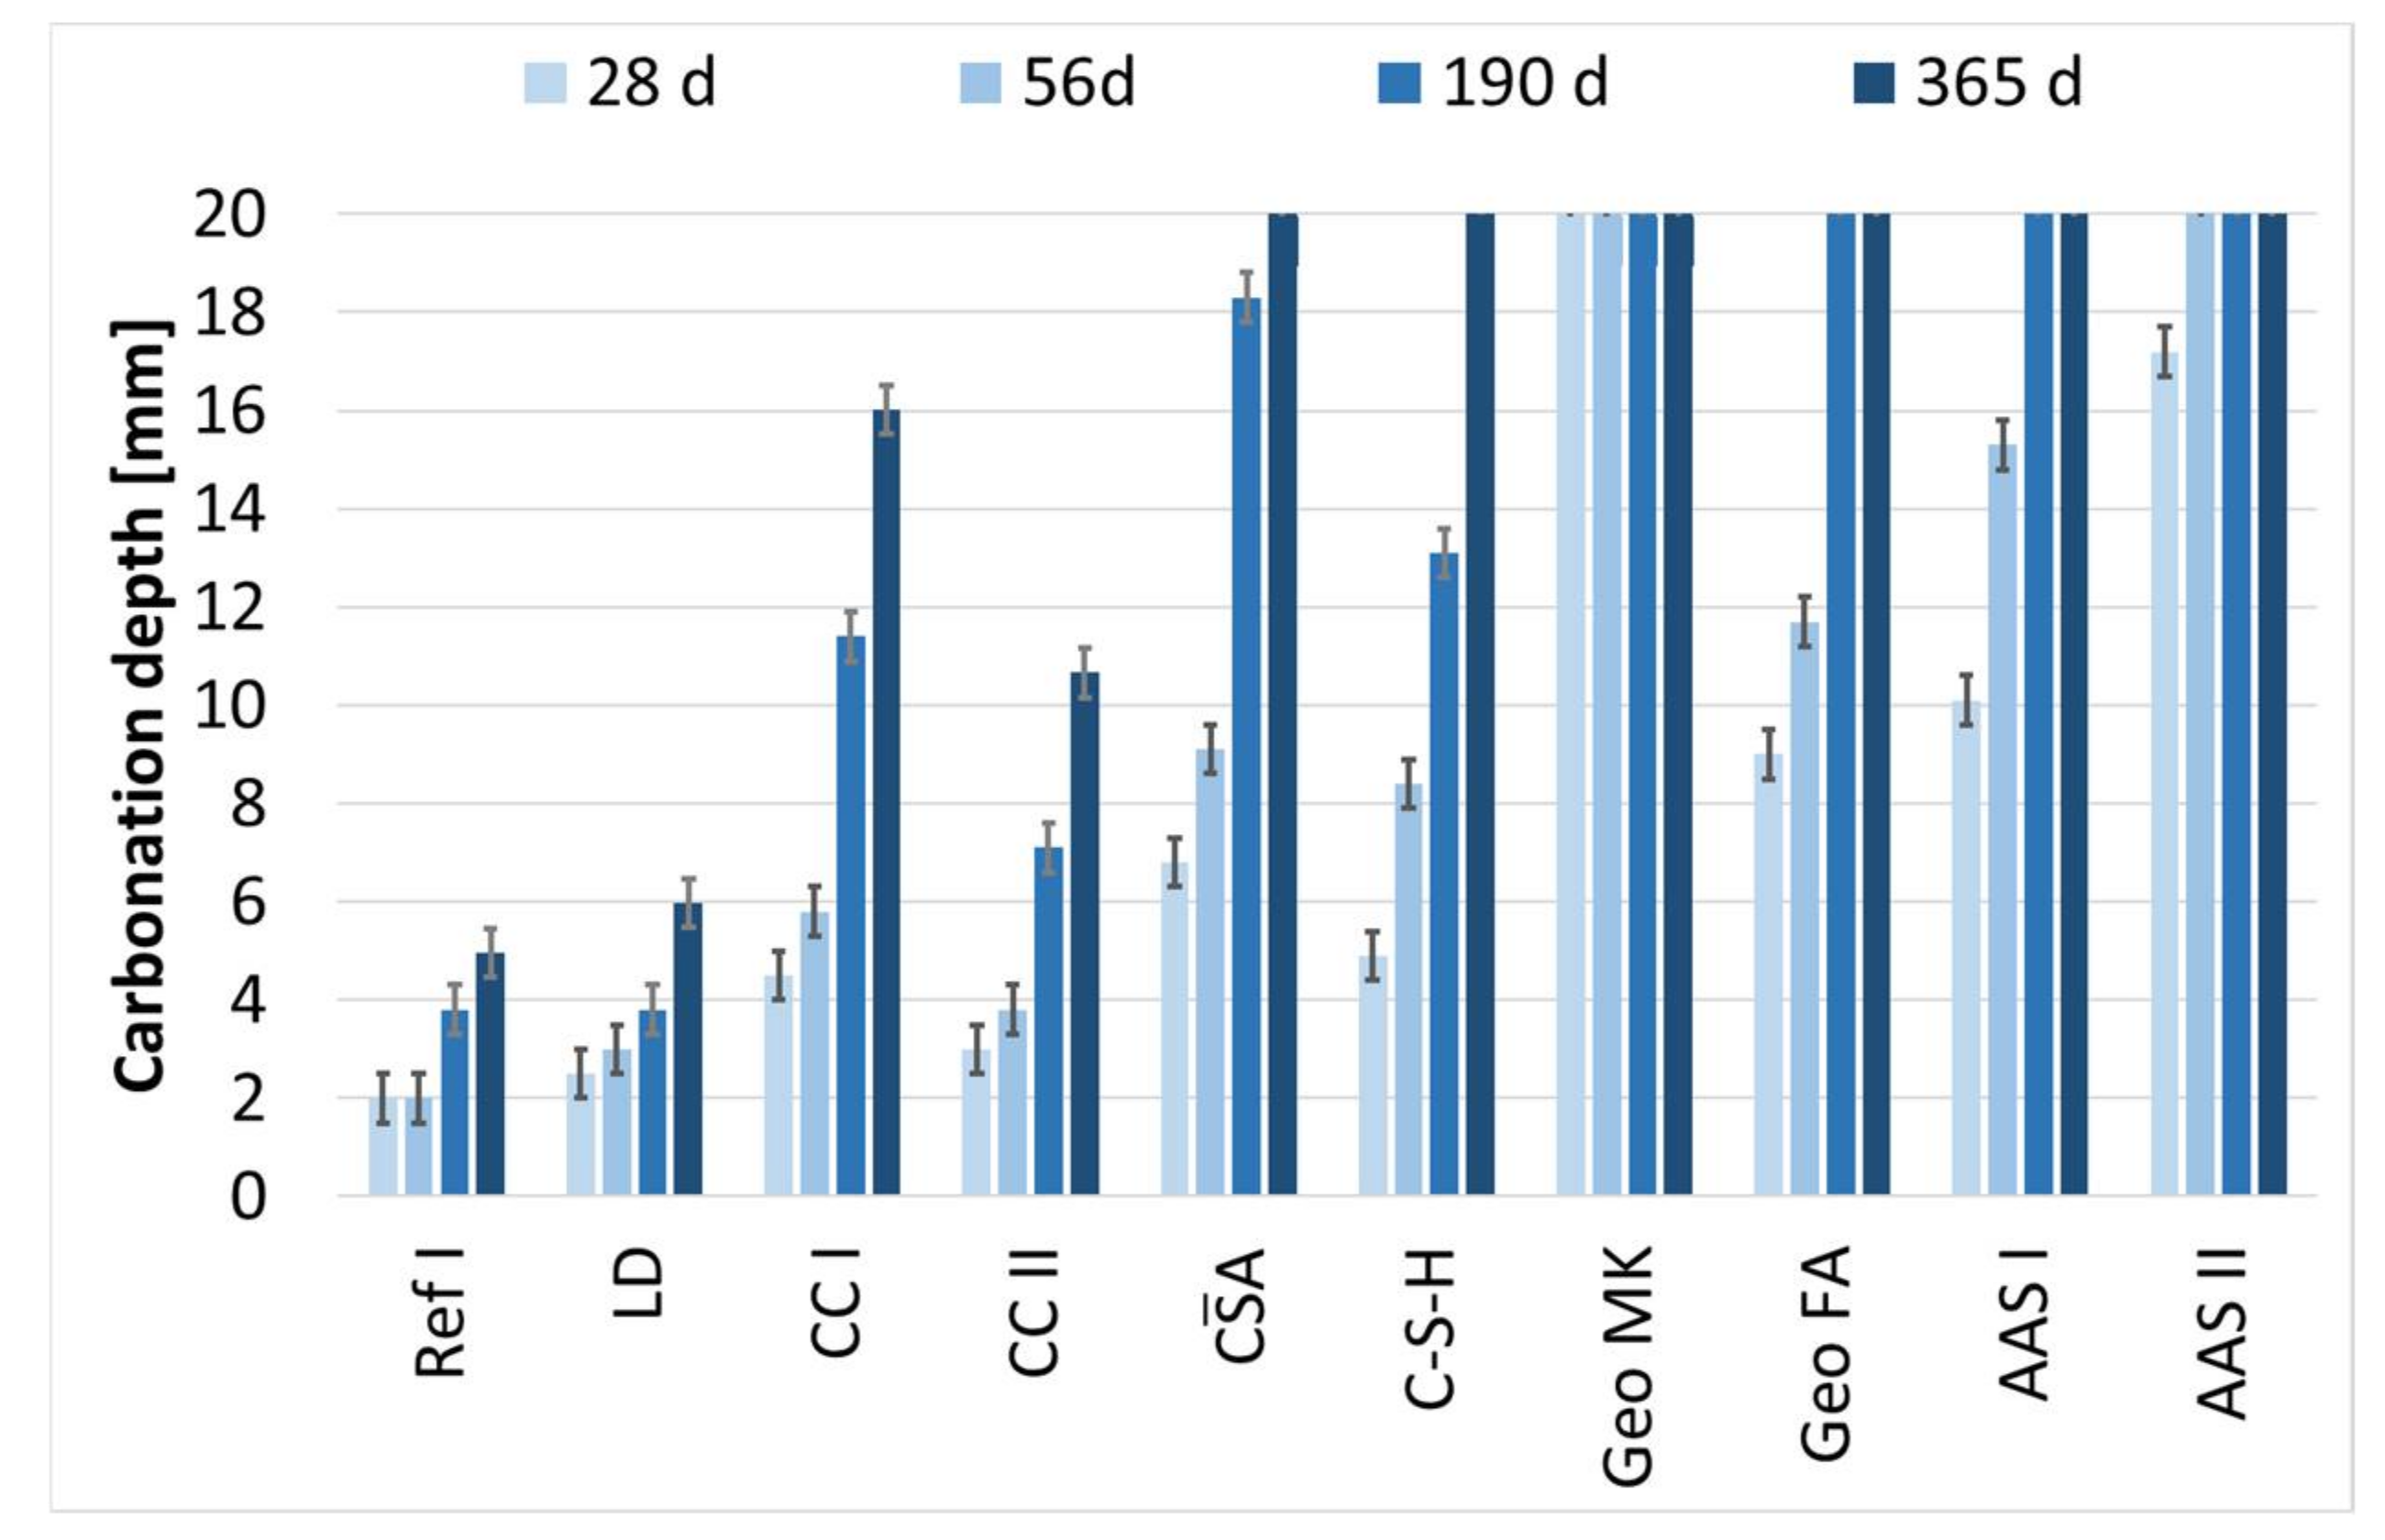
The carbonation depths shown in Figure 7 were observed at mortar specimens, stored at 1 vol.-% CO2 from the age of 42 days.
LD shows a similar behavior to the reference sample and reaches a carbonation depth of 6 mm after one year. The carbonation depth of CC I with 16 mm after one year is clearly higher than that of CC II, with 11 mm. Based on the carbonation depth of 13 mm after 190 days, it can be assumed for sample CA that it reaches a carbonation depth of 20 mm between 190 and 365 days and is thus carbonated completely. The behavior of alkali-activated binders during accelerated carbonation, which is described as problematic in the literature, is also reflected in these investigations [66,75,76]. Geo MK is already completely carbonated after 28 days, followed by AAS II, which is completely carbonated after 56 days. Geo FA and AAS I are both completely carbonated after 190 days.
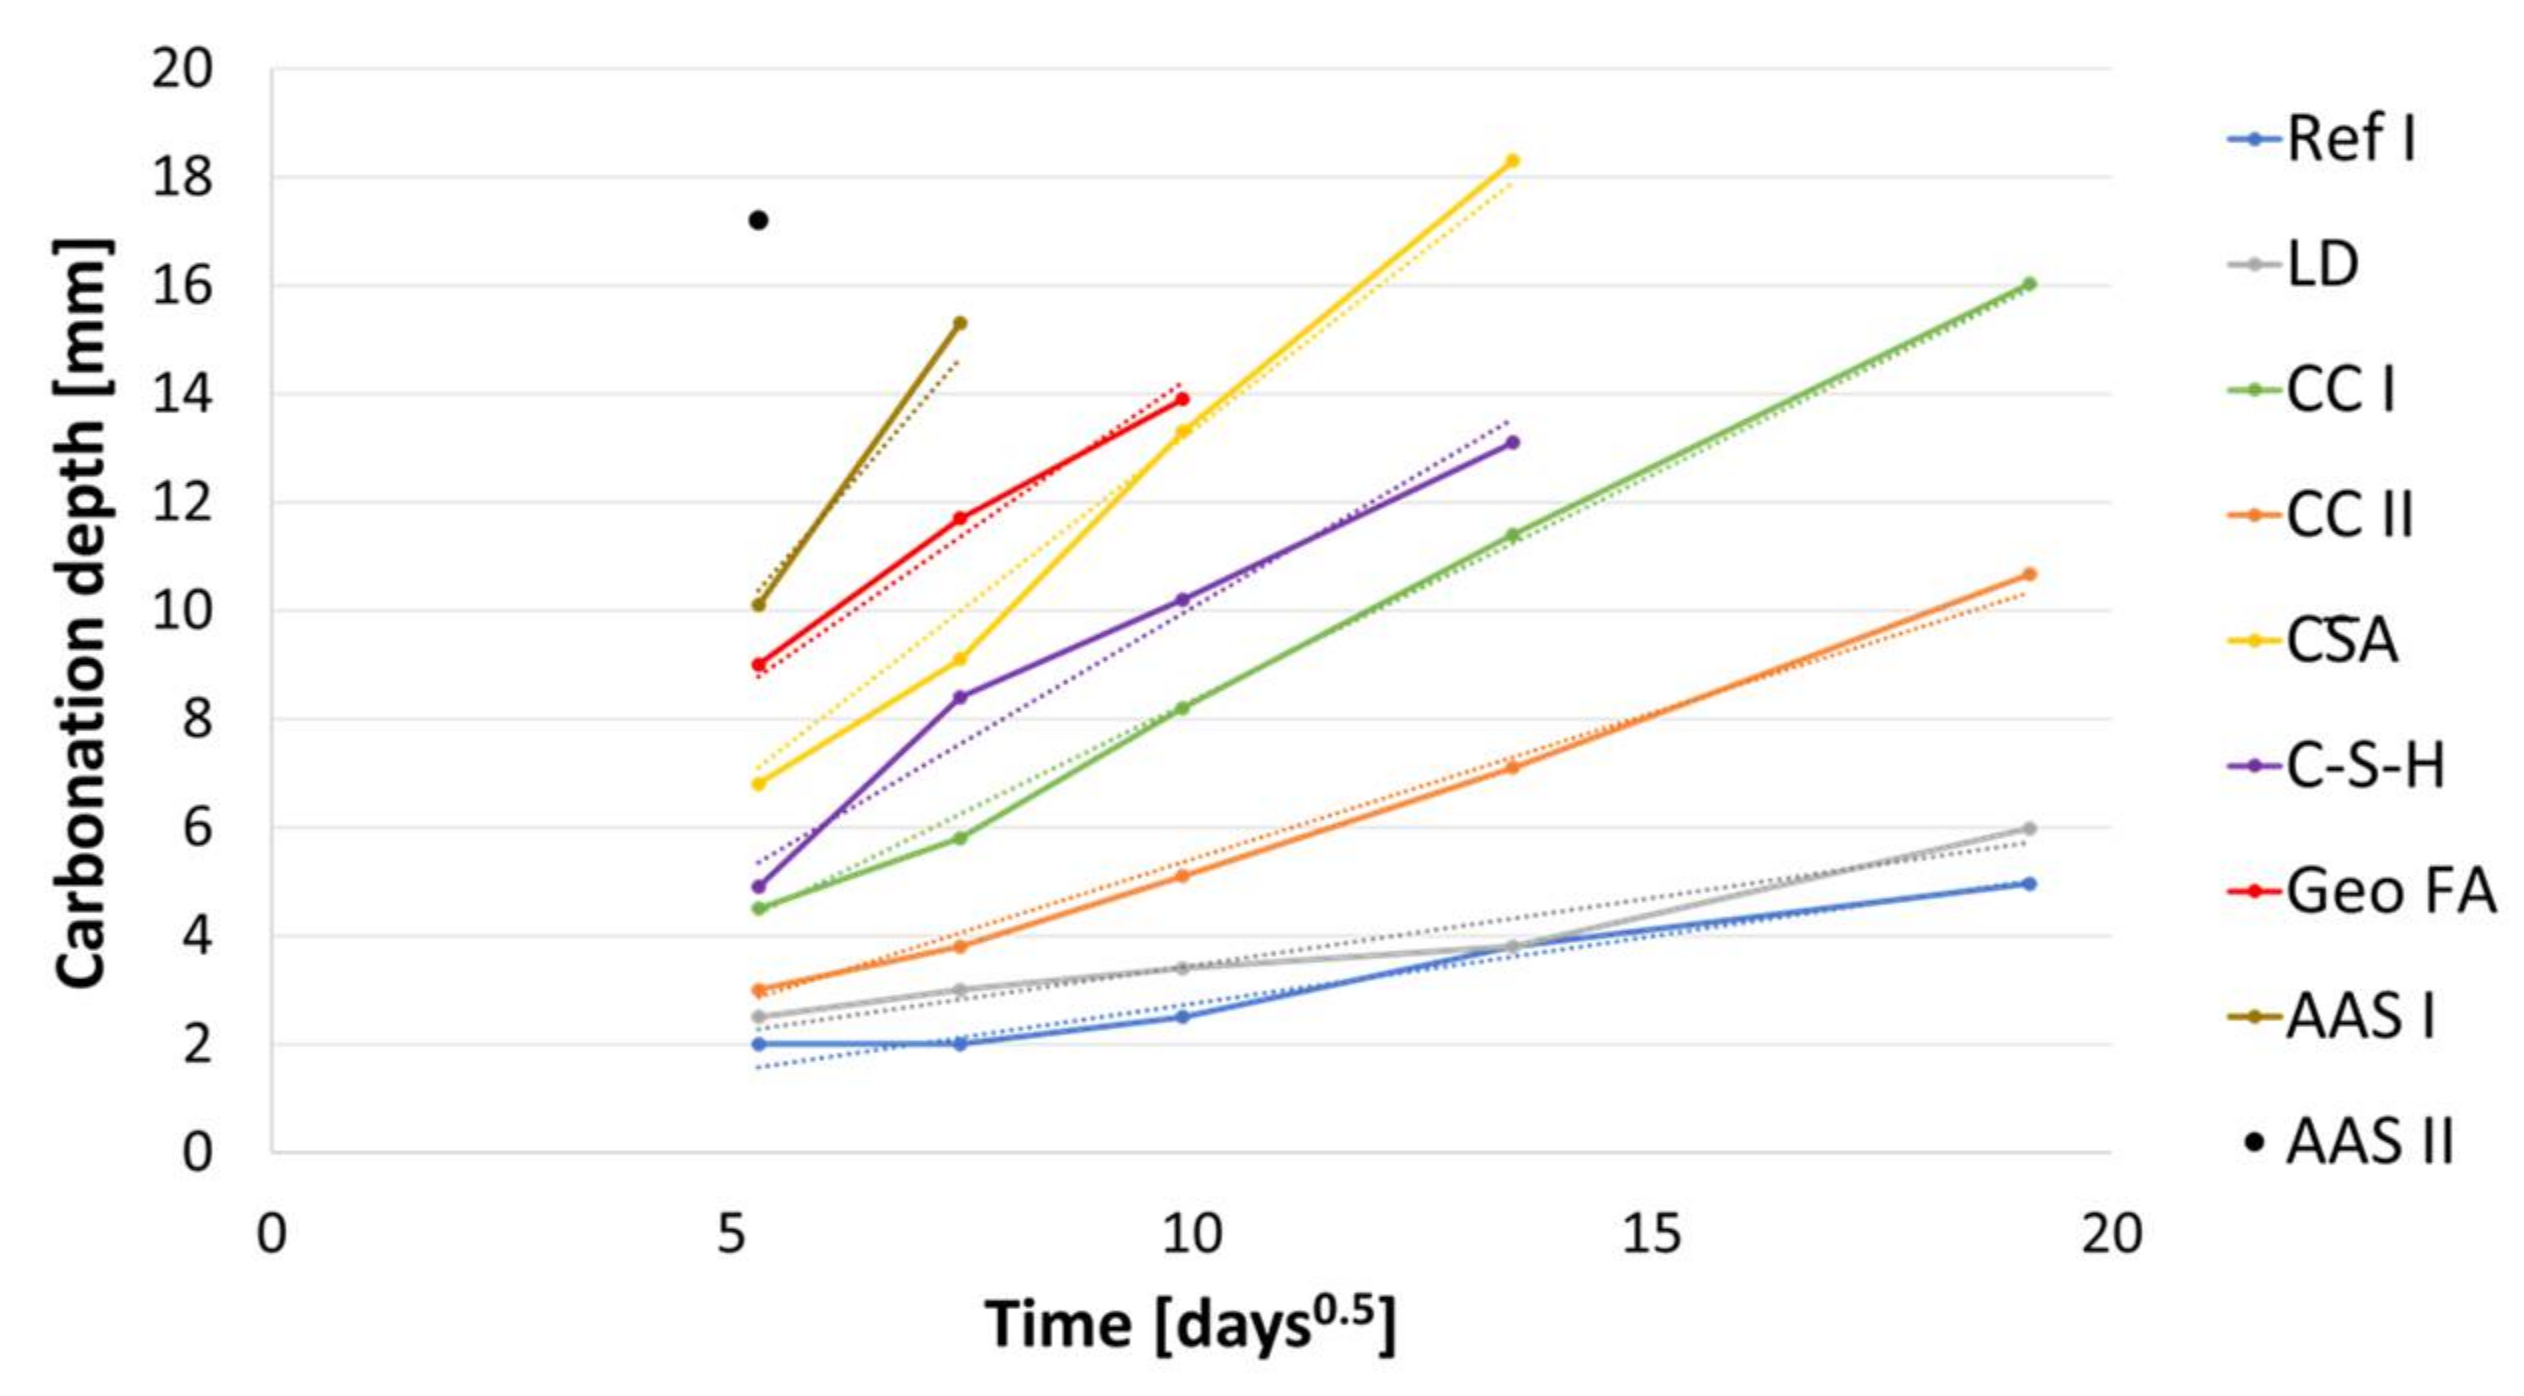
The carbonation depths are plotted against in Figure 8, according to DIN EN 12390-12 (2020-01). All the binders investigated show an approximately linear increase in carbonation depth here, so that it can be assumed that the carbonation coefficients do not vary as a function of time and that the carbonation depths follow the -characteristic. Geo MK is not included in this graph as the specimens were completely carbonated after 28 days. The carbonation coefficients for 1 vol.-% CO2 were calculated by linear regression to the values shown in Table 4 according to DIN EN 12390-12 (2020-01).
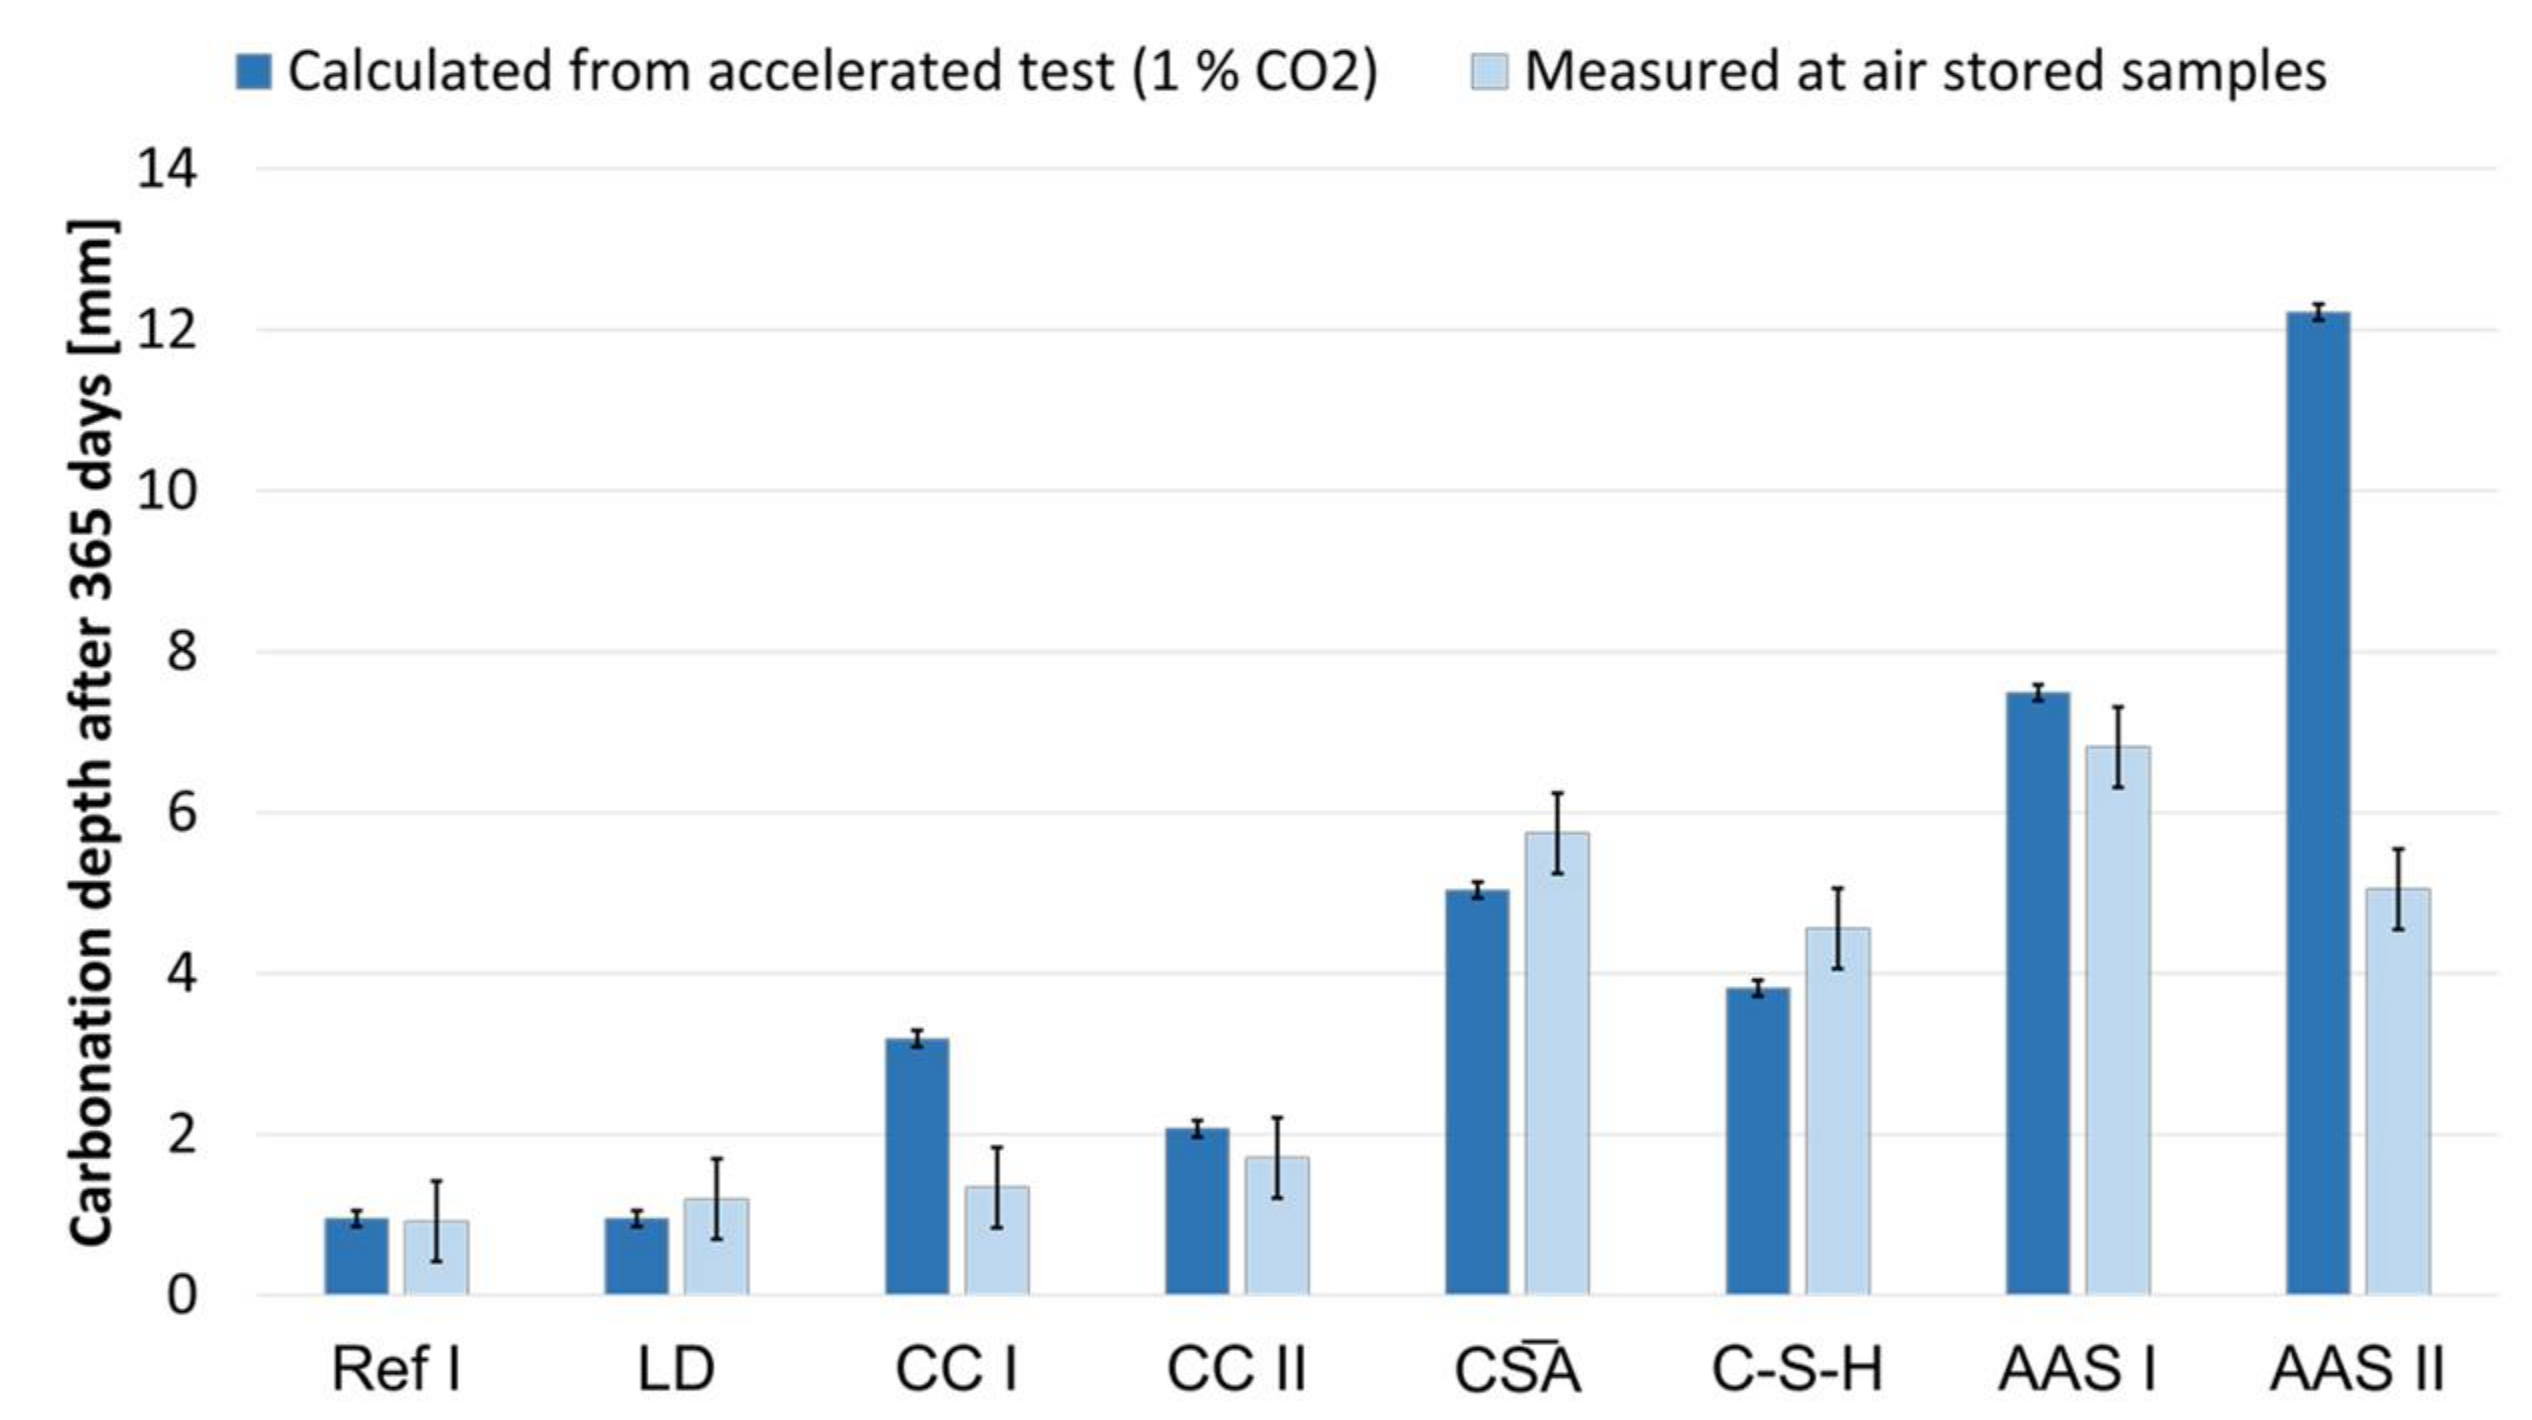
According to Equation (5) the carbonation rates for carbonation in standardized test conditions with a CO2 content comparable to air (400 ppm) were calculated (c = 1). To verify the calculated values from the accelerated test, the measured values after 365 days of natural carbonation are compared in Figure 9. The values for Ref I, LD and CC II show very good agreement, with the calculated values slightly overestimating the carbonation depth. The values for AAS I, CA and C-S-H also show good agreement, with the accelerated method slightly underestimating the actual carbonation depth of the latter two. A clear deviation with strong overestimation by the accelerated method is shown by CC I and AAS II. This behavior was expected for the alkali-activated ones. Particularly noteworthy here is the Geo MK series: at 365 days of natural carbonation, no carbonation was detected (<0.1 mm) using the phenolphthalein test, whereas the accelerated samples were fully carbonated at 28 days, so that KACC could not be determined.
4. Discussion
4.1. CEM I (Ref I)
The reference sample shows the generally known hydration and carbonation behavior. During hydration, mainly C-(A)-S-H phases and portlandite are formed. Furthermore, the microstructure densifies due to the formation of the hydrate phases. As expected, the pH is 13.2 after seven days and 13.1 after 28 d. When the reference is exposed to an increased volume of CO2, portlandite and C-(A)-S-H phases are carbonated and amorphous SiO2 and mainly calcite is formed, as well as small amounts of vaterite as previously described by Li et al. [13]. In addition, a decrease in the pore volume, is also evident. This is accompanied by the increase in volume due to the formation of calcium carbonate [25,26]. The decrease in the percentage of gel pores reflects the decalcification of the C-(A)-S-H phases. The carbonation depths after 365 d storage in 1 vol.-% CO2 is 5 mm. The comparison of the calculated carbonation depth at a CO2-concentration of 400 ppm, based on the accelerated test at 1 vol.-% CO2, shows a good suitability of this method for OPC. This was expected, as this method was designed for OPCs.
4.2. SCM with LD Slag (LD)
When looking at the hydration results for the sample of the composite cement with LD slag, it is particularly noticeable that they deviate only to a small extent from the reference sample with regard to both the phase composition and the pore size distribution as well as the pH value of the pore solution. The unreacted slag particles are only noticeable in the XRD and on the SEM images. This is in good agreement with the results of Jiang et al. and Kourounis et al. [49,77]. The carbonation behavior of LD is also similar to that of Ref I, concerning carbonation phases and pore structure. However, a faster increase of the carbonate phases, can be observed. The carbonation depths of 5 mm for Ref I and 6 mm for LD are also close to each other. Palod et al. have obtained similar results for concretes with steel slags [78]. Based on the comparison of the accelerated and natural carbonation test, the accelerated test with 1 vol.-% CO2 seems to be suitable for the SCM with LD slag.
4.3. SCM with Metaillite (CC I)
The same hydration phases can also be observed for CC I as for Ref I. However, the pozzolanic reaction of the clay minerals showed a consumption of the portlandite. This is in good agreement with [37]. Nevertheless, the pH of the pore solution remains stable at 13.2 and 13.1, respectively, and is thus comparable to that of the reference. The distribution of the pore radii is coarser in CC I than in the reference cement. Thus, in the range of 0.1 to 0.5 µm, more pores occurred.
Due to storage at 1 vol.-% CO, no change in the C-(A)-S-H phases was detected from the SEM images alone in contrast to the reference. From an optical point of view, they are similar to uncarbonated phases. However, both EDX and XRD analyses showed that also in CC I the C-(A)-S-H phases carbonate and transform into amorphous SiO2 and polymorphs of calcium carbonate. Mainly calcite is formed, vaterite only occurs in small amounts. As already observed for LC3 systems, the pore volume of CC I increases upon storage at 1 vol.-% [15] and the amount of gel pores decreases. In connection with the low portlandite content, this explains the higher carbonation depths of the CC I specimens compared to the reference. Trümer showed previously that composite cement with metaillite exhibits a significantly increased carbonation depth compared to OPC [37]. Although CC I is also an OPC-based material, it showed a significant overestimation of the carbonation depth with the accelerated method at 1 vol.-% CO2.
4.4. SCM with Metakaolin (CC II)
CC II is similar to CC I and Ref I in hydration behavior. By means of SEM and EDX analyses, C-(A)-S-H phases and portlandite were observed as the main hydration phase. Furthermore, unreacted metakaolin particles were detected. As determined by XRD, the portlandite content is lower than that of CC I and decreases sharply over the observed period. Furthermore, the pore volume decreased, and CC II formed a finer pore structure than Ref I. The pH of the pore solution remained stable at 13.1 and 13.0
When examining CC II specimens stored at 1 vol.-% CO2 by volume, it was noticeable that the crystalline carbonate phases calcite and vaterite were formed. Due to the more voluminous carbonate phases, the pore volume decreased, with an increase in pores in the range of 0.01 µm to 0.09 µm. Among others, Shi et al. investigated composite cements with about 32% metakaolin with respect to the influence of 1 vol.-% CO2 on the pore and phase composition [22]. Their results are in good agreement with the present results regarding the pore structure of (un)carbonated samples, the phase assemblage and the carbonation depth. In contrast to CC I, the accelerated carbonation of CC II at 1 vol.-% CO2 showed good agreement with the values determined by natural carbonation.
4.5. CA
During the hydration of CA, ettringite, C-(A)-S-H phases, as well as amorphous aluminum hydroxide and monosulfates were detected by XRD and EDX analyses. Furthermore, residues of C2S and clinker particles were found. These observations are in good agreement with those of Winnefeld et al. [52]. Although the measured pH is lower than those of Winnefeld et al. and Ma et al. [52,79] but it is in good agreement with [73]. The decrease in pore volume, as well as the steady change in pore distribution, is in agreement with the observations of Ma et al. [79]. When CA is exposed to a CO2 content of 1 vol.-%, the pore distribution coarsens to resemble that of day 1. This is similar to the observations of Gastaldi et al. that microstructure of a sample stored for 28 days under water is coarser than that of a sample stored for 28 days at 4 vol.-% CO2 [80]. The observations of Hargis for a w/b of 0.65 are in agreement with the results presented here [19].
Furthermore, carbonation results in an increase in gypsum content with a concomitant decrease in ettringite. As observed by Tan et al. and by Hargis et al. the calcium carbonate polymorph aragonite is formed [19,55]. By EDX analyses, C-(A)-S-H phases were found, although partially carbonated. The mortar prisms prepared to determine the carbonation depth are fully carbonated between 190 and 365 days. It is difficult to find suitable comparative data for this since all carbonation tests to date have been run with more than 1 % CO2 by volume. Gastaldi et al. achieved complete carbonation of their specimens after 120 days for the same specimen geometry at 4 vol.-% CO2 [80]. The determined carbonation coefficient was higher for CA than for OPC and it showed a good applicability of accelerated carbonation, even if this slightly underestimated the actual values.
4.6. C-S-H
As described by Möller, the hydration of C-S-H binders produces exclusively X-ray amorphous C-S-H phases and, unlike OPC, no portlandite or ettringite [56]. SEM images show a structure of agglomerates of small particles within larger particles. The pore volume is lower than that of OPC, while the amount of gel pores is significantly higher. The pH of the pore solution is lower, which can be contributed by the absence of portlandite.
In general, little is known about the carbonation of C-S-H; data on carbonation is only available for air storage investigated by Achenbach et al. [43]. XRD shows a significant increase of calcium carbonates in the form of mainly calcite and aragonite. This indicates a decalcification of the C-S-H phases, which is also reflected in the pore distribution. Although the pore volume decreases overall, the number of pores between 0.3 and 3 µm increases. SEM images show a densification of the microstructure, but it cannot be excluded that it depends on the progress of hydration and is not necessarily related to the carbonation of the binder. Measurements of the carbonation depth showed that C-S-H is completely carbonated at the latest after 365 days of storage at 1 vol.-% CO2. How the observed decalcification by carbonation of the C-S-H phases affects the durability of possibly embedded steel reinforcement requires further investigation. Although C-S-H binders, such as OPC, form C-S-H phases, the absence of portlandite is noticeable from the rapid progress of carbonation. The determined carbonation coefficient was higher than for OPC, but lower than for CA. C-S-H showed good applicability of accelerated carbonation, when compared to the values gained from natural carbonation, even if the accelerated test slightly underestimated the actual values.
4.7. Alkali-Activated Metakaolin (Geo MK)
Mainly N(K)-A-S-H phases are formed during the hydration of Geo MK, and in this case, based on potassium silicate as activator and EDX images, it can be assumed that they are K-A-S-H phases. This is in good agreement with Gracia-Lodeiro et al. and Granzio et al. [58,72]. However, based on XRD and SEM/EDX, no change in microstructure or phase composition is detectable over a hydration period of 56 days. The SEM images are comparable to those of Si et al. [81]. During the measured hydration time, the pore volume increases, but the pore distribution does not change in the range from 0.001 to 30 µm. Therefore, it can be assumed that, as already reported by Perera et al. and Si et al. for metakaolin-based geopolymers, Geo MK also tends to form shrinkage cracks [81,82]. The pH of the pore solution decreases during solidification, as is typical for geopolymers [32].
Storage of mortar prisms made of Geo MK at 1 vol.-% CO2 shows complete carbonation of the specimens after only 28 days, confirming once again that an accelerated carbonation process is not suitable for geopolymers [66,75,76]. Interestingly, however, Geo MK does not exhibit any change due to storage at 1 vol.-% CO2 that would be measurable by XRD or SEM. The pore radius distribution also changes only marginally. In addition, the carbonation depths measured at the age of 365 days of air storage was <0.1 mm.
4.8. Alkali-Activated Fly Ash (Geo FA)
EDX analyses reveal N(K)-A-S-H and C-A-S-H phases as hydration products between the fly ash particles. A dissolution of the fly ash cannot be recognized. Only slight changes due to hydration can be detected by XRD. A densification of the microstructure in the form of a decrease in pore volume can be detected by MIP measurements, but this is not evident from the pore radius distribution. Between 28 and 56 days, the microstructure undergoes coarsening. However, the pH determined during hydration was higher than the value determined by Law et al. [83].
Storing Geo FA in 1 vol.-% CO2 leads to a small structural change. The only carbonate phase detected was sodium hydrogen carbonate (NaHCO3), which was also found in several other studies during accelerated carbonation of geopolymers [76,84,85]. The proportion of this carbonate phase is about 5%. As Bernal et al. described, this is due to the fact that fly ash-based geopolymers carbonate by precipitation of alkali bicarbonate salts from the pore solution [76], a change in the binder, as shown here, cannot be detected by SEM images. Microstructural densification due to storage at 1 vol.-% CO2 was also observed in the samples studied here. Park et al. were able to observe a densification of the microstructure for fly ash-based geopolymers when they were exposed to an atmosphere with a high CO2 content at an early age. This microstructural change was explained by the fact that the aluminosilica gel changes to a Si-rich state due to carbonation [30]. Whether this is also the case here could not be verified. As already observed for Geo MK, mortar prisms made of Geo FA carbonate very rapidly. Thus, the specimens were carbonated completely after only 190 days of storage at 1 vol.-% CO2. It was reported by Law et al. and Pasupathy et al. that no clear carbonation front was determined by means of indicator solution [83,86]—this was not observed here.
4.9. Alkali-Activated Slag; Activator Sodium Silicate (AAS I)
By means of SEM and EDX analyses Ca, Si, Al and Na containing hydrate products were detected which are probably C-A-S-H and N(K)-A-S-H phases. Myers et al. simulated and observed the development C-(N-)A-S-H gel for systems with sodium metasilicate and GGBFS [87,88], while Li et al. postulated that with increasing Ca content a change from N-A-S-H to C-A-S-H phases as the main hydration product takes place [89]. Hydrotalcites were detected by XRD for AAS I as well as [87]. As a consequence of the hydration of AAS I, the pore volume decreases, and the pore structure first refines and then coarsens again after 56 d. Nevertheless, the pore structure is still very stable. Still, the pore structure is finer than that of the reference cement, as already observed by Collins et al. [90]. The pH values of the pore solution remain stable at one level during hydration, this is in good agreement with Puertas et al. [91].
When the material is stored at 1 vol.-% CO2, calcite vaterite and a small amount of aragonite are formed in addition to the carbonate phase. This is in good agreement with Puertas et al. [31]. Further carbonate phases were not detected. Due to the formation of the calcium carbonate polymorphs, the pore volume of AAS I decreases, while the proportion of pores in the range of 0.03 to 0.3 µm increases, as already observed by Puertas et al. [31]. Mortar samples with AAS I were completely carbonated within 190 days of storage at 1% CO2 by volume. This is comparable to slags with low Mg content [92]. As already described by Shi et al., AAS I showed a very different carbonation behavior from OPC [93].
Although it is known that the accelerated carbonation process for AAMs hardly provides comparable results with natural carbonation, AAS I seems to be an exception: It showed a significantly higher carbonation coefficient than OPC, but still a relatively good agreement between the values from accelerated (1 vol.-% CO2) and natural carbonation. The actual carbonation depth in air was only slightly overestimated by the accelerated method.
4.10. Hybrid Alkali-Activated Slag; Activator OPC and NaSO4 (AAS II)
AAS II is a so-called hybrid alkali-activated cement, which is activated with NaSO4 and CEM I instead of NaOH or water glass. Little is known about the hydration and carbonation behavior of such systems. In the case of AAS II, SEM images after 7 d of hydration show a low-level hydrate phase consisting of Ca, Si, S, and Al. These hydrate phases remain little distinct for all later images. Based on XRD, it was further determined that the crystalline hydrate phase ettringite has formed. EDX analysis suggests the formation of additional C-(A)-S-H phases. Angulo-Ramírez et al. were able to detect primarily C-(A)-S-H phases and hydrated gehlenite for NaOH and waterglass activated systems. Ettringite was not found. The formation of ettringite in the present case may be related to NaSO4 as activator. In the course of hydration, the pore volume also decreases, and the microstructure becomes denser. The pH of the pore solution of AAS II is lower compared to AAS I, again due to different activators.
Under the influence of 1 vol.-% CO2, calcium carbonate polymorphs aragonite and, in smaller amounts, vaterite, are formed in addition to the calcite and dolomite already present. Also, gypsum and hydrotalcite were detected, which indicates a carbonation of the ettringite. On the basis of SEM and EDX analyses, no further carbonate phases were detected; however, in the carbonated sample the hydrate phases are not very pronounced. The porous microstructure is also clearly indicated by an increase in the pore fraction with a radius >0.03 µm. The corresponding mortar samples were carbonated completely within 56 days. Angulo-Ramirez observed a full carbonation of the specimens made of made of alkali-hydrous hybrid concrete within 99 days when stored at 1 vol.-% CO2. As has been shown for other AAMs, the accelerated carbonation at 1 vol.-% CO2 is not applicable to the hybrid alkali-activated AAS II to determine values comparable to natural carbonation. The values calculated from the accelerated procedure are more than twice as high as the actual values.
Concerning the pH of the pore solutions, it can be summarized that at the age of 7 and 28 days, respectively, the pH of all investigated binders was higher than 11. Concerning the passivation of steel in the investigated alternative binders initially all pore solutions show pH values that allow passivation of the steel if no other components of the pore solution prevent this. Further investigation on this topic are necessary.
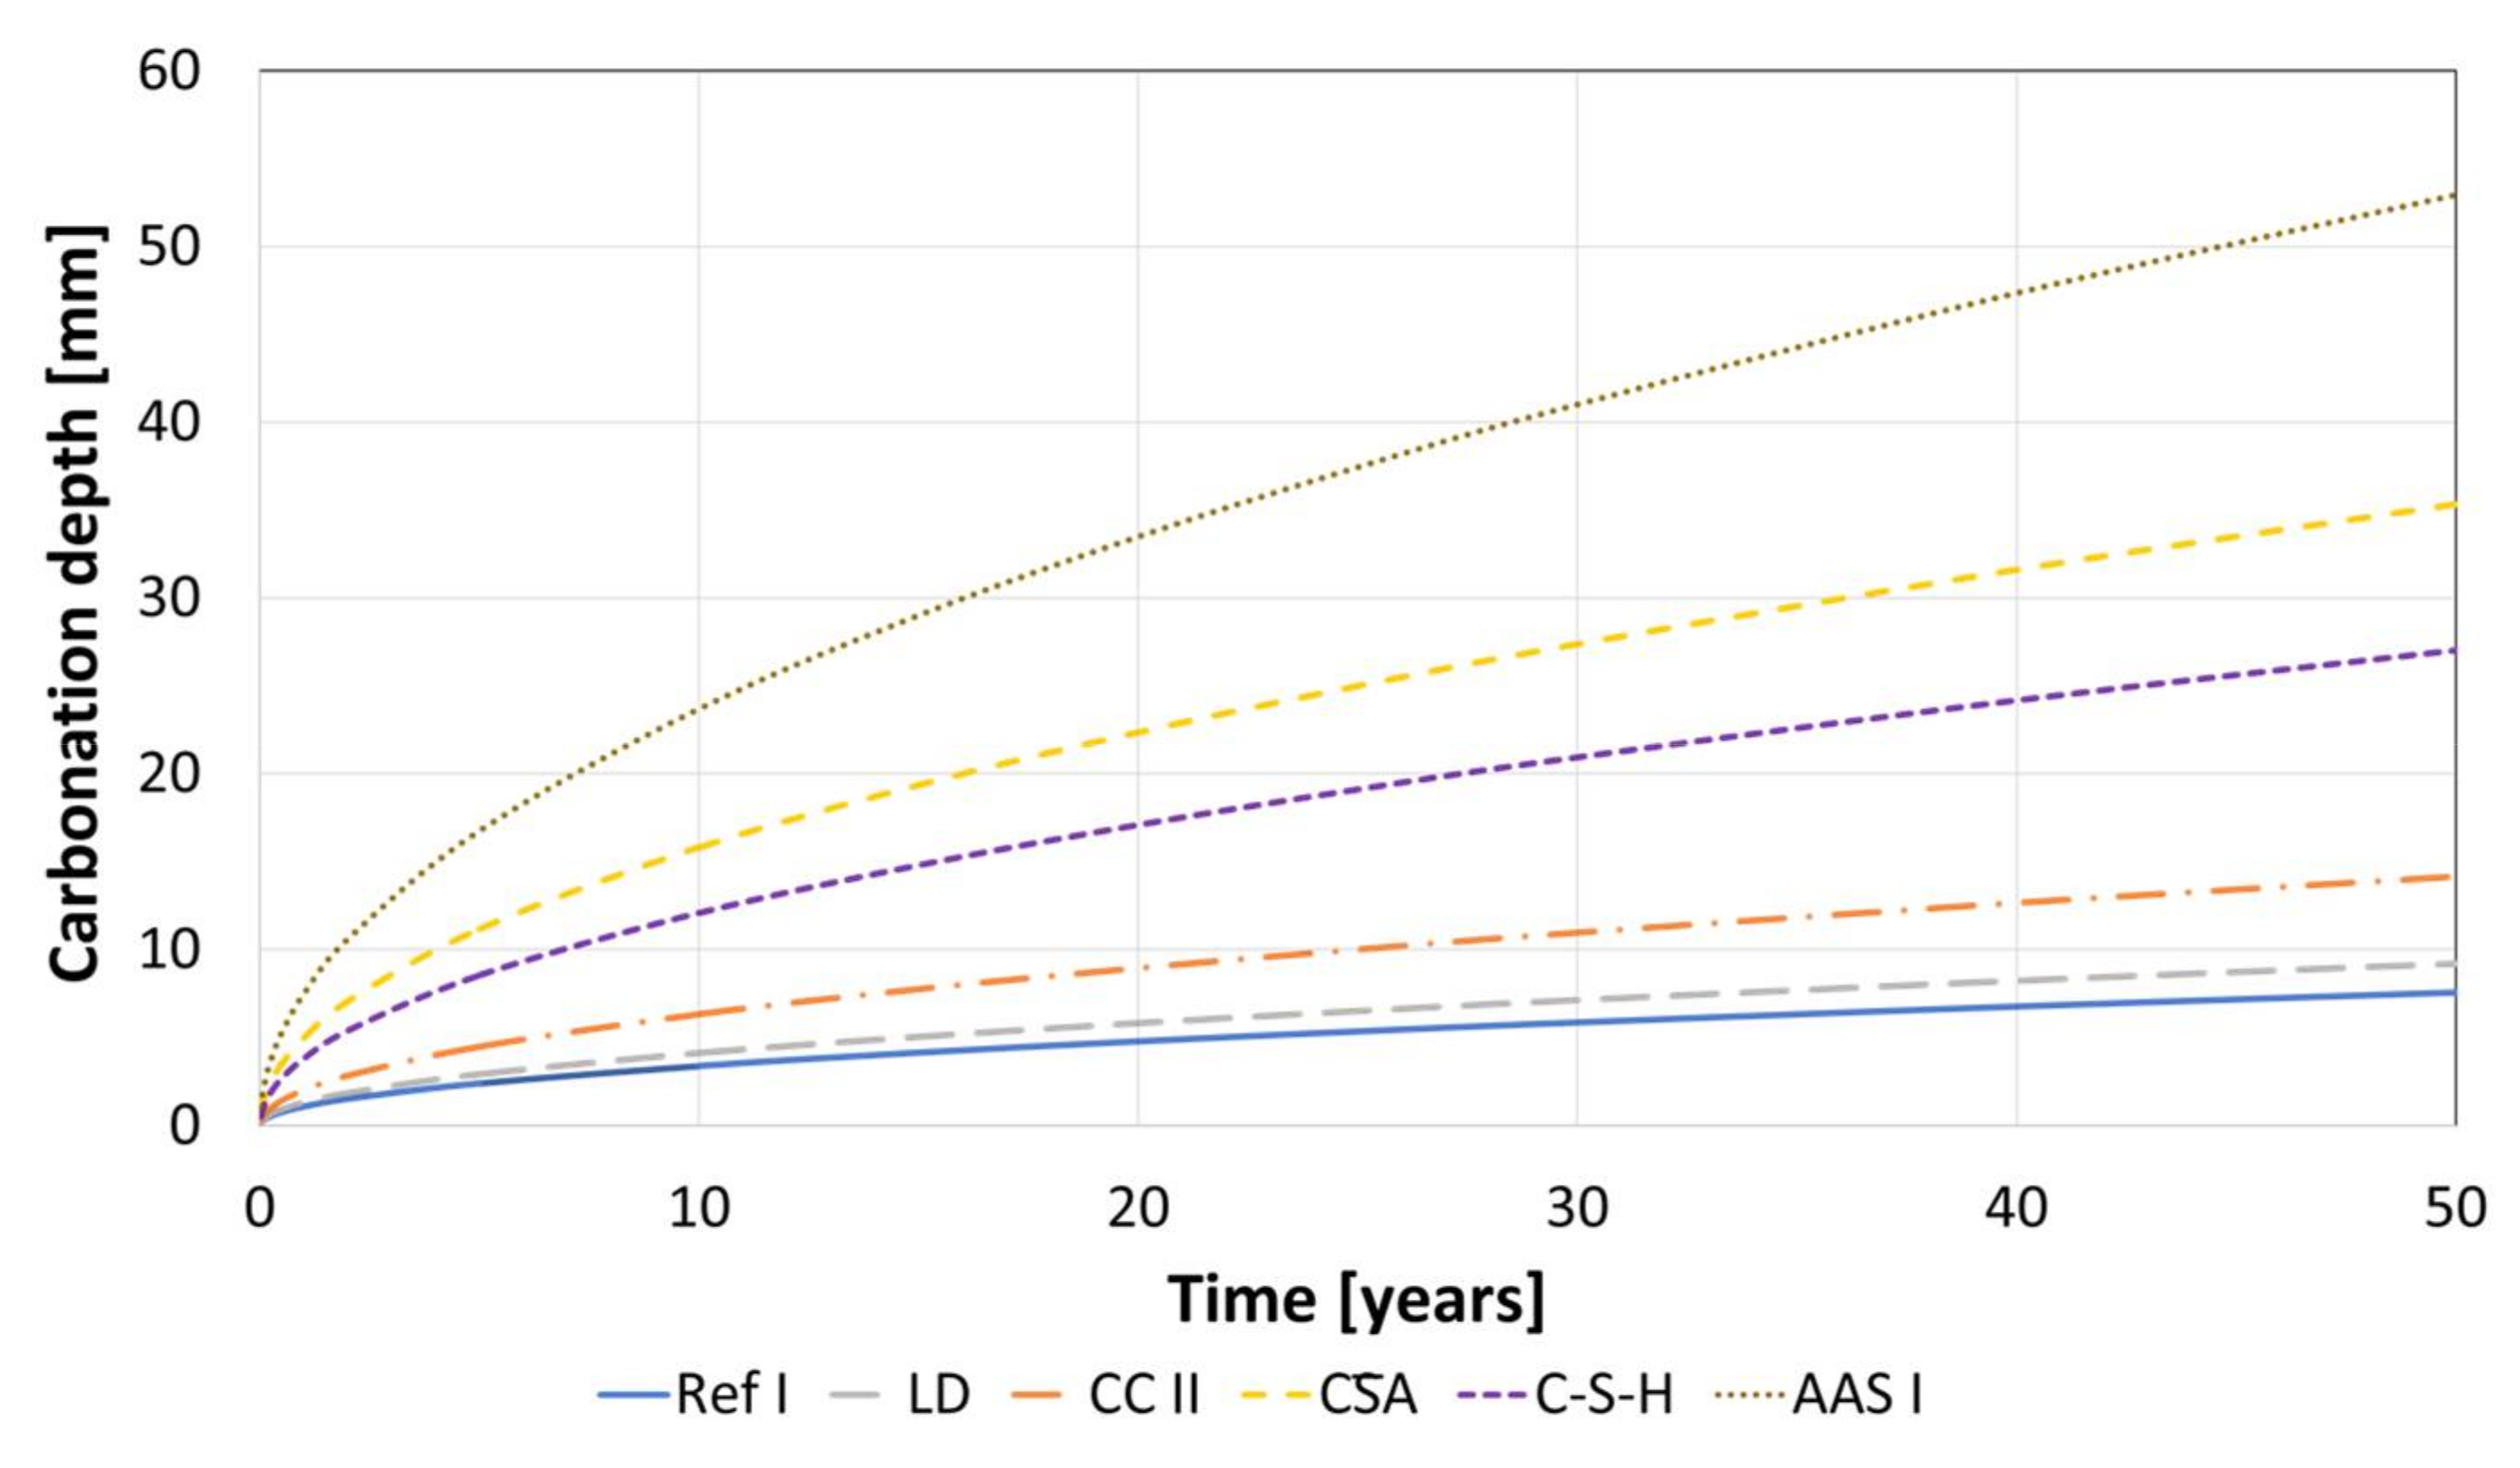
For the binder types, where the accelerated carbonation testing seems to be suitable, an extrapolation of the carbonation depths for 50 years based on the calculated KNAC values (Table 4) was made and the results are shown in Figure 10. Assuming a concrete cover of 25 mm the carbonation front in the AAS I, CA and C-S-H should reach the steel surface, considering that this is an ideal conception, which does not represent a real exposure. However, this is just a first theoretical estimation, based on models developed on OPC binders. To gain knowledge on the possible corrosion rates in carbonated material, further research is needed for all of the investigated binder types.
5. Conclusions
The hydration and carbonation behavior of nine different alternative binders, from the groups of SCMs, CA, C-S-H and AAMs have been studied in detail in comparison to an OPC as reference. The results presented on the investigations of the hydration and carbonation behavior of alternative binders can be summarized as follows:
- The binders investigated differ fundamentally in their hydration and carbonation behavior. Only the composite cements are comparable with the reference cement, whereby in connection with the carbonation of the calcined clay cements, the consumption of portlandite due to the pozzolanic reaction is clearly noticeable. The use of LD slags has no unfavorable effect on the carbonation rate and does not noticeably influence either the hydration or the carbonation reaction.
- The pH of all investigated binders is high enough to allow for a passivation of embedded steel if no corrosive substances are present in the pore solution. Further research of this topic is necessary.
- The accelerated carbonation testing at 1 vol.-% CO2 is applicable for OPC, SCMs with LD slag or metakaolin, CA, C-S-H, and the GGBFS 1 activated by sodium silicate (AAS I).
- The accelerated carbonation testing at 1 vol.-% CO2 is not applicable to gain comparable results to natural carbonation for the SCM with metaillite, the alkali-activated metakaolin and the hybrid alkali-activated slag (AAS II), as the carbonation rates are highly overestimated by the accelerated method.
- The geopolymers show during carbonation little to no change in phase composition by XRD and SEM. The alkali-activated metakaolin showed carbonation depth < 0.1 mm after one year of natural carbonation.
- To establish reliable correlations between the hydration, carbonation, and corrosion behavior of these binders, various studies on corrosion behavior must be carried out.
Author Contributions
Supervision, funding acquisition and review, H.-M.L. and M.R.; investigation, data curation, conceptualization, visualization and writing, B.K.; conceptualization, validation, visualization and writing, R.A. All authors have read and agreed to the published version of the manuscript.
Funding
This research was funded by the German Research Foundation under the grant number 416337623.
Institutional Review Board Statement
Not applicable.
Informed Consent Statement
Not applicable.
Data Availability Statement
Not applicable.
Acknowledgments
Many thanks go to Lydia Schmiedel, Christian Matthes, and Christiane Rößler from FIB of the Bauhaus Uni in Weimar for the preparation and analyses of the SEM/EDX samples.
Conflicts of Interest
The authors declare no conflict of interest.
Appendix A

Table A1.
List of abbreviations.
| Abbreviation | Explanation |
|---|---|
| AAM | alkali-activated material |
| AAS | alkali-activated slag |
| BOF | basic oxygen furnace |
| CC | calcined clay |
| A | calcium sulfoaluminate |
| C-S-H | calcium silicate hydrate |
| EDX | energy dispersive X-ray spectroscopy |
| FA | fly ash |
| Geo FA | geopolymer with fly ash |
| Geo MK | geopolymer with metakaolin |
| GGBFS | ground granulated blast furnace slag |
| LD | Linz-Donawitz |
| MK | metakaolin |
| OPC | ordinary portland cement |
| QXRD | quantitative X-ray diffraction |
| SCM | supplementary cementitious material |
| SEM | scanning electron microscope |
| XRD | X-ray diffraction |
Figure A1.
Graphical representation of XRD measurements: Ref I and LD.

Figure A2.
Graphical representation of XRD measurements: CC I and CC II.

Figure A3.
Graphical representation of XRD measurements: CA and C-S-H.

Figure A4.
Graphical representation of XRD measurements: Geopolymers.

Figure A5.
Graphical representation of XRD measurements: AAS.

References
- Bertolini, L.; Elsener, B.; Pedeferri, P.; Polder, R. Corrosion of Steel in Concrete: Prevention, Diagnosis, Repair; Wiley-VCH: Weinheim, Germany, 2005; ISBN 3-527-30800-8. [Google Scholar]
- Gouda, V.K. Corrosion and Corrosion Inhibition of Reinforcing Steel: I. Immersed in Alkaline Solutions. Br. Corros. J. 1970, 5, 198–203. [Google Scholar] [CrossRef]
- Mundra, S. Corrosion of Steel in Alkali-Activated Materials. Ph.D. Thesis, University of Sheffield, Sheffield, UK, 2018. [Google Scholar]
- Beverskog, B.; Puigdomenech, I. Revised pourbaix diagrams for iron at 25–300 °C. Corros. Sci. 1996, 38, 2121–2135. [Google Scholar] [CrossRef]
- Criado, M. The corrosion behaviour of reinforced steel embedded in alkali-activated mortar. In Handbook of Alkali-Activated Cements, Mortars and Concretes; Elsevier: Cambridge, UK, 2015; pp. 333–372. ISBN 9781782422761. [Google Scholar]
- von Greve-Dierfeld, S.; Lothenbach, B.; Vollpracht, A.; Wu, B.; Huet, B.; Andrade, C.; Medina, C.; Thiel, C.; Gruyaert, E.; Vanoutrive, H.; et al. Understanding the carbonation of concrete with supplementary cementitious materials: A critical review by RILEM TC 281-CCC. Matériaux Constr. 2020, 53. [Google Scholar] [CrossRef]
- Pu, Q.; Jiang, L.; Xu, J.; Chu, H.; Xu, Y.; Zhang, Y. Evolution of pH and chemical composition of pore solution in carbonated concrete. Constr. Build. Mater. 2012, 28, 519–524. [Google Scholar] [CrossRef]
- Stefanoni, M.; Angst, U.; Elsener, B. Corrosion rate of carbon steel in carbonated concrete—A critical review. Cem. Concr. Res. 2018, 103, 35–48. [Google Scholar] [CrossRef]
- Kern, D.M. The hydration of carbon dioxide. J. Chem. Educ. 1960, 37, 14. [Google Scholar] [CrossRef]
- Kitamura, M. Strategy for control of crystallization of polymorphs. CrystEngComm 2009, 11, 949. [Google Scholar] [CrossRef]
- Ashraf, W. Carbonation of cement-based materials: Challenges and opportunities. Constr. Build. Mater. 2016, 120, 558–570. [Google Scholar] [CrossRef]
- Deng, H.; Wang, S.; Wang, X.; Du, C.; Shen, X.; Wang, Y.; Cui, F. Two competitive nucleation mechanisms of calcium carbonate biomineralization in response to surface functionality in low calcium ion concentration solution. Regen. Biomater. 2015, 2, 187–195. [Google Scholar] [CrossRef] [Green Version]
- Li, Y.; Liu, W.; Xing, F.; Wang, S.; Tang, L.; Lin, S.; Dong, Z. Carbonation of the synthetic calcium silicate hydrate (C-S-H) under different concentrations of CO2: Chemical phases analysis and kinetics. J. CO2 Util. 2020, 35, 303–313. [Google Scholar] [CrossRef]
- Black, L.; Breen, C.; Yarwood, J.; Garbev, K.; Stemmermann, P.; Gasharova, B. Structural Features of C-S-H(I) and Its Carbonation in Air—A Raman Spectroscopic Study. Part II: Carbonated Phases. J. Am. Ceram. Soc. 2007, 90, 908–917. [Google Scholar] [CrossRef]
- Shah, V.; Scrivener, K.; Bhattacharjee, B.; Bishnoi, S. Changes in microstructure characteristics of cement paste on carbonation. Cem. Concr. Res. 2018, 109, 184–197. [Google Scholar] [CrossRef]
- Sevelsted, T.F.; Skibsted, J. Carbonation of C–S–H and C–A–S–H samples studied by 13 C, 27 Al and 29 Si MAS NMR spectroscopy. Cem. Concr. Res. 2015, 71, 56–65. [Google Scholar] [CrossRef]
- Ortaboy, S.; Li, J.; Geng, G.; Myers, R.J.; Monteiro, P.J.M.; Maboudian, R.; Carraro, C. Effects of CO2 and temperature on the structure and chemistry of C–(A–)S–H investigated by Raman spectroscopy. RSC Adv. 2017, 7, 48925–48933. [Google Scholar] [CrossRef] [Green Version]
- de Weerdt, K.; Plusquellec, G.; Belda Revert, A.; Geiker, M.R.; Lothenbach, B. Effect of carbonation on the pore solution of mortar. Cem. Concr. Res. 2019, 118, 38–56. [Google Scholar] [CrossRef]
- Hargis, C.W.; Lothenbach, B.; Müller, C.J.; Winnefeld, F. Carbonation of calcium sulfoaluminate mortars. Cem. Concr. Compos. 2017, 80, 123–134. [Google Scholar] [CrossRef]
- Yamazaki, Y.; Kim, J.; Kadoya, K.; Hama, Y. Physical and Chemical Relationships in Accelerated Carbonation Conditions of Alkali-Activated Cement Based on Type of Binder and Alkali Activator. Polymers 2021, 13, 671. [Google Scholar] [CrossRef]
- Bernal, S.A. Microstructural Changes Induced by CO2 Exposure in Alkali-Activated Slag/Metakaolin Pastes. Front. Mater. 2016, 3. [Google Scholar] [CrossRef] [Green Version]
- Shi, Z.; Lothenbach, B.; Geiker, M.R.; Kaufmann, J.; Leemann, A.; Ferreiro, S.; Skibsted, J. Experimental studies and thermodynamic modeling of the carbonation of Portland cement, metakaolin and limestone mortars. Cem. Concr. Res. 2016, 88, 60–72. [Google Scholar] [CrossRef]
- Ngala, V.T.; Page, C.L. Effects of Carbonation on Pore Structure and Diffusional Properties of Hydrated Cement Pastes. Cem. Concr. Res. 1997, 27, 995–1007. [Google Scholar] [CrossRef]
- Arandigoyen, M.; Bicer-Simsir, B.; Alvarez, J.I.; Lange, D.A. Variation of microstructure with carbonation in lime and blended pastes. Appl. Surf. Sci. 2006, 252, 7562–7571. [Google Scholar] [CrossRef] [Green Version]
- Lagerblad, B. Carbon Dioxide Uptake during Concrete Life Cycle: State of the Art; Swedish Cement and Concrete Research Institute: Stockholm, Sweden, 2005; ISBN 91-976070-0-2. [Google Scholar]
- Morandeau, A.; Thiéry, M.; Dangla, P. Investigation of the carbonation mechanism of CH and C-S-H in terms of kinetics, microstructure changes and moisture properties. Cem. Concr. Res. 2014, 56, 153–170. [Google Scholar] [CrossRef] [Green Version]
- Gruyaert, E.; van den Heede, P.; De Belie, N. Carbonation of slag concrete: Effect of the cement replacement level and curing on the carbonation coefficient—Effect of carbonation on the pore structure. Cem. Concr. Compos. 2013, 35, 39–48. [Google Scholar] [CrossRef]
- Chen, J.J.; Thomas, J.J.; Jennings, H.M. Decalcification shrinkage of cement paste. Cem. Concr. Res. 2006, 36, 801–809. [Google Scholar] [CrossRef]
- Ludwig, H.M. Zur Rolle von Phasenumwandlungen bei Frost- und Frost-Tausalz-Belastung von Beton. Ph.D. Thesis, Universitat (HAB) Weimar, Weimar, Germany, 1996. [Google Scholar]
- Park, S.-M.; Jang, J.-G.; Kim, G.-M.; Lee, H.-K. Strength Development of Alkali-Activated Fly Ash Exposed to a Carbon Dioxide-Rich Environment at an Early Age. J. Korean Ceram. Soc 2016, 53, 18–23. [Google Scholar] [CrossRef]
- Puertas, F.; Palacios, M.; Vázquez, T. Carbonation process of alkali-activated slag mortars. J. Mater. Sci. 2006, 41, 3071–3082. [Google Scholar] [CrossRef]
- Hunkeler, F.; von Greve-Dierfeld, S. Karbonatisierung von Beton und Korrosionsgeschwindigkeit der Bewehrung im Karbonatisierten Beton: Forschungsprojekt AGB 2013/005 auf Antrag der Arbeitsgruppe Brückenforschung (AGB), Schweiz. 2019. Available online: http://www.mobilityplatform.ch (accessed on 28 December 2021).
- von Greve-Dierfeld, S. Bemessungsregeln zur Sicherstellung der Dauerhaftigkeit XC-Exponierter Stahlbetonbauteile. Ph.D. Thesis, Technische Universität München, München, Germany, 2015. [Google Scholar]
- Hunkeler, F.; Lammar, L. Anfoderungen an den Karbonatisierungswiderstand von Betonen: Forschungsprojekt AGB 2008/012 auf Antrag der Arbeitsgruppe Brückenforschung (AGB), Schweiz. 2012. Available online: http://www.mobilityplatform.ch (accessed on 28 December 2021).
- Malhotra, V.M. Reducing CO2 emissions. Concr. Int. 2006, 28, 42–45. [Google Scholar]
- Scrivener, K. Issues in sustainability in cements and concrete. Am. Ceram. Soc. Bull. 2012, 91, 47–50. [Google Scholar]
- Trümer, A. Calcinierte Tone als Puzzolane der Zukunft: Von den Rohstoffen bis zur Wirkung im Beton; Universität Weimar: Weimar, Germany, 2019; ISBN 978-3-00-065011-6. [Google Scholar]
- Scrivener, K.; Avet, F.; Maraghechi, H.; Zunino, F.; Ston, J.; Hanpongpun, W.; Favier, A. Impacting factors and properties of limestone calcined clay cements (LC 3). Green Mater. 2019, 7, 3–14. [Google Scholar] [CrossRef] [Green Version]
- Bucher, R.; Diederich, P.; Escadeillas, G.; Cyr, M. Service life of metakaolin-based concrete exposed to carbonation. Cem. Concr. Res. 2017, 99, 18–29. [Google Scholar] [CrossRef]
- Homayoonmehr, R.; Ramezanianpour, A.A.; Mirdarsoltany, M. Influence of metakaolin on fresh properties, mechanical properties and corrosion resistance of concrete and its sustainability issues: A review. J. Build. Eng. 2021, 44, 103011. [Google Scholar] [CrossRef]
- Newlands, M.D. Development of a Simulated Natural Carbonation Test and Durability of Selected CEM II Concretes. Ph.D. Thesis, University of Dundee, Dundee, UK, 2001. [Google Scholar]
- Cordoba, G.P.; Zito, S.; Tironi, A.; Rahhal, V.F.; Irassar, E.F. Durability of Concrete Containing Calcined Clays: Comparison of Illite and Low-Grade Kaolin. In Calcined Clays for Sustainable Concrete, Proceedings of the 3rd International Conference on Calcined Clays for Sustainable Concrete, Singapore, 14 April 2020; Bishnoi, S., Ed.; Springer: Singapore, 2020; pp. 631–640. ISBN 978-981-15-2806-4. [Google Scholar]
- Achenbach, R.; Kraft, B.; Ludwig, H.-M.; Raupach, M. Dauerhaftigkeitseigenschaften von alternativen Bindemitteln. Beton- Und Stahlbetonbau 2021, 116, 775–785. [Google Scholar] [CrossRef]
- Yi, H.; Xu, G.; Cheng, H.; Wang, J.; Wan, Y.; Chen, H. An Overview of Utilization of Steel Slag. Procedia Environ. Sci. 2012, 16, 791–801. [Google Scholar] [CrossRef] [Green Version]
- Wang, Q.; Yan, P.; Mi, G. Effect of blended steel slag–GBFS mineral admixture on hydration and strength of cement. Constr. Build. Mater. 2012, 35, 8–14. [Google Scholar] [CrossRef]
- Wulfert, H.; Keyssner, M.; Ludwig, H.M.; Adamczyk, B. Metal recovery and conversion of steel slag into highly reactive cement components [Metallgewinnung und Umwandlung von LD-Schlacke in hochreaktive Zementkomponenten]. ZKG Int. 2013, 66, 34–40. [Google Scholar]
- Santos, R.M.; Ling, D.; Sarvaramini, A.; Guo, M.; Elsen, J.; Larachi, F.; Beaudoin, G.; Blanpain, B.; van Gerven, T. Stabilization of basic oxygen furnace slag by hot-stage carbonation treatment. Chem. Eng. J. 2012, 203, 239–250. [Google Scholar] [CrossRef] [Green Version]
- Vollpracht, A.; Brameshuber, W. Einbindung von Schwermetallen in Portlandzementstein: Lehrstuhl für Baustoffkunde. Ph.D. Thesis, RWTH Aachen University, Aachen, Germany, 2012. [Google Scholar]
- Jiang, Y.; Ling, T.-C.; Shi, C.; Pan, S.-Y. Characteristics of steel slags and their use in cement and concrete—A review. Resour. Conserv. Recycl. 2018, 136, 187–197. [Google Scholar] [CrossRef]
- Kaja, A.M.; Delsing, A.; van der Laan, S.R.; Brouwers, H.; Yu, Q. Effects of carbonation on the retention of heavy metals in chemically activated BOF slag pastes. Cem. Concr. Res. 2021, 148, 106534. [Google Scholar] [CrossRef]
- Aranda, M.A.G.; De La Torre, A.G. Sulfoaluminate cement. In Eco-Efficient Concrete; Elsevier: Amsterdam, The Netherlands, 2013; pp. 488–522. ISBN 9780857094247. [Google Scholar]
- Winnefeld, F.; Lothenbach, B. Hydration of calcium sulfoaluminate cements—Experimental findings and thermodynamic modelling. Cem. Concr. Res. 2010, 40, 1239–1247. [Google Scholar] [CrossRef]
- Telesca, A.; Marroccoli, M.; Pace, M.L.; Tomasulo, M.; Valenti, G.L.; Monteiro, P. A hydration study of various calcium sulfoaluminate cements. Cem. Concr. Compos. 2014, 53, 224–232. [Google Scholar] [CrossRef]
- Li, L.; Wang, R.; Zhang, S. Effect of curing temperature and relative humidity on the hydrates and porosity of calcium sulfoaluminate cement. Constr. Build. Mater. 2019, 213, 627–636. [Google Scholar] [CrossRef]
- Tan, B.; Okoronkwo, M.U.; Kumar, A.; Ma, H. Durability of calcium sulfoaluminate cement concrete. J. Zhejiang Univ. Sci. A 2020, 21, 118–128. [Google Scholar] [CrossRef]
- Möller, H. A Novel Cements Based on Hydraulic Calcium Hydrosilicates; Celitement GmbH: Paris, France, 2017. [Google Scholar]
- Provis, J.L.; van Deventer, J.S.J. (Eds.) Alkali Activated Materials: State-of-the-Art Report, RILEM TC 224-AAM; Springer: Dordrecht, The Netherlands, 2014; ISBN 978-94-007-7672-2. [Google Scholar]
- Garcia-Lodeiro, I.; Palomo, A.; Fernández-Jiménez, A.; Macphee, D.E. Compatibility studies between N-A-S-H and C-A-S-H gels. Study in the ternary diagram Na2O–CaO–Al2O3–SiO2–H2O. Cem. Concr. Res. 2011, 41, 923–931. [Google Scholar] [CrossRef]
- Provis, J.L.; van Deventer, J.S.J. Alkali Activated Materials; Springer: Dordrecht, The Netherlands, 2014; ISBN 978-94-007-7671-5. [Google Scholar]
- Garcia-Lodeiro, I.; Palomo, A.; Fernández-Jiménez, A. An overview of the chemistry of alkali-activated cement-based binders. In Handbook of Alkali-Activated Cements, Mortars and Concretes; Elsevier: Amsterdam, The Netherlands, 2015; pp. 19–47. ISBN 9781782422761. [Google Scholar]
- Bernal, S.A.; Provis, J.L.; Fernández-Jiménez, A.; Krivenko, P.V.; Kavalerova, E.; Palacios, M.; Shi, C. Binder Chemistry—High-Calcium Alkali-Activated Materials. In Alkali Activated Materials: State-of-the-Art Report, RILEM TC 224-AAM; Provis, J.L., van Deventer, J.S.J., Eds.; Springer: Dordrecht, The Netherlands, 2014; pp. 59–91. ISBN 978-94-007-7672-2. [Google Scholar]
- Zhang, J.; Shi, C.; Zhang, Z.; Ou, Z. Durability of alkali-activated materials in aggressive environments: A review on recent studies. Constr. Build. Mater. 2017, 152, 598–613. [Google Scholar] [CrossRef]
- Bernal, S.A.; Provis, J.L.; Brice, D.G.; Kilcullen, A.; Duxson, P.; van Deventer, J.S. Accelerated carbonation testing of alkali-activated binders significantly underestimates service life: The role of pore solution chemistry. Cem. Concr. Res. 2012, 42, 1317–1326. [Google Scholar] [CrossRef]
- Gluth, G.J.G.; Arbi, K.; Bernal, S.A.; Bondar, D.; Castel, A.; Chithiraputhiran, S.; Dehghan, A.; Dombrowski-Daube, K.; Dubey, A.; Ducman, V.; et al. RILEM TC 247-DTA round robin test: Carbonation and chloride penetration testing of alkali-activated concretes. Mater. Struct. 2020, 53, 131. [Google Scholar] [CrossRef]
- Pouhet, R.; Cyr, M. Studies of Natural and Accelerated Carbonation in Metakaolin-Based Geopolymer. AST 2014, 92, 38–43. [Google Scholar] [CrossRef]
- Pouhet, R.; Cyr, M. Carbonation in the pore solution of metakaolin-based geopolymer. Cem. Concr. Res. 2016, 88, 227–235. [Google Scholar] [CrossRef]
- Gökçe, H.S.; Tuyan, M.; Nehdi, M.L. Alkali-activated and geopolymer materials developed using innovative manufacturing techniques: A critical review. Constr. Build. Mater. 2021, 303, 124483. [Google Scholar] [CrossRef]
- Amran, M.; Abdelgader, H.S.; Onaizi, A.M.; Fediuk, R.; Ozbakkaloglu, T.; Rashid, R.S.; Murali, G. 3D-printable alkali-activated concretes for building applications: A critical review. Constr. Build. Mater. 2022, 319, 126126. [Google Scholar] [CrossRef]
- Xue, L.; Zhang, Z.; Wang, H. Hydration mechanisms and durability of hybrid alkaline cements (HACs): A review. Constr. Build. Mater. 2021, 266, 121039. [Google Scholar] [CrossRef]
- Wang, L.; Zhan, S.; Tang, X.; Xu, Q.; Qian, K. Pore Solution Chemistry of Calcium Sulfoaluminate Cement and Its Effects on Steel Passivation. Appl. Sci. 2019, 9, 1092. [Google Scholar] [CrossRef] [Green Version]
- Plusquellec, G.; Geiker, M.R.; Lindgård, J.; Duchesne, J.; Fournier, B.; De Weerdt, K. Determination of the pH and the free alkali metal content in the pore solution of concrete: Review and experimental comparison. Cem. Concr. Res. 2017, 96, 13–26. [Google Scholar] [CrossRef]
- Granizo, M.L.; Blanco-Varela, M.T.; Martínez-Ramírez, S. Alkali activation of metakaolins: Parameters affecting mechanical, structural and microstructural properties. J. Mater. Sci. 2007, 42, 2934–2943. [Google Scholar] [CrossRef]
- Carsana, M.; Canonico, F.; Bertolini, L. Corrosion resistance of steel embedded in sulfoaluminate-based binders. Cem. Concr. Compos. 2018, 88, 211–219. [Google Scholar] [CrossRef]
- Setzer, M.J. Entwicklung und Präzision eines Prüfverfahrens zum Frost-Tausalz-Widerstand. Weimar 1994, 40, 87–93. [Google Scholar]
- Bernal, S.A. The resistance of alkali-activated cement-based binders to carbonation. In Handbook of Alkali-Activated Cements, Mortars and Concretes; Elsevier: Amsterdam, The Netherlands, 2015; pp. 319–332. ISBN 9781782422761. [Google Scholar]
- Bernal, S.A.; Provis, J.L.; Walkley, B.; San Nicolas, R.; Gehman, J.D.; Brice, D.G.; Kilcullen, A.R.; Duxson, P.; van Deventer, J.S. Gel nanostructure in alkali-activated binders based on slag and fly ash, and effects of accelerated carbonation. Cem. Concr. Res. 2013, 53, 127–144. [Google Scholar] [CrossRef]
- Kourounis, S.; Tsivilis, S.; Tsakiridis, P.E.; Papadimitriou, G.D.; Tsibouki, Z. Properties and hydration of blended cements with steelmaking slag. Cem. Concr. Res. 2007, 37, 815–822. [Google Scholar] [CrossRef]
- Palod, R.; Deo, S.V.; Ramtekkar, G.D. Sustainable Approach for Linz-Donawitz Slag Waste as a Replacement of Cement in Concrete: Mechanical, Microstructural, and Durability Properties. Adv. Civ. Eng. 2020, 2020, 1–9. [Google Scholar] [CrossRef]
- Ma, J.; Yu, Z.; Ni, C.; Shi, H.; Shen, X. Effects of limestone powder on the hydration and microstructure development of calcium sulphoaluminate cement under long-term curing. Constr. Build. Mater. 2019, 199, 688–695. [Google Scholar] [CrossRef]
- Gastaldi, D.; Bertola, F.; Canonico, F.; Buzzi, L.; Mutke, S.; Irico, S.; Paul, G.; Marchese, L.; Boccaleri, E. A chemical/mineralogical investigation of the behavior of sulfoaluminate binders submitted to accelerated carbonation. Cem. Concr. Res. 2018, 109, 30–41. [Google Scholar] [CrossRef]
- Si, R.; Dai, Q.; Guo, S.; Wang, J. Mechanical property, nanopore structure and drying shrinkage of metakaolin-based geopolymer with waste glass powder. J. Clean. Prod. 2020, 242, 118502. [Google Scholar] [CrossRef]
- Perera, D.S.; Uchida, O.; Vance, E.R.; Finnie, K.S. Influence of curing schedule on the integrity of geopolymers. J. Mater. Sci. 2007, 42, 3099–3106. [Google Scholar] [CrossRef]
- Law, D.W.; Adam, A.A.; Molyneaux, T.K.; Patnaikuni, I.; Wardhono, A. Long term durability properties of class F fly ash geopolymer concrete. Matériaux Constr. 2015, 48, 721–731. [Google Scholar] [CrossRef]
- Criado, M.; Palomo, A.; Fernandezjimenez, A. Alkali activation of fly ashes. Part 1: Effect of curing conditions on the carbonation of the reaction products. Fuel 2005, 84, 2048–2054. [Google Scholar] [CrossRef]
- Sufian Badar, M.; Kupwade-Patil, K.; Bernal, S.A.; Provis, J.L.; Allouche, E.N. Corrosion of steel bars induced by accelerated carbonation in low and high calcium fly ash geopolymer concretes. Constr. Build. Mater. 2014, 61, 79–89. [Google Scholar] [CrossRef]
- Pasupathy, K.; Sanjayan, J.; Rajeev, P. Evaluation of alkalinity changes and carbonation of geopolymer concrete exposed to wetting and drying. J. Build. Eng. 2021, 35, 102029. [Google Scholar] [CrossRef]
- Myers, R.J.; Bernal, S.A.; Gehman, J.D.; van Deventer, J.S.; Provis, J.L. The Role of Al in Cross-Linking of Alkali-Activated Slag Cements. J. Am. Ceram. Soc. 2015, 98, 996–1004. [Google Scholar] [CrossRef]
- Myers, R.J.; Bernal, S.A.; Provis, J.L. Phase diagrams for alkali-activated slag binders. Cem. Concr. Res. 2017, 95, 30–38. [Google Scholar] [CrossRef]
- Li, N.; Shi, C.; Wang, Q.; Zhang, Z.; Ou, Z. Composition design and performance of alkali-activated cements. Mater. Struct. 2017, 50. [Google Scholar] [CrossRef]
- Collins, F.; Sanjayan, J. Effect of pore size distribution on drying shrinking of alkali-activated slag concrete. Cem. Concr. Res. 2000, 30, 1401–1406. [Google Scholar] [CrossRef]
- Puertas, F.; Fernández-Jiménez, A.; Blanco-Varela, M. Pore solution in alkali-activated slag cement pastes. Relation to the composition and structure of calcium silicate hydrate. Cem. Concr. Res. 2004, 34, 139–148. [Google Scholar] [CrossRef]
- Bernal, S.A.; Ke, X.; Criado, M.; Mundra, S.; Provis, J.L. Factors controlling carbonation resistance of alkali-activated materials. In Special Publication 320, Proceedings of the 10th ACI/RILEM International Conference on Cementitious Materials and Alternative Binders for Sustainable Concrete, Montreal, QC, Canada, 2–4 October 2017; Tagnit-Hamou, A., Ed.; American Concrete Institute: Farmington Hills, MI, USA, 2017; pp. 361–3610. ISBN 0193-2527. [Google Scholar]
- Li, N.; Farzadnia, N.; Shi, C. Microstructural changes in alkali-activated slag mortars induced by accelerated carbonation. Cem. Concr. Res. 2017, 100, 214–226. [Google Scholar] [CrossRef]
Figure 1.
Layer images after seven days of hydration. (A) layer image CC I after 7 d hydration on paste samples; (B) layer image LD I after 7 d hydration on paste samples; (C) layer image CA I after 7 d hydration on paste samples; (D) layer image C-S-H I after 7 d hydration on paste samples; (E) layer image Geo FA I after 7 d hydration on paste samples; (F) layer image Geo MK I after 7 d hydration on paste samples; (G) layer image AAS I after 7 d hydration on paste samples; (H) layer image AAS II I after 7 d hydration on paste samples.


Figure 2.
pH of the pore solution at age 7 d and 28 d.

Figure 3.
Pore volume of hydrated and carbonated paste samples.

Figure 4.
Carbonate phase content during carbonation of cement paste samples.

Figure 5.
Pore size distributions of hydrated and carbonated alternative binders. (A) Pore size distribution of hydrated and carbonated reference cement (Ref I); (B) Pore size distribution of hydrated and carbonated composite cements (LD); (C) Pore size distribution of hydrated and carbonated composite cements (CC I); (D) Pore size distribution of hydrated and carbonated composite cements (CC II); (E) Pore size distribution of hydrated and carbonated CA cement; (F) Pore size distribution of hydrated and carbonated C-S-H binder; (G) Pore size distribution of hydrated and carbonated AAMs (Geo FA); (H) Pore size distribution of hydrated and carbonated AAMs (Geo MK); (I) Pore size distribution of hydrated and carbonated AAMs (AAS I); (J) Pore size distribution of hydrated and carbonated AAMs (AAS II).


Figure 6.
SEM images of the mortar samples at the age of 28 days and carbonated. (A) Hydrated (28 d) Ref I; (B) Carbonated Ref I; (C) Hydrated (28 d) LD; (D) Carbonated LD; (E) Hydrated (28 d) CC I; (F) Carbonated CC I; (G) Hydrated (28 d) CC II; (H) Carbonated CC II; (I) Hydrated (28 d) CA; (J) Carbonated CA; (K) Hydrated (28 d) C-S-H; (L) Carbonated C-S-H; (M) Hydrated (28 d) Geo MK; (N) Carbonated Geo MK; (O) Hydrated (28 d) Geo FA; (P) Carbonated Geo FA; (Q) Hydrated (28 d) AAS I; (R) Carbonated AAS I; (S) Hydrated (28 d) AAS II; (T) Carbonated AAS II.


Figure 7.
Carbonation depth, samples stored at 1 vol.-% CO2.

Figure 8.
Carbonation depths at cement lime specimens over one year from accelerated test (1 vol.-% CO2) and regression.
Figure 8.
Carbonation depths at cement lime specimens over one year from accelerated test (1 vol.-% CO2) and regression.

Figure 9.
Comparison of calculated carbonation depths from accelerated test and measured values from air storage.
Figure 9.
Comparison of calculated carbonation depths from accelerated test and measured values from air storage.

Figure 10.
Extrapolation of the natural carbonation depths, calculated from accelerated test.

Table 1.
Overview of the binders investigated and w/b ratios.
| Group | Identifier | Description | w/b |
|---|---|---|---|
| Reference | Ref I | CEM I 42.5 N | 0.50 |
| SCMs | CC I | 30% Metaillite, 70% Ref I | 0.50 |
| CC II | 30% Metakaolin, 70% Ref I | 0.50 | |
| LD | 30% LD slag, 70% Ref I | 0.49 | |
| CA | CA | CA with tartaric acid as retarder | 0.50 |
| C-S-H | C-S-H | Celitement® | 0.40 |
| AAMs | Geo MK | Metakaolin activated by potassium silicate | 0.50 |
| Geo FA | Fly ash activated by NaOH and sodium silicate | 0.34 | |
| AAS I | GGBFS 1 activated by sodium silicate | 0.38 | |
| AAS II | GGBFS 2 activated by CEM I and Na2SO4 | 0.39 |
Table 2.
Change in portlandite, ettringite and x-ray amorphous amount over 56 d hydration.
| Portlandite (wt.-%) | Ettringite (wt.-%) | X-ray Amorphous (wt.-%) | ||||||||||
|---|---|---|---|---|---|---|---|---|---|---|---|---|
| 1 d | 7 d | 28 d | 56 d | 1 d | 7 d | 28 d | 56 d | 1 d | 7 d | 28 d | 56 d | |
| Ref I | 18 | 24 | 26 | 20 | 7 | 8 | 7 | 5 | 15 | 32 | 34 | 50 |
| CC I | 18 | 14 | 13 | 11 | 7 | 2 | 3 | 4 | 17 | 52 | 50 | 53 |
| CC II | 14 | 7 | 6 | 4 | 4 | 2 | 3 | 4 | 48 | 70 | 71 | 74 |
| LD | 13 | 19 | 21 | 19 | 6 | 4 | 3 | 2 | 25 | 36 | 41 | 52 |
| A | <1 | <1 | <1 | <1 | 34 | 50 | 52 | 40 | 15 | 2 | 0 | 26 |
| C-S-H | n.d. | n.d. | n.d. | n.d. | n.d. | n.d. | n.d. | n.d. | 85 | 85 | 90 | 88 |
| Geo MK | n.d. | n.d. | n.d. | n.d. | n.d. | n.d. | n.d. | n.d. | 50 | 50 | 49 | 54 |
| Geo FA | - | n.d. | n.d. | n.d. | - | n.d. | n.d. | n.d. | - | 75 | 80 | 78 |
| AAS I | n.d. | n.d. | n.d. | n.d. | n.d. | n.d. | n.d. | n.d. | 57 | 52 | 51 | 54 |
| AAS II | n.d. | n.d. | n.d. | n.d. | 8 | 8 | 10 | 13 | 13 | 19 | 22 | 32 |
Table 3.
Pore size distribution.
| Percentage (%) | ||||||||
|---|---|---|---|---|---|---|---|---|
| Gel Pores (<0.03 µm) | Capillary Pores (0.03 µm to 30 µm) | |||||||
| 1 d | 28 d | 56 d | 56 d + 56 d Carbo | 1 d | 28 d | 56 d | 56 d + 56 d Carbo | |
| Ref I | 14 | 62 | 49 | 53 | 86 | 38 | 51 | 47 |
| CC I | 17 | 56 | 63 | 52 | 83 | 44 | 37 | 48 |
| CC II | 21 | 91 | 87 | 51 | 79 | 9 | 13 | 49 |
| LD | 15 | 45 | 55 | 62 | 85 | 55 | 45 | 38 |
| A | 29 | 35 | 34 | 32 | 71 | 65 | 66 | 68 |
| C-S-H | 60 | 74 | 74 | 62 | 40 | 26 | 26 | 38 |
| Geo MK | 91 | 89 | 95 | 92 | 9 | 11 | 5 | 8 |
| Geo FA | n.d. | 79 | 12 | 68 | n.d. | 21 | 88 | 32 |
| AAS I | 81 | 72 | 77 | 53 | 19 | 28 | 23 | 47 |
| AAS II | 11 | 23 | 50 | 25 | 89 | 77 | 50 | 75 |
Table 4.
Carbonation coefficients for acc. carbonation (1 vol.-% CO2), coefficient of determination and calculated carbonation coefficient for natural carbonation (400 ppm).
Table 4.
Carbonation coefficients for acc. carbonation (1 vol.-% CO2), coefficient of determination and calculated carbonation coefficient for natural carbonation (400 ppm).
| KACC | R2 | KNAC | |
|---|---|---|---|
| - | |||
| Ref I | 4.8 | 0.97 | 1.0 |
| LD | 4.7 | 0.96 | 0.9 |
| CC I | 15.9 | 1.0 | 3.2 |
| CC II | 10.3 | 1.0 | 2.1 |
| A | 25.2 | 0.99 | 5.0 |
| C-S-H | 19.1 | 0.98 | 3.8 |
| Geo MK | - | - | - |
| Geo FA | 22.5 | 0.99 | 4.5 |
| AAS I | 37.4 | 1.0 | 7.5 |
| AAS II | 61.1 | - | 12.2 |
Publisher’s Note: MDPI stays neutral with regard to jurisdictional claims in published maps and institutional affiliations. |
© 2022 by the authors. Licensee MDPI, Basel, Switzerland. This article is an open access article distributed under the terms and conditions of the Creative Commons Attribution (CC BY) license (https://creativecommons.org/licenses/by/4.0/).
Share and Cite
MDPI and ACS Style
Kraft, B.; Achenbach, R.; Ludwig, H.-M.; Raupach, M. Hydration and Carbonation of Alternative Binders. Corros. Mater. Degrad. 2022, 3, 19-52. https://0-doi-org.brum.beds.ac.uk/10.3390/cmd3010003
AMA Style
Kraft B, Achenbach R, Ludwig H-M, Raupach M. Hydration and Carbonation of Alternative Binders. Corrosion and Materials Degradation. 2022; 3(1):19-52. https://0-doi-org.brum.beds.ac.uk/10.3390/cmd3010003
Chicago/Turabian StyleKraft, Bettina, Rebecca Achenbach, Horst-Michael Ludwig, and Michael Raupach. 2022. "Hydration and Carbonation of Alternative Binders" Corrosion and Materials Degradation 3, no. 1: 19-52. https://0-doi-org.brum.beds.ac.uk/10.3390/cmd3010003