1. Introduction
Generally in a room for speech auditoria, such as a meeting room or classroom, it is equally important to guarantee a sustainable and never excessive vocal effort of the speaker [
1,
2,
3] and a good speech intelligibility for the audience [
4]. Speech intelligibility strongly depends on Reverberation Time (T) and on speech-signal-to noise ratio [
5] and it is usually quantified with acoustical parameters such as the Speech Transmission Index (STI) [
6] or Clarity (C
50) [
7]. The passive acoustics elements employed to control Reverberation Time are sound absorbers and diffusers. The role of sound absorbers is the reduction of the reverberation tail and consequently the reduction of the reverberant sound level, while sound diffusers allow for a uniformly distributed sound energy in the room [
8], the prevention of disturbing echoes as well as the undesirable focusing of sound and the acoustic glare [
9]. Further, the positive effects of sound diffusers depend on the position of the source, the receiver and the diffusers themselves [
10] and on the degree of scattering properties [
11]. It has also been found that the alternation between absorptive and reflective zones improves sound diffusion and that sound absorbers improve subjectively perceived speech quality slightly more than diffusers [
12].
The choice of the typology, extension and position of acoustic surfaces in a room depends on the specific acoustical requirements. For example, for concert halls and auditoria where high reverberation times are expected, there is more need for specular and diffuse reflections than sound absorption. On the contrary, rooms for speech require a high degree of sound absorption combined with some diffuse reflections. When noise control is the problem, then the emphasis is most entirely given to sound absorption [
13].
This research is focused on the investigation of the optimal placement of sound absorbing and sound diffusive material for the effective acoustic design of two medium sized meeting rooms characterized by poor acoustic conditions. Different solutions for each room are presented: only sound absorbing panels on one side and a combination of sound absorbers and diffusers on the other side. Room acoustics conditions of the unoccupied untreated rooms has been characterized by acoustic measurements performed with two different software with the aim to detect possible differences in the results, as stated in the literature for some parameters. This data was necessary to calibrate the geometrical acoustics (GA) simulation models of the two rooms. The configurations for the placement of the acoustic materials in the meeting rooms were chosen starting from a large review of the literature, presented below. Optimal solutions were therefore obtained from the simulation based on the optimal values of the acoustic parameters for voice communication.
2. Literature Review on the Effect of the Placement of Acoustics Materials in Rooms for Speech
Particular attention has been paid in literature on the optimal location of acoustic materials for sound treatments [
9,
14,
15,
16], but there is still a lot of research running on this topic and no final conclusions have been drawn. In the following, some advices are given as a summary of useful guidelines that come from recent literature and standards have been listed, mainly coming from measurements in real classrooms or in scale models. However, it emerges that systematic research in the laboratory or in-field, where the different conditions can be changed and tested in a controlled environment, is still missing. It can be noticed that most of the literature is focused on classrooms or speech auditoria, thus the lack of literature becomes more critical if we consider specific environments, such as meeting rooms.
According to the DIN 18041 (2016) standard [
17], it is a good practice to place more absorbing material towards the back of the room and to leave the areas close to the sound source quite reflective, in order to direct strong useful reflections towards the rear part of the room, and thus allowing for an increase in the sound level where the direct sound decreases.
Through laboratory experiments in a simulated classroom, Bistafa and Bradley [
18] found that the concentration of sound-absorbing materials either on the ceiling or the walls produces longer reverberation times than in the case of a more uniform distribution over all of the room surfaces.
Choi (2013) [
14] investigated the application of periodic type diffusers to improve classroom acoustics and proposes an optimum combination of absorptive and diffusive treatments to achieve optimal conditions. Measurements were carried out in a 1/10 scale model classroom built in 10 mm thick expanded PVC board, where different amounts of absorptive and diffusive materials were added to one or more surfaces of the room. The results showed that the application of sound absorptive materials on the entire ceiling and sound diffusers on each wall increased Clarity C
50 [
7], i.e., the early-to-late arriving sound ratio values. Moreover, a combined coverage of the ceiling with diffusive (25%) and absorptive (75%) materials was more beneficial than a full coverage of the ceiling with absorptive materials. The placement of sound diffusers on the front wall leads to significant improvements with respect to their placement on the rear and side walls. Further, adding diffusers on the ceiling and on the lower front wall or side wall and adding diffusers on the ceiling and absorptive materials on the lower front wall were found to be the most successful treatments for classroom acoustic design.
With experimental studies in a typical classroom, Sala and Viljanen (1995) [
16] found that speech intelligibility evaluated with the RASTI method [
6] is maximized when two out of six surfaces are treated with porous material in a classroom, and particularly up to 30% of the back wall and the ceiling total surfaces.
Cucharero et al. (2019) [
9] performed acoustic measurements to evaluate the impact of the placement of sound absorptive porous material in a typical classroom. The results demonstrated that when a certain diffusion is ensured in the classroom, corners, followed by any edge between walls and ceiling, are the less efficient positions of porous material in terms of reduction of Reverberation Time and increase in speech intelligibility. In this case, the placement of acoustic material in the middle of the ceiling provided the best acoustic condition for speech. On the contrary, the most efficient position of absorbing material in the case of low diffusion in the room is on the upper part of the back and side walls. Thus, the efficiency of porous materials to dissipate sound energy depends on the diffuseness of the sound and in presence of diffusers hung to the ceiling; the placement of porous sound absorbers at the boundaries of the walls may lead to the use of larger amount of sound-absorbing material to achieve a specific Reverberation Time.
Mir and Abdou (2005) [
15] investigated the optimal overall configurations of sound-absorbing material placement and characteristics in order to enhance the listening conditions in simulated classrooms. For floor, walls and ceilings surfaces a good treatment configuration was designed and suggested in classrooms. Particularly, carpet should be placed on the whole surface of the floor; sound-absorptive panels should be positioned on the perimeter of the ceiling and reflective material in the central area; sound-absorbing panels should be in the upper and middle area of the walls, gypsum or smooth plaster in the lower part.
Russo and Ruggiero (2019) [
19] compared through simulations two different sound absorbing scenarios in a medium sized classroom. They concluded that treating the upper part of the wall in front of the teacher’s desk (rear wall) and partially also the upper part of the lateral walls, and adding sound absorbing material on the ceiling, leaving a central acoustically reflecting ceiling area starting from the area over the teacher’s desk, is preferable compared to a checkerboard distribution of the panels on the ceiling and on the upper part of the walls without maintaining a central reflecting area.
Campbell et al. (2019) [
20] studied experimentally the effect of different acoustical treatments in a multi-purpose room used for speech activities. Their results underlined that placing a suspended absorbing ceiling with or without carpet on the floor creates a non-diffuse sound environment which gives long reverberation times in the high frequency region due to the grazing sound field occurring parallel to sound absorbing surfaces, i.e., between two parallel walls. Inserting furniture adds some sound scattering and shortens the reverberation times due to redirection of the sound energy towards the absorbing surfaces, while an efficient way to reduce the effect of the grazing sound field is to add absorbing wall panels.
Arvidsson et al. (2019) [
21] tested diffusers optimized in the frequency range 2–4 kHz and applied on the walls of a reverberation room with absorbing ceiling. They used the equivalent scattering absorption area (Asc) to investigate the effect of the diffusers on the sound field. Asc describes the energy transfer between the grazing and non-grazing sound field. Vertically oriented diffusers gave a significantly higher equivalent scattering absorption area (Asc) than horizontally oriented diffusers, when the same number of diffusers were compared. This is explained by the direction that the sound waves are reflected in. The vertically oriented diffusers contribute with a higher extent to the diffuse sound field by disturbing the grazing field. Further, the vertically oriented diffusers direct the sound to the absorbing ceiling. With the same number of diffusers, Asc was higher for the chess pattern compared with vertical row pattern, and diffusers organized in horizontal rows gave higher values than the chess pattern. A positive correlation has been found between the Asc values and the acoustic parameter speech clarity, while a negative correlation has been found with Reverberation Time.
Since little is known about whether the treatment with diffusers or absorbers is more favorable for the subjectively perceived qualities, the aim of another study, by Sanavi et al. (2017) [
12], was twofold: the first purpose was to investigate the effect of an acoustic diffuser on the subjectively perceived quality of speech in a meeting room, while the second purpose was to determine if and in which measure there were perceptual differences if the diffuser was replaced by an acoustic absorber. The results showed that the room equipped with diffusers outperformed the initial condition without diffusers. Indeed, diffusers uniformly spread the reflected sound energy, thus being a remedial measure to control flutter echo. On the other side, the perception of the room equipped with absorbers resulted better than the same room equipped with diffusers.
An important outcome that is common to all the referred studies is that absorbers would lead to an overdamping when diffusive surfaces are neglected [
14,
22]. Treating the rooms also with diffusers allows the sound energy to be conserved in the room [
20,
23]. By using acoustic absorbers only, indeed, the unwanted reflections are substantially suppressed and do no longer contribute, positively or negatively, to the sound field. The current study aims to further deepen the matter of the optimal position of sound absorbers in a room, joined with sound diffusers. This is one of the first attempts to answer the question with the final aim to obtain optimal room acoustics, particularly referring to speech intelligibility, in typical medium sized meeting rooms.
Guidelines on the optimal placement of absorbing, diffusive and reflective materials in a room for speech which will be the reference for our study are summarized below, based on the previously presented literature:
- (1)
To avoid the risk of disturbing flutter echoes in rooms with a rectangular ground plan and in conditions with plane and parallel walls with no interruptions by furniture, a central sound reflecting area in the ceiling is recommended and the walls should be partially sound absorptive as compensation [
17];
- (2)
A ceiling with a fully sound absorptive surface can be used in combination with a fully sound absorptive rear wall [
17];
- (3)
A combined coverage of the ceiling with diffusive (25%) and absorptive (75%) materials is more beneficial than a full coverage of the ceiling with absorptive materials [
14];
- (4)
Adding absorptive material on the entire ceiling area and diffusers on the front or side wall is beneficial for achieving higher speech clarity [
14];
- (5)
Adding diffusers on the ceiling and on the lower front wall or side wall and adding diffusers on the ceiling and absorptive materials on the lower front wall leads to better acoustical conditions for speech than adding absorptive materials on the entire ceiling [
14];
- (6)
The most efficient positions of sound absorptive material in the case of low sound diffusion in the room is the upper part of the back and side walls [
9];
- (7)
When the sound field is more diffuse, placing absorbing materials at the junctions between walls and ceiling, especially at the corners, results in the less efficient acoustic treatment, while the best placement of absorbers is in the middle of the ceiling [
9];
- (8)
Applying absorbing material around a reflective area on the ceiling and on the upper and middle area of the walls in classrooms improves listening conditions, limits amplification of internally generated noise and results in a good acoustical uniformity throughout the classroom [
15];
- (9)
A combination of diffusers and absorbers is usually recommended as a treatment in small rooms, where reflections between parallel walls may cause coloration and flutter echoes [
12].
3. Materials and Methods
Figure 1 depicts the two meeting rooms of the Politecnico di Torino, Italy, chosen as case studies. The investigation has been performed in two phases. First, the untreated rooms have been acoustically characterized with in-field measurements according to the ISO 3382-1 (2009) [
12]. In this phase the main acoustical parameters for room acoustics quality assessment have been obtained and the values compared to typical or optimal ones [
24]. In a second phase, the meeting rooms were modeled, and the acoustics has been simulated and optimized with the geometrical acoustics (GA) based software ODEON 15 (2020) [
25]. Two typologies of panels, one absorbing and one absorbing and diffusive, were applied to the ceiling and the walls of the meeting rooms following the guidelines described in the scientific literature. Reverberation Time, Clarity and Speech Transmission Index were used as benchmark parameters in order to investigate the optimal acoustic conditions.
3.1. Case Studies
Meeting room 1 (Mr1) has a rectangular shape and a volume of 520 m
3 (
Figure 1a). It is used as a meeting and conference room and is equipped for multimedia presentations with immersive virtual reality. The measurements were taken in closed doors conditions, in order to exclude the volume behind the screen. No relevant furniture was present in the room during measurements. The meeting room 2 (Mr2) has a rectangular floor with a hip vaulted ceiling and reaches a volume of 298 m
3 (
Figure 1b). The main acoustic feature of the Mr2 is the shape of the ceilings which is supported by a reticular plastered-concrete beam system. Big desks, light upholstered chairs and a wooden wardrobe were present in the room during the measurements.
3.2. Parameters for Room Acoustics Quality and Typical Values
According to the ISO 3382-1 standard [
7], the Reverberation Time was once regarded as the predominant indicator of acoustical quality of a room for music or speech. While Reverberation Time continues to be regarded as a significant parameter, there is agreement that other measures such as early/late energy ratios, specific intelligibility indexes and background noise level, are needed for a more complete evaluation of the acoustical quality of rooms for speech.
The Reverberation Time (T), in seconds, is the measure of time elapsing between the disarming of a sound source and the moment when the sound level is decreased by 60 dB. Reverberation Time can be evaluated based on a smaller dynamic range than 60 dB and extrapolated to a decay time of 60 dB. Particularly, Reverberation Time is evaluated from the time at which the decay curve reaches 5 dB and 25 dB below the initial level for T
20, and 5 dB and 35 dB for T
30, respectively. The DIN 18041 standard [
17] defines optimal T values according to the different activities in a room for speech or music, the room volume and the frequency in octave bands. The standard always refers to occupied rooms. The following equation is applied to calculate optimal occupied T values in the frequency range 0.125 kHz–4 kHz in case of meeting rooms, starting from the volume V or the room itself:
The Early Decay Time (EDT), in seconds, is obtained from the Reverberation Time decay curve, if a decay time from 0 dB to 10 dB below the initial level is used, extrapolated to a decay time of 60 dB. According to ISO 3382-1 standard, a typical range is found between 1.0 s and 3.0 s, but these typical values are referred to halls and performance spaces and there are no indications for rooms used for speech. The detailed behavior of the early part of the reverberation curve is influenced by the relative levels and distribution in time of the early reflections, which in turn vary depending on the positions of the source and receiver in the room. Likewise, the value of EDT is often found to vary throughout a hall, which is seldom the case of Reverberation Time T.
The Clarity (C
50), expressed in decibels, describes the feeling of clearly perceiving speech, depending on the distance of the sound receiving point from the source and it is strongly sensitive to the spatial variation. It is obtained according to the following formula, were
p(t) is the instantaneous sound pressure of the impulse response measured at the measurement point:
Typical values of the C
50 vary between −1 and 1 dB, referred to performance spaces and rooms designed for music [
7], while recently the new Italian standard UNI 11532-2 [
24] refers to optimal values as C
50, 0.5–2 kHz ≥ 2 dB in unoccupied rooms used for speech with volumes lower than 250 m
3.
The Background Noise Level is one of the most important factors affecting speech intelligibility and it is usually measured as equivalent A-weighted overall level over a time period of 5 min when the room is unoccupied [
26]. Its measurement procedure follows the ISO 1996-2 standard [
27].
The Speech Transmission Index is an objective measure to predict speech intelligibility from a talker to a listener by a transmission channel. STI determines the degree to which the intensity envelope of the speech signal is affected by a transmission channel (room reverberation and noise). The indirect STI measurement method uses the octave band impulse response and the signal-to-noise-ratio to derive the modulation transfer function [
6]. STI produces a metric on a scale of 0 to 1, based on the weighted contributions from the range of octave bands present in speech, from 0.125 kHz to 8 kHz. In the case of lecture theatres, classrooms and meeting rooms, good speech intelligibility is required with STI values higher than 0.64 [
6].
3.3. Measurements
3.3.1. Equipment and Settings
Acoustic measurements in the two meeting rooms have been carried out using a NTi Audio M2210 omnidirectional microphone, an omnidirectional sound source Bruel&Kjaer 4205, a sound card Tascam US-144, a LAB 300 amplifier and a NTi Audio XL2 sound level meter.
All the measurements were performed according to the ISO standard 3382-1. The distance between two microphones’ positions was set at ≥2 m; the distance between both the microphone and the source from any reflecting surface (including the floor) was set at ≥1 m; the symmetric positions were avoided as far as possible. The source height was 1.5 m from the floor, while microphones were set at 1.2 m from the floor at the ears height of a seated person.
Figure 2 shows the layout of the measurement set-up in the two meeting rooms. The source positions were chosen in order to correspond to the effective sound source positions in the rooms. The receivers were placed with the aim to cover, in plan, the widest part of the audience. Two and three source positions were considered in Mr1 and Mr2, respectively, and 6 receivers were distributed in the larger audience area of Mr1 compared to 4 in the smaller audience area of Mr2.
Background noise measurements were taken in empty conditions when the entire buildings were unoccupied and the outdoor noise was low, in order to exclude any possible disturbing source of noise from outside the rooms. An average level lower than 40 dB (A) was measured both in the Mr1 and Mr2, respectively, as average value across all the receivers’ positions.
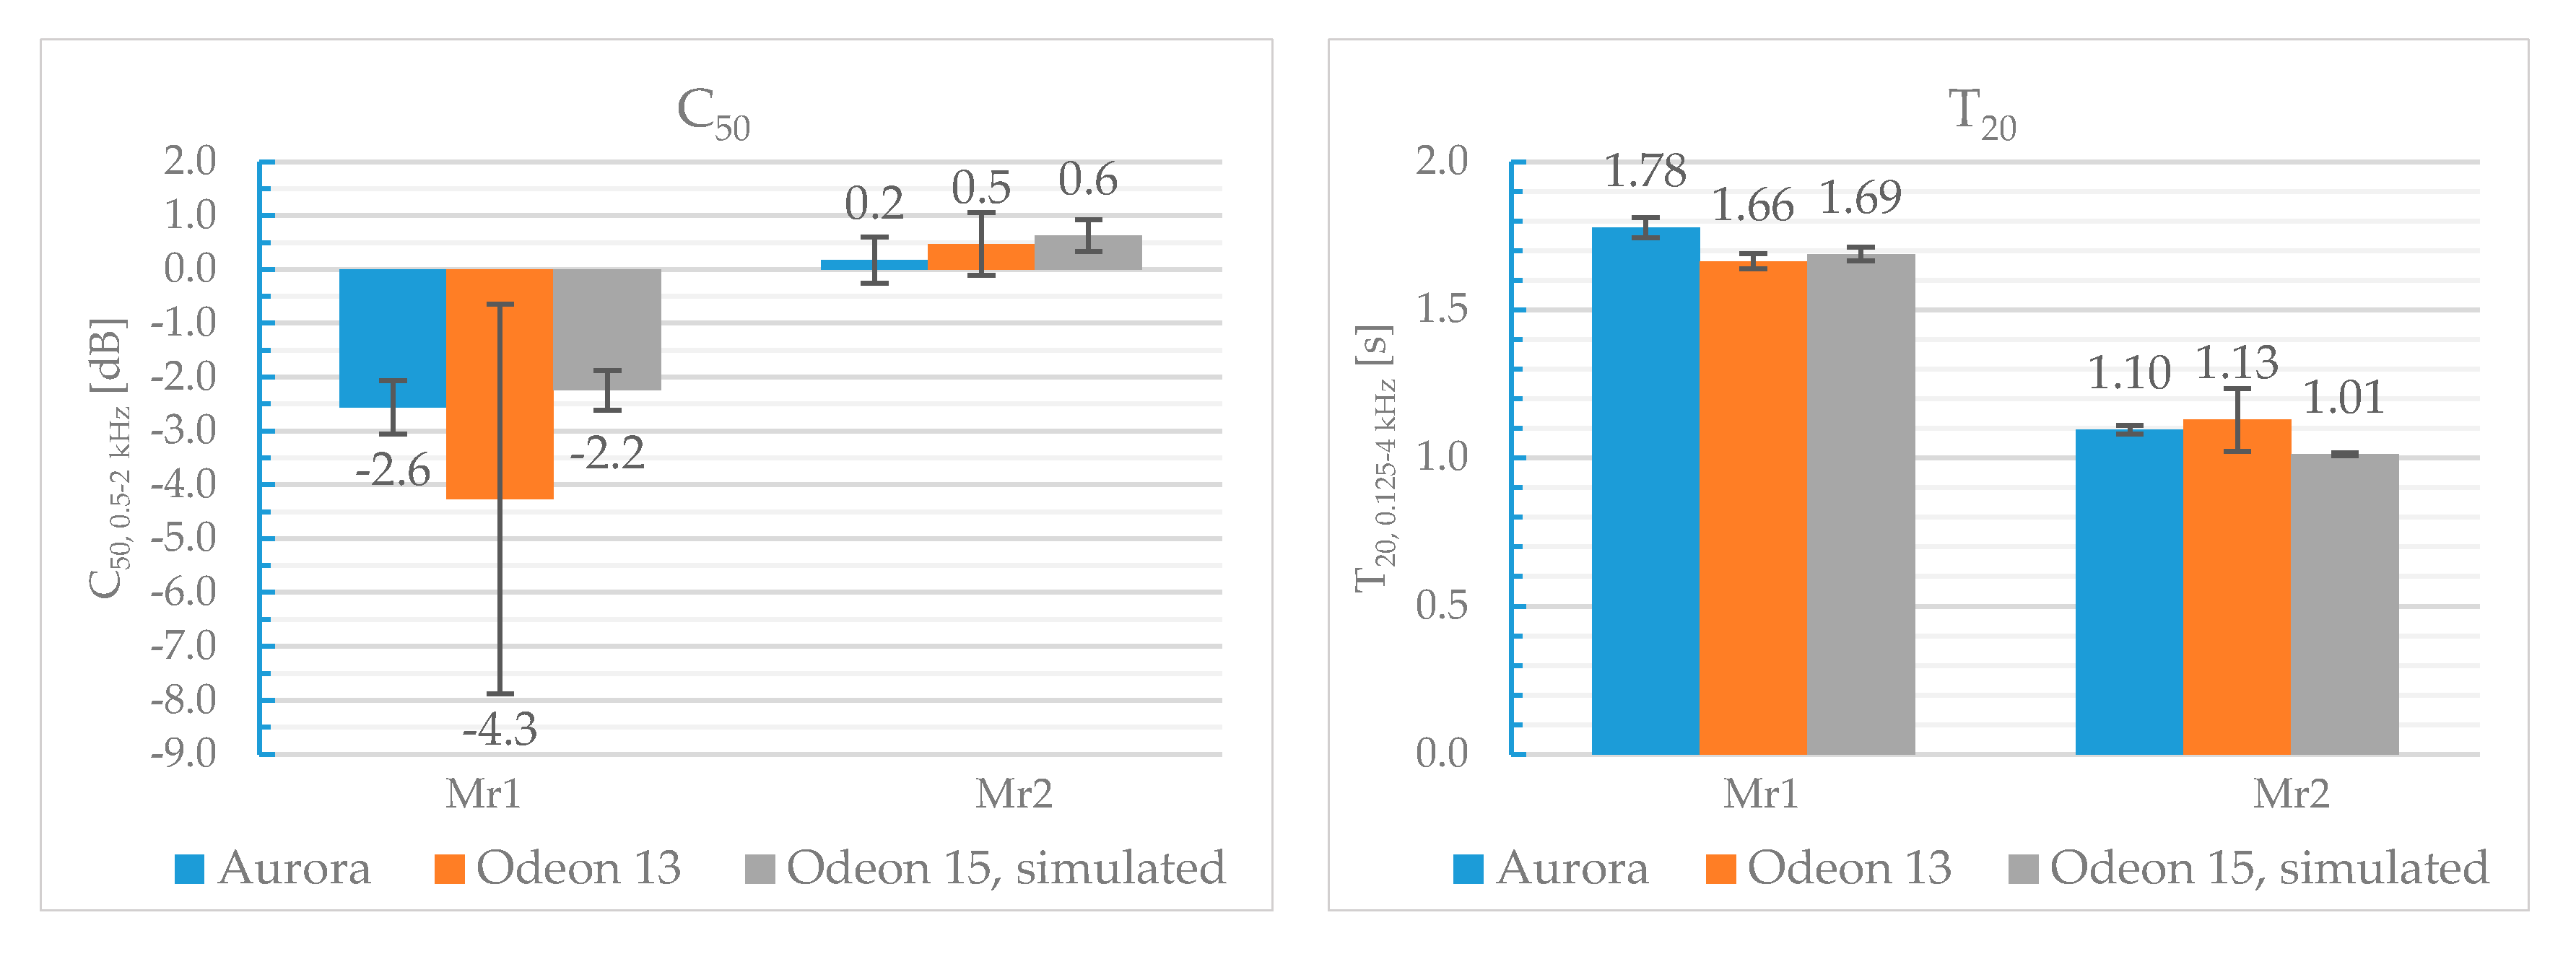
3.3.2. Analysis of the Acoustic Measurements
Two kind of software have been used for the analysis of the acoustic measurements in the meeting rooms, i.e., ODEON 13 Room Acoustic Measurement System [
28] and Aurora plug-in, version 3.0, of the Adobe Audition software [
29]. For both the systems an exponential sweep signal with a length of 8 s in the frequency range 22 Hz to 22 kHz has been used to excite the rooms. The sweep response has been then deconvolved to give the impulse response between the sound source and the microphone from which the room acoustical parameters included in the ISO 3382-1 standard [
7] have been obtained.
According to the standard ISO 3382-1, for the engineering and precision methods, the frequency range should cover at least 0.125 kHz to 4 kHz. For T
20 and EDT the results measured for the range of source and microphone positions were combined for the room as a whole to give spatial average values [
7]. This spatial averaging is achieved by arithmetic averaging of the measured or calculated values for all the independent source and microphone positions. The standard deviation was also determined to provide a measure of accuracy and the spatial variability of the Reverberation Time. The measurement results for EDT and C
50 should normally not be averaged over all microphone positions because the measures are assumed to describe local acoustical conditions. However, in the case of small rooms, it can be useful to have a measure that represents the spatial average across source and microphone positions, as it is specified for C
50 in the standard UNI 11532-2 [
24]. C
50 values are presented in terms of mid-frequency values by determining averages from the 0.5–2 kHz octave band range [
7,
24].
3.4. Simulations
ODEON 15 has been applied to obtain accurate room acoustics predictions [
25]. The new version of the software was used for simulations instead of the previous one (ODEON 13), as it was released after the measurement sessions. In the simulation process the first step is to import a 3D model of the room, previously drawn in a modelling software. The current used software for room modelling is SketchUp (SU), which includes an available SU2Odeon plug-in that allows users to make direct use of SU models in ODEON.
In the simulations, all the receivers (6 in the Mr1 and 4 in the Mr2) have been located at the same positions used in the measurement setup at a height of 1.2 m from the floor level. The sound source (2 positions in the Mr1 and 3 positions in the Mr2) was placed as in the measurement set up shown in
Figure 2, at the height of 1.5 m from the floor. In the simulations, except the calibration phase where an omnidirectional source has been used as in the measurement phase, a directional source as a human speaker has then been applied, in order to consider a more realistic effect on the speech intelligibility outcomes [
24].
Results are provided for different configurations of sound absorbing and sound diffusive panels described below, in terms of octave band frequency range Reverberation Time (T
20), 0.5–1 kHz octave band frequency range average Clarity (C
50), and Speech Transmission Index (STI). The Reverberation Time results have been spatially averaged accounting for all source and microphone positions. C
50 and STI spatial average values over the sources and receivers positions have been obtained, according with the standard UNI 11532-2 [
24]. STI was computed accounting for a normal vocal effort, i.e., 60 dB(A) at 1 m from the speaker’s mouth [
30] and the octave band background noise levels correspondent to the NC 35, which can be assumed as typical unoccupied background noise level in the rooms during normal activities [
31].
3.4.1. Calibration of the Models
An omnidirectional sound source (dodecahedron) has been located at the same positions used during the measurements stage in the two meeting rooms, for calibration purposes. Additionally, the microphones positions were left unchanged from the measurement setup shown in
Figure 2. The main input settings to perform simulations, that are the number of rays, the maximum reflection order and the transition order (TO), have been set according to the aim of study, in agreement with the assumptions and adjustments reported in Shtrepi et al. (2017) [
32]. Particularly, the number of rays, set equal to 10,000, has been estimated considering the aspect ratio of the room and the size and number of surfaces in the geometry. The transition order (TO) have been set to and 1 and the impulse response length was fixed at 10 s.
The assignment of the absorption coefficients to the different surfaces in the room was carried out by a first visual inspection of the materials in the two rooms and calibrated following a trial and error approach, that means the coefficients were firstly taken from the scientific literature and then slightly modified for each octave frequency band so that a matching between measured and simulated Reverberation Time was obtained. The scattering coefficient has been also used to characterize the diffusive behavior of materials and objects in the simulation model. It quantifies how much sound energy reflected from a surface deviates from the specular direction [
33,
34]. It is assigned at the frequency of 707 Hz (average value at 500 and 1000 Hz), according to the software manual [
25], and it was left like default value (0.1) for the reflective surfaces, and it was assumed equal to 0.6 for the chairs area.
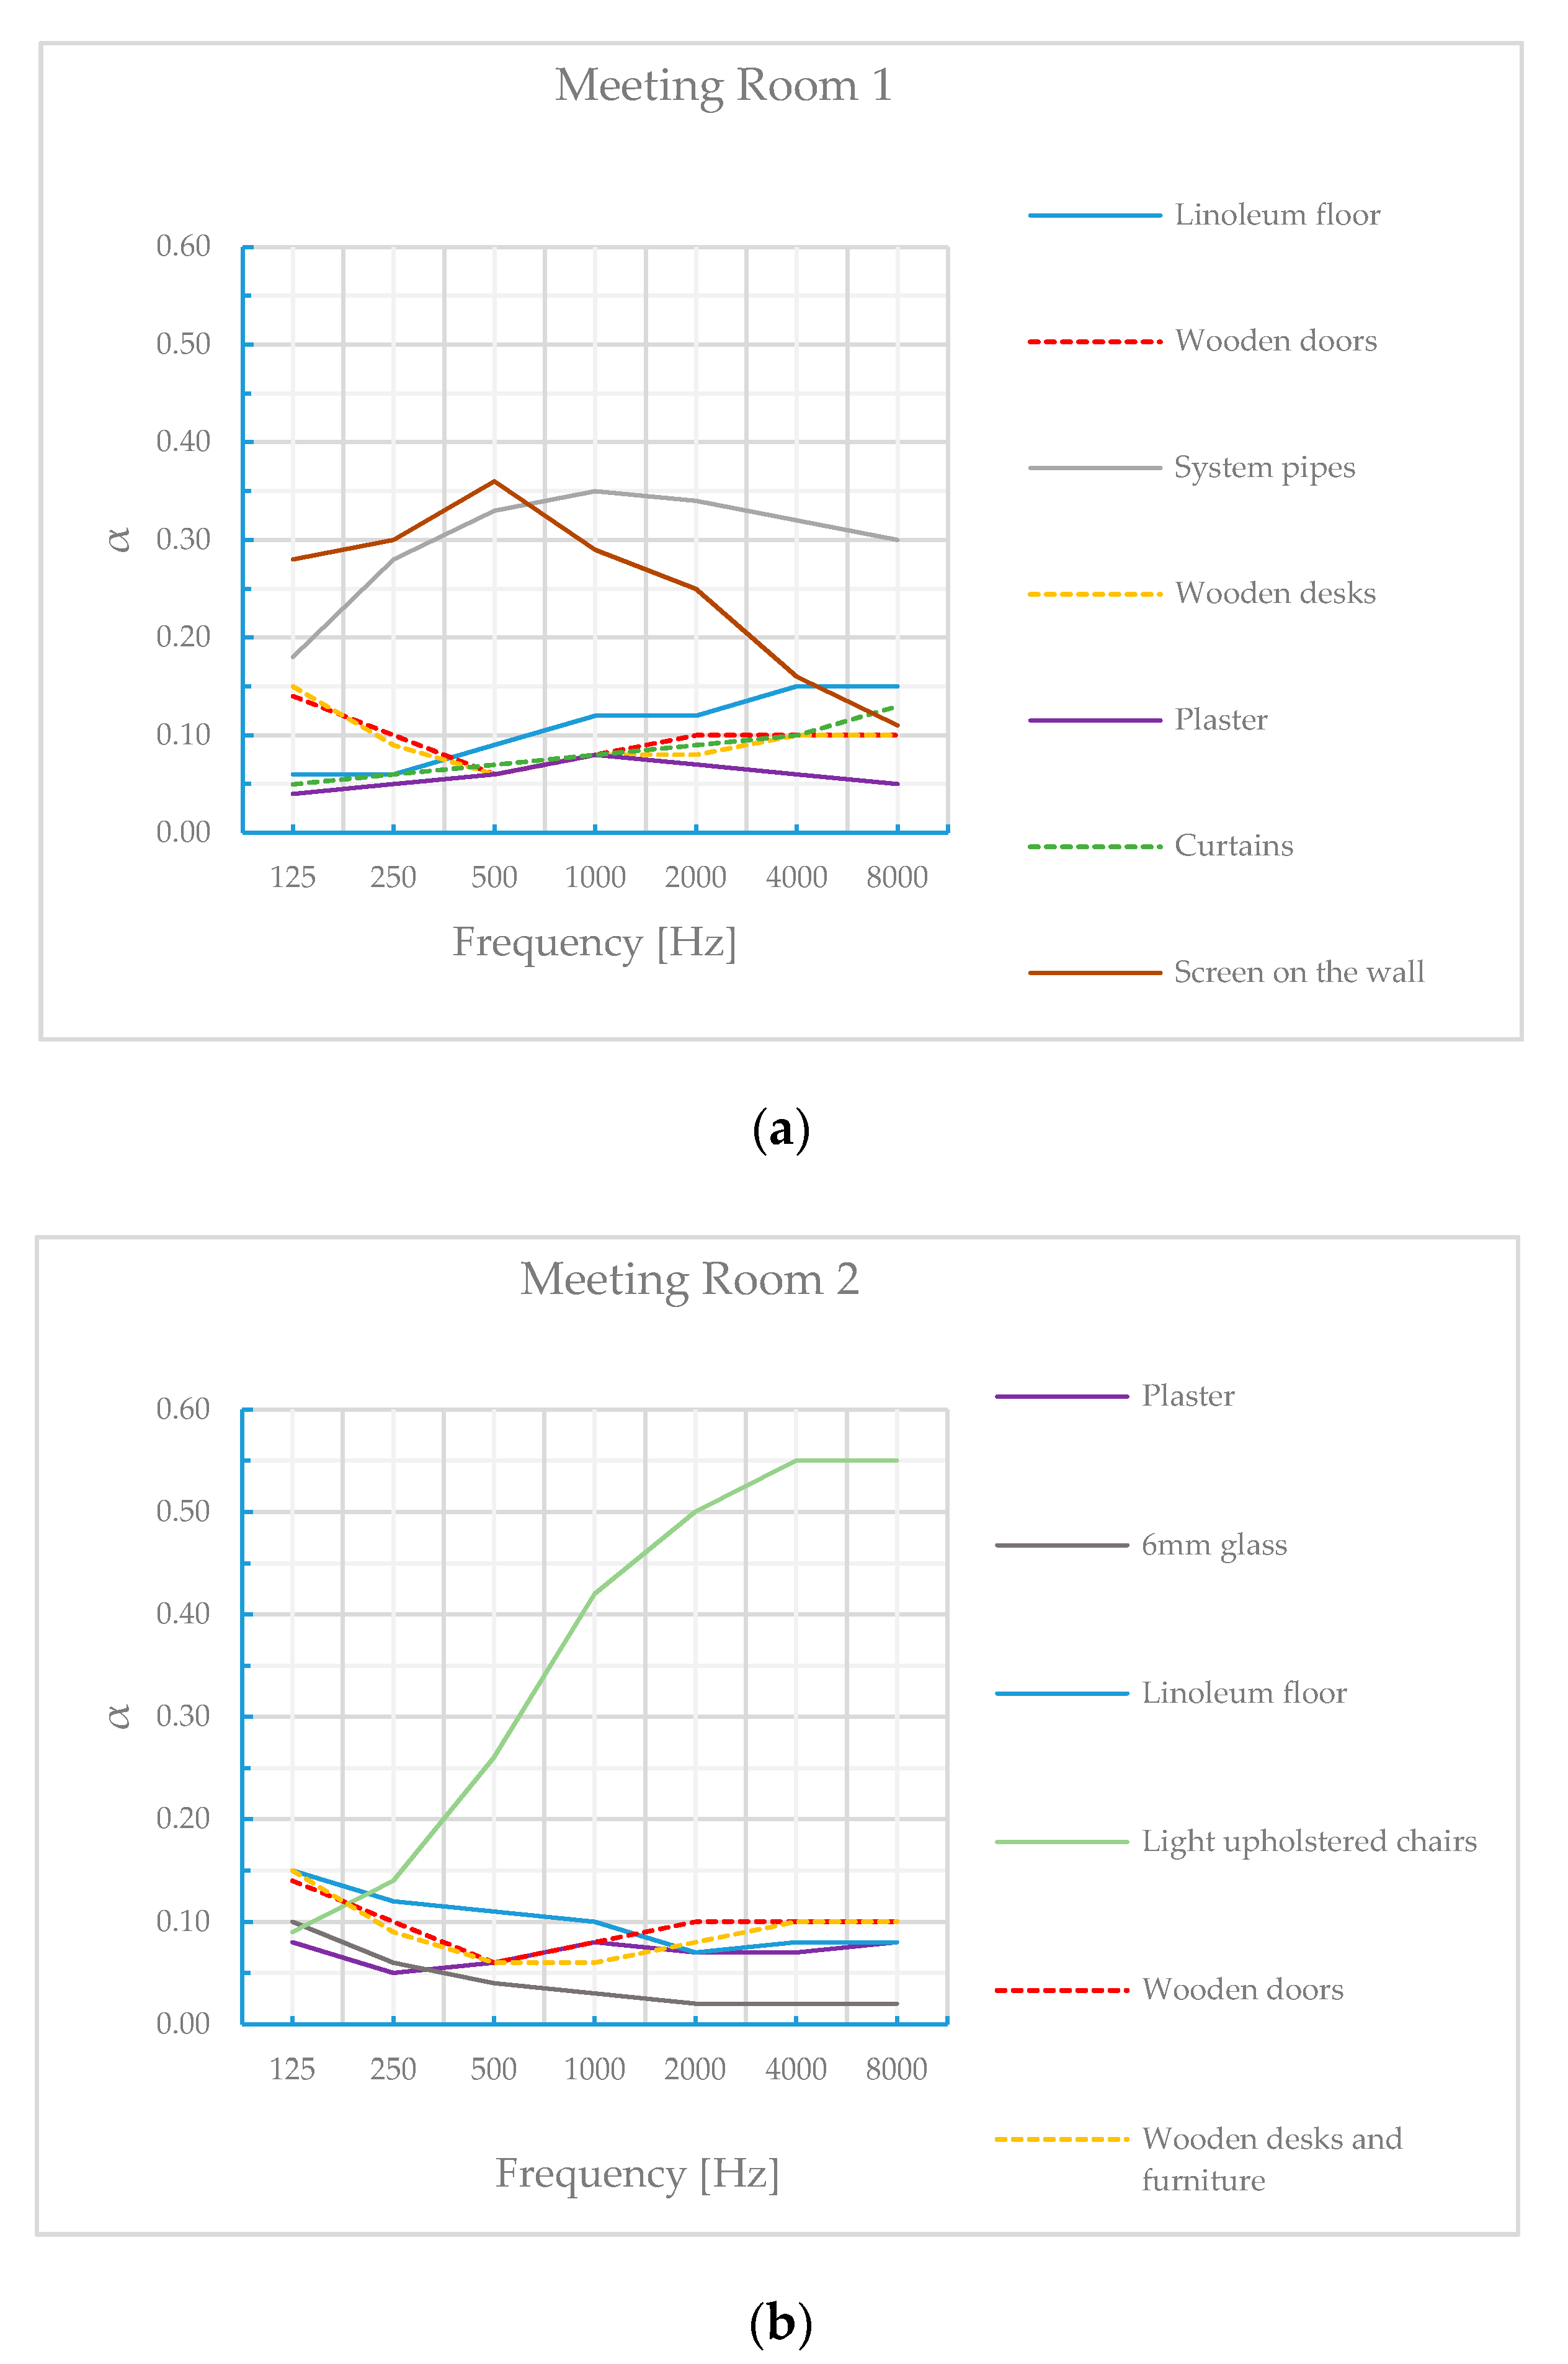
Figure 3 shows the octave band absorption coefficients of the surfaces in the two meeting rooms, after the calibration process has been carried out. The final condition allowed to us obtain differences in the ± 5% range between measured and simulated reverberation times for each octave band. Indeed, to get an effective calibration the results found with the simulation software should not exceed the JND (Just Noticeable Difference) of the Reverberation Time, i.e., 5% of the measured value [
7].
3.4.2. Optimal Area for the Acoustic Materials
After the calibration of the acoustic models, the acoustic design of Mr1 and Mr2 proceeded with the estimation of the optimal occupied Reverberation Time according to Formula (1) and then of the optimal Reverberation Time for unoccupied conditions [
24]:
where A
pers is the equivalent absorption area of the persons who overall can occupy the room, expressed in m
2 [
24]. Assuming 80% occupancy, which corresponds to an average of 10 persons in each rooms, the T
opt,unocc resulted equal to 0.72 s in Mr1 and 0.65 s in Mr2. Both results relate to average values in the frequency range 0.125–4 kHz.
A single typology of both absorptive panels and diffusive panels has been chosen for the acoustic interventions. Particularly, the sound absorptive panel is made of fiberglass, with a thickness of 40 mm and an overall depth of construction of 50 mm [
35]. This panel is often used for the acoustic design in speech auditoria. The sound diffusive panel is made of 3 overlying layers, i.e., a semi-rigid fiberglass panel, a two-dimensional reflecting grating and an acoustically transparent fabric, with a total thickness of 30 mm [
36].
Each panel has an area of 0.36 m2 (60 × 60 cm). The diffusive panels also present a relatively high sound absorption at medium frequencies, which makes them a hybrid acoustic panel.
Octave band sound absorption coefficients of the absorptive and diffusive panels are shown in
Figure 4. The weighted sound absorption index α
w is also given, that is 1.00 and 0.65 for the absorptive and diffusive panel, respectively [
37,
38].
The sound diffusion coefficient of the diffusive panel, which characterizes its performance in terms of uniformity of the reflected polar distribution in accordance with the standard AES-4id-2001 [
39], has its highest values of 0.61, 0.66 and 0.65 at the one-third octave bands 1, 1.25 and 1.6 kHz, respectively. The scattering coefficient (ISO 17497-1) [
33], suitable as an input to current diffusion algorithms in geometric room acoustic models, has been assumed equal to 0.5 at 707 Hz.
A trial and error procedure has been applied to obtain the optimal number of acoustic panels in each room starting from a baseline configuration, which is one of the most occurrent in practice, and that consists of the placement of sound absorption on the ceiling and at the upper part of the back wall (configuration
b in
Figure 5 and
Figure 6). This solution limits the occurrence of flutter echo between walls as it is expected in configuration
a where sound absorption is only placed on the ceiling [
9,
17]. The number of acoustic panels on the ceiling was increased step-by-step up to reach the optimal Reverberation Time in the range 0.125–4 kHz, with an error less than 5%. A total of 277 and 68 panels was obtained in the Mr1 and Mr2, respectively. These panels were then changed in position according to the different configurations detailed in
Section 3.4.3.
3.4.3. Configurations of the Acoustic Materials
Based on some of the guidelines reported in
Section 2, the acoustic treatments of the rooms have been designed assuming the total number of panels equal to 277 and 68 in the Mr1 and Mr2, respectively.
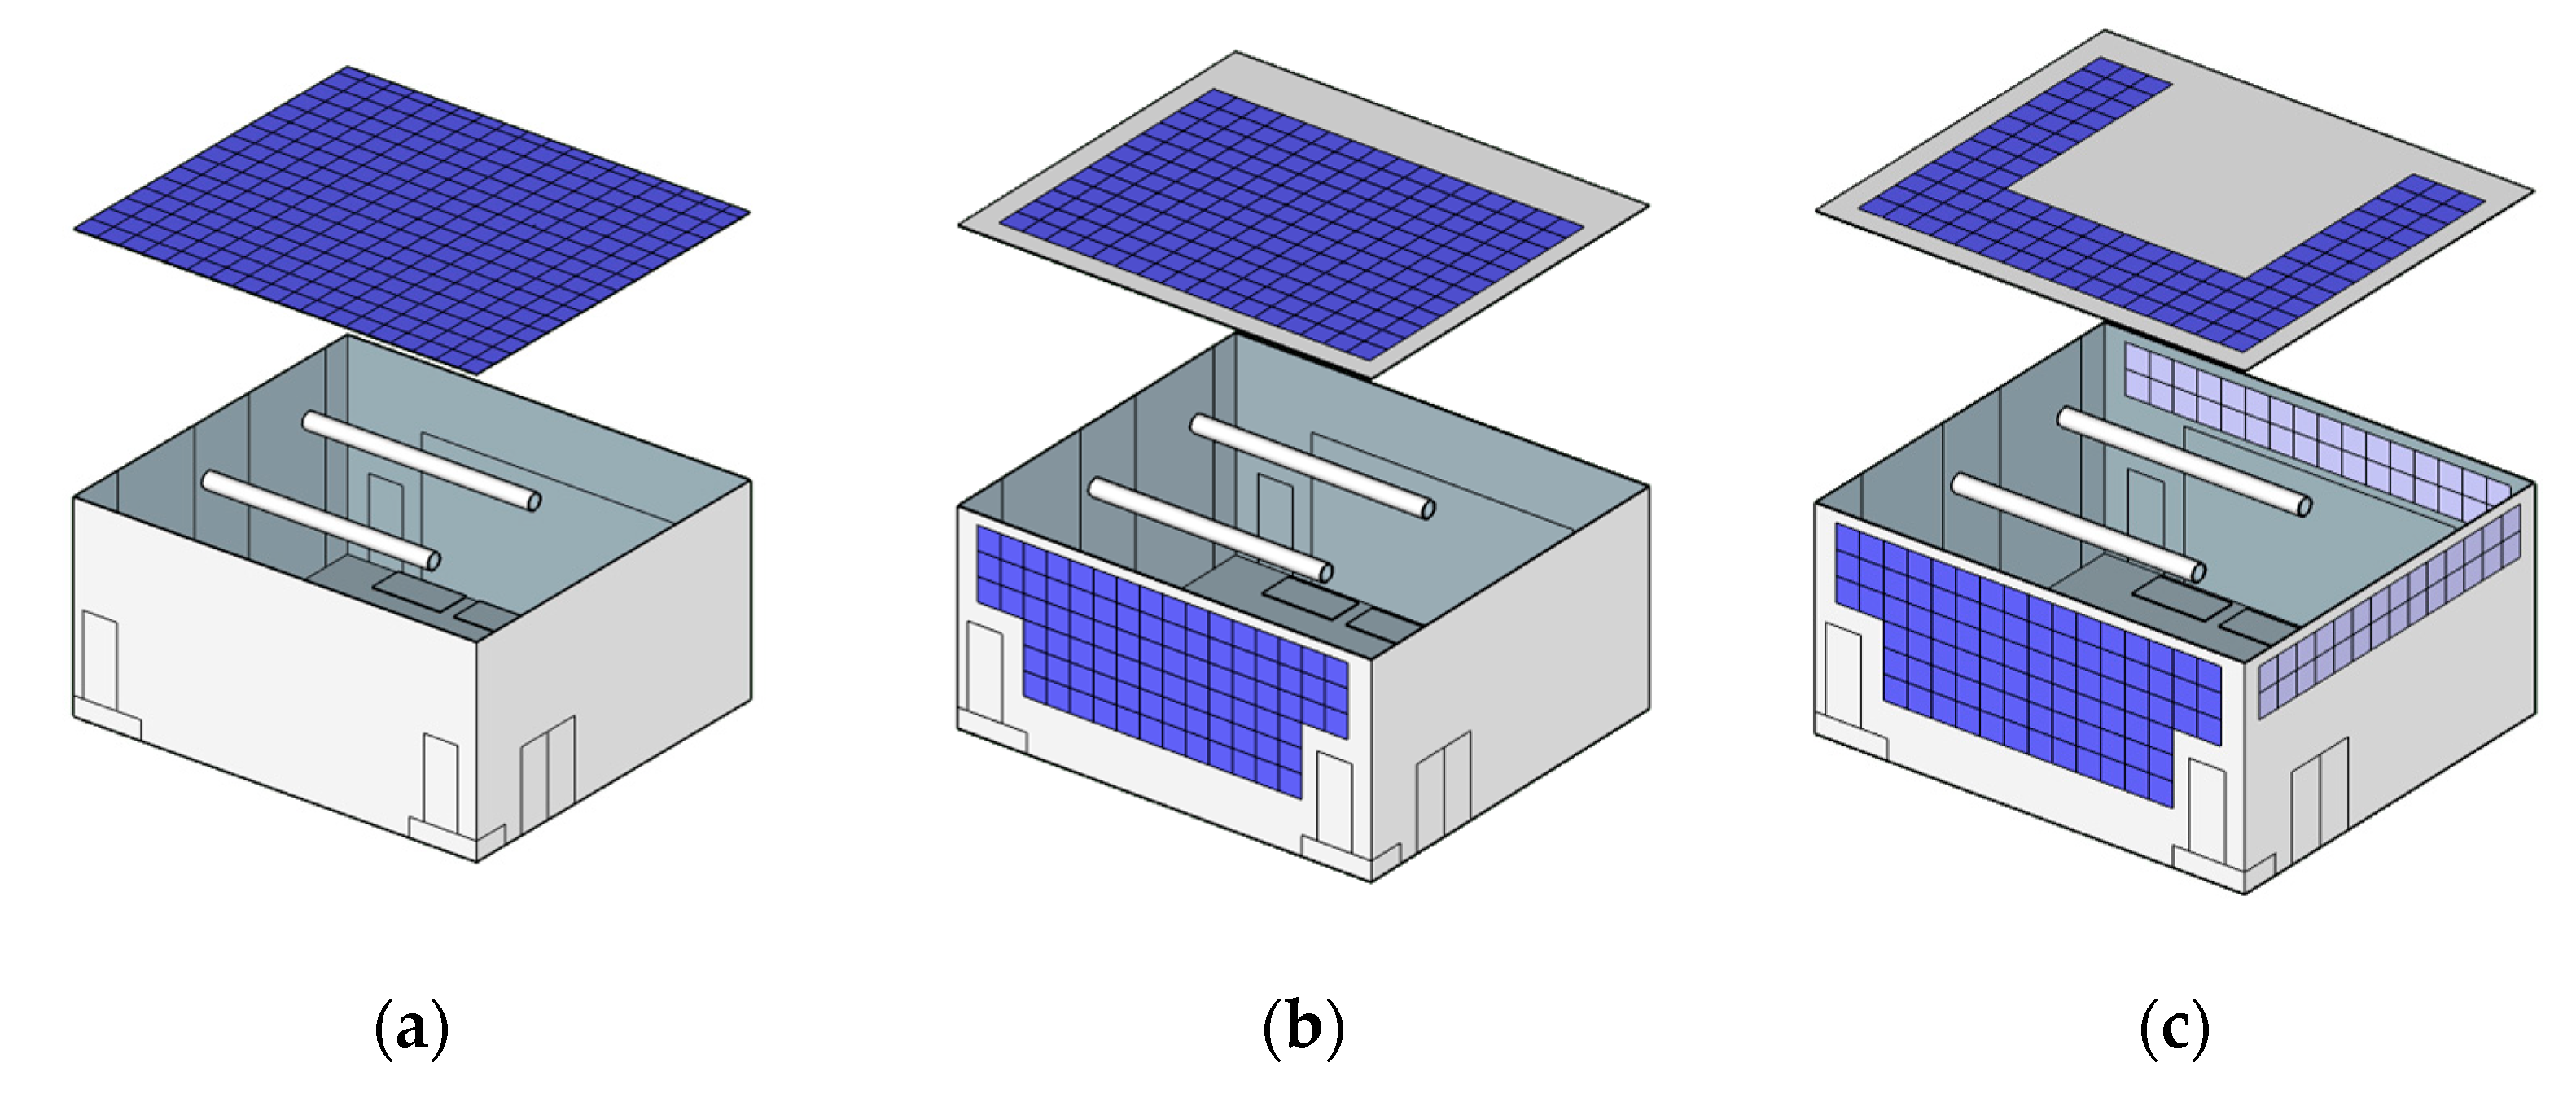
For the Mr1 five different configurations were proposed, as shown in
Figure 5. Particularly, configuration
a considers absorptive surfaces over the ceiling surface only, configuration
b considers absorptive surfaces over the ceiling and rear wall, configuration
c considers absorptive surfaces over the ceiling and rear wall and sound diffusers on the front and lateral walls, configuration
d considers absorptive and diffusive panels alternated over the ceiling, rear and lateral walls, and configuration
e considers absorbers only, placed on the ceiling and over three out of four lateral walls. Configuration
a is a standard one (also the less expensive), which is more often put in practice. Configuration
b is the reference configuration and complies with guideline 2. Configuration
c complies with guideline 1 in
Section 2, and partially with guidelines 4, 8 and 9. Configuration
d complies with guideline 9 and partially with guidelines 3 and 5, even it was not possible to place diffusers or absorptive materials on the lower part of the front wall in the case of Mr1. The constraint is based on the need of having the panels at a certain minimum height from the floor for cleaning reasons. Finally, configuration
e complies with guidelines 1 and 8.
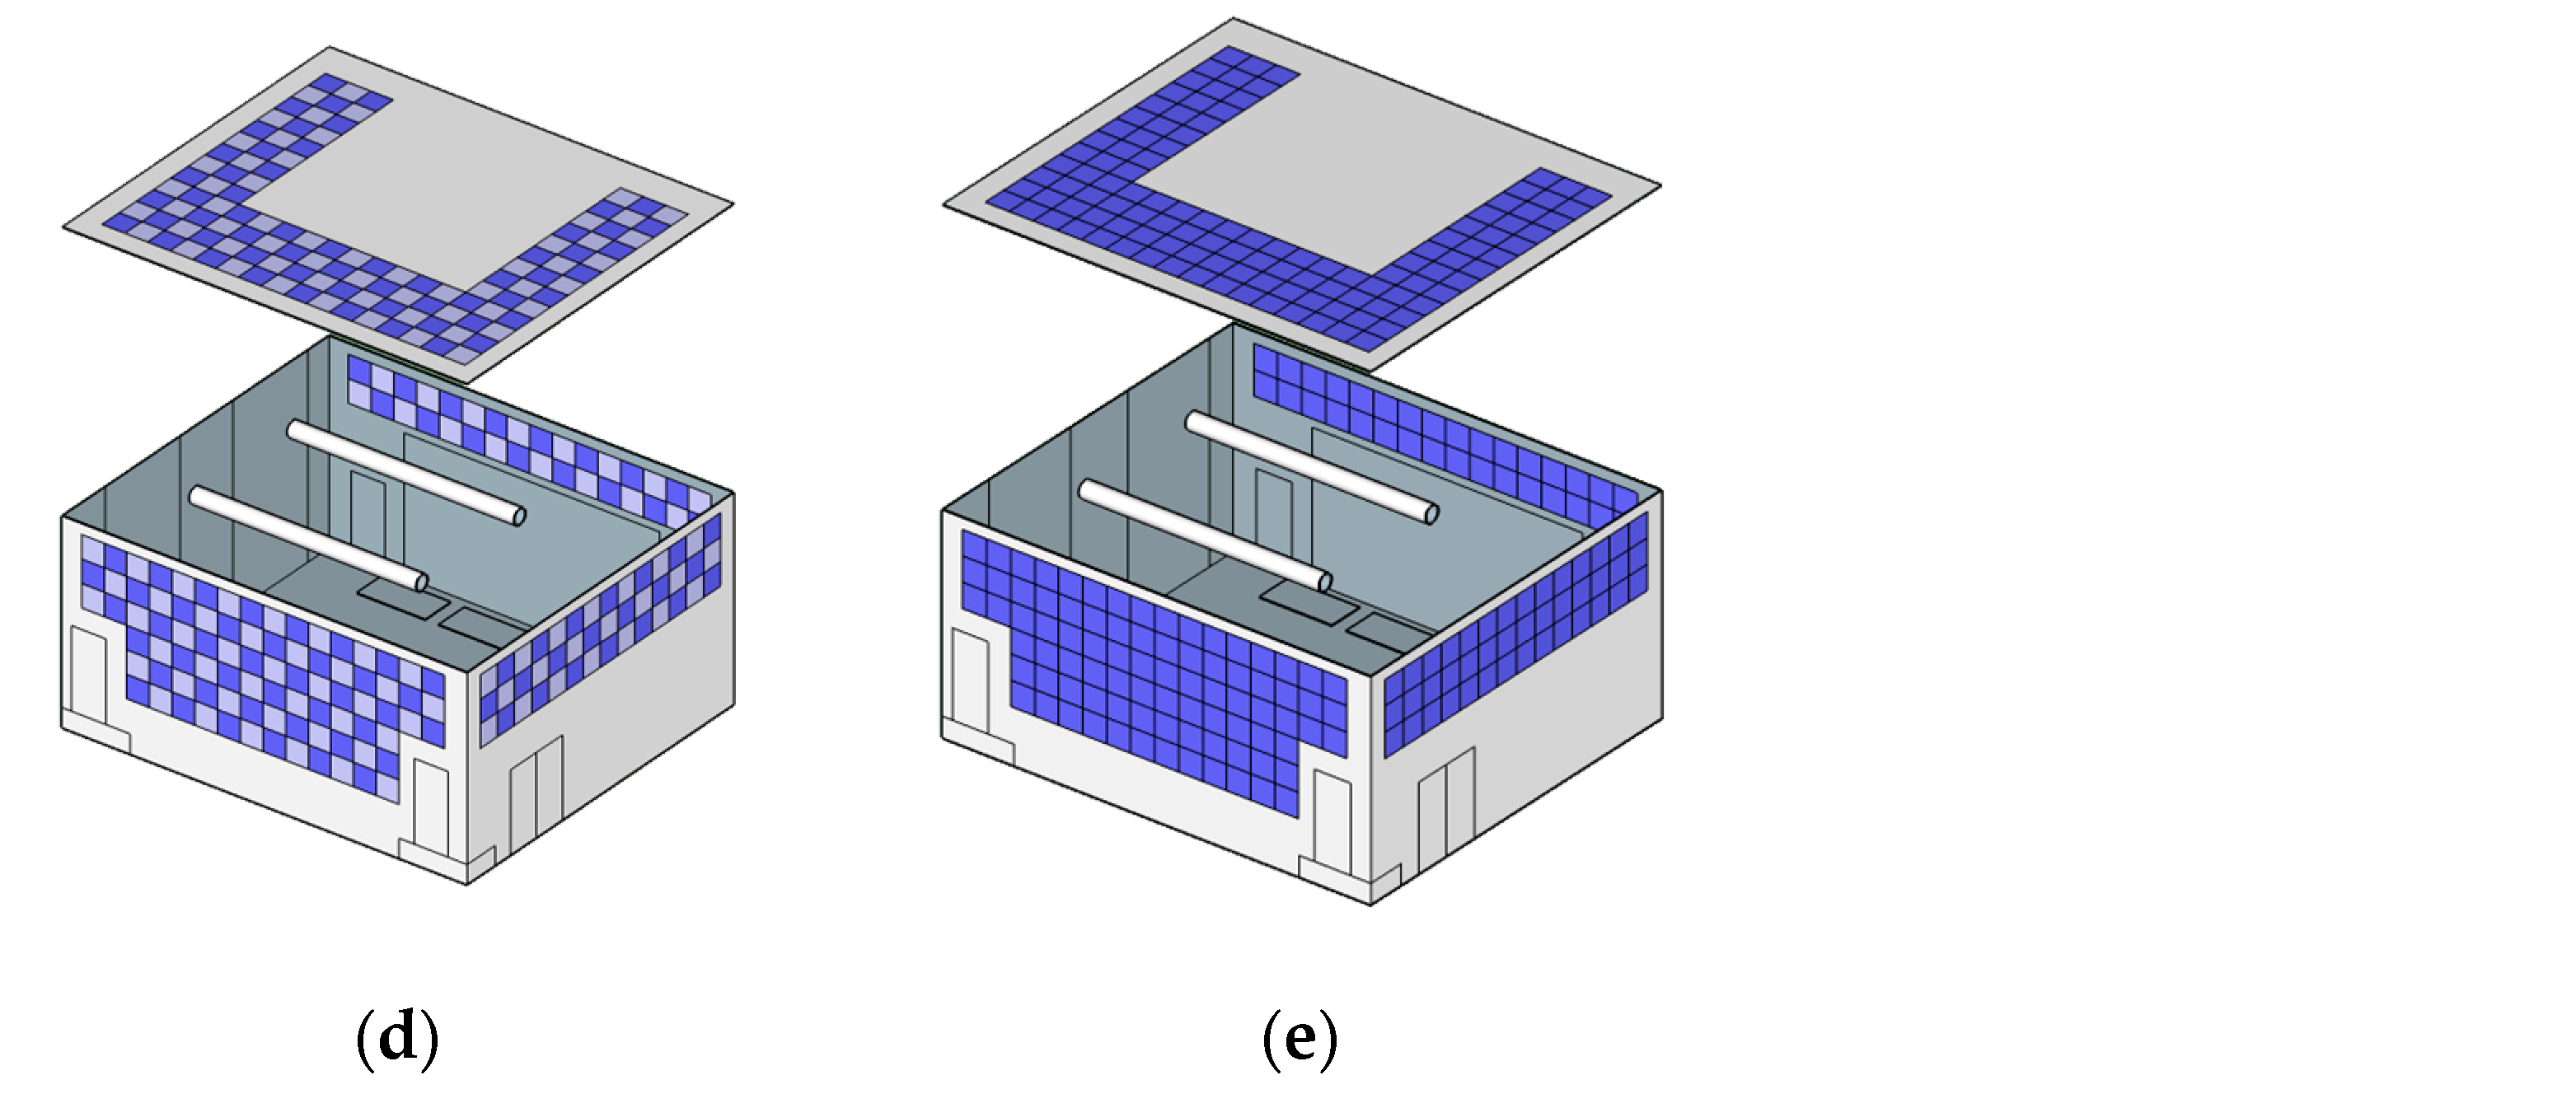
For the Mr2, the acoustic intervention applied to Mr1 is adapted to the shape of the hip ceiling (
Figure 6). Four different acoustic design solutions were proposed, considering both absorptive and diffusive surfaces: in solution
a absorbers are placed on three out of four pitches of the hip ceiling, in
b absorbers are on three out of four pitches of the hip ceiling and on the upper part of the rear wall, in
c absorbers are positioned on the rear pitch of the hip ceiling and on the rear wall, and diffusers are located on the side and front walls, and in
d absorbers and diffusers are alternated on the upper part of three out of four side walls and on the rear pitch of the hip ceiling. Configuration
a complies partially with guideline 1. Configuration
b represents the reference intervention and complies partially with guidelines 1, 2, and 8. Configuration
c partially complies with guidelines 1, 4, 8 and 9. Configuration
d complies with guideline 9 and partially with guidelines 3 and 5.
Table 1 shows the percentages of acoustic panels on the ceiling and the walls and the percentages of ceiling and walls covered by acoustic panels for the different configurations shown in
Figure 5 and
Figure 6 in Mr1 and Mr2, respectively. The two opposite conditions for the two rooms are configurations
a and
d. In configuration
a, the acoustic panels are only absorptive and placed on the ceiling only, while in configuration
d both the rooms have the same percentage of absorptive and diffusive panels on the ceiling and the walls, i.e., they are equally distributed.
In Mr1, the percentages of ceiling covered by panels is almost three times the one in Mr2 for the configurations from a to d, while it is dissimilar on the walls, where Mr1 has almost two times the percentage of panels of Mr2 for configuration d, it is slightly higher than Mr2 for configuration b and it has almost three times the percentage of absorptive panels than Mr2 but the same percentage of diffusive panels for configuration c.
6. Conclusions
The whole study aims to lead to a systematic approach for acoustic design and conscious application of the acoustic treatment in medium sized rooms for public speaking and professional meetings, such as meeting rooms with volume between 300–500 m3. The first part involved an extensive review of the literature, which aimed to collect useful guidelines on the optimal placement of acoustic materials in medium sized rooms used for speech.
The second part covered methods and results related to the acoustic treatment of two meeting rooms at the Politecnico di Torino. Measurements were carried out in the untreated rooms, with two software, and results were comparable among them apart from Clarity, which is affected by recognized uncertainty related to its computation procedure from the impulse response.
Simulations of different configurations of sound absorptive and diffusive panels have been carried out with a geometrical acoustic based software. Reverberation Time can be obtained in the octave frequency band 0.125 kHz with an average error of about 50%, and in the range 0.25–4 kHz with an error between 10–20%. A slightly higher divergence from 10–20% is expected for Speech Transmission Index, since it covers all the frequency range from 0.125–8 kHz.
Results from the different configurations tested in the two rooms recommend the application of absorptive materials on the ceiling or on the perimeter of the ceiling, and on the upper part of one of the three lateral walls, including the rear wall. A range between 50–70% of the ceiling and 20–40% of the walls, including the rear wall, covered with sound absorbing material is recommended in regular shaped rooms with volume around 500 m3, while a range between 20–30% of the ceiling and up to 15% of the rear walls is advised in meeting rooms with volumes around 300 m3. Generally, the configurations with diffusers do not lead to significant improvements compared to solutions with sound absorption. STI is the least sensitive parameter of the different acoustic scenarios, compared to Reverberation Time and Clarity. The research also outlined a design workflow, useful to successfully design meeting rooms and classrooms in general, which allows to determine the optimal number and location of acoustic panels, and to minimize the installation costs.


