
IoT-Based Sanitizer Station Network: A Facilities Management Case Study on Monitoring Hand Sanitizer Dispenser Usage


Abstract
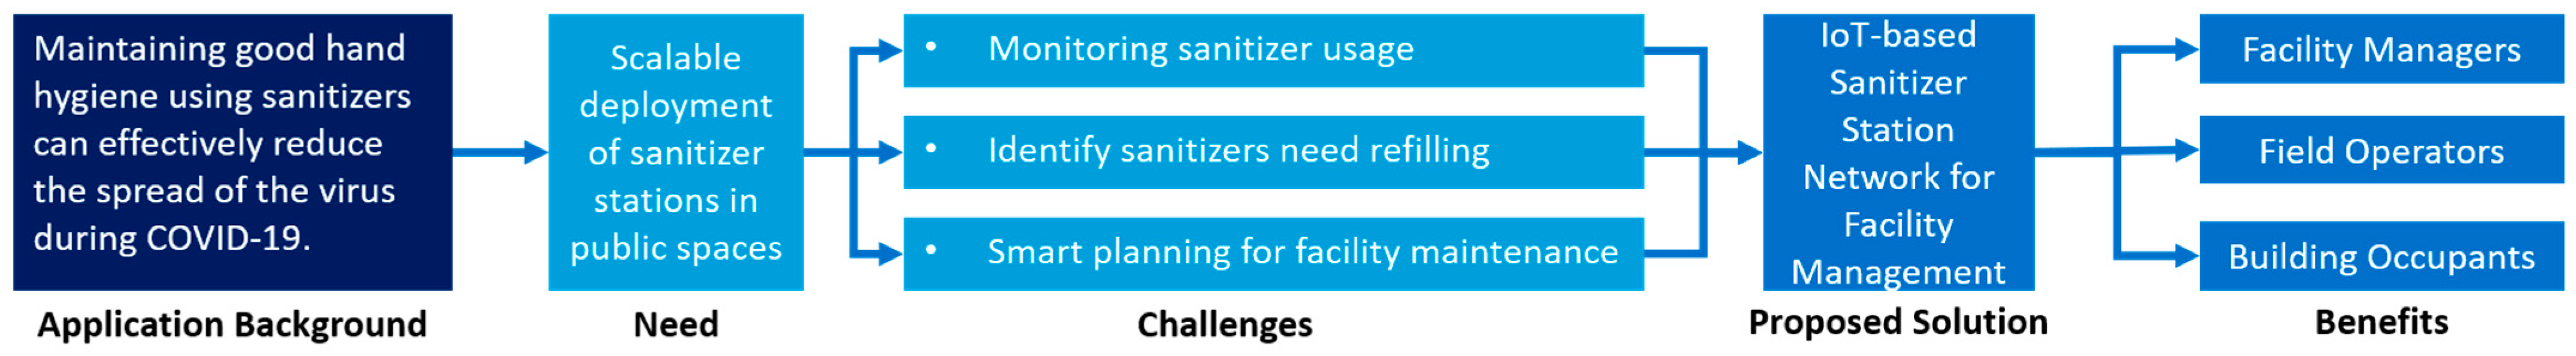
:1. Introduction

| Studies | Application Scenario | Deployed Techniques |
|---|---|---|
| Herbert, Horsham, Ford, Wall and Hacker [26] | Applying a smart handwashing station to improve hand hygiene compliance with real-time feedback (regarding the effectiveness of handwashing). | Camera, UV light, and tablet installed on handwashing station for detecting and displaying unwashed areas of hands. |
| Chowdhury and De [29] | Sensorized sanitizer station to monitor the sanitizer usage and remaining level. | Liquid stage sensor installed on sanitizer station, with WiFi for data communication. |
| Bal and Abrishambaf [23] | Sensorized sanitizer station to monitor the compliance with hand hygiene of medical staff. | RFID tag and an infrared sensor for monitoring the hand hygiene compliance of each staff; ZigBee and WiFi for data communication. |
| Meydanci, Adali, Ertas, Dizbay, and Akan [25] | Sensorized sanitizer station for monitoring the compliance with hand hygiene of medical staff. | RFID tags for monitoring hand cleaning behaviors; ZigBee for data communication. |
| Tadikonda [28] | Sensorized sanitizer station for monitoring the level of sanitizer. | Ultrasonic sensor for monitoring the level of sanitizer bottle; WiFi for data communication. |
| Sumbawati, Chandra, Wrahatnolo, Ningrum, Khotimah, and Fathoni [27] | Sensorized dispenser with smart control for automated serving of sanitizer and reducing waste. | Ultrasonic sensor for detecting presence of human hands. |
2. Materials and Methods
2.1. Concept Development
2.2. Sensor Module Selection
- Low-cost: each sensor costs USD 40–45, which is affordable for deployment scale up.
- Wire-free power supply: the sensors are powered by batteries with a lifetime of up to 5–10 years. The sensors are, therefore, easy to deploy and have no requirement of being near a power source.
- Wireless data communication: the sensors use LoRaWAN for data communication, which is a low-power solution for long-range communication.
- Remote configuration and management: the sensor manufacturer provides an accessible network server service (Radio Bridge Console [31]), allowing remote sensor configuration and troubleshooting.
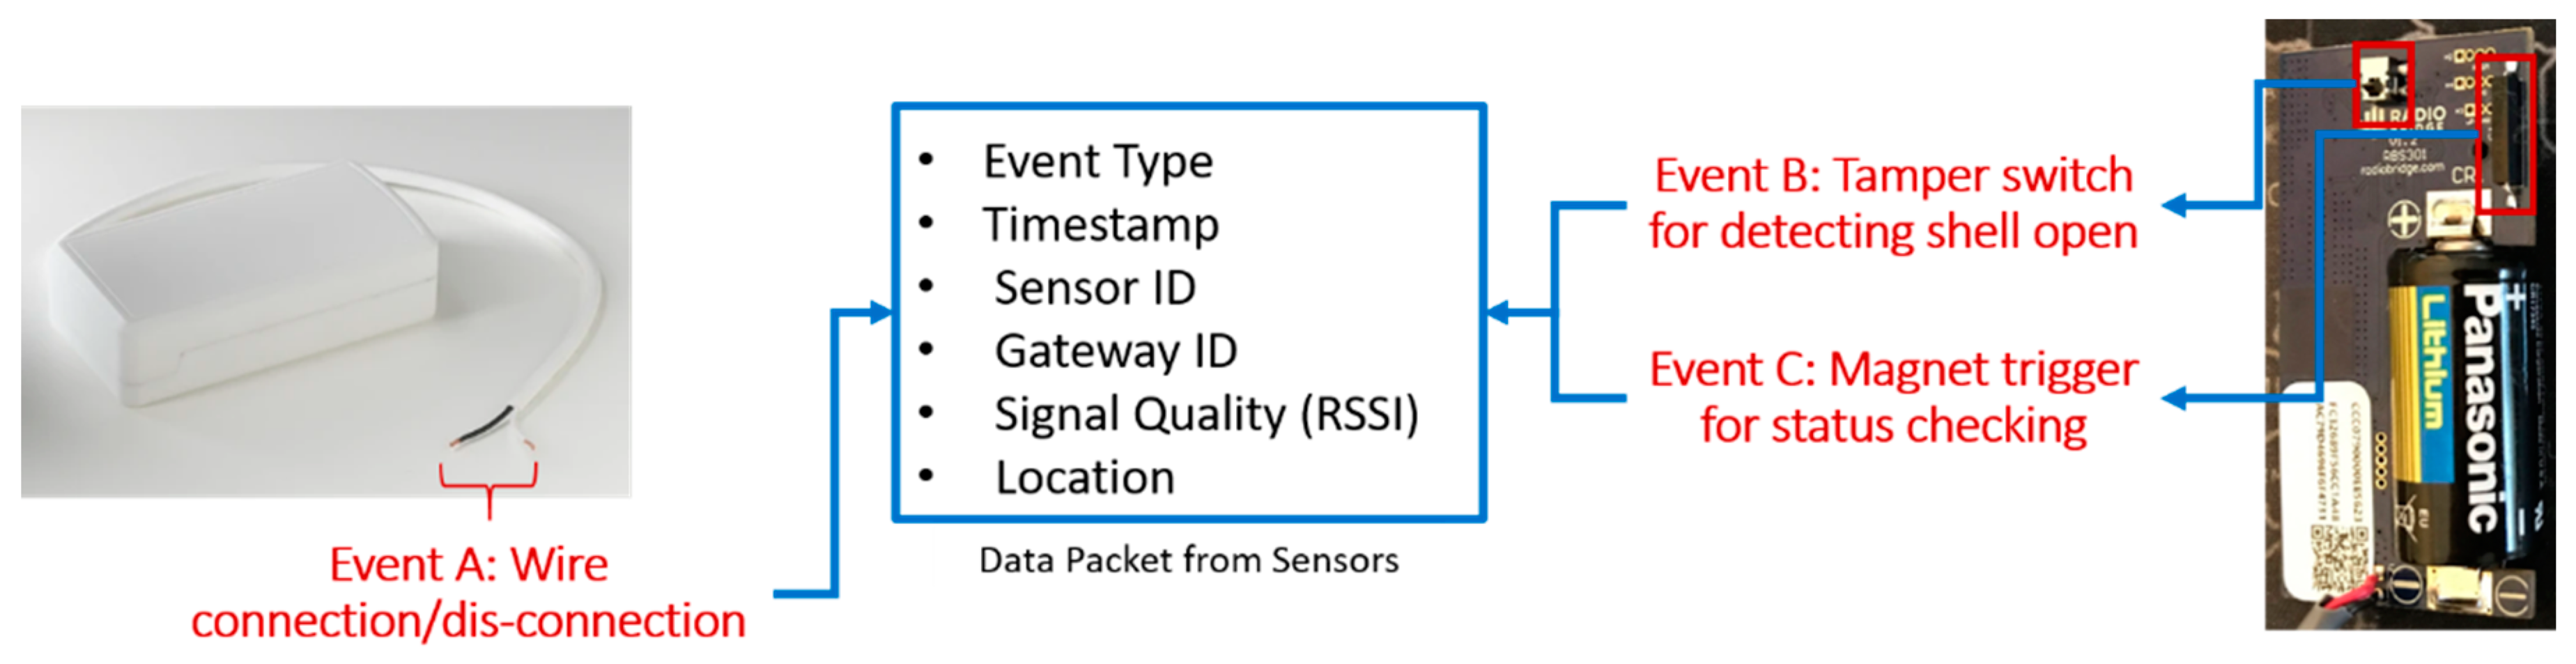
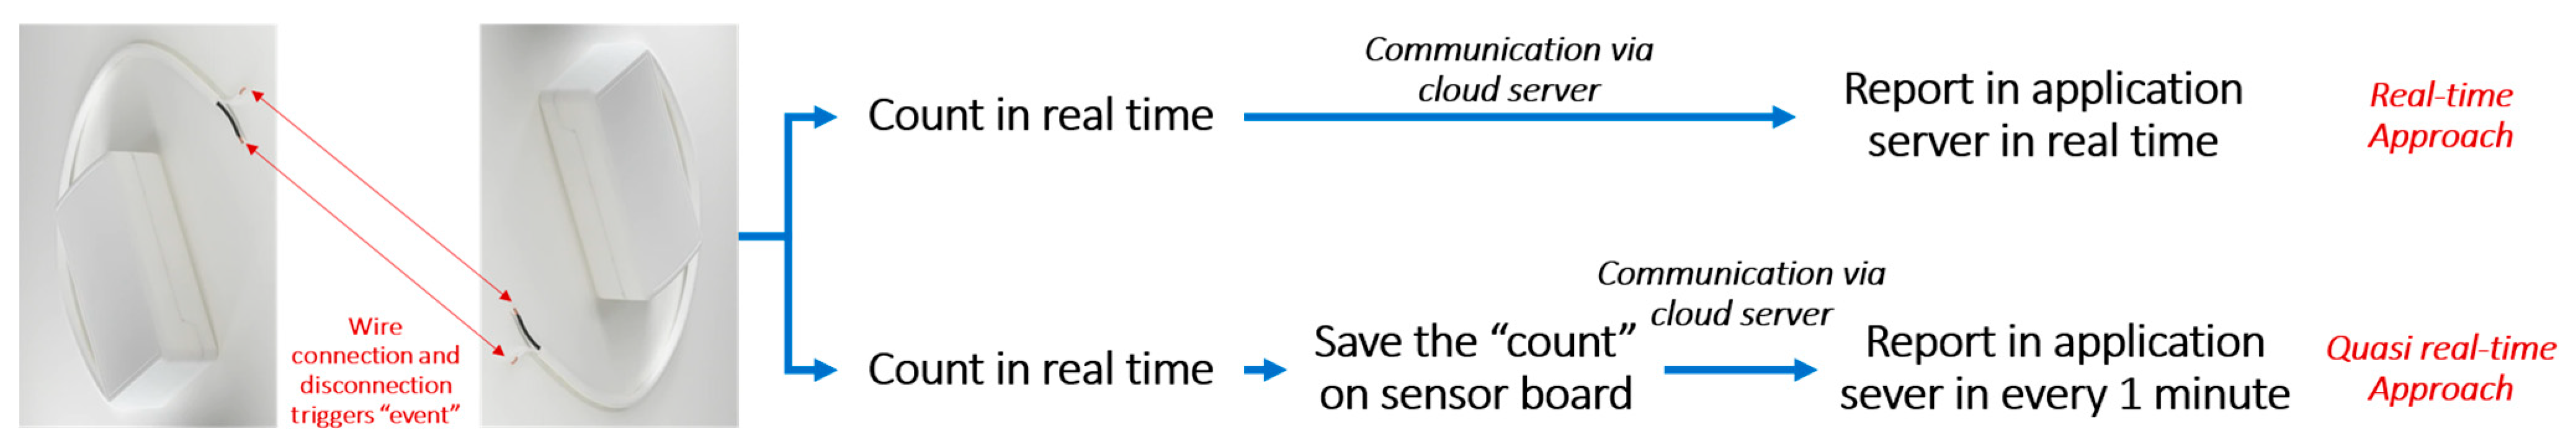
- Multiple triggering mechanisms: the sensor can detect several different events through three different mechanisms, namely, wire connection/disconnection (Event A), tamper switch for detecting sensor shell open (Event B), and magnetic trigger for sensor status checking (Event C).
2.3. Sensor Deployment
2.3.1. Existing Sanitizer Dispenser Stations
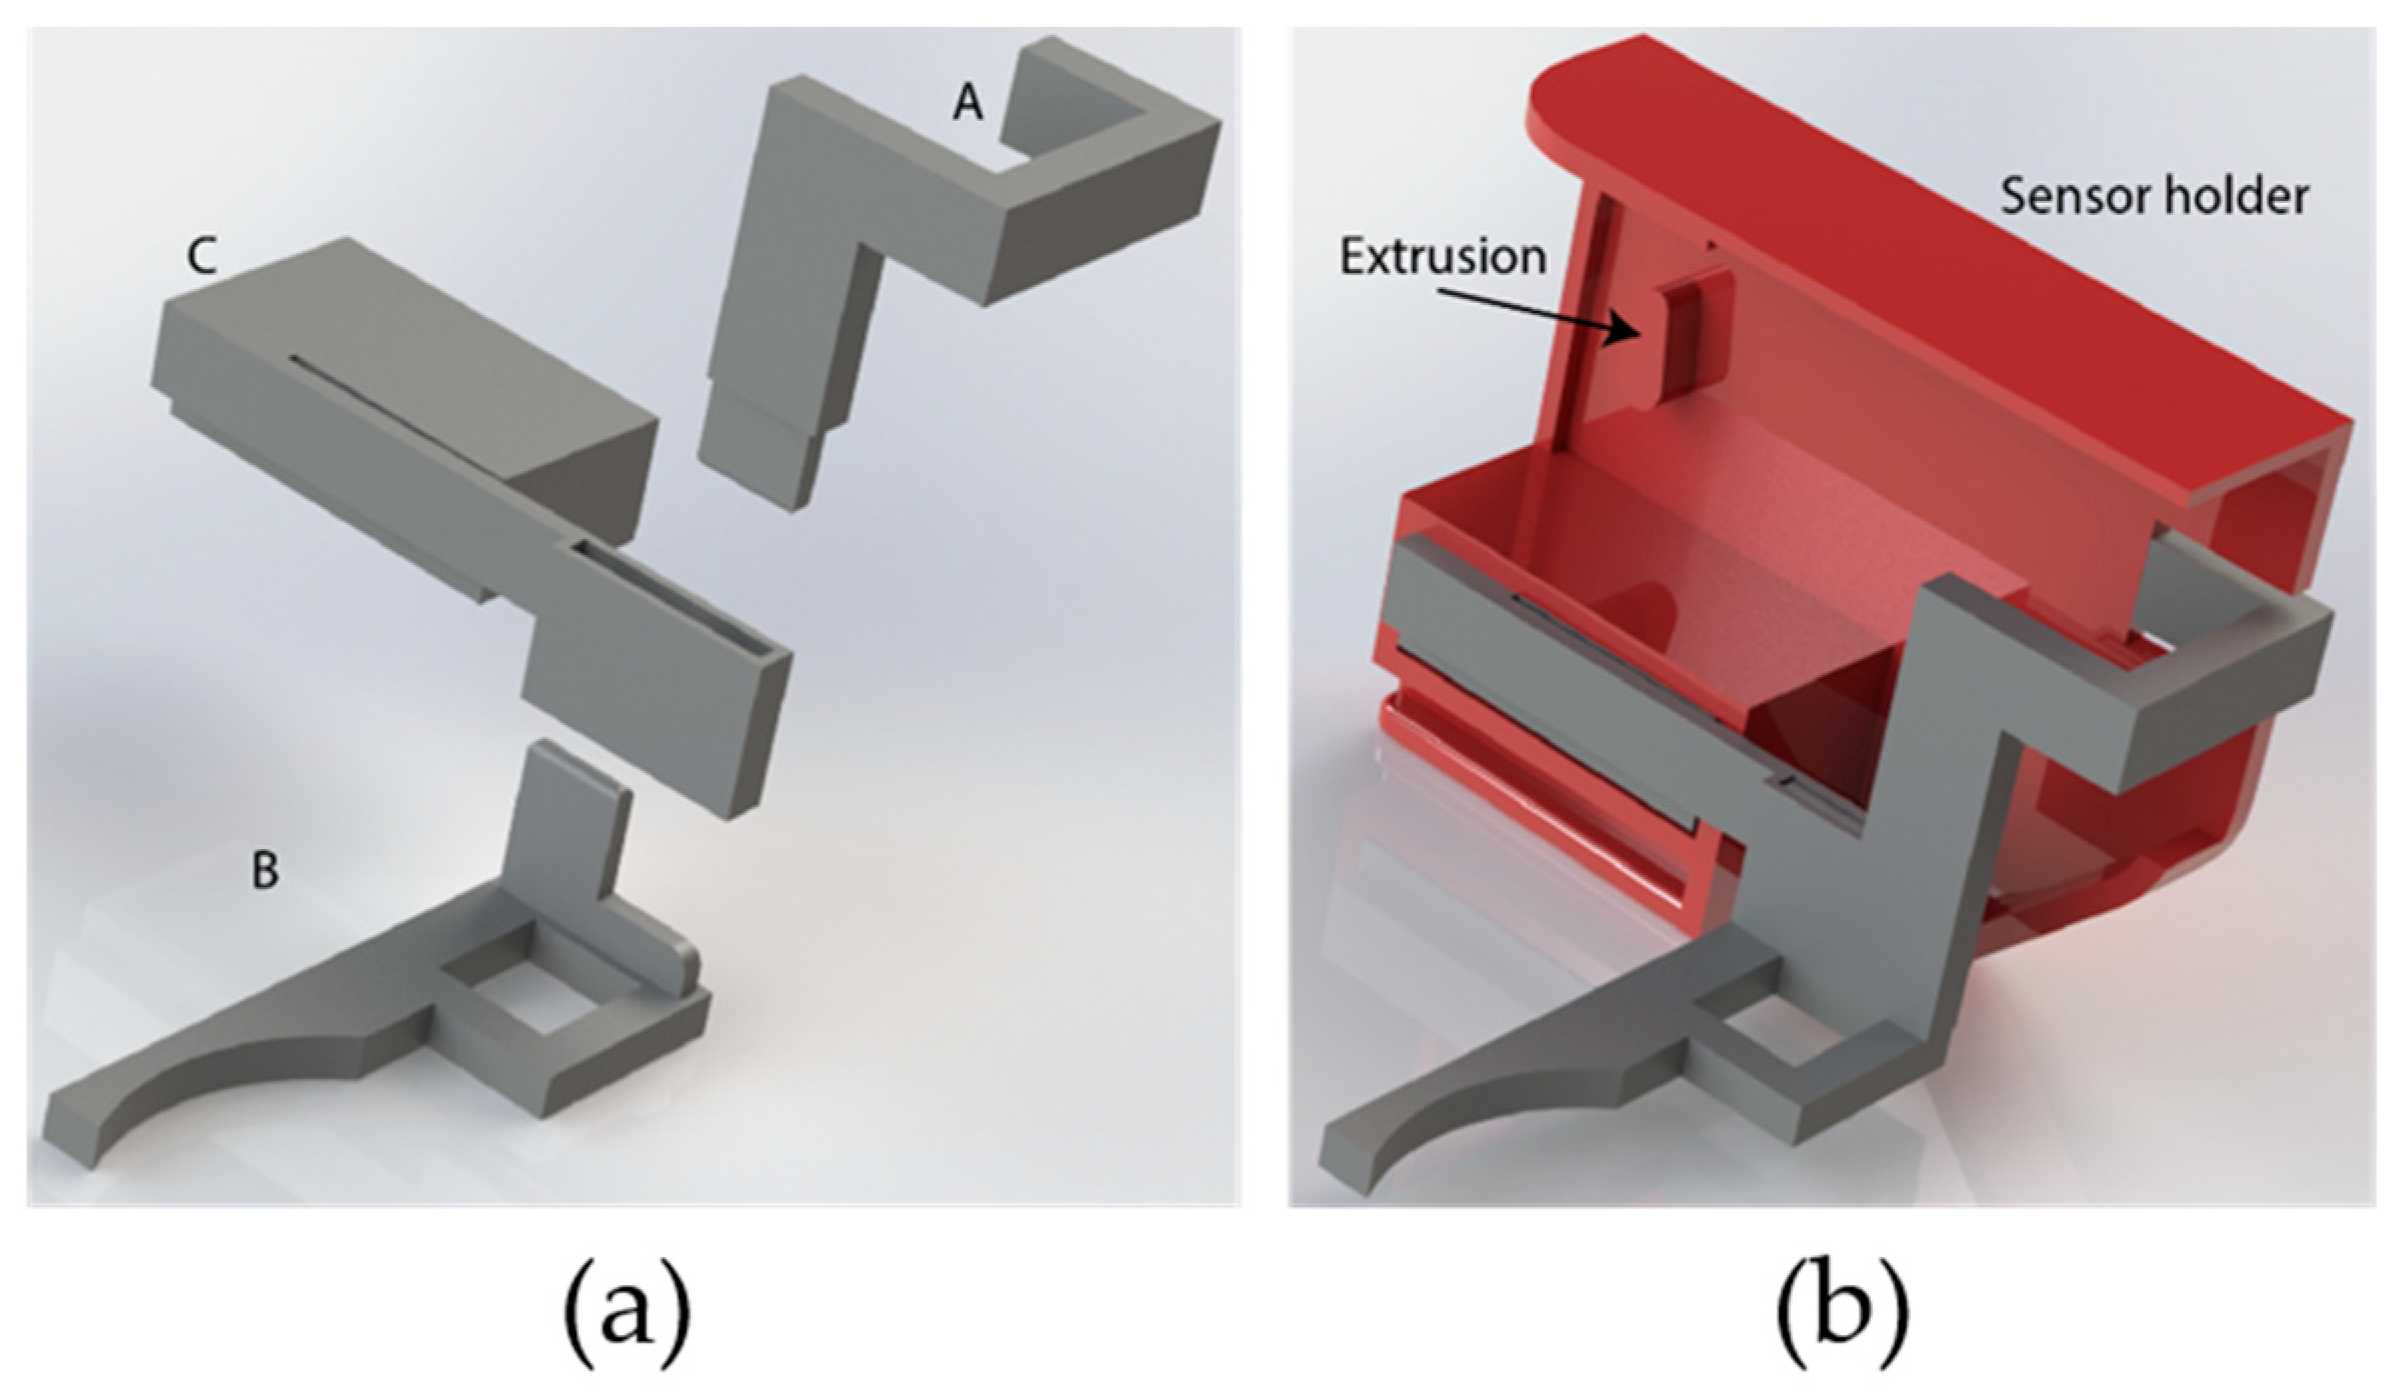
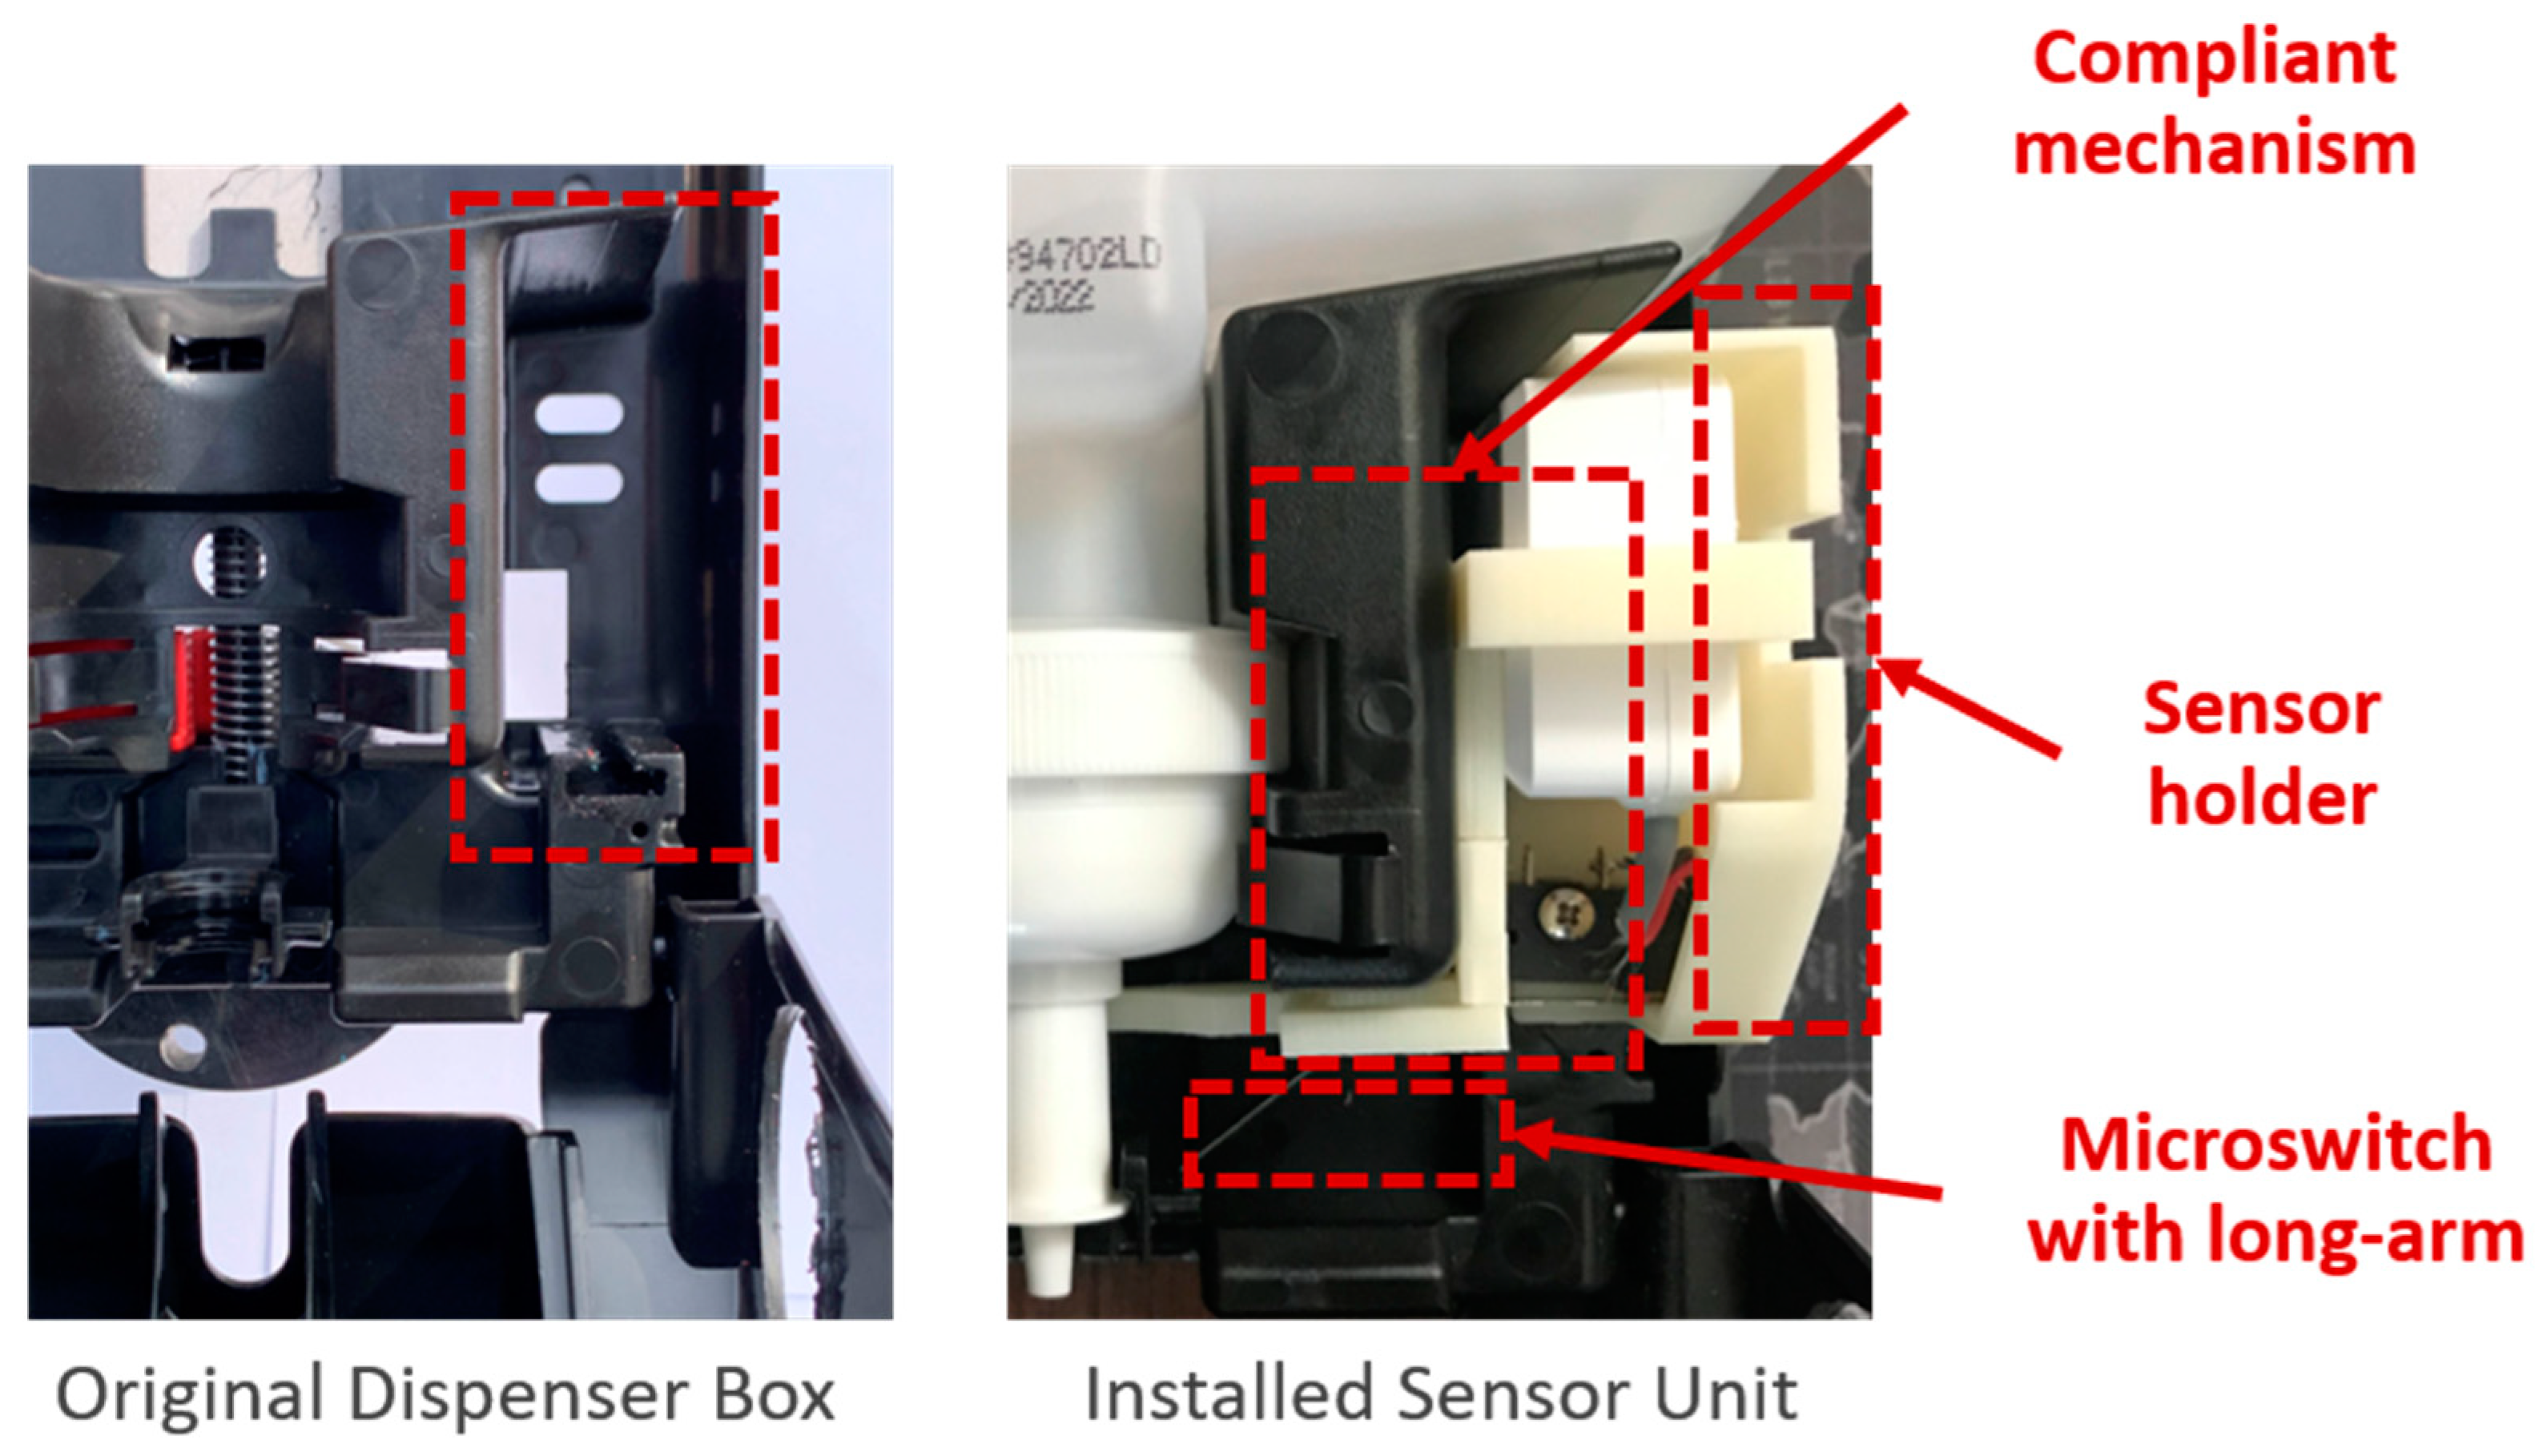
2.3.2. “Plug-and-Play” Sensor Unit Design for Monitoring Dispenser Interactions
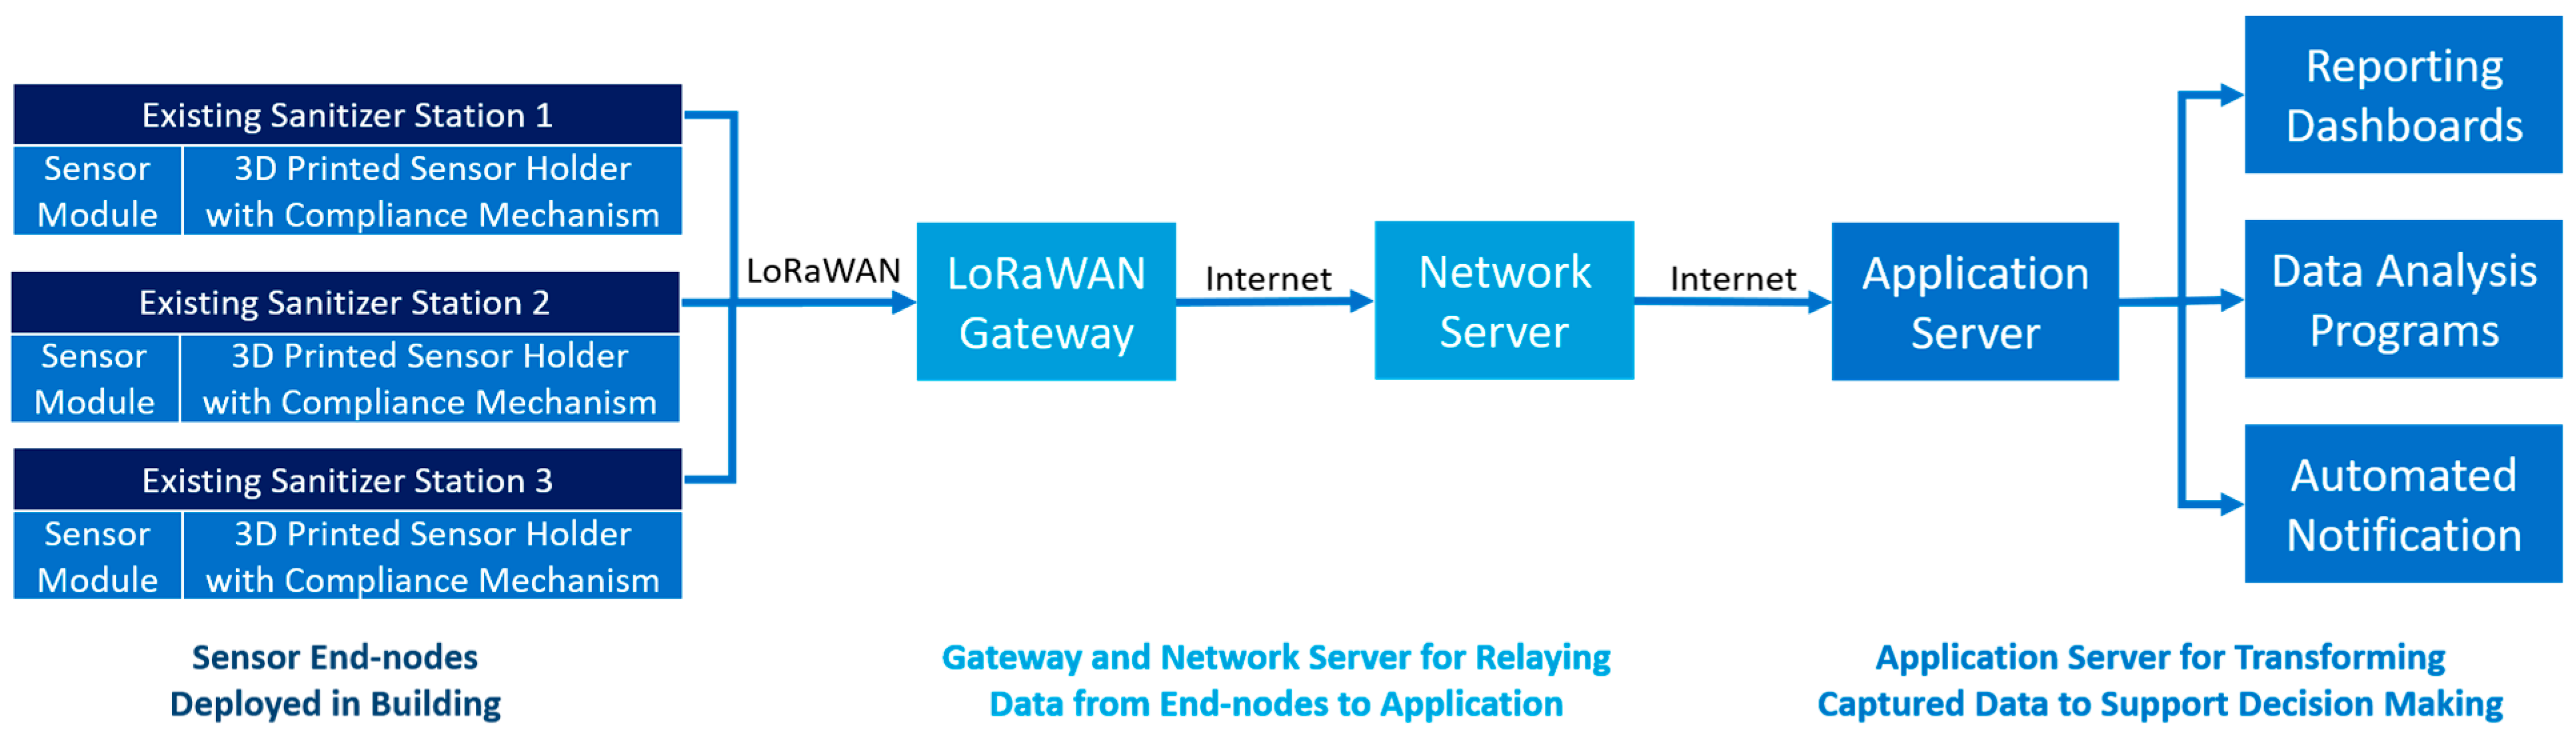
2.4. Wireless Network
2.4.1. Wide-Area Network
- Private WAN: the wireless network can be created using a single gateway without paying for access to a cellular network.
- Long-range communication: the signal coverage range can be up to 10 miles (16 km) with line-of-sight and approx. 1–3 miles (1.5–5 km) around/inside buildings.
- Cost-effectiveness: the LoRa network follows a “star topology”, with which a single gateway (USD 600) can cover up to hundreds of end-node devices for decreased cost of implementation.
2.4.2. Network Server
2.4.3. Application Server
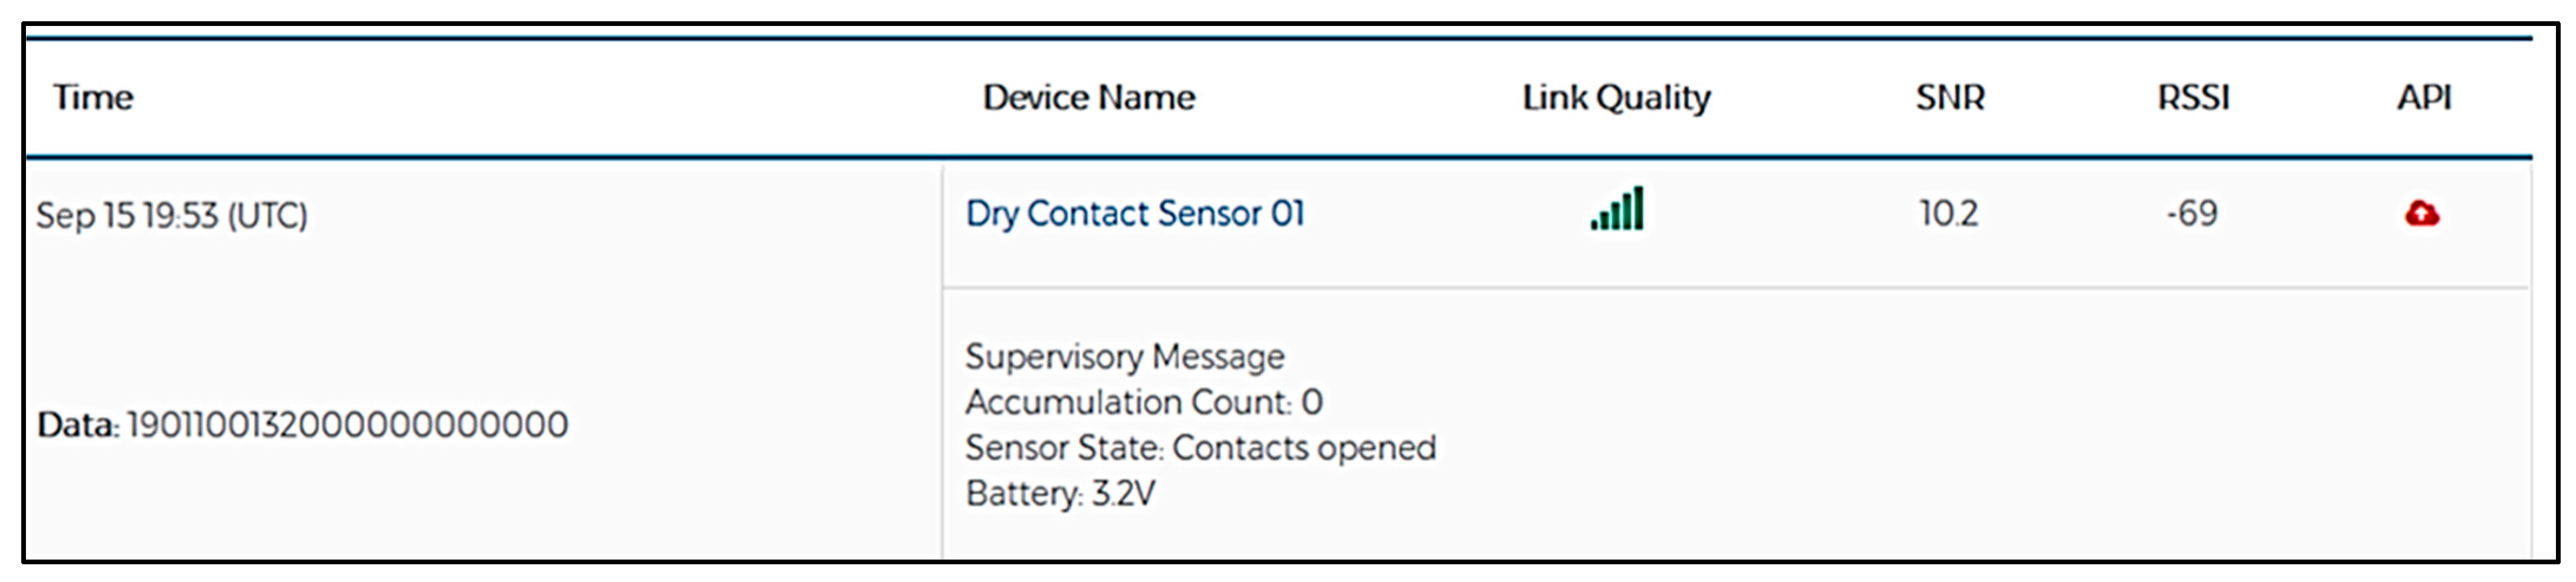
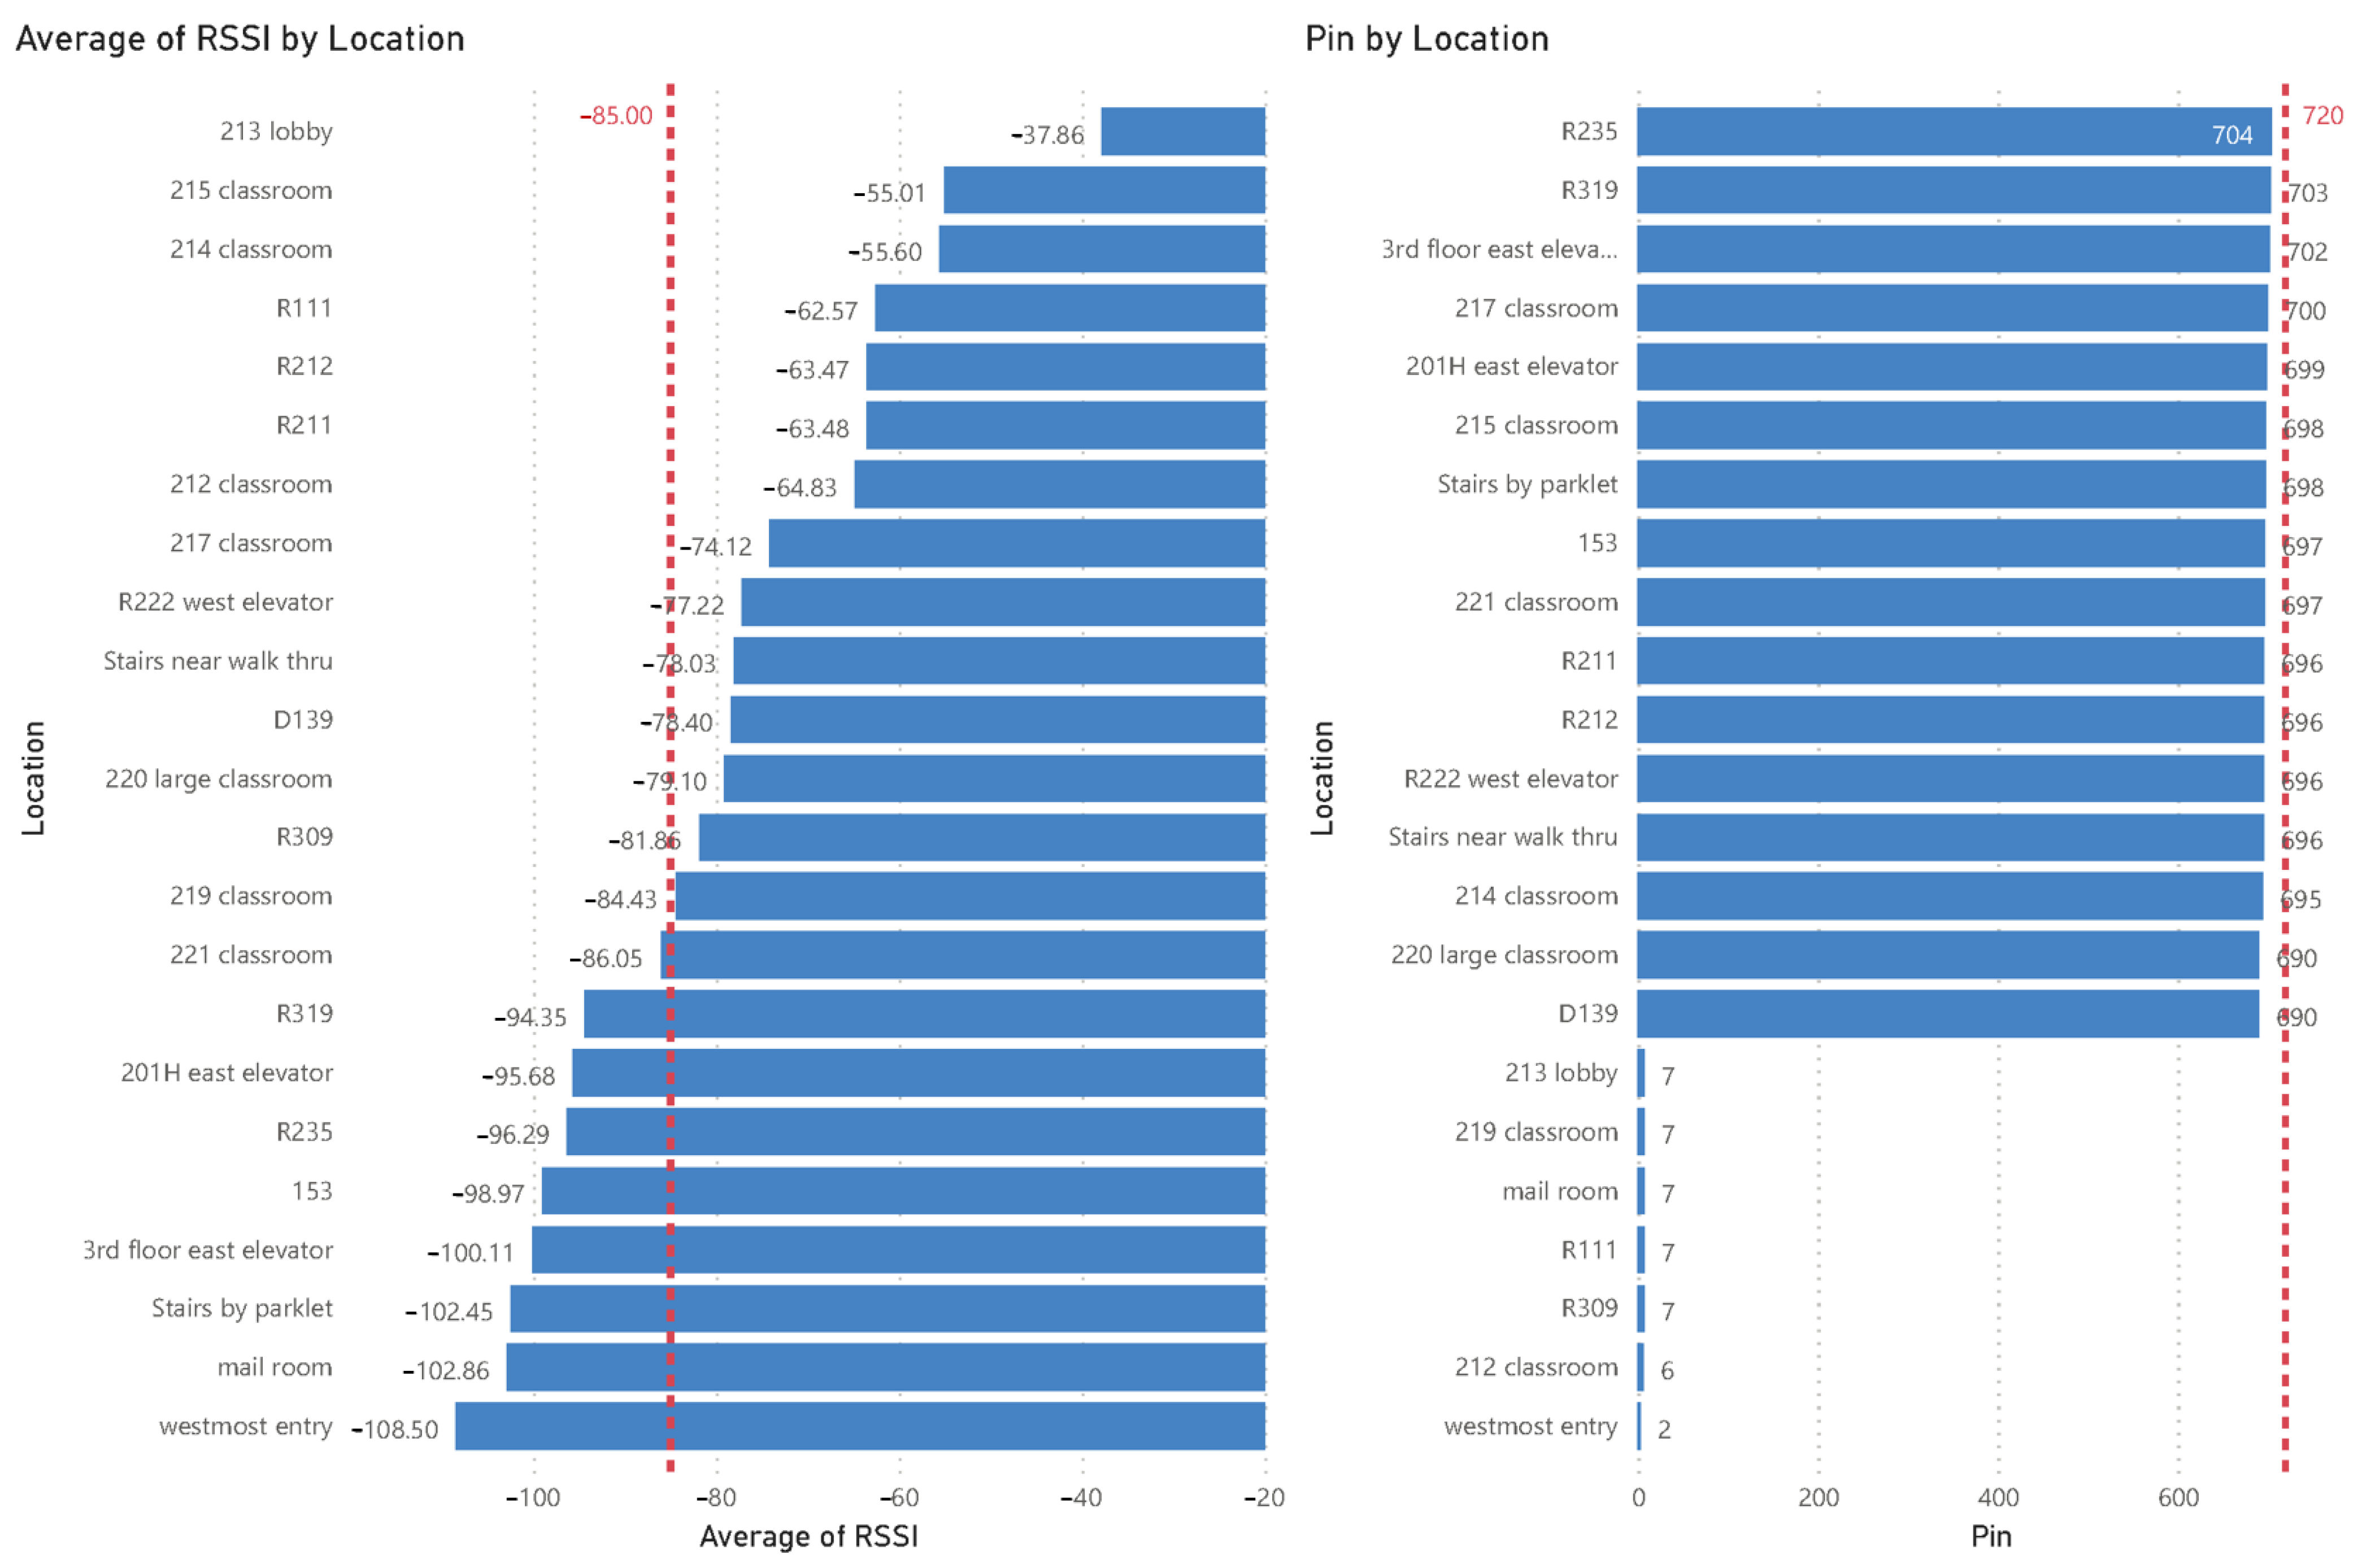
- Sensor status checking: the received data packet is used to monitor the sensor operational status, such as signal quality (via the received signal strength indicator, RSSI) and battery life.
- Real-time tracking of sanitizer usage: both the “push” and “replace” events are analyzed to monitor the number of push events after the most recent replacement, which tracks sanitizer usage.
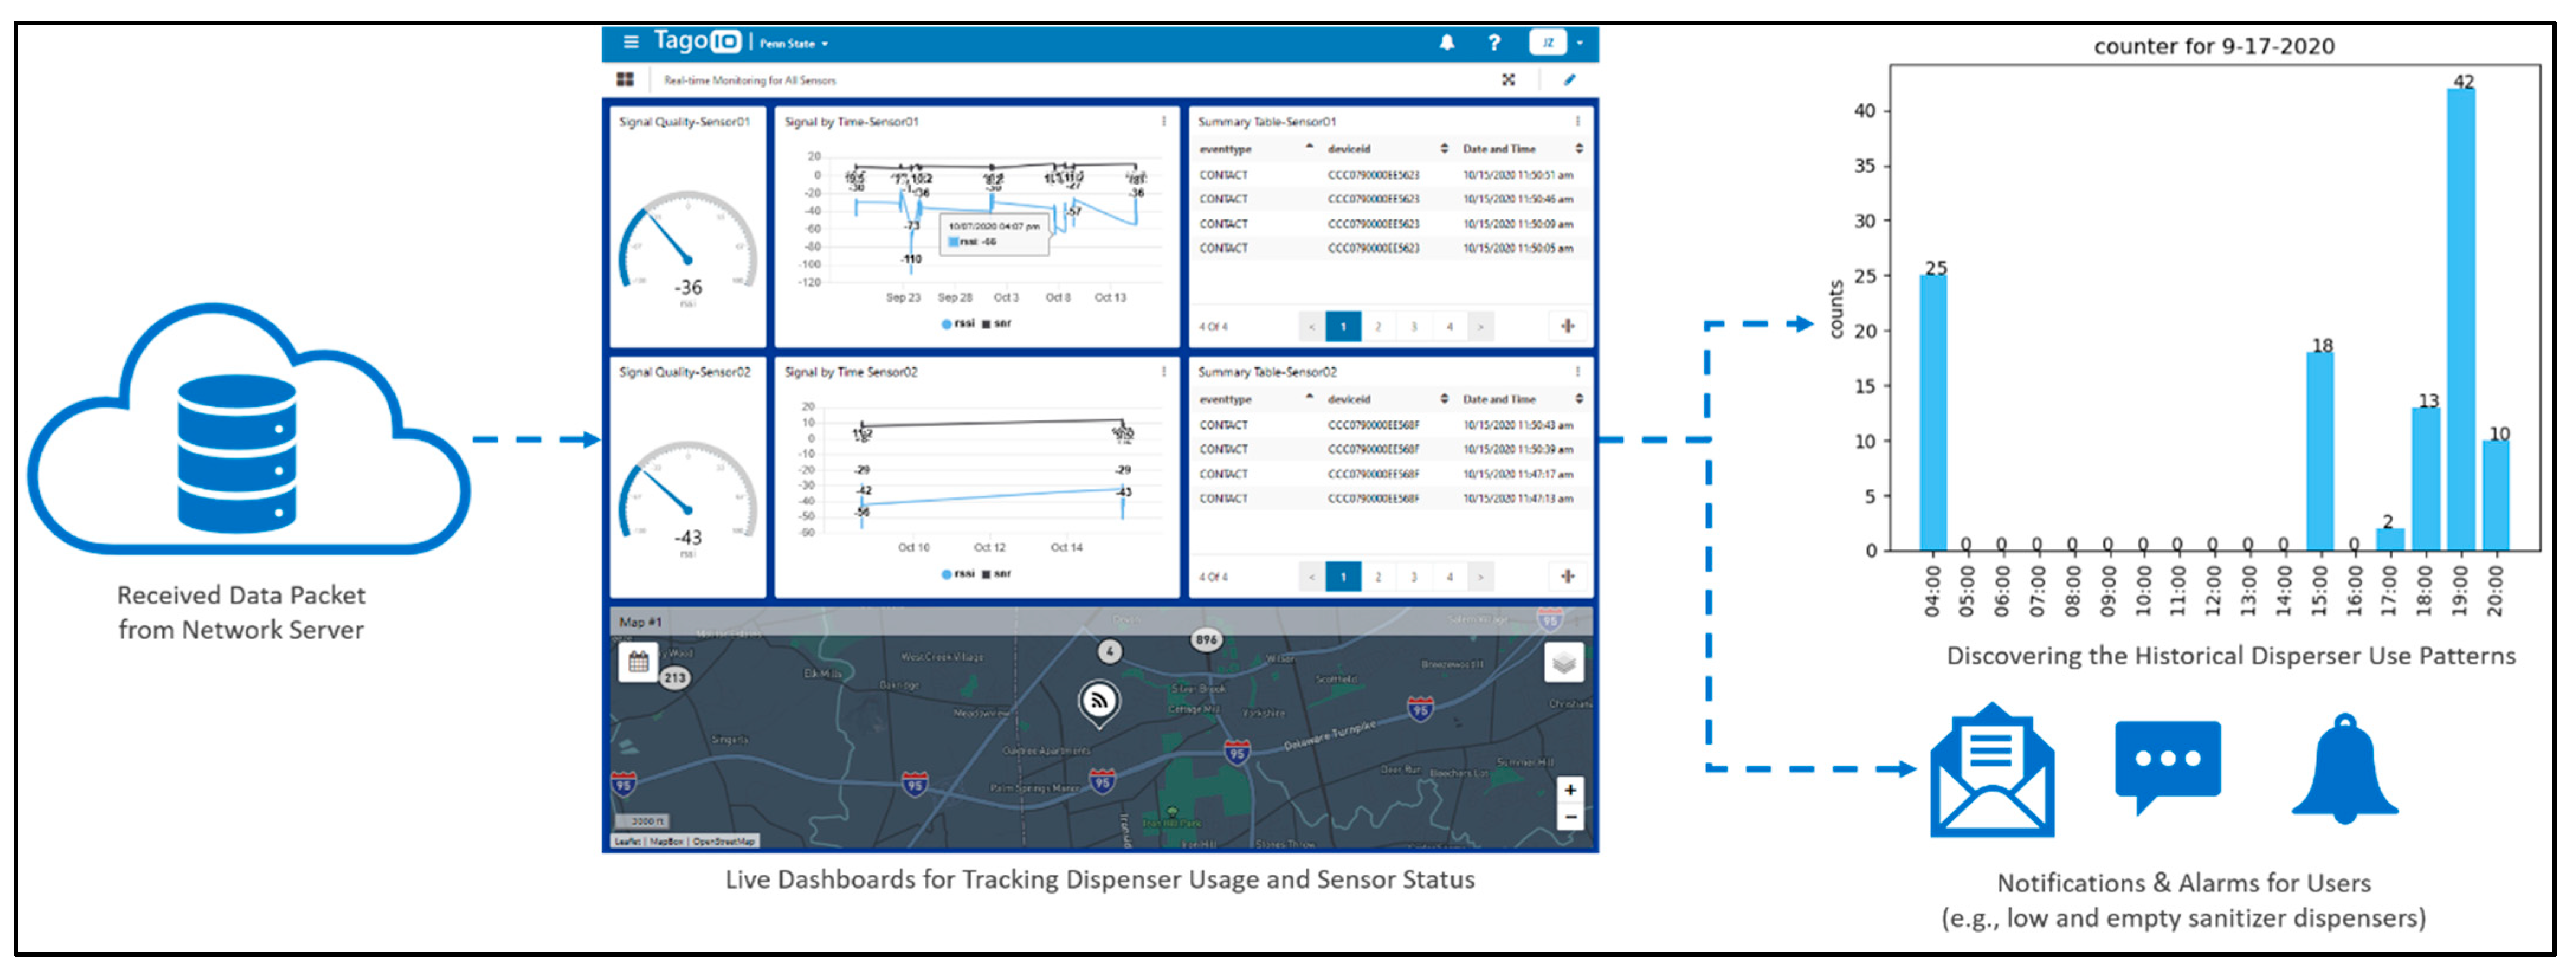
- Visualization: dispenser conditions and their locations are presented graphically.
- Usage-pattern discovery: the recorded sanitizer usage data can assist in discovering historical patterns, such as the temporal and spatial usage trends on campus, which can help in assessing compliance with hand hygiene recommendations.
- Early warning of empty sanitizers: rule-based alarms and notifications can be set to notify the facility managers and operators about sanitizer dispensers close to empty and those that are malfunctioning.
2.5. Test of Sanitizer Dispenser Network Operation
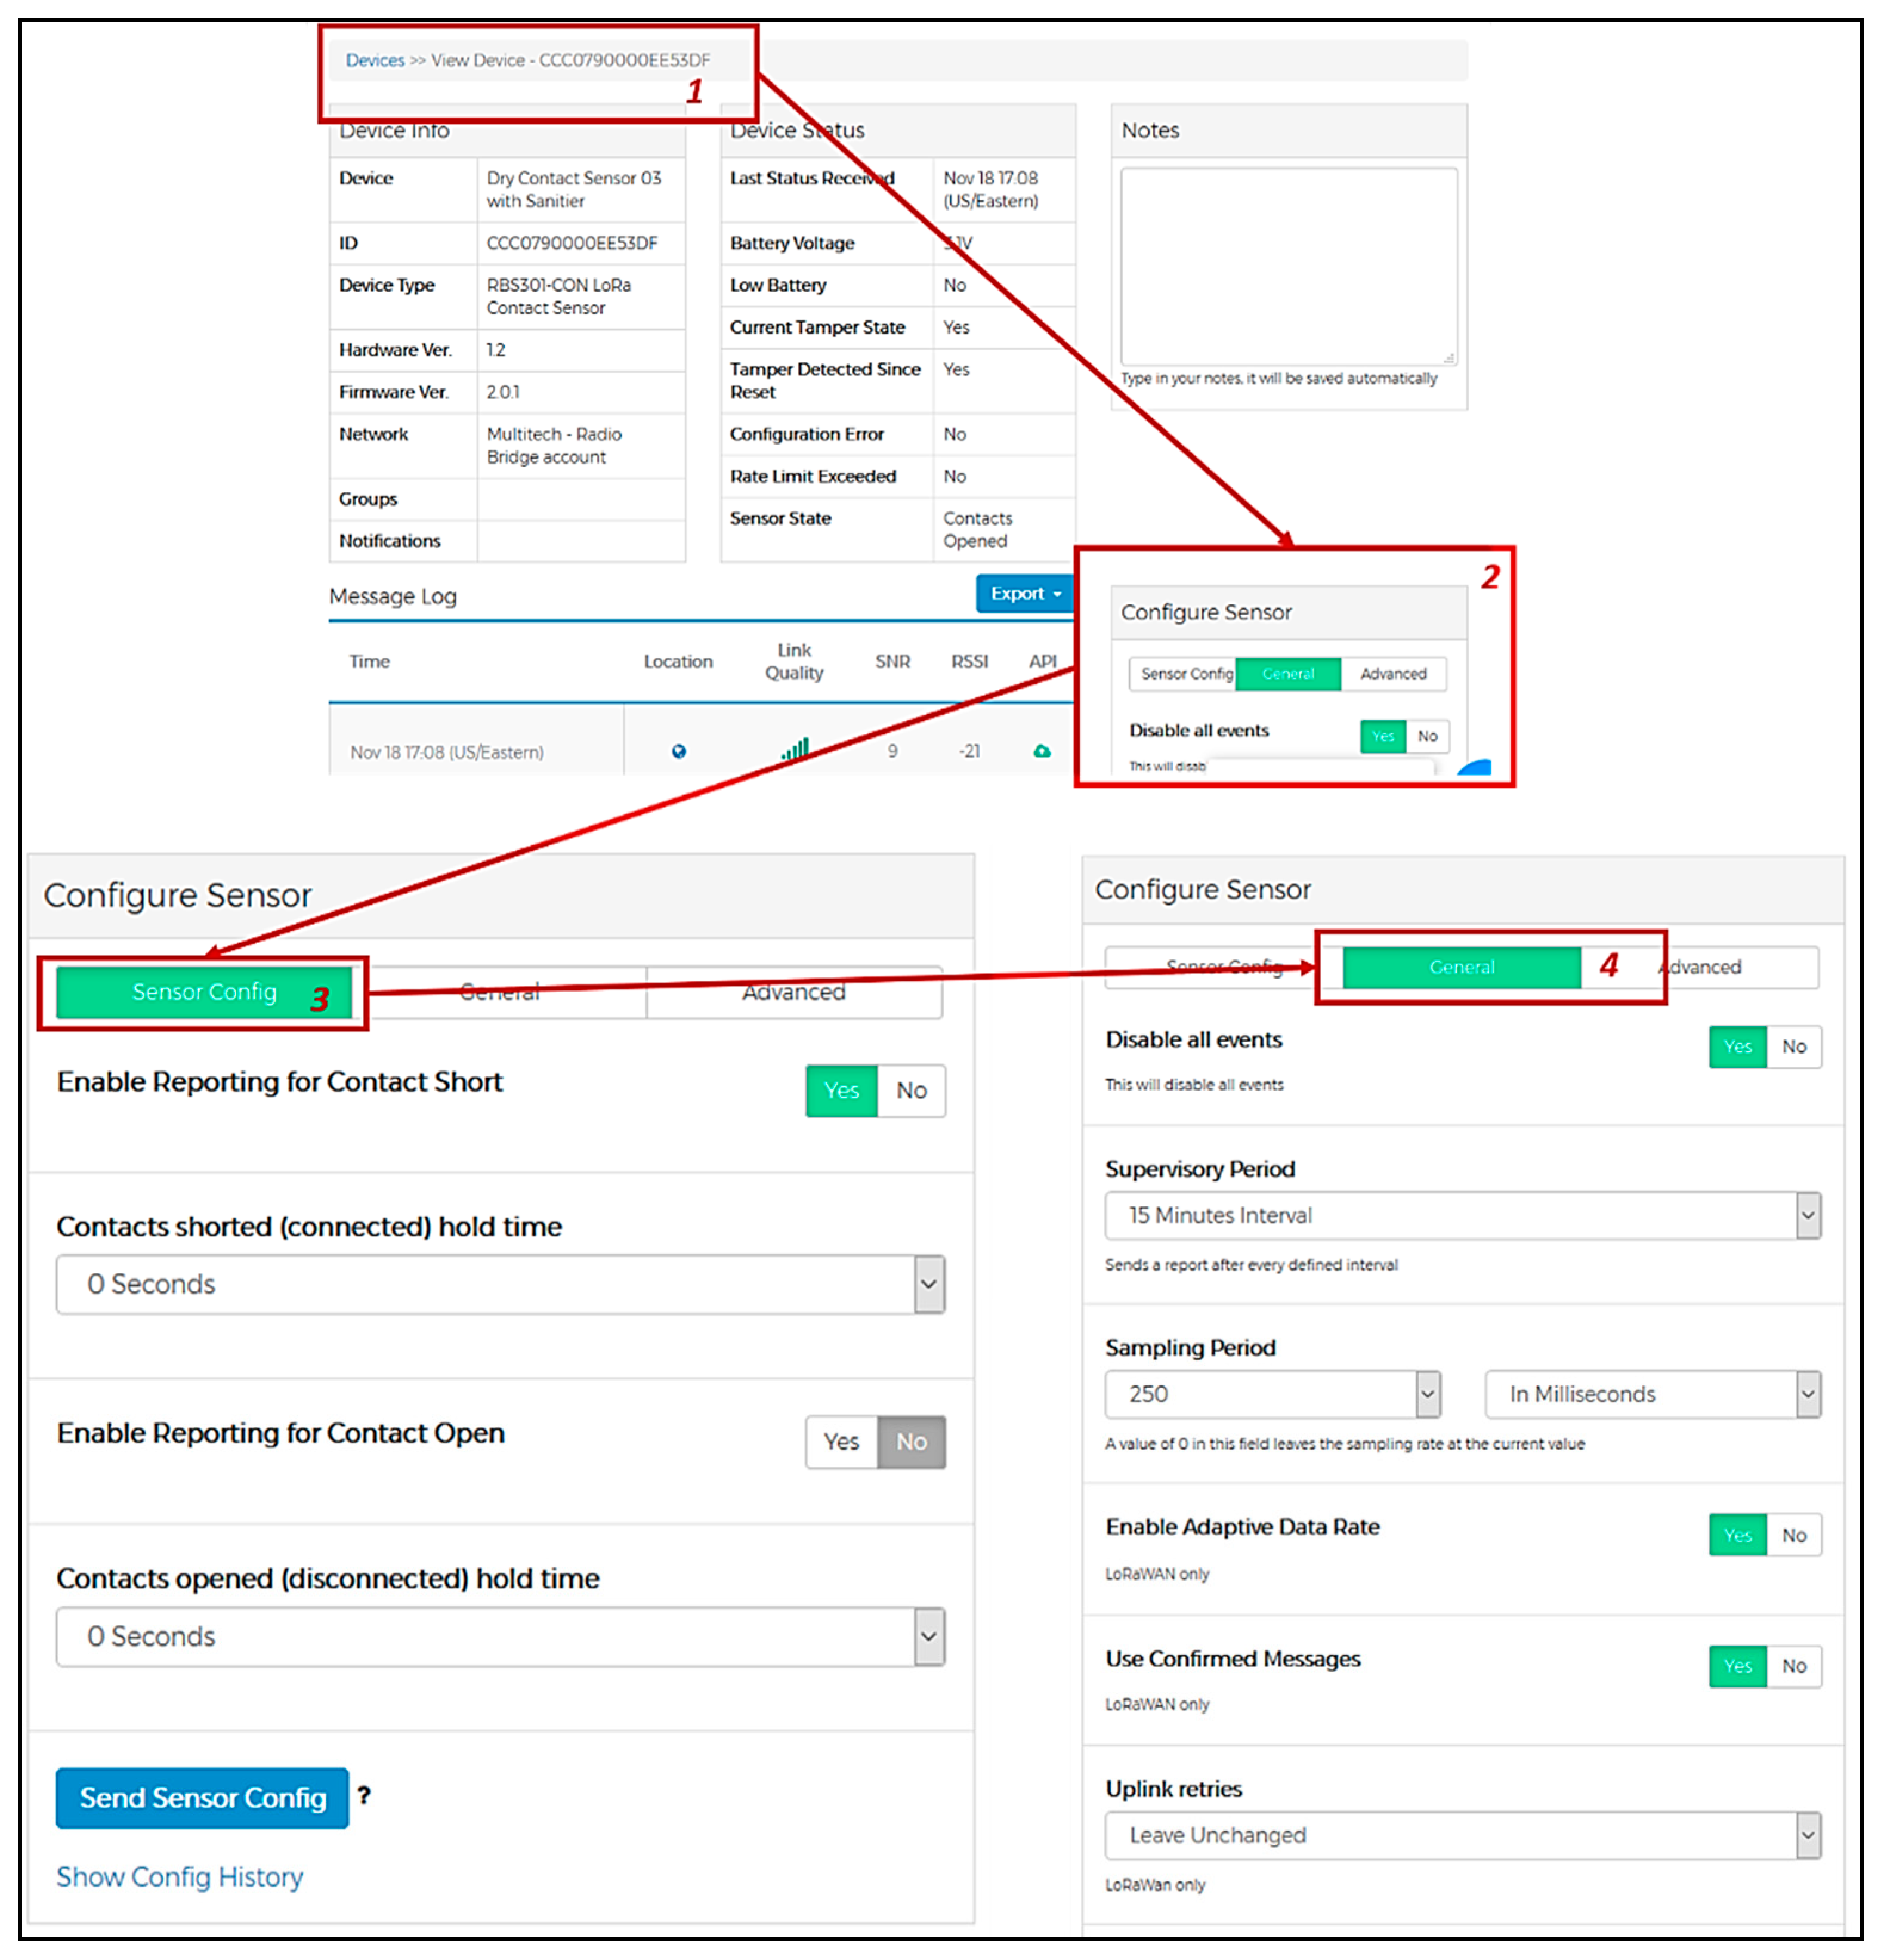
2.5.1. Test of Sensor Configuration
2.5.2. Field Test of Sanitizer Network Operation
3. Results and Discussion
3.1. Test of Sensor Module Configuration
3.2. Test of System Operation in the Field
4. Conclusions, Limitations, and Further Work
4.1. Conclusions
4.2. Limitations and Further Work
Author Contributions
Funding
Data Availability Statement
Acknowledgments
Conflicts of Interest
References
- Cdc.gov. COVID-19 and Your Health. Available online: https://www.cdc.gov/coronavirus/2019-ncov/prevent-getting-sick/prevention.html (accessed on 27 March 2021).
- Love, J.; Keegan, L.T.; Angulo, F.J.; McLaughlin, J.; Shea, K.M.; Swerdlow, D.L.; Samore, M.H.; Toth, D.J. Continued need for non-pharmaceutical interventions after COVID-19 vaccination in long-term-care facilities. medRxiv 2021. [Google Scholar] [CrossRef]
- Galanti, M.; Pei, S.; Yamana, T.K.; Angulo, F.J.; Charos, A.; Swerdlow, D.L.; Shaman, J. The importance of continued non-pharmaceutical interventions during the upcoming SARS-COV-2 vaccination campaign. medRxiv 2020. [Google Scholar] [CrossRef]
- Gozzi, N.; Bajardi, P.; Perra, N. The importance of non-pharmaceutical interventions during the COVID-19 vaccine rollout. medRxiv 2021. [Google Scholar] [CrossRef]
- Andrade, R.O.; Yoo, S.G. A comprehensive study of the use of LoRa in the development of smart cities. Appl. Sci. 2019, 9, 4753. [Google Scholar] [CrossRef] [Green Version]
- Biyik, C.; Allam, Z.; Pieri, G.; Moroni, D.; O’Fraifer, M.; O’Connell, E.; Olariu, S.; Khalid, M. Smart Parking Systems: Reviewing the Literature, Architecture and Ways Forward. Smart Cities 2021, 4, 623–642. [Google Scholar] [CrossRef]
- Jaid Jim, A.A.; Kadir, R.; Mamun, M.; Al, A.; Nahid, A.-A.; Ali, M. A noble proposal for Internet of garbage bins (IoGB). Smart Cities 2019, 2, 214–229. [Google Scholar] [CrossRef] [Green Version]
- Fahmideh, M.; Yan, J.; Shen, J.; Mougouei, D.; Zhai, Y.; Ahmad, A. A Comprehensive Framework for Analyzing IoT Platforms: A Smart City Industrial Experience. Smart Cities 2021, 4, 588–622. [Google Scholar] [CrossRef]
- Syed, A.S.; Sierra-Sosa, D.; Kumar, A.; Elmaghraby, A. IoT in Smart Cities: A Survey of Technologies, Practices and Challenges. Smart Cities 2021, 4, 429–475. [Google Scholar] [CrossRef]
- Belli, L.; Cilfone, A.; Davoli, L.; Ferrari, G.; Adorni, P.; Di Nocera, F.; Dall’Olio, A.; Pellegrini, C.; Mordacci, M.; Bertolotti, E. IoT-Enabled Smart Sustainable Cities: Challenges and Approaches. Smart Cities 2020, 3, 1039–1071. [Google Scholar] [CrossRef]
- Ertürk, M.A.; Aydın, M.A.; Büyükakkaşlar, M.T.; Evirgen, H. A survey on LoRaWAN architecture, protocol and technologies. Future Internet 2019, 11, 216. [Google Scholar] [CrossRef] [Green Version]
- Haxhibeqiri, J.; De Poorter, E.; Moerman, I.; Hoebeke, J. A survey of LoRaWAN for IoT: From technology to application. Sensors 2018, 18, 3995. [Google Scholar] [CrossRef] [PubMed] [Green Version]
- Barro, P.A.; Zennaro, M.; Degila, J.; Pietrosemoli, E. A smart cities LoRaWAN network based on autonomous base stations (BS) for some countries with limited internet access. Future Internet 2019, 11, 93. [Google Scholar] [CrossRef] [Green Version]
- A’ssri, S.A.; Zaman, F.H.; Mubdi, S. The efficient parking bay allocation and management system using LoRaWAN. In Proceedings of the the 2017 IEEE 8th Control and System Graduate Research Colloquium (ICSGRC), Shah Alam, Malaysia, 4–5 August 2017; pp. 127–131. [Google Scholar]
- Nor, R.F.A.M.; Zaman, F.H.; Mubdi, S. Smart traffic light for congestion monitoring using LoRaWAN. In Proceedings of the 2017 IEEE 8th Control and System Graduate Research Colloquium (ICSGRC), Shah Alam, Malaysia, 4–5 August 2017; pp. 132–137. [Google Scholar]
- Pasolini, G.; Buratti, C.; Feltrin, L.; Zabini, F.; Verdone, R.; Andrisano, O.; De Castro, C. Smart city pilot project using LoRa. In Proceedings of the European Wireless 2018, 24th European Wireless Conference, Catania, Italy, 2–4 May 2018; pp. 1–6. [Google Scholar]
- Liu, S.; Xia, C.; Zhao, Z. A low-power real-time air quality monitoring system using LPWAN based on LoRa. In Proceedings of the 2016 13th IEEE International Conference on Solid-State and Integrated Circuit Technology (ICSICT), Hangzhou, China, 25–28 October 2016; pp. 379–381. [Google Scholar]
- Basford, P.J.; Bulot, F.M.; Apetroaie-Cristea, M.; Cox, S.J.; Ossont, S.J. LoRaWAN for smart city IoT deployments: A long term evaluation. Sensors 2020, 20, 648. [Google Scholar] [CrossRef] [PubMed] [Green Version]
- de Castro Tomé, M.; Nardelli, P.H.; Alves, H. Long-range low-power wireless networks and sampling strategies in electricity metering. IEEE Trans. Ind. Electron. 2018, 66, 1629–1637. [Google Scholar] [CrossRef] [Green Version]
- Mdhaffar, A.; Chaari, T.; Larbi, K.; Jmaiel, M.; Freisleben, B. IoT-based health monitoring via LoRaWAN. In Proceedings of the IEEE EUROCON 2017-17th International Conference on Smart Technologies, Ohrid, North Macedonia, 6–8 July 2017; pp. 519–524. [Google Scholar]
- Hayati, N.; Suryanegara, M. The IoT LoRa system design for tracking and monitoring patient with mental disorder. In Proceedings of the 2017 IEEE International Conference on Communication, Networks and Satellite (Comnetsat), Semarang, Indonesia, 5–7 October 2017; pp. 135–139. [Google Scholar]
- Petäjäjärvi, J.; Mikhaylov, K.; Hämäläinen, M.; Iinatti, J. Evaluation of LoRa LPWAN technology for remote health and wellbeing monitoring. In Proceedings of the 2016 10th International Symposium on Medical Information and Communication Technology (ISMICT), Worcester, MA, USA, 20–23 March 2016; pp. 1–5. [Google Scholar]
- Bal, M.; Abrishambaf, R. A system for monitoring hand hygiene compliance based-on internet-of-things. In Proceedings of the 2017 IEEE International Conference on Industrial Technology (ICIT), Toronto, ON, Canada, 22–25 March 2017; pp. 1348–1353. [Google Scholar]
- Karimpour, N.; Karaduman, B.; Ural, A.; Challenger, M.; Dagdeviren, O. Iot based hand hygiene compliance monitoring. In Proceedings of the 2019 International Symposium on Networks, Computers and Communications (ISNCC), Istanbul, Turkey, 18–20 June 2019; pp. 1–6. [Google Scholar]
- Meydanci, M.A.; Adali, C.; Ertas, M.; Dizbay, M.; Akan, A. RFID based hand hygiene compliance monitoring station. In Proceedings of the 2013 IEEE International Conference on Control System, Computing and Engineering, Penang, Malaysia, 29 November–1 December 2013; pp. 573–576. [Google Scholar]
- Herbert, J.; Horsham, C.; Ford, H.; Wall, A.; Hacker, E. Deployment of a Smart Handwashing Station in a School Setting During the COVID-19 Pandemic: Field Study. JMIR Public Health Surveill. 2020, 6, e22305. [Google Scholar] [CrossRef] [PubMed]
- Sumbawati, M.S.; Chandra, H.A.; Wrahatnolo, T.; Ningrum, L.E.C.; Khotimah, K.; Fathoni, A.N. Design Automatic Hand Sanitizer Microcontroller Based using Arduino Nano and Ultrasonic Sensors as an Effort to Prevent the Spread of Covid-19. In Proceedings of the International Joint Conference on Science and Engineering (IJCSE 2020), Surabaya, Indonesia, 3–4 October 2020; pp. 136–140. [Google Scholar]
- Tadikonda, C. Smart Sanitizer Disperser with Level Monitoring. Turk. J. Comput. Math. Educ. (TURCOMAT) 2021, 12, 994–999. [Google Scholar]
- Chowdhury, B.; De, T. An Internet of Things Assisted Smart Hand Sanitizer with Health Monitoring System Help to Reduce Rapid Spread of COVID-19; 2516-2314; EasyChair: Manchester, UK, 2020. [Google Scholar]
- Wireless Dry Contact Sensors|Indoor/Smart Building|LoRa. Available online: https://radiobridge.com/products/wireless-contact-sensor (accessed on 27 March 2021).
- Radio Bridge Console. Available online: https://console.radiobridge.com/ (accessed on 27 March 2021).
- MultiTech Conduit®. Available online: https://www.multitech.com/brands/multiconnect-conduit (accessed on 27 March 2021).
- Cloud IoT Platform|Internet of Things|TagoIO. Available online: https://tago.io/ (accessed on 27 March 2021).
- Penn State University Libraries. Available online: https://digital.libraries.psu.edu/digital/collection/psuimages/id/380 (accessed on 27 March 2021).
- LoRa—LoRa Documentation. Available online: https://lora.readthedocs.io/en/latest/#rssi (accessed on 27 March 2021).
- Gambi, E.; Montanini, L.; Pigini, D.; Ciattaglia, G.; Spinsante, S. A home automation architecture based on LoRa technology and Message Queue Telemetry Transfer protocol. Int. J. Distrib. Sens. Netw. 2018, 14, 1550147718806837. [Google Scholar] [CrossRef] [Green Version]
- Carminati, M.; Sinha, G.R.; Mohdiwale, S.; Ullo, S.L. Miniaturized Pervasive Sensors for Indoor Health Monitoring in Smart Cities. Smart Cities 2021, 4, 146–155. [Google Scholar] [CrossRef]


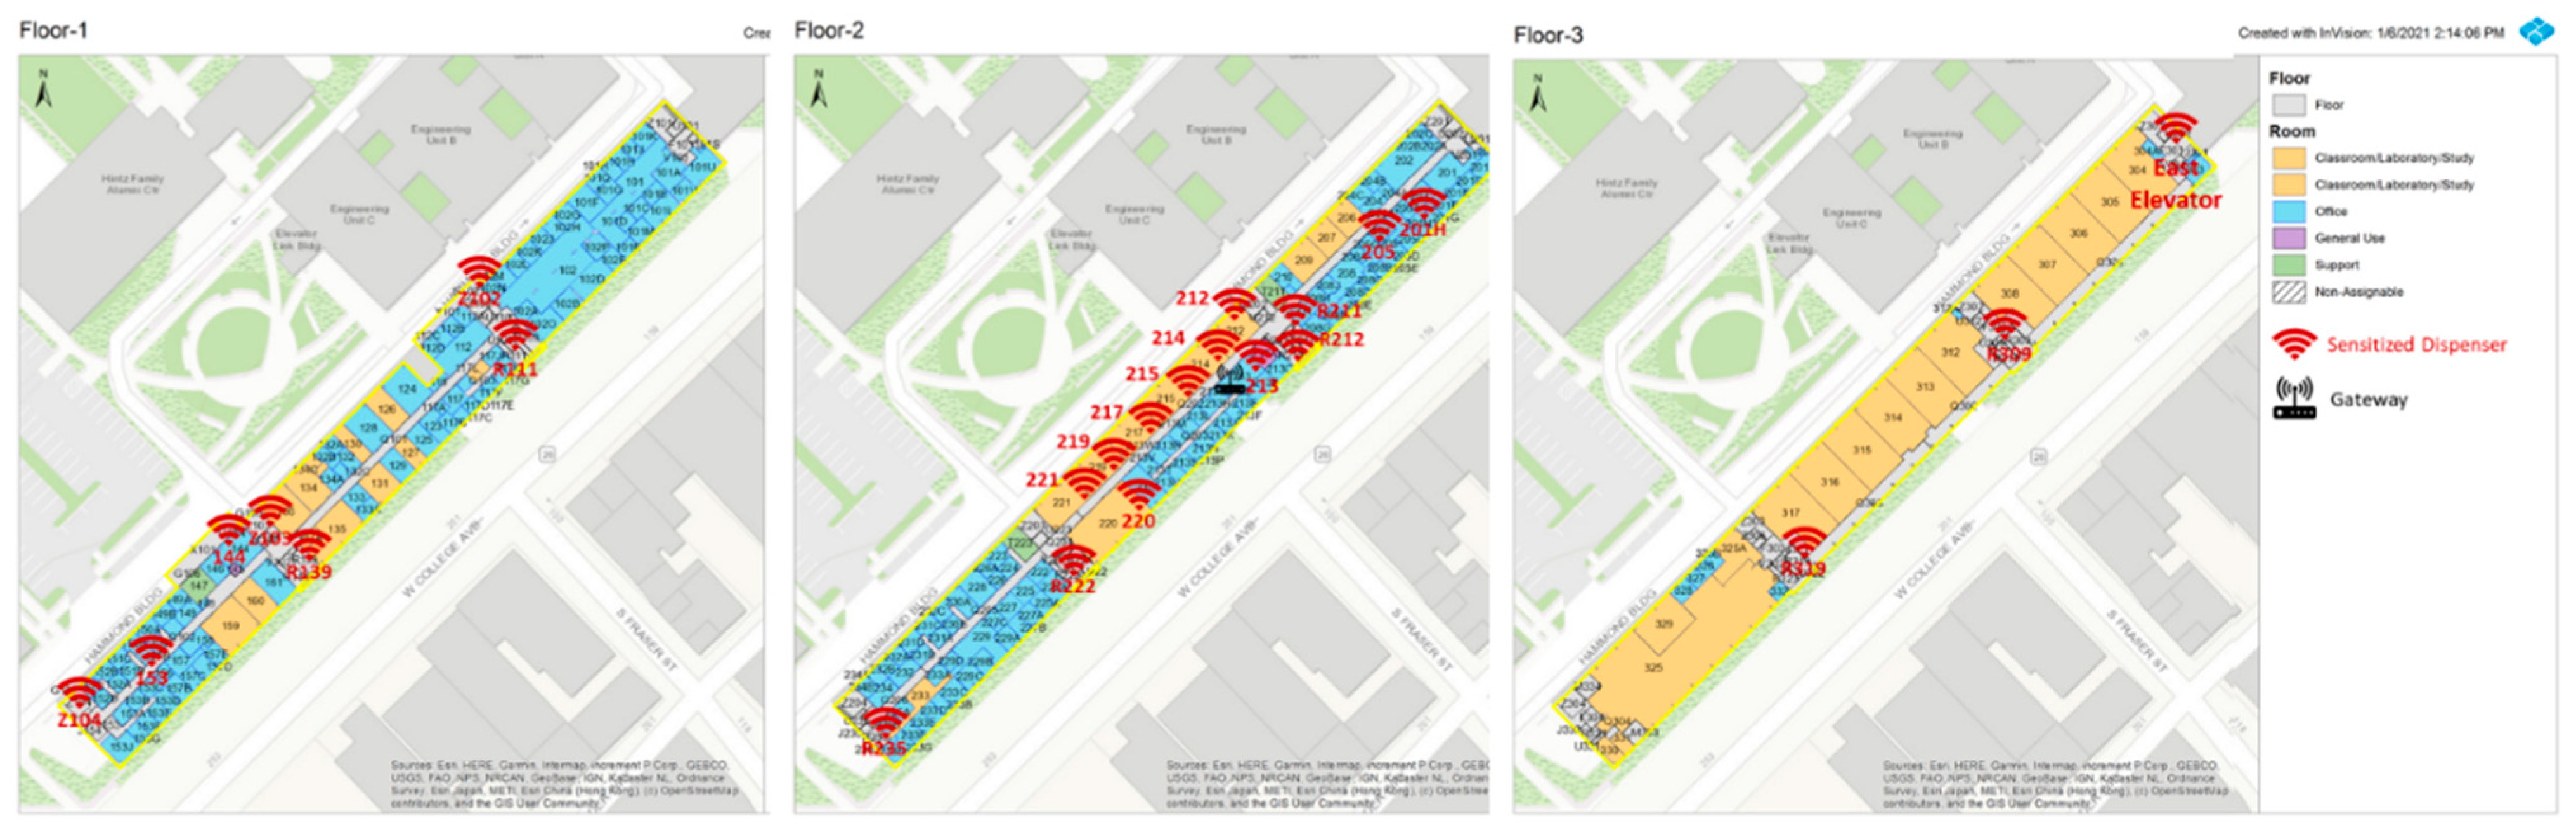
| Device | Location |
|---|---|
| Gateway | 2nd Floor (213) × 1 |
| Sensors | 1st Floor × 7 |
| 2nd Floor × 14 | |
| 3rd Floor × 3 |
| Real Time | 1-min Interval | |||
|---|---|---|---|---|
| Experiment | Count | Error Rate | Count | Error Rate |
| 1 | 3 | 0.7 | 9 | 0.1 |
| 2 | 2 | 0.8 | 10 | 0 |
| 3 | 2 | 0.8 | 9 | 0.1 |
| 4 | 3 | 0.7 | 10 | 0 |
| 5 | 3 | 0.7 | 7 | 0.3 |
| 6 | 3 | 0.7 | 10 | 0 |
| 7 | 5 | 0.5 | 10 | 0 |
| 8 | 3 | 0.7 | 9 | 0.1 |
| 9 | 3 | 0.7 | 10 | 0 |
| 10 | 3 | 0.7 | 10 | 0 |
| Average | 3 | 0.7 | 9.4 | 0.06 |
| Location | Average of RSSI | Received Messages | Error Rate |
|---|---|---|---|
| Westmost entry | −108.5 | 2 | 0.997 |
| 212 classroom | −64.83 | 6 | 0.992 |
| 213 lobby | −37.86 | 7 | 0.990 |
| 219 classroom | −84.43 | 7 | 0.990 |
| Mail room | −102.86 | 7 | 0.990 |
| R111 | −62.57 | 7 | 0.990 |
| R309 | −81.86 | 7 | 0.990 |
| 220 large classroom | −79.1 | 690 | 0.042 |
| D139 | −78.4 | 690 | 0.042 |
| 214 classroom | −55.6 | 695 | 0.035 |
| R211 | −63.48 | 696 | 0.033 |
| R212 | −63.47 | 696 | 0.033 |
| R222 west elevator | −77.22 | 696 | 0.033 |
| Stairs near walk thru | −78.03 | 696 | 0.033 |
| 153 | −98.97 | 697 | 0.032 |
| 221 classroom | −86.05 | 697 | 0.032 |
| 215 classroom | −55.01 | 698 | 0.031 |
| Stairs by parklet | −102.45 | 698 | 0.031 |
| 201H east elevator | −95.68 | 699 | 0.029 |
| 217 classroom | −74.12 | 700 | 0.028 |
| 3rd floor east elevator | −100.11 | 702 | 0.025 |
| R319 | −94.35 | 703 | 0.024 |
| R235 | −96.29 | 704 | 0.022 |
Publisher’s Note: MDPI stays neutral with regard to jurisdictional claims in published maps and institutional affiliations. |
© 2021 by the authors. Licensee MDPI, Basel, Switzerland. This article is an open access article distributed under the terms and conditions of the Creative Commons Attribution (CC BY) license (https://creativecommons.org/licenses/by/4.0/).
Share and Cite
Zhao, J.; Zhou, B.; Butler, J.P.; Bock, R.G.; Portelli, J.P.; Bilén, S.G. IoT-Based Sanitizer Station Network: A Facilities Management Case Study on Monitoring Hand Sanitizer Dispenser Usage. Smart Cities 2021, 4, 979-994. https://0-doi-org.brum.beds.ac.uk/10.3390/smartcities4030051
Zhao J, Zhou B, Butler JP, Bock RG, Portelli JP, Bilén SG. IoT-Based Sanitizer Station Network: A Facilities Management Case Study on Monitoring Hand Sanitizer Dispenser Usage. Smart Cities. 2021; 4(3):979-994. https://0-doi-org.brum.beds.ac.uk/10.3390/smartcities4030051
Chicago/Turabian StyleZhao, Junqi, Boyang Zhou, Jared P. Butler, Randall G. Bock, Joseph P. Portelli, and Sven G. Bilén. 2021. "IoT-Based Sanitizer Station Network: A Facilities Management Case Study on Monitoring Hand Sanitizer Dispenser Usage" Smart Cities 4, no. 3: 979-994. https://0-doi-org.brum.beds.ac.uk/10.3390/smartcities4030051