
Harmonic and Supraharmonic Emissions of Plug-In Electric Vehicle Chargers


Dipartimento di Ingegneria Navale, Elettrica, Elettronica e delle Telecomunicazioni—DITEN, University of Genova, 16145 Genova, Italy
Smart Cities 2022, 5(2), 496-521; https://0-doi-org.brum.beds.ac.uk/10.3390/smartcities5020027
Submission received: 1 February 2022
/
Revised: 2 April 2022
/
Accepted: 6 April 2022
/
Published: 9 April 2022
(This article belongs to the Special Issue Feature Papers in Section Smart Grids)
Abstract
:Electric vehicle (EV) charging represents a relevant electric load with a rapid evolution in terms of number, power rating and distortion, in particular, considering the connection to the low-voltage public grid: available short-circuit power may be limited and particularly susceptible loads may co-exist in the same grid portion. Standards can partially address the problem covering only the harmonic interval, but they necessitate significant extension and improvement in the supraharmonic range. In addition, EV chargers have been observed to violate in some scenarios the applicable harmonic limits, so that the mechanisms of emission and distortion should be better understood and evaluated, including phenomena of mutual influence between EV chargers and with pre-existing grid distortion. Although models can help simulate large-scale scenarios in terms of fundamental frequency phenomena, such as power flow, voltage fluctuation and imbalance, substantial and reliable information can come from experimental results, providing measured harmonic and supraharmonic emissions, accompanied by details on loads mix, grid characteristics and EV charger operating conditions. This work thus defines the applicable constraints in terms of limits and compatibility levels for public and light industrial low-voltage grids, discusses the available experimental results and datasets, analyzing the typical distortion behavior and providing indication of sources of information for further studies.
1. Introduction
It is established that the number of electric vehicles (EVs) for private and public mobility is increasing, not only in absolute terms, but also compared to the total fleet of circulating vehicles [1,2]. This has been fostered also by economic incentives, a slight reduction of prices and the incoming publicized ban for vehicles running on conventional fossil fuels: some cities announced circulation prohibition for such vehicles around 2030, as well as entire countries announcing a stop of sales, following the “green package” that the European Union disclosed on 14 July 2021 [3].
EV advantages are well recognized mainly as [4]:
- Ecologically friendly with negligible direct polluting emissions;
- Indirect emissions are also lower, if more efficient generation at the source and the possibility of exploiting renewables are considered;
- Higher energy efficiency and better performance than conventional fossil-fuel vehicles;
- Reduced noise, especially at low speed amid cities.
On the other hand, disadvantages reside in a still uncertain duration of batteries and the way they can be recycled or disposed of, the convenience and duration of a recharge operation compared to conventional refuel at the gas station, and the overall impact on the existing electric network, in addition to the necessary improvements in terms of planning, infrastructure and operation. On this latter aspect, there have been significant efforts for simulating and evaluating the power demand, its dynamic behavior and the adequacy of the electric infrastructure (in particular the Low-Voltage, LV, distribution network and the Medium-Voltage, MV, feeding points).
In particular, the following technical aspects have been evaluated in the available literature:
- Voltage unbalance, troublesome in the case of numerous, albeit low-power, single-phase charging loads;
- Verification of suitability of LV distribution elements, such as MV/LV cabin transformers and feeders;
- Balancing power demand by economic incentives and regulations to push the peaks of exploitation to more attractive times of the day.
Many of the works addressing even the most technical and low-level interfaces and phenomena are based on simulated data, for an obvious reason of availability and readiness [10,11,12,13]. It is recognized that simulated charging patterns and profiles on the one hand may be realistic, representative and quite close to the measured data available, and on the other hand, may allow the application of induced artificial variability, probabilistic behavior and statistical dispersion, which would not otherwise be possible with purely experimental data. The accuracy and reliability of simulated data and synthetic time series are discussed among others in [14,15], focusing on EV load, charge profile and locations, without exploring the details of the EV electric behavior. This was carried out in [16], integrating EV and LV distribution grid models from a probabilistic perspective.
The impact on the electric distribution network, however, should be also evaluated and discussed in Power Quality (PQ) terms, as EV charging represents a significant source of distortion. Especially for integration with renewable source and storage and for decoupling from the public AC grid, DC grids are a significant viable solution [17,18,19], that deserves attention in terms of enhancing PQ and efficiency; this is a solution currently under investigation for ultra-fast charging. However, considering an ubiquitous, direct and presently ready implementation of EV charging, the connection to the public AC grid is the most relevant interface, for which some points should be taken in due consideration:
- On-board chargers may differ significantly among EV models, especially considering the span of fabrication date and of power levels, from small vehicles to sport cars and to public transportation means;
- Distortion patterns may change during the charging process as a function of the state of charge, of the absorbed current intensity and the charging mode;
- For the widespread use of power converters and smart conversion methods to enhance flexibility and efficiency, distortion patterns are not only various, but extend significantly in the supraharmonic range (namely, 9–150 kHz), where switching components and their harmonics are easily visible;
- Superposition of low- and high-frequency distortion and secondary emissions (distortion caused by a converter subject to network voltage distortion, such as caused by other converters) are more important as the mix of connected EV chargers becomes more complex.
All such points can be effectively addressed with extensive and comprehensive measurements, carried out with adequate hardware and methods for both harmonic and supraharmonic frequency intervals and phenomena. There is, in particular nowadays, a common agreement on the relevance of supraharmonics as a distortion phenomenon with significant penetration and non-negligible intensity, relevant for ageing of network components, disturbance to connected loads and network stability [18,20,21,22,23].
This work thus evaluates PQ issues and the impact of the charging process, discussing various findings both for harmonic and supraharmonic phenomena, including identifying available repositories of experimental data.
The paper continues with Section 2, where charging architectures are briefly reviewed, together with a description of typical distortion phenomena. Section 3 provides an overview of available experimental results and a quantitative assessment of the relevance of distortion caused by EV charging; it includes elements such as superposition and aggregation, preexisting network distortion, comparison of harmonic and supraharmonic limits, discussing the formulation of suitable emission limits for the latter. Section 4 reports selected works providing extensive sets of data, which are compared and cross-checked for consistency and relevance.
2. EV Charging Modes and Architectures
From a general high-level standpoint, we may distinguish, first of all, between Conductive Charging (CC) and Wireless Charging (WC), or more generally, Wireless Power Transfer (WPT) to include feeding of vehicle during run, besides charging its on-board battery. In terms of performance, both approaches require a large amount of deployed power, or that charging times be compatible with typical acceptable waiting times at the gas station for the former and acceptable vehicle speed when running over the WPT coil system for the latter. Charging at home during, e.g., the whole night, of course, does not need such power level, also to necessarily accommodate for the lower available power at the feeding point (higher short-circuit impedance of residential LV distribution). The CC high-level advantages and disadvantages are well summarized in Table 1 of [13]:
- Different charging power levels may be negotiated during one charge session thanks to the communication channel between the intelligent socket and the on-board logic; it is observed that, for example, fast charging may be allowed only when grid conditions are suitable, such as when there is no risk of abnormal voltage fluctuations and grid instability;
- Communication supports also the V2G (vehicle-to-grid) mode [24], particularly useful when the EV is available connected for long times (such as a work day or an entire night at office and home, respectively); the V2G operation, however, reduces expected battery life;
- Higher efficiency compared to, e.g., wireless power transfer at the cost of a direct injection of distortion into the grid.
Focusing on CC, a distinction may be drawn between off-board and on-board charging configurations. The latter is the most relevant, with on-board chargers differing from vehicle to vehicle and connecting directly to the LV distribution grid. The off-board charger has instead an optimized installation for the dedicated feeder it is connected to, which is then more tolerant to distortion and conducted disturbance thanks to the much lower short-circuit impedance.
In agreement with IEC 61851-1 [25], charging modes range from 3.7 kW to 43 kW, with an additional 200 kW ultra-fast charge mode (mode 4) [17,26]. The first three modes are compatible with AC feeding points: single phase of 16 A and 32 A (corresponding to mode 1 and 2, with 3.7 and 7.4 kW, respectively) and three-phase socket of 32 A and 63 A (corresponding to mode 2 and 3, with 22 and 43 kW, respectively). EV charging possibilities are made more complex by a wide range of connectors [4], integrating AC pins for the first three modes, DC pins in some models for additional mode 4 ultra-fast charge and a set of communication pins.
The design of the on-board charger conversion system aims first of all at energy efficiency and reduced space, weight and number of components, besides a suitable electric interface to the AC grid with unity power factor (pursuing minimization of reactive power at fundamental and reduction of low-order harmonics, providing a fairly sinusoidal current waveform). Bidirectional power flow is an additional feature to support e.g., V2G functionality.
The front-end converter for connection to the AC grid is a rectifier (AC–DC converter) that in general is based on a traditional diode bridge or on an active bidirectional rectifier in half or totally controlled arrangement, featuring MOS or IGBT devices (the latter shown in Figure 1a). The reasons for the latter solution are: lower voltage drop across active devices than using diodes and better control of input power factor and waveshape (power factor correction), largely reducing reactive power and low-order harmonics compared to a diode rectifier.
Although in general passive and active power factor correction (PFC) exist, all modern power converters use active PFC, generically indicated as PFC in the following:
- Single-phase diode rectifiers are followed by a full-rated boost converter (DC–DC step-up converter);
- The solution is not directly suitable for three-phase bridges (so for higher power levels), although three interleaved PFC boost converters may be used;
- The active rectifier solution can control voltage and current vectors over a wide range of conditions and is equally applicable to single- and three-phase connections; however, being usually decoupled with series inductors to the grid, necessitates a compensating inner current loop to improve speed of response [27];
- An attractive solution that allows downrating the PFC circuit is the use of a shunt connected active power filter, which is sized for approximately 40% of the rated power of the diode rectifier [28].
More elaborated architectures, especially ones achieving higher efficiency and better sharing of higher voltage among devices, can be based with neutral-point clamped (NPC) converters [29,30], exemplified in Figure 1b,c.
The basic distortion of three-level inverters using various types of optimized PWM schemes for harmonic distortion reduction, besides efficiency improvement, is in the order of 15–25% for the line voltage, and about 1/3 to 1/5 for line current distortion, considering normal values of resistive-inductive feeding impedance [31,32,33]. For high power levels, interleaving of elementary converters brings along harmonic reduction thanks to the reduced ripple and increased equivalent switching frequency.
Alternative advanced solutions to harmonic distortion reduction require increasing the number of levels, implementing an asymmetrical structure, where dc voltages are not equally shared among modules, as well as the switching frequency [34]. The proposed modulation in fact provides high-frequency switching only for few cells with lower dc voltage providing a kind of fine regulation of the voltage shape, while reducing overall switching losses. The attained THD is less than 25% of a standard NPC converter and about 60% to 90% of the THD of a symmetric voltage converter. The studied frequency range extends to the 150th harmonic, which for the 50 Hz mains corresponds to kHz, making it clear that harmonically related emissions extend nowadays well above the conventional 2 kHz boundary [35].
The basic PWM scheme has been subjected to several optimizations for reduction of harmonic distortion, such as:
- Zero dead-time PWM that improves the THD by about a factor of two [32] without exposing the converter to the shoot-through risk, since the implemented switching pattern does not allow to activate consecutively two switches of the same leg;
- Random PWM, which avoids the peaks of emission at the switching frequency harmonics, but increases the remaining spectrum significantly, de facto providing only a partial solution.
With the extensive use of PFC, low-frequency harmonic distortion problems have been largely mitigated, shifting distortion to higher frequency, as a byproduct of waveform manipulation to achieve PFC and mixing with the distortion of the DC–DC converter downstream for DC bus regulation. The impact of PFC on the AC grid materializes as typical pulse width modulation bands for active rectifier implementations, or oscillating pulses, named zero-crossing oscillations in [36]: such pulses have frequency occupation in approximately the 2–10 kHz range [37,38] and can cause excessive stress and interference in equipment and components, with consequential malfunction and damage [36].
The increase of the switching frequency values of modern converters and the extensive use of the PFC have increased emissions in the supraharmonic range causing higher levels of distortion and network pollution. This has been favored by the absence of limits of emissions as it will be discussed in Section 3. Reduction of such supraharmonic emissions is surely possible by the effect of differential filters of the LCL type (preferable to the CLC ones so as to prevent network instability and to keep network impedance at higher values, hindering then supraharmonic components propagation). The adoption of such filters is, however, avoided when not compulsory, as they add weight and increase losses, in particular, due to the two series inductors.
DC bus regulation downstream is implemented by means of a range of DC–DC converter types:
- Buck, buck–boost, Cuk, Sepic for non-isolated architectures;
- Single or dual active bridge (SAB and DAB), or even dual half bridge (DHB), providing galvanic isolation.
Galvanic isolation at basic insulation level is mandatory as per ISO 6469-3 [39] to ensure electrical safety, possibly extended to a double or reinforced insulation, as one of the measures covering both basic and fault protection.
Whatever the DC–DC converter downstream, its input current ripple will be reflected upstream on the AC network, mixing its switching components to those of the input rectifier. The typical shape of the series inductor scheme is a triangular waveform, whose Fourier spectrum decreases rapidly; if designed for 10% ripple at the switching frequency, the first harmonic of order 3 is about 1% and negligible. In case of resonant operation, there will be an almost sinusoidal current that in some operating intervals (e.g., high power) may be distorted by even components [40]. In general, current distortion is limited to a few % and only the fundamental at the resonant frequency can be retained; the portion reaching the AC network upstream is quite limited by the local DC link capacitor, whose action is facilitated by the extremely large resonant frequency, an order of magnitude higher than the switching frequency of non-resonant DC–DC converters.
The DAB converter is made by operating in resonant conditions to achieve high efficiency and reduced size, although it is difficult to maintain a zero voltage or current switching condition for a wide range of load levels. Resonant behavior is achieved by adding a capacitor in series with each of the two windings of the intermediate transformer, possibly including a separate series inductor to better control the resonance frequency and to bring it to lower values.
Often, a designer’s attention is focused on high loading levels to achieve fast charging rates, with EV connection lasting for a short time. If, conversely, home and office charging is considered, then the connection may last much longer and reduced loading levels may be used. The optimal design of an EV on-board charger must reconcile then these two opposite scenarios, especially in terms of efficiency and distortion.
Battery cell equalization is another operation that contributes to high-frequency distortion and emissions: various arrangements may be implemented, employing buck–boost or switched-capacitor elementary converters, exchanging energy between cells from higher-voltage ones to lower-voltage ones [41]. Equalization may be started at any time by the battery management system (BMS), asynchronously and not related to any particular state of charge. It will then last for time intervals that may range from some to several tens of minutes depending on the level of unbalance and the adopted stop criteria. Although cell equalization does not have a remarkable influence on harmonic distortion, it does in terms of conducted emissions at higher frequency. Based on personal experience, it causes a significant variability of conducted emissions in the tens of kHz to a few MHz, impacting on the repeatability of otherwise identical test sequences.
3. Distortion Limits and Assessment
This section discusses the limits applicable to EV chargers for the harmonic and supraharmonic frequency intervals, also providing information on the so-called compatibility levels, so the expected maximum disturbance levels to expect in a given environment (in the present case, a type of distribution grid, such as residential, light industrial, etc.) It is observed that the correct process proceeds from the definition of tolerable levels of disturbance (in terms of voltage) and then, based on three factors, limits for individual loads are stipulated (in terms of current). The three factors are:
- Propagation or attenuation of emissions from the respective connection points along the network;
- Characteristics of phase angle distribution and degree of superposition and compensation;
- Network impedance transforming current emissions of loads into network voltage distortion.
It is immediately clear that all three elements above have widely different behavior for harmonics and supraharmonics, and for the latter, in particular, over a considerably wide frequency interval. Attenuation depends significantly on frequency; phase distribution of emissions depends on the power conversion process, the degree of synchronization to the network fundamental, etc.; impedance curves are then shaped by resonances and anti-resonances and have a general increase of amplitude and flattening of peaks with increasing frequency.
3.1. Harmonics and Supraharmonics Limits
Distorting loads are in general subject to regulatory limits for what regards first of all harmonics, and then overall harmonic distortion and emissions at higher frequency. There is a dichotomy for which compatibility levels for the electric network the load is connected to are specified as tolerable voltage distortion and then apportioned to each load in terms of current distortion limits. This process assumes certain characteristics of the network and a certain mix of loads: the latter is bound to change with the increase of distorting loads that are diffusely connected to LV distribution nowadays, as in the present case of EVs. The various compatibility levels and limits of emission are reviewed in the following, distinguishing the more consolidated harmonic interval (up to the 40th harmonic order, namely, 2 kHz or 2.4 kHz for 50 Hz and 60 Hz mains fundamental, respectively), and the supraharmonic interval above it.
3.1.1. Harmonic Frequency Interval
For public LV distribution networks, compatibility levels are indicated in the IEC 61000-2-2 [42] which summarizes the tolerable voltage distortion for the harmonic interval up to the 40th order, as shown in Figure 2.
As the scenarios of EV charging extend to both residential and office environments, possibly including light industrial environment (in case charging is carried out at small factories and workshops), the IEC 61000-2-4 standard [43] should be considered as well. The IEC 61000-2-4 defines three classes of environments:
- Class 1: protected supplies with compatibility levels lower than public networks, representing, e.g., laboratories with measurement and scientific equipment;
- Class 2: light industrial environment that may be without (class 2a, office) or with (class 2b, office + light industry) industrial power electronic equipment; in case of class 2b, there is no separation by a supply transformer between the office-like and the light industrial parts of the network;
- Class 3: heavy industrial environment with power converters, welding machines, motors starting and stopping frequently.
Our discussion focuses mainly on the class 2 environment, being sensible that, in case of EV charging, this is connected before the local protected supply, thus, to a public (IEC 61000-2-2) or light industrial (IEC 61000-2-4, class 2) network. The compatibility levels for voltage distortion are shown in Figure 3.
The class 2a values, as expected, correspond to those indicated in the previous Figure 2 regarding the IEC 61000-2-2, but not completely: low-order even harmonics are twice as large for the former.
For LV low-power equipment limits are established in the IEC 61000-3-2 standard [44], whose scope encompasses all electrical equipment (both single-phase and three-phase) absorbing no more than 16 A (charging mode 1) and connected to the LV public network. For larger current levels, the reference standard is the IEC 61000-3-12 [44] for electrical equipment absorbing more than 16 A and up to 75 A, thus encompassing the other two charging modes 2 and 3.
The applicability of IEC 61000-3-2 for chargers with Mode 1, i.e., with absorbed current up to 16 A, is not so clear and straightforward, as the standard was not originally conceived for such equipment and thus all reported examples and considerations are applicable to other types of equipment, such as portable electric tools, lighting devices, electric appliances, and so on. However, the product standard IEC 61851-21-1 [45] makes explicit reference to both IEC 61000-3-2 and to IEC 61000-3-12 with a short-circuit ratio of 33. In addition, authors in [21] confirm the compulsory applicability of IEC 61000-3-2 (of course in its CENELEC equivalent version) before marketing of chargers within the European Union.
In case of charging through a private electric network that is in turn connected to the public network at the Medium- or High-Voltage level, the standard to take into consideration is the IEC 61000-3-6. This latter case is representative of a charging facility, such as a modern gas station, and allows an overall compensation of the aggregated distortion of the connected loads downstream the connection to the public grid. It will not be further considered, because it is a special case covered by harmonic flow studies and specific control measures, depending on the available short-circuit ratio at the feeding point. The focus of this work, instead, is on the impact on the public network at the LV level, as for residential and office charging of EVs.
Regarding harmonic distortion, the IEC 61000-3-12 [46] indicates a total current harmonic distortion (THC) and a weighted version, that is defined starting from order 14, and it is thus called partial weighted harmonic current (PWHC):
The limits of current distortion for the direct connection to the public network are reported in Table 1 for the IEC 61000-3-2 [44] (class A, applicable to 16 A chargers) and in Figure 4 and Figure 5 for the IEC 61000-3-12 [46].
A specific table of the IEC 61000-3-12 standard (Table 5) specifies a separate limit of 1% for even harmonics above order 12, instead of including them all comprehensively in the Total Harmonic Distortion (THD) for current (THC). This particular condition applies to equipment with either particularly low 5th and 7th harmonics (less than 3%), or with a 5th harmonic phase evenly distributed over the whole 0–360 or consistently located in a favorable 150–210 sector.
Observing the stipulated compatibility levels and current limits for the harmonic interval, it is possible to reason on how the three factors at the beginning of this Section 3 have been taken into account. This is a useful exercise carried out in Section 3.2 covering supraharmonics, for which limits of emissions are not available, but only compatibility levels.
3.1.2. Supraharmonic Frequency Interval
The 2–150 kHz interval has been recently extensively considered for the distortion and commutation byproducts of a wide range of devices and equipment, such as LED lamps, fluorescent lamps (CFLs) and Switched Mode Power Supplies, that are quite widespread in residential, office and light-industrial environments. The relevance of emission components in this frequency range is built around the following points:
- Large penetration in supply networks, undergoing marginal attenuation similar to high-order harmonics;
- Potential disturbance to metering and control equipment, as well as to power line carrier (PLC) devices;
- Possible excitation of network resonances, in particular considering the small LV grids of limited extension.
The IEC 61000-2-2 [42] addresses supraharmonic distortion with compatibility levels added in the new 2017 version, ranging between 2 kHz and 150 kHz, specifically for nonintentional emissions (as mains signaling is considered separately). Limit values and graphical representation are shown in Figure 6.
Similarly, the IEC 61000-2-4 defines compatibility levels for equipment connected to LV distribution, distinguishing between unbalanced loads (that cover single-phase EV chargers rated in the range of 16 to 32 A) and balanced three-phase loads. They are reported in Figure 7, distinguishing between Industrial, Residential and Special environments, the most suitable one being the second for EV charging at home or office.
Such levels are defined using a 200 Hz bandwidth invoking the IEC 61000-4-7 [47] grouping for frequencies between 2 and 9 kHz, and in line with measurements for non-narrowband phenomena, regulated by CISPR 16-1-1 [48].The standard, however, does not go into detail regarding the definition of such bandwidth, i.e., as resolution bandwidth of a frequency domain scan measurement or frequency resolution of a Fourier-transformed time-domain signal [49,50].
An important point regards the implicit assumptions for the definition of such levels as stated by the IEC 61000-2-2: at a given location, the disturbance level in a same bandwidth interval of 200 Hz is assumed not to result from more than two pieces of equipment generating nonintentional emissions close to the emission limit at the same time. Now there are two terms that deserve some further attention:
- The concept of location should be better defined, as for LV distribution, it may mean the same part of the LV grid, or the entire LV grid that is fed from the same MV/LV transformer, representing a decoupling point; in both cases, it is easy to see that several EVs can be plugged at the same time (during the day at the office, during the night at home) in a small portion of the LV network;
- The “same bandwidth interval of 200 Hz” could exclude the combination of different sources of emission, but in a real scenario the number of different EV models is not so large (9 BEVs were considered in [51] and a few had similar emissions).
Unfortunately, there are no supraharmonic limits applicable to LV equipment, and in particular, EV charging converters. Limits are again applied above 150 kHz for what is referred to as radio-frequency conducted emissions, what is worth recalling are unsymmetrical voltages, measured with respect to ground, and not differential-mode line-to-line voltages, as for harmonics and supraharmonics. The IEC 61000-2-4 indicates that, according to CISPR 16-2-1 [52], suitable emission limits are 6 dB lower than those for differential-mode emissions. Regarding RF emissions, in fact, the IEC 61851-21-1 refers to the residential/light-industry limits of the IEC 61000-6-3.
3.2. Extrapolation of Supraharmonic Limits
In order to attempt an estimation of suitable current emission limits in the supraharmonic range, a comparison between harmonic and supraharmonic compatibility levels may be carried out by quantifying a proportion factor, to transfer then to the emission limits, starting from the existing harmonic current limits. A point to consider is the identification of bandwidth values for homogeneous comparison of compatibility levels: together with the said bandwidth, a harmonic bandwidth may be identified, considering the 200 ms time widow used by the IEC 61000-4-7. The amplitude conversion factor between the two types of evaluations (or “measurements”) is then
It is thus possible to verify that the ratio of compatibility levels is close to this value: referring to Figure 2, the average amplitude values are V or V, taking the last ten and five harmonics, respectively; supraharmonic levels in Figure 6 account for V.
Multiplication of harmonic levels by gives values of V and V that are below the V value by 10 % and 24.6 %, respectively. This could be justified only assuming a higher immunity to disturbance in the lower supraharmonic range, an assumption that is not well grounded; in fact, there is a tiny difference of less than one octave between the two regimes, positioned at 1.5–2.0 kHz and 2–3 kHz for harmonics and supraharmonics, respectively. The conclusion is that tolerable supraharmonic levels seem slightly overestimated by 1 to 3 dB approximately.
By extension, harmonic current limits suitable for public LV network can be projected onto the supraharmonic interval, covering scenarios of office and light industrial networks of class 2a, and possibly covering at some extent class 2b. Harmonic compatibility levels (see Figure 6) expressed in voltage units can be compared to current emission limits (see Table 1), to derive, in order, an estimate of the “impedance effect” and margins for multiple sources assumed by the standardization committees. The simple ratio below includes effects of network impedance and multiple sources and is thus indicated as :
where and denote the compatibility level and the emission limit for LV public networks.
Such values are shown in Figure 8 for the harmonic interval where both and are available. Odd and even harmonics have been separated, and among odd ones, those named “characteristic” are distinguished from the noncharacteristic ones. Even and odd characteristic harmonics are then selected to assign them a specific behavior for what regards aggregation: for a given number of alike sources n, it is assumed that partial cancellation may occur for the even ones, which in principle have a random phase distribution (not being closely related to the power conversion process mechanisms), whereas characteristic ones are assumed to sum in phase (that is correct for a wide range of loads, e.g., featuring front-end rectifiers, as demonstrated later in Section 4.2).
The consequence is that the total current value at each harmonic frequency increases with and n for the two categories of harmonics, respectively. Even and odd characteristics harmonics were selected for this quite different behavior with respect to aggregation: such simplifying assumption has some arbitrariness, but allows to keep two well-separated behaviors as reference and is justified for the objective of extrapolating to the supraharmonic range.
The recalculated impedance considering a number n of aggregated harmonic sources is also shown in Figure 8, where the value (corresponding to the triangle symbol) was selected to have the two recalculated impedance curves for even () and odd characteristic () harmonics almost overlap. A second larger value is shown for comparison (square symbols). Approximate overlap is a condition supported by the assumption that the real network impedance is continuous and cannot take too many different values for adjacent frequency bins. It turns out to be reasonable then that a total of about sources including some margin was assumed when stipulating limits. If the assumption of in-phase sum does not fully hold for characteristic harmonics, then a slightly larger number n could be applied.
It is also worth noting that the estimated network impedance is in the order of 3 to 5 at 2 kHz, in line with the reference impedance values of IEC 61000-4-7 [47] and compatible with a 5 LISN value [54], applicable yet to unsymmetrical impedance starting at 9 kHz. The simple linear extrapolation with frequency of the reactive part of the reference impedance of the IEC 61000-3-11 [55] yields an excess of impedance (the purple curve in Figure 8) not in agreement with the general observed behavior. In fact, in addition, a confirmation comes from [56], where impedance values similar to the above appear, although resonance phenomena are also pointed out, which may increase locally impedance values by a factor of 2–3, depending on losses. It is remarkable that the number of sources of distortion connected to the same small portion of the grid (e.g., one home, office or small group of them) has recently increased well above the assumed “10” or thereabout, and that EVs will add on top a significant contribution.
When aggregating supraharmonic emissions, a random phase distribution may be certainly assumed, given the mechanisms of generation, not synchronized to the mains. It is also sensible to presume that the number of sources responsible for a specific emission component is smaller than for the harmonic interval, where emission components are rigidly located at harmonic frequencies, synchronized to the mains fundamental. As for network impedance, values typical of the harmonic interval cannot increase steadily with frequency and may undergo significant variations as a consequence of network resonances and anti-resonance. Referring again to [56], impedance values keep approximately at the 2 kHz value or increase slightly under specific configurations of network parameters in the first decade or so. Stiegler et al. [57] show two main points: the IEC 61000-4-7 impedance is the envelope of the largest measured impedance values in four different countries (Austria, Switzerland, Czech Republic and Germany) and reaches values even larger than those provided by the LISN impedance curve [54]; the 95th percentile profile instead has a much more reasonable behavior, whilst still providing a robust estimate. Such a 95th curve has the following values: 3 at 2 kHz, 6 at 20 kHz, 12 at 50 kHz, 18 at 100 kHz and 18 at 150 kHz, for what is shown in [57].
Compatibility values in Figure 6 can thus be translated into current limits for the supraharmonic range, based on the measured LV public network impedance values provided in [57] and assuming randomly distributed sources with emissions occurring in the same measuring RBW interval. The result is shown in Figure 9.
3.3. Distortion Measurement and Assessment
Standards discussed so far to limit and establish a reference for harmonic and supraharmonic distortion rarely specify processing methods and settings by which spectral components should be derived and their amplitude estimated. Another aspect that deserves attention regarding the accuracy of the assessment of emissions is the method with which time-domain signals are processed and evaluated, not only in terms of the time interval to report averaged values (200 ms, 3 s and 10 min with reference to IEC 61000-4-7 [47]), but also regarding spectral leakage control (in particular with the adoption of specific smoothing windows [58]) and the influence on spectral amplitude estimate [49].
3.3.1. Time Window, Frequency Resolution and Grouping
Especially for static converters of significant power rating, which use a relatively large switching frequency and techniques to improve efficiency above other exigencies (such as minimization of conducted emissions), the characteristics of differential- and common-mode emissions may be such to require wise selection of settings to improve amplitude estimate uncertainty and reproducibility. The AC input quantities waveshape is in fact characterized by the superposition of power factor control stage byproducts and ringing phenomena occurring at each switching, possibly adopting zero-voltage or zero-current resonant techniques, so in that case, leaking also the main resonant component. All such components have different dynamics and time durations, so as to require different processing parameters selection [49]. Longer time intervals T with finer frequency resolutions from a Fourier-transform perspective () provide reduced amplitude estimates of faster transient components, which have a shorter duration and become “diluted” over the time interval T [37,49].
Two problems are common to all types of measurements and are related to data collection and representation. They become evident by looking at what is shown in [59,60].
- First, whatever the uncertainty of the measuring equipment and probes and having even minimized background noise sources, a significant deal of variability of emissions is expected both with respect to time and while ideally sweeping the frequency axis, passing from one spectral component to the adjacent one.
- Second, the amount of data, if stored unaltered as time-domain samples, is huge since the required sampling rate is in the order of 500 kHz or larger for the supraharmonic range. Data compression, when going beyond simple lossless algorithms, unavoidably requires a choice for results representation, namely what should be included and what left out. Examples of condensed indexes are average values and maxima, percentiles, etc., over given time intervals.
At a finer scale, considering frequency spectrum values obtained from time samples with a Short-Time Fourier Transform (STFT) approach, a trade-off is necessary between a small and descriptive frequency resolution on the one hand, and an as coherent as possible behavior of spectrum portions along the time axis on the other, achieved by grouping of adjacent components resulting in a coarser frequency representation. Grouping is indicated in two widely used standards for harmonic and supraharmonic measurements, the IEC 61000-4-7 [47] and IEC 61000-4-30 [61], respectively.
For the harmonic interval up to 2 kHz grouping solves the problem of interharmonics, caused, e.g., by variable speed drives emissions, occurring in between harmonics of the fundamental. Processing by Discrete Fourier Transform would require a long time window, longer than the fundamental cycle, as the greatest common divisor of all component frequencies might be very small. The measurement process is thus simplified by adopting a standard frequency resolution of 5 Hz (namely, a time window of 200 ms) and grouping adjacent spectrum components as harmonic and interharmonic groups and sub-groups, with overall amplitude determined by rms summation (square root of the sum of squares) of components falling inside each grouping interval. Grouping brings along a better stability of the amplitude estimation, more robust to residual spectral leakage.
For the wider supraharmonic interval, grouping is applied collecting spectrum components falling in a wider bandwidth of 2 kHz, sweeping between 2 and 150 kHz. (As a note, formal difficulties are encountered with the 2–9 kHz sub-interval that is covered by the method of IEC 61000-4-7, Annex B, that differs from that of the IEC 61000-4-30, which indicates in its Annex C.2 that incorporation of this sub-interval is under consideration.) The use of a bandwidth is justified by the wider frequency band, keeping roughly the same proportionality of 5 Hz compared to the harmonic interval, and a sufficiently fine frequency resolution at the same time.
Such bandwidth B was deemed appropriate when writing down the IEC 61000-4-30, but its value is in reality somewhat arbitrary and subject to different exigencies and constraints for its fine tuning:
- As most supraharmonic emission sources are switching power converters with emissions mostly of the pulse-width-modulated (PWM) type, attention must be paid to the width of each PWM carrier (or switching frequency multiple ) and the side bands, spaced by even multiples of the modulation frequency . Each switching+modulation PWM group of components is characterized by some amount of power that spectral grouping should try to capture and preserve in the resulting representation [62]. From this, the exigency to set B to a value bracketing most of such side-band components belonging to the same PWM group. However, such justification should be accompanied by the determination of the switching carriers and their harmonics, so as to align the grouping bandwidth B [62], which complicates spectrum evaluation;
- In a scenario of several EV chargers of the same type, whose emissions overlap with plausible shifts of the switching frequency due to normal tolerance of components and settings and related drift over time, a sufficient bandwidth value should be set to correctly compose alike spectral components and observe the expected compensation, if phase displacement occurs. This is demonstrated in [63], where a 1 kHz bandwidth puts together slightly different peaks around the nominal 10 kHz switching frequency, resulting in mutual compensation, although beating phenomena also take place.
- In view of evaluating supraharmonic emissions to compare with limits and to limit disturbance to connected devices, B should be interpreted as the bandwidth of the victim equipment, as all spectral components falling within the same bandwidth B will contribute to the same disturbance term. For a uniform approach, however, the bandwidth B should not be changed depending on victim devices, but unified to a standard value (as the proposed 2 kHz), from which disturbance occurring with larger bandwidth may be simply estimated by, e.g., rms summation. Authors in [59] are cautious on the interpretation of the potential interference effect of grouped components over, in that case, a 4 kHz bandwidth, stating that the impact will not be that of a single component of same intensity; on this, it is possible to object that interference is to be weighted with the concept of victim bandwidth and also that spectrum components quite close to each other may give rise to modulation and beating effects that one single component is not able to. This is confirmed by [22], who report unwanted tripping of residual current devices due to disturbance occurring when many EVs of the same type (but not switching exactly at the same frequency) were plugged in.
The influence of the selected bandwidth on the estimate of spectral components is exemplified in [35,64]:
- Tested bandwidths were 5 Hz, 200 Hz and 2 kHz, in line with the discussed standards, representing well a narrow, medium and large bandwidth for the supraharmonic frequency range;
- Effects of bandwidth on the amplitude estimate of spectral components can be divided, as known, between narrowband and broadband components: the influence is larger for broadband components, where the increase of amplitude follows ideally the square root of the ratio of the bandwidth, namely, 16 dB passing from 5 Hz to 200 Hz, and 10 dB from 200 Hz to 2 kHz. Even apparently narrowband components subjected to some frequency instability or modulation undergo variability of amplitude estimate, as it was shown in Figure 10 of [64]. In that figure, curves at 5 Hz and 200 Hz have a difference of about 7 dB, reduced to about 1 dB passing from 200 Hz to 2 kHz: this confirms the inadequacy of too-narrow bandwidth values (namely 5 Hz or so), when dealing with real emissions, which seem stably evaluated by bandwidth values of hundreds of Hz or few kHz;
- When facing transient components for which a larger bandwidth allows tracking a fast-changing spectrum, the attention is drawn in [35] on the worsening of the amplitude estimate accuracy, due to the increased superposed background noise, and widening of spectral lines (visible in the same Figure 10 of [64]).
For a matter of compactness of reported results, in general, supraharmonic emissions are represented by a total supraharmonic distortion factor (TSHC), which for the type of measurement is referred to as current. This factor is the translation to the supraharmonic range of the total harmonic distortion for current already shown in (1) and in Section 3.1.1.
The summation takes supraharmonic terms evaluated over bandwidth B, which, if set to 200 Hz, leads to . The summation starts at 2 kHz, taken conventionally as .
Other proposed indexes are simple variations of the simple formulation above, where the underlying starting point is the extension of the summation to the entire supraharmonic interval, adding then weighting proportional to frequency (as losses and aging of dielectrics are approximately proportional to frequency) or establishing the ratio to a reference frequency (the so-called K-factor).
3.3.2. Supply Voltage, Grid Distortion and Superposition of Emissions
When considering an EV charger (as any other distorting load subject to assessment), a significant difference of results may be expected for measurements carried out at laboratory and in a real scenario (namely in a real grid, with other connected loads, under variable operating conditions).
Influence of the supply voltage level on emissions was preliminarily studied for CFLs [65] and switched-mode power supplies [66], and represents an overlooked factor, affecting variability of emissions for a wide range of distorting loads, including power converters.
Results in [67] demonstrate that the supply voltage level plays a significant role:
- Two EVs (EV1 and EV2) show a completely different behavior of their , with very constant values in one case and a change of about ± A around a mean value of about 14 A for an excursion of the supply voltage of 230 V ±10%;
- Individual harmonics feature a wide range of values for the same supply voltage excursion: EV1 has the fifth spreading +200% and −60% around the reference amplitude of 11 A, whereas the most variable harmonic for EV2 is the ninth varying by +110% and −10%; in both cases, the increase of harmonic amplitude is observed at the largest power supply levels ( 241 V and 253 V);
- Phase angle variations are also dramatic with both harmonics considered above spanning 120.
It is clear that any deal of compensation and partial cancellation occurring at some harmonic is compromised by any, even small, change of the supply voltage level, as the same harmonics of different EVs may vary quite differently. It is interesting to remark that such supply voltage changes may originate in other ports of the network, such as upstream, but may also be the consequence of local load change, e.g., when new EVs connect for charging, or, the other way round, when they suddenly disconnect.
As for low-frequency distortion (harmonics), the grid impedance plays a major role also for supraharmonics. In particular, EV charger supraharmonic emissions will flow easily in the filters of other connected loads (such as PWM output filters of inverters, EMI filters, etc.), setting up a low-impedance path between loads connected to the same LV grid up to a considerable distance (hundreds of meters), that is a large portion of the typical extension of LV feeders stemming from the secondary of a MV/LV transformer.
As the EV charger is connected to a real grid with preexisting distortion, three factors must be duly considered:
- Superposition of spectral components from different sources occurring at the same frequency or, better, with a difference less than the resolution bandwidth. Examples are not only multiple EV chargers, but also for coexistence with other power converters, such as photovoltaic inverters and various types of power drives. Superposition, depending on the specific phase relationship, may have the positive effect of the reduction of the overall distortion components. This in general is more likely to occur for harmonics, whose frequency is fixed by the grid fundamental, rather than supraharmonics; quite interestingly in [63] the intensity of the 10 kHz switching component at the feeding point reduces significantly with the number of vehicles n, more than the expected assuming random phase and identical frequency. The amount of harmonic cancellation may be expressed simply by the coefficient , calculated for a variable number of sources N. Combined emissions of EVs and household loads were evaluated in [68], showing a non-obvious relationship between low-order harmonics and the amount of connected EVs (see Section 4);
- The influence of low-frequency harmonic distortion on higher-frequency emissions, such as in the supraharmonic range. Such influence was observed for various types of converters, where, in general, supraharmonic emissions depend on both the AC supply voltage level and low-order distortion (affecting the local wave shape and thus high-frequency emissions localized along the fundamental waveform). This is discussed further in Section 4;
- The so-called secondary emissions, where the charger is passively subject to grid distortion components, letting flow a corresponding current at the same frequency of the said components. This is particularly evident when small distortion voltages can cause a significant current intensity to flow through the low EMI (electromagnetic interference) filter impedance at such frequencies; in such cases, minimizing the amount of capacitance at the grid side is a necessity, not only used to prevent zero-sequence current leakage. Figure 2 in [64] demonstrates that three supraharmonics spectra taken at two field locations and one laboratory are quite different with broadband and narrowband components occurring at 35 and 100 kHz for the two field measurements, respectively.
The effect of the grid voltage waveshape (in turn affected by low-order harmonics) was explored in [64], where a photovoltaic inverter, supplied by a flat or pointed top sinusoidal voltage, has harmonics larger by an order of magnitude compared with when it is fed by a sinusoidal voltage.
4. Experimental Data
This section reports experimental evidence of distortion characteristics of EV charging operation, in some cases referring to the same publications and results that were used for clarification and exemplification in Section 3.
4.1. Arrangement and Results of the Systematic Review
An extensive search was carried out using the major journals databases (Elsevier, IEEE, MDPI) and the Google search engine (including thus journals and conferences not sponsored by the major publishers, and ResearchGate), using keywords such as “electric vehicle”, “charge”, “distortion”, “harmonic”, “supraharmonic”, “measurement”, in AND combination of at least 3 terms. In journal databases, such terms were searched almost always within “abstract”, then “full text”, excluding things such as the name of the conference (if using “metadata”), but avoiding limiting the search to the title only. References in found articles were then added, until relevant hits happened to be already found. As observed in [36] (almost at the same time of this work), long-term datasets providing EV charging measurements extended to the harmonic and supraharmonic range are not yet available.
The search proceeded with a first set of hits based on the keywords above (set1), that was then cleaned up for all the works evidently just including the sought keywords, but not providing any relevant information (set2). The works belonging to this second set were then inspected more closely, verifying if they provide results and their quality, and in particular the use of experimental data (contrasted to models and simulation data). For Google search results, the large amount of hits that makes set1 was examined by removing duplicates, focusing on hits with a linked file, and limiting the operation to the first 50 pages.
The number of search hits are reported in Table 2, distinguishing two search schemes, using either “supraharmonic” or “harmonic” in conjunction with “electric vehicle” and “measurement”, applied to the entire text of the sources. The objective is to show what is the progress in the research regarding supraharmonics, compared to the more classical topic of harmonics, albeit applied to the emerging sector of electric vehicles. We may observe that Elsevier and MDPI have fewer hits, but an intense publishing activity of pertinent works: they consistently have an almost triple percentage of supraharmonics-related publications, compared to IEEE, that reflects the general trend represented by Google, of about 0.5–0.6%.
The analysis of the search results is completed by showing some characteristics of the selected references that make set3: type of source (conference, journal, technical report, website), origin (Elsevier, IEEE, MDPI, others) and the year of publication. A graphical representation appears in Figure 10.
The number of works providing reusable experimental data has evidently increased, by almost 50% the average of the works published between 2013 and 2018, and testifying the increased interest for this topic. Supraharmonics are gaining attention, doubling the number of works in the last 3-year period, with the same amount now as for harmonics. Looking at the types of publications, the shift to journal publications is remarkable, from the prevailing conferences of the two 3-year periods between 2013 and 2018. In this, MDPI represents a significant pole of attraction in the most recent period (including two months of 2022), sharing equally with IEEE and the rest of the reachable sources. It is remarked that many works still speak of loading and not of distortion, propose models, possibly suitable for statistical analysis, but not measurements. Their quantity is more than five times greater, as indicated by the size of set2 (in the order of 150) compared to that of set3 (27), as derivable from Figure 10.
Selected works providing experimental data and technical judgment have been included in the references, used in the previous Section 3 to discuss methods of processing and assessment; those with substantial sets of data are analyzed in more detail in the rest of this section.
4.2. Discussion of Publications and Experimental Data
A significant set of data regarding harmonics and supraharmonics for 9 EVs in use in The Netherlands at the end of 2018 is reported by [51]. The results show that four out of nine vehicles fail to comply with the IEC 61000-3-2 limits for harmonics ranging from the 13th to the 37th: the degree of noncompliance amounts to 20% to 60% of the limit. Three EVs capable of charging above 16 A were tested against IEC 61000-3-12 limits and found instead compliant. This situation highlights the problem of pollution specific to LV grids for residential and office loads, but at the same time, casts a doubt on the appropriateness of IEC 61000-3-2 limits, formulated more than 15 years ago and unchanged in the course of three revisions. The reason is that the more and more frequent and widespread use of distorting loads in home and office scenarios would necessitate a new evaluation of limits.
Supraharmonic emissions for the 9 EVs are quite diversified in terms of frequency (switching fundamental ranging from 10 to 50 kHz) and amplitude (from 27 to 1080 mA). Emissions have not, however, been statistically characterized, nor correlated to the state of charge or charging current. It is worth underlining that significant emissions in the audible frequency range have caused several cases of acoustic noise emitted by the EV and charger, but also by other loads in the same grid portion (such as induction cooking plates).
Another relevant set of data is provided in [69], where five chargers (ranging from a small single-phase electric bike charger to a three-phase 11 kW car charger) were subjected to measurement. The work not only reports results on the harmonic behavior of each, but goes into detail on the waveshape and power factor, distortion power factor and displacement factor, showing that some deal of compensation between distorting loads is possible, although at large EV penetration compensation is compromised and distortion is relevant. Comparison of measurements carried out at off-peak (4:30 am) and on-peak (6:00 pm) hours confirms larger current distortion, but a lower resulting voltage distortion, for the former. The reason is the lack of compensation with other distorting loads (leading to the larger current distortion), but at the same time, the grid is almost unloaded and the resulting voltage drops are lesser.
A similar opinion is expressed in [68], where a mix of EVs and household loads is considered, showing some compensation of the 5th harmonic and an overall lower distortion for a specific amount of EVs, that, however, have a prevailing distortion contribution when their number is increased. A significant compensation with external load (heat pump) is reported in [70], where the constant increase of the 7th harmonic intensity is effectively reduced by the switching on of a heat pump; when the second heat pump is switched on overcompensation occurs and the contribution of the latter prevails; the observed EVs had a negligible contribution of 5th harmonic, so that the switching on of the first heat pump does not produce any beneficial effect. Iqbal et al. [71] report a low variability of EV harmonic phase displacement for the 5th and 7th harmonics, spreading at most 45 for the vast majority of the examined EVs (80% of a set of 11 EVs), preventing thus a substantial compensation between different EVs. In addition, it is observed that when comparing the harmonic phase angles of [70,71], they could be in agreement by applying a sign reversal, which raises a concern that many studies do not indicate clearly the polarity of the measured voltage and current quantities (e.g., voltage sign reversal as in German notation, preference for incoming or outgoing current).
In [68], results regarding supraharmonic emissions are also provided, showing switching frequencies of 27, 37 and 100 kHz with quite a wide range of amplitude, from 335 mA for the first one, and only 10 mA for the last, and highest, switching frequency. One important point is also that tests conducted at a laboratory and on-site do not fully match, with one EV in particular undergoing a 4.3% shift of the main switching component and a 31% change of amplitude.
Such values of supraharmonic emissions are confirmed in [36], where the results of three parking lots are reported with low mean values (profiles of about 80 to 50 dBA for 2 to 150 kHz) and a maximum profile (less than 5% probability) 20 dB above, with sporadic peaks for a few switching components above 0.1 Arms. Similarly, the spectra up to 50 kHz reported in [21] show a couple of vehicles with clear emissions at 10 kHz and 27 kHz with peaks in amplitude of about 0.1 and 1 A rms, but also two profiles of emissions that do not have clear peaks of the fundamental switching frequency, thus cleverly achieving a reduction of supraharmonic emissions, limited to 10 mA rms.
Regarding the positioning of emissions over the 2–150 kHz interval, the most common behavior corresponds to narrowband emissions between about 10 kHz (a common emission frequency among EVs) and 50 kHz [51]. A particular case is mentioned in [59] with broadband emissions between 2 and 6 kHz, that are probably of the same kind as those observed in [37] and result from the main pulse of the PFC stage. This impulsive nature is confirmed by [36] providing high-pass filtered time-domain traces, rather than a frequency-domain analysis; in particular, its Figure 9c provides a waveform quite close to those analyzed in [37].
It should also be noted that the particular waveshape of the grid voltage has influence on the harmonic emissions of the connected load; in particular, a flattened sinusoid (typical of residential LV grids with third harmonic pollution) may cause positive or negative changes of amplitude of some low-order harmonics by a significant amount (between 30% and 300%), also depending on the type of EV charger [68].
In addition, the extensively mentioned unbalance at the fundamental caused by single-phase chargers is transferred also to harmonics and supraharmonics, as shown by [36], where differences of up to a factor of 2 between average values of supraharmonic total distortion can be observed. This is confirmed by [59], where the supraharmonic current profile (grouped on a bandwidth of 800 Hz or 4 kHz, the latter for the mentioned 2–6 kHz broadband emission) has almost a 2:1 difference between phase A and C.
As anticipated, “unexpected” components, not visible when an EV charger is individually tested, e.g., in laboratory conditions, may arise due to two mechanisms that are discussed in [22]: intermodulation and beating. They both occur between two or more EV chargers:
- Beating takes place when harmonic or supraharmonic emissions exist with a small frequency difference and they mix within the grid to which the EV chargers are connected. The small frequency difference may be justified by normal tolerance, drift and ageing of two otherwise identical chargers. The result is a low-frequency pulsation after superposition of individual emission signals as difference of the two frequency values, thus, mathematically identical to a second-order intermodulation discussed below. The example provided in [22] indicates a pulsation of 10% amplitude, resulting from two “identical” EVs with a frequency difference of 2.4 Hz out of the two respective 10 kHz switching frequencies;
- Intermodulation distortion instead occurs even with spectral components of emission that are located farther apart and is in general caused by nonlinear elements, such as the power converters themselves. The example in [22] clarifies the extent to which such a phenomenon can occur: taking two components at and of a measured spectrum, in the spectrum itself a second-order intermodulation term () and two third-order intermodulation terms ( and ) are clearly visible.
5. Conclusions
The articulated problem of harmonic and supraharmonic emissions of plug-in EV chargers was analyzed, focusing first on the typical power converter architecture implementing EV chargers and on the normative requirements and reference levels.
The typical mechanisms of emission, the spectral behavior and the superposition of emissions from different chargers and with existing LV grid distortion were then discussed, with extensive reference to existing experimental data, that unfortunately are limited to fewer than a dozen works in the last ten years or so.
There are some significant elements to consider for standardization purposes (e.g., to identify suitable limits for a new category of highly dynamic loads), for the design of lines feeding the charging points, and when preparing a measurement campaign and evaluating then the measurement results:
- Harmonic distortion is still quite variable between EV models, above IEC limits in some conditions, although PFC should be extensively applied;
- Superposition of harmonics can occur with a wide range of distorting loads, such as home and office appliances and equipment, characterized by a significant penetration into the AC grid;
- Some major low-order harmonics may be quite dependent on the waveshape of the grid voltage, in particular for cases of flat-top voltage affected thus by third harmonic pollution; this exemplifies the necessity of testing reflecting the real conditions of use;
- The supraharmonic interval contains emissions from the PFC stage and power converters downstream inside the EV, in the form of a main switching component and its harmonics; broadband emissions may occur in the lowest frequency interval, below, e.g., 10 kHz, excited by the PFC impulses;
- A significant mutual influence between different chargers connected to the same grid was observed, pointing out the influence of field conditions contrasted with laboratory qualification results of single standalone EV; such influence materializes in a significant deal of beating and intermodulation phenomena;
- At a different level, mutual influence was also reported, consisting of the reciprocal interference between EVs passing through different charging conditions and switching on and off the charging process abruptly, causing changes of grid response and transient disturbance; interference resulted in EV charger disconnection, repeated charging attempts and the necessity of manual intervention.
Lessons learned would suggest, among others, three lines of intervention for the improvement of the assessment of the impact of EV charging on LV grids and connected loads:
- Modeling and accounting for superposition of components and resulting intermodulation;
- Consistent test of emissions to reflect real conditions of use for grid impedance (including the effect of other loads) and pre-existing distortion;
- Immunity test of EVs to supraharmonics, zero-crossing oscillatory signals and transient events caused by EV interactions and concomitant charging.
A thorough understanding of the response of the grid in its entirety to an increasing number of connected EVs should go beyond the estimate of the resulting electrical load and impact in terms of voltage drop and voltage imbalance. This is particularly important for the reported episodes distortion and interference in the most recent papers and in view of the green transition to an exclusively electric vehicle production in the next ten years or so.
Funding
This research received no external funding.
Institutional Review Board Statement
Not applicable.
Informed Consent Statement
Not applicable.
Conflicts of Interest
The author declares no conflict of interest.
References
- Energy Technology Policy (ETP) Division. Nordic EV Outlook 2018, Directorate of Sustainability, Technology and Outlooks (STO) of the International Energy Agency (IEA); Technical Report; International Energy Agency (IEA): Paris, France, 2018. [Google Scholar]
- Energy Technology Policy (ETP) Division. Global EV Outlook 2019, Directorate of Sustainability, Technology and Outlooks (STO) of the International Energy Agency (IEA); Technical Report; International Energy Agency (IEA): Paris, France, 2019. [Google Scholar]
- European Union. European Green Deal: Commission Proposes Transformation of EU Economy and Society to Meet Climate Ambitions. 2021. Available online: https://ec.europa.eu/commission/presscorner/detail/en/IP_21_3541 (accessed on 28 January 2022).
- Sanguesa, J.A.; Torres-Sanz, V.; Garrido, P.; Martinez, F.J.; Marquez-Barja, J.M. A Review on Electric Vehicles: Technologies and Challenges. Smart Cities 2021, 4, 372–404. [Google Scholar] [CrossRef]
- Dharmakeerthi, C.; Mithulananthan, N.; Saha, T. Impact of electric vehicle fast charging on power system voltage stability. Int. J. Electr. Power Energy Syst. 2014, 57, 241–249. [Google Scholar] [CrossRef]
- Auer, M.; Kaffe, E.; La Fauci, R. Impact of fast charging and home charging infrastructure for electric vehicles on the power quality of the distribution grid. In Proceedings of the 25th International Conference on Electricity Distribution, Madrid, Spain, 3–6 June 2019. [Google Scholar]
- Liu, L.; Kong, F.; Liu, X.; Peng, Y.; Wang, Q. A review on electric vehicles interacting with renewable energy in smart grid. Renew. Sustain. Energy Rev. 2015, 51, 648–661. [Google Scholar] [CrossRef]
- Fernández-Rodriguez, A.; Fernández-Cardador, A.; Cucala, A.; Falvo, M. Energy Efficiency and Integration of Urban Electrical Transport Systems: EVs and Metro-Trains of Two Real European Lines. Energies 2019, 12, 366. [Google Scholar] [CrossRef] [Green Version]
- Smith, K.; Hunter, L.; Galloway, S.; Booth, C.; Kerr, C.; Kellett, M. Integrated Charging of EVs Using Existing LVDC Light Rail Infrastructure: A Case Study. In Proceedings of the 2019 IEEE Third International Conference on DC Microgrids (ICDCM), Matsue, Japan, 20–23 May 2019. [Google Scholar]
- Akhavan-Hejazi, H.; Mohsenian-Rad, H.; Nejat, A. Developing a Test Data Set for Electric Vehicle Applications in Smart Grid Research. In Proceedings of the 2014 IEEE 80th Vehicular Technology Conference (VTC2014-Fall), Vancouver, QC, Canada, 14–17 September 2014. [Google Scholar]
- Gaete-Morales, C.; Kramer, H.; Schill, W.P.; Zerrahn, A. An open tool for creating battery-electric vehicle time series from empirical data, emobpy. Sci. Data 2021, 8, 1–18. [Google Scholar] [CrossRef] [PubMed]
- Haben, S.; Arora, S.; Giasemidis, G.; Voss, M.; Greetham, D.V. Review of low voltage load forecasting: Methods, applications, and recommendations. Applied Energy 2021, 304, 117798. [Google Scholar] [CrossRef]
- Arif, S.M.; Lie, T.T.; Seet, B.C.; Ayyadi, S.; Jensen, K. Review of Electric Vehicle Technologies, Charging Methods, Standards and Optimization Techniques. Electronics 2021, 10, 1910. [Google Scholar] [CrossRef]
- Mies, J.; Helmus, J.; van den Hoed, R. Estimating the Charging Profile of Individual Charge Sessions of Electric Vehicles in The Netherlands. World Electr. Veh. J. 2018, 9, 17. [Google Scholar] [CrossRef] [Green Version]
- Amara-Ouali, Y.; Goude, Y.; Massart, P.; Poggi, J.M.; Yan, H. A Review of Electric Vehicle Load Open Data and Models. Energies 2021, 14, 2233. [Google Scholar] [CrossRef]
- Gruosso, G. Analysis of impact of electrical vehicle charging on low voltage power grid. In Proceedings of the 2016 International Conference on Electrical Systems for Aircraft, Railway, Ship Propulsion and Road Vehicles & International Transportation Electrification Conference (ESARS-ITEC), Toulouse, France, 2–4 November 2016. [Google Scholar]
- Abraham, D.S.; Verma, R.; Kanagaraj, L.; Raman, S.R.G.T.; Rajamanickam, N.; Chokkalingam, B.; Sekar, K.M.; Mihet-Popa, L. Electric Vehicles Charging Stations’ Architectures, Criteria, Power Converters, and Control Strategies in Microgrids. Electronics 2021, 10, 1895. [Google Scholar] [CrossRef]
- Mariscotti, A. Power Quality Phenomena, Standards, and Proposed Metrics for DC Grids. Energies 2021, 14, 6453. [Google Scholar] [CrossRef]
- Rafi, M.A.H.; Bauman, J. A Comprehensive Review of DC Fast-Charging Stations with Energy Storage: Architectures, Power Converters, and Analysis. IEEE Trans. Transp. Electrif. 2021, 7, 345–368. [Google Scholar] [CrossRef]
- Rönnberg, S.K.; Castro, A.G.; Bollen, M.H.J.; Moreno-Munoz, A.; Romero-Cadaval, E. Supraharmonics from power electronics converters. In Proceedings of the 9th International Conference on Compatibility and Power Electronics (CPE), Costa da Caparica, Portugal, 24–26 June 2015; pp. 539–544. [Google Scholar]
- Meyer, J.; Mueller, S.; Ungethuem, S.; Xiao, X.; Collin, A.; Djokic, S. Harmonic and supraharmonic emission of on-board electric vehicle chargers. In Proceedings of the IEEE PES Transmission & Distribution Conference and Exposition-Latin America (PES T&D-LA), Morelia, Mexico, 21–24 September 2016. [Google Scholar]
- Slangen, T.; van Wijk, T.; Ćuk, V.; Cobben, S. The Propagation and Interaction of Supraharmonics from Electric Vehicle Chargers in a Low-Voltage Grid. Energies 2020, 13, 3865. [Google Scholar] [CrossRef]
- Blum, J. Evaluating Supraharmonics Up to 150 kHz in Electric Vehicles at the University of Applied Sciences Bingen; Technical Report; 2021; Available online: https://powerquality.blog/2021/11/05/evaluating-supraharmonics-up-to-150-khz-in-electric-vehicles-at-the-university-of-applied-sciences-bingen (accessed on 28 January 2022).
- Lee, B.K.; Kim, J.P.; Kim, S.G.; Lee, J.Y. An Isolated/Bidirectional PWM Resonant Converter for V2G(H) EV On-Board Charger. IEEE Trans. Veh. Technol. 2017, 66, 7741–7750. [Google Scholar] [CrossRef]
- IEC 61851-1; Electric Vehicle Conductive Charging System—Part 1: General Requirements. IEC: Geneva, Switzerland, 2017.
- Triviño, A.; González-González, J.M.; Aguado, J.A. Wireless Power Transfer Technologies Applied to Electric Vehicles: A Review. Energies 2021, 14, 1547. [Google Scholar] [CrossRef]
- Zhang, Z.; Xu, H.; Shi, L.; Li, D.; Han, Y. A unit power factor DC fast charger for electric vehicle charging station. In Proceedings of the 7th International Power Electronics and Motion Control Conference, Harbin, China, 2–5 June 2012. [Google Scholar]
- Kuperman, A.; Levy, U.; Goren, J.; Zafranski, A.; Savernin, A. Modeling and Control of the PFC Stage for a 50 kW EV Fast Battery Charger. Proc. World Congr. Eng. 2011, 2, 5–9. [Google Scholar]
- Ramakrishnan, H.; Rangaraju, J. Power Topology Considerations for Electric Vehicle Charging Stations; Technical Report; Texas Instruments: Dallas, TX, USA, 2020. [Google Scholar]
- Piasecki, S.; Zaleski, J.; Jasinski, M.; Bachman, S.; Turzyński, M. Analysis of AC/DC/DC Converter Modules for Direct Current Fast-Charging Applications. Energies 2021, 14, 6369. [Google Scholar] [CrossRef]
- Das, S.; Narayanan, G. Analytical Closed-Form Expressions for Harmonic Distortion Corresponding to Novel Switching Sequences for Neutral-Point-Clamped Inverters. IEEE Trans. Ind. Electron. 2014, 61, 4485–4497. [Google Scholar] [CrossRef]
- Kan, Y.; Hyun, S.W.; Hong, S.J.; Won, C.Y. Zero dead-time PWM implementation method for reducing total harmonic distortion in 3-level NPC inverter. In Proceedings of the 2015 18th International Conference on Electrical Machines and Systems (ICEMS), Pattaya City, Thailand, 25–28 October 2015. [Google Scholar]
- Feng, Z.; Zhang, X.; Wang, J.; Yu, S. A High-Efficiency Three-Level ANPC Inverter Based on Hybrid SiC and Si Devices. Energies 2020, 13, 1159. [Google Scholar] [CrossRef] [Green Version]
- Zambra, D.A.B.; Rech, C.; Pinheiro, J.R. Comparison of Neutral-Point-Clamped, Symmetrical, and Hybrid Asymmetrical Multilevel Inverters. IEEE Trans. Ind. Electron. 2010, 57, 2297–2306. [Google Scholar] [CrossRef]
- Mariscotti, A. Experimental characterisation of active and non-active harmonic power flow of AC rolling stock and interaction with the supply network. Electr. Syst. Transp. 2021, 11, 109–120. [Google Scholar] [CrossRef]
- Streubel, T.; Kattmann, C.; Eisenmann, A.; Rudion, K. Characterization of Supraharmonic Emission from Three Different Electric Vehicle Charging Infrastructures in Time and Frequency Domain. Energies 2022, 15, 394. [Google Scholar] [CrossRef]
- Sandrolini, L.; Mariscotti, A. Signal Transformations for Analysis of Supraharmonic EMI Caused by Switched-Mode Power Supplies. Electronics 2020, 9, 2088. [Google Scholar] [CrossRef]
- Sandrolini, L.; Mariscotti, A. Waveform and Spectral Characteristics of Supraharmonic Unsymmetrical Conducted EMI of Switched-Mode Power Supplies. Electronics 2022, 11, 591. [Google Scholar] [CrossRef]
- ISO 6469-3; Electrically Propelled Road Vehicles—Safety Specifications. Part 3: Electrical Safety. ISO: Geneva, Switzerland, 2017.
- Liu, C. Analysis, Design and Control of DC-DC Resonant Converter for On-Board Bidirectional Battery Charger in Electric Vehicles. Ph.D. Thesis, University of Sheffield, Sheffield, UK, 2017. Available online: https://etheses.whiterose.ac.uk/17528/1/ChaohuiLiu_Thesis_Final_2017-05-30.pdf (accessed on 28 January 2022).
- Liu, K.; Yang, Z.; Tang, X.; Cao, W. Automotive Battery Equalizers Based on Joint Switched-Capacitor and Buck-Boost Converters. IEEE Trans. Veh. Technol. 2020, 69, 12716–12724. [Google Scholar] [CrossRef]
- IEC 61000-2-2; Electromagnetic Compatibility (EMC)—Part 2-2: Environmen—Compatibility Levels for Low-Frequency Conducted Disturbances and Signalling in Public Low-Voltage Power Supply Systems. IEC: Geneva, Switzerland, 2019.
- IEC 61000-2-4; Electromagnetic Compatibility (EMC)—Part 2-4: Environment—Compatibility Levels In Industrial Plants for Low-Frequency Conducted Disturbances. IEC: Geneva, Switzerland, 2020.
- IEC 61000-3-2; Electromagnetic Compatibility (EMC)—Part 3-2: Limits – Limits for Harmonic Current Emissions (Equipment Input Current ≤ 16 A Per Phase). IEC: Geneva, Switzerland, 2019.
- IEC 61851-21-1; Electric Vehicle Conductive Charging System—Part 21-1: Electric Vehicle on-Board Charger EMC Requirements for Conductive Connection to an AC/DC Supply. IEC: Geneva, Switzerland, 2017.
- IEC 61000-3-12; Electromagnetic Compatibility (EMC)—Part 3-12: Limits–Limits for Harmonic Currents Producedby Equipment Connected to Public Low-Voltage Systems with Input Current >16 A and ≤ 75 A per Phase. IEC: Geneva, Switzerland, 2011.
- IEC 61000-4-7; Electromagnetic Compatibility (EMC)—Part 4-7: Testing and Measurement Techniques—General Guide on Harmonics and Interharmonics Measurements and Instrumentation, for Power Supply Systems and Equipment Connected Thereto. IEC: Geneva, Switzerland, 2002.
- CISPR 16-1-1; Specification for Radio Disturbance and Immunity Measuring Apparatus and Methods—Part 1-1: Radio Disturbance and Immunity Measuring Apparatus—Measuring Apparatus. IEC: Geneva, Switzerland, 2019.
- Sandrolini, L.; Mariscotti, A. Impact of short-time Fourier transform parameters on the accuracy of EMI spectra estimates in the 2–150 kHz supraharmonic interval. Electr. Power Syst. Res. 2021, 195, 107130. [Google Scholar] [CrossRef]
- Klatt, M.; Meyer, J.; Schegner, P. Comparison of measurement methods for the frequency range of 2 kHz to 150 kHz. In Proceedings of the International Conference on Harmonics and Quality of Power, Bucharest, Romania, 25–28 May 2014; pp. 818–822. [Google Scholar]
- Slangen, T.M.H.; van Wijk, T.; Cuk, V.; Cobben, J.F.G. The Harmonic and Supraharmonic Emission of Battery Electric Vehicles in The Netherlands. In Proceedings of the 2020 International Conference on Smart Energy Systems and Technologies (SEST), Istanbul, Turkey, 7–9 September 2020. [Google Scholar]
- CISPR 16-2-1; Specification for Radio Disturbance and Immunity Measuring Apparatus and Methods—Part 2-1: Methods of Measurement of Disturbances and Immunity—Conducted Disturbance Measurements. IEC: Geneva, Switzerland, 2014.
- EN 50065-1; Signalling on Low-Voltage Electrical Installations in the Frequency Range 3 kHz to 148,5 kHz Part 1: General Requirements, Frequency Bands and Electromagnetic Disturbances. CENELEC: Brussels, Belgium, 2012.
- CISPR 16-1-2; Specification for Radio Disturbance and Immunity Measuring Apparatus and Methods—Part 1-2: Radio Disturbance and Immunity Measuring Apparatus—Coupling Devices for Conducted Disturbance Measurements. IEC: Geneva, Switzerland, 2014.
- IEC 61000-3-11; Electromagnetic Compatibility (EMC)—Part 3-11: Part 3-11: Limits—Limitation of Voltage Changes, Voltage Fluctuationsand Flicker in Public Low-Voltage Supply Systems—Equipment with rated Current ≤ 75 A and Subject to Conditional Connection. IEC: Geneva, Switzerland, 2019.
- Busatto, T.; Larsson, A.; Ronnberg, S.K.; Bollen, M.H.J. Including Uncertainties From Customer Connections in Calculating Low-Voltage Harmonic Impedance. IEEE Trans. Power Deliv. 2019, 34, 606–615. [Google Scholar] [CrossRef]
- Stiegler, R.; Meyer, J.; Schori, S.; Höckel, M.; Scheida, K.; Drápela, J.; Hanžlík, T. Survey of network impedance in the frequency range 2–9 kHz in public low voltage networks in AT/CH/CZ/GE. In Proceedings of the 25th International Conference and Exhibition on Electricity Distribution (CIRED), Madrid, Spain, 3–6 June 2019. [Google Scholar]
- Harris, F.J. On the use of windows for harmonic analysis with the discrete Fourier transform. Proc. IEEE 1978, 66, 51–83. [Google Scholar] [CrossRef]
- Darmawardana, D.; David, J.; Perera, S.; Robinson, D.; Meyer, J.; Jayatunga, U. Analysis of High Frequency (Supraharmonics) Emissions Caused by Electric Vehicle Charging. In Proceedings of the 2020 19th International Conference on Harmonics and Quality of Power (ICHQP), Dubai, United Arab Emirates, 6–7 July 2020. [Google Scholar]
- Streubel, T.; Kattmann, C.; Eisenmann, A.; Rudion, K. Detection and Monitoring of Supraharmonic Anomalies of an Electric Vehicle Charging Station. In Proceedings of the 2019 IEEE Milan PowerTech, Milan, Italy, 27 June 2017. [Google Scholar]
- IEC 61000-4-30; Electromagnetic Compatibility (EMC)—Part 4-30: Testing and Measurement Techniques—Power Quality Measurement Methods. IEC: Geneva, Switzerland, 2015.
- Wang, Y.; Xu, Y.; Tao, S.; Siddique, A.; Dong, X. A Flexible Supraharmonic Group Method Based on Switching Frequency Identification. IEEE Access 2020, 8, 39491–39501. [Google Scholar] [CrossRef]
- Möller, F.; Müller, S.; Meyer, J. Impact of Electric Vehicles on Power Quality in Central Charging Infrastructures. In Proceedings of the 1st E-Mobility Power System Integration Symposium, Berlin, Germany, 23 October 2017. [Google Scholar]
- Meyer, J.; Bollen, M.; Amaris, H.; Blanco, A.M.; Gil De Castro, A.; Desmet, J.; Klatt, M.; Kocewiak, L.; Ronnberg, S.; Yang, K. Future work on harmonics—Some expert opinions Part II —Supraharmonics, standards and measurements. In Proceedings of the International Conference on Harmonics and Quality of Power, ICHQP, Bucharest, Romania, 25–28 May 2014; pp. 909–913. [Google Scholar]
- Gil-De-Castro, A.; Medina-Gracia, R.; Ronnberg, S.; Blanco, A.; Meyer, J. Differences in the performance between CFL and LED lamps under different voltage distortions. In Proceedings of the 18th International Conference on Harmonics and Quality of Power (ICHQP), Ljubljana, Slovenia, 13–16 May 2018. [Google Scholar]
- Mariscotti, A.; Sandrolini, L.; Pasini, G. Variability caused by Setup and Operating Conditions for Conducted EMI of Switched Mode Power Supplies over the 2–1000 kHz Interval. IEEE Trans. Instrum. Meas. 2022. [Google Scholar] [CrossRef]
- Kutt, L.; Saarijarvi, E.; Lehtonen, M.; Molder, H.; Niitsoo, J. Electric vehicle charger load current harmonics variations due to supply voltage level differences—Case examples. In Proceedings of the 2014 International Symposium on Power Electronics, Electrical Drives, Automation and Motion, Ischia, Italy, 18–20 June 2014. [Google Scholar]
- Möller, F.; Müller, S.; Wald, C.; Isensee, S. Impact of electric vehicle charging on unbalance and harmonic distortion—Field study in an urban residential area. In Proceedings of the 23rd International Conference on Electricity Distribution, Lyon, Franc, 15–18 June 2015. [Google Scholar]
- Collin, A.J.; Djokic, S.Z.; Thomas, H.F.; Meyer, J. Modelling of electric vehicle chargers for power system analysis. In Proceedings of the 11th International Conference on Electrical Power Quality and Utilisation, Lisbon, Portugal, 17–19 October 2011. [Google Scholar]
- Malano, A.A.; Muller, S.; Meyer, J.; Bachmann, S. Harmonic interaction of electric vehicle chargers in a central charging infrastructure. In Proceedings of the 2016 17th International Conference on Harmonics and Quality of Power (ICHQP), Belo Horizonte, Brazil, 16–19 October 2016. [Google Scholar]
- Iqbal, M.N.; Kütt, L.; Daniel, K.; Asad, B.; Ghahfarokhi, P.S. Estimation of Harmonic Emission of Electric Vehicles and Their Impact on Low Voltage Residential Network. Sustainability 2021, 13, 8551. [Google Scholar] [CrossRef]
Figure 1.
Typical AC–DC converter schemes (three-phase versions shown): (a) two-level active rectifier, (b) floating capacitor converter, (c) neutral point clamped converter.
Figure 1.
Typical AC–DC converter schemes (three-phase versions shown): (a) two-level active rectifier, (b) floating capacitor converter, (c) neutral point clamped converter.

Figure 2.
Harmonic distortion compatibility levels for public LV distribution grid (Table 1 of IEC 61000-2-2), with a prescribed voltage THD level of 11%: (a) numeric values, (b) graphical form.
Figure 2.
Harmonic distortion compatibility levels for public LV distribution grid (Table 1 of IEC 61000-2-2), with a prescribed voltage THD level of 11%: (a) numeric values, (b) graphical form.

Figure 3.
Harmonic distortion compatibility levels for light/heavy industrial networks (Table 2 of IEC 61000-2-4), with a prescribed voltage THD level of 11%: (a) numeric values, (b) graphical form.
Figure 3.
Harmonic distortion compatibility levels for light/heavy industrial networks (Table 2 of IEC 61000-2-4), with a prescribed voltage THD level of 11%: (a) numeric values, (b) graphical form.

Figure 4.
Harmonic distortion limits for unbalanced loads as a function of short-circuit ratio (Table 2 of IEC 61000-3-12): (a) numeric values, (b) graphical form.
Figure 4.
Harmonic distortion limits for unbalanced loads as a function of short-circuit ratio (Table 2 of IEC 61000-3-12): (a) numeric values, (b) graphical form.

Figure 5.
Harmonic distortion limits for balanced three-phase loads as a function of short-circuit ratio (Table 3 of IEC 61000-3-12): (a) numeric values, (b) graphical form.
Figure 5.
Harmonic distortion limits for balanced three-phase loads as a function of short-circuit ratio (Table 3 of IEC 61000-3-12): (a) numeric values, (b) graphical form.

Figure 6.
Supraharmonic distortion compatibility levels for public LV distribution grid (Table 2 of IEC 61000-2-2): (a) numeric values, (b) graphical form.
Figure 6.
Supraharmonic distortion compatibility levels for public LV distribution grid (Table 2 of IEC 61000-2-2): (a) numeric values, (b) graphical form.

Figure 7.
Supraharmonic distortion limits for LV distribution grids (distinguishing Protected, class 1, Residential/Office, class 2, and Industrial, class 3, environments, as in Tables 4 and 5 of IEC 61000-2-4): (a) numeric values, (b) graphical form.
Figure 7.
Supraharmonic distortion limits for LV distribution grids (distinguishing Protected, class 1, Residential/Office, class 2, and Industrial, class 3, environments, as in Tables 4 and 5 of IEC 61000-2-4): (a) numeric values, (b) graphical form.

Figure 8.
Harmonic impedance for selected groups: odd harmonics multiple of 3 (green dots), even harmonics (blue dots) and odd characteristic harmonics (red dots); recalculated network impedance for even (, light blue) and odd characteristic (, light brown) harmonics (triangles are for the case, squares for ). The violet curve is the linear extrapolation with harmonic order of the reference impedance of the IEC 61000-3-11.

Figure 9.
Extrapolated supraharmonic current limits based on CLs, estimated network impedance and number of concomitant sources with randomly distributed phase: overall limit with (brown squares), individual limit with (blue triangles).
Figure 9.
Extrapolated supraharmonic current limits based on CLs, estimated network impedance and number of concomitant sources with randomly distributed phase: overall limit with (brown squares), individual limit with (blue triangles).

Figure 10.
Overview of sources of experimental harmonic and supraharmonic data for electric vehicles: (a) publication type versus grouped years, (b) publisher versus grouped years, (c) topic (harmonics, supraharmonics, counting when both) versus grouped years.
Figure 10.
Overview of sources of experimental harmonic and supraharmonic data for electric vehicles: (a) publication type versus grouped years, (b) publisher versus grouped years, (c) topic (harmonics, supraharmonics, counting when both) versus grouped years.


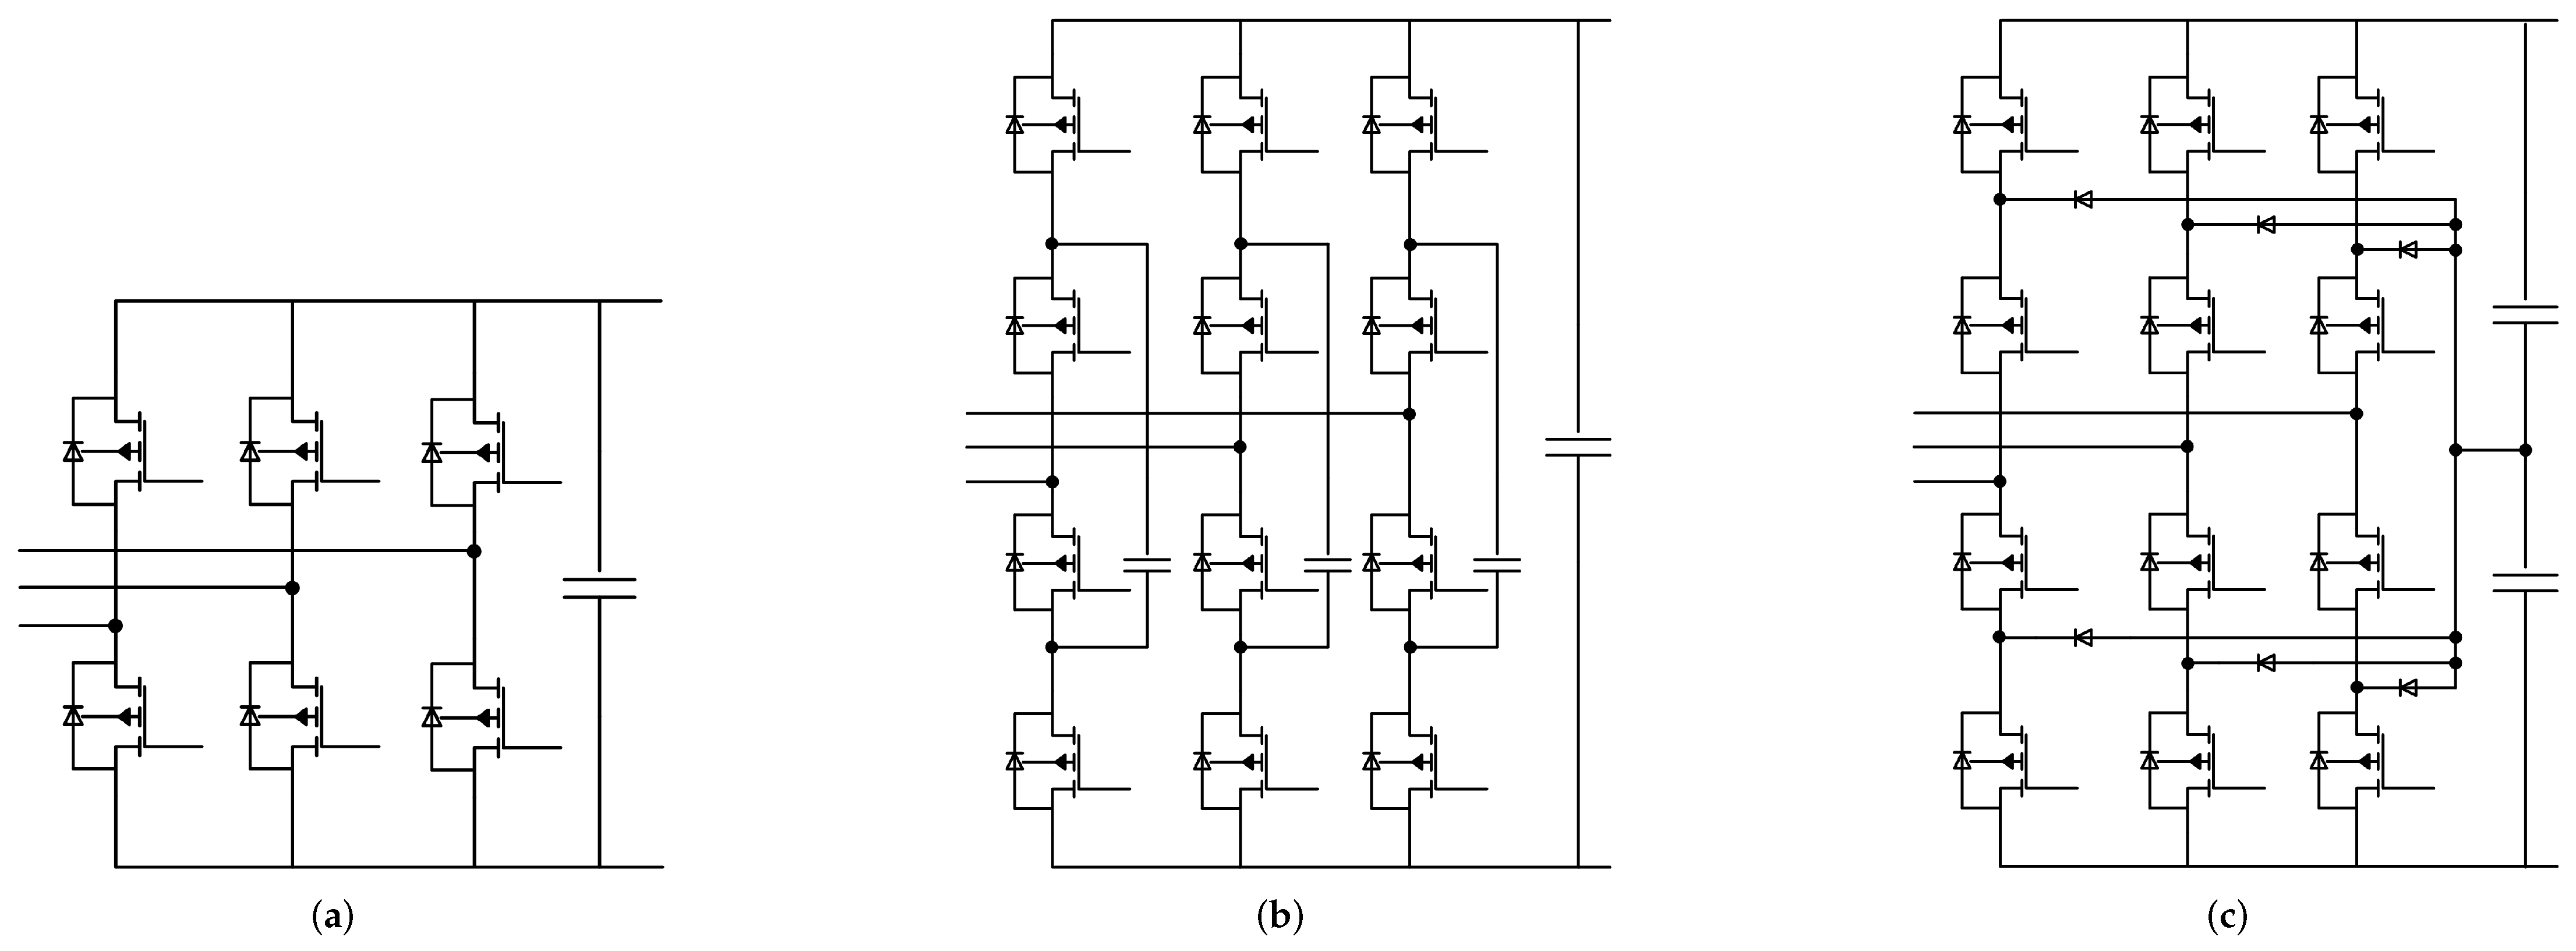
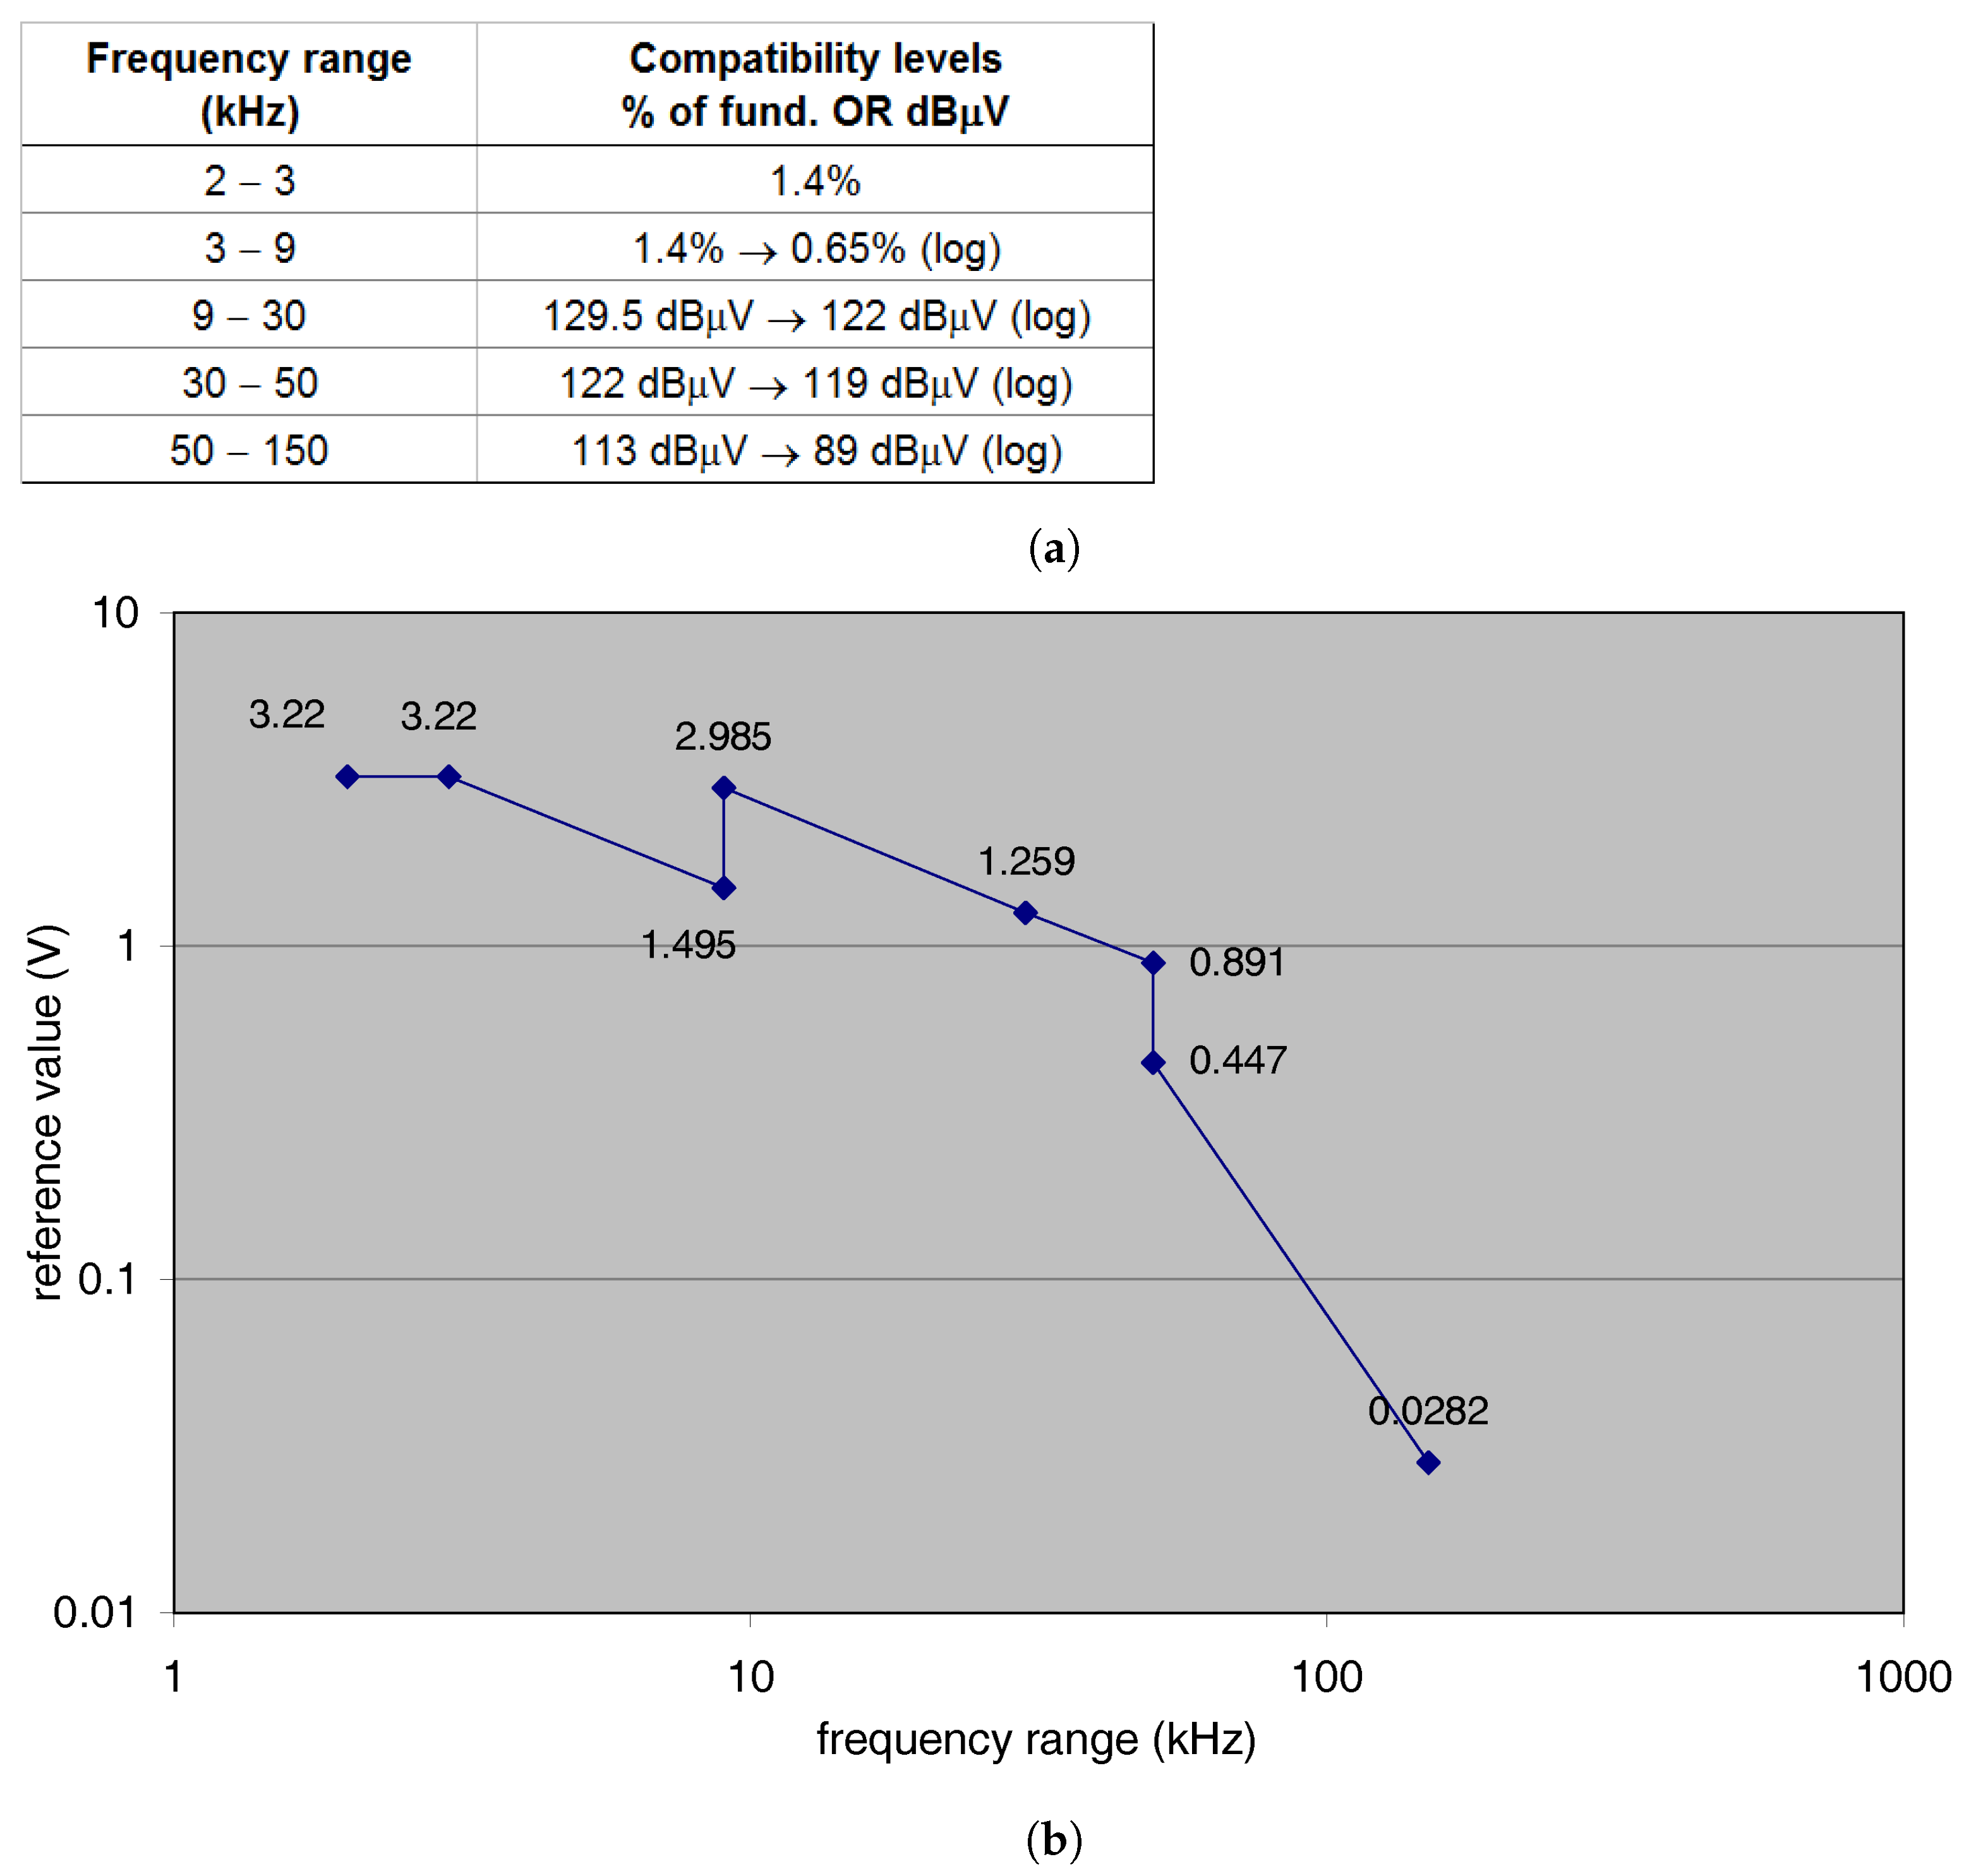
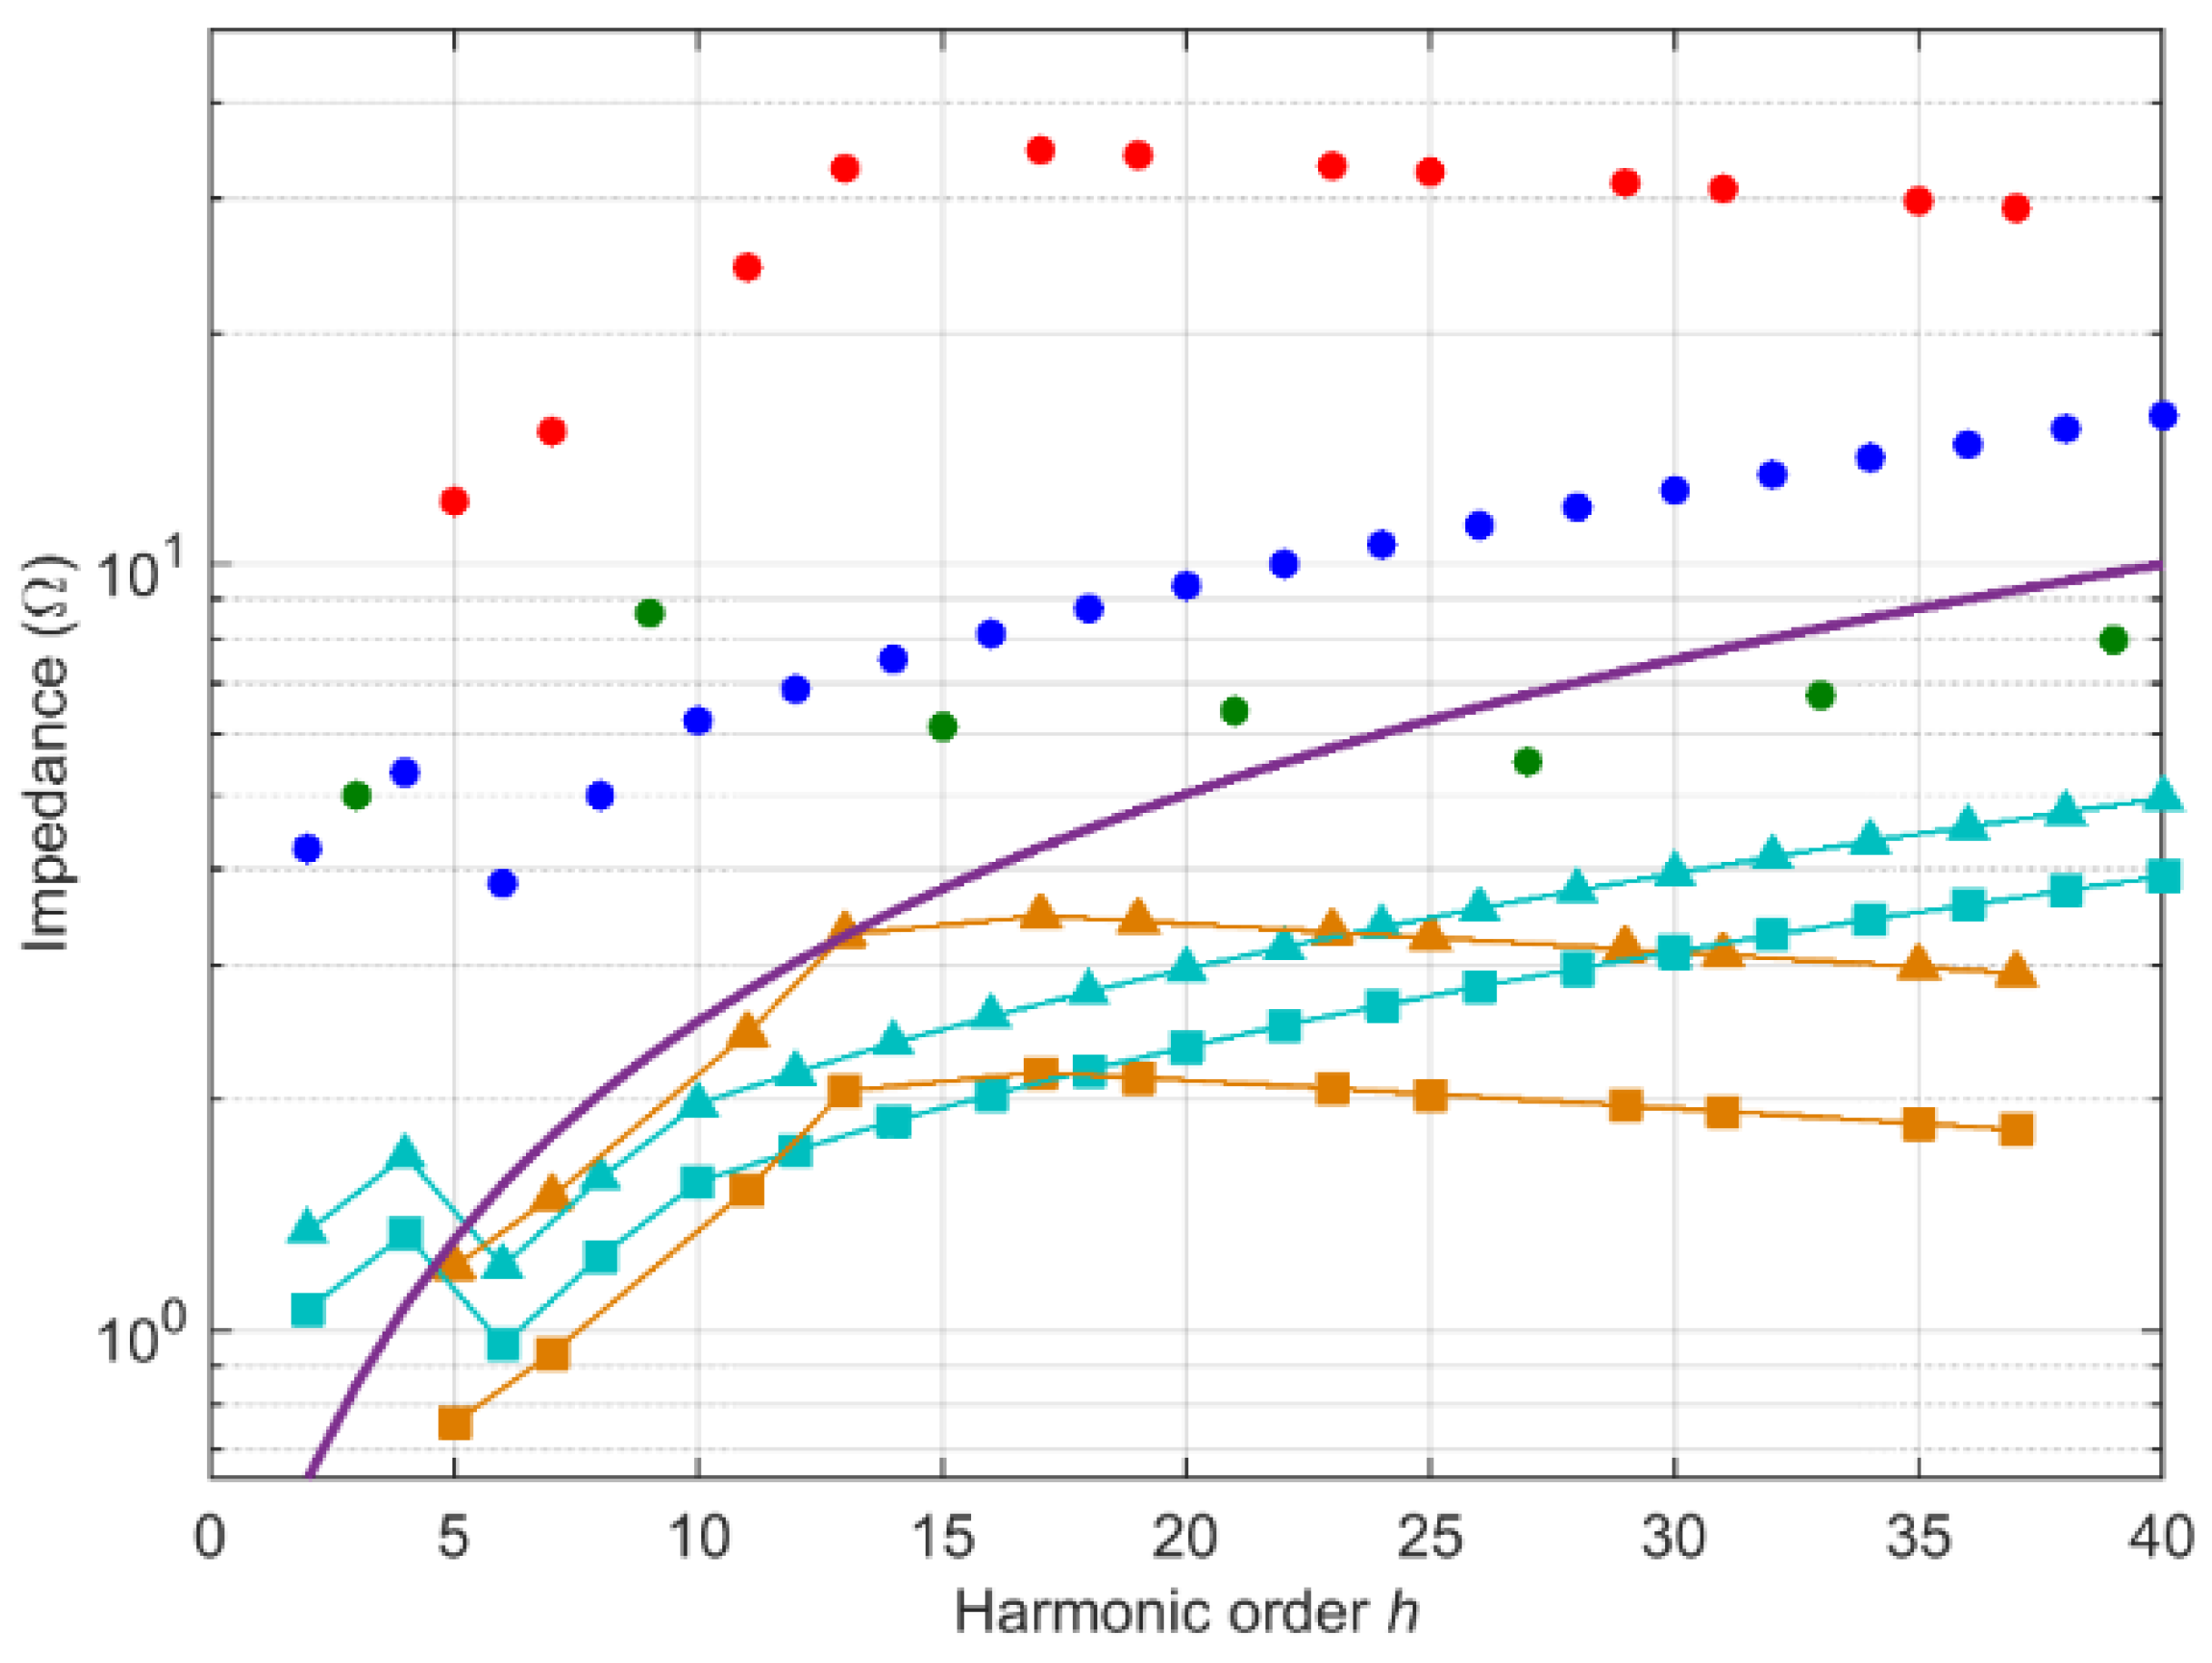
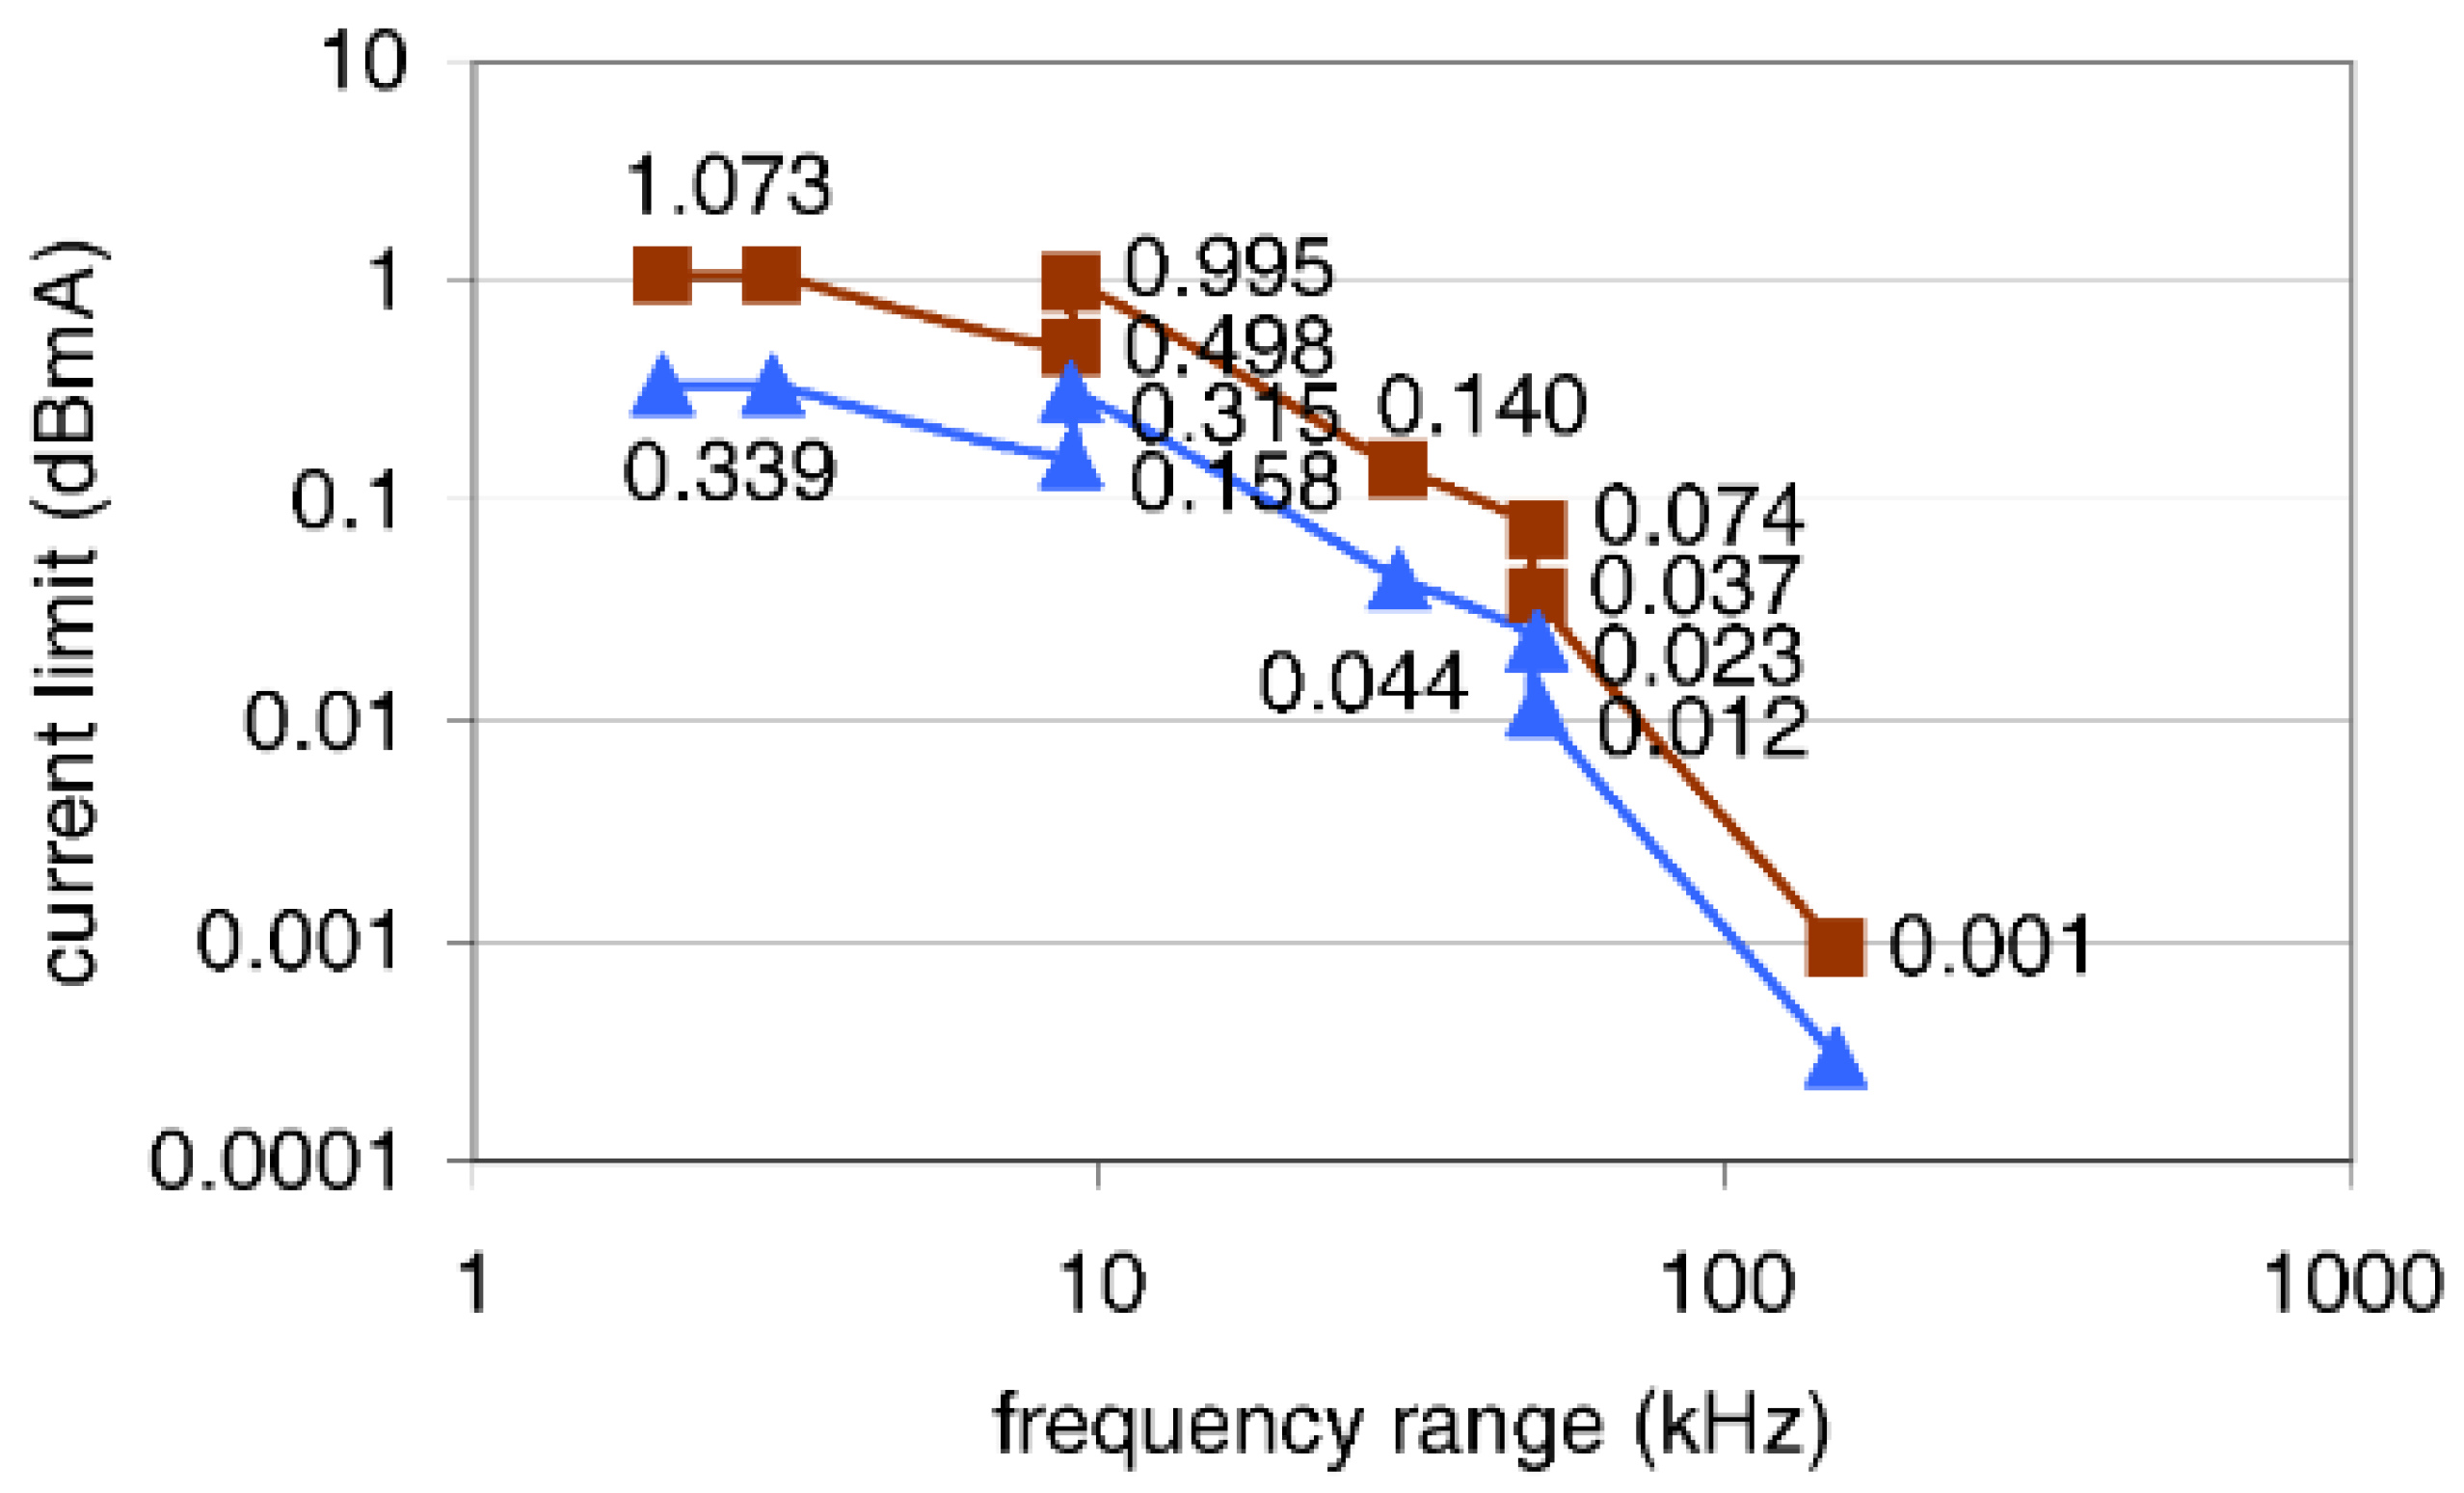
Table 1.
Harmonic distortion limits as per Table 1 of IEC 61000-3-2 standard.
| Harmonic Order h | Limit (A) |
|---|---|
| 2 | 1.08 |
| 3 | 2.30 |
| 4 | 0.43 |
| 5 | 1.14 |
| 6 | 0.30 |
| 7 | 0.77 |
| 9 | 0.40 |
| 11 | 0.33 |
| 13 | 0.21 |
Table 2.
Results of the hits of bibliographic search (set1): columns “Supraharmonic” and “Harmonic” refer to the use of the two respective keywords.
Table 2.
Results of the hits of bibliographic search (set1): columns “Supraharmonic” and “Harmonic” refer to the use of the two respective keywords.
| Publisher/Search Engine | “Supraharmonic” | “Harmonic” | Ratio |
|---|---|---|---|
| Elsevier | 24 | 1511 | 1.6% |
| IEEE | 78 | 12,910 | 0.6% |
| MDPI | 15 | 1072 | 1.4% |
| 5440 | 1,050,000 | 0.5% |
Publisher’s Note: MDPI stays neutral with regard to jurisdictional claims in published maps and institutional affiliations. |
© 2022 by the author. Licensee MDPI, Basel, Switzerland. This article is an open access article distributed under the terms and conditions of the Creative Commons Attribution (CC BY) license (https://creativecommons.org/licenses/by/4.0/).
Share and Cite
MDPI and ACS Style
Mariscotti, A. Harmonic and Supraharmonic Emissions of Plug-In Electric Vehicle Chargers. Smart Cities 2022, 5, 496-521. https://0-doi-org.brum.beds.ac.uk/10.3390/smartcities5020027
AMA Style
Mariscotti A. Harmonic and Supraharmonic Emissions of Plug-In Electric Vehicle Chargers. Smart Cities. 2022; 5(2):496-521. https://0-doi-org.brum.beds.ac.uk/10.3390/smartcities5020027
Chicago/Turabian StyleMariscotti, Andrea. 2022. "Harmonic and Supraharmonic Emissions of Plug-In Electric Vehicle Chargers" Smart Cities 5, no. 2: 496-521. https://0-doi-org.brum.beds.ac.uk/10.3390/smartcities5020027