An Artificial Intelligence-Based Approach for the Controlled Access Ramp Metering Problem


Institute of Communication and Computer Systems, Zografou, 15773 Athens, Greece
*
Author to whom correspondence should be addressed.
Vehicles 2021, 3(1), 63-83; https://0-doi-org.brum.beds.ac.uk/10.3390/vehicles3010005
Submission received: 29 December 2020
/
Revised: 15 January 2021
/
Accepted: 22 January 2021
/
Published: 26 January 2021
Abstract
:The ever-increasing demand for transportation of people and goods as well as the massive accumulation of population in urban centers have increased the need for appropriate infrastructure and system development in order to efficiently manage the constantly increasing and diverse traffic flows. Moreover, given the rapid growth and the evolution of Information and Communication Technologies (ICT), the development of intelligent traffic management systems that go beyond traditional approaches is now more feasible than ever. Nowadays, highways often have sensors installed across their range that collect data such as speed, density, direction and so on. In addition, the rapid evolution of vehicles with installed computer systems and sensors on board, provides a very large amount of data, ranging from very simple features such as speed, acceleration, etc. to very complex data like the driver’s situation and driving behavior. However, these data alone and without any further processing, cannot solve the congestion problem. Therefore, the development of complex computational methods and algorithms underpins the chance to process these data in a fast and reliable way. The purpose of this paper is to present a traffic control ramp metering (RM) method based on machine learning and to study its impact on a selected highway segment.

1. Introduction
In 2019, the United Nations reported that 55% of the world population lived in urban areas in 2018 and by 2050 this number will be approximately around 68% [1]. Adding to this urban population density observation, the Covid-19 pandemic has increased the demand for urban deliveries and stressed, often to their limits, urban transport systems which are the cornerstone for the economic activities of all modern communities which involve railways, highways, airports, ports, etc. Highways, being the major transport systems in urban areas, affect the transportation and commute times as well as the quality of life of citizens to the greatest extent. Hence, the research on transport enhancement mainly focuses in the utilization of data and the development of intelligent systems which are directly connected primarily to the roadways of a city.
The solutions proposed during the previous decades in order to address traffic congestion problems were mainly focused on constructing new road segments so to increase the capacity of existing road networks. However, this type of solution has proved to be inadequate. A further step to address the traffic congestion was made by introducing traffic management and control systems in order to reduce traffic congestion and improve the road network conditions. To date, the already installed systems collect data and perform traffic control through dynamic signboards, variable speed limits, etc. in a more static way based explicitly on statistical methods. However, the ever-increasing volume of road traffic has stressed these systems to their limits. This leads to increased travel times and travel costs, as well as large negative economic and social impacts.
In addition to the operation of existing systems, rapidly evolving technologies in the fields of communications, sensors and information processing have enabled the development of new traffic management and control systems. This has led to the implementation of intelligent transportation systems (ITS) and intelligent vehicle highway systems (IVHS) as well as the automated highway system (AHS) paradigms. The ITS, IVHS and AHS incorporate both legacy systems (sensors, signs, VSL, etc.) installed on the road as well as data (speed, direction, location, etc.) coming from vehicles. The collection of the traffic data is carried out through peripheral sensors that are installed at key points in the highways and on the vehicles. Through the combination of data provided and the deployment of advanced computer algorithms, state-of-the-art systems try to predict and manage traffic congestion, the emergency response and the environmental effects in a more efficient way. According to Baskar et al. [2] the three main techniques used for the management and control of a road traffic network can be summarized in the following:
Table 1 below provides a comparison in terms of scalability, future data predictions and computational complexity with reference to these aforementioned categories:
Table 1 shows that the higher the computational complexity the higher the scalability of the considered method. Thus, artificial intelligence as well as optimal control and MPC methods can be employed for systemic integration. The difference between a systemic and a local integration procedure is that the first refers to the entire roadway systems of an entire city or a country, for example. The systemic approach takes as input data from the entire highway network and aims to achieve better traffic management in total rather than at specific points. On the other hand, the local approach refers to small scale systems which involve just a section of a highway and cannot take into account the overall traffic conditions, so in these cases it is possible that traffic will be alleviated in specific segments while causing congestion in others.
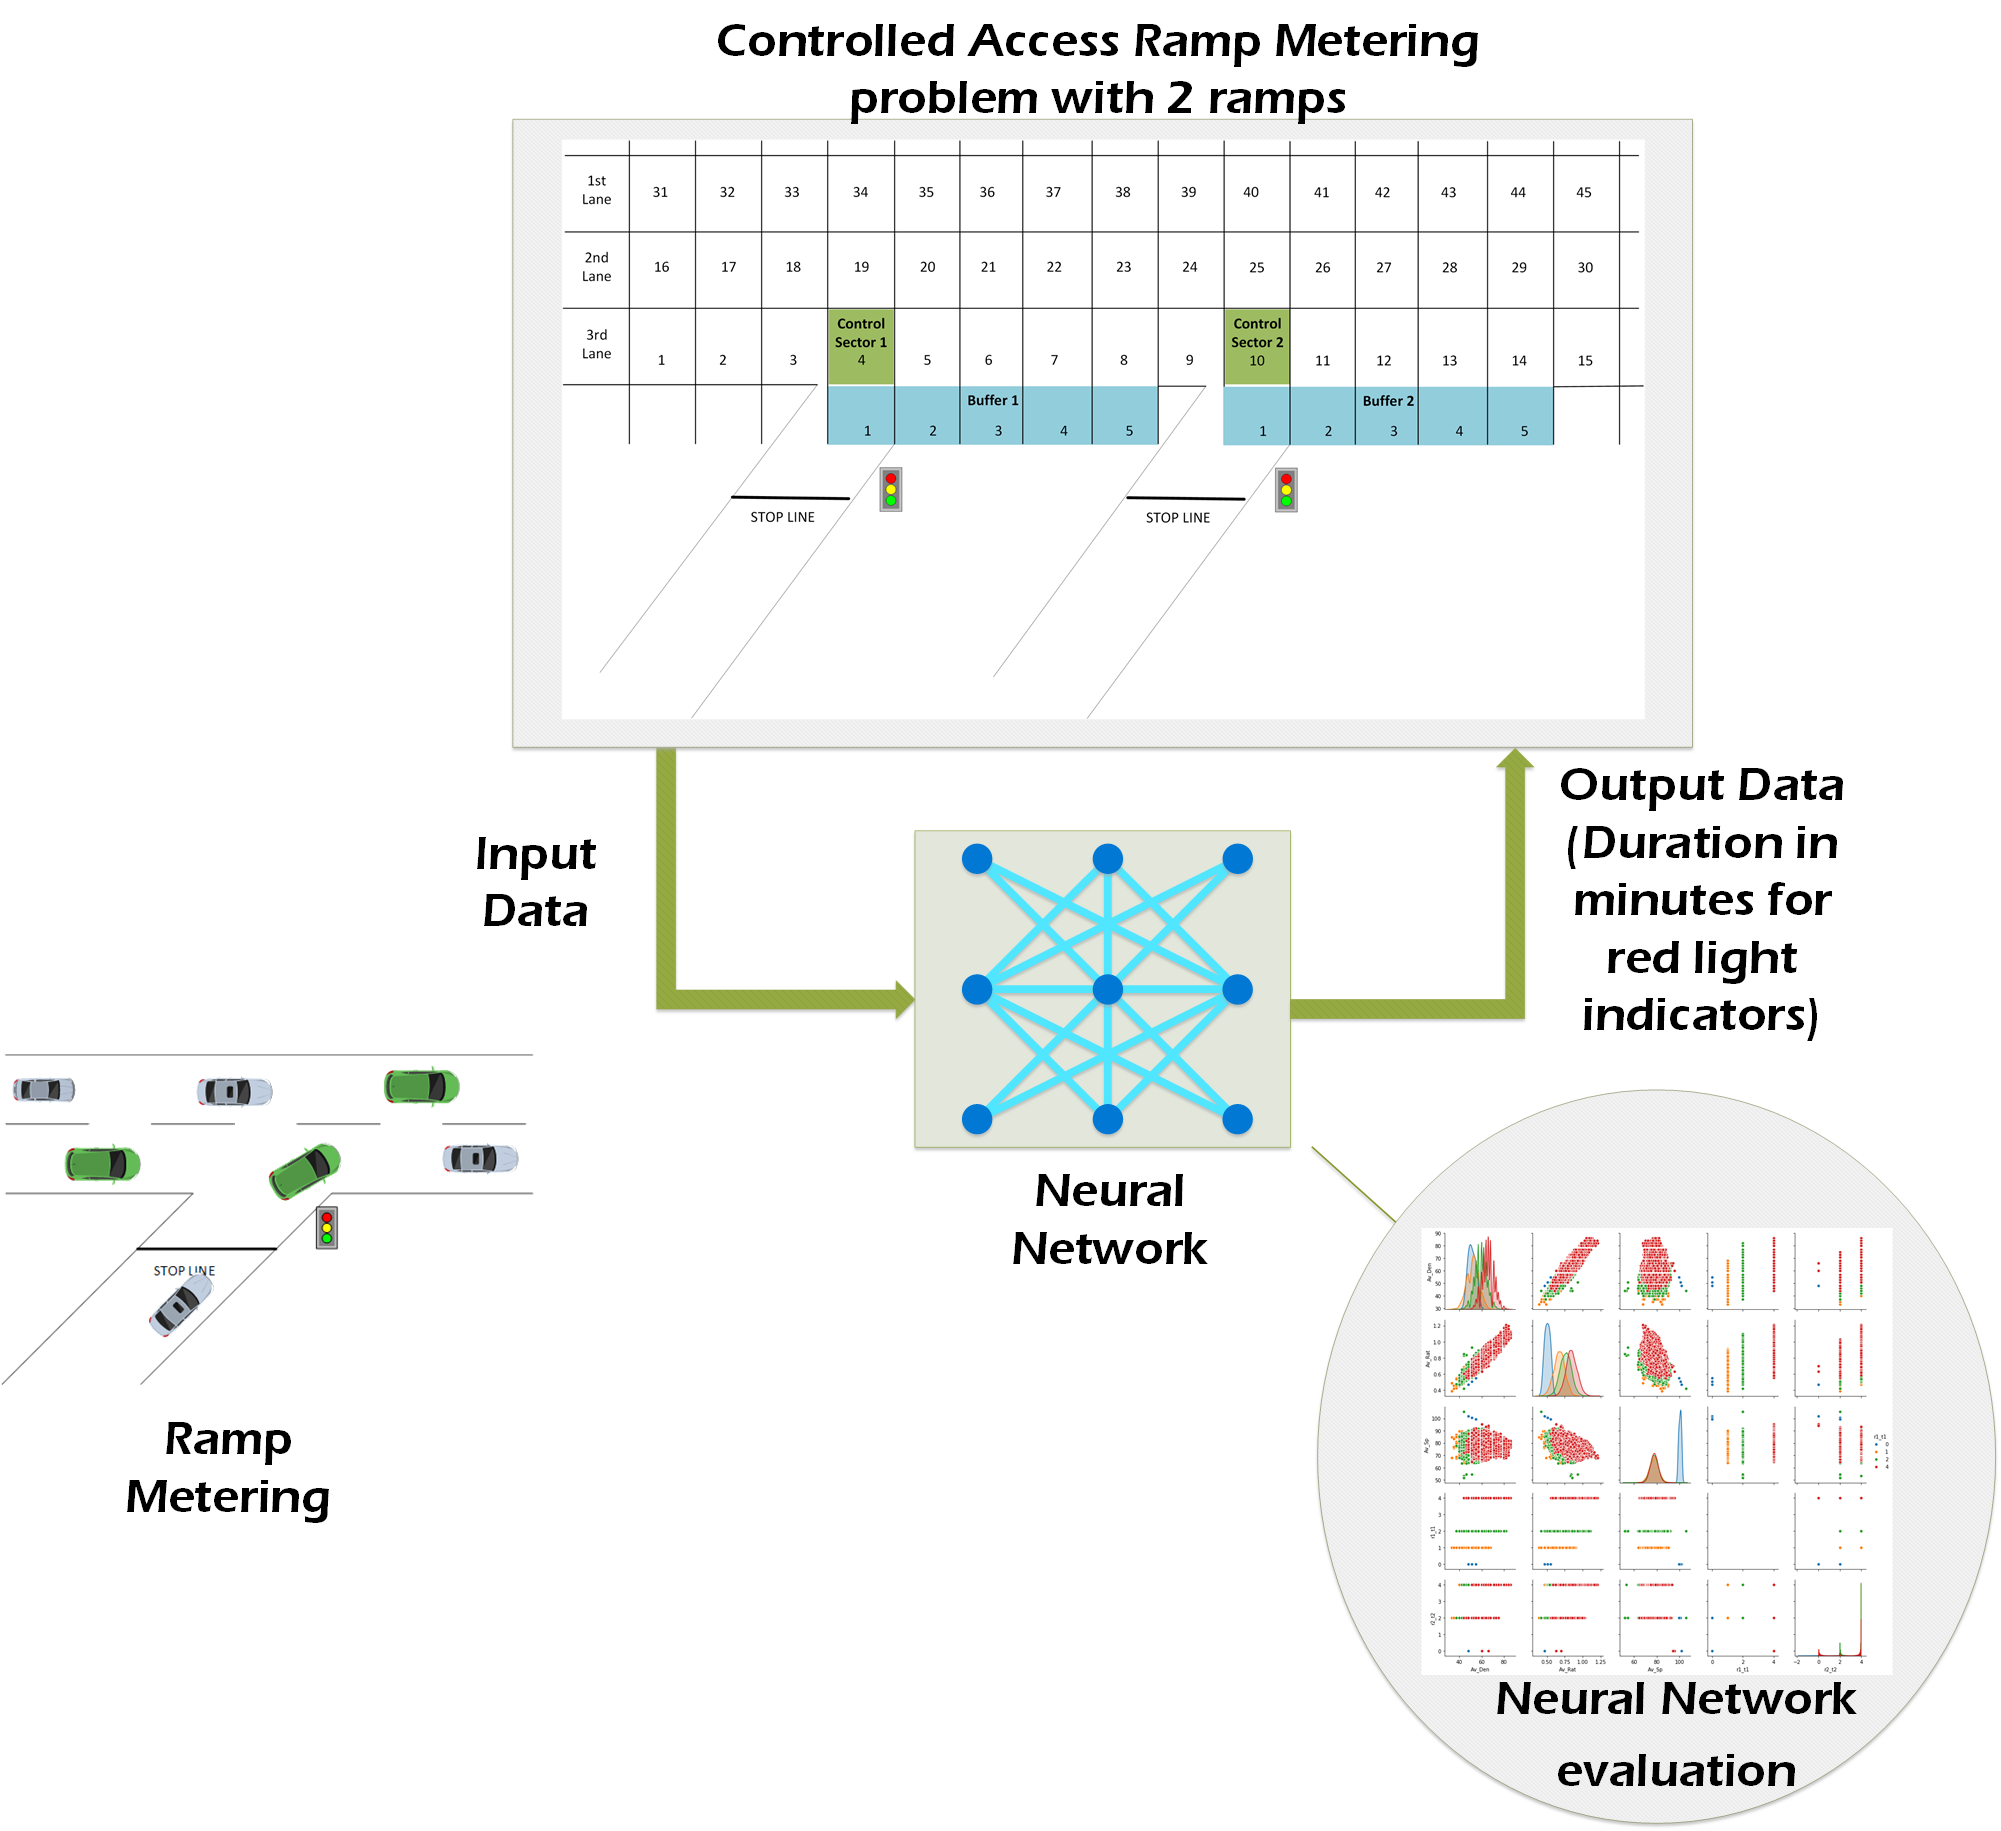
The traffic congestion problem has many dimensions and therefore, many different solutions that can use one or more of the aforementioned categories. In this light, the approach that will be followed in this work is that of the development of an intelligent, artificial intelligence-based, traffic data management system. The proposed method collects data from a highway segment and processes it using a neural network algorithm in order to predict the best duration (in minutes) for the red light in two consecutive entrance ramps of this specific highway segment or in other words, optimize the on-ramp flow control. The on-ramp flow control through traffic lights is one of the most studied and promising methods to improve the traffic conditions in highways [6,7]. The method proposed in this paper is a ramp metering (RM) method which incorporates two input ramps and a three-lane highway segment.
The remainder of this paper is structured as follows: Section 2 features an overview of the ramp metering problem alongside a literature review considering different studies focused on ramp metering; Section 3 presents the model developed for traffic simulation and the deployed neural network configuration; Section 4 demonstrates the results and their evaluation and Section 5 concludes the paper and points to future work and extensions of the current study.
2. Ramp Metering: Theory and Related Work
2.1. Theoretical Background
The main goal in any highway-related traffic management study is the seamless entrance and exit of vehicles in and out of the main stream of a highway, respectively, as well as the continuous traffic flow on it. In particular, an entrance ramp which includes the necessary auxiliary lane(s) enables the incoming vehicles to accelerate so as to attain the necessary speed to incorporate smoothly into the highway traffic flow without the need to stop the flow of either the incoming vehicles or the vehicles already moving on the highway [8].
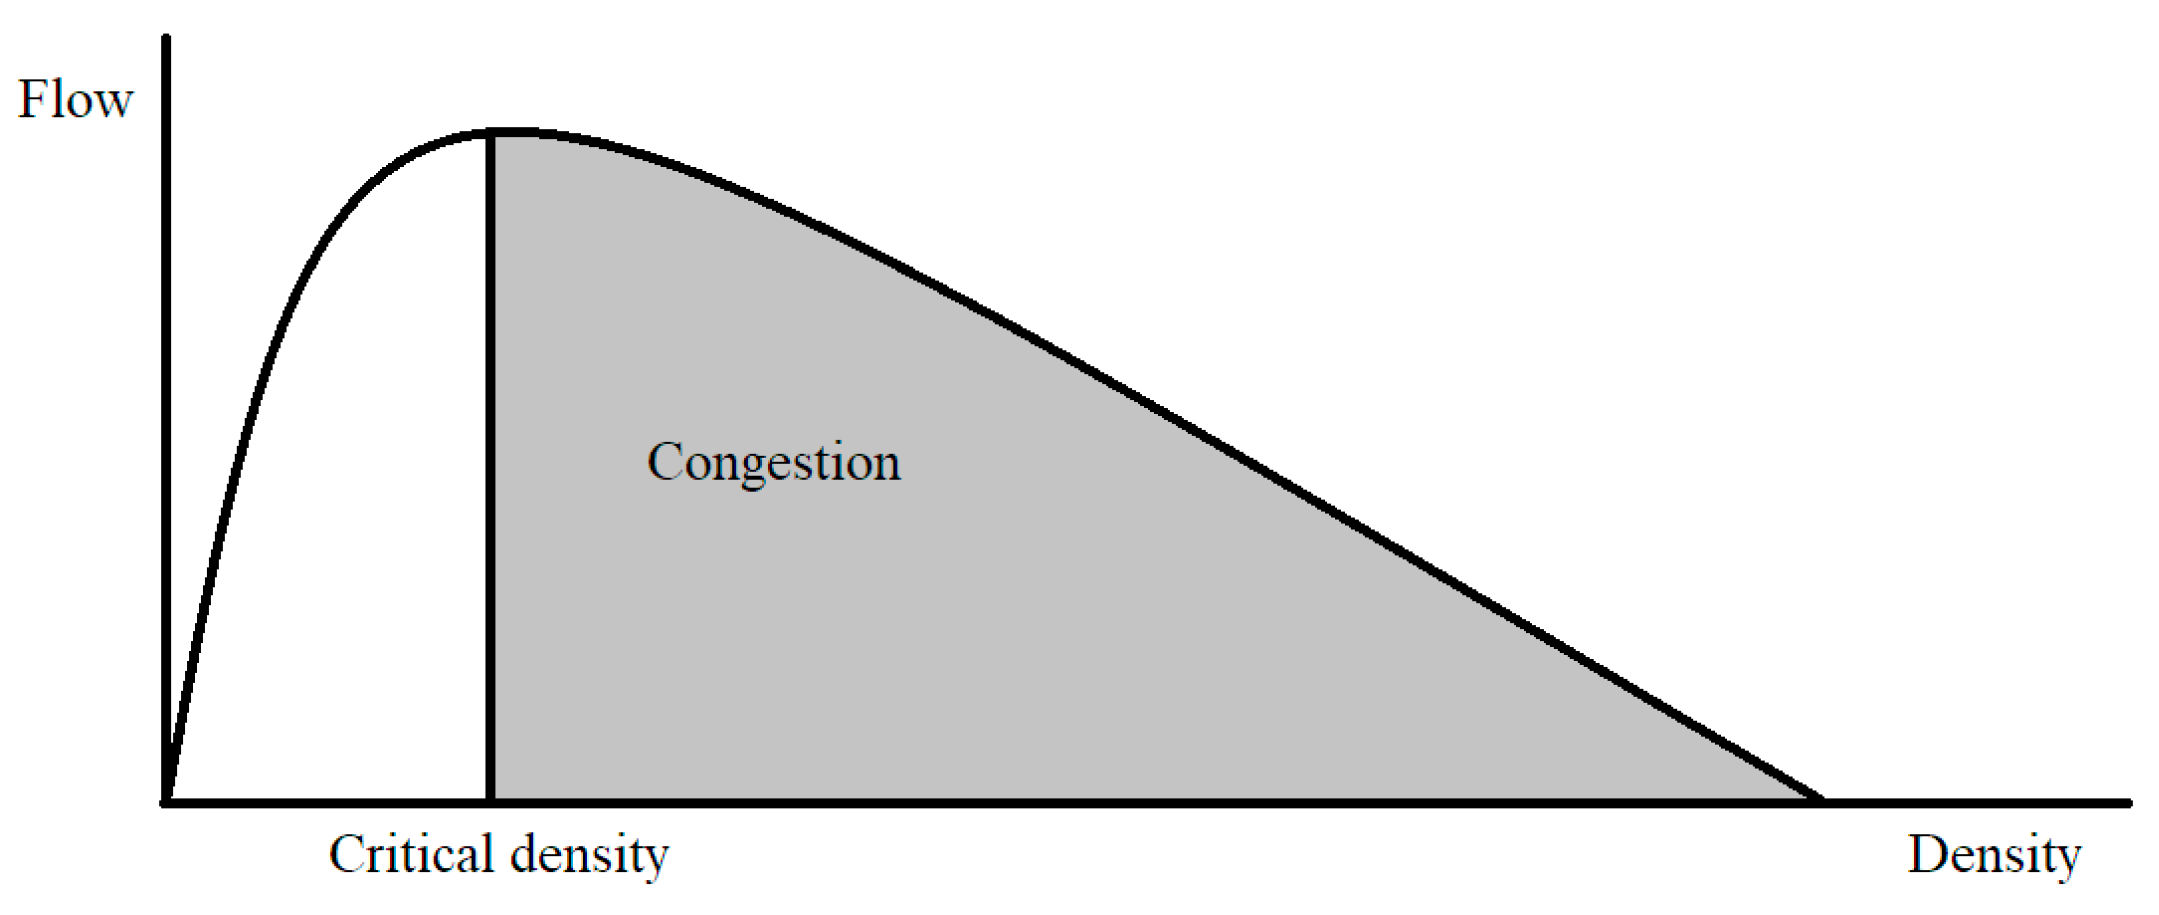
Ramp metering is a method for measuring and controlling traffic that is applied to entrance ramps on highways. The measurement of the number of vehicles is performed through sensors located at the entrances and exits of the highway. The purpose of this method is to control the entry of vehicles in the highway so to make the best use of the capacity of the highway [6,8],. Specifically, the ramp has a demand for traffic d0 expressed in vehicles per hour (vh/h), while r0 (vh/h) is the traffic on the ramp regulated by signs, qc (vh/h) the highway capacity and qin (vh/h) the flow of the main stream. When a traffic jam occurs, the maximum output current qout (vh/h) is less than the normal main current flow qc. The above phenomenon is called capacity drop and the goal is to avoid it as much as possible [9]. The capacity drop phenomenon can be seen in flow—density chart in Figure 1. In cases where ramp metering is not applied, capacity drops tend to occur quite often. Therefore, with the use of ramp metering and the continuous retrieval and analysis of traffic data, this phenomenon can be alleviated. Then, the flow of vehicles is smooth and the traffic times are reduced on the main lanes. On the other hand, there is a possibility of creating a long queue of vehicles on the entrance ramp and correspondingly long delays there. Thus, it is easily understood that a balance must be maintained between the traffic on the highway and the length of the queue at the entrance.
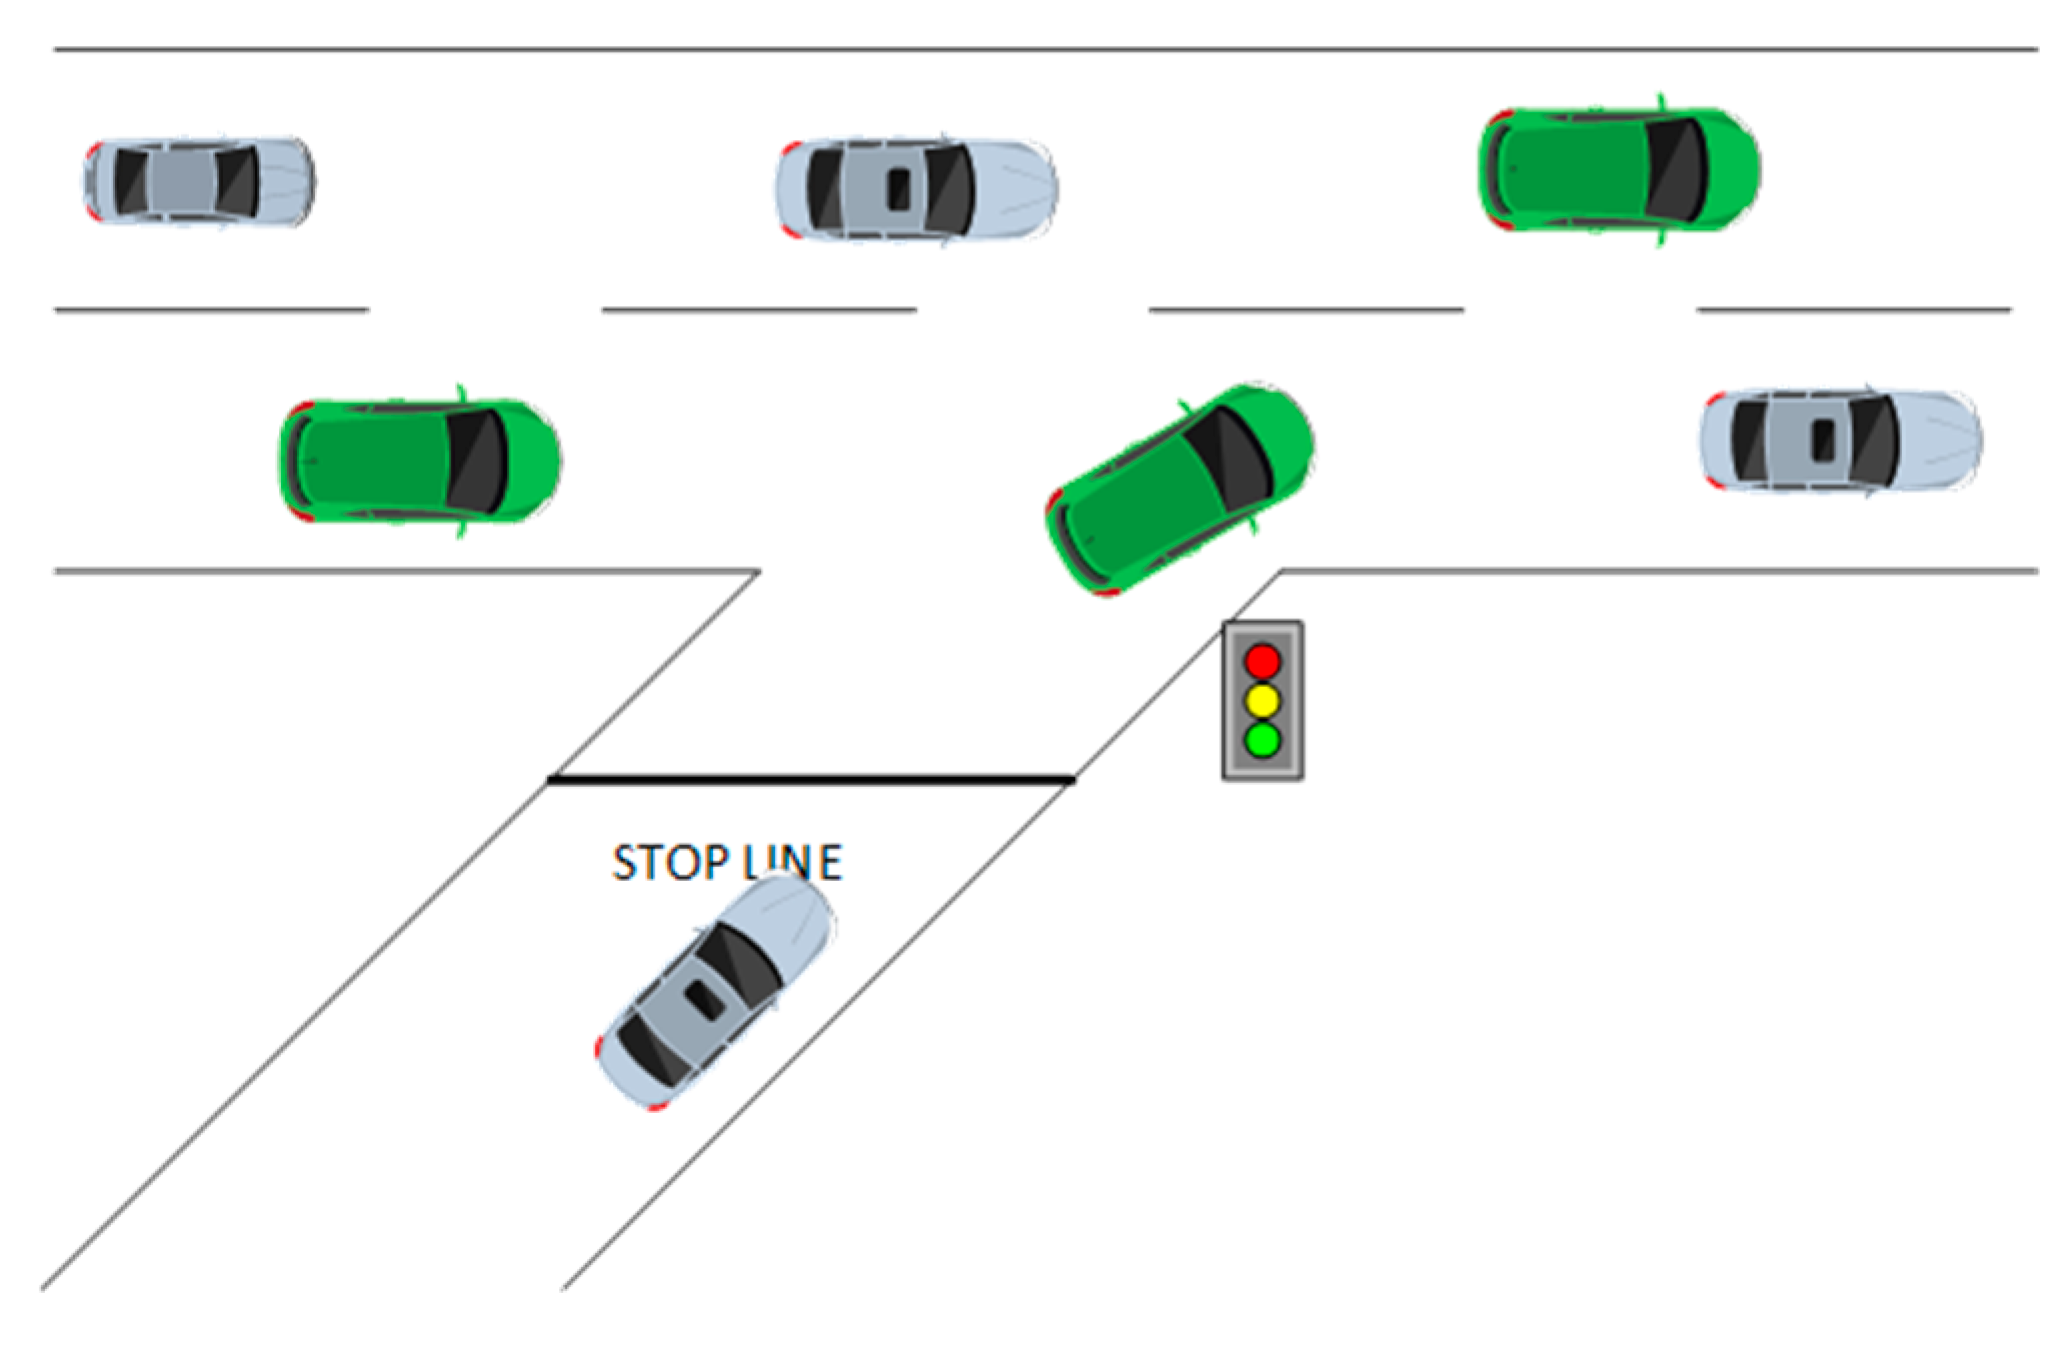
Controlled access through ramps is a key tool for achieving the required flow on highways and avoiding traffic congestion at the same time. The main goal, given that the capacity of a highway is obviously not unlimited, is to maintain as high as possible the level of the main flow. In this perspective, traffic lights are installed on the entrance ramps, in order to control the rate at which vehicles enter the main stream of the highway [8]. Controlled access is widely used on entrance ramps to achieve the best possible traffic regulation. More specifically, it is possible to reduce the waiting times of vehicles entering the highway as well as the travel times on it. In addition, controlled access on ramps increases safety when vehicles enter the main flow, thus reducing the risk and number of accidents caused especially in situations of increased traffic. A typical depiction of an entrance ramp with traffic lights for control access is shown in Figure 2.
2.2. Related Work and Purpose of the Current Study
Ramp metering is a one of the most studied and important methods for traffic control so to reduce highway congestion and improve safety [7]. There are several studies through the years that utilize ramp metering by combining different models and computational methods so to achieve the best possible performance. Some of the first ramp metering methods that were suitable mostly for local implementation are the occupancy (COC) strategy and demand-capacity (DC) according to Masher et al. [10]. These methods can be classified as fixed-time control methods which are generally simple and based on historical data in order to adjust the time and entrance rate through ramps [11]. Local-traffic response methods based on the demand-capacity method and the occupancy method are developed in [10,12,13] studies. The aforementioned methods cannot perform well in cases of rapid changes and fluctuations in traffic on a highway. Adaptive RM control methods which can be classified to local and coordinated traffic response can be considered as an evolution to these methods.
Papageorgiou et al. [5] proposed the ALINEA method, which is also a local adaptive method, engaging a closed loop algorithm in order to define the entrance rate through ramps in a highway and simultaneously to retain the flow in a predefined value [14]. ALINEA is one of the most celebrated methods considering the RM and thus is combined with various diverse technologies and tools. ALINEA was the first to introduce a local traffic coordinated method and due to its performance in the next years it was studied and expanded by many researchers in order to be adapted to different conditions and become more effective. Some of these modified ALINEA-based methods are the following: (i) flow-based ALINEA (FL-ALINEA) [7]; (ii) upstream-occupancy ALINEA (UP-ALINEA) [7]; (iii) upstream-flow-based ALINEA (UF-ALINEA) [7]; (iv) ramp-queue control (X-ALINEA/Q) [7]; (v) AD-ALINEA [15]; (vi) ALINEA with mainline speed recovery [16]; (vii) data-driven feedback approach for ALINEA fine-tuning [17]; (viii) proportional integral ALINEA (PI-ALINEA) [18]; (ix) feed-forward ALINEA (FF-ALINEA) [19] and (xi) congestion-status ALINEA (CS-ALINEA) [20].
In addition to the ALINEA method and its modifications, there are also some other well-known algorithms for ramp metering. METALINE is a well-known RM algorithm which uses a linearized version of a nonlinear macroscopic flow model as presented in [21]. System-wide adaptive ramp metering (SWARM) is also a multivariate method which attempts to alleviate traffic congestion though controlled ramp entrances [22]. Another interesting approach for RM is the usage of fuzzy logic. Taylor et al. [23] proposed a method that envisions to improve robustness, prevent congestion and balance the conflict needs of a highway. ALINEA, METALINE, SWARM and fuzzy logic methods are some representative methods proposed in previous years. Because of ALINEA’s scientific impact the aforementioned methods in many cases compared their performance with it. One major common characteristic of the abovementioned studies is that they study the RM problem from a local perspective and this may not lead to the desired results when these methods are applied at a larger scale.
The algorithms mentioned till this point presented very promising results and establish a basis for efficiently solving the ramp metering problem. Every and each one of them has its own strengths and weaknesses. However, the advances in ICT, sensors and data technologies have created new standards and new needs for almost every data-driven application. Machine learning methods and especially neural networks is a quite attractive approach for problems that need to deal with fluctuating data values. The idea of applying neural networks to ramp metering is not new, but due to technological limitations it is only in the last few years that it has tended to gain more and more ground. Zhang et al. [24] proposed the first approaches with artificial neural networks (ANNs) for RM in 1994 and 1997 [25]. Their results were promising for local RM problems and since then many studies were published which tried to go one step further either by using different machine learning methods or by scaling up the problem and examining more complex highway systems. In addition to ANNs, reinforcement learning approaches are used in several studies considering the RM problem. Also, the technology evolution both for data and machine learning techniques nowadays has led to deep learning approaches for ramp metering. A brief classification of the methods mentioned above can be found in Table 2.
Most of the aforementioned studies [14,15,16,18,19,20,24,25,27,31,32,37,39,44,45,49] studied and modelled the ramp metering problem by using only one on-ramp for entrance in the main flow of the highway. The addition of an extra ramp which shares a common ramp controller to adjust the red-light duration so to control the entrance rate in the main flow increases drastically the computational complexity. In this study, as presented, in the next section (Section 3) the modelling of the highway traffic flow assumes two ramps which are coordinated so as to maintain the density of the highway at a predefined threshold.
Moreover, machine learning methods are becoming more and more popular for traffic control and RM. Thus, it is not an exaggeration to claim that almost every state-of-the-art method employs machine learning algorithms for RM and traffic regulation in general. This is underpinned by searching relevant literature for RM and traffic regulation studies conducted in the previous years. Based on the latest research processes, state-of-the-art algorithms in ramp metering studies, are discussed in the following references: [12,20,44,45,49].
Ghanbartehrani et al. [12] investigated the development of an algorithm for ramp signal control based on the incorporation of linear regression and clustering approaches in order to learn the traffic flow trends over time. The proposed algorithm is compared with the widely known and used as well, traffic-responsive algorithm ALINEA. The results of the current comparison confirm the effective maintenance of the traffic flow at reasonable levels using the proposed algorithm, when ALINEA demonstrated cycles of long red phases followed by overcompensation and brief breakdowns [12].
Liu et al. [20] proposed an improved ALINEA-based algorithm, named CS-ALINEA. During the development and the simulation of the current algorithm the traffic flow is used to replace occupancy as the control parameter and the control rate can be selected according to the congestion status reclassified in an adaptive way [20]. The algorithm often ignores the impact of ramp overflow on ground road traffic in order to provide the traffic efficiency of the mainstream. The extracted results show that the proposed algorithm can optimize the ramp queuing length and reduce waiting time of vehicles while the efficiency of urban freeway can also be guaranteed an many cases [20].
Zhou et al. [44] proposed a reinforcement learning approach in order ‘to learn an optimal ramp metering policy controlling a downstream bottleneck that is far away from the metered ramp’. In fact, the problem of ramp metering for a distant downstream bottleneck in this study is modeled as a Q-learning problem supported by an artificial neural network. In this artificial network an intelligent ramp meter agent develops and trains a nonlinear optimal ramp metering model in such a way that the capacity of the distant downstream bottleneck can be fully utilized, but not as much so as to cause congestion due to the current density limit exceedance [44]. The results of the current research show that the proposed metering policy approach that was developed, trained and evaluated can achieve satisfying traffic flow evolution over the entire freeway for a specific range of noise level(s) that is defined as vehicles per hour (veh/h) [44].
Chai et al. [45] demonstrated a reinforcement learning algorithm to optimize the on-ramp control regulation by combining the metering rate, the length of ramp queue, the throughput and the occupancy rate of the interweaving area and the volume of the road network. In comparison with widely used simulation methods as no-control and classical ALINEA, the proposed method performs intelligent learning and optimized function and achieves an improvement on the control effect of the road network performance, ramp queue length, weaving area occupancy rate and traffic volume [45].
An interesting study regarding control strategy for ramp metering was made by Zhao et al. [49]. The current study proposes a fuzzy self-adaptive proportional–integral–derivative (FSAPID) control strategy for RM control at distance downstream bottlenecks, where the specific FSAPID control is composed of proportional–integral–derivative control and fuzzy control as well. The results depict that the current algorithm approach provides fast convergence, strong predictive ability and high action precision, and achieves preferable performance especially when the bottleneck in the examined highway is located far downstream [49].
Given the technological evolution, RM studies tend to adapt machine learning methods to address the problem as efficiently as possible. The critical phase of machine learning methods and especially for neural networks is the training phase. Most researchers try to train their models with as many as possible unbiased random data so as to prepare their model to be ready to handle even the rarest and most unexpected situations with the highest possible efficiency. In this light, the proposed solution in this study used a randomized dataset which was created by engaging different scenarios of traffic flow in a highway employing entrance ramps. The details for the data generation and the scenario implemented are provided in the next section.
3. Highway Modeling and Methodology for the Neural Network Controller
3.1. Highway Modelling
As already mentioned previously, the goal of a ramp metering access control model is to make the most of a highway while keeping the traffic density steady within a predetermined range. The density concerns the whole section of the highway and thus, in this case with more than one ramp employed, the total density of the entire section covered by the ramps before and after them needs to be considered. Based on this approach, the main goal of the model proposed is to limit the density into a predefined range according to Equation (1):
where ρ the measured value of density, ρc the critical density of the highway and ε the acceptable divergence from the critical density. Density in a section of a highway is defined as the total number of cars on it divided by its total capacity, so the following assumptions were used to develop the proposed model:
ρ ∊ [ρc − ε, ρc + ε]
- C, highway section capacity. This value is identical to the set of sectors that the highway has as each sector can have a maximum of one car.
- S, set of cars on the highway in the specific section under examination. The sum is calculated from the total sections with value 1 that exist on the highway.
- ρ the density which is calculated as in Equation (2):ρ = (S/C) × 100%
Therefore, the magnitude that affects the density is the number of cars (S) moving on the main stream of the highway. This specific measurement changes when new cars enter the highway either from the entrance ramps or appear at the beginning of the studied section as well as when cars exit at the end of it.
During the model development process for the purposes of this study several different scenarios and highway models were considered. The study initiated from a nascent stage in which the highway consisted of one lane and one ramp and through development process and several loops the final model consisted of a highway main stream with three lanes and two entrance ramps. More specifically the different scenarios for the highways modelling configuration examined in this study are:
- One lane and one ramp
- Three lanes and one ramp
- Three lanes and two ramps
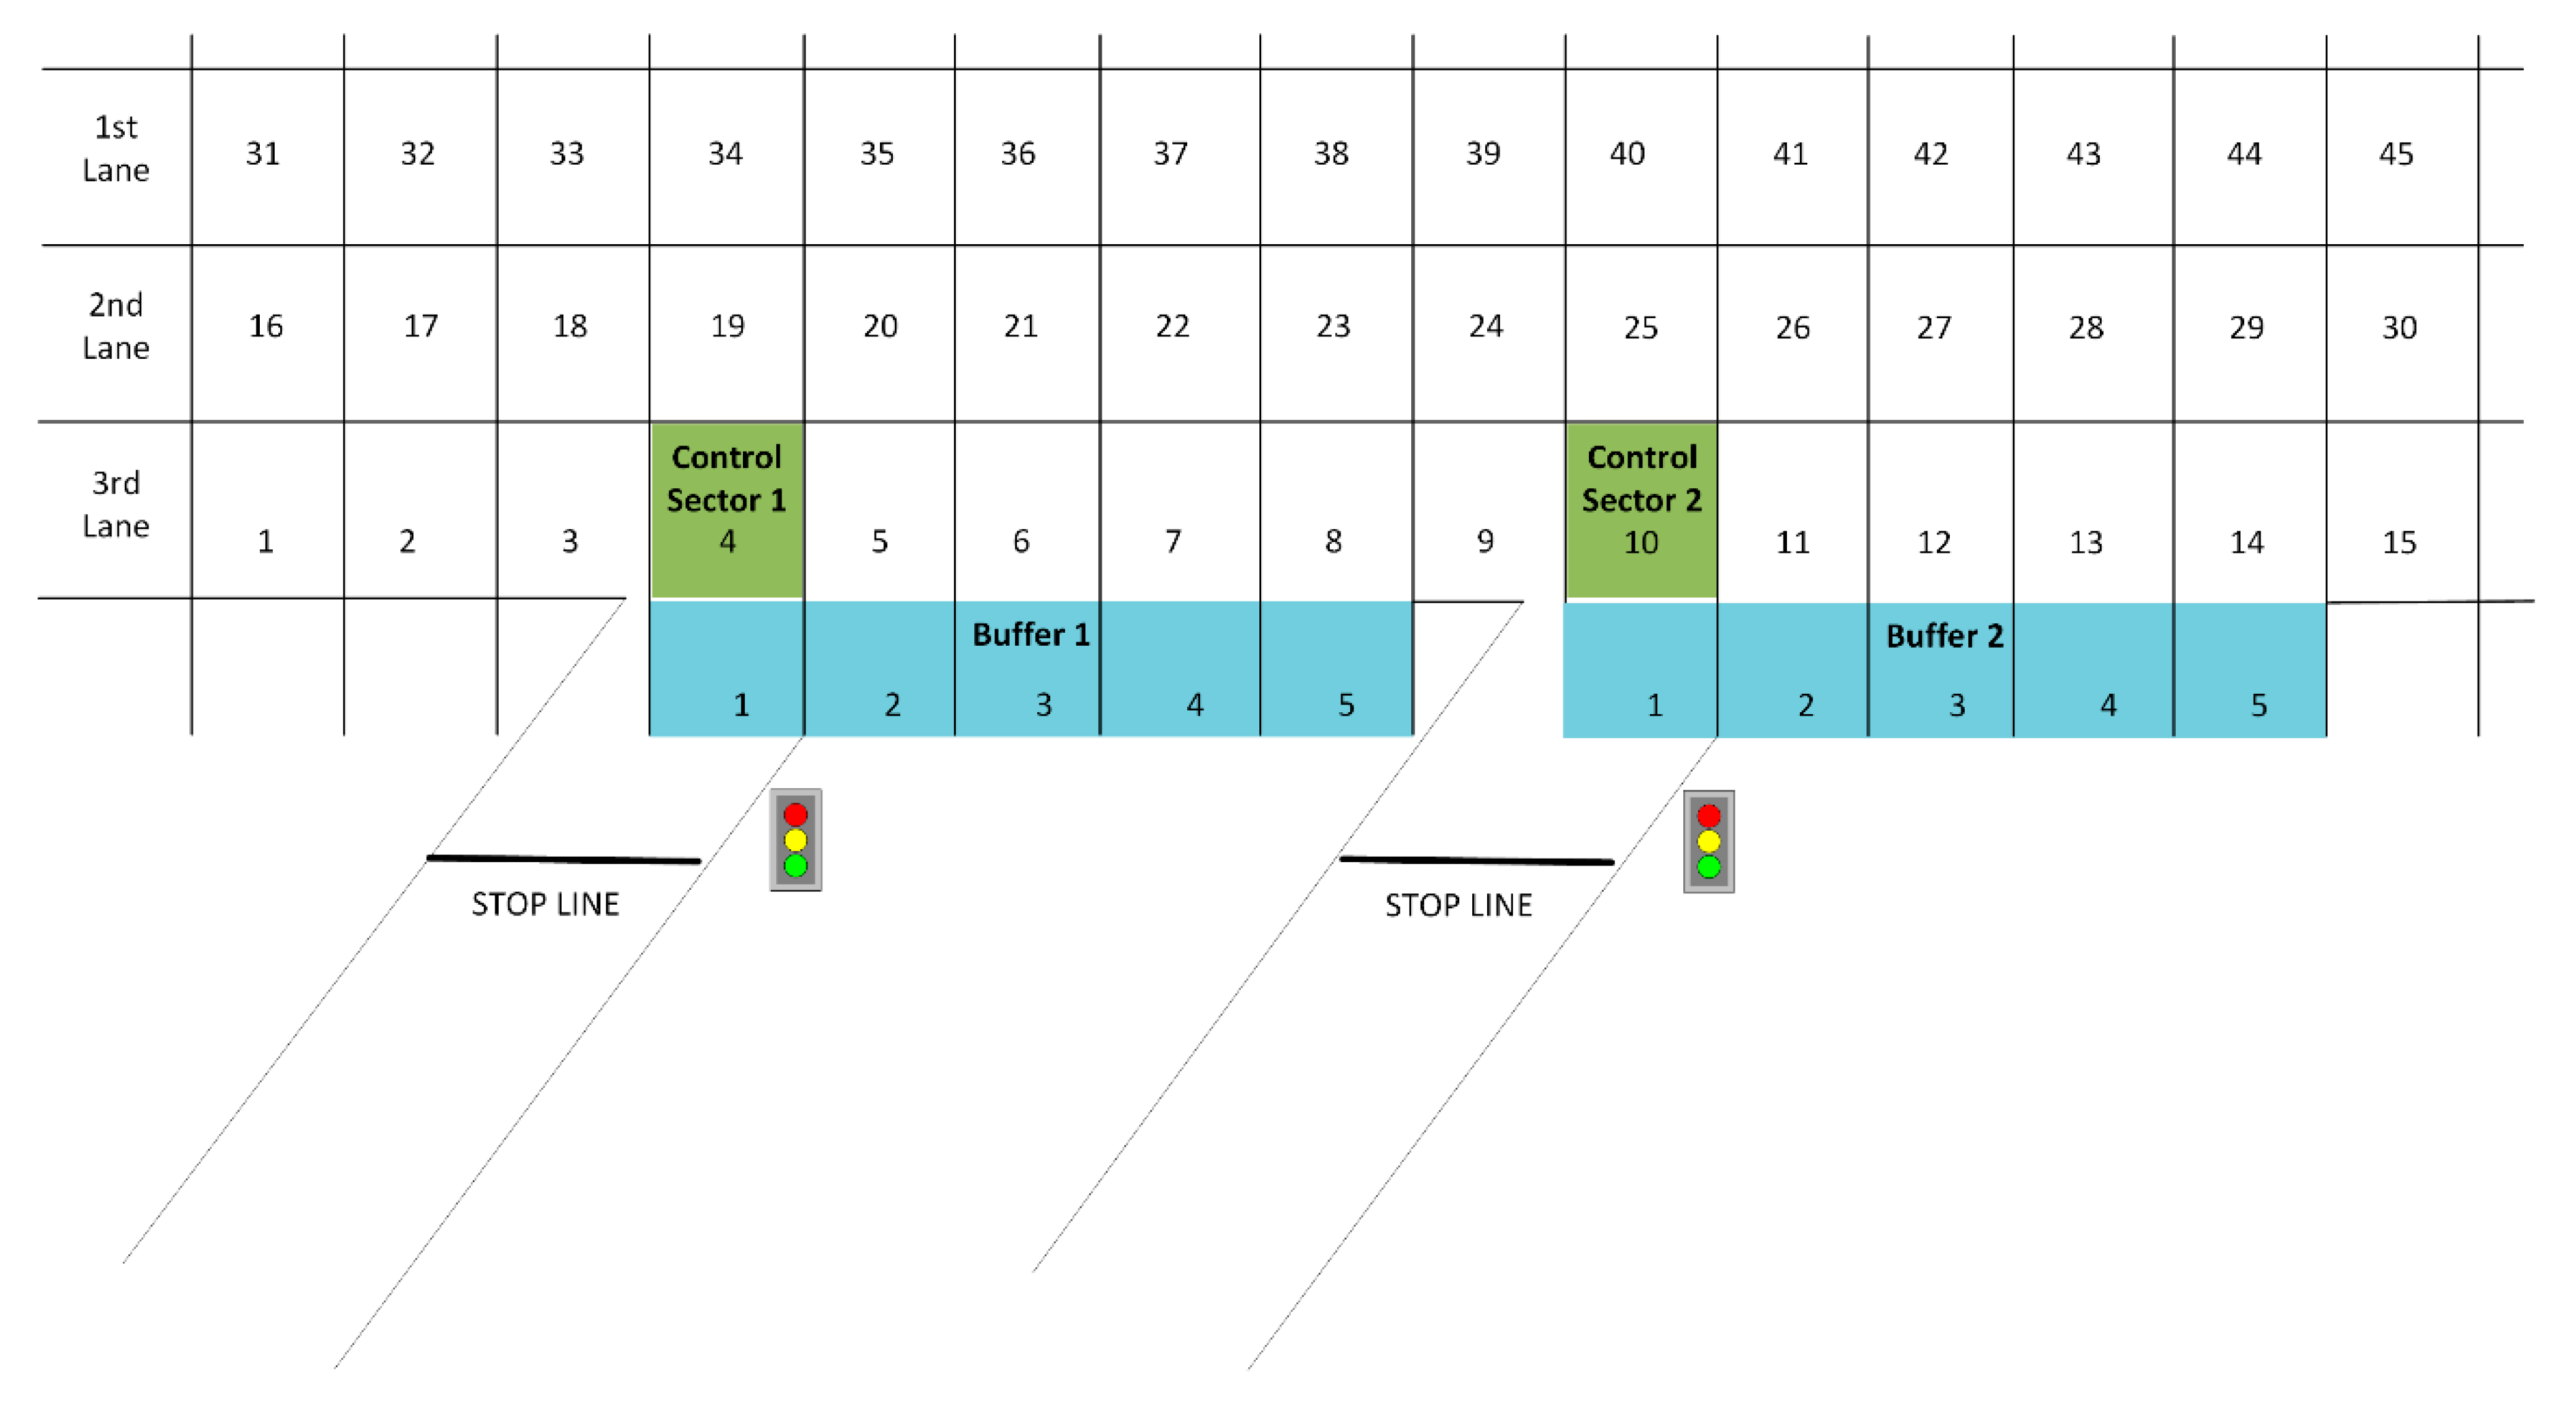
The final model, which is very close to the real conditions of a highway, consists of three lanes and two entrance ramps. Moreover, the entrance ramps have one lane and the auxiliary entrance lane has a capacity of five cars. The main stream of the highway consists of 45 different sectors whereas each sector can host one car (capacity of each sector is equal to 1). The 45 sectors are distributed evenly in the three lanes—15 sectors on each lane (1–15 right lane, 16–30 middle lane, 31–45 left lane). The cars that enter the highway through the ramps firstly move in the auxiliary lane (buffer). Cars can change lanes in the main stream and can move only forward in the road. The entrance of a car into the main stream of the highway or on to a ramp happens randomly. A depiction of the model used for this study is shown in Figure 3.
The proposed model as described above can be used to simulate the traffic in a highway section. The control process in order to allow a vehicle to enter into the main stream is done at each ramp by examining the density of the main stream before and after it. The first ramp is directly affected by sectors 1–4 which are directly before the ramp 1 and the second ramp by sectors 5–10 which are also directly before ramp 2. More specifically, when the control sector 1 (sector 4) and the control sector 2 (sector 10) are occupied then both ramps do not allow any vehicle to enter. Also, when the buffer for each ramp is full then the corresponding ramp does not let any vehicle to enter. Moreover, there is a predefined set about the duration of the red light, 0, 1, 2 or 4 min. So, when the density of the highway section, which affects each ramp (sectors 1–4 for ramp 1 and sectors 5–10 for ramp 2), is:
- 0–30%, then the red light duration is set to 0 min
- 31–60%, then the red light duration is set to 1 min
- 61–70%, then the red light duration is set to 2 min
- Over 70%, then the red light duration is set to 4 min
As mentioned previously, the density of the highway should remain around a predefined threshold. For the purposes of this study, during the modelling implementation phase this threshold was defined at 70% capacity. Thus, when the density reaches this threshold, the ramps should decrease the entrance rate of vehicles in to the highway. It is worth mentioning that the entrance through the ramps cannot be totally halted even when the density of the road is above 70% because then there will be traffic congestion and long queues onto the ramps which, also represents a problem. Thus, the decision made was to double the time of the red light duration in case the capacity exceeds the critical value of 70%.
Due to the existence of the three lanes as well as the two ramps, the conventional control algorithm execution has a significant increase in computational complexity terms. This composed model is in fact very close to real life systems and so through its simulation it is possible to mine data in order to create useful datasets to train the neural network presented in the next sub-section. As far as the computational complexity of the aforementioned model is concerned, it must be mentioned that a running period of around 5 min produced 150 Mb of data.
3.2. Neural Network for 2-Ramps Metering Control Configuration
In the previous subsection, the model used to simulate real traffic conditions in a highway segment was presented. It is clear that the more demanding the algorithms used for traffic simulation the more power and execution time are needed. In this light, the need to develop a machine learning algorithm using a neural network which will responds in near-real time to rapid traffic changes so to control the entrance in the highway through ramps is pertinent.
After the completion of the modelling procedure, as described in the previous subsection, the necessary training and test data sets for the neural network need to be created. The development of the studied neural network was performed using the Keras library (https://keras.io). This neural network examines a system like the one described in the previous paragraph with three lanes and two ramps.
Following the experimentation and implementation of the aforementioned model, the data were created randomly using the brute force method so to approach real-life conditions as much as possible. More specifically, initially multiple iterations of the control scenario were performed and thereby various data were created which, after analysis, could potentially reveal hidden patterns and useful correlations in traffic congestion and flow terms. These patterns were thoroughly examined and led to the selection of the raining data format as shown in Table 3.
More specifically:
- T refers to the discrete time instances.
- Section columns refer to the sections of the highway and contain binary values (0 or 1) which indicate whether there is a car or not in the corresponding section.
- Density contains the value of the density along the entire segment of the highway.
- Average speed is the average vehicle speed for each time point on the highway.
- Ratio (R) is the ratio between density and average speed.
- Output time ramp x columns contain the desired results of the neural network and present the time in minutes for the duration of the red traffic light on each ramp. Each of these columns consists of 4 categorical values, and more specifically the values 0, 1, 2, 4, which refer to the time that each ramp remains closed for the specific period of time.
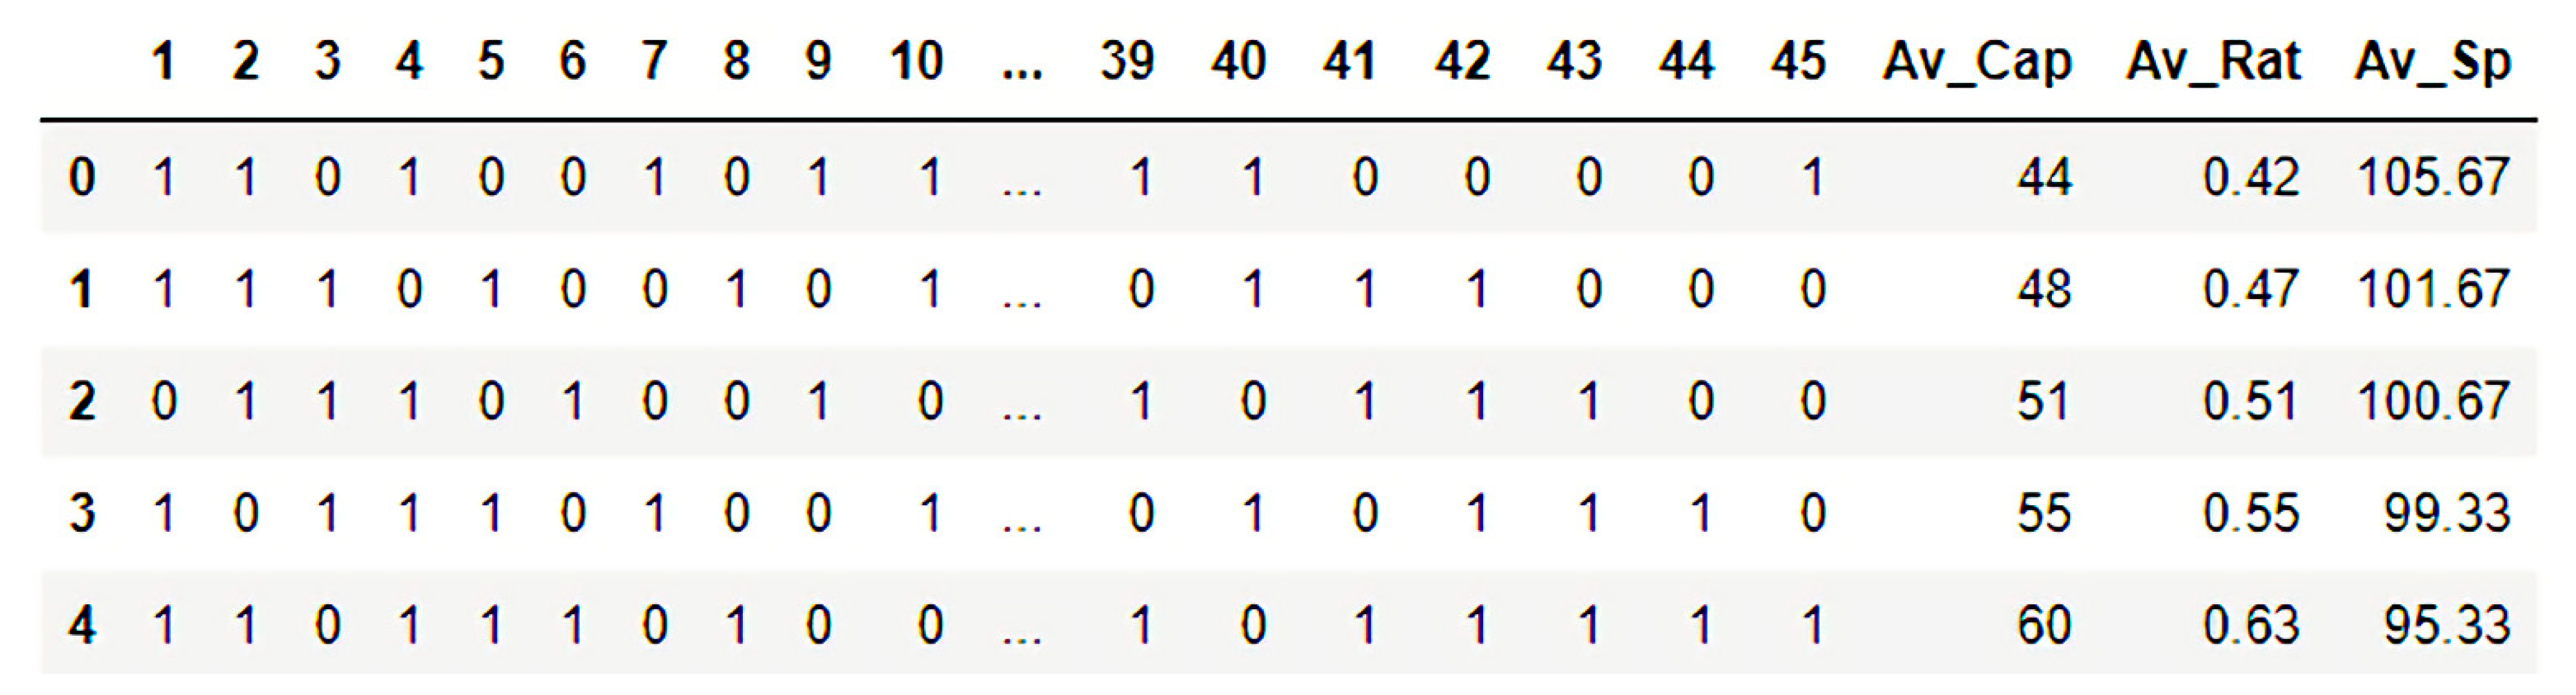
For the needs of this study, a neural network was developed for multiclass classification. The produced dataset consists of 108016 observations, with 48 input variables and two output variables as described above. An indicative snapshot of the input in the studied neural network is depicted in Figure 4:
As shown above, all input variables are numeric and continuous and do not contain any categorical variables. Since there is no categorization variable, there is no need to convert data of this type of variables accordingly. Given the fact that the input characteristics of the network were expressed in different scales, it was necessary to normalize the input of the model at a specific scale. Thus, the development process of the neural network was finalized upon completion of data pre-processing. The Keras library which is used for the development process created the required neural network levels. There are two main types of models available in the Keras library, the sequential and the functional model. For this study the sequential model was used in order to implement the neural network.
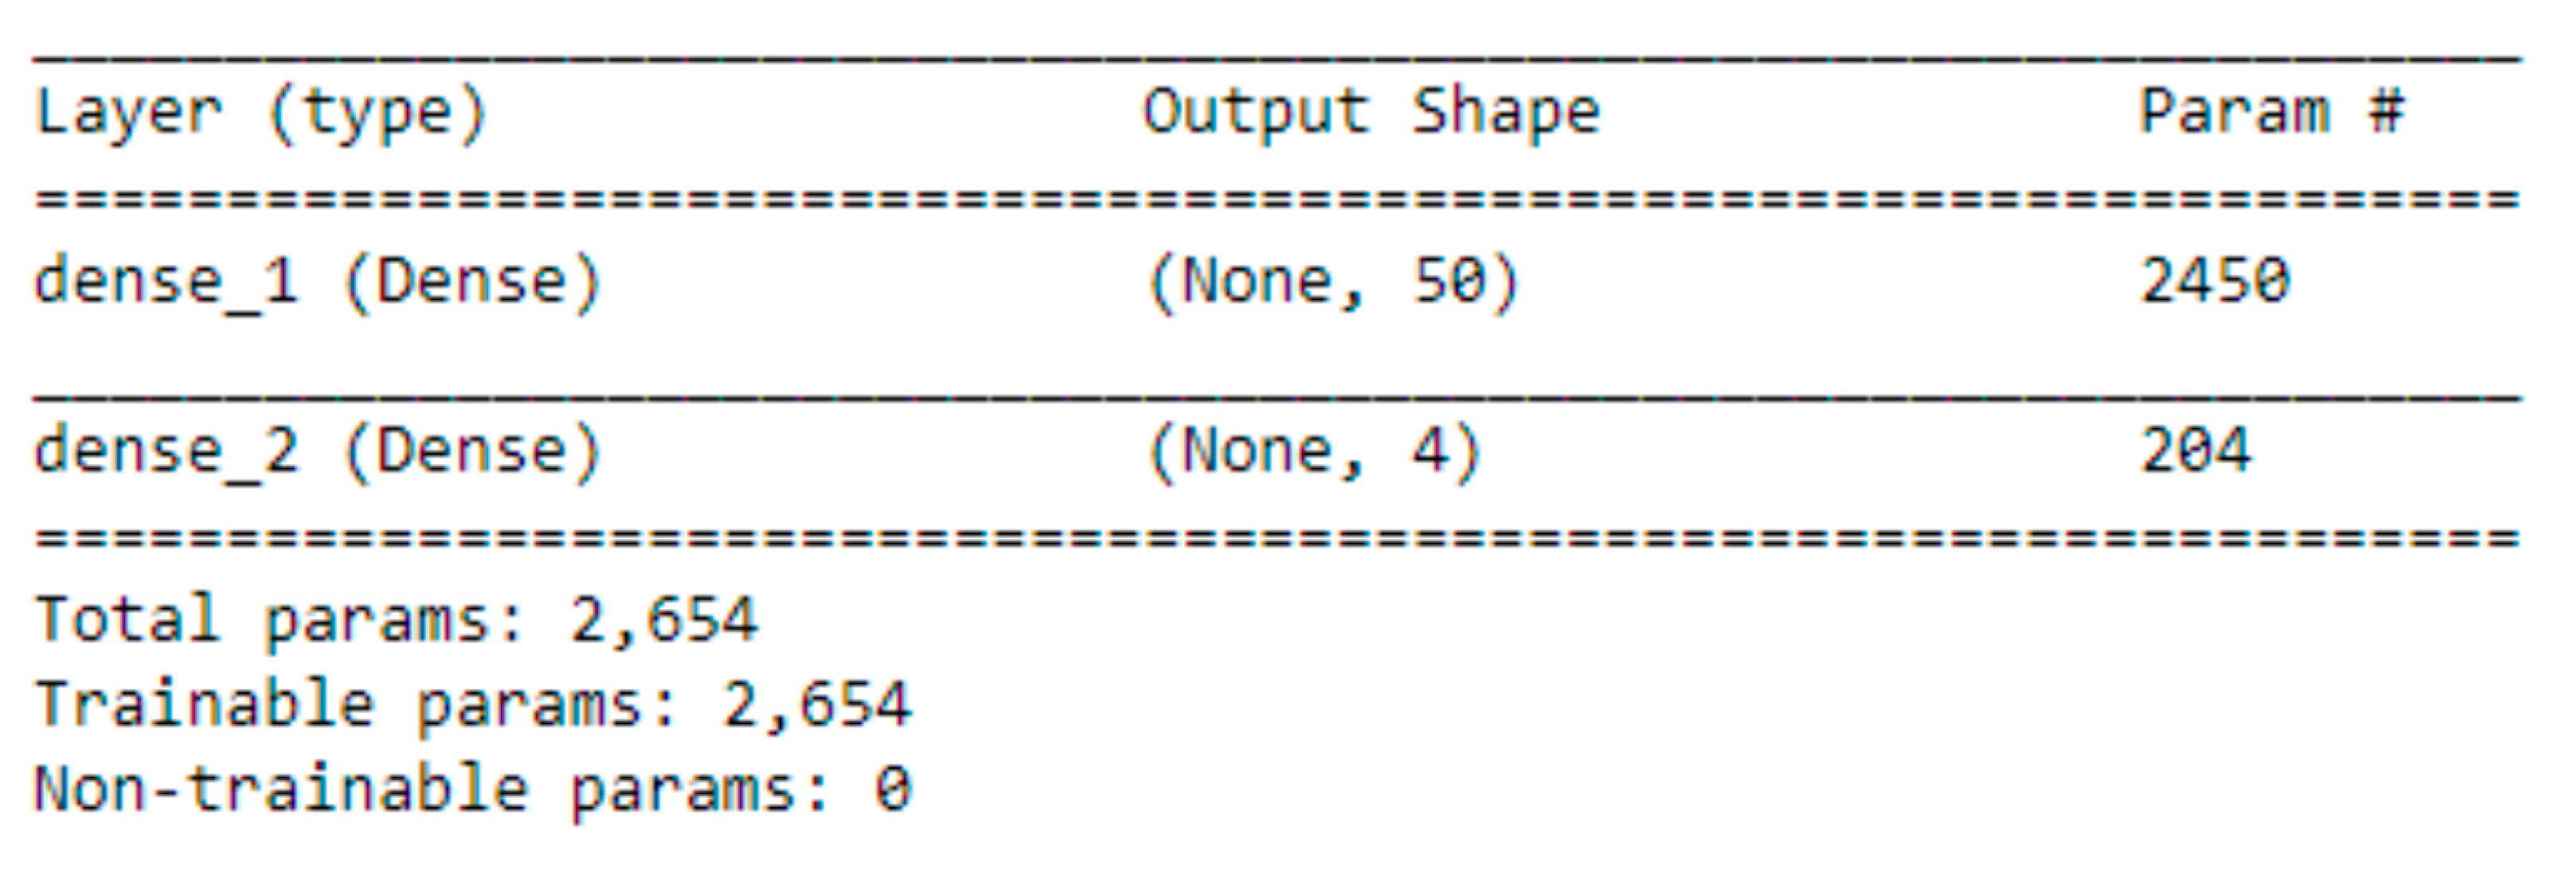
Moreover, the dense class (https://keras.io/api/layers/core_layers/dense/) was used to create the required network layers. The implemented model consists of 48 input features and one target variable. In addition, it has two hidden layers, one of them with 50 nodes and an output layer that gives four output variables, required for the forecast values (0, 1, 2 and 4) as mentioned above. Figure 5 features some indicative information about the characteristics of the neural network layers.
During the model configuration, a random initial weight distribution was used at each node, which was optimized during the model training. The Relu (https://keras.io/api/layers/activation_layers/relu/) function produced the conditions for the hidden level activation function, while at the same time the softmax (https://keras.io/api/layers/activation_layers/softmax/) function was used, since the problem at hand is actually a sorting problem with multiple output values. For optimization purposes, the Adam class (https://keras.io/api/optimizers/adam/) was used, which represents the estimation of adaptive torque. Adam utilizes the RMSProp class optimizer (https://keras.io/api/optimizers/rmsprop/). The RMSProp takes into account past gradations to smooth out the slope by engaging plain momentum. In order to confirm the validity of the algorithm’s performance over time, the accuracy both on the training data as well as on test data was measured and evaluated. During the training process, as the neural networks process more and more data, the error for both the training and the test data decreases. However, in case the training is carried out for a large volume of data, the network’s performance in the training dataset may be reduced but also this would lead the model to be over-trained as it would learn irrelevant details and noise (overfitting). In this case the overfitting adversely affects the neural network’s performance and at the same time, the error for the test set would increase again. Therefore, the key point of the training phase is just before the error starts to increase in the test data set.
Following the study and development of proposed neural network by using the Keras library, the next section presents an analysis and evaluation of the acquired results based on the traffic data produced by the model presented in detail in Section 3.1.
4. Results and Evaluation
4.1. Results of Different Control Scenarios for Ramp Metering
In this section acquired results of each scenario/algorithm mentioned in Section 3.1. are presented. The extraction of the provided results took place for each algorithm separately through specific commands and exported to readable csv files so that they could be further studied and analyzed even with simple office applications such as excel. The results of the aforementioned scenarios contain the following metrics:
- The density in all lanes of the highway as shown in Equation (2)
- The average speed as shown in Equation (3)
- The ratio (R) between average speed and density as shown in Equation (4)
- The execution time of the algorithm
- The repetitions performed:where vi is the speed of vehicle i and S the total vehicles on the highway segment examined:R = ρ/V
The above ratio is dimensionless and expresses the correlation between average speed and density. Table 4 depicts the results for every and each scenario the aforementioned metrics:
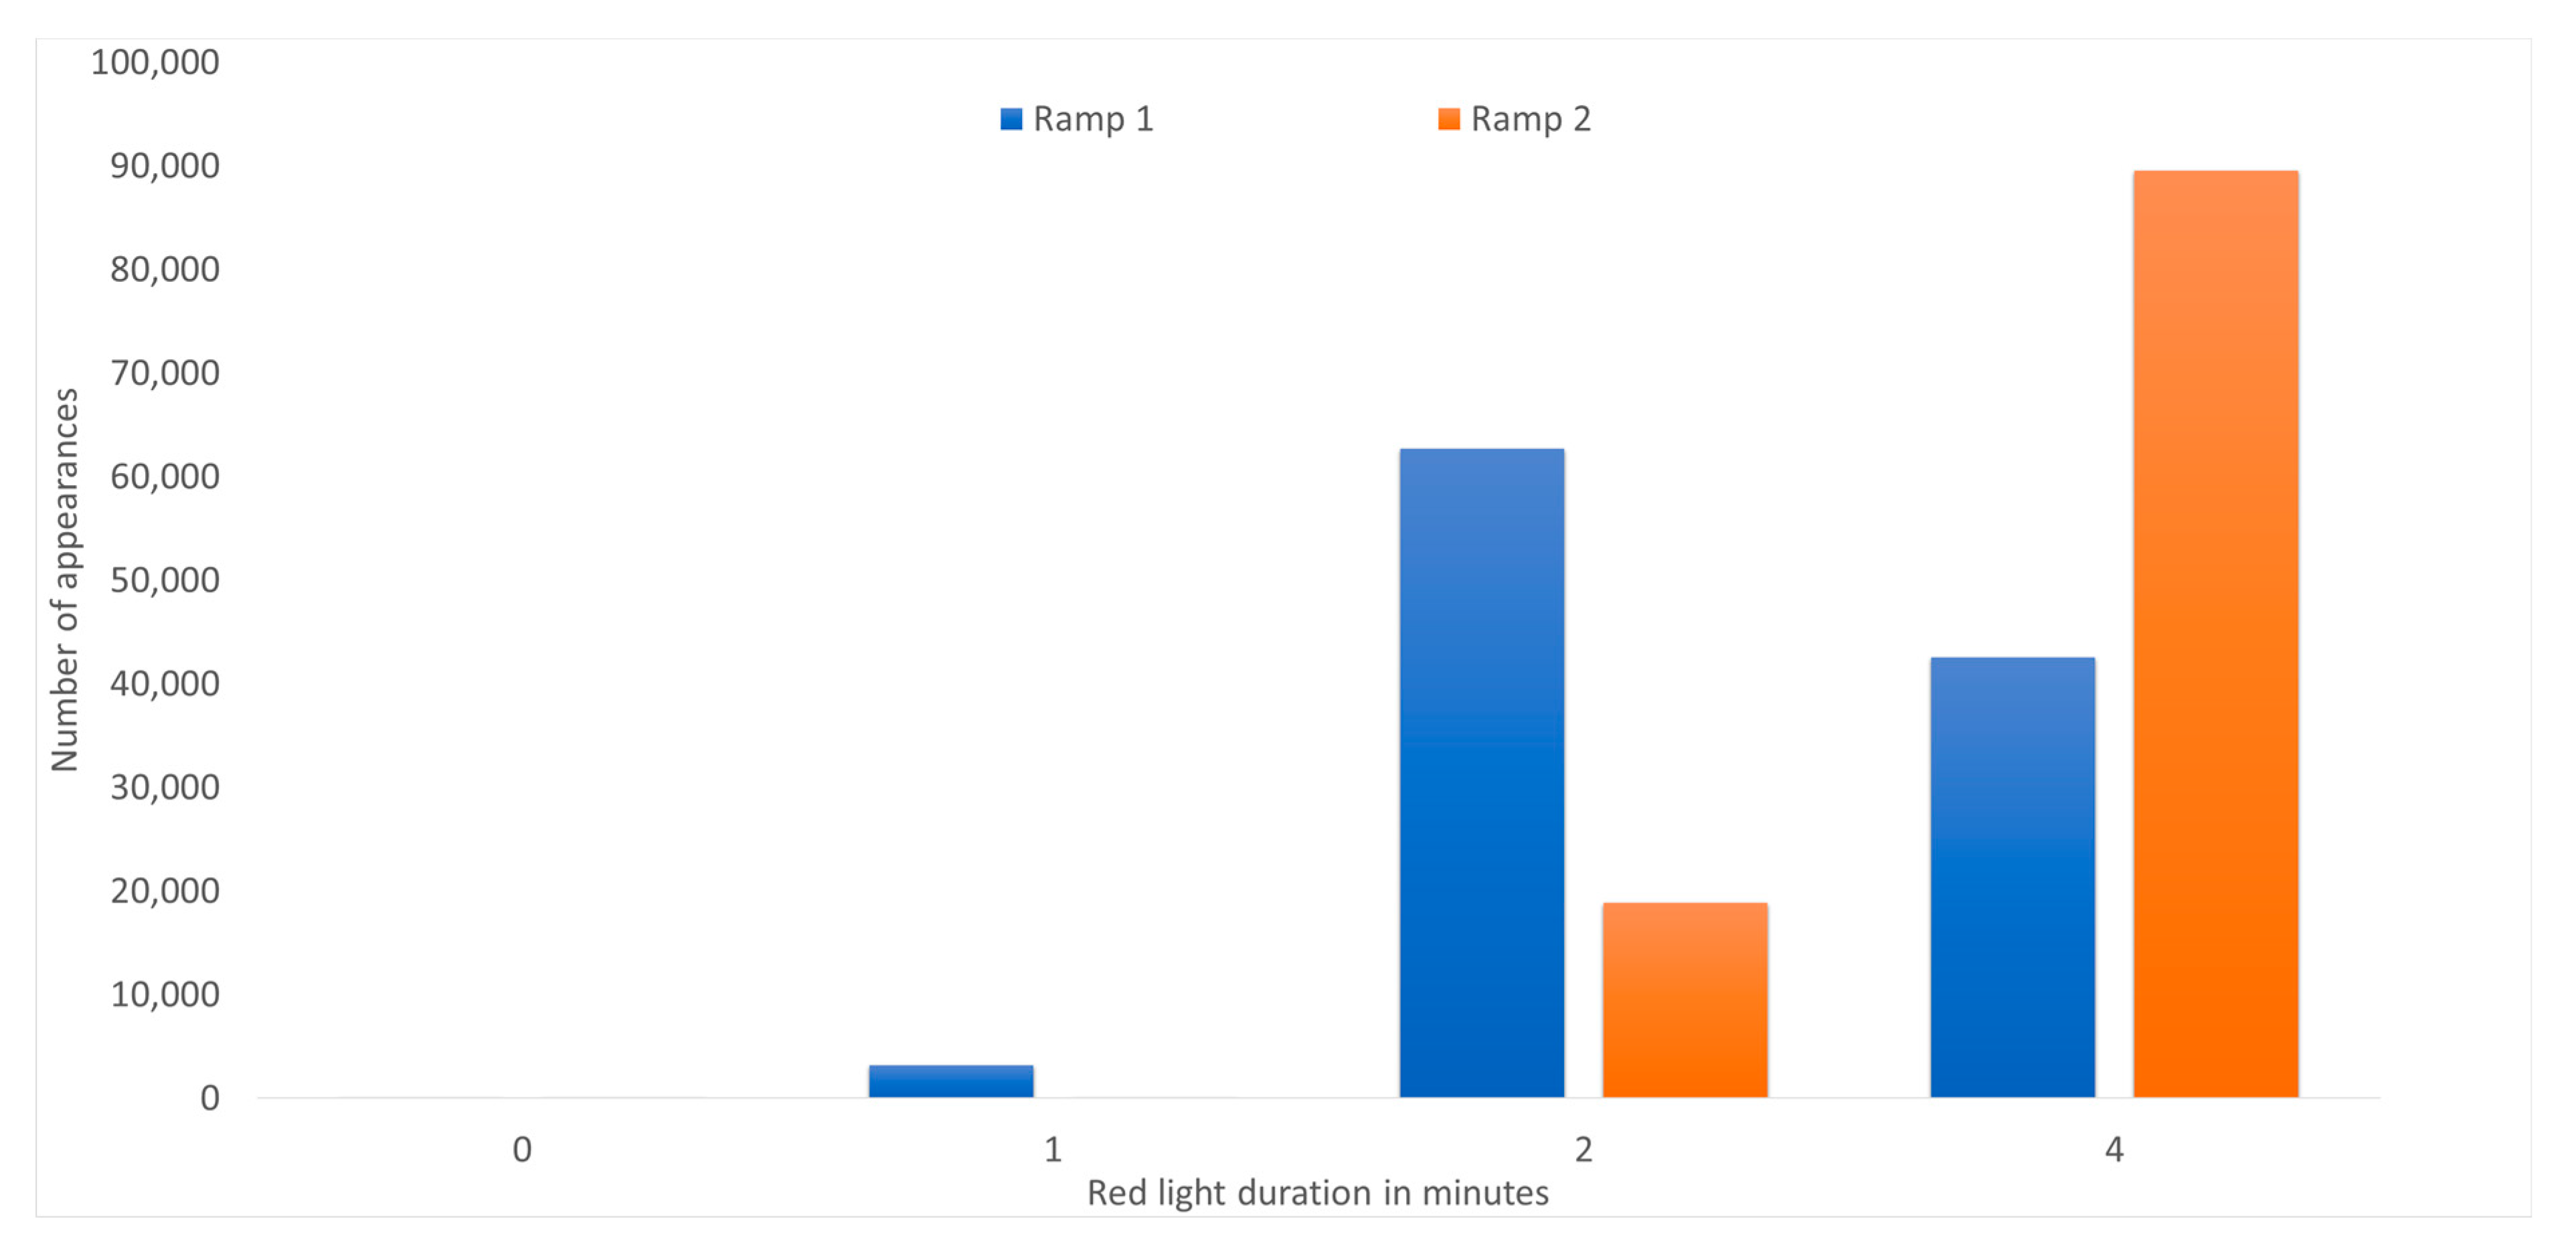
By observing the results above, it is obvious that the closer to the real-world the scenario lies the more demanding the algorithms are as they require more computational power and execution time. Therefore, the need to develop a machine learning algorithm using a neural network is pertinent. The neural network developed used as training and test data the data generated by the latest implementation scenario with three lanes and two ramps. The neural network was trained to produce very fast results and specifically result in the optimal the duration of the red light on each ramp. The results of the data mining scenario considering the duration in minutes for each ramp for the 108,016 discrete time instances are depicted in Figure 6.
4.2. Neural Networks Results
The neural network was trained using a subset of the data produced from the data mining scenario which was described in detail in Section 3.1. Thus, the neural network receives as input for its training a dataset composed of 60,712 records. The rest of the data (47,704 records) that were not involved in the training process of the neural network, consist the test set of the results. Following the execution of the training, the predictions about the duration of the red traffic light of ramp 1 and 2 were produced for discrete time points.
4.2.1. Ramp 1-Results
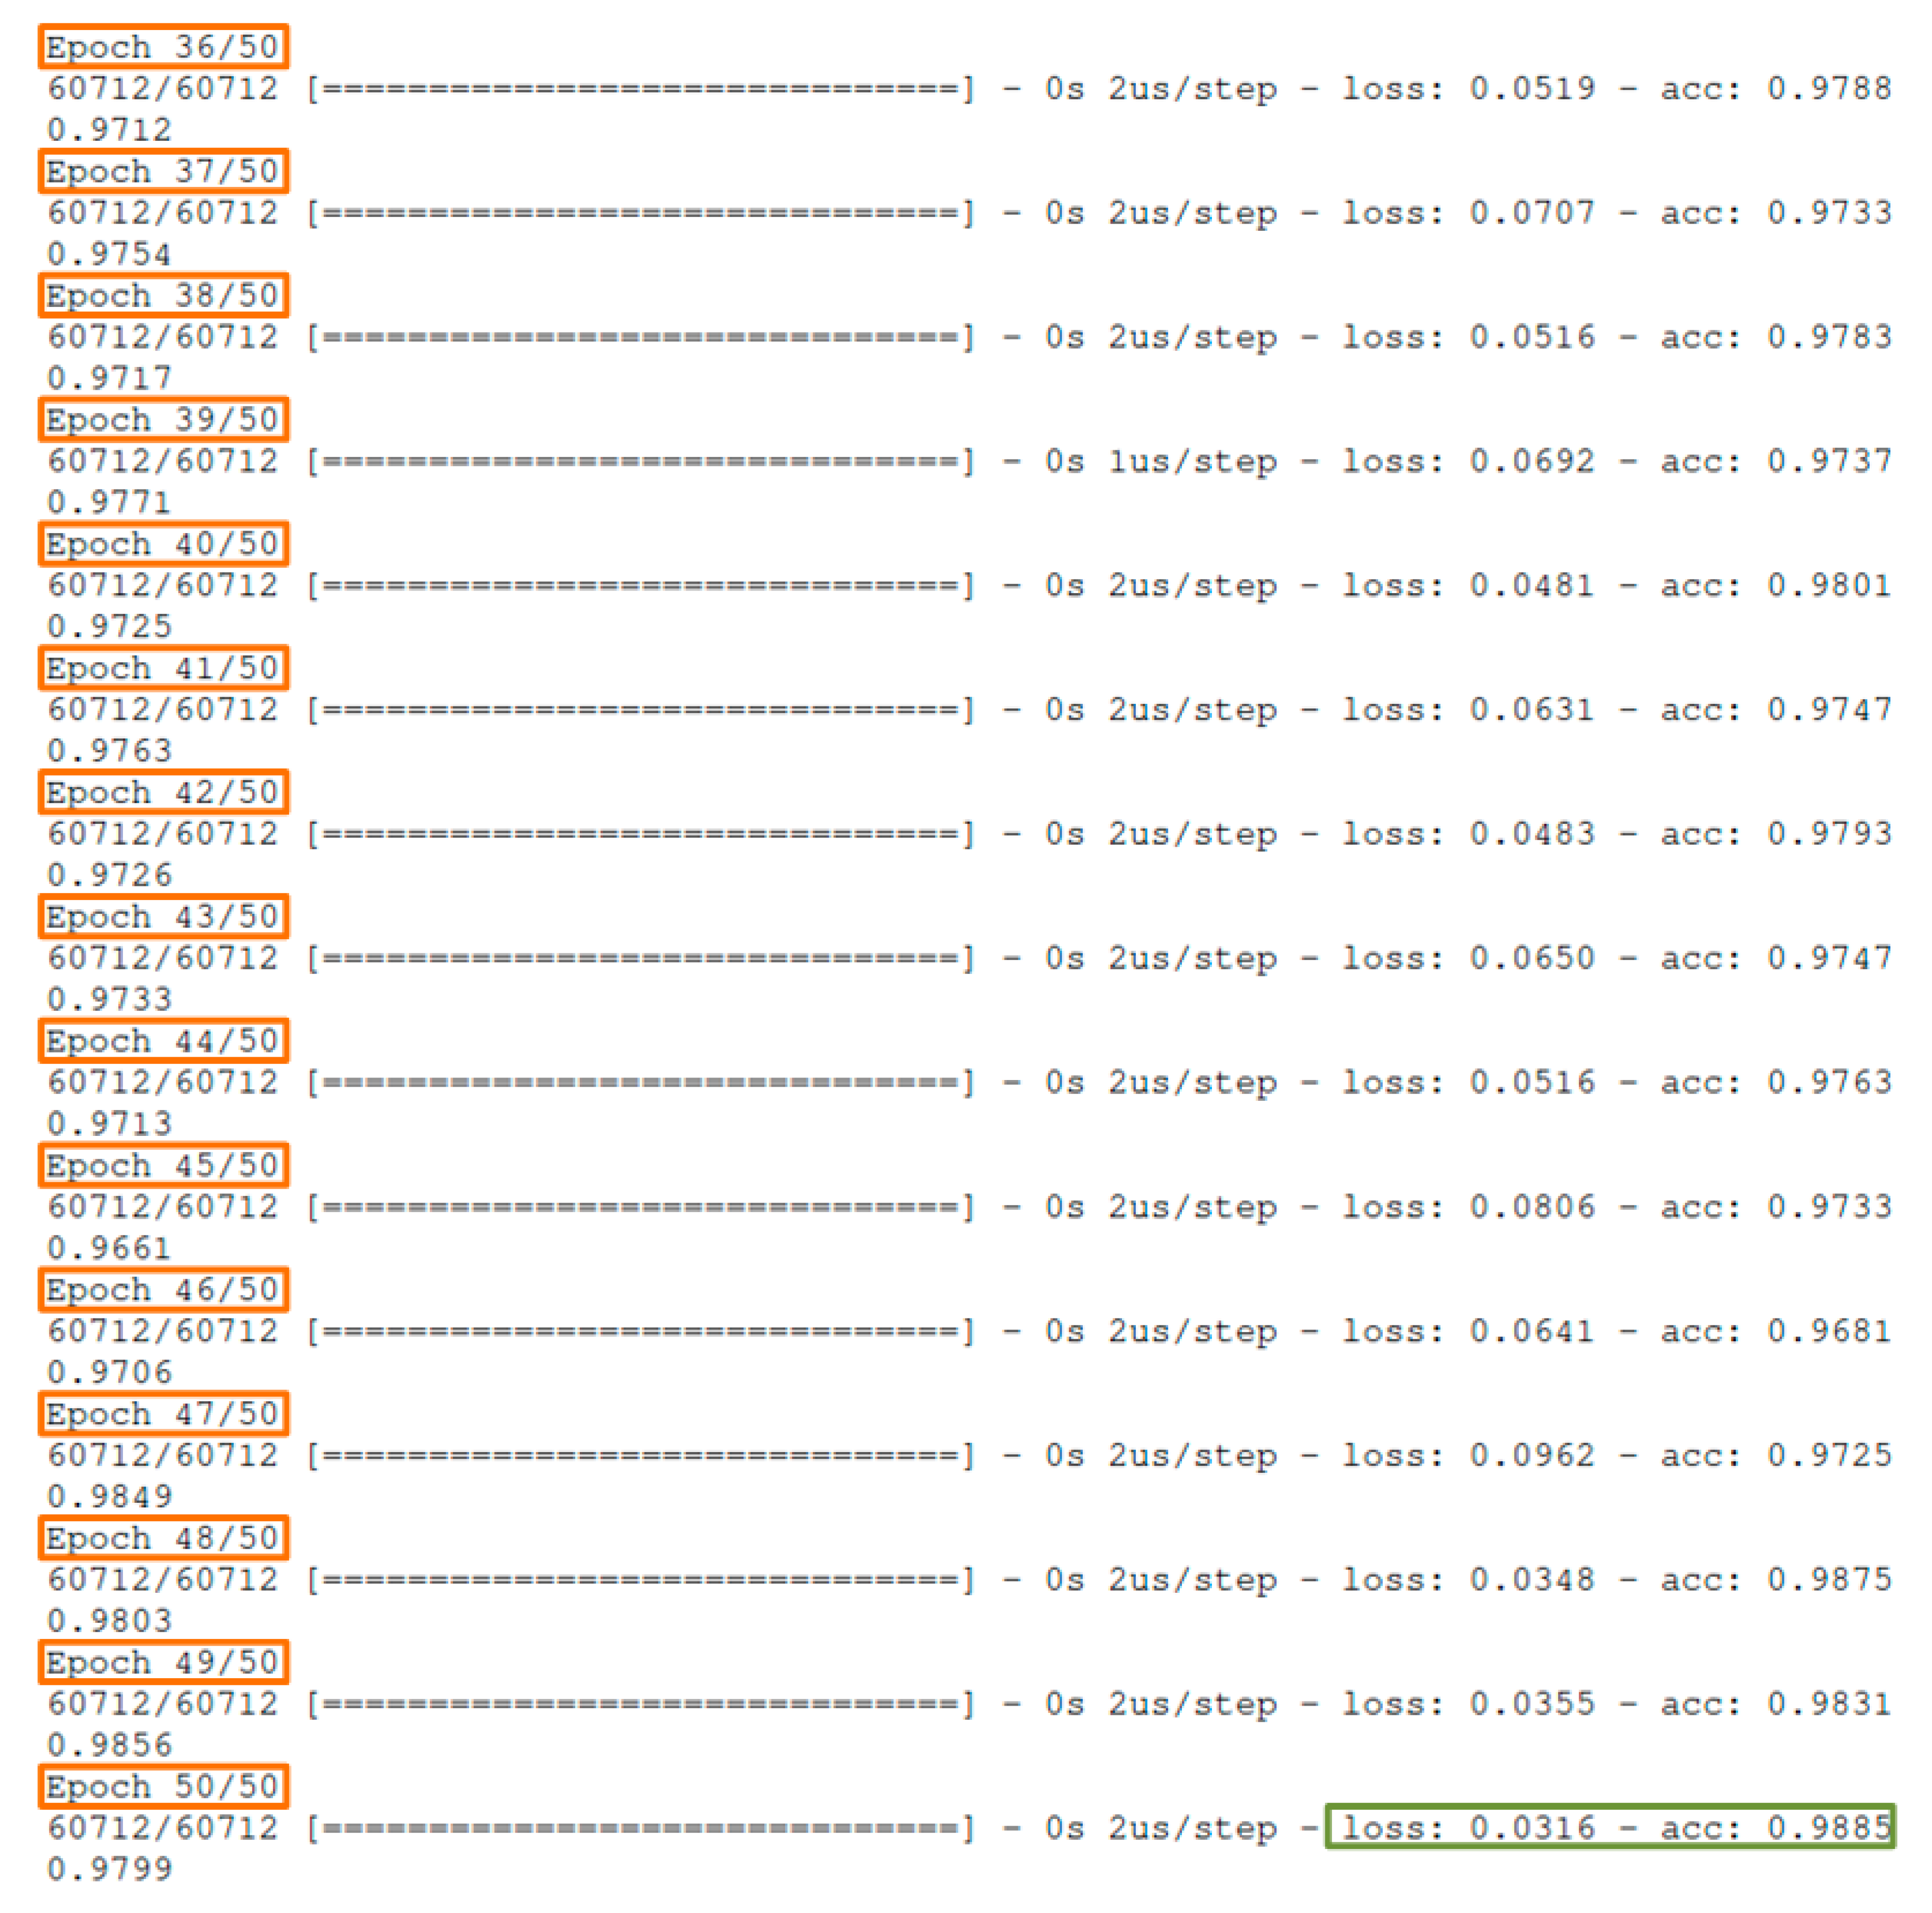
In order to ensure the reliability of the results for ramp 1, the neural network was (pre)configured to perform 50 reads (epochs) of training data as shown in Figure 7:
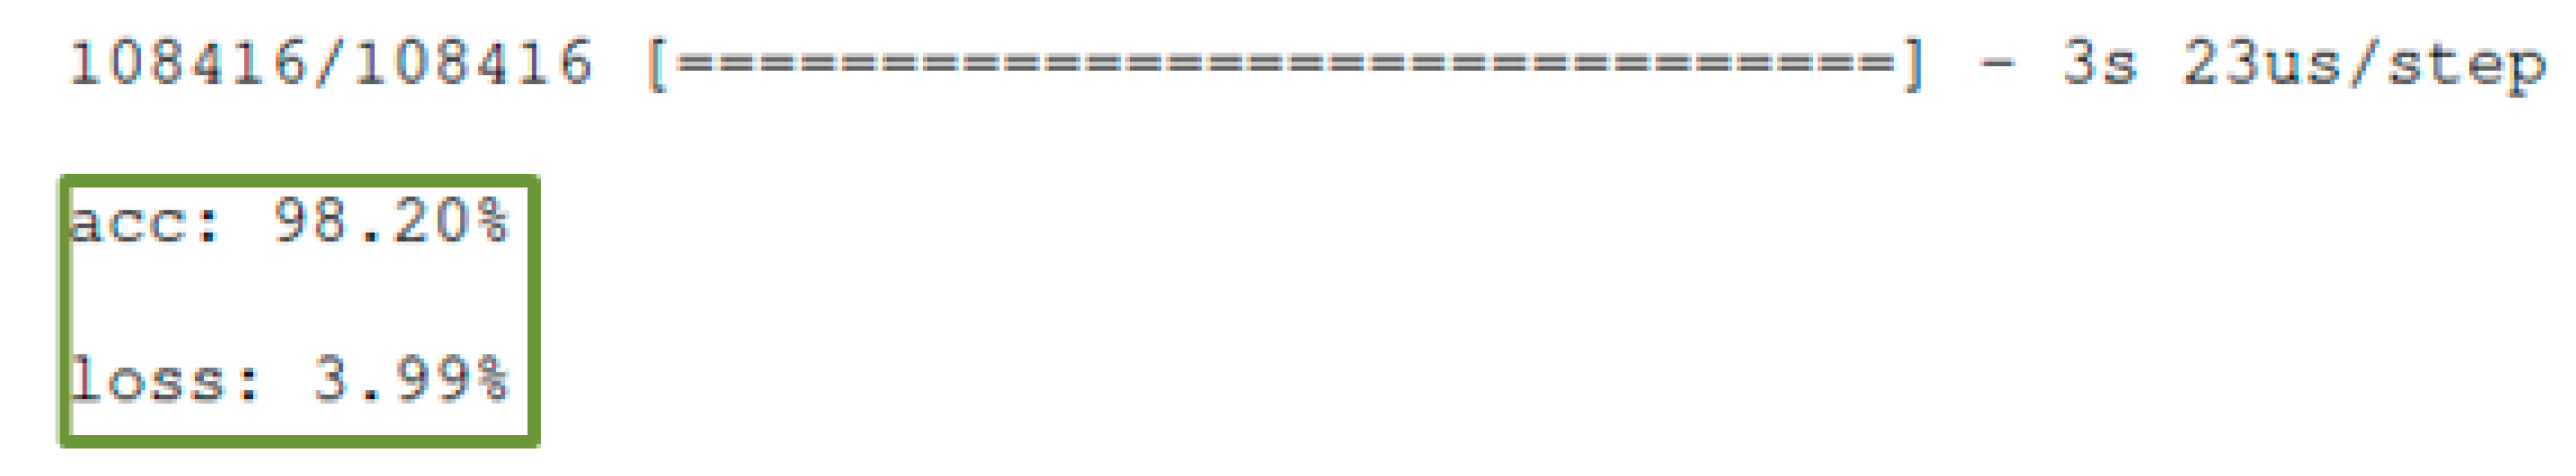
Figure 7 depicts the accuracy and loss for each subsequent training epoch which are generally improved. Some oscillations that may be observed between epochs are normal and anticipated, as the neural network is not a repeating method improving accuracy in each repetition. Additionally, the concept of epoch is not identical to that of repetition, so its behavior is slightly different. As a result, the accuracy of the neural network output is improved on the basis of the quality of the data and its training. So, in the above depiction, it is observed that after 50 epochs the neural network had an accuracy of 98.85% and data loss of 3.16% on training set. After the completion of the training phase and the production of the time predictions for ramp 1, the predictions reached were compared to the ones of the test and the results of Figure 8 were acquired:
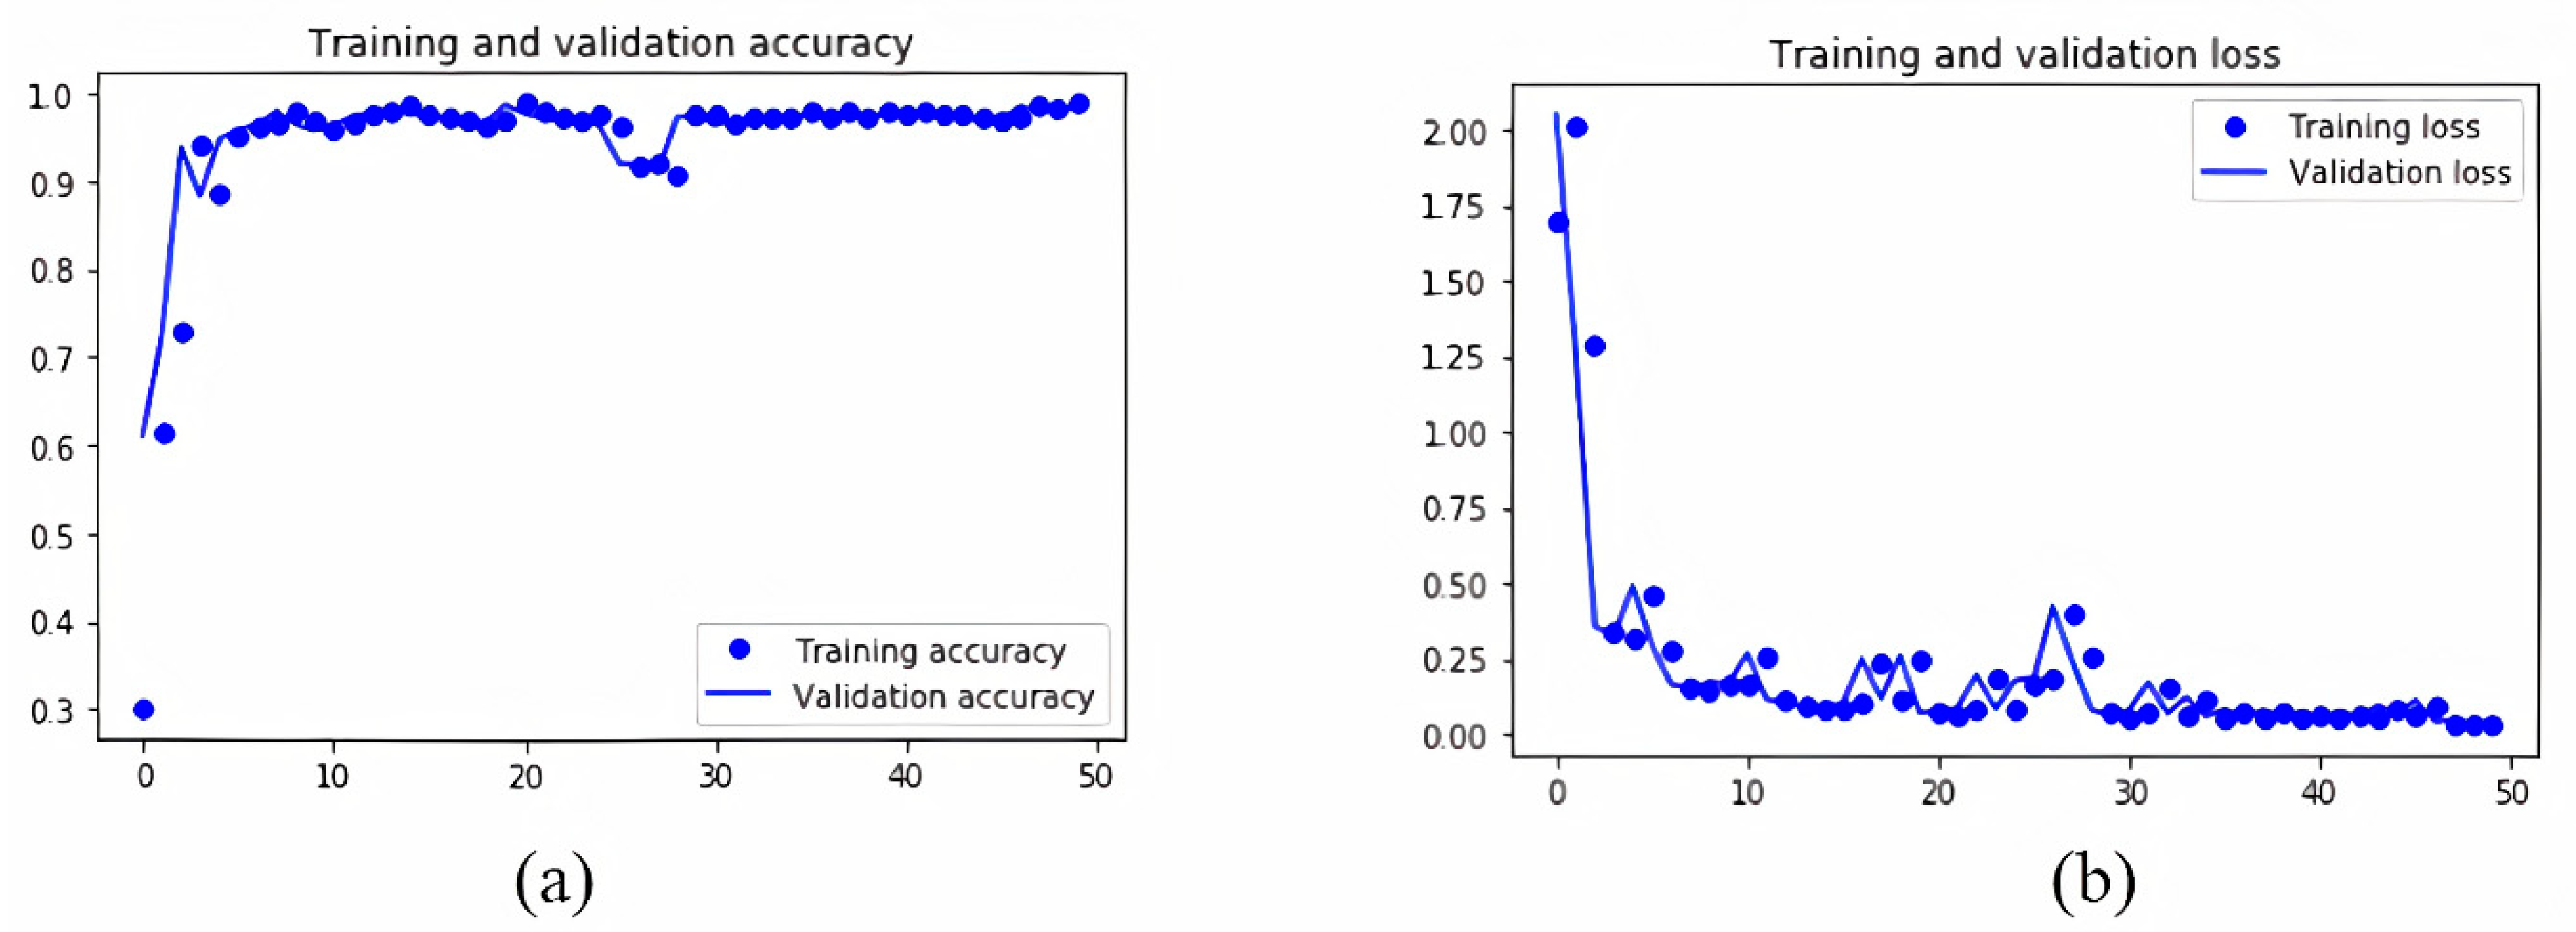
As shown in Figure 8, the results for ramp 1 are extremely promising as they have an accuracy of 98.20% and a loss of only 3.99%. In our model, it is deduced that the loss and the accuracy of the test set are synchronized with the accuracy of loss of the training set. Another extremely important result that suggests the validity (or not) of the provided neural network model is whether the results of the values suffer from the common issue of overfitting or underfitting. Overfitting gives an intuition on whether the network has memorized the education data to a satisfactory or very good level, but does not guarantees that it will work on blind data, which may lead into an important difference in the accuracy of the training and test dataset. Although the test and training accuracy lines are not completely linear, Figure 9a indicates that the model does not seem to be overfitted. The corresponding diagrams for ramp times 1 are presented in Figure 9:
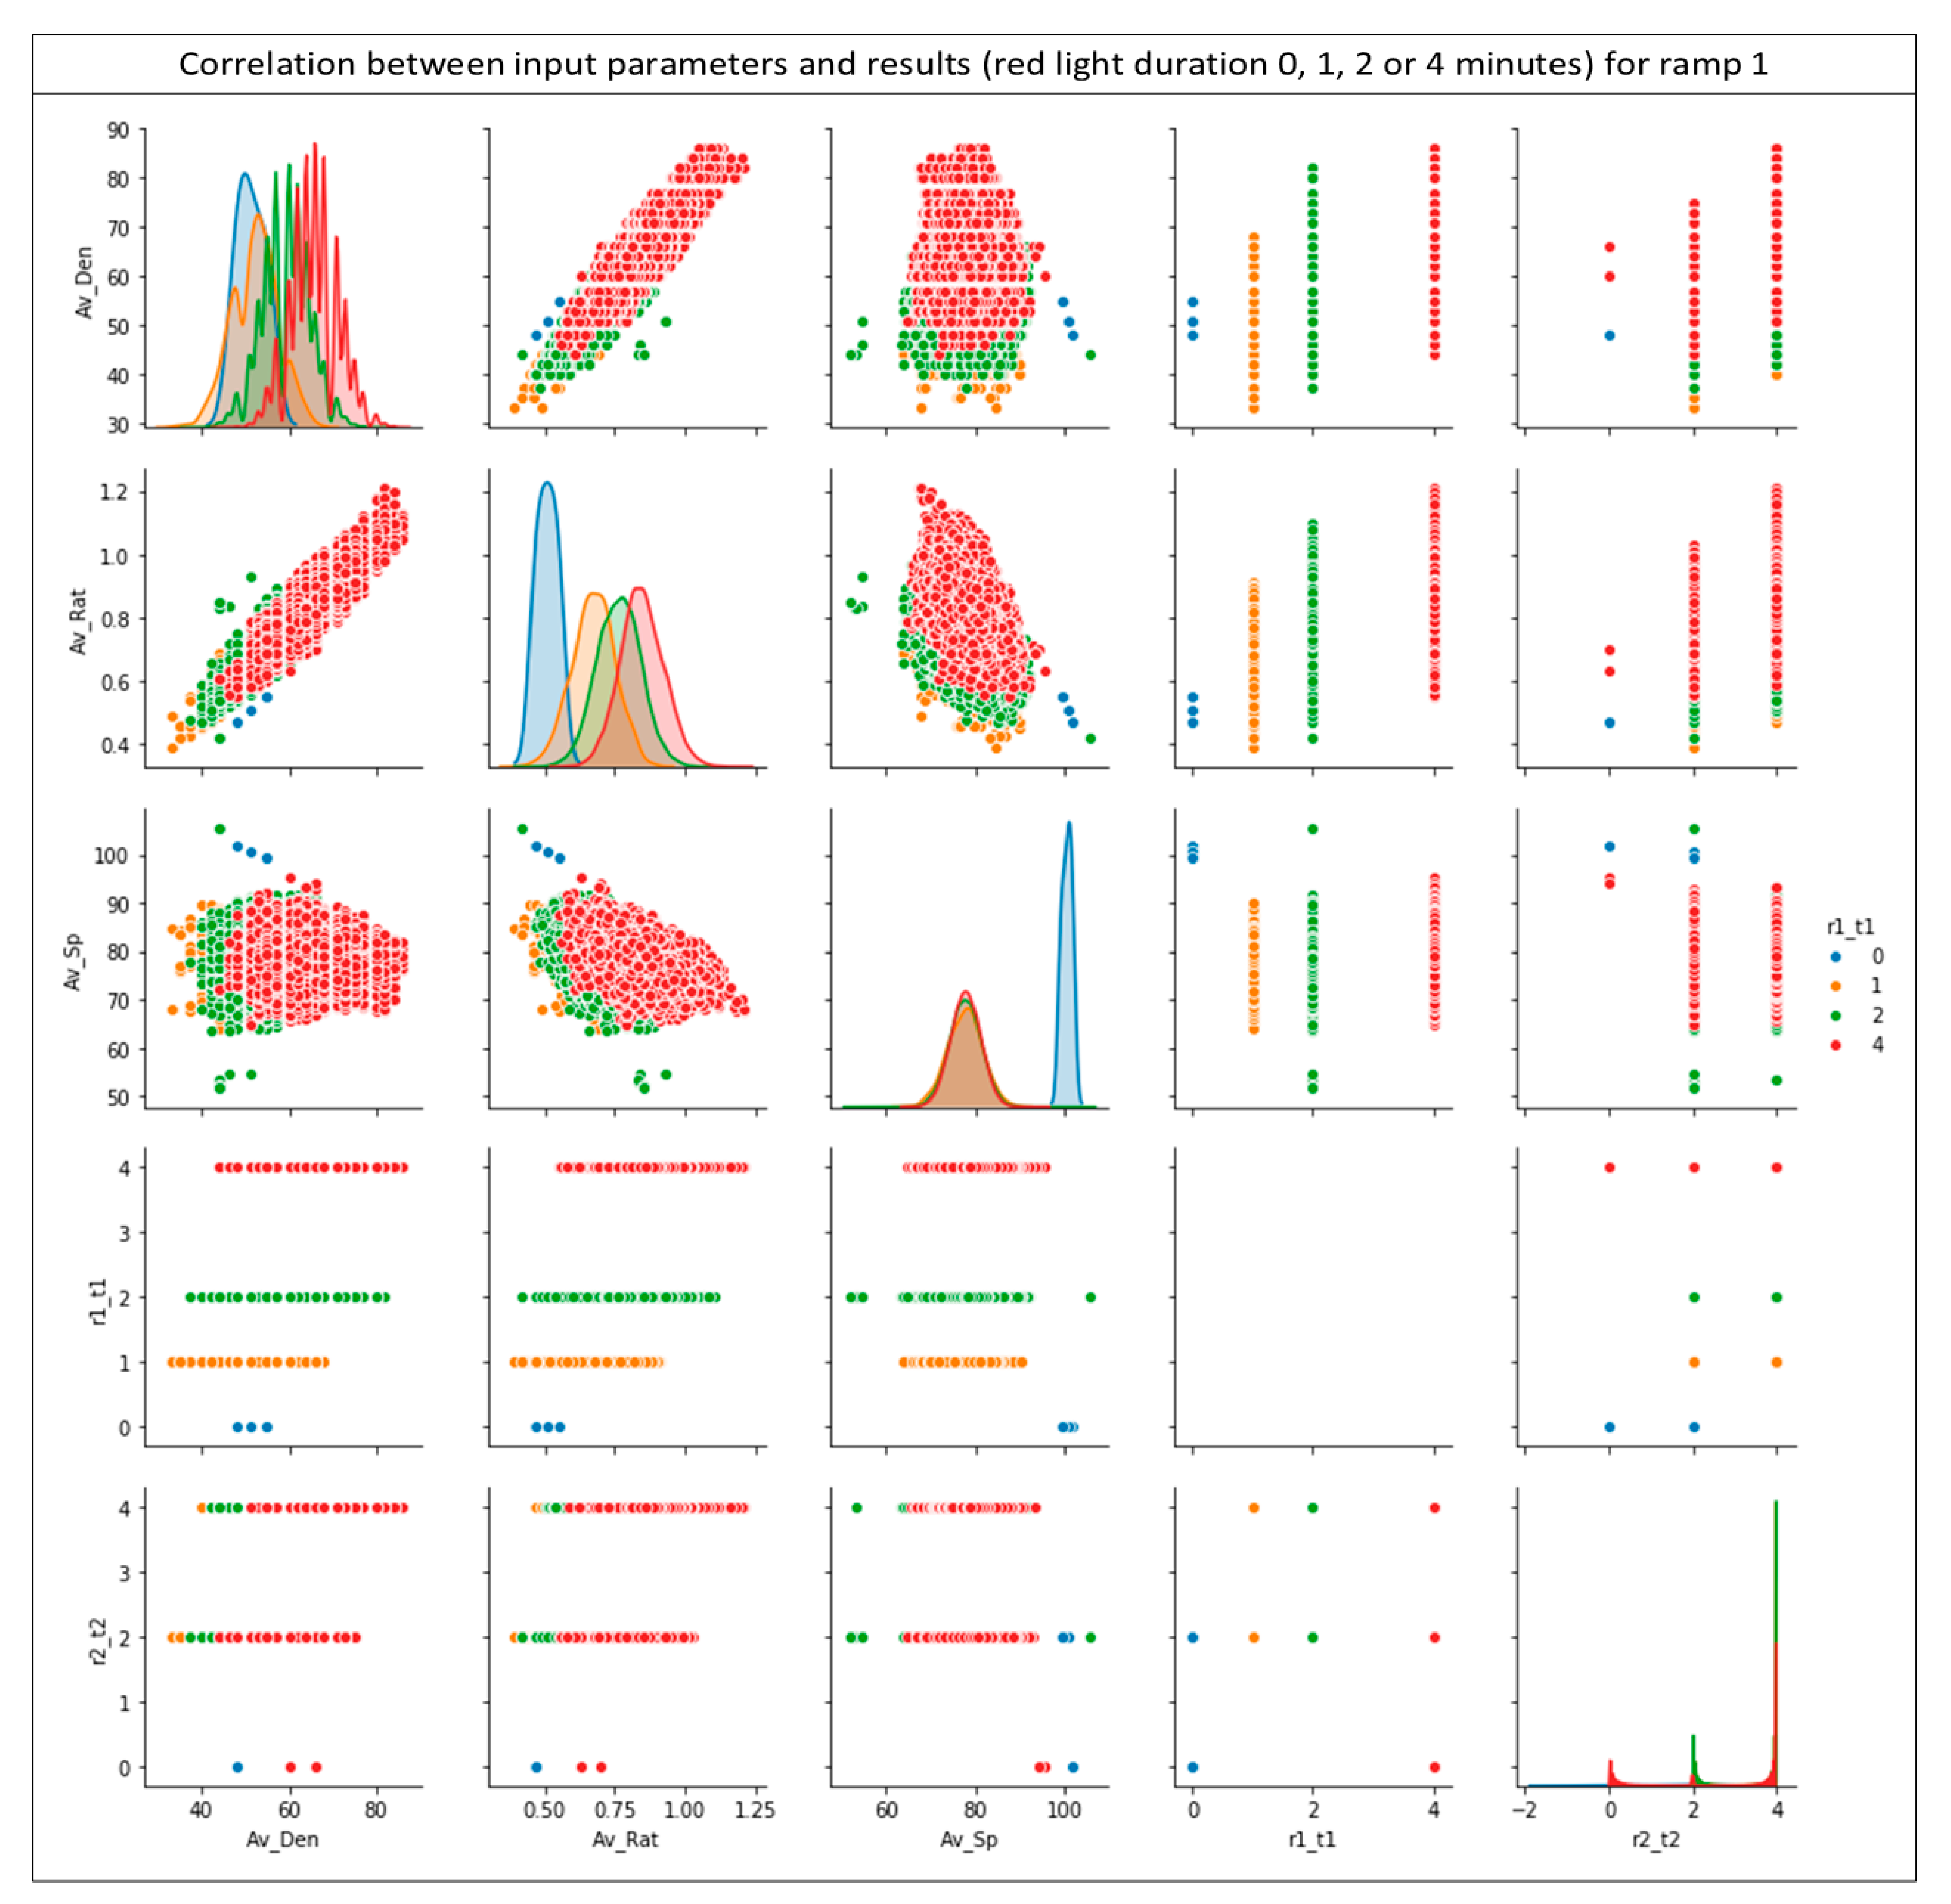
Similarly, Figure 9b shows the training and test loss for the 50 epochs executed for ramp 1. This observation is just as important as the previous one, due to the fact that it confirms the reliability of the predicted results. All of the above results support the reliability of the neural network results as well as the high-quality of the training data provided. Figure 10 presents a synthesis of pairplot charts, where the correlation of the input data for the developed neural network model with the acquired results is depicted. More specifically, in the presented pairplot (Figure 10), each input parameter is combined with all the other (provided) inputs and it is examined whether the combination of these groups correlates the outputs of the developed neural network. In other words, the provided pairplot allows us to check and depict both distribution of variables and the relationship between them, highlighting this method as a great approach for identifying trends for the specific algorithm. The x-axes namely are: the average density (Av_Den); average ratio (R) (Av-Rat); average speed (Av_Sp); red light duration for ramp 1 (r1_t1) and red light duration for ramp 2 (r2_t2), respectively. The y-axes namely are: the average density (Av_Den); average ratio (R) (Av-Rat); average speed (Av_Sp); red light duration for ramp 1 (r1_t1) and red light duration for ramp 2 (r2_t2). Every row shares the same y-axis and every column shares the same x-axis in Figure 10. The blue points are for 0 min red light duration for ramp 1, the yellow for 1 min, the green for 2 min and red points for 4 min respectively.
From the diagrams shown in Figure 10 it is immediately apparent that there is a distinct distribution of the extracted results. As shown by the color code, there are distinct groups of results depending on the data, with just a few exceptions. This separation is perfectly reasonable and desirable as it indicates that the network has been properly trained and able to produce quick and reliable results.
4.2.2. Ramp 2-Results
Same as ramp 1 results, and in order to ensure the reliability of the results for ramp 2, the neural network model performed 50 epochs during the training process as shown in Figure 11:
As a result of the previous training process, the accuracy and loss are improved. Regarding ramp 2 results, compared to the ones of ramp 1, a stability after the execution of the initial epochs is observed. So, it is noted that after 50 epochs the neural network has an accuracy of 99.98% and data loss of 0.39%. The results for ramp 2 are even more impressive and apparently there is no need for further epochs or further deepening of the network.
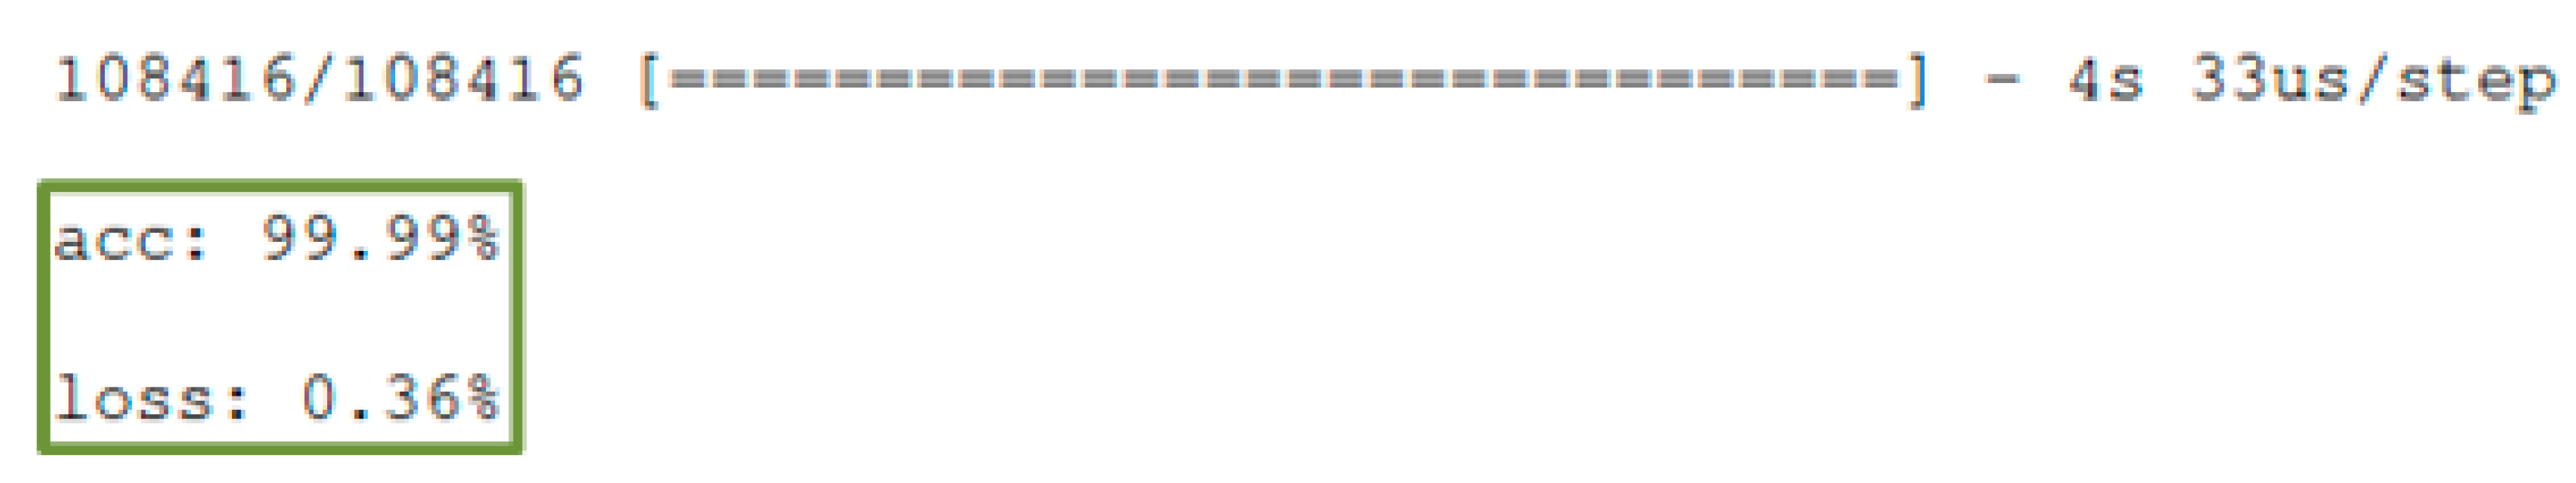
After the completion of the training phase and the production of time predictions for ramp 2, the predictions reached were compared to the ones of the test and the results of Figure 12 were acquired:
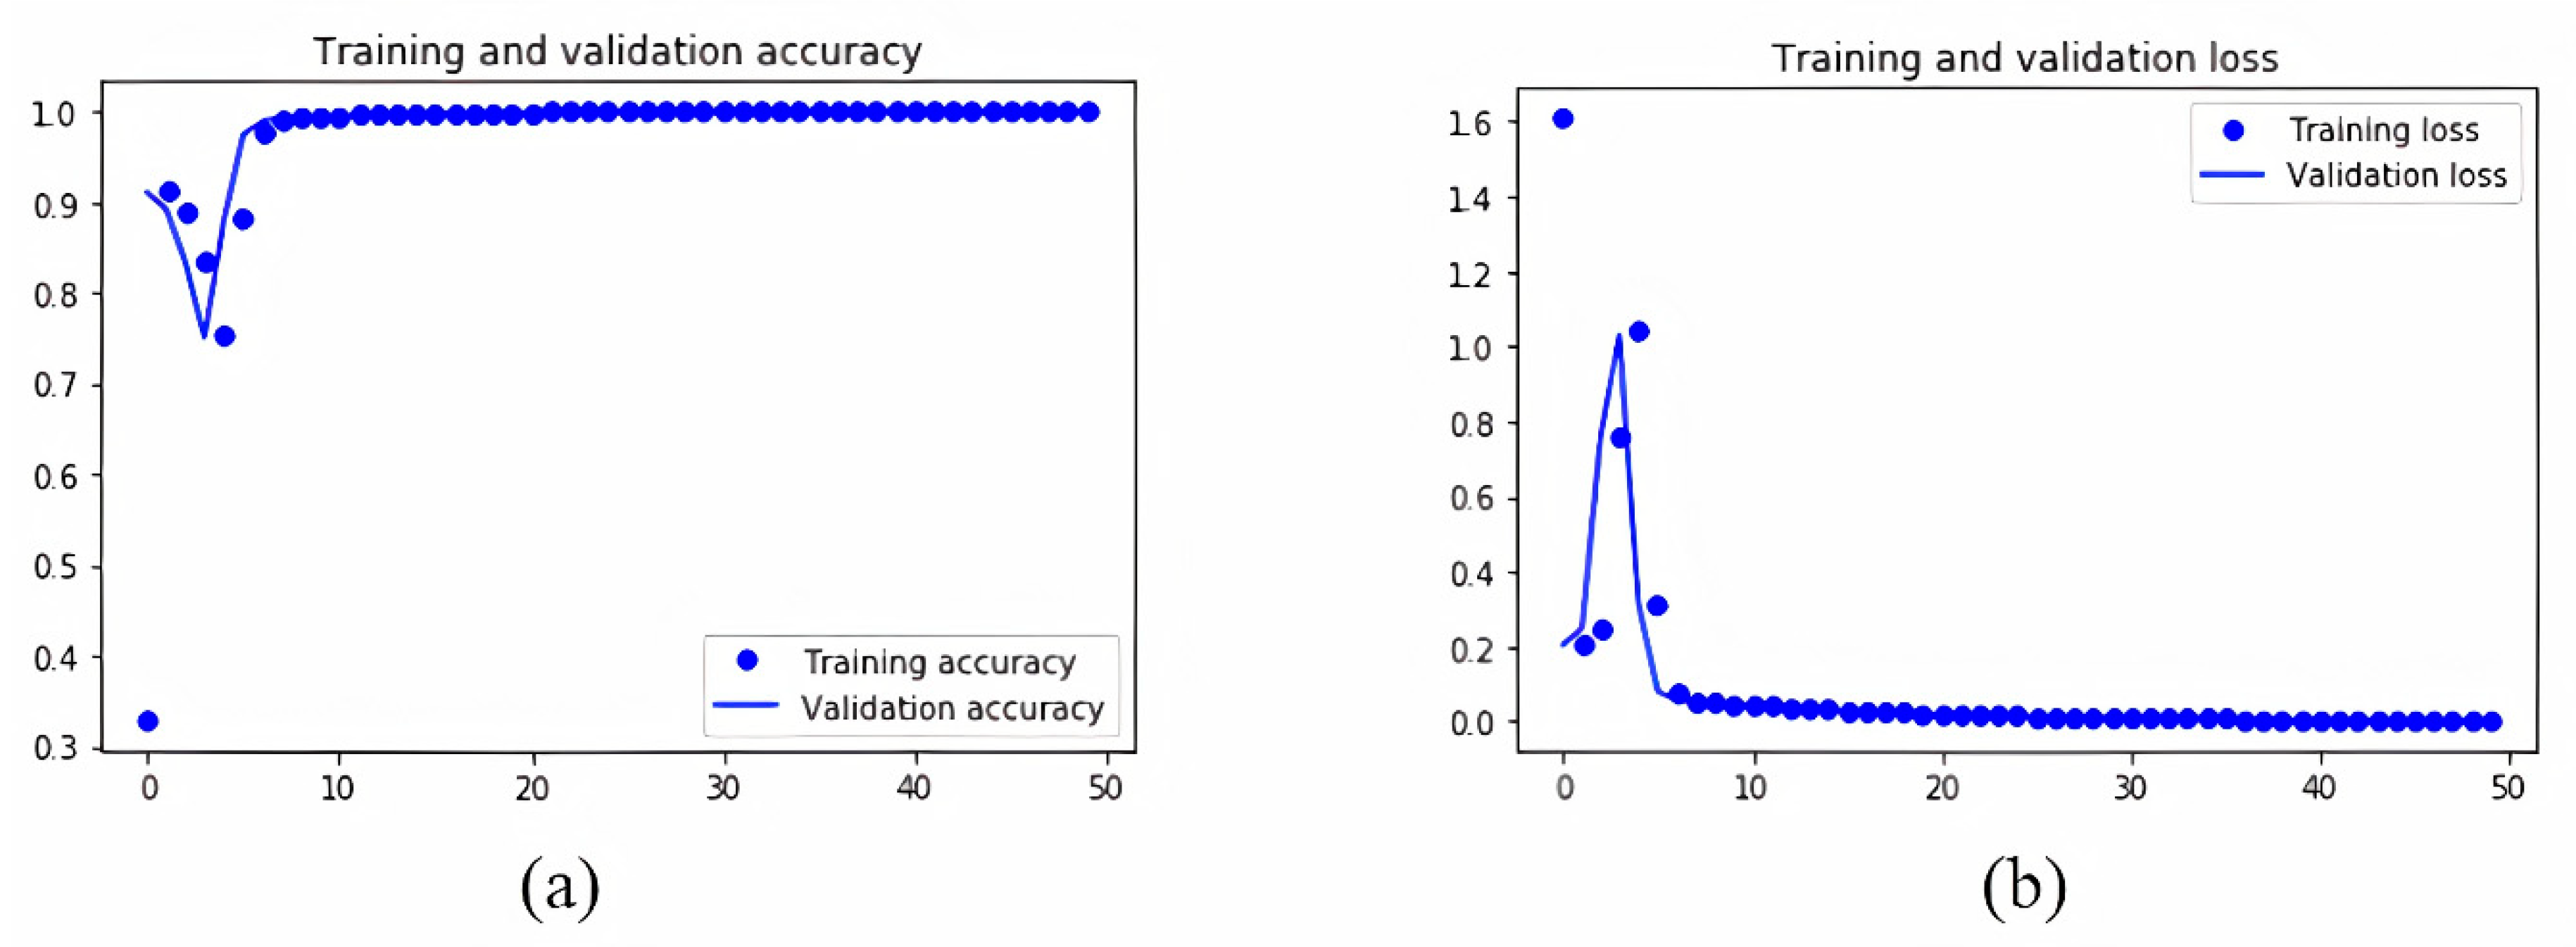
Accuracy and loss of the test set for ramp 2 are particularly positive as well as they have an accuracy of 99.99% and a loss of just 0.36%. Similarly to ramp 1, the diagrams for the training and test sets considering the accuracy and loss for ramp 2 are presented in Figure 13:
Like ramp 1, the accuracy and the loss show no deviation beyond some values after a certain number of epochs. The two diagrams in Figure 13 show even better results in relation to ramp 1, suggesting that the predictions for ramp 2 are even more accurate. As previously presented for ramp 1 the diagrams in Figure 14 relate each input parameter to all other inputs existing in the provided dataset for the results of the ramp 2 (r2_t2). Similar to Figure 10, Figure 14 x-axes namely are: the average density (Av_Den); average ratio (R) (Av-Rat); average speed (Av_Sp); red light duration for ramp 1 (r1_t1) and red light duration for ramp 2 (r2_t2). The y-axes namely are the average density (Av_Den); average ratio (R) (Av-Rat); average speed (Av_Sp); red light duration for ramp 1 (r1_t1) and red light duration for ramp 2 (r2_t2). Every row shares the same y-axis and every column shares the same x-axis in Figure 10. The blue points are for 0 min red light duration for ramp 2, the yellow for 2 the green for 4 min respectively.
As in the previous case of ramp 1, Figure 14 reveals the existence of distinct groups of results according to the input data, with just a few exceptions. This segregation is perfectly reasonable and desirable as it indicates that the network has been trained and is able to produce fast and reliable results without any major failures.
4.2.3. Overall Results
In the previous subsections the results acquired by the neural network for each ramp separately were presented. Based on these, it is obvious that the developed neural network model is quite reliable in terms of prediction performance as the accuracy in both cases was more than 98% and the loss of data below 4% as shown in Table 5.
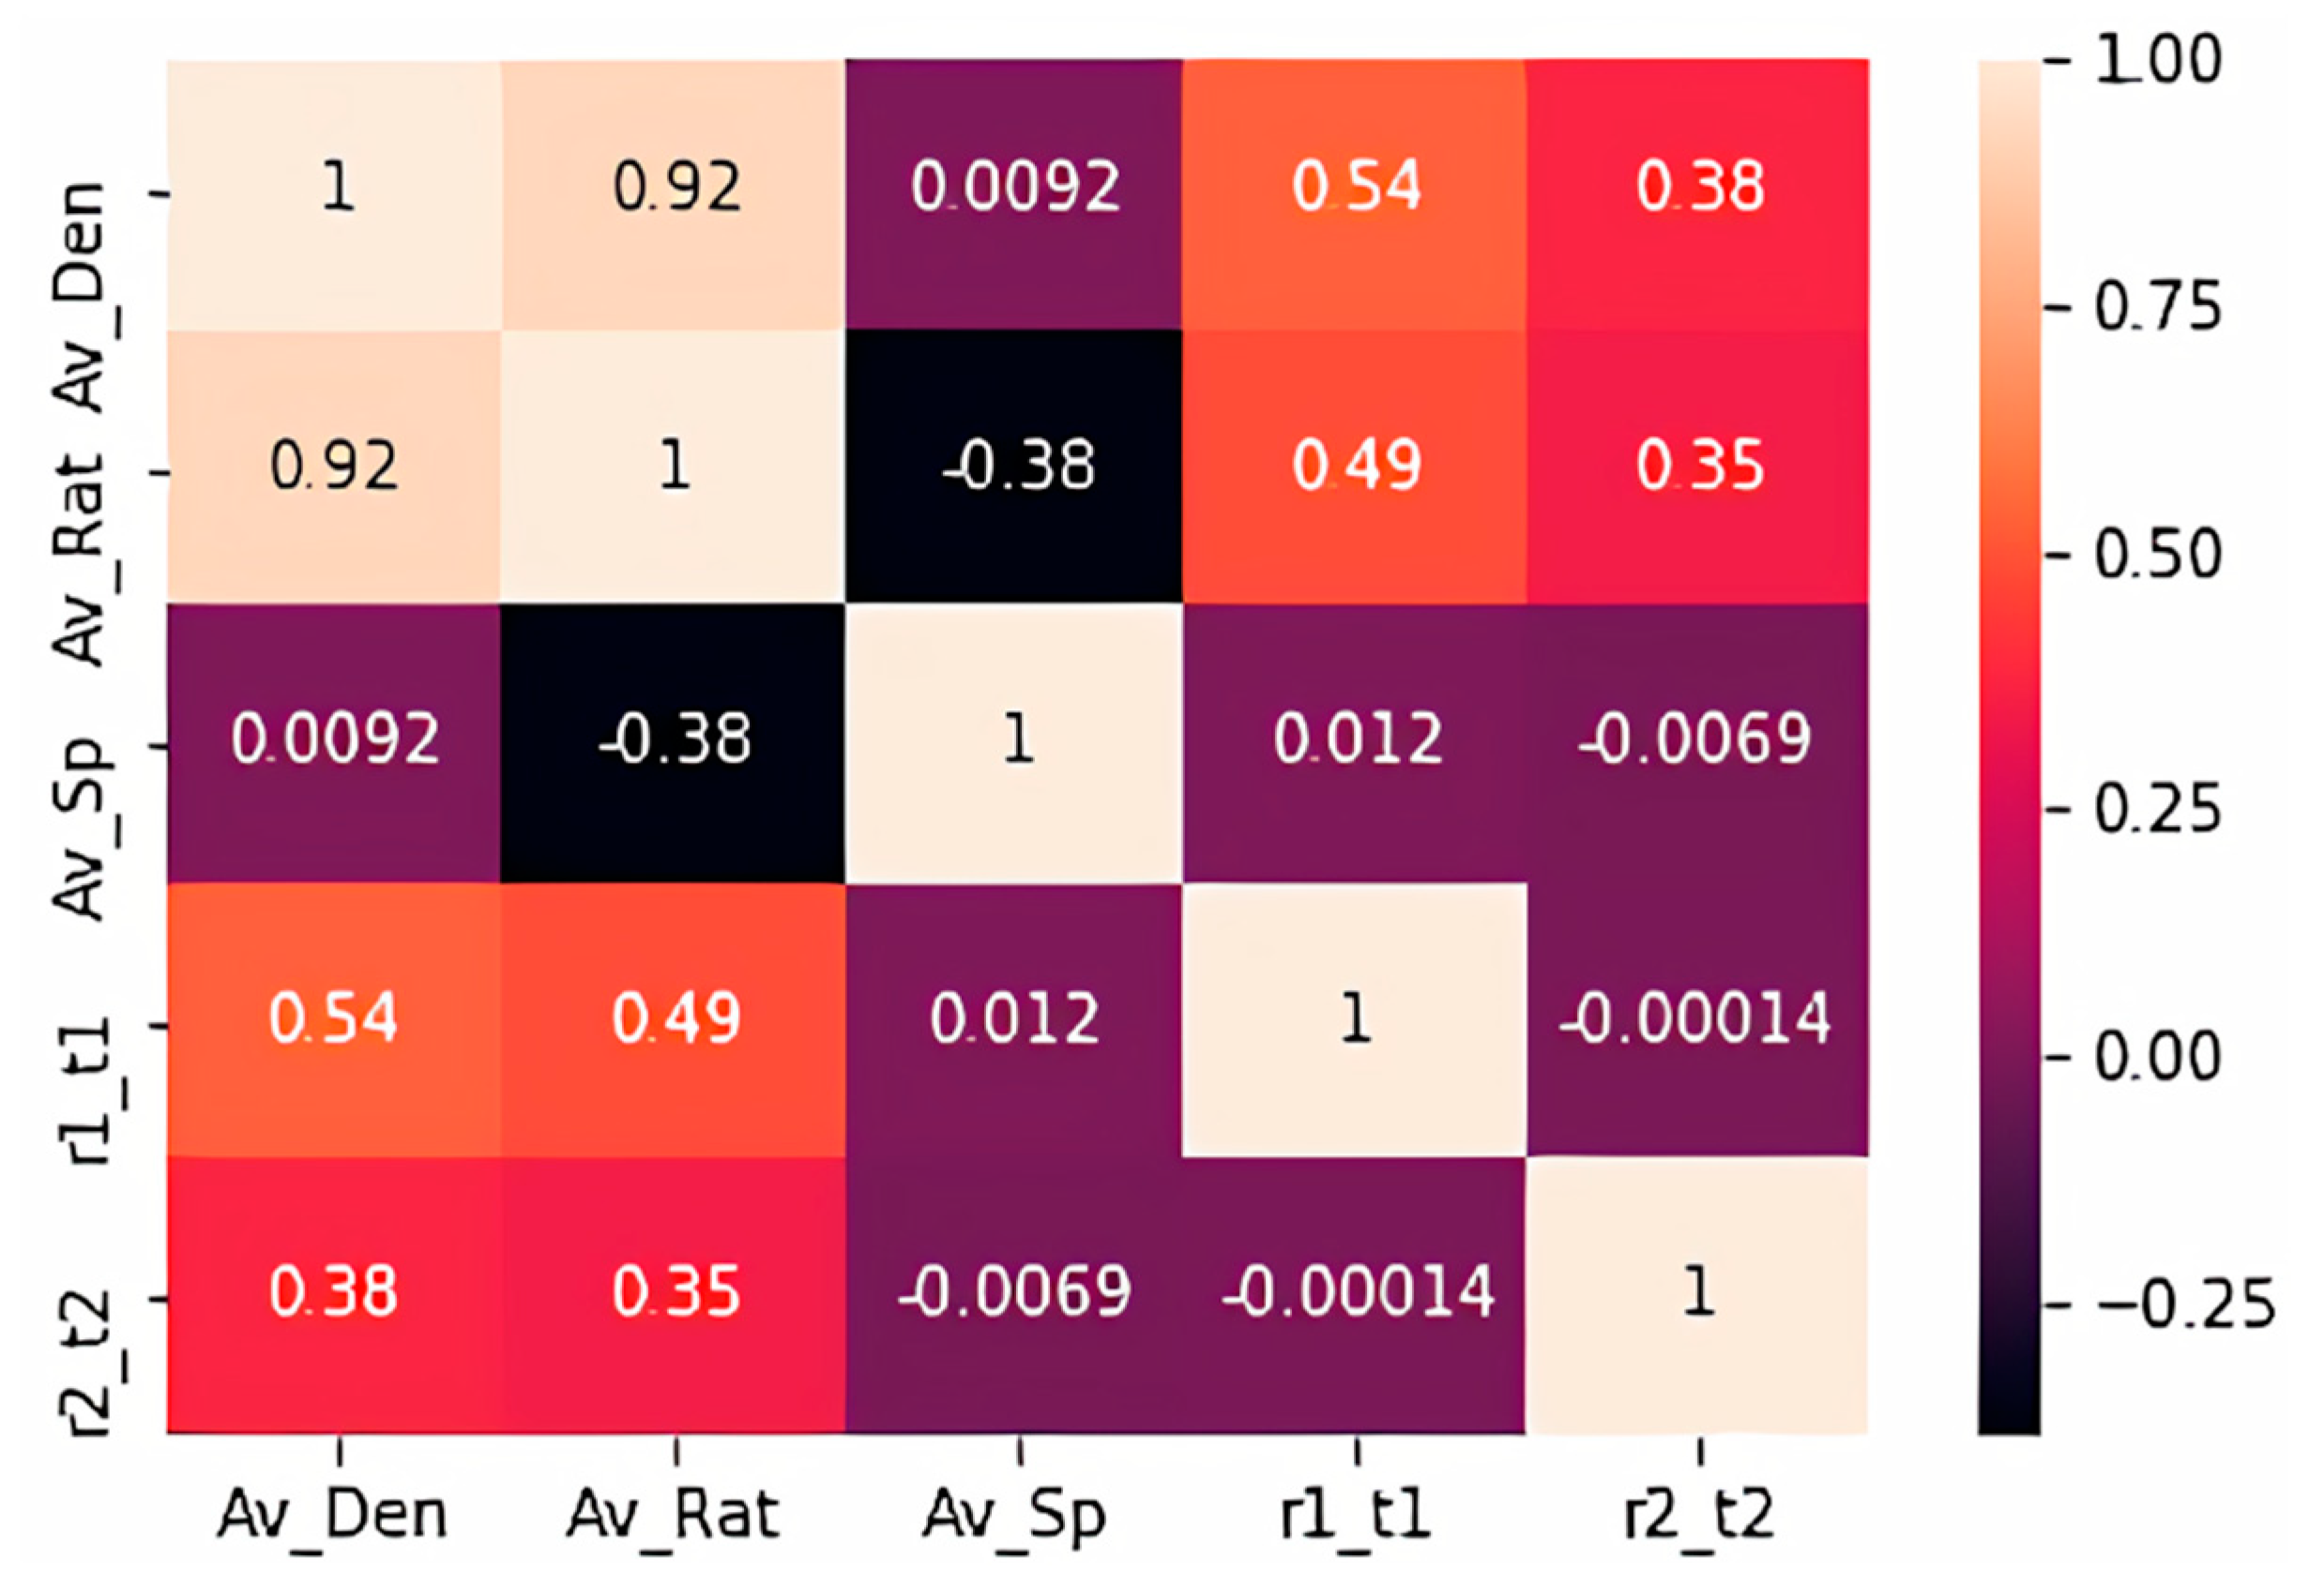
In addition, after the initial training execution process, the results were produced rapidly within a few seconds. This renders feasible the application of the model in complex systems, such as the one studied in this work. In Figure 15, a confusion matrix is depicted which demonstrates possible correlations between the various parameters configuring the neural network:
The confusion matrix of Figure 15 shows that the density features a significant correlation with the R ratio. This result indicates that the R ratio follows density. Similarly, we notice that the R ratio features a negative correlation with the average speed which is perfectly normal as these two sizes are inversely proportional. In addition, as expected, the times for ramp 1 and 2 are significantly correlated with density as this is the critical measure which determines them. The degree of correlation between different metrics shown in Figure 15 above is expressed by the color code and the value of each cell. The closest to 1 a cell is, the stronger the relationship of these two metrics.
Based on the above promising results, it seems that the use of machine learning algorithms for problems such as the traffic management is imperative because of the variety and diversity of parameters as well as data values and volumes. In addition, on a road network, the data change rapidly so the response from the control traffic systems must be immediate. Thus, in this direction only state-of-the-art machine learning algorithms could provide immediately results and adjust the behavior of the system dynamically. The proposed method in this study addresses the rapid changes on the traffic conditions by engaging a trained neural network which can produce in real time the appropriate duration for red light both for ramp 1 and ramp 2. The critical and most computational demanding phase of the proposed method is that of the neural network training. Thus, as long as the training data are of high quality and unbiased then the outputs of the neural network developed achieve the desired result which is the right entrance rate in the highway so to avoid traffic congestion. This indicates that while the training is done correctly the proposed method can produce accurate outputs even when there are rapid changes and fluctuations in traffic conditions. Also, due to the neural network model’s adjusting nature the proposed method can be applied even in more complex systems, given that the training will be performed using data originating from entire road networks, for example.
It is worth mentioning that the ramp metering strategy developed and presented in this study used custom-made data produced by the simulation of highway model in Section 3. Given that, it would be unfair to make a direct comparison with other methods presented in Section 2. The study of those methods gave the inspiration and the starting point of how the ramp metering problem can be solved and triggered the concept and approach of this study.
5. Conclusions and Future Work
Through this work, an extensive study and development of a machine-learning-based ramp metering algorithm was performed. The literature review as well as the modelling process presented in Section 3 indicate that ramp metering has evolved from a simple automatic control system to a complex system which due to the rapid changes and fluctuations of the measured values as well as the vast volume of data requires state-of-the-art machine learning tools such as neural networks. The neural network algorithm presented in this study was developed using state-of-the-art methods and open-source tools such as the Python language and the Keras library. Given the promising results presented in Section 4, this method could indeed provide a valuable contribution for further research activities as it can underpin several extensions. More specifically, some of the additions/extensions proposed as subject of future research are the following:
- Increase of the number of entrance ramps.
- Application to an entire road network so to utilize even more data and manage more efficiently the traffic flow.
- Engage more complex control conditions for the ramp entrance control.
- Increase the number of hidden layers of the neural network so to increase the accuracy of the results.
The goal of the present paper was to demonstrate a state-of-the-art machine learning approach of a controlled access ramp metering problem. This method can be integrated into future solutions which aim to provide innovative intelligent next-generation tools in the ITS domain. This study’s principal goal was to address the traffic congestion problem so to improve road traffic conditions as well as road and driver safety. Fast developing technologies, utilized in this study, involving machine learning, could lead to the establishment of the smart transportation paradigm. Thus, scientific research should be steered towards a more practical approach for creating more pilot applications and platforms in the next years as well as for expanding the boundaries of current and next generation technologies such as machine learning, big data blockchain, smart contracts and more.
Author Contributions
Conceptualization, E.A. and K.D.; methodology, T.A.; software, N.P.; validation, T.A., E.A. and K.D.; formal analysis, T.A.; investigation, T.A.; resources, N.P.; data curation, N.P.; writing—original draft preparation, T.A., N.P., E.A. and K.D. writing—review and editing, E.A.; visualization, T.A. and N.P.; supervision, K.D. All authors have read and agreed to the published version of the manuscript.
Funding
This research has been co-financed by the European Regional Development Fund of the European Union and Greek national funds through the Operational Program Competitiveness, Entrepreneurship and Innovation, under the call RESEARCH-CREATE-INNOVATE (project code: T1EDK-04610—MANTIS). This paper reflects only the authors’ views, and the Operational Programme is not liable for any use that may be made of the information contained therein.
Institutional Review Board Statement
Not applicable.
Informed Consent Statement
Not applicable.
Data Availability Statement
The data presented in this study are available on request from the corresponding author. The data are not publicly available due to the policy of the MANTIS project.
Conflicts of Interest
The authors declare no conflict of interest.
References
- United Nations. Revision of World Urbanization Prospects; United Nations: New York, NY, USA, 2018. [Google Scholar]
- Baskar, L.; Schutter, B.D.; Hellendoorn, J.; Papp, Z. Traffic control and intelligent vehicle highway systems: A survey. IET Intell. Transp. Syst. 2011, 5, 38–52. [Google Scholar] [CrossRef] [Green Version]
- Yan, J.; Bitmead, R.R. Incorporating state estimation into model predictive control and its application to network traffic control. Automatica 2005, 41, 595–604. [Google Scholar] [CrossRef]
- Bielli, M.; Ambrosino, G.; Boero, M.; Mastretta, M. Artificial intelligence techniques for urban traffic control. Transp. Res. Part A Gen. 1991, 25, 319–325. [Google Scholar] [CrossRef]
- Papageorgiou, M.; Hadj-Salem, H.; Middelham, F. ALINEA Local Ramp Metering: Summary of Field Results. Transp. Res. Rec. 1997, 1603, 90–98. [Google Scholar] [CrossRef]
- Papageorgiou, M.; Kotsialos, A. Freeway ramp metering: An overview. IEEE Trans. Intell. Transp. Syst. 2002, 3, 271–281. [Google Scholar] [CrossRef]
- Smaragdis, E.; Papageorgiou, M. Series of New Local Ramp Metering Strategies. Transp. Res. Rec. 2003, 1856, 74–86. [Google Scholar] [CrossRef]
- Roberts, A.; Jacobsen, K.; Thompson, L.; Colyar, N.; Mizuta, J. Ramp Metering: A Proven, Cost-Effective Operational Strategy: A Primer; Federal Highway Administration: Washington, DC, USA, 2014.
- Hall, F.; Agyemang-Duah, K. Freeway Capacity Drop and the Definition of Capacity; Transportation Research Board: Washington, DC, USA, 1991. [Google Scholar]
- Masher, D.P.; Ross, D.; Wong, P.J.; Tuan, P.; Zeidler, H.M.; Petracek, S. Guidelines for Design and Operation of Ramp Control Systems; Transportation Research Board: Washington, DC, USA, 1975. [Google Scholar]
- Chu, L.; Liu, H.X.; Recker, W.; Zhang, H.M. Performance Evaluation of Adaptive Ramp-Metering Algorithms Using Microscopic Traffic Simulation Model. J. Transp. Eng. 2004, 130, 330–338. [Google Scholar] [CrossRef] [Green Version]
- Ghanbartehrani, S.; Sanandaji, A.; Mokhtari, Z.; Tajik, K. A Novel Ramp Metering Approach Based on Machine Learning and Historical Data. Mach. Learn. Knowl. Extr. 2020, 2, 21. [Google Scholar] [CrossRef]
- Zhanfeng, J.; Chao, C.; Coifman, B.; Varaiya, P. The PeMS algorithms for accurate, real-time estimates of g-factors and speeds from single-loop detectors. In Proceedings of the ITSC 2001 IEEE Intelligent Transportation Systems, Oakland, CA, USA, 25–29 August 2001; pp. 536–541. [Google Scholar]
- Hadj-Salem, H.; Blosseville, J.M.; Papageorgiou, M. ALINEA: A local feedback control law for on-ramp metering; A real-life study. In Proceedings of the Third International Conference on Road Traffic Control, 1990, London, UK, 22–24 March 1994; pp. 194–198. [Google Scholar]
- Smaragdis, E.; Papageorgiou, M.; Kosmatopoulos, E. A flow-maximizing adaptive local ramp metering strategy. Transp. Res. Part B Methodol. 2004, 38, 251–270. [Google Scholar] [CrossRef]
- Jiang, R.; Chung, E.; Lee, J.B. Local On-ramp Queue Management Strategy with Mainline Speed Recovery. Procedia Soc. Behav. Sci. 2012, 43, 201–209. [Google Scholar] [CrossRef] [Green Version]
- Chi, R.; Hou, Z.-S.; Jin, S.; Wang, D.; Hao, J. A data-driven iterative feedback tuning approach of ALINEA for freeway traffic ramp metering with PARAMICS simulations. IEEE Trans. Ind. Inform. 2013, 9, 2310–2317. [Google Scholar] [CrossRef]
- Wang, Y.; Kosmatopoulos, E.B.; Papageorgiou, M.; Papamichail, I. Local Ramp Metering in the Presence of a Distant Downstream Bottleneck: Theoretical Analysis and Simulation Study. IEEE Trans. Intell. Transp. Syst. 2014, 15, 2024–2039. [Google Scholar] [CrossRef]
- Frejo, J.R.D.; Schutter, B.D. Feed-Forward ALINEA: A Ramp Metering Control Algorithm for Nearby and Distant Bottlenecks. IEEE Trans. Intell. Transp. Syst. 2019, 20, 2448–2458. [Google Scholar] [CrossRef]
- Liu, Z.; Wu, Y.; Cao, S.; Zhu, L.; Shen, G. A Ramp Metering Method Based on Congestion Status in the Urban Freeway. IEEE Access 2020, 8, 76823–76831. [Google Scholar] [CrossRef]
- Papageorgiou, M.; Blosseville, J.-M.; Haj-Salem, H. Modelling and real-time control of traffic flow on the southern part of Boulevard Peripherique in Paris: Part II: Coordinated on-ramp metering. Transp. Res. Part A Gen. 1990, 24, 361–370. [Google Scholar] [CrossRef]
- Paesani, G.; Kerr, J.; Perovich, P.; Khosravi, F. System wide adaptive ramp metering (SWARM). In Proceedings of the Merging the Transportation and Communications Revolutions, Abstracts for ITS America Seventh Annual Meeting and Exposition, Washington, DC, USA, 2–5 June 1997. [Google Scholar]
- Taylor, C.; Meldrum, D.; Jacobson, L. Fuzzy ramp metering: Design overview and simulation results. Transp. Res. Rec. 1998, 10–18. [Google Scholar] [CrossRef]
- Zhang, H.; Ritchie, S.G.; Lo, Z. A Local Neural Network Controller for Freeway Ramp Metering. IFAC Proc. Vol. 1994, 27, 655–658. [Google Scholar] [CrossRef]
- Zhang, H.M.; Ritchie, S.G. Freeway ramp metering using artificial neural networks. Transp. Res. Part C Emerg. Technol. 1997, 5, 273–286. [Google Scholar] [CrossRef]
- Papageorgiou, M.; Ben-Akiva, M.; Bottom, J.; Bovy, P.; Hoogendoorn, S.; Hounsell, N.; Kotsialos, A.; Mcdonald, M. ITS and traffic management. Handb. Oper. Res. Manag. Sci. 2007, 14, 715–774. [Google Scholar]
- Taale, H.; Slager, J.; Rosloot, J. The assessment of ramp metering based on fuzzy logic. In Proceedings of the 3rd ITS World Congress, Orlando, FL, USA, 14–18 October 1996. [Google Scholar]
- Taylor, C.E.; Meldrum, D.R. Evaluation of a Fuzzy Logic Ramp Metering Algorithm: A Comparative Study among Three Ramp Metering Algorithms Used in the Greater Seattle Area; Washington State Department of Transportation: Olympia, WA, USA, 2000.
- Ghods, A.H.; Kian, A.R.; Tabibi, M. Adaptive freeway ramp metering and variable speed limit control: A genetic-fuzzy approach. IEEE Intell. Transp. Syst. Mag. 2009, 1, 27–36. [Google Scholar] [CrossRef]
- Yu, X.; Xu, W.; Alam, F.; Potgieter, J.; Fang, C. Genetic fuzzy logic approach to local ramp metering control using microscopic traffic simulation. In Proceedings of the 19th International Conference on Mechatronics and Machine Vision in Practice (M2VIP), Auckland, New Zealand, 28–30 November 2012; pp. 290–297. [Google Scholar]
- Xu, J.; Zhao, X.; Srinivasan, D. On optimal freeway local ramp metering using fuzzy logic control with particle swarm optimisation. IET Intell. Transp. Syst. 2013, 7, 95–104. [Google Scholar] [CrossRef]
- Yu, X.F.; Alam, F.; Xu, P. Genetic-fuzzy logic ramp metering control for ramp metering of motorway. Int. J. Comput. Appl. Technol. 2014, 50. [Google Scholar] [CrossRef]
- Wei, C.-H. Analysis of artificial neural network models for freeway ramp metering control. Artif. Intell. Eng. 2001, 15, 241–252. [Google Scholar] [CrossRef]
- Tafti, M. The Development of a Ramp Metering Strategy Based on Artificial Neural Networks. In Applications and Innovations in Intelligent Systems IX; Spinger: London, UK, 2002; pp. 199–212. ISBN 978-1-85233-530-4. [Google Scholar]
- Feng, C.; Yuanhua, J.; Jian, L.; Huixin, Y.; Zhonghai, N. Design of Fuzzy Neural Network Control Method for Ramp Metering. In Proceedings of the 2011 Third International Conference on Measuring Technology and Mechatronics Automation, Shangshai, China, 6–7 January 2011; Volume 1, pp. 966–969. [Google Scholar]
- Chen, F.; Jia, Y.; Niu, Z.; Yi, H.; Song, H. Ramp Metering Research of Junction Based on Fuzzy Neural Network Model. J. Transp. Syst. Eng. Inf. Technol. 2011, 11, 108–113. [Google Scholar] [CrossRef]
- Chen, J.; Lin, W.; Yang, Z.; Li, J.; Cheng, P. Adaptive Ramp Metering Control for Urban Freeway Using Large-Scale Data. IEEE Trans. Veh. Technol. 2019, 68, 9507–9518. [Google Scholar] [CrossRef]
- Jacob, C.; Abdulhai, B. Automated Adaptive Traffic Corridor Control Using Reinforcement Learning: Approach and Case Studies. Transp. Res. Rec. 2006, 1959, 1–8. [Google Scholar] [CrossRef]
- Wang, X.-J.; Xi, X.-M.; Gao, G.-F. Reinforcement Learning Ramp Metering without Complete Information. J. Control Sci. Eng. 2012, 2012, 208456. [Google Scholar] [CrossRef] [Green Version]
- Rezaee, K.; Abdulhai, B.; Abdelgawad, H. Application of reinforcement learning with continuous state space to ramp metering in real-world conditions. In Proceedings of the 2012 15th International IEEE Conference on Intelligent Transportation Systems, Anchorage, AK, USA, 16–19 September 2012; pp. 1590–1595. [Google Scholar]
- Li, Z.; Liu, P.; Xu, C.; Duan, H.; Wang, W. Reinforcement Learning-Based Variable Speed Limit Control Strategy to Reduce Traffic Congestion at Freeway Recurrent Bottlenecks. IEEE Trans. Intell. Transp. Syst. 2017, 18, 3204–3217. [Google Scholar] [CrossRef]
- Yang, H.; Rakha, H.A. Reinforcement Learning Ramp Metering Control for Weaving Sections in a Connected Vehicle Environment. In Proceedings of the Transportation Research Board 96th Annual Meeting, Washington DC, USA, 8–12 January 2017. [Google Scholar]
- Lu Chao; Huang Jie; Deng Lianbo; Gong Jianwei Coordinated Ramp Metering with Equity Consideration Using Reinforcement Learning. J. Transp. Eng. Part A Syst. 2017, 143, 04017028. [CrossRef]
- Zhou, Y.; Ozbay, K.; Kachroo, P.; Zuo, F. Ramp Metering for a Distant Downstream Bottleneck Using Reinforcement Learning with Value Function Approximation. J. Adv. Transp. 2020, 2020, 8813467. [Google Scholar] [CrossRef]
- Chai, G.; Cao, J.; Xu, S. An optimized on-ramp metering method for urban expressway based on reinforcement learning. J. Intell. Fuzzy Syst. 2020, 38, 2703–2715. [Google Scholar] [CrossRef]
- Belletti, F.; Haziza, D.; Gomes, G.; Bayen, A.M. Expert Level control of Ramp Metering based on Multi-task Deep Reinforcement Learning. IEEE Trans. Intell. Transp. Syst. 2017, 19, 1198–1207. [Google Scholar] [CrossRef]
- Yang, M.; Li, Z.; Ke, Z.; Li, M. A Deep Reinforcement Learning-based Ramp Metering Control Framework for Improving Traffic Operation at Freeway Weaving Sections. In Proceedings of the Transportation Research Board 98th Annual Meeting, Washington DC, USA, 13–17 January 2019. [Google Scholar]
- Deng, F.; Jin, J.; Shen, Y.; Du, Y. Advanced Self-Improving Ramp Metering Algorithm based on Multi-Agent Deep Reinforcement Learning. In Proceedings of the 2019 IEEE Intelligent Transportation Systems Conference (ITSC), Auckland, New Zealand, 27–30 October 2019; pp. 3804–3809. [Google Scholar]
- Zhao, L.; Li, Z.; Ke, Z.; Li, M. Fuzzy self-adaptive proportional–integral–derivative control strategy for ramp metering at distance downstream bottlenecks. IET Intell. Transp. Syst. 2020, 14, 250–256. [Google Scholar] [CrossRef]
Figure 1.
Flow and density chart in a highway.

Figure 2.
Ramp entrance with traffic light.

Figure 3.
Highway section with two entrance ramps model.

Figure 4.
Training data snapshot.

Figure 5.
Neural network layers.

Figure 6.
Classification histogram for red light duration after the execution of data mining scenario.
Figure 6.
Classification histogram for red light duration after the execution of data mining scenario.

Figure 7.
Snapshot of the last 15 epochs for ramp 1.

Figure 8.
Accuracy and loss for ramp 1 on test set.

Figure 9.
Accuracy (a) and loss (b) for training and validation set for ramp 1.

Figure 10.
Correlations between results for ramp 1 (r1_t1) and the input data.

Figure 11.
Snapshot of the last 15 epochs for ramp 2.
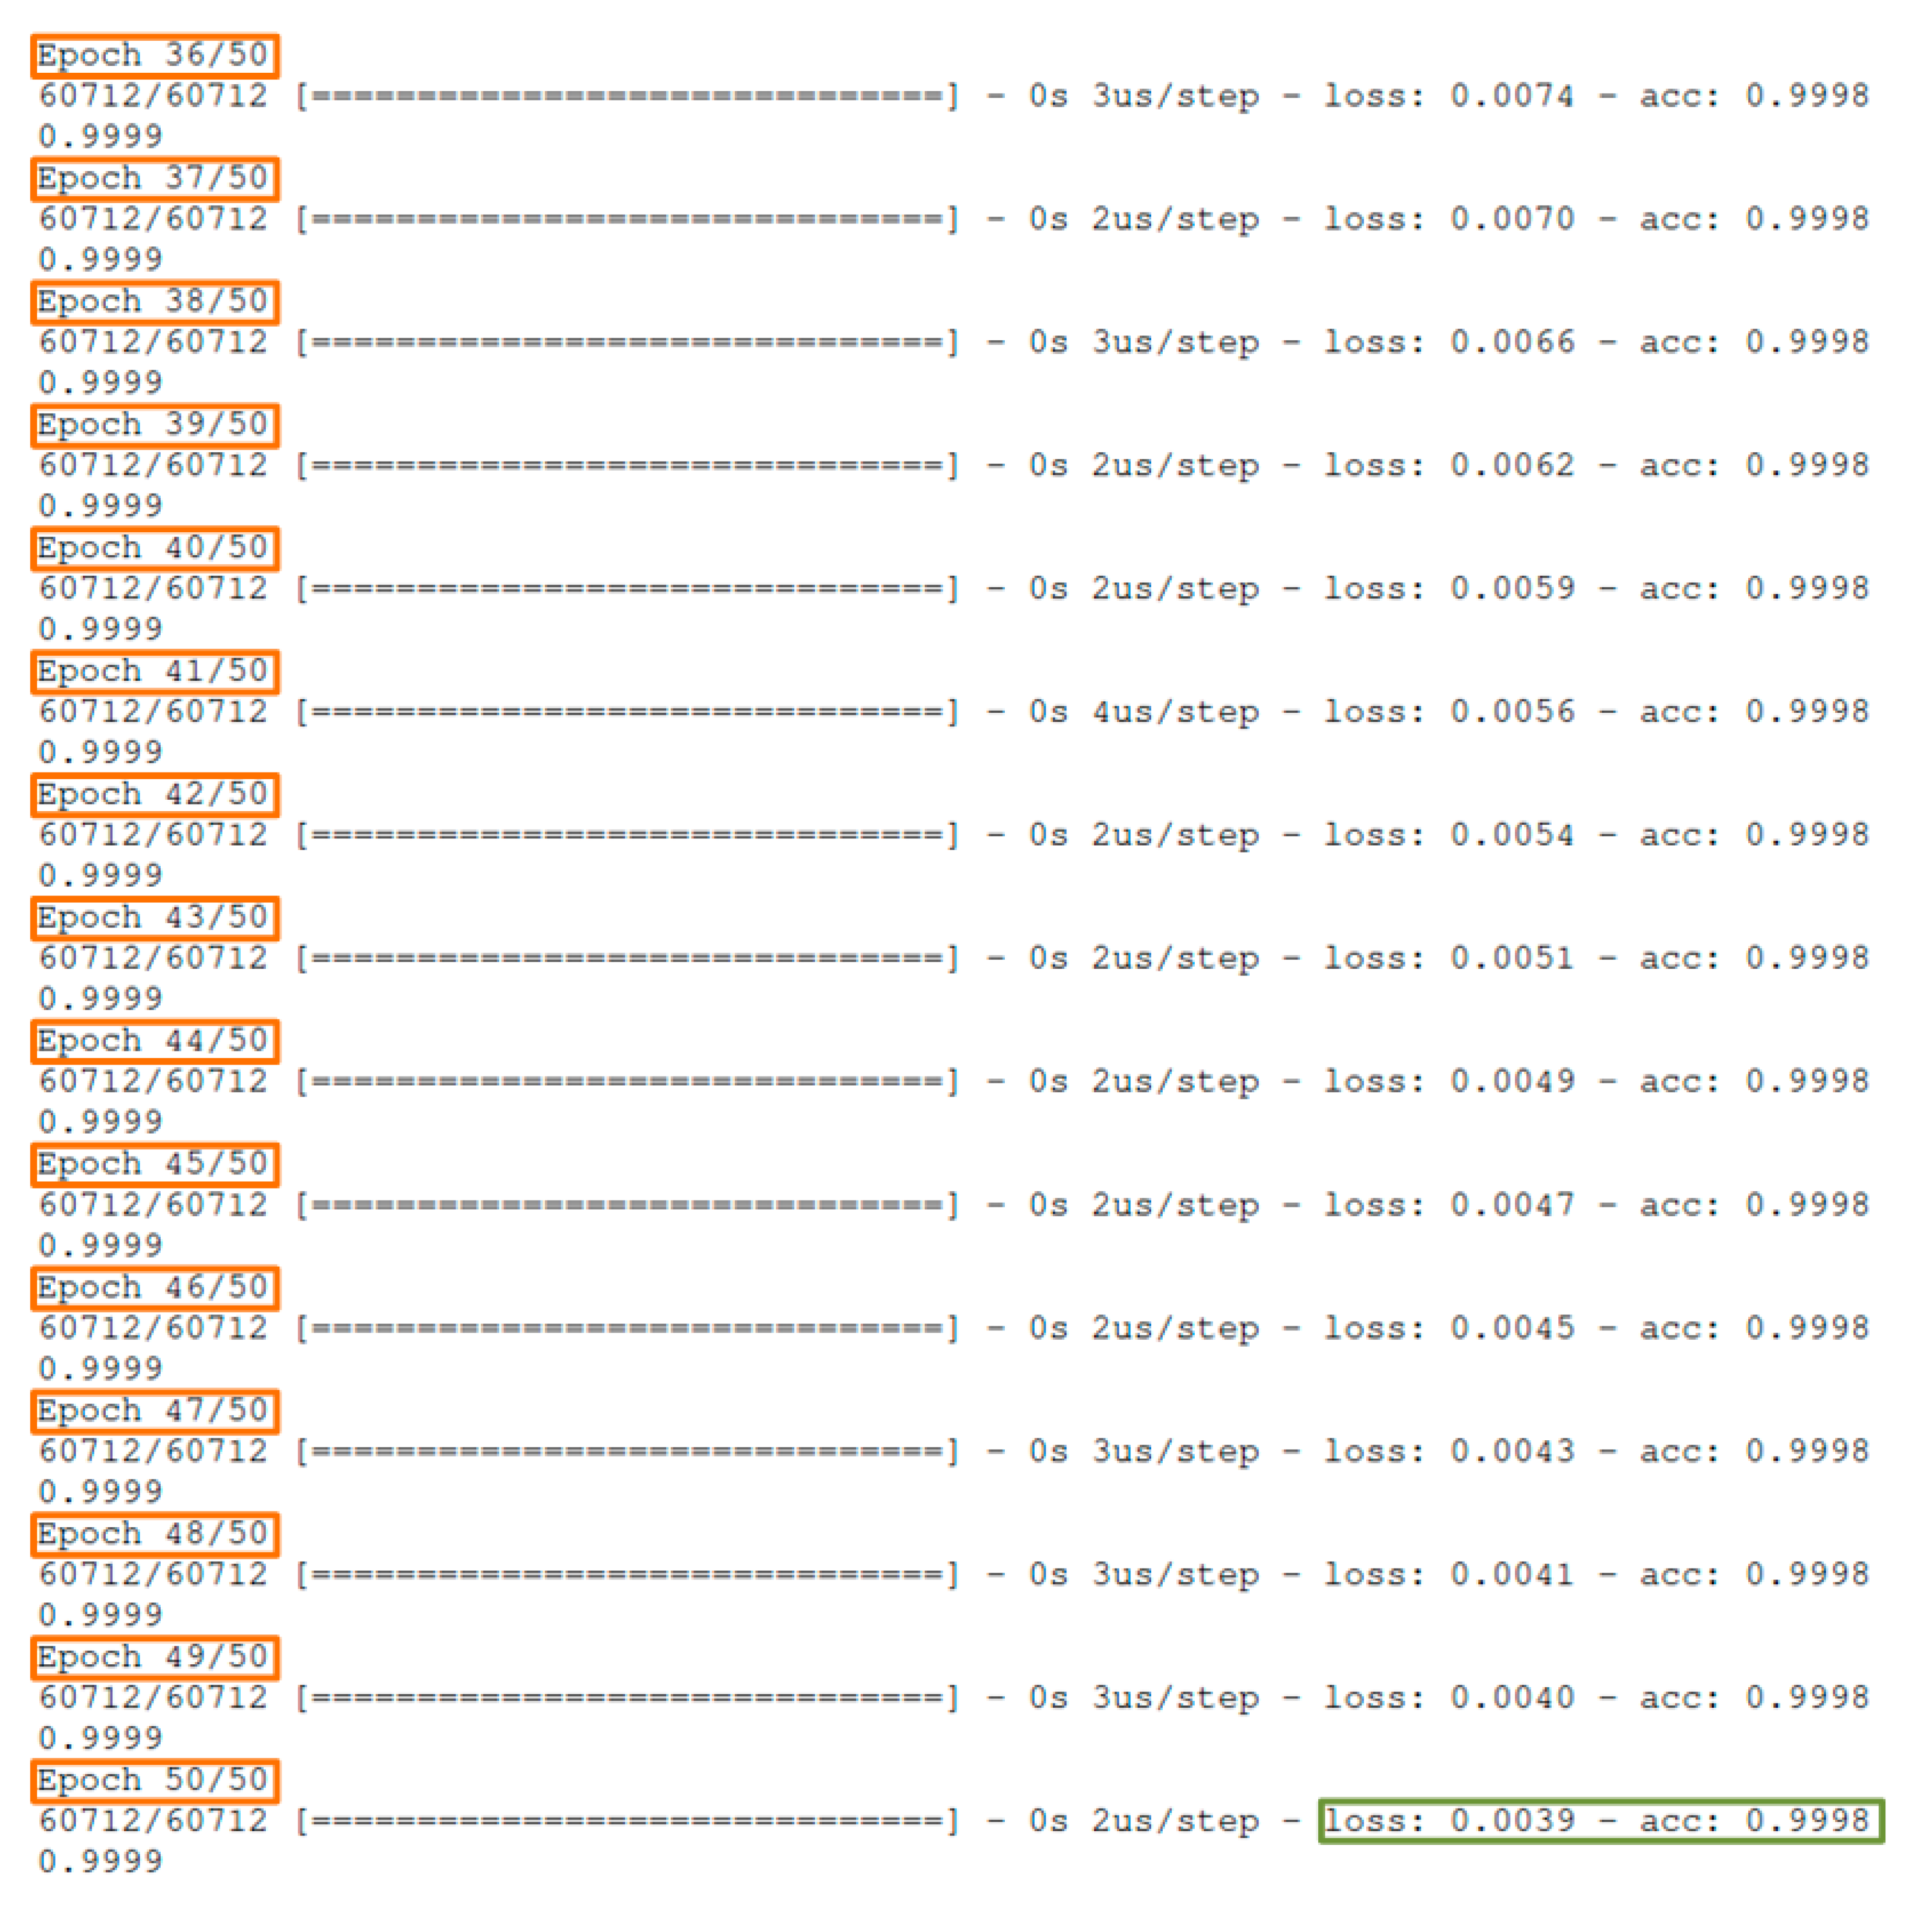
Figure 12.
Accuracy and loss for ramp 2 on test set.

Figure 13.
Accuracy (a) and loss (b) for training and validation set for ramp 2.

Figure 14.
Correlations between results for ramp 2 (r2_t2) and the input data.
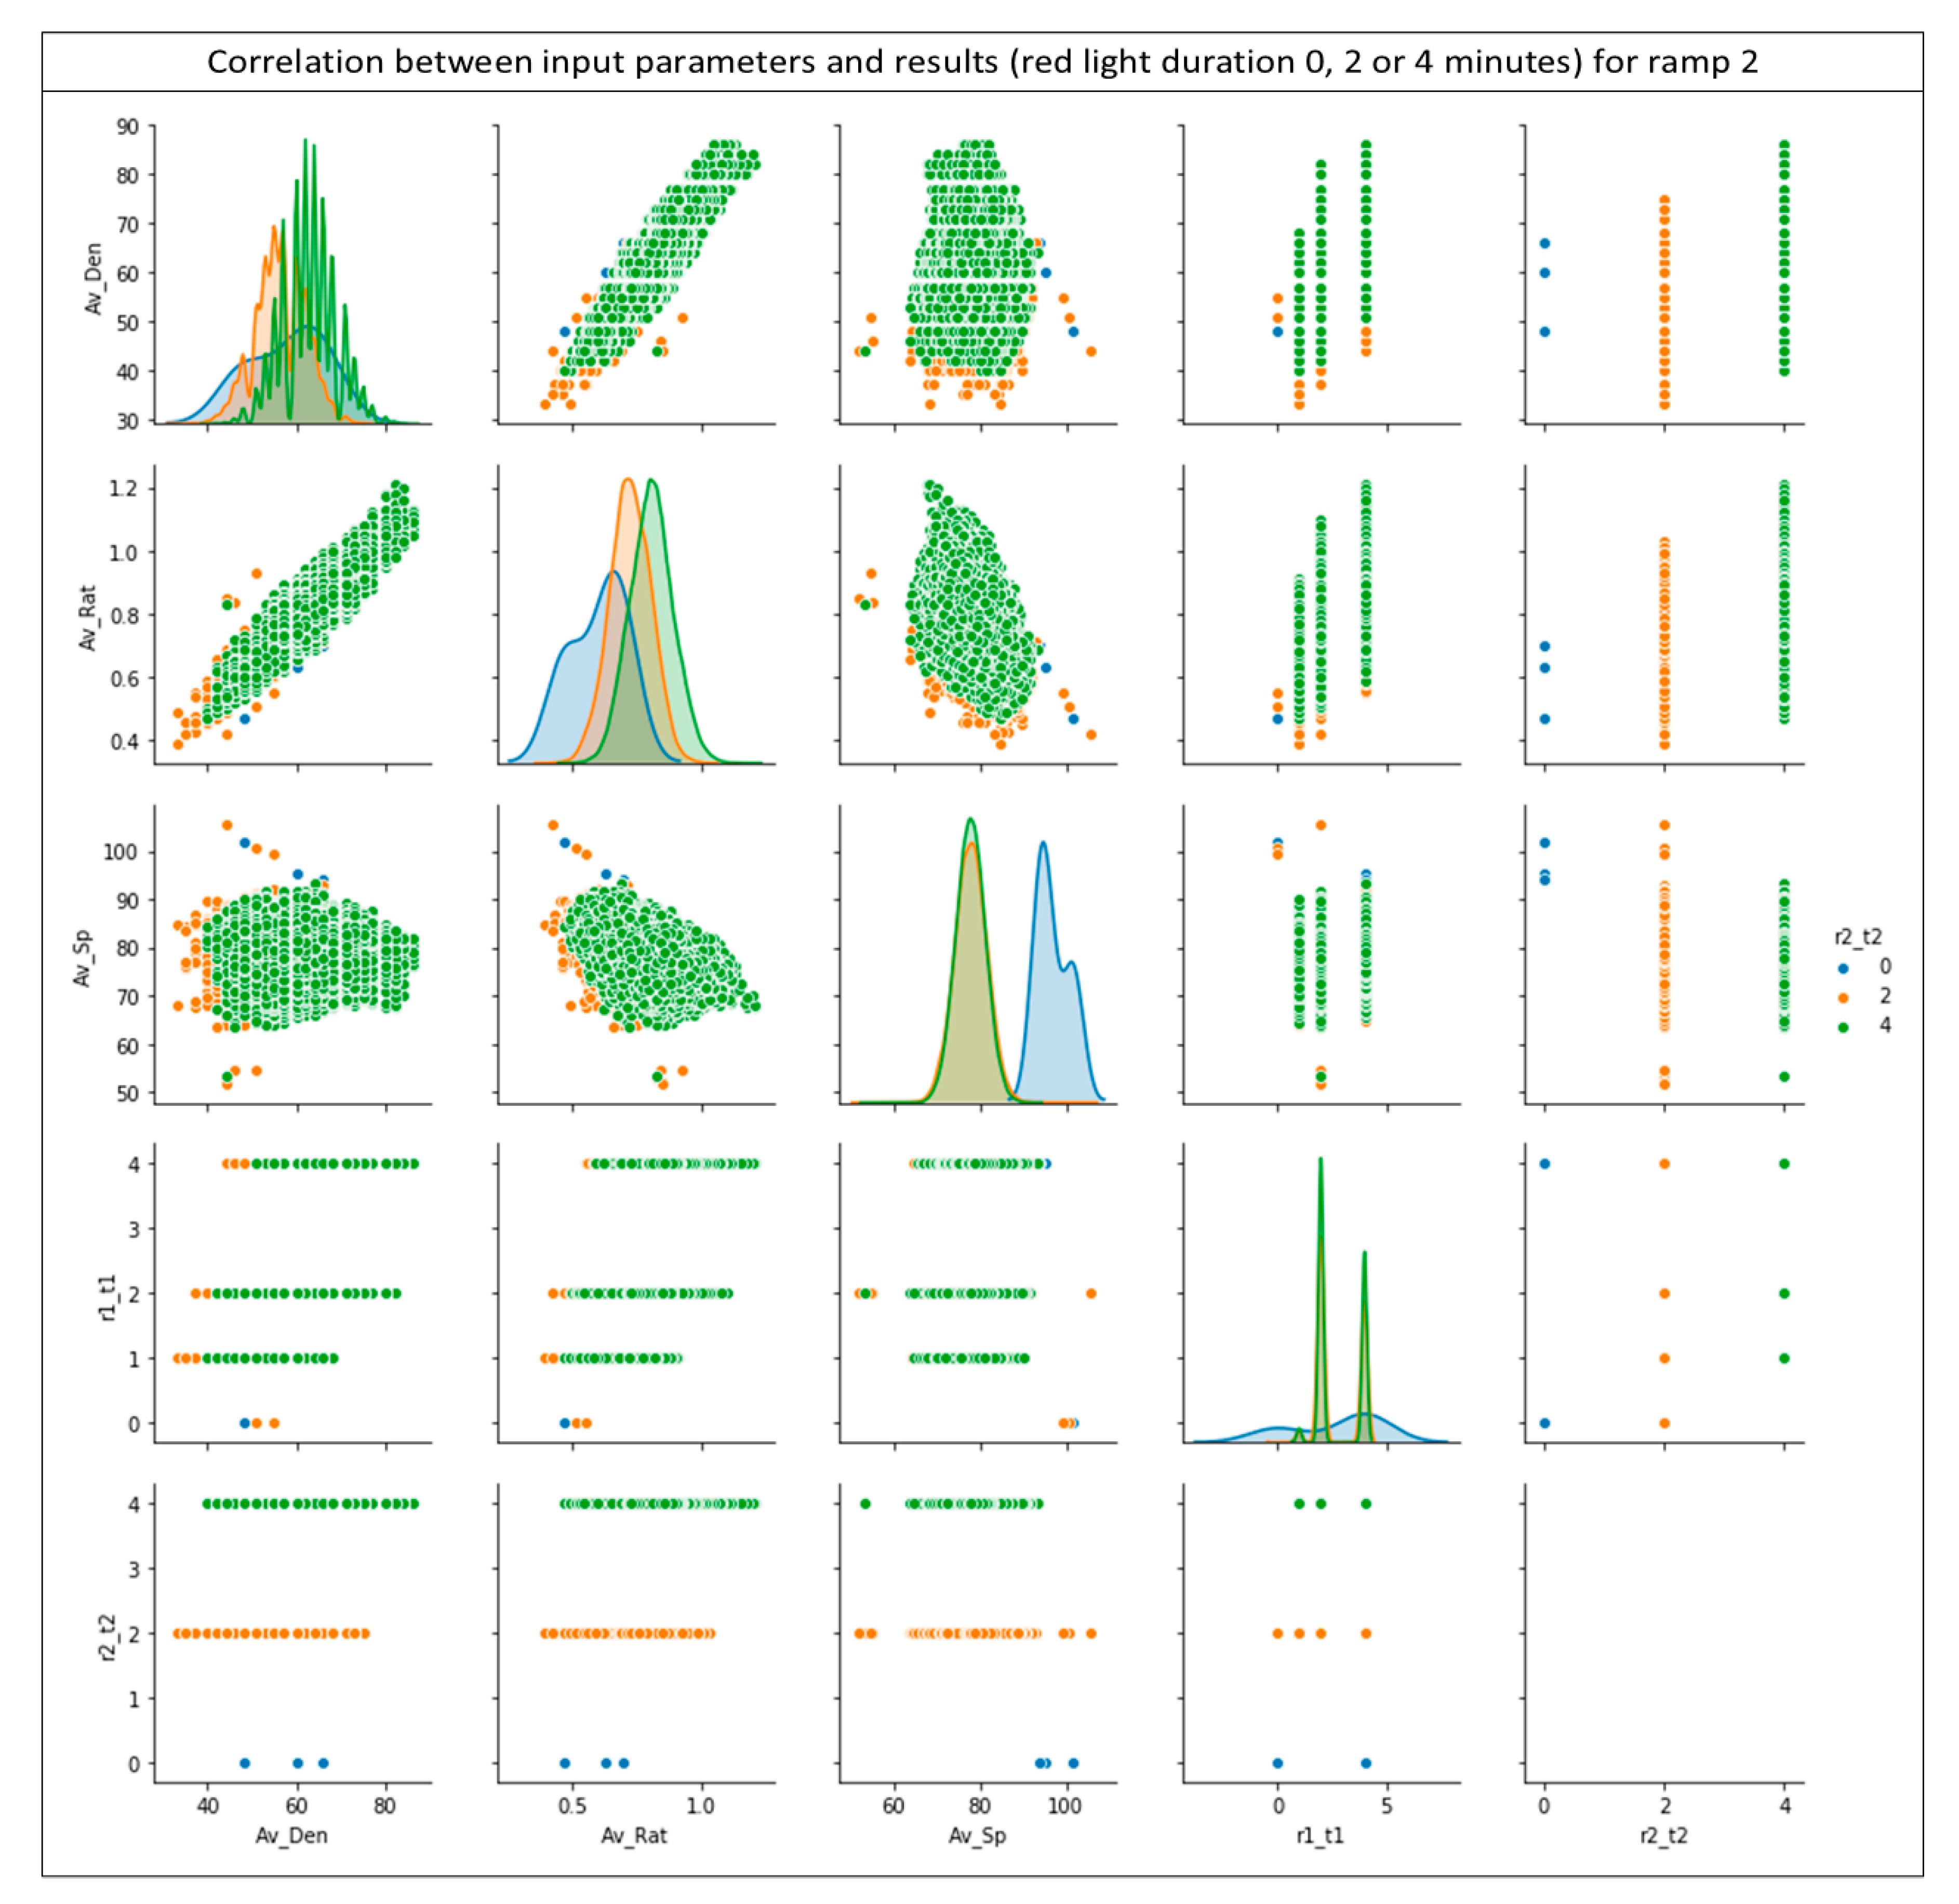
Figure 15.
Confusion matrix of the studied neural network.

Table 1.
Characteristics of road network traffic management techniques.
| Technique | Local or Systemic Nature | Future Data Predictions | Computational Complexity |
|---|---|---|---|
| Optimal control and model predictive control | Systemic | Yes | High |
| Artificial Intelligence | Local and systemic | Yes | Medium or high |
| Static feedback control | Local | No | Low |
Table 2.
Ramp metering studies by method.
| Method | Studies |
|---|---|
| Demand-Capacity | [8,10,26] |
| Occupancy | [8,10,13] |
| ALINEA based | [5,7,14,15,16,17,18,19,20] |
| Fuzzy logic | [23,27,28,29,30,31,32] |
| Neural Networks | [24,25,33,34,35,36,37] |
| Reinforcement Learning | [38,39,40,41,42,43,44,45] |
| Deep Reinforcement Learning | [46,47,48,49] |
Table 3.
Training data format for the training of the studied neural network.
| Discrete Time Instance (T) | Section 1 | … | Section n | Density | Average Speed V | Ratio (R) | Output Time Ramp 1 | Output Time Ramp 2 |
|---|---|---|---|---|---|---|---|---|
| T = 1 | 0 | … | 1 | 52 | 100 | 0.42 | 1 | 2 |
| T = 2 | 0 | … | 0 | 48 | 105 | 0.47 | 1 | 2 |
| … | … | … | ||||||
| T = n | 1 | … | 1 | 60 | 90 | 0.55 | 4 | 1 |
Table 4.
Results for different scenarios.
| Scenario | Density (%) | Average Speed (km/h) | Ratio-R | Execution Time (s) | Repetitions |
|---|---|---|---|---|---|
| 1 lane & 1 ramp | 63.45 | 76.71 | 0.8 | 4.08 | 4383 |
| 3 lanes & 1 ramp | 55.37 | 78.85 | 0.76 | 12.59 | 4467 |
| 3 lanes & 2 ramps | 61.70 | 77.86 | 0.79 | 300 | 108,016 |
Table 5.
Accuracy and loss results for ramp 1 and ramp 2.
| Ramp | Accuracy Train Set | Loss Train Set | Accuracy Test Set | Loss Test Set |
|---|---|---|---|---|
| Ramp 1 | 98.15% | 3.16% | 98.20% | 3.99% |
| Ramp 2 | 99.98% | 0.39% | 99.99% | 0.36% |
Publisher’s Note: MDPI stays neutral with regard to jurisdictional claims in published maps and institutional affiliations. |
© 2021 by the authors. Licensee MDPI, Basel, Switzerland. This article is an open access article distributed under the terms and conditions of the Creative Commons Attribution (CC BY) license (http://creativecommons.org/licenses/by/4.0/).
Share and Cite
MDPI and ACS Style
Alexakis, T.; Peppes, N.; Adamopoulou, E.; Demestichas, K. An Artificial Intelligence-Based Approach for the Controlled Access Ramp Metering Problem. Vehicles 2021, 3, 63-83. https://0-doi-org.brum.beds.ac.uk/10.3390/vehicles3010005
AMA Style
Alexakis T, Peppes N, Adamopoulou E, Demestichas K. An Artificial Intelligence-Based Approach for the Controlled Access Ramp Metering Problem. Vehicles. 2021; 3(1):63-83. https://0-doi-org.brum.beds.ac.uk/10.3390/vehicles3010005
Chicago/Turabian StyleAlexakis, Theodoros, Nikolaos Peppes, Evgenia Adamopoulou, and Konstantinos Demestichas. 2021. "An Artificial Intelligence-Based Approach for the Controlled Access Ramp Metering Problem" Vehicles 3, no. 1: 63-83. https://0-doi-org.brum.beds.ac.uk/10.3390/vehicles3010005