Experimental Analysis of a Novel, Magnetic-Driven Tactile Feedback Device


1
Natural Interactions Lab, Institute of Biomedical Engineering, Department of Engineering Science, University of Oxford, Oxford OX1 3PJ, UK
2
Mechanobiology Group, Institute of Biomedical Engineering, Department of Engineering Science, University of Oxford, Oxford OX3 7DQ, UK
*
Author to whom correspondence should be addressed.
Prosthesis 2020, 2(1), 25-38; https://0-doi-org.brum.beds.ac.uk/10.3390/prosthesis2010003
Submission received: 4 February 2020
/
Revised: 24 February 2020
/
Accepted: 26 February 2020
/
Published: 3 March 2020
Abstract
:The study presented in this paper details the development and experimental testing of a novel, magnetic, tactile feedback device that is able to deliver a stimulus to a patch of skin on the lower arm of a user. The device utilizes magnets to deliver a sensation that is not dependent on controlling specific frequency bands to stimulate the mechanoreceptors, as is the case with vibro-tactile methods. The device was tested on human volunteers to evaluate its ability to induce a response from the user through the magnetic interface. The study aims to quantify the ability of the user to sense the stimulus by analysis of the receiver operating characteristic (ROC) and delay in response under different experimental conditions. Three different speeds and two different distances were explored for the magnetic interface. A two-way, repeated-measures ANOVA with post-hoc analysis was performed for the percentage of correct responses, delay in response time, and area under the curve (AUC) of the obtained ROCs. The results showed that the different conditions had a significant effect on the number of correct responses and the AUC, but not on the delay. The magnetic interface thus needs to be optimized across different parameters to deliver the best detectable stimulus to the user. Future work includes further development of the device and working towards a comparative trial with other tactile feedback approaches.
1. Introduction
The development of tactile feedback devices has been gaining much attention in the past few years across different healthcare domains. Amputees are one of the main beneficiaries of tactile feedback devices, as they could further optimize the functionality and utility of (upper limb) prosthetics. Trans-radial amputees make up a large portion of all amputees in the United States, with an estimated 57% of all upper limb amputees suffering from a trans-radial amputation [1]. The number of new amputees that reject their prosthetic is quite high, at around 40% [2]; many reasons play a role in the rejection, but one of the major contributors is the lack of tactile feedback from the prosthetic. The mechanism of sensation that exists within the skin organ is dependent on the highly abundant and versatile mechanoreceptors. Four different mechanoreceptors make up the family of sensors that sense and respond to different external stimuli [3]. The slowly adapting (SA) Type 1 receptors (SA1) are reactive to indentations of up to 1500 micrometers [4]. They are highly sensitive to edges, curves, and points, due to their selective nature in sensing strain energy density translated from the external stimulus. They also have high spatial resolution, which allows them to convey a lot of information about the spatial image of an external item [3]. The slowly adapting Type 2 (SA2) receptors are very sensitive to skin stretch [4,5]. Additionally, the SA2 afferents play an important role in the perception of the motion of an object or a force on the skin [6], as the motion on the skin stretches the skin. Rapidly adapting receptors are quite similar to SA1, but are much more sensitive to dynamic skin deformation and also insensitive to static indentation [3]. Due to their inability to respond to deformation non-uniformly across their receptive field, rapidly adapting receptors are able to relay almost no spatial information. Therefore, they act as a detector of micro-vibrations, making them ideal in detecting sudden movements on the skin and slip motions [7,8]. Finally, Pacinian corpuscles (PAs) are the most sensitive of all the receptors [9]. They are able to respond to nanometer deformations of the skin at high vibrations. Additionally, they are able to filter out much of the low-vibration stimuli, and hence can convey an image of the transient and vibratory motion that occurs to the hand while delicately manipulating items. PAs are much more sensitive than rapidly adapting (RA) receptors when it comes to small indentations at high vibrations; they have also been shown to play an important role in the perception of distant events, through tools that are held in the hand [3,9]. The spatial distribution of the receptors is of extreme importance to tactile feedback delivery. The density distribution of the receptors, both in the hand and at the location at which a tactile feedback stimulus is delivered, can be quite different. Therefore, mapping out the distributions is important for matching the modality of touch from the hand to the place of tactile feedback delivery.
The current methods that deliver tactile stimulation are limited, and most adopt the vibro-tactile techniques [10,11,12]. While they have proven to be quite successful in sending a stimulus to the mechanoreceptors, they are limited in stimulus variation and provide a stimulus that is not very common in real-world interactions, as they send signals through controlled frequencies [13]. In natural tactile stimulation, the signals delivered to the receptors are a lot more dynamic, and are not represented in the form of a specific frequency that overwhelmingly stimulates a single type of receptor over another. Due to the limitations with the sort of frequencies and amplitudes that can be delivered, the effectiveness of recruiting the afferents to send a signal to the brain can be hindered, especially when it comes to the type of receptors that are triggered. Additionally, there have been issues reported with how tight the vibrators are attached to the skin [13], and hence the reliability of the signal that is delivered to the user.
Systems by Li et al. [10], Markovic et al. [11], and Marasco et al. [12] all utilize the vibro-tactile approach to deliver a sensation that is used in aiding the user in completing a task of dexterity. Their effectiveness has varied, and there is much room for improvement and more diverse methods of tactile stimulation that can support new ways of generating sensations. Furthermore, systems by Kim et al. [14], have tackled multiple types of sensation delivery, but have been proven to be extremely complex in design and mechanism. The utilization of magnetic interactions to drive tactile feedback sensation has various different advantages over some of the traditional techniques that currently exist. The ease in control and safety [15,16] are two main advantages, along with the ability to create complex dynamics with a reduced number of components. This is becoming a much more robust and favorable system in comparison to mechanical approaches.
Additionally, the lack of modality matching for different natural stimuli makes the perception less effective [17]. Therefore, the need for a system that delivers a more natural stimulus is desired, as it would help in interfacing such a technology with amputees and would exploit the plasticity of the brain much better, since it is closer to what the amputee’s brain is used to sensing from the past.
This research study looks at further understanding the delivery of tactile sensation driven through a magnetic field. The parameters that effect the stimulus delivered are also explored and controlled, in order to identify the optimal control parameters. For the focus of this study, two main parameters are controlled—namely, the speed of the driver magnet and the distance between the driver magnet and stimulus magnet. The primary aim of the study is to understand whether or not the tactical stimulation induced by the magnetically driven device is sensed by the user. The secondary aim of the study is test different control parameters, and to see the differences they produce with regards to the ability of the user to sense the stimulus. Therefore, the study focuses its experiments on understanding the delay in response due to a stimulus on the forearm, as well as the percentage of correct responses based on a given stimulus and on the receiver operator characteristic (ROC) of the tactile feedback device. These measurements quantitatively asses the ability to sense the stimulus and its effect on response when varying control parameters.
2. Results
Figure 1 shows the matching and pattern following for two different users.
2.1. Percentage of Correct Responses
The percentage of correct responses was computed (Figure 2). The highest average percentage of correct responses was found for the condition were the magnets were further apart in vertical direction and the speed was 5 mm/s. The ANOVA indicated there was a significant difference between the sample means for the two within-factors and the interactions: distance factor, F(1,13) = 13.172 (p = 0.003); speed factor, F(1,13) = 21.501 (p = 0.0004); interactions factor, F(1,13) = 10.334, (p = 0.007). The post-hoc test revealed that there is a strong significant difference between the speeds in the far distance condition (p < 0.01); the same did not exist for the close distance condition, and there was only a significant difference between the slow and fast conditions in that the distance condition existed. With the exception of the slow group, there was no statistical difference between the groups from the same speeds but different distances.
2.2. Delay in Response
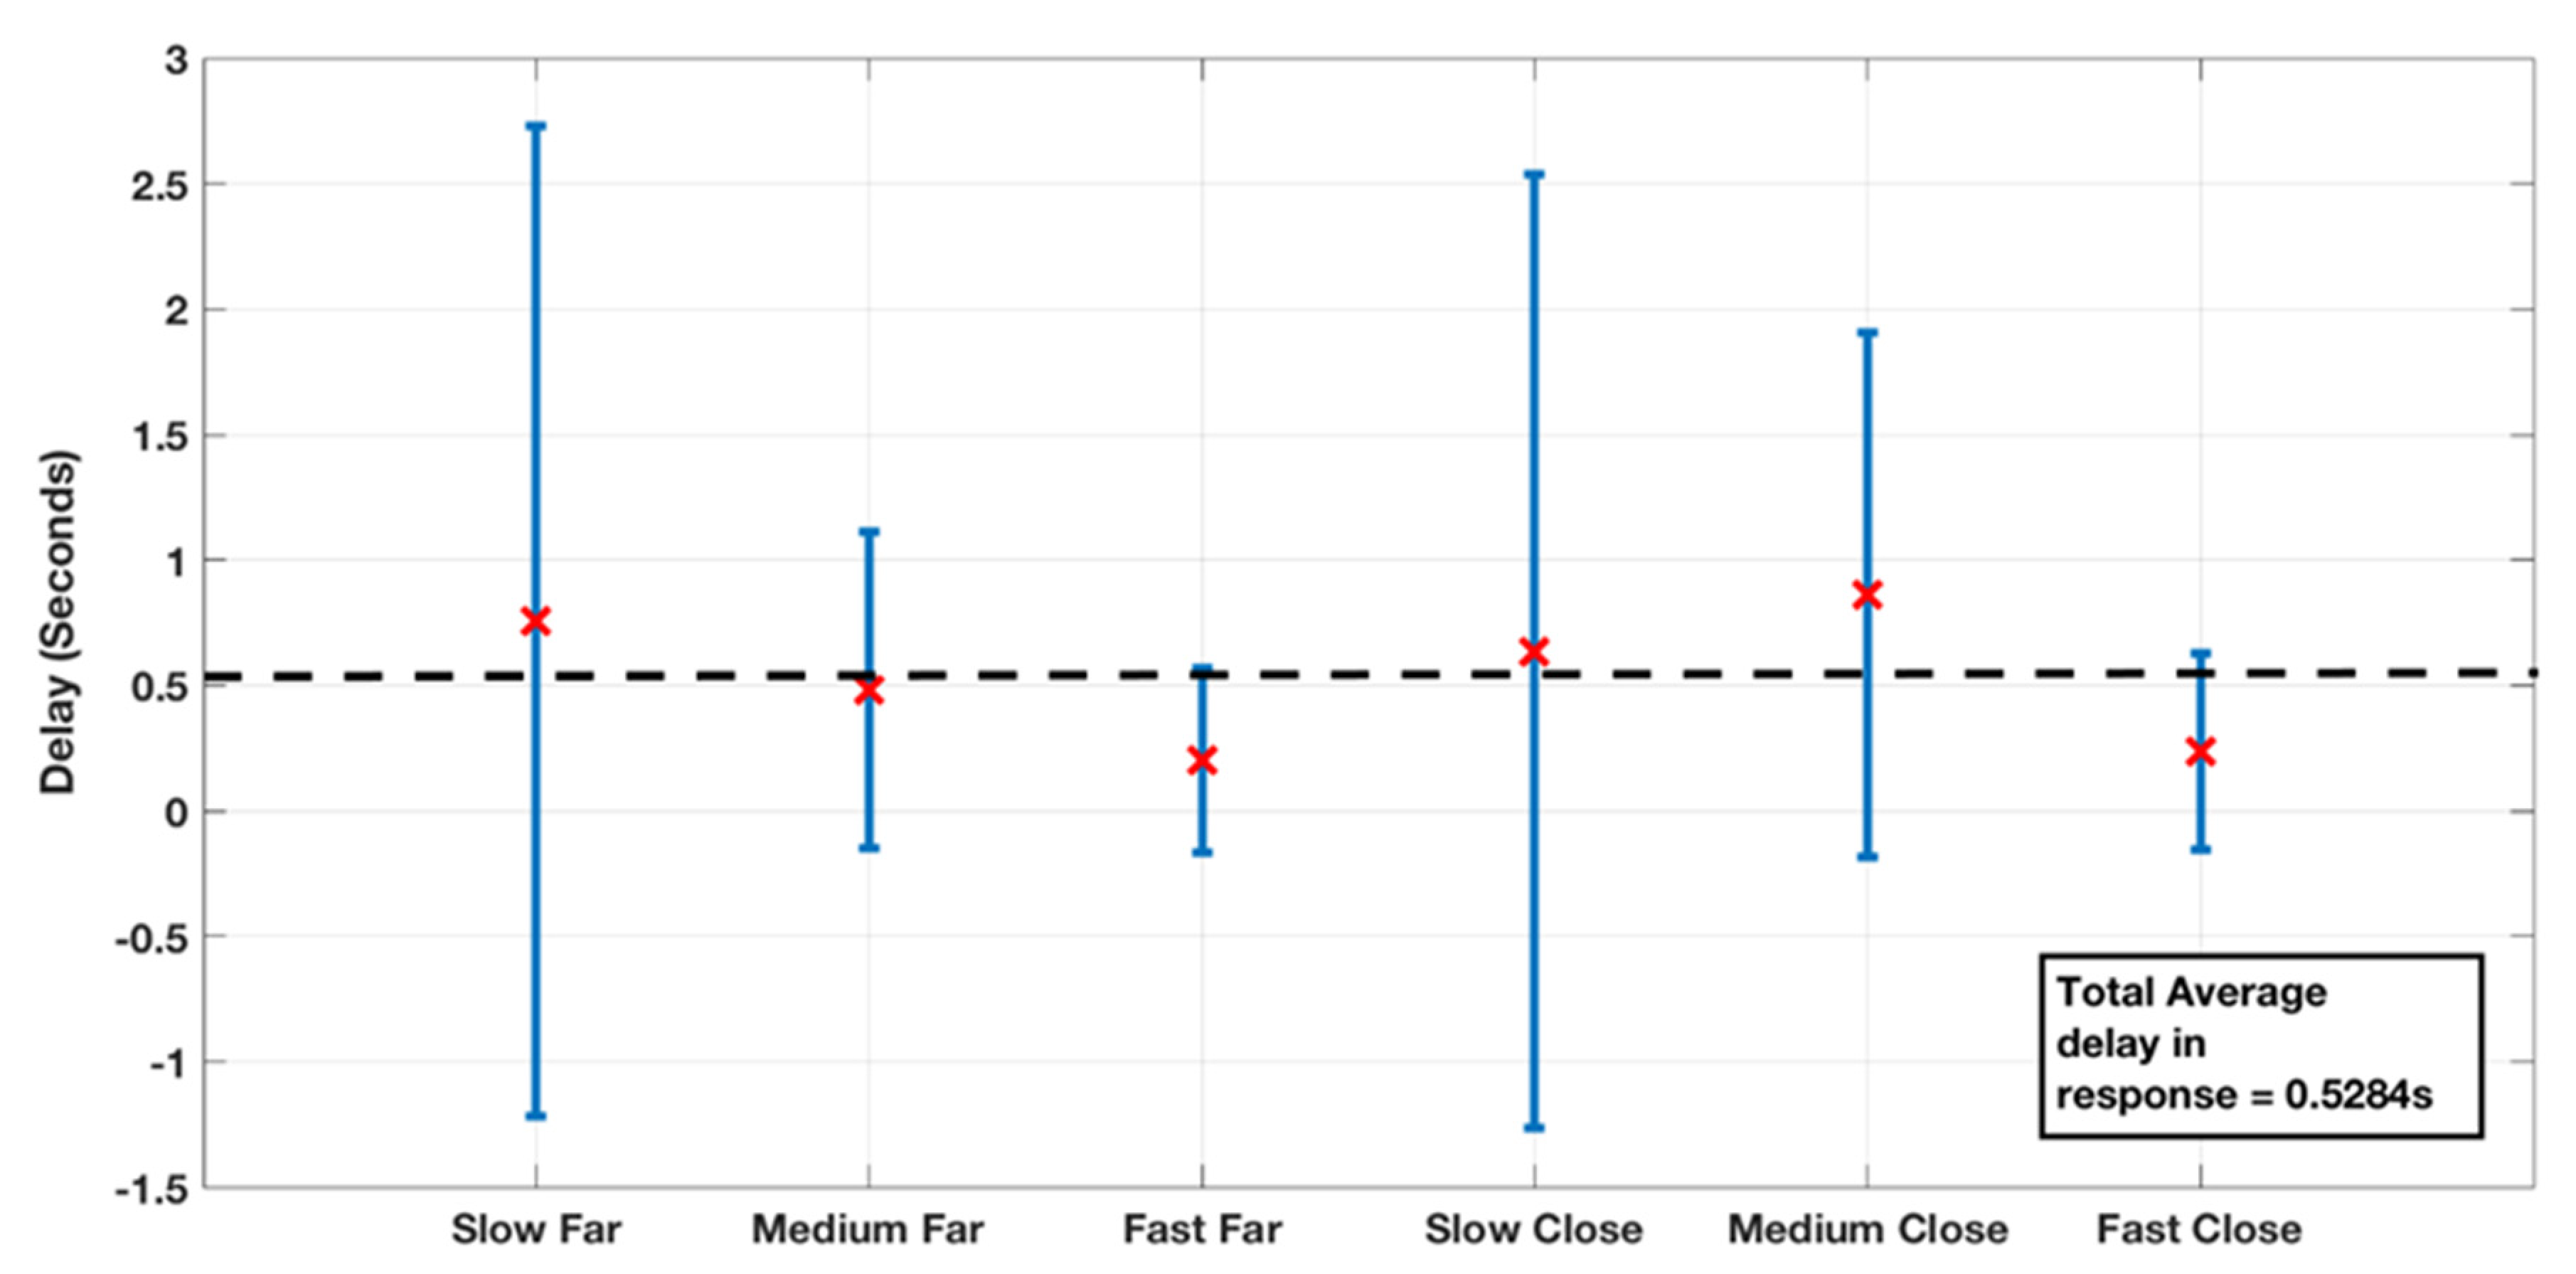
Figure 3 shows the mean and standard deviation for the delay in response. The null hypothesis could not be rejected, and hence there were no significant differences between the conditions in terms of the delay in responses. The largest standard deviation was found for the condition with the lowest speeds and the greatest vertical distance between magnets. The standard deviation decreased when the speed was increased.
2.3. Receiver Operator Characteristic Analysis
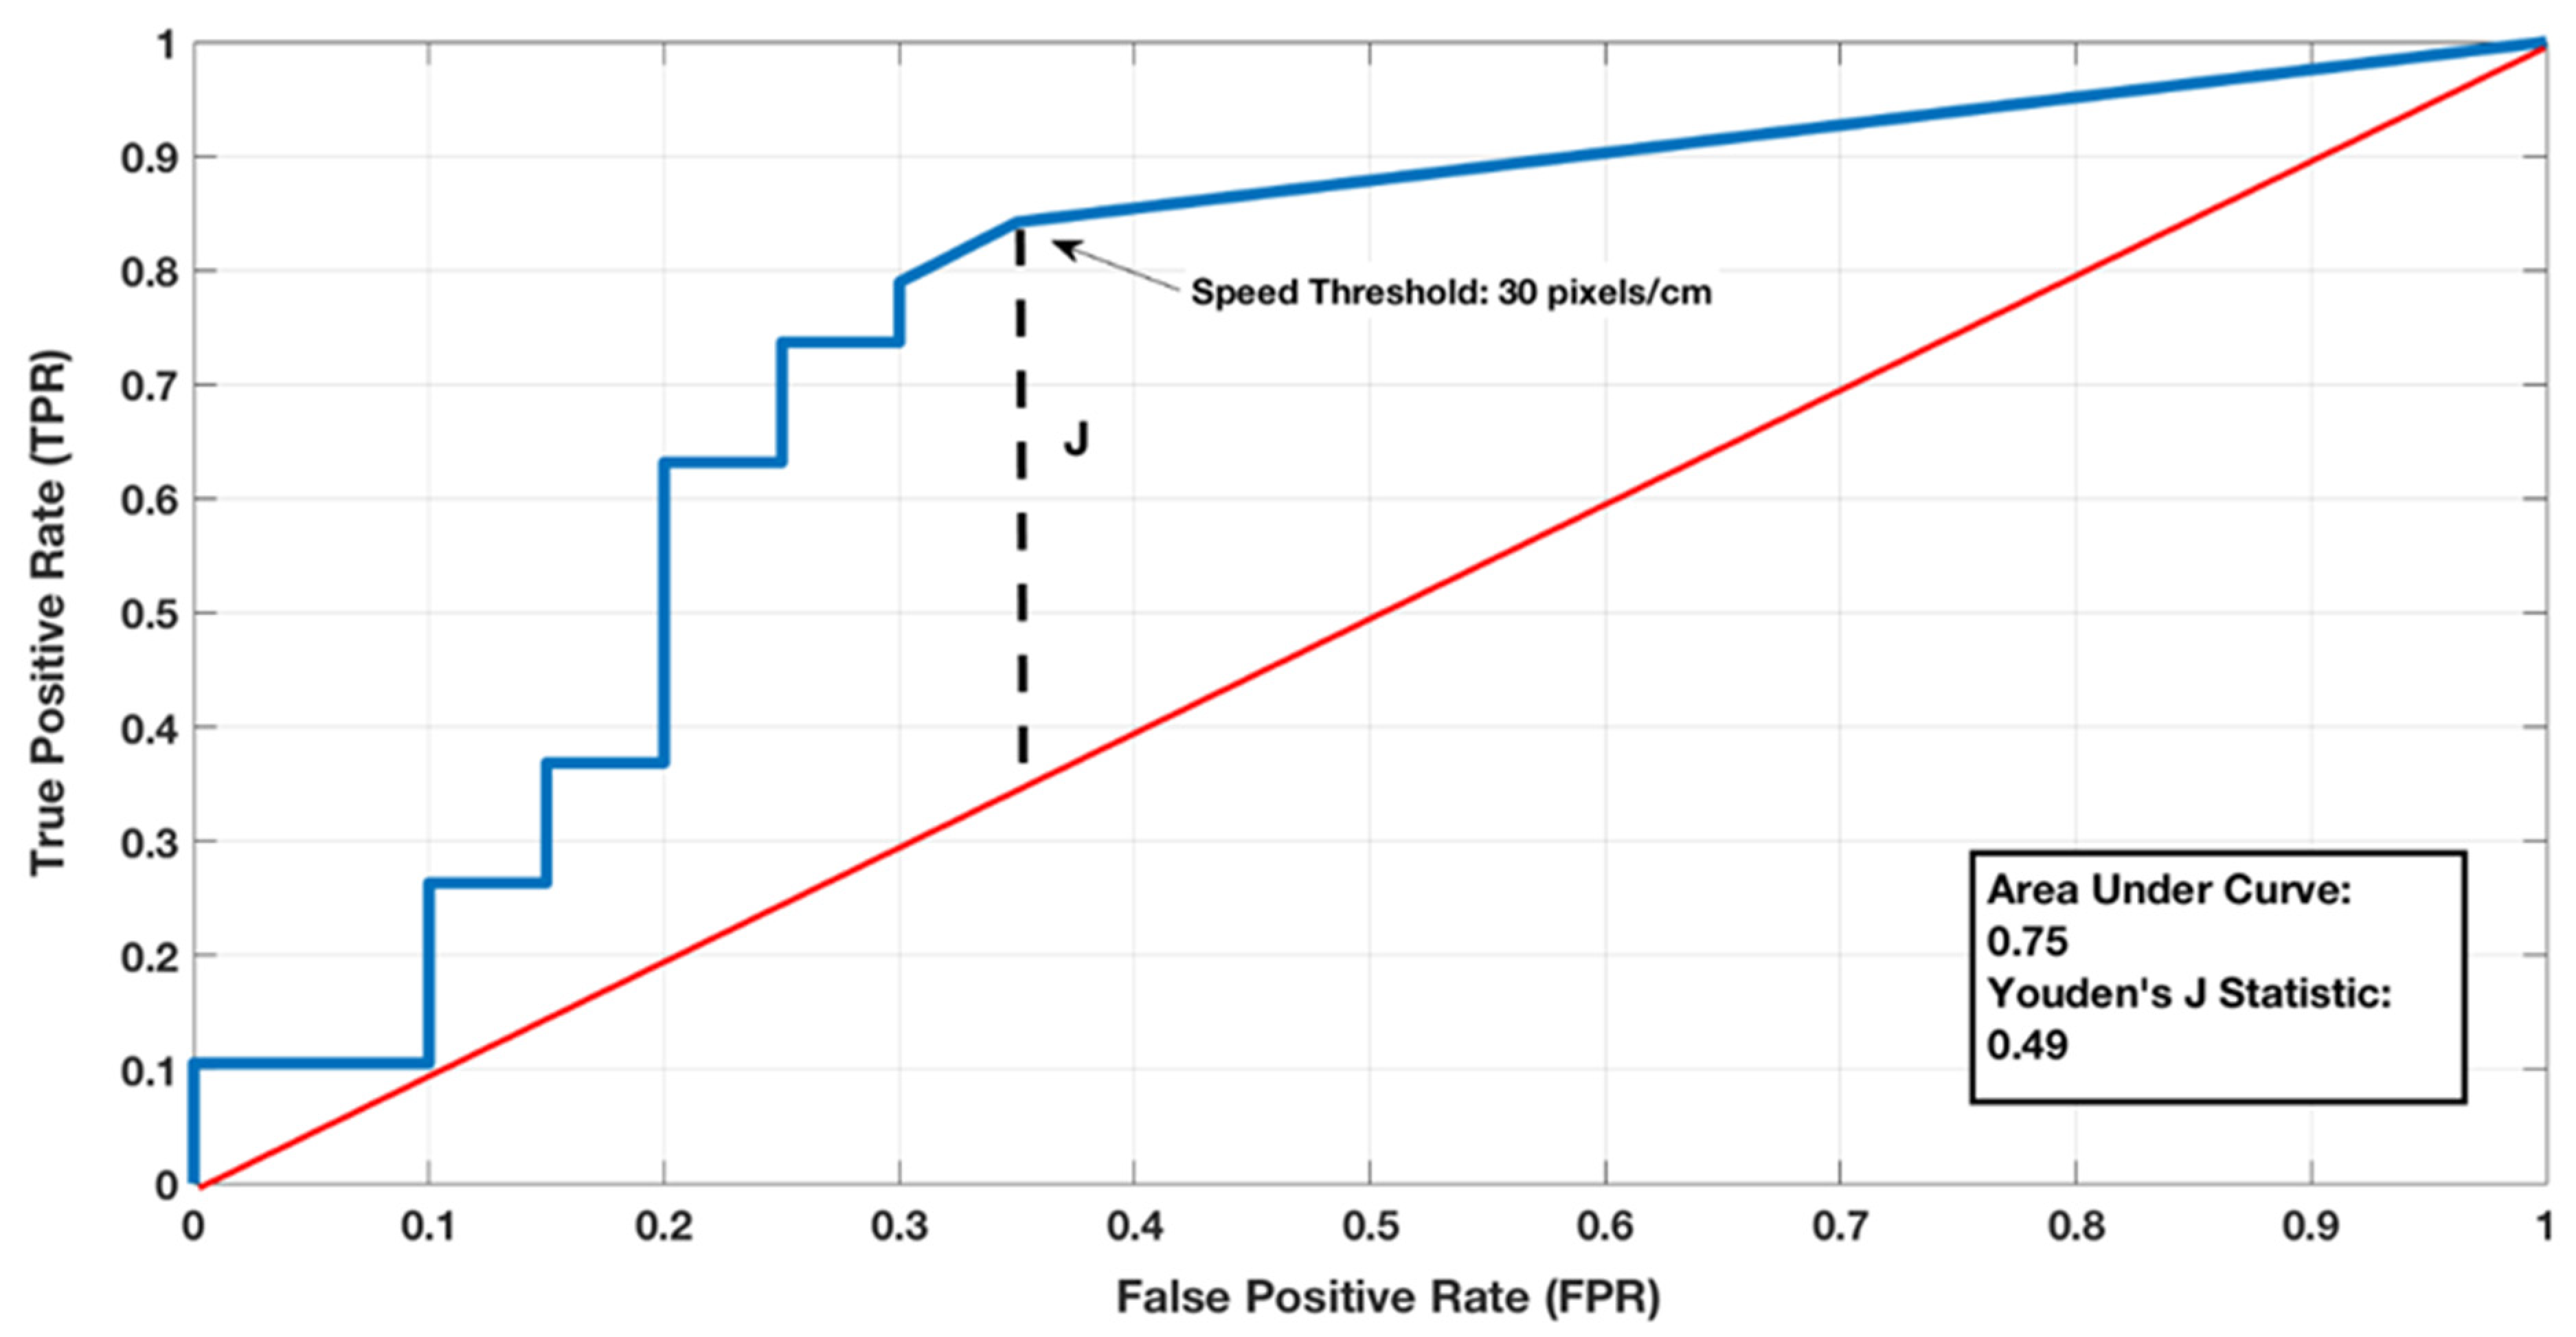
An example ROC curve is given for a single trial, with a reasonably large area under the curve (AUC) (AUC = 0.75) and a Youden’s J statistic of 0.48 (Figure 4). A J-value of 1 would show that there are no false positives or negatives, whilst a value of 0 would mean that the user was not able to predict anything correctly. Figure 5 compares the AUC computed for each of the six conditions.
The results in the figure indicate a similar trend as shown for the percentage of correct responses. The ANOVA showed there was a significant difference between the mean AUC for the two within-factors and the interactions: distance factor, F(1,13) = 9.127 (p= 0.01); speed factor, F(1,13) = 29.048 (p= 0.0001); interactions factor, F(1,13) = 11.273 (p = 0.005). The largest significant differences (p < 0.1) were found between the different speed conditions in the far distance condition, and solely between the two slow conditions of both distances. It is worth noting that the fast–far condition, which scored the lowest in the far distance condition, had a significant difference with the slow–close condition. Similar to the percentage of correct responses, there is only a significant difference between the slow and fast speeds in the close distance condition.
3. Discussion
The results show that varying the conditions had a significant effect on the percentage of correct responses and the area under the curve (AUC) from the receiver operator characteristic (ROC). However, there were no significant differences between conditions in the delay of responses. The testing of the effectiveness of the tactile feedback device culminated in understanding whether or not the stimulus that was delivered was being sensed accurately (sensitive and specific) and with a delay in the user response that would be considered as suitable for integration with everyday tasks. This was explored while understanding the effects of changing the parameters of the driver magnet (DM).
As seen from the results above, the device is able to deliver a stimulus that was sensed with a minimal delay in response, averaging around 0.5 seconds. This, along with a relatively high average score in the percentage of correct responses (73.9%), is a compelling indicator of the magnetic-driven tactile device’s ability to induce a timely tactile response from the user. As for the ROC analysis, the averages for the AUC also fall within the ~0.75 value, which is a high value that signals the sensitivity and specificity of the device; therefore, it can be concluded that the user is able to react to the devices stimuli accurately (sensitive) and also precisely (specific). The results show that the majority of users are able to respond to the device due to a sensed input and not random guessing. It is also clear that for some users, the device was extremely effective in delivering a stimulus, and the user was able to respond perfectly to the contact stimuli. The averages in AUC and percentage of correct responses are relatively comparable to other tactical/haptic devices that deliver a similar stimulus. Antfolk et al. reported an average of ~85% with able-bodied users with regards to identifying the correct spatial location of a tactical stimulus [18].
As seen in the results section above, there is a clear significant difference between varying the control parameters and the effectiveness in response. Specifically, this difference is manifested in changing the speed from slow to fast. The medium speed does seem to have some difference, but not as strong as between the slow and fast speeds. Furthermore, it is clear that the magnetic field strength does not play such an important role in the effectiveness of the device in delivering a stimulus to the user. This can be seen in both the AUC and percentage of correct response results; while there are some weak significant differences, they is not strong and can be mostly attributed to the large standard deviation, due the comparison between different users. From the perspective of the device, the distance between the magnets is supposed to affect how responsive the stimulus magnet (SM) is in rolling when the DM moves above it. The issue however, seems to be in the way that the SM is attached to the user, which is through the band. The reason there is an overall trend of the closer situation scoring lower is due to the stronger attraction between the magnets, which causes the SM to be pulled further away from the skin; hence, while the magnet rolls it indents the users’ skin less, and therefore a weaker stimulus is sensed. This highly relates to the modeling of the rolling vs. sliding action of the SM when the DM moves, which is vital in understanding the kind of forces that act on the skin. Models that have been developed that incorporate displacement [19] and force [20] as an input can be used to predict the neural spike train, given such rolling vs. sliding inputs as an experiment. Based on such an outcome, it is probable that slow adapting 1 and 2 are the two main types of receptors that are being triggered by the stimulus, as the rolling of the magnet is ultimately indenting the skin (rolling with the edge) and also partially stretching the skin (sliding on the skin).
One important clarification is that the standard deviation for most of the data sets is quite large. This is due to the fact that each of the conditions consists of a combination of different factors from different user trials, and this creates very high variability in the performance of the tactile feedback device. This can be explained by the small sample size. Therefore, the trends between varying parameters are less clear, as the issue of robustness and repeatability across users becomes a strong factor in deciding the statistical inference.
The delay in response seemed to be quite small and with a positive ~0.5 second reaction time, meaning that even before the magnet reaches the optimal point to cause a reaction, the user had already sensed a movement and reacted. While there is no significant difference between the different parameter combinations (mostly attributed to the large SD in the samples), the fast DM speed for both distances has an average delay value that is much lower than the total average, and is closer to the zero mark. This quantitatively means that the users do not respond in the fast case as quickly as for the other two speeds. This is explained by the simple fact that the DM reaches the midpoint (which is the reference point for calculation the delay in response) a lot quicker than in the other cases, and hence the user has less time to sense the initial rolling before the midpoint, so it takes them more time to respond.
The use of the ROC analysis proved useful, and specifically the use of the Youden J statistic to understand the informedness of the user as they make a prediction about the motion of the magnet. A score of 50% or 0.5 AUC would indicate that the user is randomly moving; this can be seen in Figure 6 below.
The users clearly hold still during the experiment, as they might have not sensed anything; in the case shown in Figure 6, the Youden J statistic was calculated as 0.05, which is very close to 0, and the percentage of correct responses was ~51%. Even though such a score might indicate that the users guessed half the states of the SM right, it is in fact simply the score from getting all the stopping states right, as the user was still most of the time. Therefore, with the Youden J statistic it becomes clear that this 51% score does not constitute any useful score of sensing effectively.
It is worth noting how the current experimental system adopts a continuous method of delivering a stimulus compared to a discrete binary approach. By continuously sending a stimulus to the user and randomly inputting delays that break the stimulus pattern, we ensure that the user is not simply guessing whether or not they sensed a stimulus, and hence the statistic of them responding is completely independent of their ability to guess the correct response by the simple notions of probability. This is an important feature in the experimental design, as it is more reflective of how the user receives tactile information in real-life situations. Another major feature that must be kept in consideration is the period in which the user senses a stimulus versus the period waiting for a given stimulus. In most real-life situations, the patient would receive a lot of information in short periods, and would have longer periods of being idle without any stimulus being delivered. This is an important concept in matching what is realistically expected by the users’ brain.
In conclusion, the experiments support the hypothesis of being able to effectively deliver a stimulus using magnetic field interactions. While it can be concluded that the slow parameter setting has a higher effectiveness in delivering a stimulus, the issue of having a small data set and not enough trials with each user experiments makes it difficult to conclude what the effects of the distance between the magnets is. Additionally, understanding the rolling mechanism better with regards to modeling the magnetic field and its effect on the motion of SM would help shed light on the kind of stimulus that can maximize the sensation and response from the user. Future works that further experiment with different frictions and creating an array of magnets in a miniaturized system promise to be a fruitful step towards development of a tactile feedback device that is able to deliver a sophisticated and matched sensation, which can be coupled with a trans-radial amputees’ prosthetic through the use of tactile sensors [21] to aid in sensation restoration for dexterity.
4. Materials and Methods
4.1. Rig Development
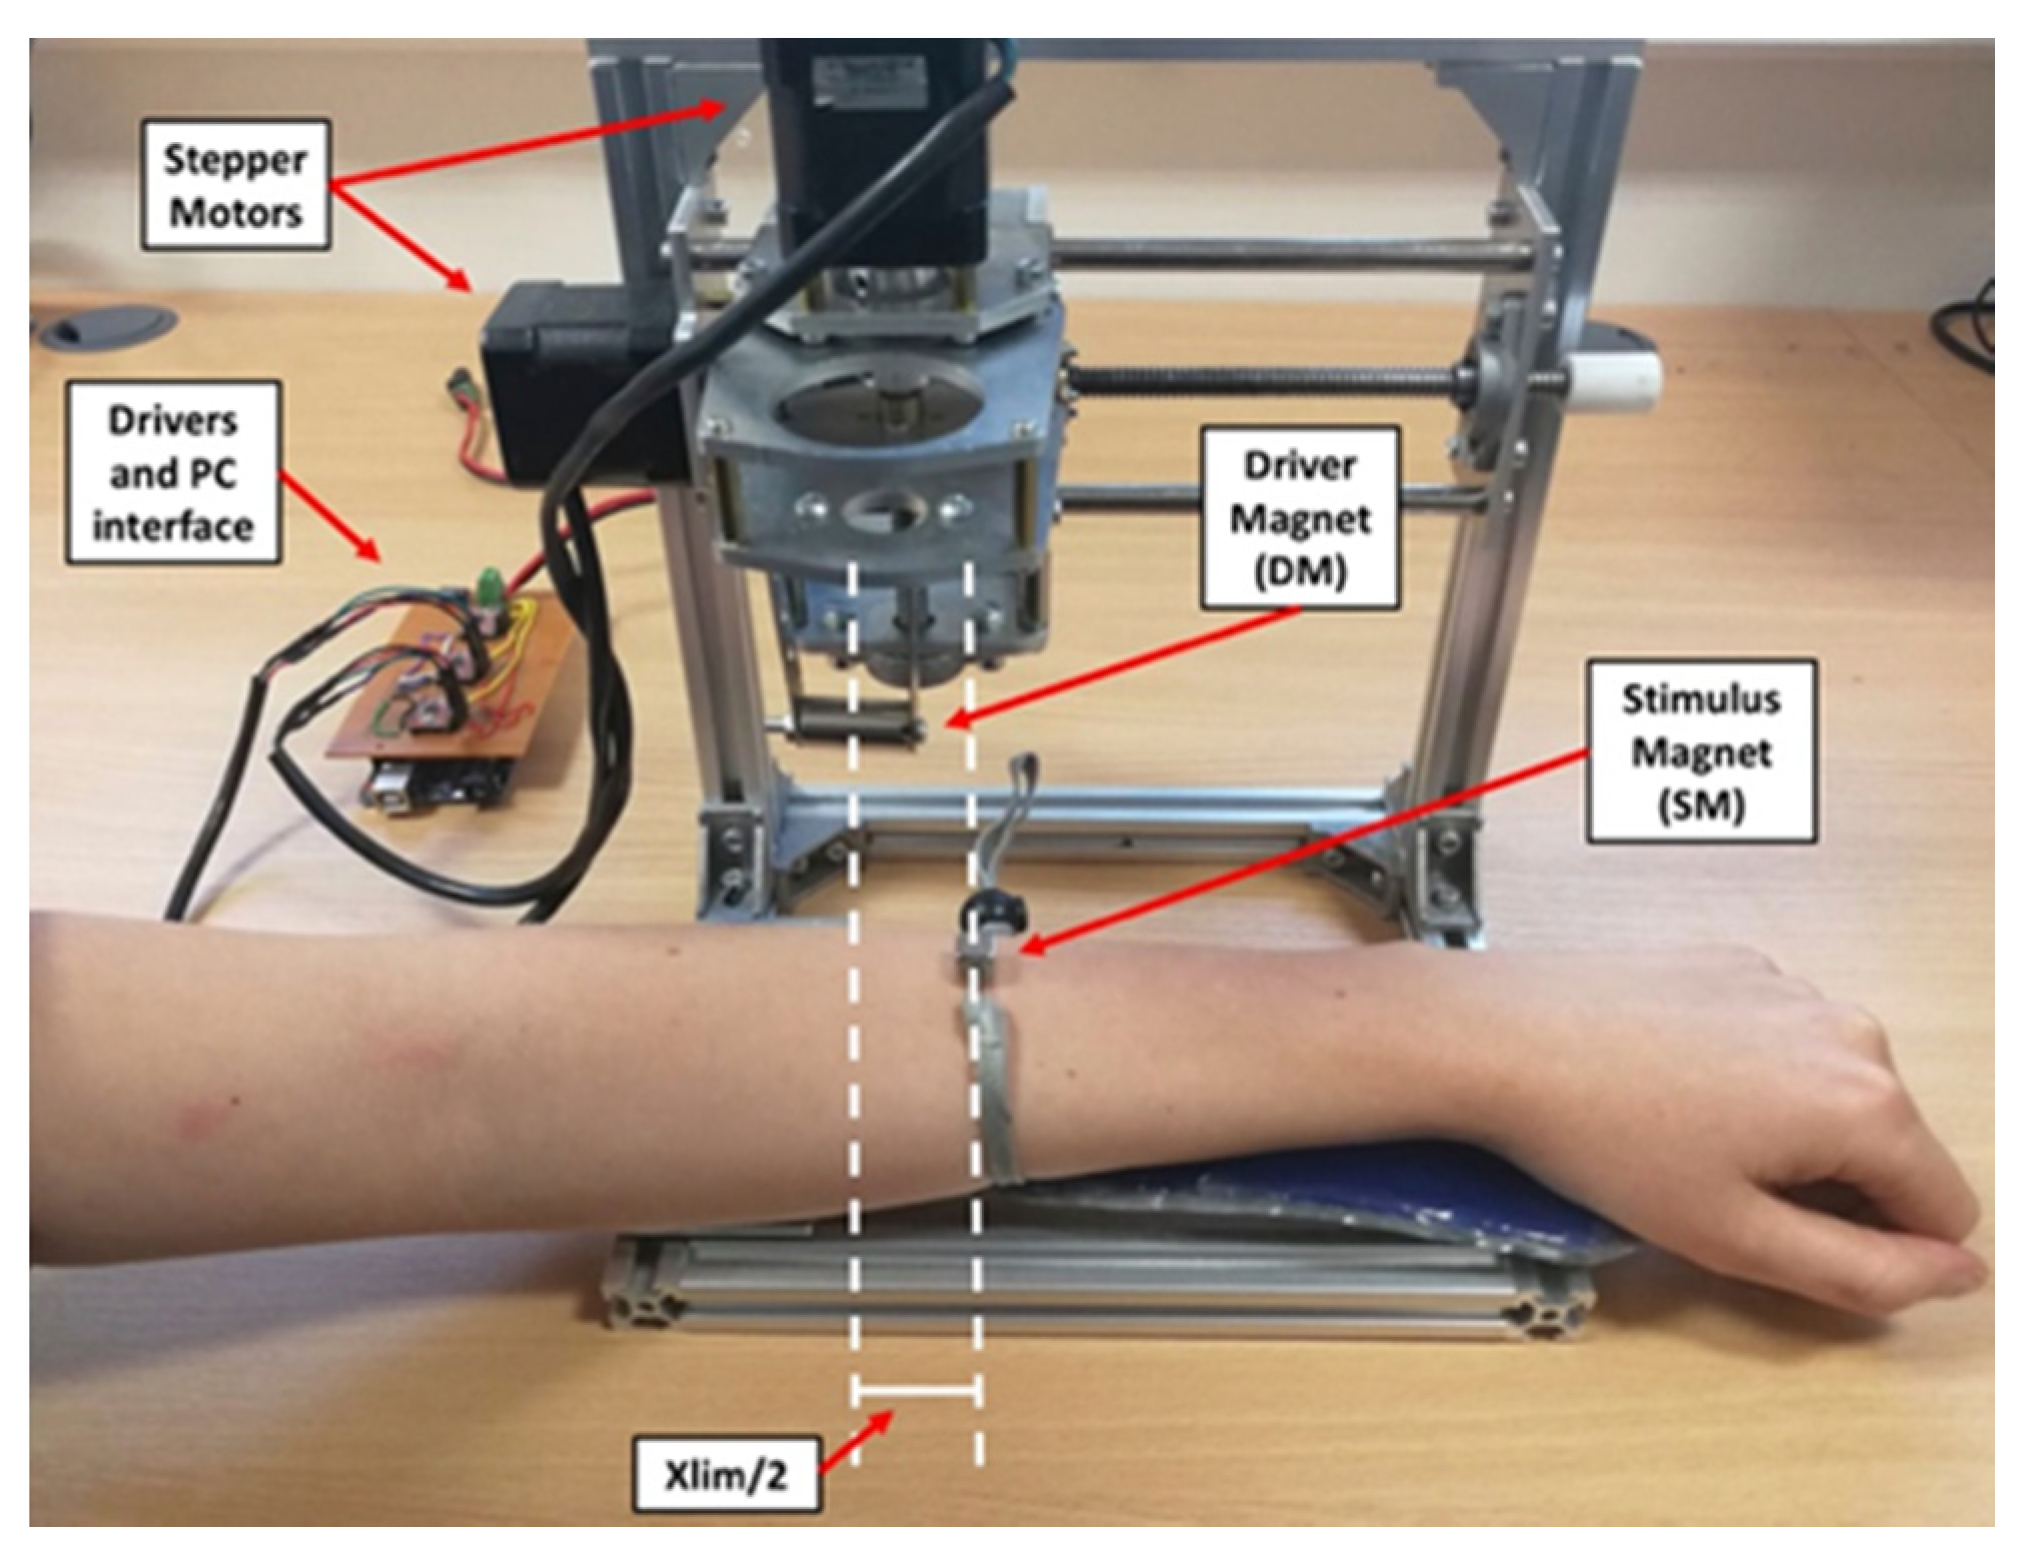
The rig was developed to control the position of one (driver) magnet, in order to subsequently change the magnetic field in which the second magnet, which was in contact with the skin, was located. The test rig was constructed from aluminum alloy, as aluminum is not ferromagnetic. The main objective of the rig was to position the driver magnet across two dimensions. Positioning took place within the plane that included both the driver magnet (DM) and stimulus magnet (SM). The motors on the rig were used to control the DM across the horizontal (x-axis) and vertical (y-axis) dimensions that made up the plane. Figure 7 presents the motion of the magnets on the skin. Figure 8 presents the real device, with a user in the correct position during operation.
4.2. Specifications
The main specifications were the speeds at which the DM moved; the spatial resolution, in terms of positions that the DM could achieve; and the boundaries in both the vertical and horizontal directions. The speeds could be set ranged between 5 mm/s to 20 mm/s. The total distance the DM could travel was 60 mm in the horizontal direction and 30 mm in the vertical direction. This was enough to ensure that no observable magnetic effect would be present at the minimum and maximum positions in the x-direction. Each step of the motor provided a 2 mm displacement of the DM.
4.3. System Design
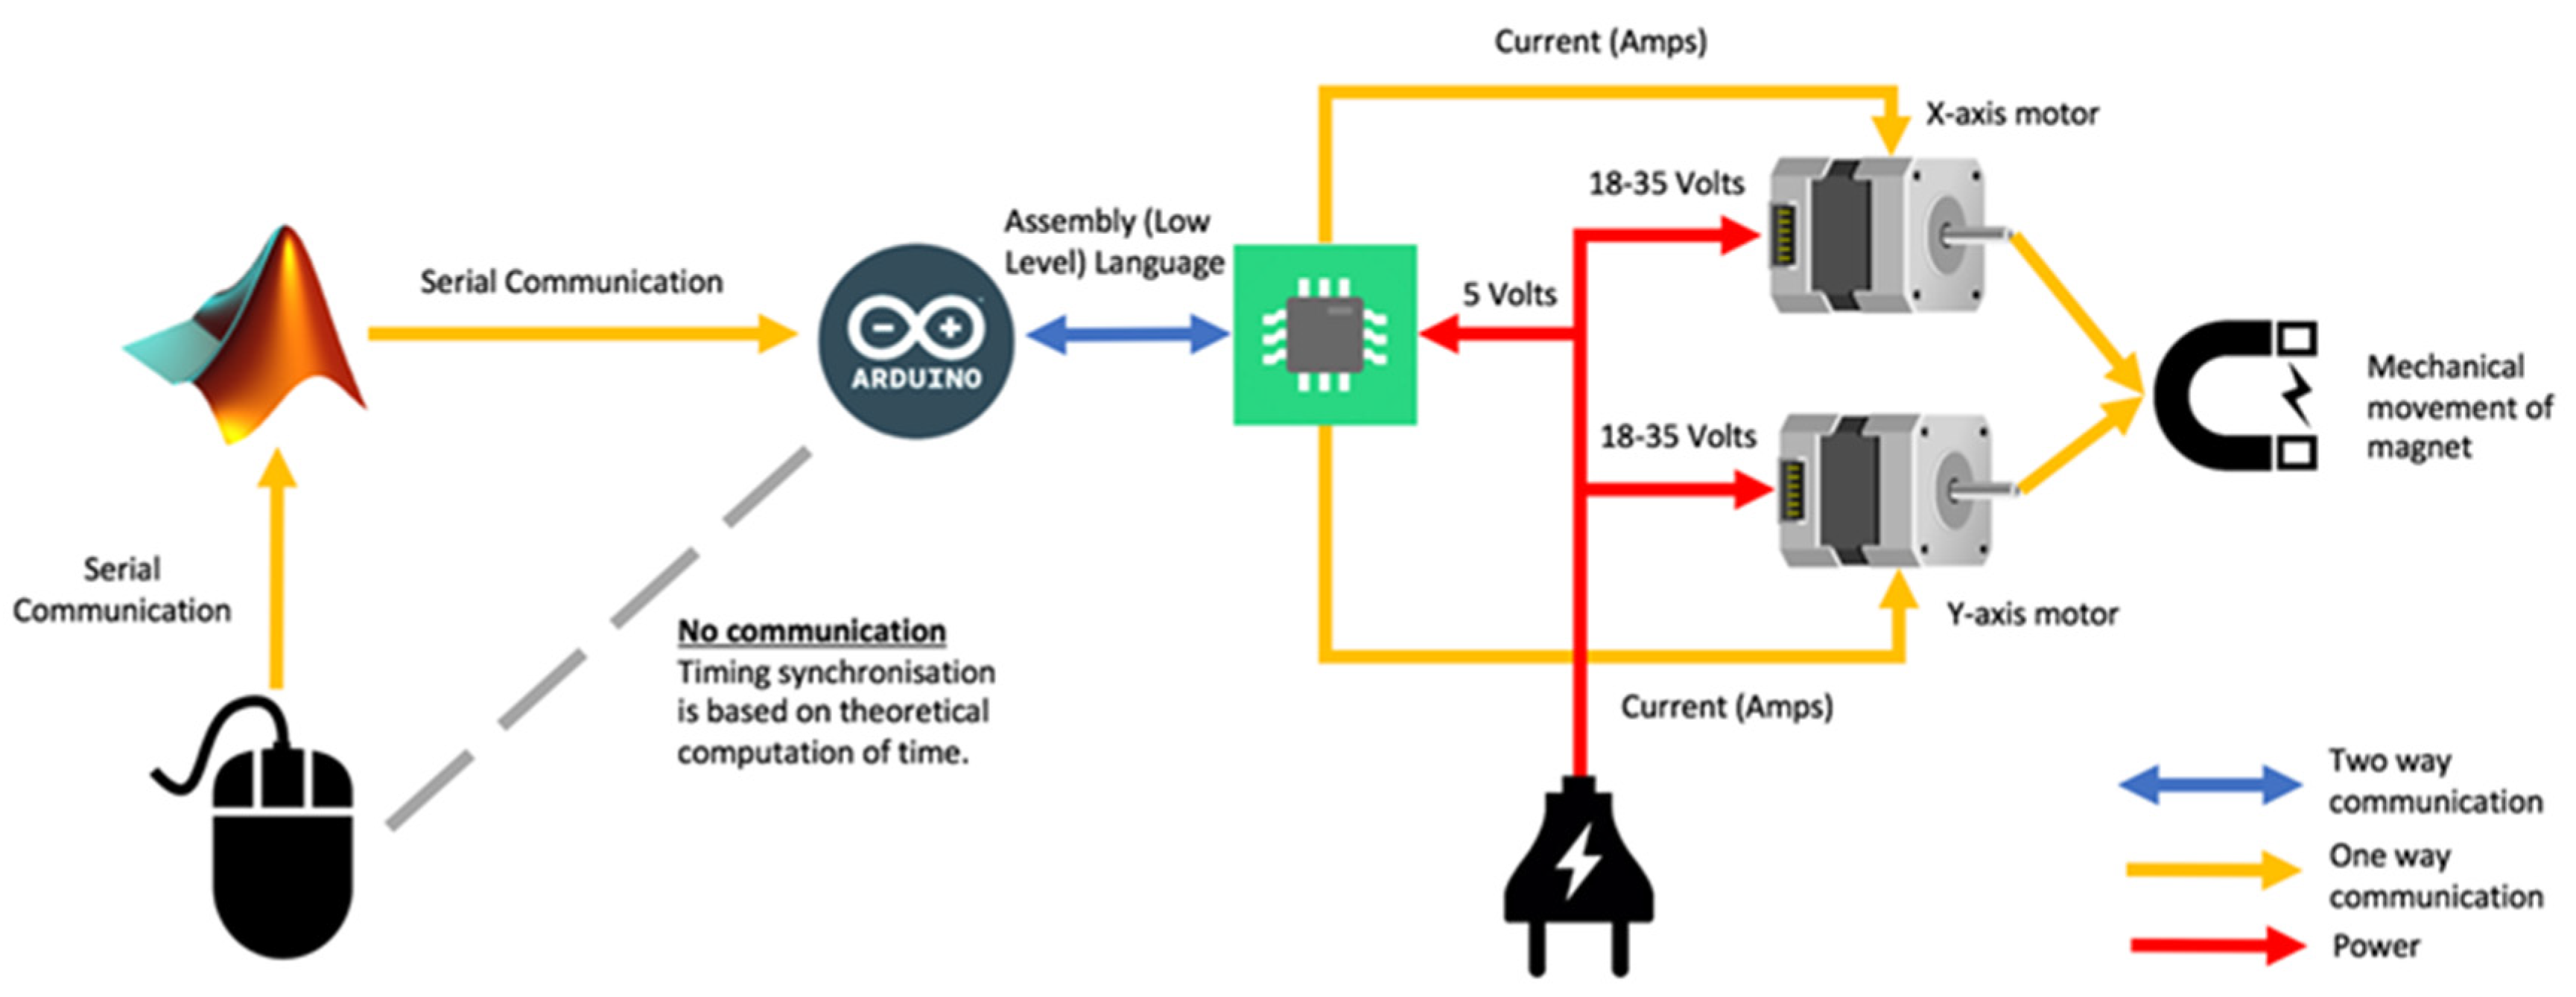
Two stepper motors (17HS4406A-20PB20, EVMJGroup, China), each with a step angle of 1.8 degrees, were used to change the location of the DM by using open-loop positioning. The motor was connected to a threaded output shaft, making it a linear actuator. The stainless-steel shaft had a diameter of 8 mm and a pitch of 2 mm. The travelling nut had four mounting holes that were connected to the slider plate that held the DM. The stepper motor allowed the system to hold and move the DM to a desired position. Each phase of the stepper draws 1.3 A and provides a holding torque of 40 N-cm. Two rods on either side of the threaded shaft were used to keep the driver plate in the right orientation. The rods were lubricated using lubricant, in order to minimize any friction during motion. The motors were driven by an Arduino (Uno Rev3, Arduino.cc, United States), which is a microcontroller board based on the ATmega328P. All the programming done to the microcontroller was done in C++, and was compiled using a custom Arduino IDE. Power to the motors was also relayed through the Arduino. A custom shield created allowed for the interfacing of the drivers with the Arduino in MATLAB (R2017a, Mathworks, United States) through the serial port. Finally, the power supply unit ensured a maximum of 35V could be delivered to the motors; the power supply unit was connected to the Arduino. Figure 9 below depicts the system design and flow of information.
4.4. Experimental Protocol
The experimental protocol was designed to test the ability of the system to deliver a correctly sensed stimulus to the user. The input to be delivered was the motion of the SM caused by the movement of the DM. The SM was allowed to move freely on the arm, induced by the DM’s magnetic field. The location of the band worn by the subject was chosen to be the upper end of the lower arm, just below the elbow joint and on the posterior face of the limb. The user was instructed to move the mouse back and forth in a vertical direction when they sensed the magnet move, and keep the mouse still when they sensed nothing. The mouse positions were tracked and recorded using tracking of the cursor position with MATLAB.
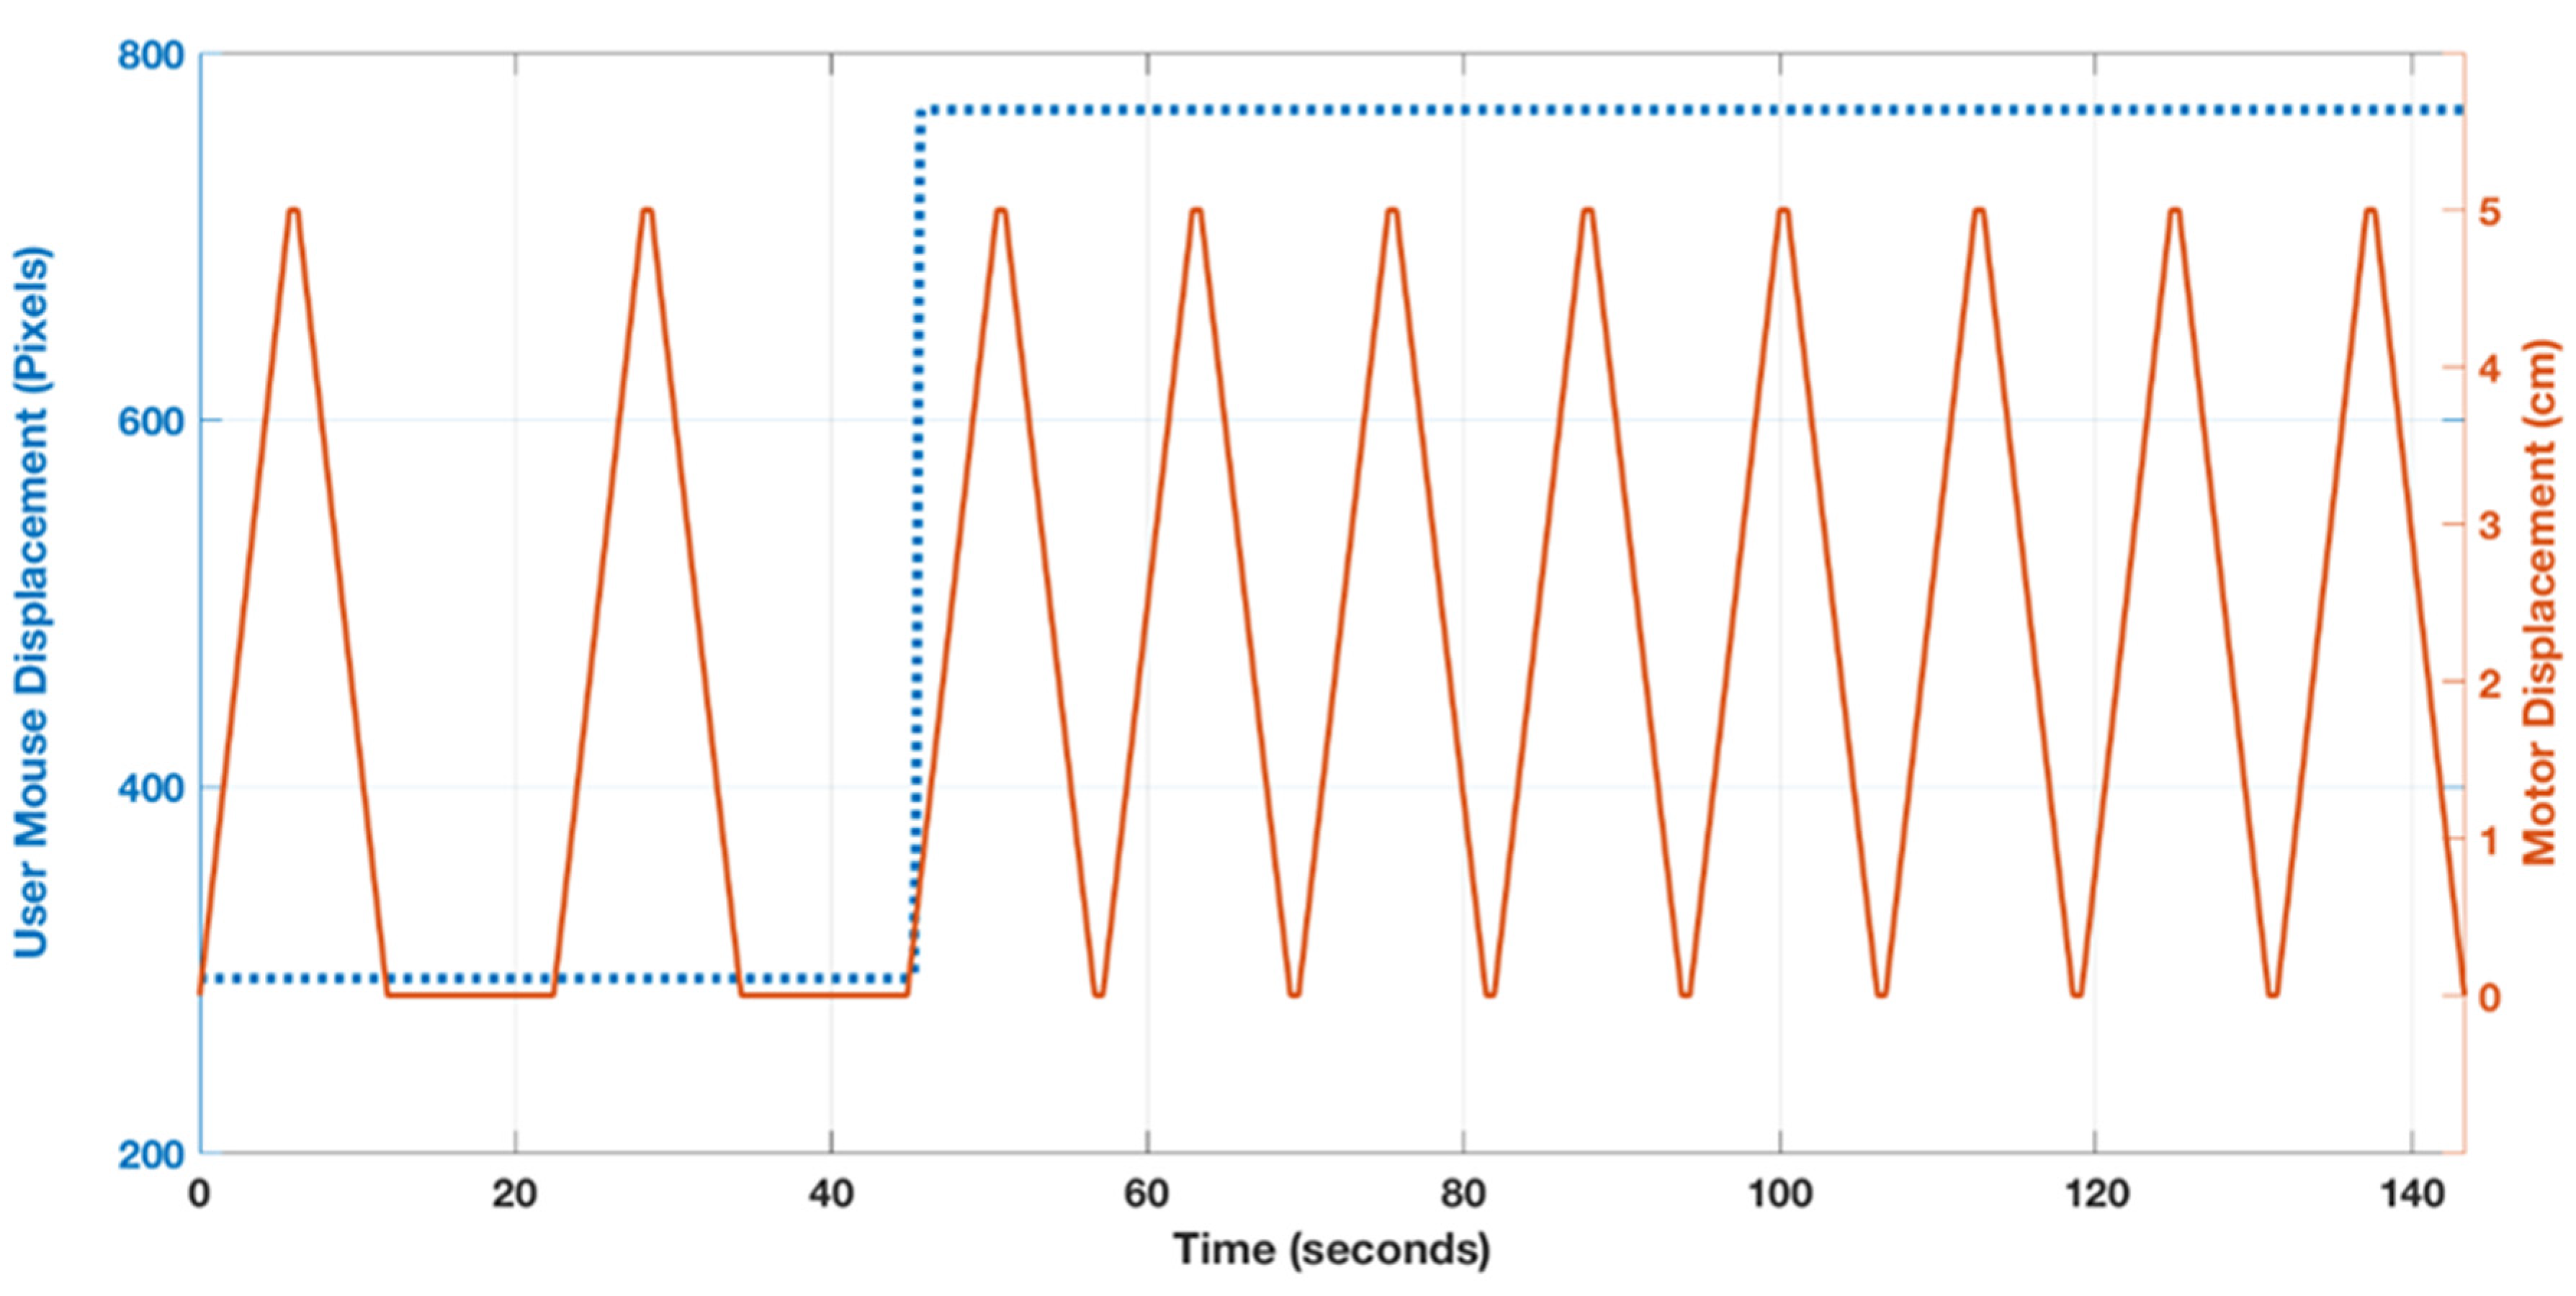
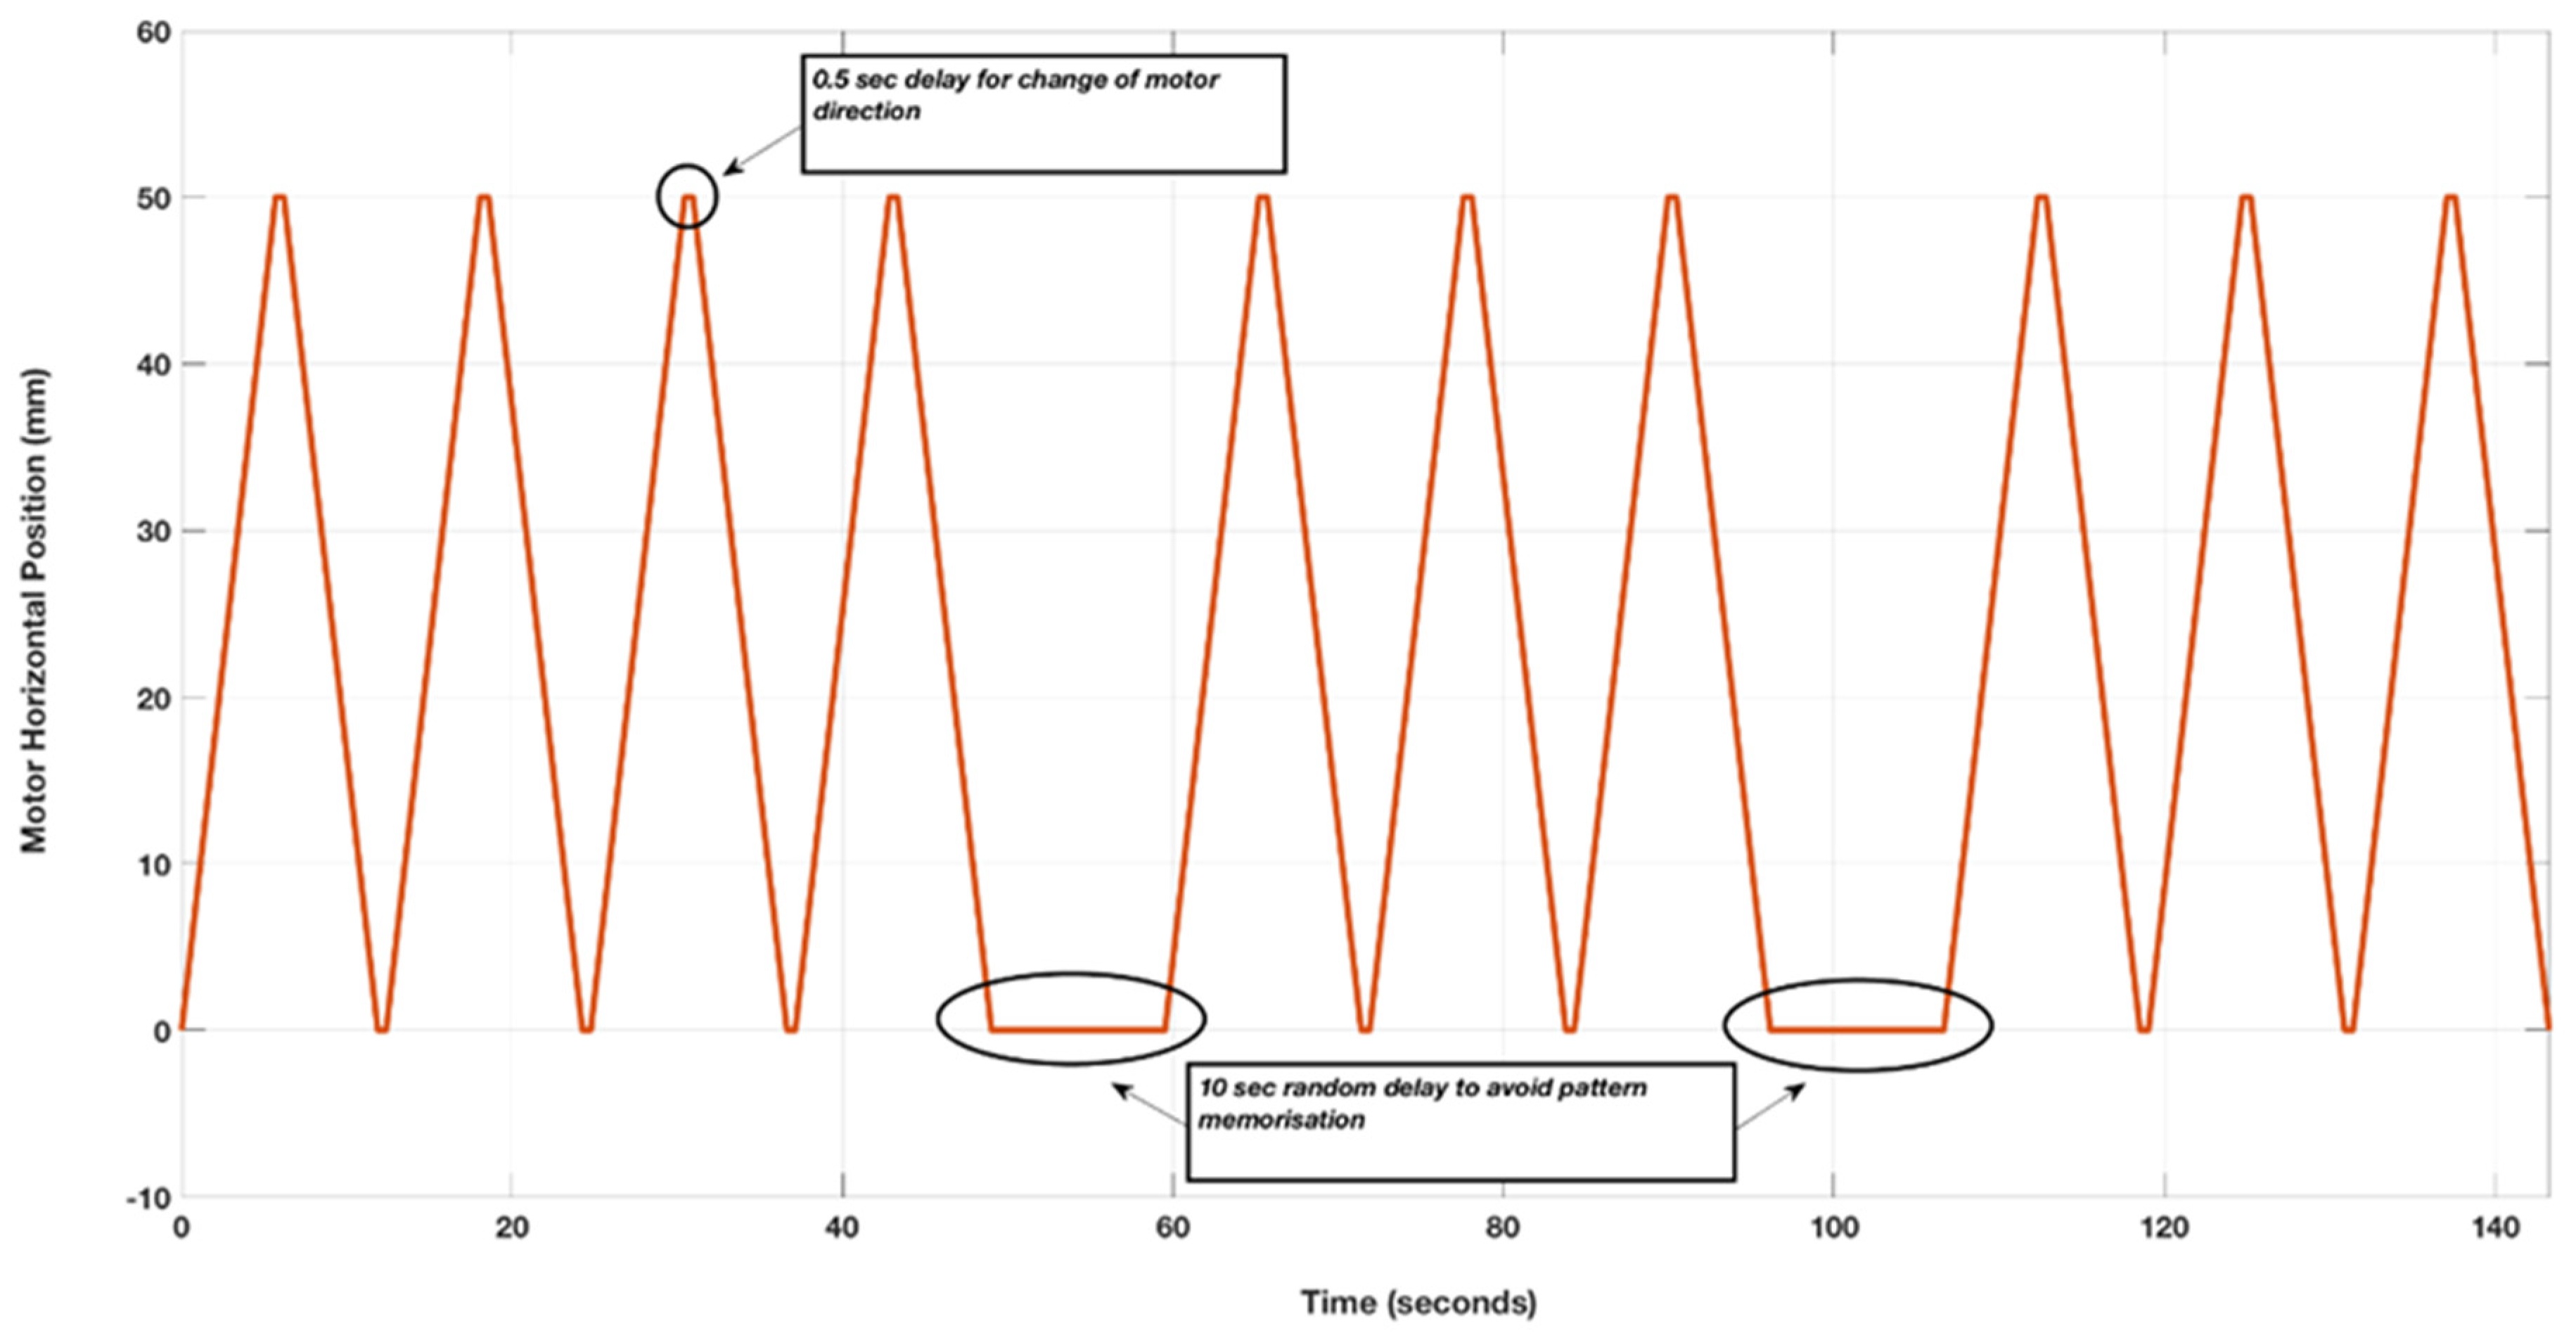
The inputs given to the users were generated randomly, and various controls were added to avoid biased outputs caused by the users learning the input patterns. This was done by randomly adding 10 second delays during the motion of the DM. To control the inputs delivered to the user, two different parameters were changed, giving a total of six different possible input conditions that a user could receive. The two parameters were the speed of the driver magnet (5, 10, or 20 mm/s) and the two distances between the magnets. The closer distance was calibrated for each user, having the distance set as close as possible without the magnets making contact when aligned in the vertical direction. The subsequent further distance was set by increasing the calibrated vertical distance by 5 mm. The speed of the DM dictates how quick the stimulus magnet moves in response to change in the magnetic field, while the vertical distance between the magnets during the smallest Euclidian norm reflects an offset of the magnetic field. These simple manipulations of the magnetic field will have consequences in terms of the movement of the SM and the experienced user stimulus. Figure 10 depicts a graph that shows an example of how the driver magnet was moving with time. For each trial, 10 peaks (each peak is the driver magnet going to end of the vertical distance that was defined and back) were fixed, and 10 second delays were inserted at random time points. The six experimental conditions were defined as thus: slow–far (5 mm/s and +5 mm vertical distance), medium–far (10 mm/s and +5 mm vertical distance), fast–far (20 mm/s and +5 mm vertical distance), slow–close (5 mm/s and +0 mm vertical distance), medium–close (10 mm/s and +0 mm vertical distance), and fast–close (20 mm/s and +0 mm vertical distance).
4.5. Participants
A total of seven subjects were recruited: four males and three females. The average age was 25.5 years, and the age range was between 22–36 years. Ethical approval was obtained for this study (MS-IDREC-C1-2015-157). Each user performed 12 trials in their experiment, lasting for around 36 minutes total. The users were not able to see or hear the system as it operated, in order to minimize any sound or visual clues.
4.6. Data Processing and Statistical Analysis
All of the data gathered from the mouse position was processed and analyzed as shown in Figure 11. The first step was to remove the artifacts in the mouse position data, which were caused by the mouse position being limited to the screen dimensions. This produced artifacts that were created due to the internal ceiling function caused by the limit of the screen dimension, which had to be corrected before the forward difference quotient was computed. The artifacts were removed by applying a ceil onto the data points and adjusting any values above the maximum dimension to the ceil value. The position signal was then differentiated to identify when the mouse was moved by the user. The forward difference quotient was computed by
with x representing the vertical mouse position, i ranging from 1 to the maximum length of the dataset (n), and as the time difference between the collected data points. The data was split into bins that were used to differentiate between a “movement” or “no-movement”, based on a threshold method described below. This information was used to score whether the users’ responses correctly matched the state of the SM. A receiver operating characteristic analysis was conducted to obtain the optimal threshold that would give the highest accuracy from the experimental data. The true positive (TP) values were computed as the instance when the user moved while the magnet moved. The true negative (TN) was the instance when the user was not moving, as the magnet was still. A false positive (FP) was the instance when the driver magnet was not moving, but the user was moving. Finally, a false negative (FN) was the case when the user was not moving, but the magnet was moving on their skin. The true positive rate (TPR) and false positive rate (FPR) were computed with varying thresholds for the amplitude of , in order to determine intentional user movement, which is defined as when the value was higher than the proposed threshold. The threshold that gave the largest Youden J Statistic was then used to compute the percentage of correct responses and the delay in response. The Youden J statistic (also known as Yuden’s Index) is the probability of an informed decision rather than a guess [22]. The selection of a good threshold that constitutes an intended change in position is important, as it directly determines the scores each trial achieved.
The delay in response was computed based on the time difference between the user moving the mouse (the threshold of what constitutes a movement was computed from a receiver operator curve) and the time when the DM was aligned with the SM in the vertical direction. A positive difference indicated a late response, and a negative value was interpreted as an early response. The approach taken to compute the delay is visualized in Figure 12. The halfway point is where the attraction is strongest between magnets and causes a rotation.
A total of six different conditions (three speeds × two vertical distances) were compared for within-subject factors using a two-way, repeated-measures ANOVA to test for statistically significant differences. Normality was tested using a Lilliefors test [23], and the ANOVA was conducted on all six conditions. The following three alternative hypotheses were tested in a sample population of healthy users:
- There a significant difference between conditions in the percentage of correct responses;
- There a significant difference between conditions in the delay of response time;
- There a significant difference between different conditions in the area under the curve (AUC) from the receiver operator curve (ROC).
The AUC of the ROC represents the accuracy of the users’ predictions for a given condition. If the ANOVA’s null hypothesis was rejected, a paired t-test post-hoc test with a Bonferroni correction method was conducted [24].
5. Limitations and Future Works
There are various issues that limited the scope of this study and the accompanying statistical findings. Firstly, due to the small sample size, it was relatively difficult to conclude much about changing the parameter (distance between magnets). This will be addressed in future experiments to ensure a more reliable inference. Additionally, for each user there existed only two repeats for each different set of combinations; this was a limitation, because no statistical analysis regarding the effects of changing parameters could be tested within a single users’ experiment. Therefore, all the tests comparing the effect of parameter choice was based on a sample from various users. This is an issue because it does not remove the factor of differences between each users’ overall tactile sensation. Furthermore, there was a limitation with the SM band design and the magnetic attraction caused by changing the distance between the DM and SM. While the tightness of the SM magnet in the band around the users’ arm was ensured to be tight enough to maintain contact between the SM and the skin, the stronger attraction in the close scenario had an effect on this assumed contact between the SM and the user’s skin. Future designs will address this issue, in order to ensure that it does not have a role in the stimulus. This also relates to the issue of the rolling vs. sliding motion of the SM. A model must be created to exactly understand how the DM causes the SM to move, and the parameters that control the SM’s movement must be well described to ensure the desired input to the skin is being delivered. The time delay of the response can be affected by manipulating the intensity of the magnetic interaction between the DM and SM. Moving on, the design of the rig caused issues with some users sensing vibrations in the environment as the motor was moving in the slow speed. This is an issue because the user should not sense any movements except that of the SM induced by the DM; it will be addressed in future prototypes by changing the motors and adding damping components. Future works will also include exploring the friction between the skin and the SM, in order to understand how the sensation would change as the friction increases and decreases. This is an important concept, as the skin will be stretched in different ways, and hence the afferents will fire and respond differently. Finally, in future experiments, accounting for the “leaking” of user responses from a previous stimulus that might come as a true positive for the wrong stimulus has to be considered. In other words, it is important to understand whether a response was caused due to the current stimulus, or if it was a delayed response from an older stimulus.
This study showed that the magnetic interface can be optimized for stimulus detection, and that more research is needed to further improve the detection rate beyond the established level.
Author Contributions
Conceptualization, F.A., M.S.T. and J.H.M.B.; Methodology, F.A., M.S.T. and J.H.M.B.; Pilot-testing, F.A. and J.H.M.B.; Formal Analysis, F.A.; Data Curation, F.A. and J.H.M.B.; Writing – Original Draft Preparation, F.A.; Writing – Review & Editing, F.A., M.S.T. and J.H.M.B.; Visualization, F.A.; Supervision, M.S.T. and J.H.M.B.; Project Administration, J.H.M.B.; Funding Acquisition, J.H.M.B. and M.S.T. All authors have read and agreed to the published version of the manuscript.
Funding
This research was funded by UK Research and Innovation (UKRI) internal grant from the Global Challenges Research Fund (GCRF) and the EPSRC Impact Acceleration Account Award grant number [EP/R511742/1]. The APC was funded by MDPI.
Conflicts of Interest
The authors declare no conflict of interest.
References
- Waris, A.; Niazi, I.; Jamil, M.; Gilani, O.; Englehart, K.; Jensen, W.; Shafique, M.; Kamavuako, E. The effect of time on EMG classification of hand motions in able-bodied and trans-radial amputees. J. Electromyogr. Kinesiol. 2018, 40, 72–80. [Google Scholar] [CrossRef] [PubMed] [Green Version]
- Biddiss, E.A.; Chau, T.T. Upper limb prosthesis use and abandonment: A survey of the last 25 years. Prosthet. Orthot. Int. 2007, 31, 236–257. [Google Scholar] [CrossRef]
- Johnson, K. The roles and functions of cutaneous mechanoreceptors. Curr. Opin. Neurobiol. 2001, 11, 455–461. [Google Scholar] [CrossRef]
- Johnson, K.; Yoshioka, T.; Vega-Bermudez, F. Tactile functions of mechanoreceptive afferents innervating the hand. J. Clin. Neurophysiol. 2000, 17, 539–558. [Google Scholar] [CrossRef] [PubMed]
- Edin, B.B. Quantitative analysis of static strain sensitivity in human mechanoreceptors from hairy skin. J. Neurophysiol. 1992, 67, 1105–1113. [Google Scholar] [CrossRef] [PubMed]
- Olausson, H.; Wessberg, J.; Kakuda, N. Tactile directional sensibility: Peripheral neural mechanisms in man. Brain Res. 2000, 866, 178–187. [Google Scholar] [CrossRef]
- Srinivasan, M.A.; Whitehouse, J.M.; LaMotte, R.H. Tactile detection of slip: Surface microgeometry and peripheral neural codes. J. Neurophysiol. 1990, 63, 1323–1332. [Google Scholar] [CrossRef]
- Macefield, V.G.; Hager-Ross, C.; Johansson, R.S. Control of grip force during restraint of an object held between finger and thumb: Responses of cutaneous afferents from the digits. Exp. Brain Res. 1996, 108, 155–171. [Google Scholar] [CrossRef]
- Brisben, A.J.; Hsiao, S.S.; Johnson, K.O. Detection of vibration transmitted through an object grasped in the hand. J. Neurophysiol. 1999, 81, 1548–1558. [Google Scholar] [CrossRef] [Green Version]
- Li, T.; Huang, H.; Antfolk, C.; Justiz, J.; Koch, V. Tactile display on the remaining hand for unilateral hand amputees. Curr. Dir. BioMed. Eng. 2016, 2, 399–403. [Google Scholar] [CrossRef]
- Markovic, M.; Schweisfurth, M.; Engels, L.; Bentz, T.; Wustefeld, D.; Farina, D.; Dosen, S. The clinical relevance of advanced artificial feedback in the control of a multifunctional myoelectric prosthesis. J. Neuroeng. Rehabil. 2018, 15, 28. [Google Scholar] [CrossRef] [Green Version]
- Marasco, P.D.; Hebert, J.S.; Sensinger, J.W.; Shell, C.E.; Schofield, J.S.; Thumser, Z.C.; Gill, S. Illusory movement perception improves motor control for prosthetic hands. Sci. Transl. Med. 2018, 10, eaao6990. [Google Scholar] [CrossRef] [Green Version]
- Chaubey, P.; Rosenbaum-Chou, T.; Daly, W.; Boone, D. Closed-loop vibratory haptic feedback in upper-limb prosthetic users. J. Prosthet. Orthot. 2014, 26, 120–127. [Google Scholar] [CrossRef]
- Kim, K.; Colgate, J.E.; Santos-Munne, J.J.; Makhlin, A.; Peshkin, M.A. On the Design of Miniature Haptic Devices for Upper Extremity Prosthetics. IEEE ASME Trans. Mechatron. 2010, 15, 27–39. [Google Scholar]
- Hines, L.; Petersen, K.; Lum, G.Z.; Sitti, M. Soft actuators for small-scale robotics. J. Adv. Mater. 2017, 29. [Google Scholar] [CrossRef]
- Erb, R.; Martin, J.; Soheilian, R.; Pan, C.; Barber, J. Actuating soft matter with magnetic torque. J. Adv. Funct. Mater. 2016, 26, 3859–3880. [Google Scholar] [CrossRef]
- Stephens-Fripp, B.; Alici, G.; Mutlu, R. A Review of Non-invasive sensory feedback methods for transradial prosthetic hands. IEEE Access 2018, 6, 6878–6899. [Google Scholar] [CrossRef]
- Antfolk, C.; Cipriani, C.; Carrozza, M.C.; Balkenius, C.; Björkman, A.; Lundborg, G.; Sebelius, F. Transfer of tactile input from artificial hand to the forearm: Experiments in amputees and able-bodied volunteers. Disabil. Rehabil. Assist. Technol. 2013, 8, 249–254. [Google Scholar] [CrossRef]
- Dong, Y.; Mihalas, S.; Kim, S.; Yoshioka, T.; Bensmaia, S.; Niebur, E. A simple model of mechanotransduction in primate glabrous skin. J. Neurophysiol. 2013, 109, 1350–1359. [Google Scholar] [CrossRef] [Green Version]
- Gerling, G.J.; Rivest, I.I.; Lesniak, D.R.; Scanlon, J.R.; Wan, L. Validating a population model of tactile mechanotransduction of slowly adapting type I afferents at levels of skin mechanics, single-unit response and psychophysicis. IEEE Trans. Haptics 2014, 7, 216–228. [Google Scholar] [CrossRef]
- Wettels, N.; Parnandi, A.R.; Moon, J.; Loeb, G.E.; Sukhatme, G.S. Grip control using biomimetic tactile sensing systems. IEEE Trans. Mechatron. 2009, 14, 718–723. [Google Scholar] [CrossRef]
- Powers, D. Evaluation: From precision, recall and f-measure to ROC, informedness, markedness & correlation. J. Mach. Learn. Technol. 2011, 2. [Google Scholar]
- Conover, W.J. Practical Nonparametric Statistics; John Wiley & Sons, Inc.: Hoboken, NJ, USA, 1980. [Google Scholar]
- Hochberg, Y.; Tamhane, A.C. Multiple Comparison Procedures; John Wiley & Sons, Inc.: Hoboken, NJ, USA, 1987. [Google Scholar]
Figure 1.
Top: a user response that deviates from the stimulus input. Bottom: a user response that aligns more with the input.
Figure 1.
Top: a user response that deviates from the stimulus input. Bottom: a user response that aligns more with the input.

Figure 2.
Percentage of correct responses across the six experimental conditions. The mean (crosses) ± standard deviation (vertical T lines) are shown.
Figure 2.
Percentage of correct responses across the six experimental conditions. The mean (crosses) ± standard deviation (vertical T lines) are shown.

Figure 3.
The delay in response across the six experimental conditions. The mean (crosses) ± standard deviation (vertical T lines) are shown. The dashed line shows the total average delay in response across all conditions.
Figure 3.
The delay in response across the six experimental conditions. The mean (crosses) ± standard deviation (vertical T lines) are shown. The dashed line shows the total average delay in response across all conditions.

Figure 4.
Example of receiver operator characteristic (ROC) analysis depicting the J statistic and area under the curve (AUC).
Figure 4.
Example of receiver operator characteristic (ROC) analysis depicting the J statistic and area under the curve (AUC).

Figure 5.
Mean and SD for the AUC across all experimental conditions.

Figure 6.
Example of an unresponsive user achieving a low Youden value of almost zero, but a correct response rate of ~51%.
Figure 6.
Example of an unresponsive user achieving a low Youden value of almost zero, but a correct response rate of ~51%.

Figure 7.
Rotation of stimulus magnet (SM) on skin induced by driver magnet (DM).

Figure 8.
Experimental setup used during tactile feedback testing. XLim represents the total distance covered by the DM in the horizontal direction (x-axis).
Figure 8.
Experimental setup used during tactile feedback testing. XLim represents the total distance covered by the DM in the horizontal direction (x-axis).

Figure 9.
System architecture and flow of commands.

Figure 10.
An example of the horizontal position of the driver magnet during a trial.

Figure 11.
Data processing and analysis flowchart, starting at the top left corner. Each of the steps depicted was done in MATLAB. The six categories shown in the bottom right corner relate to the three speeds of the driver magnet and two vertical distances between the driver and stimulus magnet.
Figure 11.
Data processing and analysis flowchart, starting at the top left corner. Each of the steps depicted was done in MATLAB. The six categories shown in the bottom right corner relate to the three speeds of the driver magnet and two vertical distances between the driver and stimulus magnet.

Figure 12.
Visualization of the method used to compute time delay between the driver magnet reaching the midpoint and the time at which the response occurred. * Detection of magnet occurs after optimal half point; hence, it is a negative delay.
Figure 12.
Visualization of the method used to compute time delay between the driver magnet reaching the midpoint and the time at which the response occurred. * Detection of magnet occurs after optimal half point; hence, it is a negative delay.

© 2020 by the authors. Licensee MDPI, Basel, Switzerland. This article is an open access article distributed under the terms and conditions of the Creative Commons Attribution (CC BY) license (http://creativecommons.org/licenses/by/4.0/).
Share and Cite
MDPI and ACS Style
Alshaibani, F.; Thompson, M.S.; Bergmann, J.H. Experimental Analysis of a Novel, Magnetic-Driven Tactile Feedback Device. Prosthesis 2020, 2, 25-38. https://0-doi-org.brum.beds.ac.uk/10.3390/prosthesis2010003
AMA Style
Alshaibani F, Thompson MS, Bergmann JH. Experimental Analysis of a Novel, Magnetic-Driven Tactile Feedback Device. Prosthesis. 2020; 2(1):25-38. https://0-doi-org.brum.beds.ac.uk/10.3390/prosthesis2010003
Chicago/Turabian StyleAlshaibani, Fahad, Mark S Thompson, and Jeroen HM Bergmann. 2020. "Experimental Analysis of a Novel, Magnetic-Driven Tactile Feedback Device" Prosthesis 2, no. 1: 25-38. https://0-doi-org.brum.beds.ac.uk/10.3390/prosthesis2010003