
Otolith δ18O Composition as a Tracer of Yellowfin Tuna (Thunnus albacares) Origin in the Indian Ocean


 , , and
Abstract
: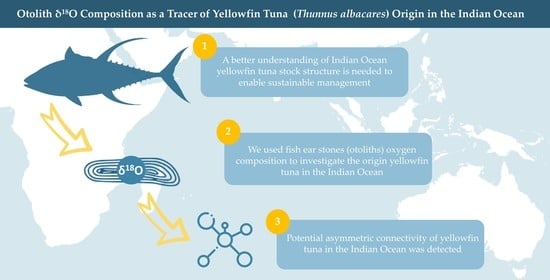
1. Introduction
2. Materials and Methods
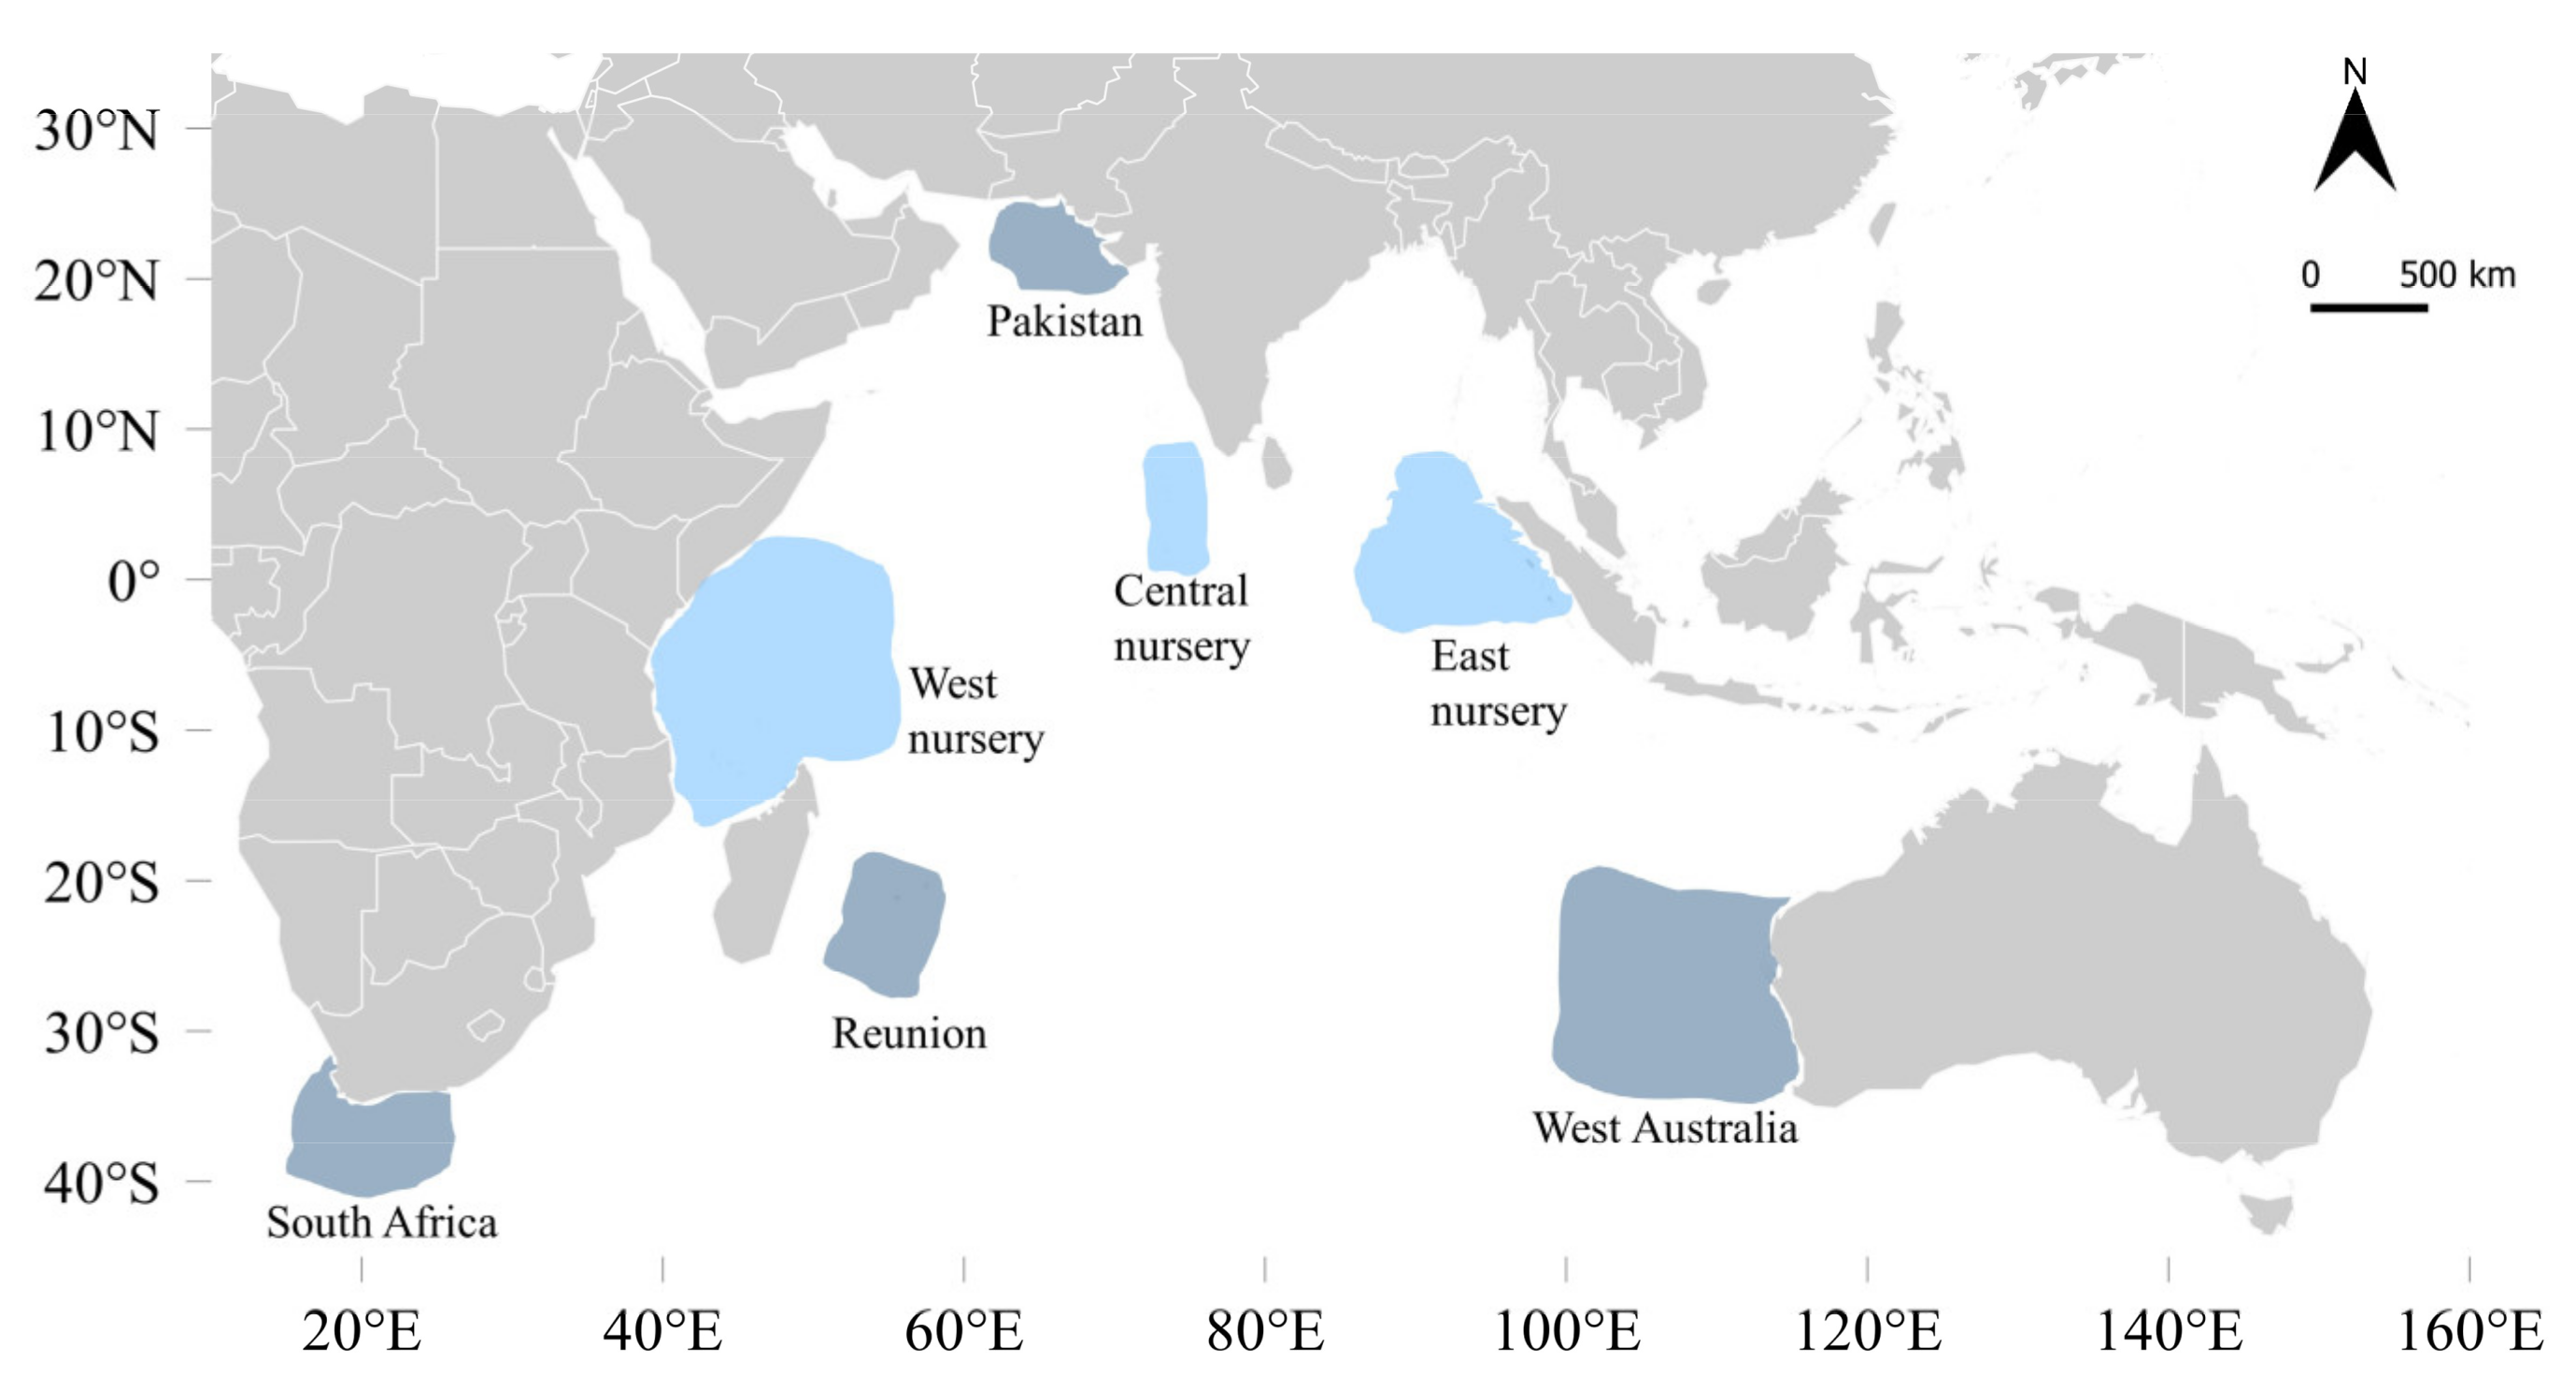
2.1. Fish Sampling
2.2. Otolith δ18O Analysis by IRMS
2.3. Otolith δ18O Analysis by SIMS
2.4. Isoscape Computation
2.5. Statistical Analyses
3. Results
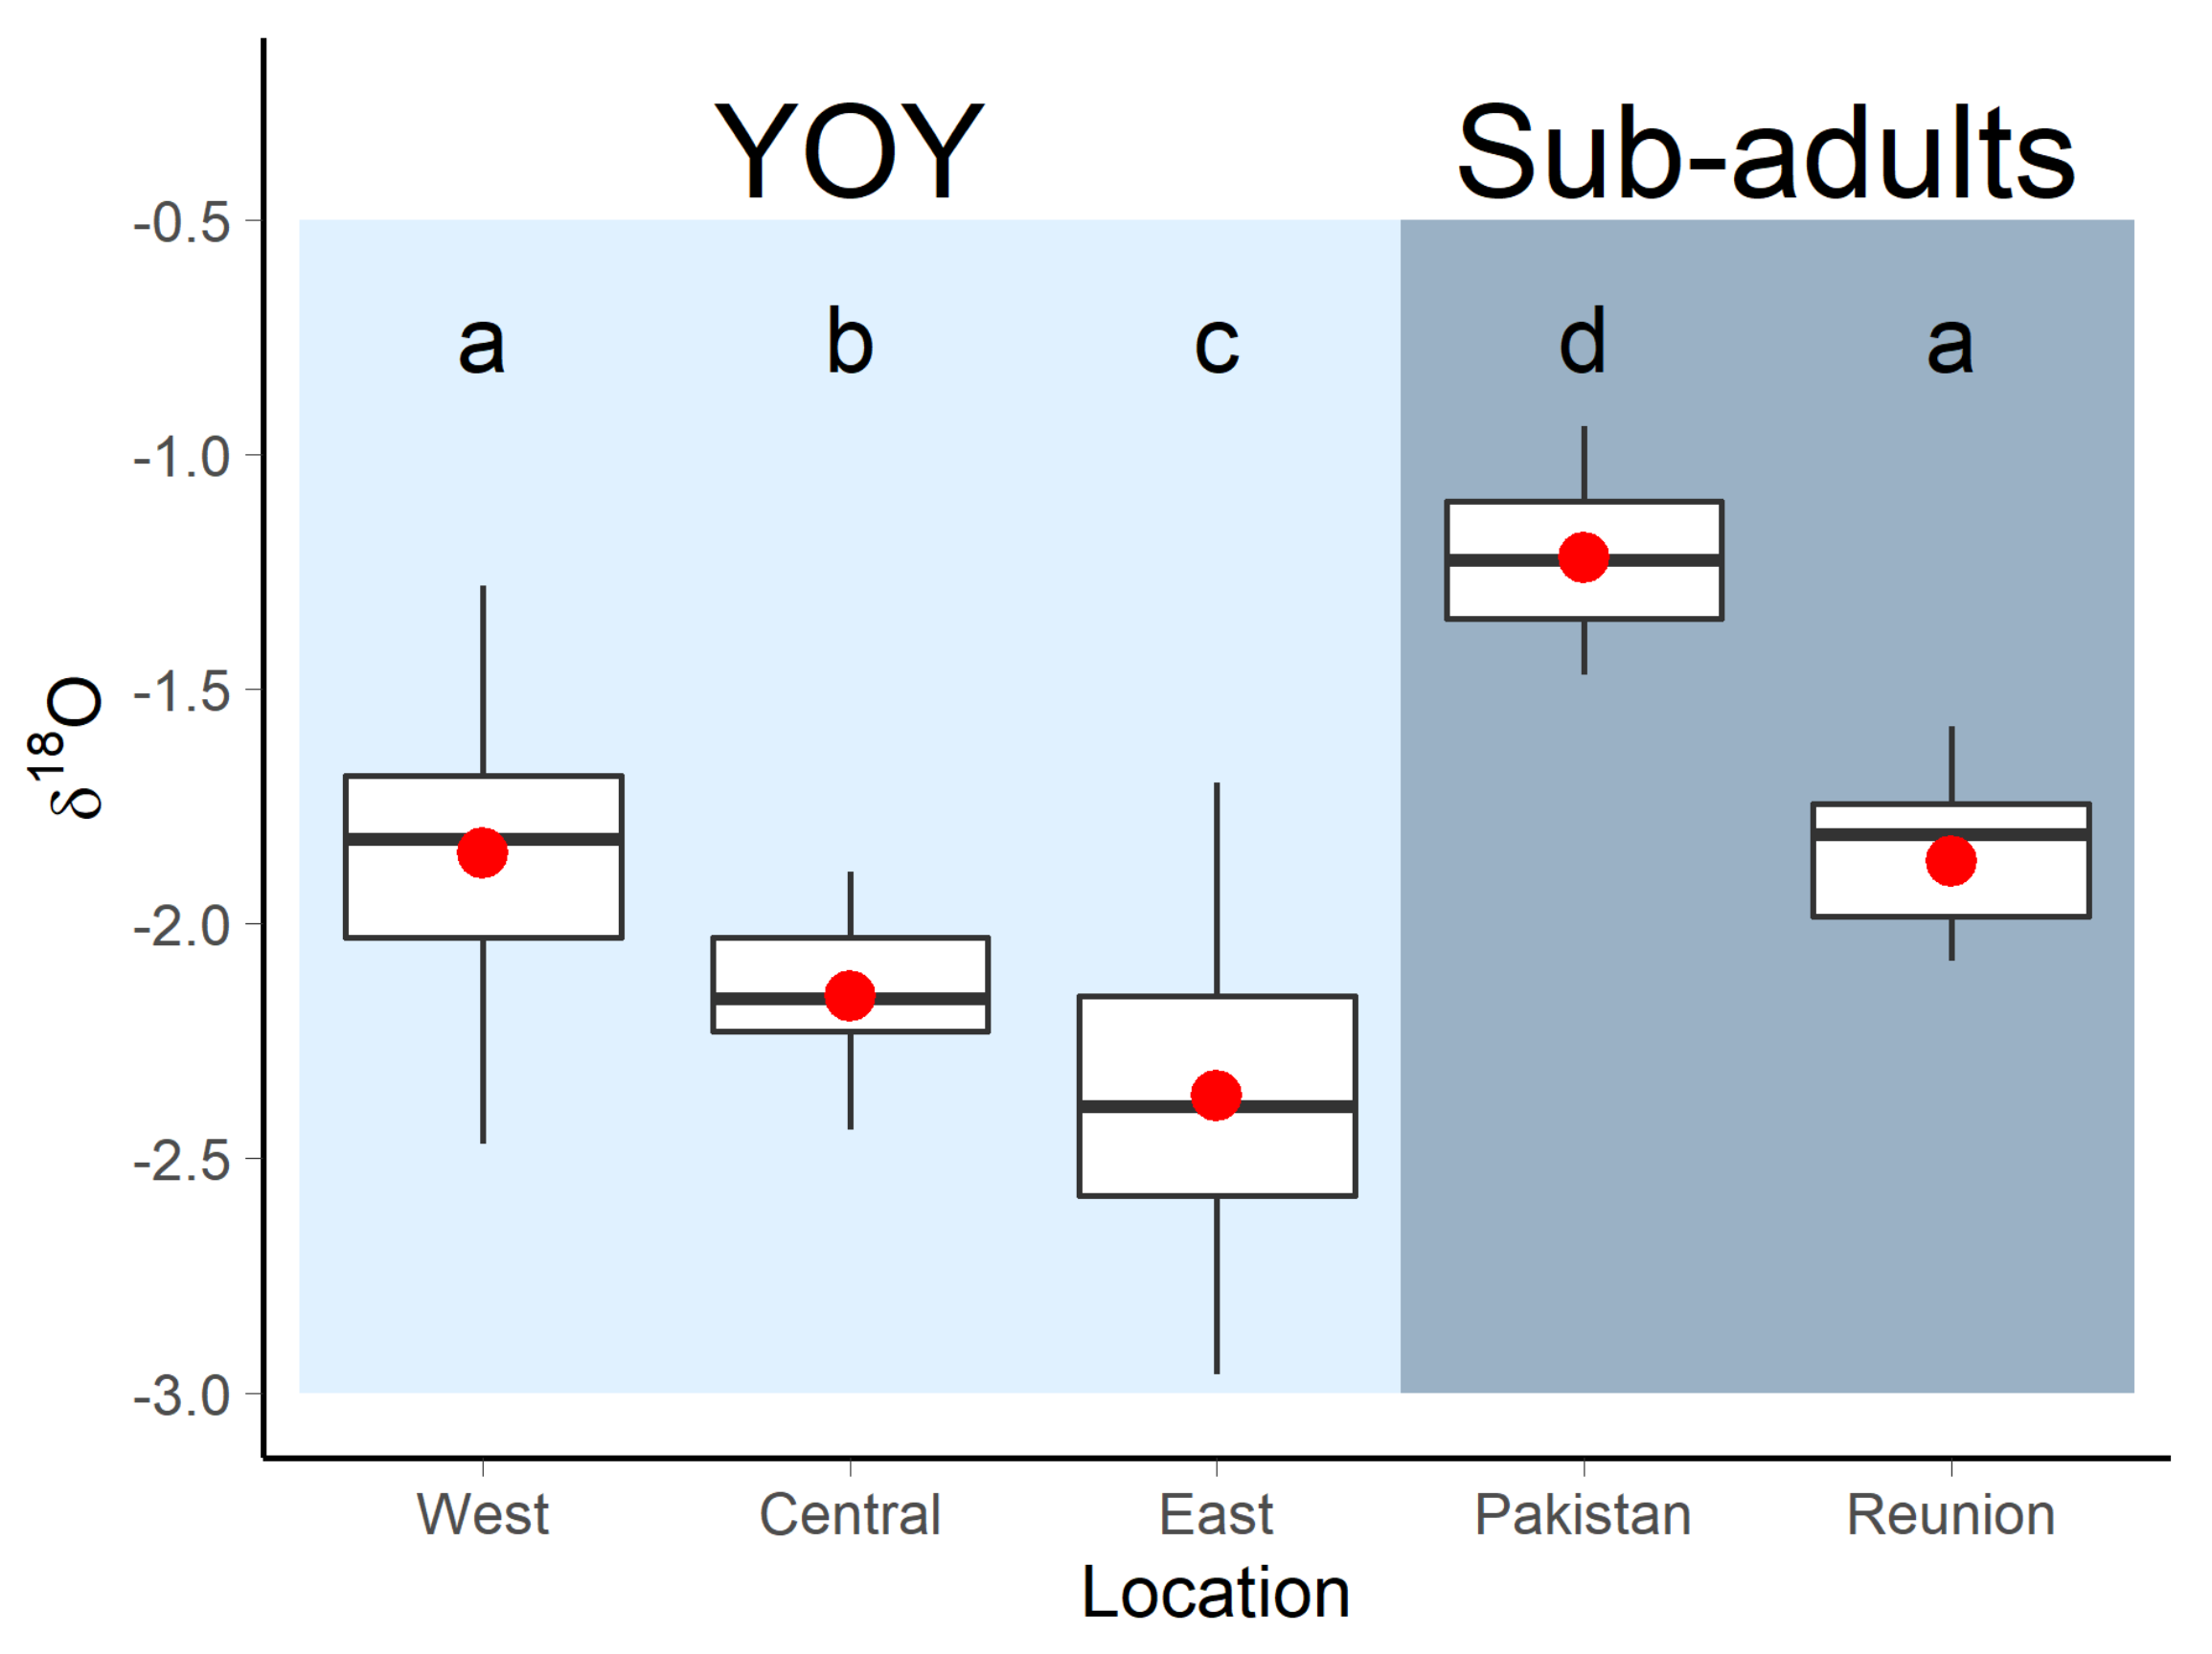
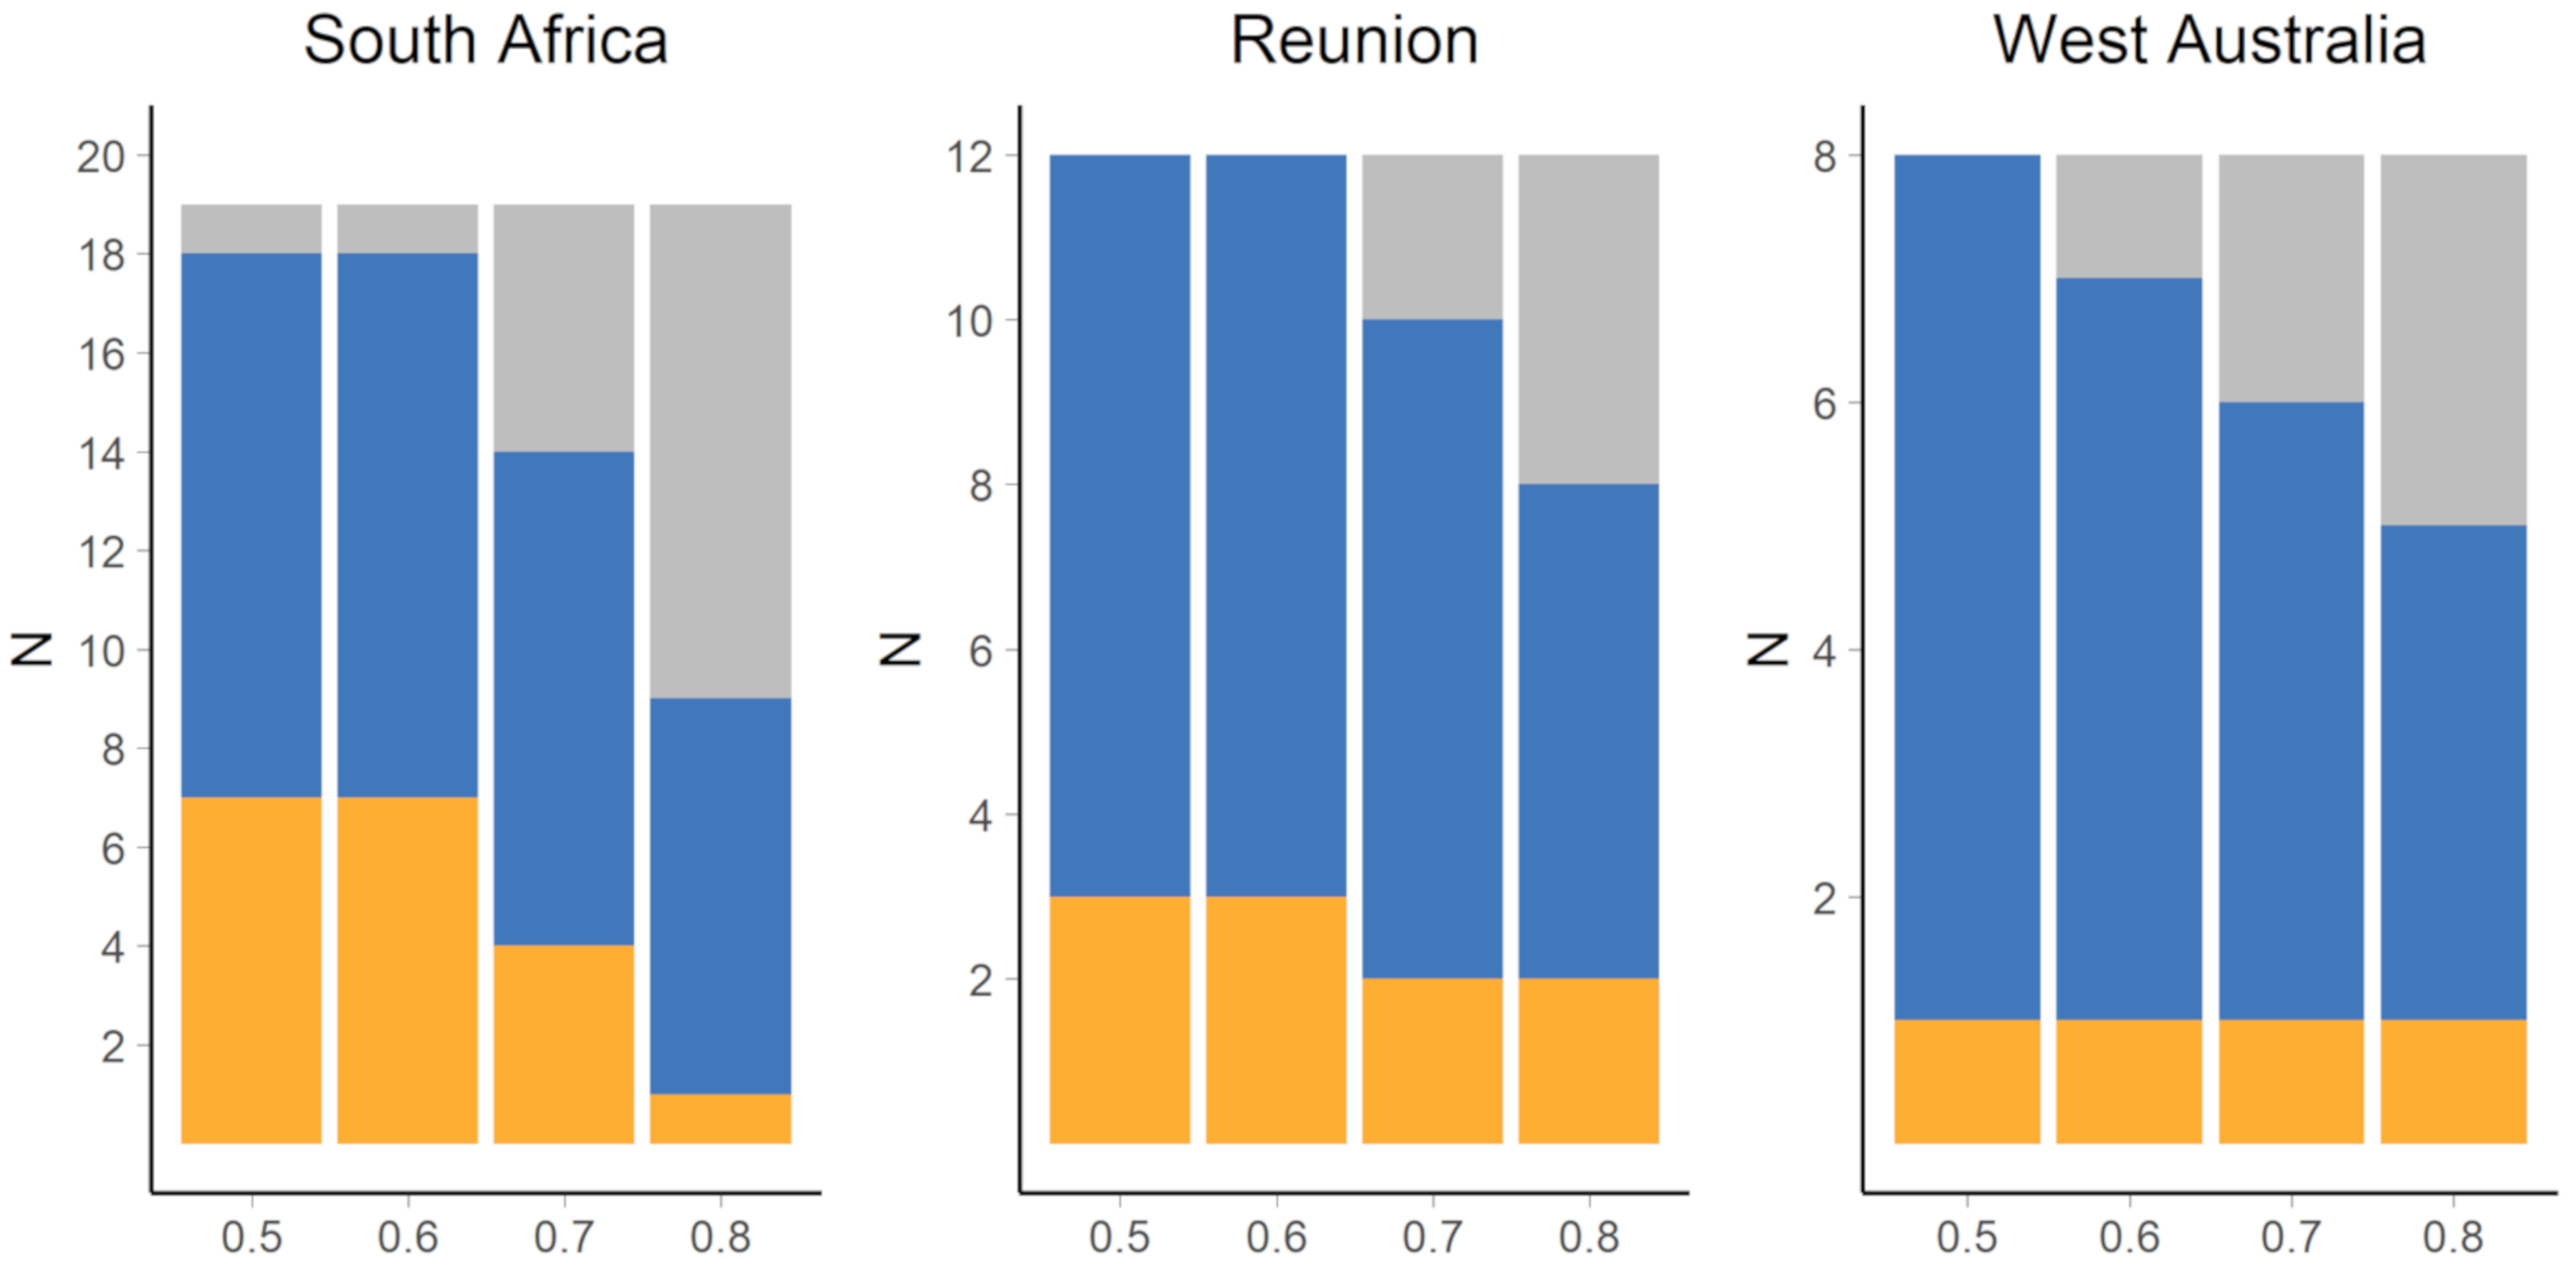
3.1. Nursery Origin of Sub-Adult and Adult Yellowfin Tuna
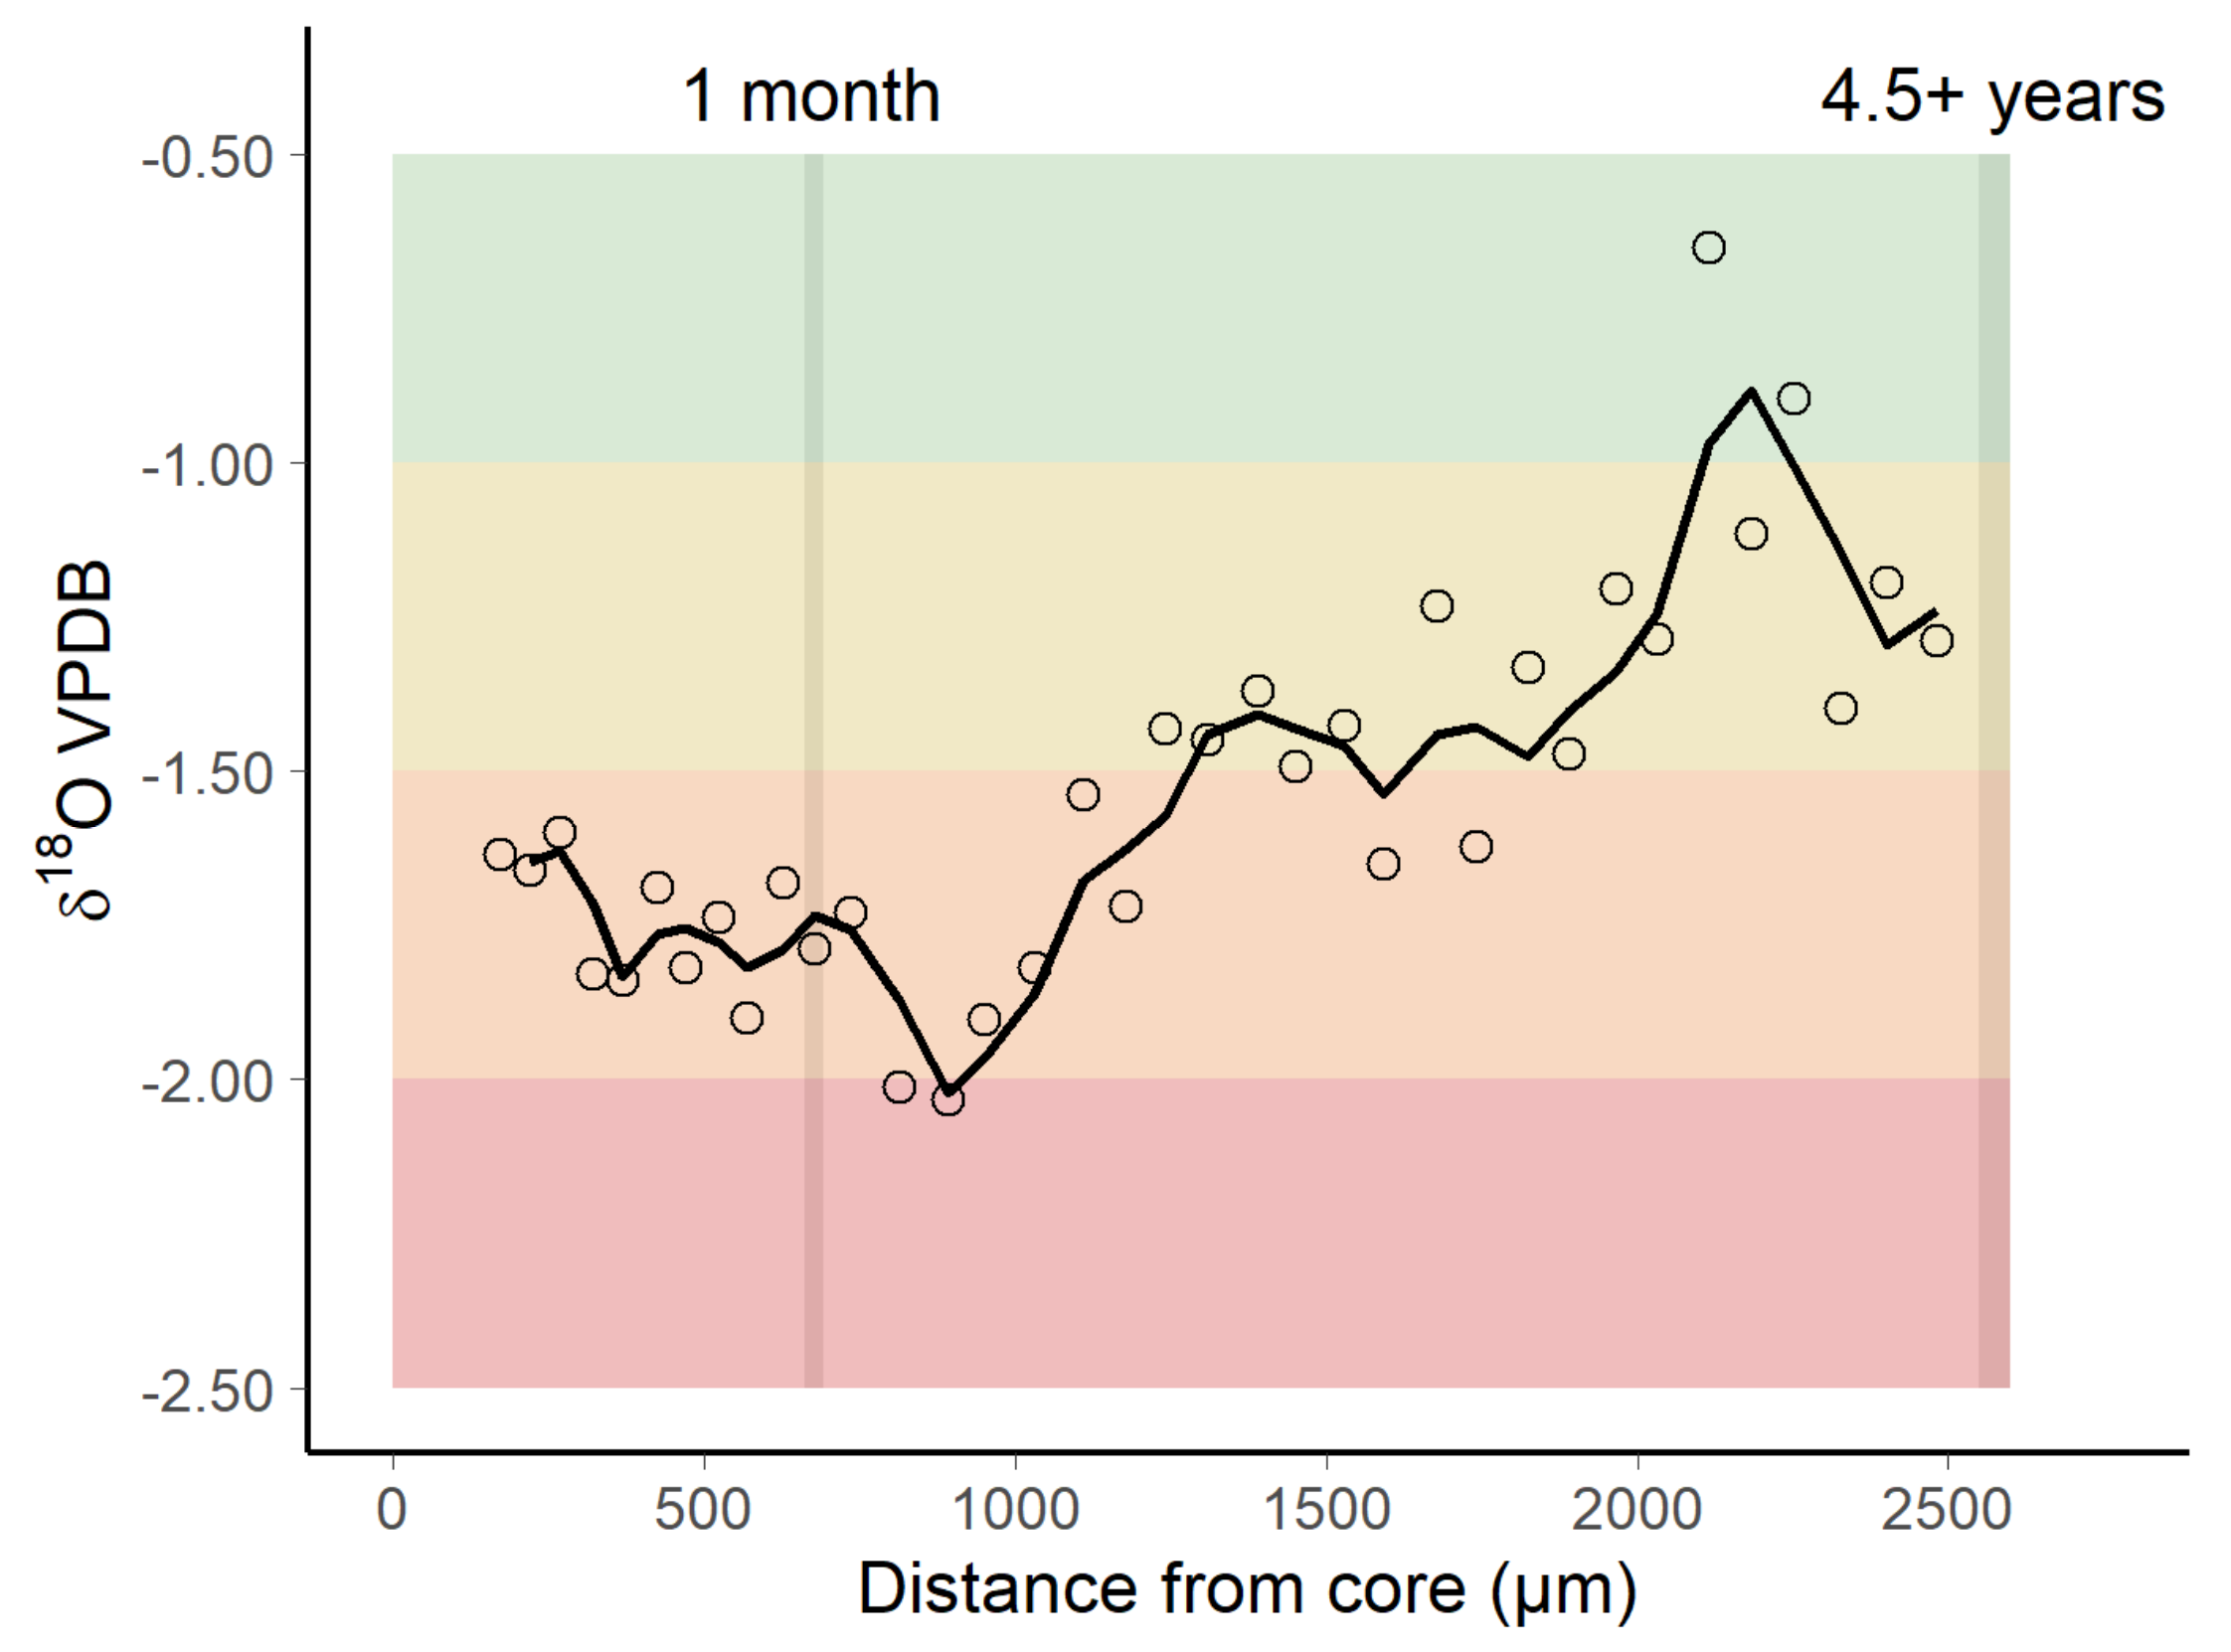
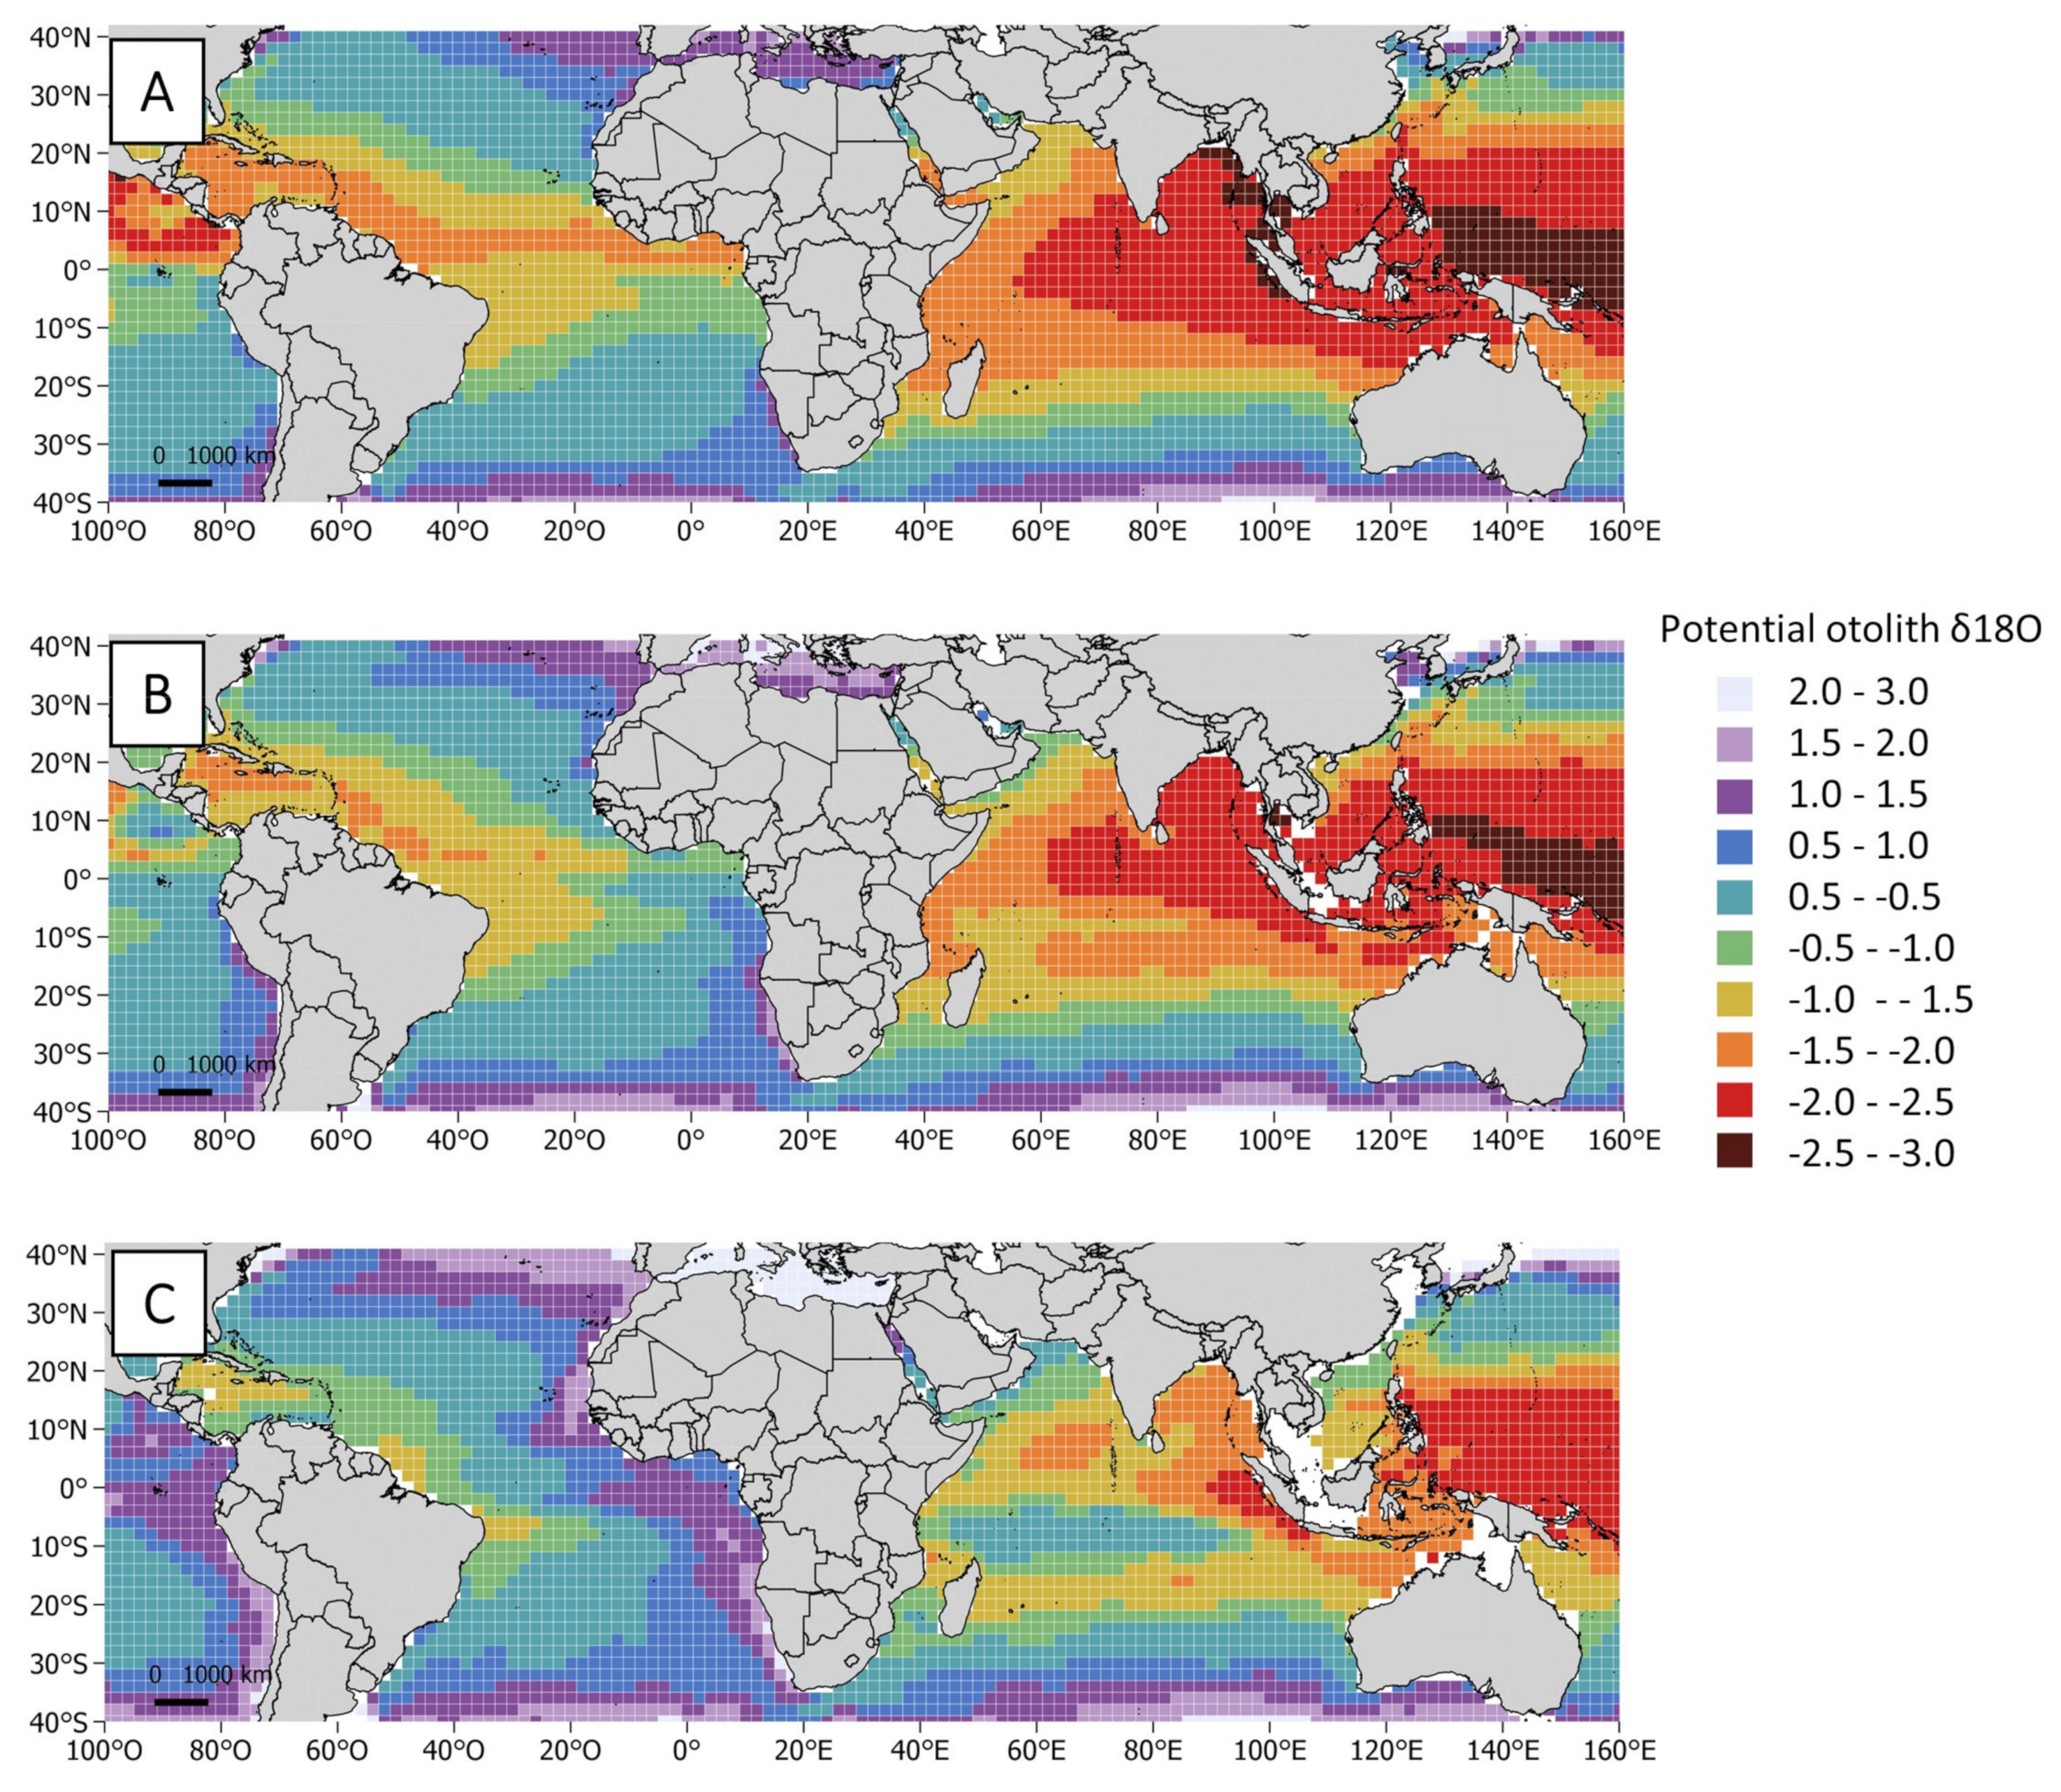
3.2. Oxygen Isotopic Distribution Along the Otolith and Isoscape Predictions
4. Discussion
4.1. Nursery Origin of Sub-Adult and Adult Yellowfin Tuna
4.2. Oxygen Isotopic Distribution Along the Otolith and Isoscape Predictions
5. Conclusions
Supplementary Materials
Author Contributions
Funding
Institutional Review Board Statement
Data Availability Statement
Acknowledgments
Conflicts of Interest
References
- Kritzer, J.P.; Liu, O.R. Fishery management strategies for addressing complex spatial structure in marine fish stocks. In Stock Identification Methods: Applications in Fishery Science, 2nd ed.; Cadrin, S.X., Kerr, L., Mariani, S., Eds.; Elsevier Academic Press: Amsterdam, The Netherlands, 2014; pp. 29–57. [Google Scholar] [CrossRef]
- Aranda, M.; Murillas, A.; Motos, L. International management of shared stocks. In Developments in Aquaculture and Fisheries Science; Elsevier BV: Amsterdam, The Netherlands, 2006; Chapter 2; pp. 29–54. [Google Scholar]
- Collette, B.B.; Nauen, C.E. Scombrids of the World. An Annotated and Illustrated Catalogue of Tunas, Mackerels, Bonitos and Related Species Known to Date; FAO: Rome, Italy, 1983. [Google Scholar]
- ISSF. Status of the World Fisheries for Tuna. March 2020; ISSF Technical Report 2020-12; ISSF: Washington, DC, USA, 2020. [Google Scholar]
- IOTC. Nominal Catch by Species and Gear, by Vessel Flag Reporting Country. IOTC-2019-DATASETS-NCDB. 2019. Available online: https://www.iotc.org/data/datasets/latest/NC (accessed on 17 January 2020).
- IOTC. Status of Yellowfin Tuna (Thunnus albacares) in the Indian Ocean; Executive Summery 2020; IOTC: Victoria, Seychelles, 2020; Appendix 11; Available online: https://www.iotc.org/sites/default/files/Yellowfin2020.pdf (accessed on 1 December 2020).
- IOTC. Yellowfin Tuna Supporting Information. Status Summary for Species of Tuna and Tuna-Like Species Under IOTC Mandate, as well as Other Species Impacted by IOTC Fisheries. 2017. Available online: http://www.iotc.org/documents/status-indian-ocean-yellowfin-tuna-yft-thunnus-albacares-resource (accessed on 3 February 2017).
- Proctor, C.H.; Lester, R.J.G.; Clear, N.P.; Grewe, P.M.; Moore, B.R.; Eveson, J.P.; Lestari, P.; Wujdi, A.; Taufik, M.; Wudianto Lansdell, M.J.; et al. Population Structure of Yellowfin Tuna (Thunnus albacares) and Bigeye Tuna (T. obesus) in the Indonesian Region. Final Report as Output of ACIAR Project FIS/2009/059; ACIAR: Hobart, Australia, 2019. [Google Scholar]
- Dammannagoda, S.T.; Hurwood, D.A.; Mather, P.B. Evidence for fine geographical scale heterogeneity in gene frequencies in yellowfin tuna (Thunnus albacares) from the north Indian Ocean around Sri Lanka. Fish. Res. 2008, 90, 147–157. [Google Scholar] [CrossRef] [Green Version]
- Kunal, S.P.; Kumar, G.; Menezes, M.R.; Meena, R.M. Mitochondrial DNA analysis reveals three stocks of yellowfin tuna Thunnus albacares (Bonnaterre, 1788) in Indian waters. Conserv. Genet. 2013, 14, 205–213. [Google Scholar] [CrossRef]
- Artetxe-Arrate, I.; Fraile, I.; Marsac, F.; Farley, J.H.; Rodriguez-Ezpeleta, N.; Davies, C.R.; Clear, N.P.; Grewe, P.; Murua, H. A review of the fisheries, life history and stock structure of tropical tuna (skipjack Katsuwonus pelamis, yellowfin Thunnus albacares and bigeye Thunnus obesus) in the Indian Ocean. Adv. Mar. Biol. 2020, 88, 39–89. [Google Scholar] [CrossRef]
- Sharp, G.D. Tuna Oceanography-an applied science. In Tuna: Physiology, Ecology, and Evolution; Block, B., Stevens, G., Eds.; Academic Press: San Diego, CA, USA, 2001; pp. 345–388. [Google Scholar]
- Schaefer, K.M. Reproductive biology of tunas. In Tuna: Physiology, Ecology and Evolution; Block, B.A., Stevens, E., Eds.; Academic Press: San Diego, CA, USA, 2001; pp. 225–270. [Google Scholar] [CrossRef]
- Reglero, P.; Tittensor, D.; Álvarez-Berastegui, D.; Aparicio-González, A.; Worm, B. Worldwide distributions of tuna larvae: Revisiting hypotheses on environmental requirements for spawning habitats. Mar. Ecol. Prog. Ser. 2014, 501, 207–224. [Google Scholar] [CrossRef] [Green Version]
- Muhling, B.A.; Lamkin, J.T.; Alemany, F.; García-García, A.; Farley, J.; Ingram, G.W.; Álvarez-Berastegui, D.; Reglero, P.; Carrion, R.L. Reproduction and larval biology in tunas, and the importance of restricted area spawning grounds. Rev. Fish. Biol. Fish. 2017, 27, 697–732. [Google Scholar] [CrossRef]
- Boehlert, G.; Mundy, B. Vertical and onshore-offshore distributional patterns of tuna larvae in relation to physical habitat features. Mar. Ecol. Prog. Ser. 1994, 107, 1–13. [Google Scholar] [CrossRef]
- Zudaire, I.; Murua, H.; Grande, M.; Bodin, N. Reproductive potential of Yellowfin Tuna (Thunnus albacares) in the western Indian Ocean. Fish. Bull. 2013, 111, 252–264. [Google Scholar] [CrossRef] [Green Version]
- Zhu, G.; Xu, L.; Zhou, Y.; Song, L. Reproductive biology of yellowfin tuna T. albacares in the west-central Indian Ocean. J. Ocean. Univ. China 2008, 7, 327–332. [Google Scholar] [CrossRef]
- Nootmorn, P.; Yakoh, A.; Kawises, K. Reproductive Biology of Yellowfin Tuna in the Eastern Indian Ocean; IOTC-2005-WPTT-14; IOTC: Victoria, Seychelles, 2005; pp. 379–385. [Google Scholar]
- Stéquert, B.; Marsac, F. Tropical Tuna–Surface Fisheries in the Indian Ocean; FAO Fisheries Technical Paper; FAO: Rome, Italy, 1989. [Google Scholar]
- IOTC. Nominal Catches by Fleet, Year, Gear, IOTC Area and Species. IOTC-2020-WPTT22(AS)-DATA03. 2020. Available online: https://www.iotc.org/WPTT/22AS/Data/03-NC (accessed on 4 December 2020).
- Fonteneau, A.; Pallares-Soubrier, P. Interactions between tuna fisheries: A global review with specific examples from the Atlantic Ocean. In Status of Interactions of Pacific Tuna Fisheries in 1995, Proceedings of the Second FAO Expert Consultation Interactions of Pacific Tuna Fisheries, Shimizu, Japan, 23–31 January 1995; Shomura, R.S., Majkowski, J., Harman, R.F., Eds.; FAO Fisheries Technical Paper; FAO: Rome, Italy, 1995; Available online: http://www.fao.org/3/W3628E/w3628e0b.htm (accessed on 15 November 2020).
- Fonteneau, A.; Hallier, J.-P. Fifty years of dart tag recoveries for tropical tuna: A global comparison of results for the western Pacific, eastern Pacific, Atlantic, and Indian Oceans. Fish. Res. 2015, 163, 7–22. [Google Scholar] [CrossRef]
- Kerr, L.A.; Hintzen, N.; Cadrin, S.X.; Clausen, L.W.; Dickey-Collas, M.; Goethel, D.; Hatfield, E.M.; Kritzer, J.P.; Nash, R.D. Lessons learned from practical approaches to reconcile mismatches between biological population structure and stock units of marine fish. ICES J. Mar. Sci. 2017, 74, 1708–1722. [Google Scholar] [CrossRef] [Green Version]
- Bosley, K.M.; Goethel, D.R.; Berger, A.M.; Deroba, J.J.; Fenske, K.H.; Hanselman, D.H.; Langseth, B.J.; Schueller, A.M. Overcoming challenges of harvest quota allocation in spatially structured populations. Fish. Res. 2019, 220, 105344. [Google Scholar] [CrossRef]
- Kitchens, L.; Rooker, J.; Reynal, L.; Falterman, B.; Saillant, E.; Murua, H. Discriminating among yellowfin tuna Thunnus albacares nursery areas in the Atlantic Ocean using otolith chemistry. Mar. Ecol. Prog. Ser. 2018, 603, 201–213. [Google Scholar] [CrossRef]
- Wells, R.; Rooker, J.; Itano, D. Nursery origin of yellowfin tuna in the Hawaiian Islands. Mar. Ecol. Prog. Ser. 2012, 461, 187–196. [Google Scholar] [CrossRef] [Green Version]
- Rooker, J.R.; Wells, R.J.D.; Itano, D.G.; Thorrold, S.R.; Lee, J.M. Natal origin and population connectivity of bigeye and yellowfin tuna in the Pacific Ocean. Fish. Oceanogr. 2016, 25, 277–291. [Google Scholar] [CrossRef]
- Campana, S.E. Chemistry and composition of fish otoliths:pathways, mechanisms and applications. Mar. Ecol. Prog. Ser. 1999, 188, 263–297. [Google Scholar] [CrossRef] [Green Version]
- Thorrold, S.R.; Latkoczy, C.; Swart, P.K.; Jones, C.M. Natal Homing in a Marine Fish Metapopulation. Science 2001, 291, 297–299. [Google Scholar] [CrossRef] [Green Version]
- Rooker, J.R.; Secor, D.H. Stock Structure and Mixing of Atlantic Bluefin Tuna: Evidence from Stable δ13C and δ18O Isotopes in Otoliths; ICCAT Collective Volume of Scientific Papers; ICCAT: Madrid, Spain, 2004; Volume 56, pp. 1115–1120. [Google Scholar]
- Kerr, L.A.; Whitener, Z.T.; Cadrin, S.X.; Morse, M.R.; Secor, D.H.; Golet, W. Mixed stock origin of Atlantic bluefin tuna in the U.S. rod and reel fishery (Gulf of Maine) and implications for fisheries management. Fish. Res. 2020, 224, 105461. [Google Scholar] [CrossRef]
- Secor, D.H. Synopsis of Regional Mixing Levels for Atlantic Bluefin Tuna Estimated from Otolith Stable Isotope Analysis, 2007–2014; Collective Volume of Scientific Papers ICCAT.; ICCAT: Madrid, Spain, 2015; Volume 71, pp. 1683–1689. [Google Scholar]
- Darnaude, A.M.; Hunter, E. Validation of otolith δ18O values as effective natural tags for shelf-scale geolocation of migrating fish. Mar. Ecol. Prog. Ser. 2018, 598, 167–185. [Google Scholar] [CrossRef] [Green Version]
- LeGrande, A.N.; Schmidt, G. Global gridded data set of the oxygen isotopic composition in seawater. Geophys. Res. Lett. 2006, 33. [Google Scholar] [CrossRef] [Green Version]
- Wrigth, J. Global climate change in Marine Stable Isotope Records. In Quaternary Geo-Chronology: Methods and Applications; Noller, J., Sowers, J., Lettis, W., Eds.; American Geophysical Union: Washington, DC, USA, 2013; pp. 671–682. [Google Scholar]
- Kitagawa, T.; Ishimura, T.; Uozato, R.; Shirai, K.; Amano, Y.; Shinoda, A.; Otake, T.; Tsunogai, U.; Kimura, S. Otolith δ18O of Pacific bluefin tuna Thunnus orientalis as an indicator of ambient water temperature. Mar. Ecol. Prog. Ser. 2013, 481, 199–209. [Google Scholar] [CrossRef] [Green Version]
- Thorrold, S.; Campana, S.E.; Jones, C.M.; Swart, P. Factors determining δ13C and δ18O fractionation in aragonitic otoliths of marine fish. Geochim. Cosmochim. Acta 1997, 61, 2909–2919. [Google Scholar] [CrossRef]
- Trueman, C.N.; MacKenzie, K.; Palmer, M.R. Identifying migrations in marine fishes through stable-isotope analysis. J. Fish. Biol. 2012, 81, 826–847. [Google Scholar] [CrossRef]
- Hsieh, Y.; Shiao, J.; Lin, S.; Iizuka, Y. Quantitative reconstruction of salinity history by otolith oxygen stable isotopes: An example of a euryhaline fishLateolabrax japonicus. Rapid Commun. Mass Spectrom. 2019, 33, 1344–1354. [Google Scholar] [CrossRef] [PubMed]
- Darnaude, A.M.; Sturrock, A.; Trueman, C.N.; Mouillot, D.; EIMF; Campana, S.; Hunter, E. Listening In on the Past: What Can Otolith δ18O Values Really Tell Us about the Environmental History of Fishes? PLoS ONE 2014, 9, e108539. [Google Scholar] [CrossRef] [PubMed] [Green Version]
- Hane, Y.; Kimura, S.; Yokoyama, Y.; Miyairi, Y.; Ushikubo, T.; Ishimura, T.; Ogawa, N.; Aono, T.; Nishida, K. Reconstruction of temperature experienced by Pacific bluefin tuna Thunnus orientalis larvae using SIMS and microvolume CF-IRMS otolith oxygen isotope analyses. Mar. Ecol. Prog. Ser. 2020, 649, 175–188. [Google Scholar] [CrossRef]
- Matta, M.E.; Orland, I.; Ushikubo, T.; Helser, T.E.; Black, B.; Valley, J. Otolith oxygen isotopes measured by high-precision secondary ion mass spectrometry reflect life history of a yellowfin sole (Limanda aspera). Rapid Commun. Mass Spectrom. 2013, 27, 691–699. [Google Scholar] [CrossRef]
- Shiao, J.-C.; Itoh, S.; Yurimoto, H.; Iizuka, Y.; Liao, Y.-C. Oxygen isotopic distribution along the otolith growth axis by secondary ion mass spectrometry: Applications for studying ontogenetic change in the depth inhabited by deep-sea fishes. Deep. Sea Res. Part. I Oceanogr. Res. Pap. 2014, 84, 50–58. [Google Scholar] [CrossRef]
- Shirai, K.; Otake, T.; Amano, Y.; Kuroki, M.; Ushikubo, T.; Kita, N.T.; Murayama, M.; Tsukamoto, K.; Valley, J. Temperature and depth distribution of Japanese eel eggs estimated using otolith oxygen stable isotopes. Geochim. Cosmochim. Acta 2018, 236, 373–383. [Google Scholar] [CrossRef]
- Willmes, M.; Lewis, L.S.; Davis, B.; Loiselle, L.; James, H.F.; Denny, C.; Baxter, R.; Conrad, J.L.; Fangue, N.A.; Hung, T.; et al. Calibrating temperature reconstructions from fish otolith oxygen isotope analysis for California’s critically endangered Delta Smelt. Rapid Commun. Mass Spectrom. 2019, 33, 1207–1220. [Google Scholar] [CrossRef]
- Trueman, C.; St John Glew, K. Isotopic Tracking of Marine Animal Movement. In Tracking Animal Migration with Stable Isotopes, 2nd ed.; Hobson, K., Wassenaar, L., Eds.; Academic Press: San Diego, CA, USA, 2019; pp. 137–172. [Google Scholar] [CrossRef]
- Davies, C.; Marsca, F.; Murua, H.; Fraile, I.; Fahmi, Z.; Farley, J.; Grewe, P.; Proctor, C.; Clear, N.; Lansdell, M.; et al. Study of Population Structure of IOTC Species and Sharks of Interest in the Indian Ocean Using Genetics and Microchemistry: 2020; Final Report to IOTC.; FAO: Rome, Italy, 2020. [Google Scholar]
- Eveson, J.P.; Million, J.; Sardenne, F.; Le Croizier, G. Estimating growth of tropical tunas in the Indian Ocean using tag-recapture data and otolith-based age estimates. Fish. Res. 2015, 163, 58–68. [Google Scholar] [CrossRef]
- Artetxe-Arrate, I.; Fraile, I.; Clear, N.; Darnaude, A.; Dettman, D.; Pécheyran, C.; Farley, J.; Murua, H. Discrimination of yellowfin tuna (Thunnus albacares) from nursery areas in the Indian Ocean using otolith chemistry. Mar. Ecol. Prog. Ser. 2021. [Google Scholar] [CrossRef]
- Kita, N.T.; Ushikubo, T.; Fu, B.; Valley, J. High precision SIMS oxygen isotope analysis and the effect of sample topography. Chem. Geol. 2009, 264, 43–57. [Google Scholar] [CrossRef]
- Graham, C.M.; Valley, J.W.; Eiler, J.M.; Wada, H. Timescales and mechanisms of fluid infiltration in a marble: An ion microprobe study. Contrib. Miner. Pet. 1998, 132, 371–389. [Google Scholar] [CrossRef]
- Brand, W.A.; Coplen, T.B.; Vogl, J.; Rosner, M.; Prohaska, T. Assessment of international reference materials for isotope-ratio analysis (IUPAC Technical Report). Pure Appl. Chem. 2014, 86, 425–467. [Google Scholar] [CrossRef]
- Helser, T.E.; Kastelle, C.R.; McKay, J.L.; Orland, I.J.; Kozdon, R.; Valley, J. Evaluation of micromilling/conventional isotope ratio mass spectrometry and secondary ion mass spectrometry of δ18O values in fish otoliths for sclerochronology. Rapid Commun. Mass Spectrom. 2018, 32, 1781–1790. [Google Scholar] [CrossRef]
- Schaefer, K.M.; Fuller, D.W.; Block, B.A. Movements, behavior, and habitat utilization of yellowfin tuna (Thunnus albacares) in the northeastern Pacific Ocean, ascertained through archival tag data. Mar. Biol. 2007, 152, 503–525. [Google Scholar] [CrossRef]
- Rooker, J.R.; Fraile, I.; Liu, H.; Abid, N.; Dance, M.A.; Itoh, T.; Kimoto, A.; Tsukahara, Y.; Rodriguez-Marin, E.; Arrizabalaga, H. Wide-Ranging Temporal Variation in Transoceanic Movement and Population Mixing of Bluefin Tuna in the North Atlantic Ocean. Front. Mar. Sci. 2019, 6, 1–13. [Google Scholar] [CrossRef] [Green Version]
- R Core Team. R: A Language and Environment for Statistical Computing; R Foundation for Statistical Computing: Vienna, Austria, 2019; Available online: https://www.R-project.org/ (accessed on 1 December 2020).
- Rooker, J.R.; Secor, D.; De Metrio, G.; Schloesser, R.; Block, B.A.; Neilson, J.D. Natal Homing and Connectivity in Atlantic Bluefin Tuna Populations. Science 2008, 322, 742–744. [Google Scholar] [CrossRef] [Green Version]
- Keshtgar, B.; Alizadeh-Choobari, O.; Irannejad, P. Seasonal and interannual variations of the intertropical convergence zone over the Indian Ocean based on an energetic perspective. Clim. Dyn. 2020, 54, 3627–3639. [Google Scholar] [CrossRef]
- Barth, J.M.; Damerau, M.; Matschiner, M.; Jentoft, S.; Hanel, R. Genomic Differentiation and Demographic Histories of Atlantic and Indo-Pacific Yellowfin Tuna (Thunnus albacares) Populations. Genome Biol. Evol. 2017, 9, 1084–1098. [Google Scholar] [CrossRef]
- Grewe, P.; Feutry, P.; Foster, S.; Aulich, J.; Landsdell, M.; Cooper, S.; Clear, N.; Nikolic, N.; Krug, I.; Mendibil, I.; et al. Genetic Population Connectivity of Yellowfin Tuna in the Indian Ocean from the PSTBS-IO Project; Report No.: IOTC-2020-WPTT22(AS)12_REV1; FAO: Rome, Italy, 2020. [Google Scholar]
- Langley, A.; Million, J. Determining an Appropriate Tag Mixing Period for the Indian Ocean Yellowfin Tuna Stock Assessment; IOTC–2012–WPTT14–31; FAO: Rome, Italy, 2012. [Google Scholar]
- Kolody, D.; Hoyle, S. Evaluation of Tag Mixing Assumptions for Skipjack, Yellowfin and Bigeye Tuna Stock Assessments in the Western Pacific and Indian Oceans; WCPFC-SC9-2013/ SA-IP-11; FAO: Rome, Italy, 2013. [Google Scholar]
- Hallier, J.-P.; Gaertner, D. Drifting fish aggregation devices could act as an ecological trap for tropical tuna species. Mar. Ecol. Prog. Ser. 2008, 353, 255–264. [Google Scholar] [CrossRef] [Green Version]
- Fonteneau, A. On the Movements and Stock Structure of Skipjack (Katsuwonus pelamis) in the Indian Ocean; IOTC–2014–WPTT16–36; FAO: Rome, Italy, 2014; pp. 1–16. [Google Scholar]
- Gillanders, B. Temporal and spatial variability in elemental composition of otoliths: Implications for determining stock identity and connectivity of populations. Can. J. Fish. Aquat. Sci. 2002, 59, 669–679. [Google Scholar] [CrossRef]
- Schloesser, R.; Rooker, J.R.; Louchuoarn, P.; Neilson, J.D.; Secor, D. Interdecadal variation in seawater d13C and d18O recorded in fish otoliths. Limnol. Oceanogr. 2009, 54, 1665–1668. [Google Scholar] [CrossRef] [Green Version]
- Brownscombe, J.W.; Lédée, E.J.I.; Raby, G.D.; Struthers, D.P.; Gutowsky, L.; Nguyen, V.; Young, N.; Stokesbury, M.J.W.; Holbrook, C.M.; Brenden, T.O.; et al. Conducting and interpreting fish telemetry studies: Considerations for researchers and resource managers. Rev. Fish. Biol. Fish. 2019, 29, 369–400. [Google Scholar] [CrossRef]
- Musyl, M.; Domeier, M.; Nasby-Lucas, N.; Brill, R.; McNaughton, L.; Swimmer, J.; Lutcavage, M.; Wilson, S.; Galuardi, B.; Liddle, J. Performance of pop-up satellite archival tags. Mar. Ecol. Prog. Ser. 2011, 433, 1–28. [Google Scholar] [CrossRef] [Green Version]
- Secor, D.H. Specifying divergent migrations in the conceptof stock: The contingent hypothesis. Fish Res. 1999, 43, 13–34. [Google Scholar] [CrossRef]
- Graham, J.B.; Dickson, K.A. Tuna comparative physiology. J. Exp. Biol. 2004, 207, 4015–4024. [Google Scholar] [CrossRef] [Green Version]
- Dagorn, L.; Holland, K.N.; Hallier, J.-P.; Taquet, M.; Moreno, G.; Sancho, G.; Itano, D.G.; Aumeeruddy, R.; Girard, C.; Million, J.; et al. Deep diving behavior observed in yellowfin tuna (Thunnus albacares). Aquat. Living Resour. 2006, 19, 85–88. [Google Scholar] [CrossRef] [Green Version]
- Mullins, R.B.; McKeown, N.; Sauer, W.H.H.; Shaw, P. Genomic analysis reveals multiple mismatches between biological and management units in yellowfin tuna (Thunnus albacares). ICES J. Mar. Sci. 2018, 75, 2145–2152. [Google Scholar] [CrossRef]
- Nakamura, M.; Yoneda, M.; Ishimura, T.; Shirai, K.; Tamamura, M.; Nishida, K. Temperature dependency equation for chub mackerel (Scomber japonicus) identified by a laboratory rearing experiment and microscale analysis. Mar. Freshw. Res. 2020, 71, 1384. [Google Scholar] [CrossRef] [Green Version]
- Tanner, S.E.; Santos, P.R.; Cabral, H. Otolith chemistry in stock delineation: A brief overview, current challenges and future prospects. Fish. Res. 2016, 173, 206–213. [Google Scholar] [CrossRef]
- Geffen, A.J. Otolith oxygen and carbon stable isotopes in wild and laboratory-reared plaice (Pleuronectes platessa). Environ. Boil. Fishes 2012, 95, 419–430. [Google Scholar] [CrossRef]
- Macdonald, J.I.; Drysdale, R.; Witt, R.; Cságoly, Z.; Marteinsdóttir, G. Isolating the influence of ontogeny helps predict island-wide variability in fish otolith chemistry. Rev. Fish. Biol. Fish. 2019, 30, 173–202. [Google Scholar] [CrossRef]
- Kalish, J.M. Marine Biology Oxygen and carbon stable isotopes in the otoliths. Mar Biol. 1991, 110, 37–47. [Google Scholar] [CrossRef]
- Nishida, K.; Yasu, A.; Nanjo, N.; Takahashi, M.; Kitajima, S.; Ishimura, T. Microscale stable carbon and oxygen isotope measurement of individual otoliths of larvae and juveniles of Japanese anchovy and sardine. Estuar. Coast. Shelf Sci. 2020, 245, 106946. [Google Scholar] [CrossRef]
- Høie, H.; Folkvord, A.; Otterlei, E. Effect of somatic and otolith growth rate on stable isotopic composition of early juvenile cod (Gadus morhua L) otoliths. J. Exp. Mar. Biol. Ecol. 2003, 289, 41–58. [Google Scholar] [CrossRef]
- Shih, C.-L.; Hsu, C.-C.; Chen, C.-Y. First attempt to age yellowfin tuna, Thunnus albacares, in the Indian Ocean, based on sectioned otoliths. Fish. Res. 2014, 149, 19–23. [Google Scholar] [CrossRef]
- Sardenne, F.; Dortel, E.; Le Croizier, G.; Million, J.; Labonne, M.; Leroy, B.; Bodin, N.; Chassot, E. Determining the age of tropical tunas in the Indian Ocean from otolith microstructures. Fish. Res. 2015, 163, 44–57. [Google Scholar] [CrossRef] [Green Version]
- Kerr, L.A.; Cadrin, S.X.; Secor, D.H.; Taylor, N. Evaluating the Effect of Atlantic Bluefin Tuna Movement on the Perception of Stock Units; ICCAT Collective Volume of Scientific Papers; ICCAT: Madrid, Spain, 2015; Volume 74, pp. 1660–1682. [Google Scholar]
- Cadrin, S.X.; Secor, D.H. Accounting for Spatial Population Structure in Stock Assessment: Past, Present, and Future. In The Future of Fisheries Science in North America; Beamish, R., Rothschild, B., Eds.; Springer Science and Business Media LLC: Amsterdam, The Netherlands, 2009; pp. 405–426. [Google Scholar]


| Location | N | Sampling Dates | FL Range (cm) | Estimated Age (years) | Life Stage Classification 1 |
|---|---|---|---|---|---|
| West nursery | 51 | March–April 2018 and 2019 | 26–37 | <1 | YOY |
| Central nursery | 31 | August 2018 and February 2019 | 28–36 | <1 | YOY |
| East nursery | 31 | April and November 2018 | 19–34 | <1 | YOY |
| Pakistan | 12 | September 2018 | 64–75 | 1–2 | Sub-adult |
| Reunion | 15 | December 2017 | 47–51 | 1 | Sub-adult |
| Reunion | 12 | February–March 2018; February 2019 | 124–169 | >4 | Adult |
| South Africa | 19 | March–May 2018 | 133–138 | >4 | Adult |
| West Australia | 8 | May 2019 | 143–174 | >5 | Adult |
Publisher’s Note: MDPI stays neutral with regard to jurisdictional claims in published maps and institutional affiliations. |
© 2021 by the authors. Licensee MDPI, Basel, Switzerland. This article is an open access article distributed under the terms and conditions of the Creative Commons Attribution (CC BY) license (https://creativecommons.org/licenses/by/4.0/).
Share and Cite
Artetxe-Arrate, I.; Fraile, I.; Farley, J.; Darnaude, A.M.; Clear, N.; Dettman, D.L.; Davies, C.; Marsac, F.; Murua, H. Otolith δ18O Composition as a Tracer of Yellowfin Tuna (Thunnus albacares) Origin in the Indian Ocean. Oceans 2021, 2, 461-476. https://0-doi-org.brum.beds.ac.uk/10.3390/oceans2030026
Artetxe-Arrate I, Fraile I, Farley J, Darnaude AM, Clear N, Dettman DL, Davies C, Marsac F, Murua H. Otolith δ18O Composition as a Tracer of Yellowfin Tuna (Thunnus albacares) Origin in the Indian Ocean. Oceans. 2021; 2(3):461-476. https://0-doi-org.brum.beds.ac.uk/10.3390/oceans2030026
Chicago/Turabian StyleArtetxe-Arrate, Iraide, Igaratza Fraile, Jessica Farley, Audrey M. Darnaude, Naomi Clear, David L. Dettman, Campbell Davies, Francis Marsac, and Hilario Murua. 2021. "Otolith δ18O Composition as a Tracer of Yellowfin Tuna (Thunnus albacares) Origin in the Indian Ocean" Oceans 2, no. 3: 461-476. https://0-doi-org.brum.beds.ac.uk/10.3390/oceans2030026