
A Review of Current and New Optical Techniques for Coral Monitoring
by
 , , ,
, , ,
Jonathan Teague
1,* ,
,
David A. Megson-Smith
1 ,
,
Michael J. Allen
2,3,
John C.C. Day
1 and
Thomas B. Scott
1 1
Interface Analysis Centre (IAC), HH Wills Physics Laboratory, Bristol University, Tyndall Avenue, Bristol BS8 1TL, UK
2
Plymouth Marine Laboratory (PML), Prospect Place, The Hoe, Plymouth PL1 3DH, UK
3
College of Life and Environmental Sciences, University of Exeter, Geoffrey Pope Building, Stocker Road, Exeter EX4 4QD, UK
*
Author to whom correspondence should be addressed.
Oceans 2022, 3(1), 30-45; https://0-doi-org.brum.beds.ac.uk/10.3390/oceans3010003
Submission received: 1 May 2021
/
Revised: 3 November 2021
/
Accepted: 13 January 2022
/
Published: 20 January 2022
(This article belongs to the Special Issue The Future of Coral Reefs: Research Submitted to ICRS 2020, Bremen, Germany)
Abstract
:Monitoring the health of coral reefs is essential to understanding the damaging impacts of anthropogenic climate change as such non-invasive methods to survey coral reefs are the most desirable. Optics-based surveys, ranging from simple photography to multispectral satellite imaging are well established. Herein, we review these techniques, focusing on their value for coral monitoring and health diagnosis. The techniques are broadly separated by the primary method in which data are collected: by divers and/or robots directly within the environment or by remote sensing where data are captured above the water’s surface by planes, drones, or satellites. The review outlines a new emerging technology, low-cost hyperspectral imagery, which is capable of simultaneously producing hyperspectral and photogrammetric outputs, thereby providing integrated information of the reef structure and physiology in a single data capture.
1. Introduction
Coral reefs are strategically important for coastal nations in tropical and subtropical regions due to the valuable ecosystem goods and services they provide [1]. However, reef systems are now being impacted on a global scale by a variety of conditions, namely, “coral bleaching” [2,3], diseases [4,5], nutrient pollution [6] and algal overgrowth [7], coastal engineering [8] and sedimentation [9], crown-of-thorns [10] and sea-urchin predation [11]. Corals are particularly susceptible to environmental changes as they have low tolerance to variations in temperature, salinity, and solar radiation [12]. Sustained periods of stress can lead to coral colony death, and, in some instances, to whole reef collapse [13]. This represents a significant concern for the 275 million people who live within 30 km of these ecosystems, and who rely on these reefs for their livelihoods and food security [14].
While coral bleaching is most commonly associated with changes in sea surface temperature (SST) [3,15], it can also be a response to other external factors or triggers such as ocean acidification [16], bacterial infection [17] or shading caused by extreme turbidity [18]. The term ‘bleaching’ refers to the loss of the symbiont algal cells of the family Symbiodiniaceae, which are normally the main provider of coral colour [19,20]. The white or bleached appearance of the coral results from the calcium carbonate exoskeleton becoming visible, since the coral tissue itself is translucent [19], or as a result of polyp death.
Coral disease is another of the main causes of reef degradation and has been increasing worldwide since first studied in the 1970s in the Red Sea [21]. It has become particularly prevalent in the Caribbean [22,23], but has also been increasingly recorded in other reef systems such as the Great Barrier Reef [4,22,24,25]. Coral can become more susceptible to disease due to factors such as a decline in water quality and fish stocks, heat stress and, more recently identified, to ocean acidification driven by anthropogenic activity [26,27,28]. In some cases, specific pathogens have been identified as a primary contributor [22,29]. A diverse array of diseases have now been observed, with approximately 30 diseases and syndromes affecting the health of 150 different species worldwide [5,30]. The term ‘disease’ is used to describe symptoms arising from a known pathogen, while ‘syndrome’ refers to effects arising from an unknown causative agent, whether it be a pathogen, pollutant, or climate condition such as ocean warming [19].
Visible changes associated with coral ill-health can provide a valuable metric for the monitoring of colonies. Affected corals are frequently characterised (and named accordingly) by abnormal or decreased pigmentation in compromised tissue [31]. To date, white, brown, pink, yellow, and black line diseases have all been described [26,27,28,32].
Bleaching or disease is often identifiable by the absence of specific pigments in individual corals [33,34,35,36]. These pigments have specific wavelength peaks characteristic of their optical reflectance or fluorescence spectra. These pigments include chlorophyll-a absorption (676 nm) [37], chlorophyll-a fluorescence (685 nm), peridinin (574 nm) [38], diatoxanthin (607 nm) [38], and green fluorescent protein (GFP) (511 nm) [39].
The photosynthetic pigment chlorophyll-a and accessory pigments peridinin and diatoxanthin provide a direct insight into the symbiont density [40,41]. As these pigments are only found within the corals’ symbiotic partner Symbiodiniaceae, they provide a direct bleaching indicator. GFP fluorescence provides different insights as it is highly responsive to thermal fluctuations [15,42,43] and is often spectrally more distinctive, namely in its intensity when compared to chlorophyll fluorescence [33].
This observed specificity lends itself to utilising automated image-based techniques that can objectively quantify and monitor compromised colonies based on spectroscopic optical measurements. Current observations by human divers are unavoidably subjective and provide less robust and detailed data.
2. Current Optic Based Methods for Monitoring Coral Health
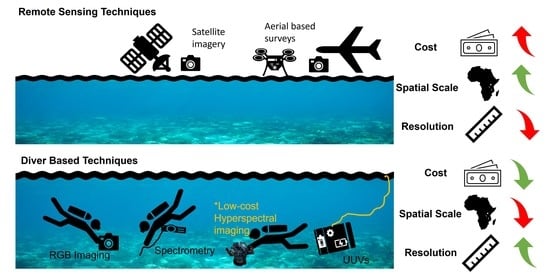
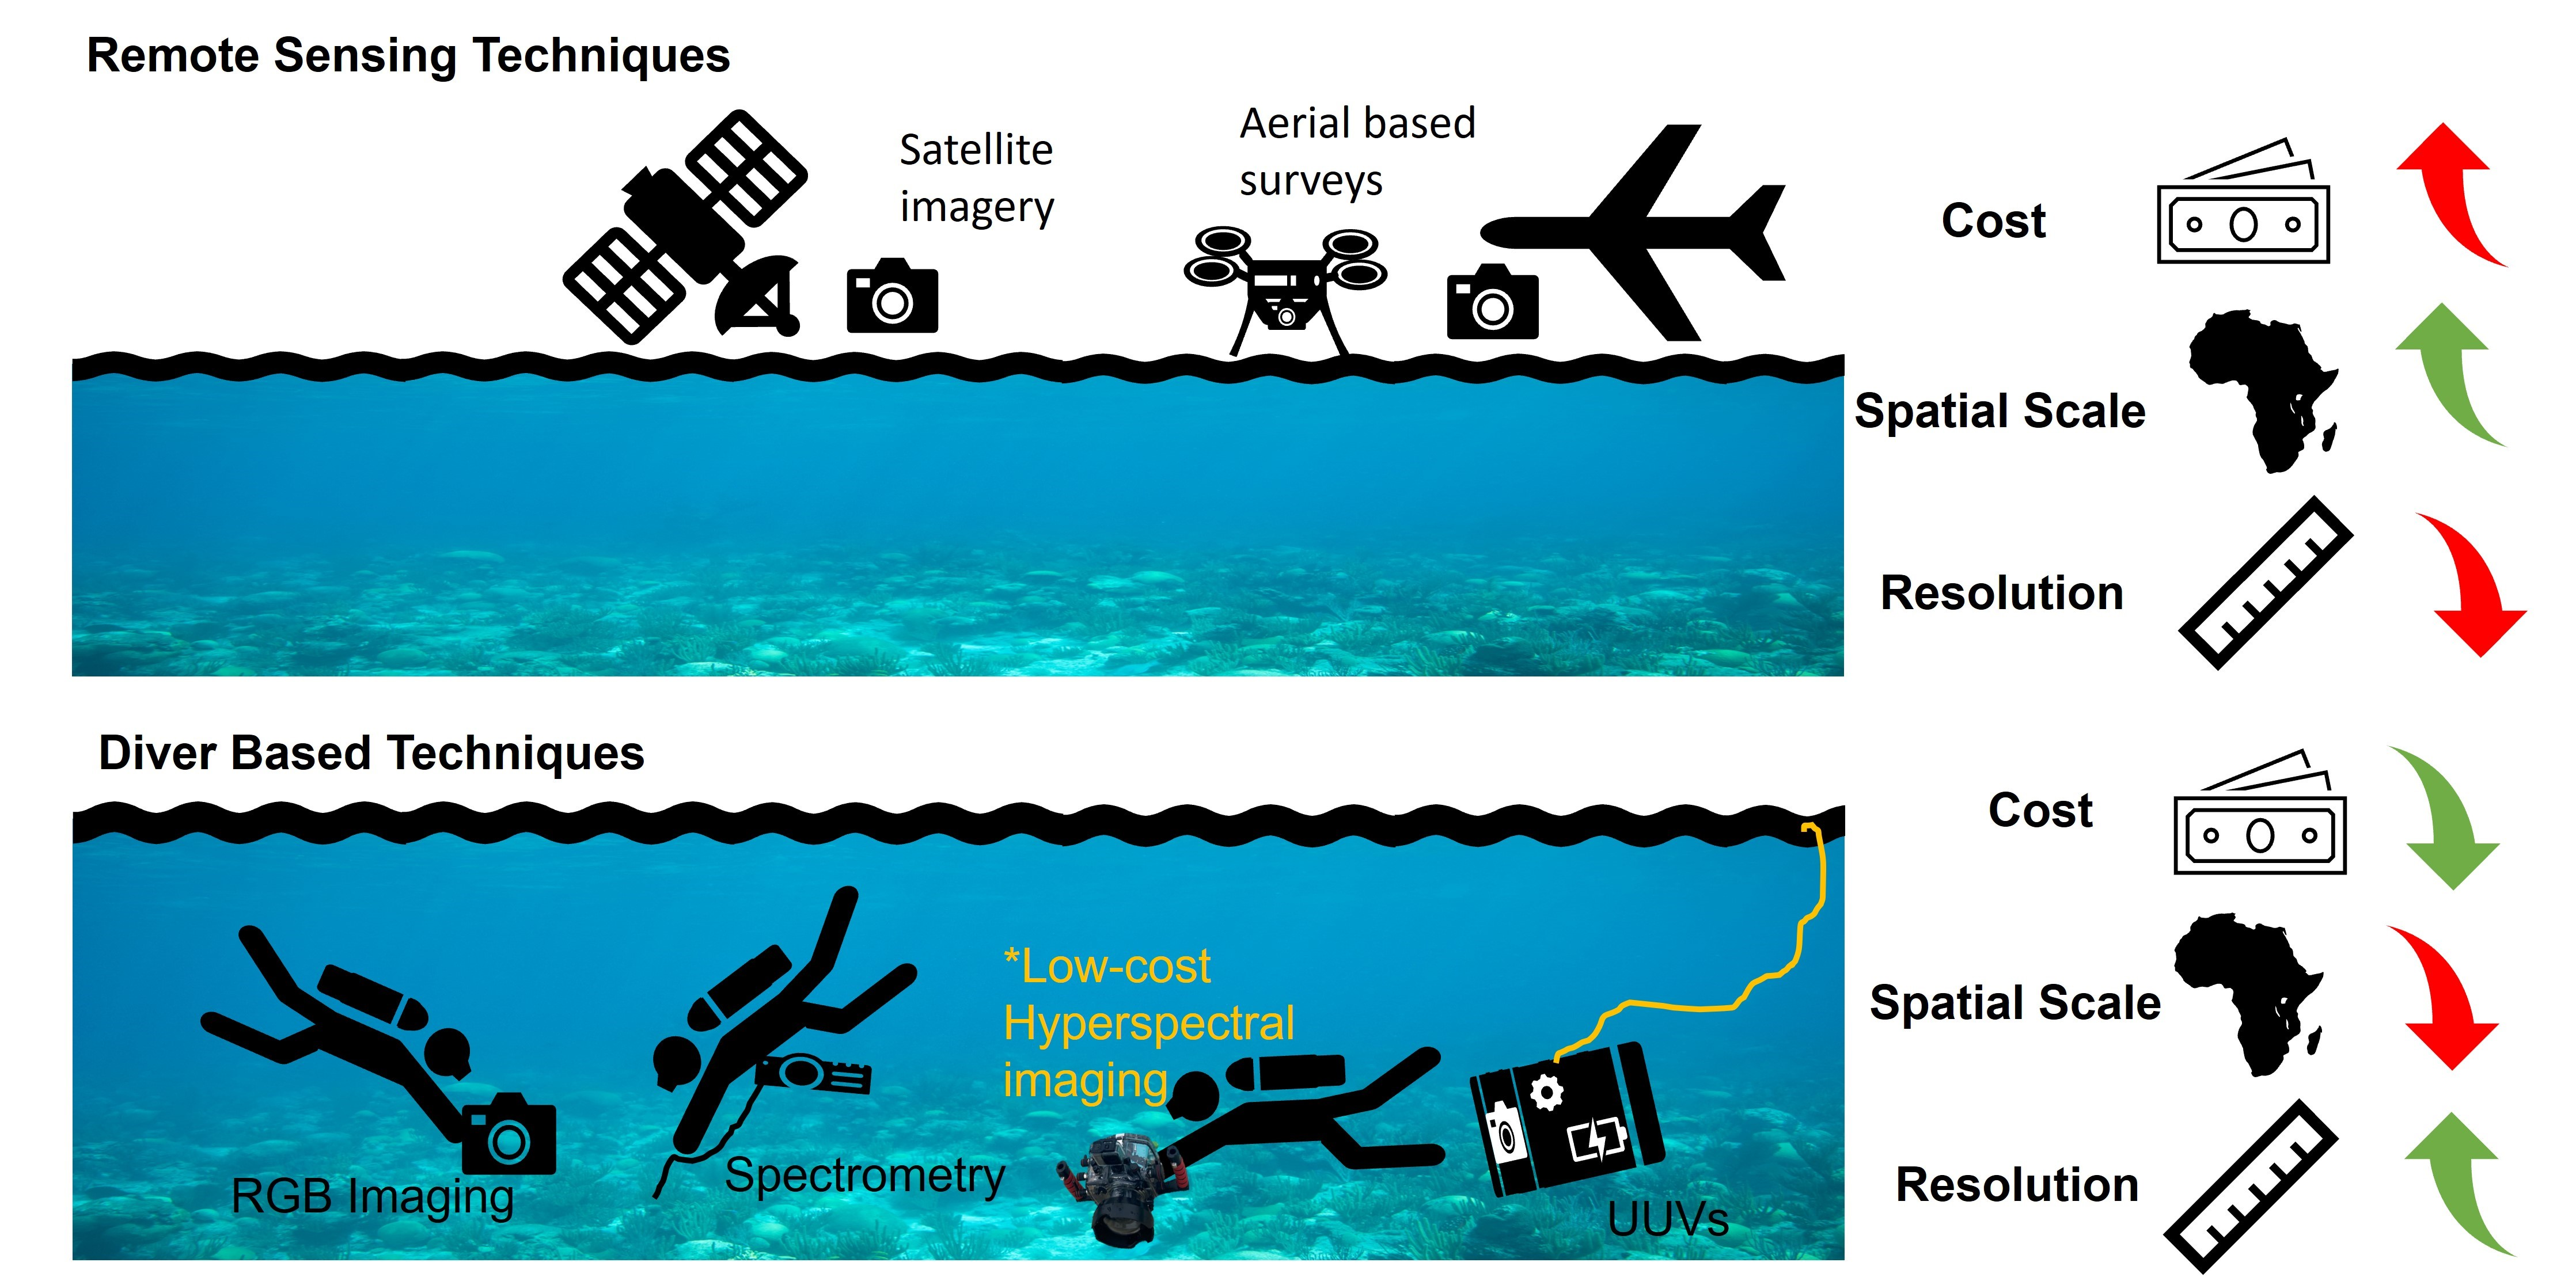
There currently exist many optical methods that make up the majority of coral health assessments ranging from underwater data collection via divers or robots to remote sensing techniques using satellites (Figure 1).
There are many factors relevant to the accurate monitoring of coral reefs. These may be biological including an abundance of coral predators, coral species composition and distribution; chemical such as pH (acidity) or the presence of nutrients; physical parameters such as temperature and turbidity; and socio-economic parameters such as marine protected areas and fishing communities [44]. This review will focus on the biological parameters.
Many current reef health survey methods employ divers as ‘observers’. The advantages of this method are that they offer a versatile set of skills for coral monitoring, being highly manoeuvrable, adaptable, and able, with training, to deliver reasonably precise results. Observers generally record basic data such as ‘percentage cover of live coral’, which is the most widely used metric of coral reef condition and is commonly used in studies that record coral reef decline and recovery across local spatial scales [45]. A drawback is that such surveys are time-consuming and so are often not able to prioritise disease identification and assessment [4,23,46,47]. A standardised survey for the assessment of coral health requires detailed examination of all coral colonies within a designated sample area (e.g., transects or quadrats), and so also involves lengthy and expensive person-intensive field time [48].
Underwater diver-generated photographic surveys employing photo-quadrats or video transects comprise the bulk of modern reef monitoring activities and may be used to record the reef substrate over hundreds of square meters. Due to difficulties associated with conducting frequent surveys over large areas by divers, there is an increasing use of ’robotic observers’ (i.e., unmanned underwater vehicles (UUVs)) that can be used to cover thousands of square meters [49,50]. The increased area coverage and data generation offered by UUVs allows for the time and human effort otherwise required for physical measurements to be better used for processing, interpretation, and analysis of the often semi-quantitative digital data.
A major advantage of image-based surveys is that the images created provide a permanent record of the habitat at the time they were taken. This reduces the dependency on in-field coral experts and provides data that can be re-analysed retrospectively or compared directly between repeat surveys. The following section describes diver-based optical survey techniques that represent the ‘classical’ approach to coral surveyance. Many of these techniques could readily be employed using UUVs, but as yet, have found limited application in this manner. This is principally due to the higher costs associated with the UUVs and the additional training required to operate them.
2.1. Diver-Based Survey Techniques
2.1.1. RGB Imaging
Digital cameras used in current photography surveys detect light in three broad colour channels: red, green, blue (RGB), centred at approximately 660 nm, 520 nm, and 450 nm, respectively. This enables similar images to be taken to those perceived by the human eye, which also sees using only these RGB channels [51]. Cameras can be employed in many coral reef surveying techniques such as photo-quadrat sampling in which quadrats are imaged via high resolution digital cameras. This secures a visual record suitable for subsequent laboratory analysis as opposed to manual in situ coverage estimates. Imaging thus allows for a reduction in diver ‘bottom time’ compared with non-image based surveyance. The advantage of laboratory analysis is that it allows for images to be run through machine learning software such as CoralNet [38], which attempt to fully or partially automate classification and benthic cover estimates. However, classification can only be made after sufficient training data are provided to the algorithm [52,53]. These types of machine learning systems are still in their infancy and, to date, can only effectively estimate the cover of common coral genera.
Images can also be interpreted to provide rudimentary colour analysis. This yields outputs similar to diver assessments undertaken qualitatively by eye using colour charts or wheels. The comparison of corals against known colour hues corresponding to different concentrations of symbionts [54] enables divers to quickly identify the extent of any coral bleaching, though other aspects of coral health may be overlooked. Performing such surveys using traditional digital camera (RGB) images is an improvement, since the intensity of individual colour channels can be recorded and interpreted. For example, the intensity of red wavelengths indicates the extent of chlorophyll absorption [55]. However, the value of the method is limited as only three broad colour bands are recorded by the camera sensor. The method can aid in preliminary assessments of bleaching, but by the point bleaching is RGB-detectable, typically around 70% or more of symbionts have already been expelled [56]. A general point to remember is that these types of survey typically only cover an individual coral colony and may not be representative of the whole reef system. They also only provide a snapshot of an environment and cannot be extrapolated to an understanding of the ongoing population dynamics of the whole reef system.
An emerging and more advanced utilisation of RGB imaging is via the creation of three-dimensional (3D) reconstructions of coral systems using photogrammetry. With recent advances in photogrammetric processing, this is now relatively quick and easy to conduct [57]. Photogrammetry uses a set of overlapping images collected either by video or still photography of a target area. Ideally adjacent images should have 60–80% overlap [58]. Physical parameters can be obtained from 3D reconstruction models of coral reefs such as surface topography, estimations of rugosity and surface area as well as coral cover and distribution [59]. Crucially, a wide range of additional information can be extracted from the same original dataset, making it a useful analysis technique when image sets are recorded. However, when using standard digital cameras, the method is still limited. Resultant images are only relevant to changes in coral colour or fluorescent emissions as detected by the three RGB channels.
2.1.2. Underwater Spectroscopic Techniques
Spectroscopic techniques can image in numerous, narrower wavelength bands across the whole visible light spectrum and mark an improvement over simple RGB imaging. The use of spectral data enables a more definitive discrimination between live coral, macroalgae, and other photoactive organisms by using the specific spectral “signature” or “fingerprints” associated with a certain organism or type of organism [60,61]. It also identifies whether corals are displaying a decline in ‘normal health’ by measuring the relative intensity of the spectral signatures arising from specific pigments associated with health such as chlorophyll. This can be achieved by using reference targets to correct for incident light variations, thereby normalising spectra so they can be compared between datasets to track changes in pigment intensity and thus bleaching.
Underwater spectrometry can be achieved by using laboratory spectrometers enclosed in waterproof housings with fibre optic probes to record radiance reflectance measurements. The fibre optic probes are held at an orthogonal angle to the solar incidence angle, approximately 0.5–1.0 cm from the target [36]. An accompanying reference measurement is required to normalise for variations in ambient illumination. This is achieved by taking a reflectance measurement from a well characterised, white Lambertian reflectance target such as polytetrafluorethylene (PTFE) or a Spectralon (Labsphere, USA). The reference spectrum enables a correction function to be applied to the data. Specialised spectrometers can also be employed for certain niche applications. For example, pulse amplitude modulation (PAM) fluorometers specifically look at fluorescence to determine the photosynthetic yield. Chlorophyll density can be used to determine relative electron transport rates of photosynthetic organisms to provide a measurement of photosynthetic efficiency [62]. This is a measure of how well chlorophyll converts light into energy and detects compromised tissues that are less efficient. The diving PAM I and II (Walz, Germany) are examples of underwater fluorometers and are the most commonly used devices in studies using this technique [3,63,64]. PAM devices do have limitations. Notably, a requirement for the sampling optical fibre probe to be held in near contact (<5 mm) with the sampled object for a long time (>30 s) to obtain accurate readings.
Spectrometers and fluorometers are able to generate more accurate spectral data but also suffer from many of the same pitfalls as RGB imaging. Data acquisition is typically slow when used to cover a whole reef system. This is mainly due to the small sampling area of the probes and the requirement to make point measurements. This limitation makes the technique particularly unsuitable for large-area surveys. Additionally, multiple points are often sampled on individual corals to obtain average spectra. However, the small number of measurements precludes confidence that these average spectra are truly representative of the whole organism or a whole reef system.
Conversely, spectroscopy techniques using imagers (multispectral and hyperspectral imaging) can generate spectra for every pixel in an image within one data acquisition. This makes the process of data collection quicker and more efficient, thereby facilitating the collection of datasets that are more comprehensive and representative. In turn, imagers can categorise and quantify colour. Spectral imagers generally comprise a dispersive element (either a prism or diffraction grating) or filter, which splits or filters incoming light into wavelengths, and an imaging detector such as a charged coupled device (CCD) or complementary metal–oxide–semiconductor device (CMOS).
Multispectral imagers record data across multiple spectral bands, typically between three and 15 bands [65]. Conversely, hyperspectral imaging records in hundreds of spectral bands, which means data may be collected and processed across the whole visible and/or near infrared spectrum with improved spectral resolution.
Previously, some multispectral systems have been deployed to assess specific marine monitoring cases. These included determining coral fluorescence using narrow bandpass filters [66] and filter wheel style imagers for classification via spectral discrimination [67]. Other imagers have been produced for applications such as the exploration of marine minerals and ores [68], but are not currently being used in coral monitoring surveys [69].
Underwater hyperspectral imaging (UHI) is a relatively new, emerging technology with limited published instances to date. Current diver operated hyperspectral systems such as the “HyperDiver” system [70] can generate hyperspectral and traditional RGB images simultaneously capturing synchronised high-resolution digital images, hyperspectral, and topographic data [70]. The system utilises a push-broom hyperspectral imager (Pika 2, Resonon Inc., Bozeman, MT, USA) with a spectral range of 400–900 nm sampled at ~1.5 nm resolution with 480 fixed bands and 640 spatial pixels [70].
Push broom or line scanning imaging methods acquire full spectral data one spatial line at a time. The line is imaged onto the entrance slit of a spectrometer, which disperses the light into its spectral components before reaching the sensor array. The composite image is constructed by either moving the slit across the image plane or by moving the entire system across the scene [71]. This is advantageous as spectral data can be gathered whilst the imager is moving, which provides both full spectral and spatial data. Other hyperspectral systems such as ‘Full data cube snapshot’ imagers work from fixed viewpoints, similar to traditional RGB imagers. In this case, a push broom effect is achieved by optically scanning a linear field of view across the hyperspectral detector within the device. The need for a stable platform and the delicate nature of the optics involved make them generally unsuitable for use in UHI.
UHI presents additional potential applications using an ‘objects of interest’ (OOI) identification technique, as described by Johnsen [72], which includes mapping and monitoring of seafloor habitats for minerals or soft versus hard bottom; seafloor pipeline inspections to determine type of material, cracks, rust, and leakage; shipwrecks (type and state of wood, nails, rust, and artefacts); deep-water coral reefs and sponge fields for species identification, area coverage and physiological state, and kelp forests (species identification, area coverage, physiological state, and growth rates of benthic organisms).
Current UHI technologies (outlined in Table 1) are generally bulky systems that are difficult to deploy and manoeuvre. For example, the “Hyperdiver” system [70] including all its additional sensors and payloads weighs 32 kg in air. Other sensors, specifically the tunable LED-based underwater multispectral imaging system (TuLUMIS) and ocean vision (UHI OV), are designed to be mounted on a UUV. The UUV provides the interface system to operate the camera as well as a translation platform. These are not easily deployed by a diver.
The use of UUVs does, however, eliminate the limitations imposed by diver reliance. For example, dive surveys require substantial amounts of time as there is a finite period a diver can spend underwater; on dives, this is usually dependent on air-tank capacity and depth. Subsequent dives can be achieved through the use of multiple air-tanks but ultimately, a diver will fatigue. The corresponding issue on UUV based surveys is battery life, although multiple batteries can be used to extend the survey time. Crucially, UUVs do not suffer fatigue and can be deployed longer than their human counterparts. A UUV can also cover a larger distance in a shorter time. For example, a 120 m squared area may take two scuba divers up to 2.5 h [4], equating to a surveying rate of 0.13 m2/s. Comparatively, a low-cost remotely operated vehicle (ROV) such as BlueROV2 can achieve survey rates of 1 m2/s. Key limitations to both divers and UUVs are repeatability and accuracy when surveying reefs because global positioning system(s) (GPS) do not work underwater. Acoustic transponder networks designed for UUVs create a way of translating GPS coordinates underwater and thus improve the repeatability and accuracy by recording accurate georeferenced data [57].
The use of UHI on UUVs is currently limited with only a few studies having been reported. One such study [73] used a prototype UHI system for mapping the seafloor for the automated identification of seabed, habitat, and OOI in coral reefs. Other studies [61], specifically using hyperspectral imaging with corals, have mainly focused on coverage and benthic discrimination with machine learning to classify corals and have not focused on assessing health or disease. The current generation of commercially available hyperspectral imagers are often cost prohibitive to both acquire and insure for marine studies. Consequently, there exists a need for technology development and application to study marine environments such as the surveyance of coral health.
2.1.3. The Potential of ‘New’ Underwater Hyperspectral Imagers
A new type of hyperspectral imaging technology that utilises linear variable filter(s) (LVF) has recently emerged. A LVF is an optical filter whose bandpass windows varies continuously across its surface [74]. LVFs allow for lower cost imagers to be produced [74]. For example, LVFs have been integrated with consumer grade digital cameras to convert them into hyperspectral imagers [74,75,76]. The Bi-Frost [74] DSLR reduces the financial burden of spectral imagers by up to 75%. Using DSLR cameras offers key advantages as they are already well implemented in underwater photography (in both scientific and hobbyist applications), making them affordable and accessible in both supply and use. Non-specialised personnel can access and use the technology with relatively little training, thus reducing dependency on highly skilled divers and marine scientists for surveying.
The Bi-Frost DSLR can be implemented in two operational modes: hyperspectral reflectance imaging (HyRi) and fluorescence imaging (HyFi). These modes use the same Bi-Frost DSLR with the only difference being the lighting conditions a used for imaging; HyRi images under sunlight/white light; and HyFi under ultraviolet (UV) produced by light emitting diodes (LEDs).
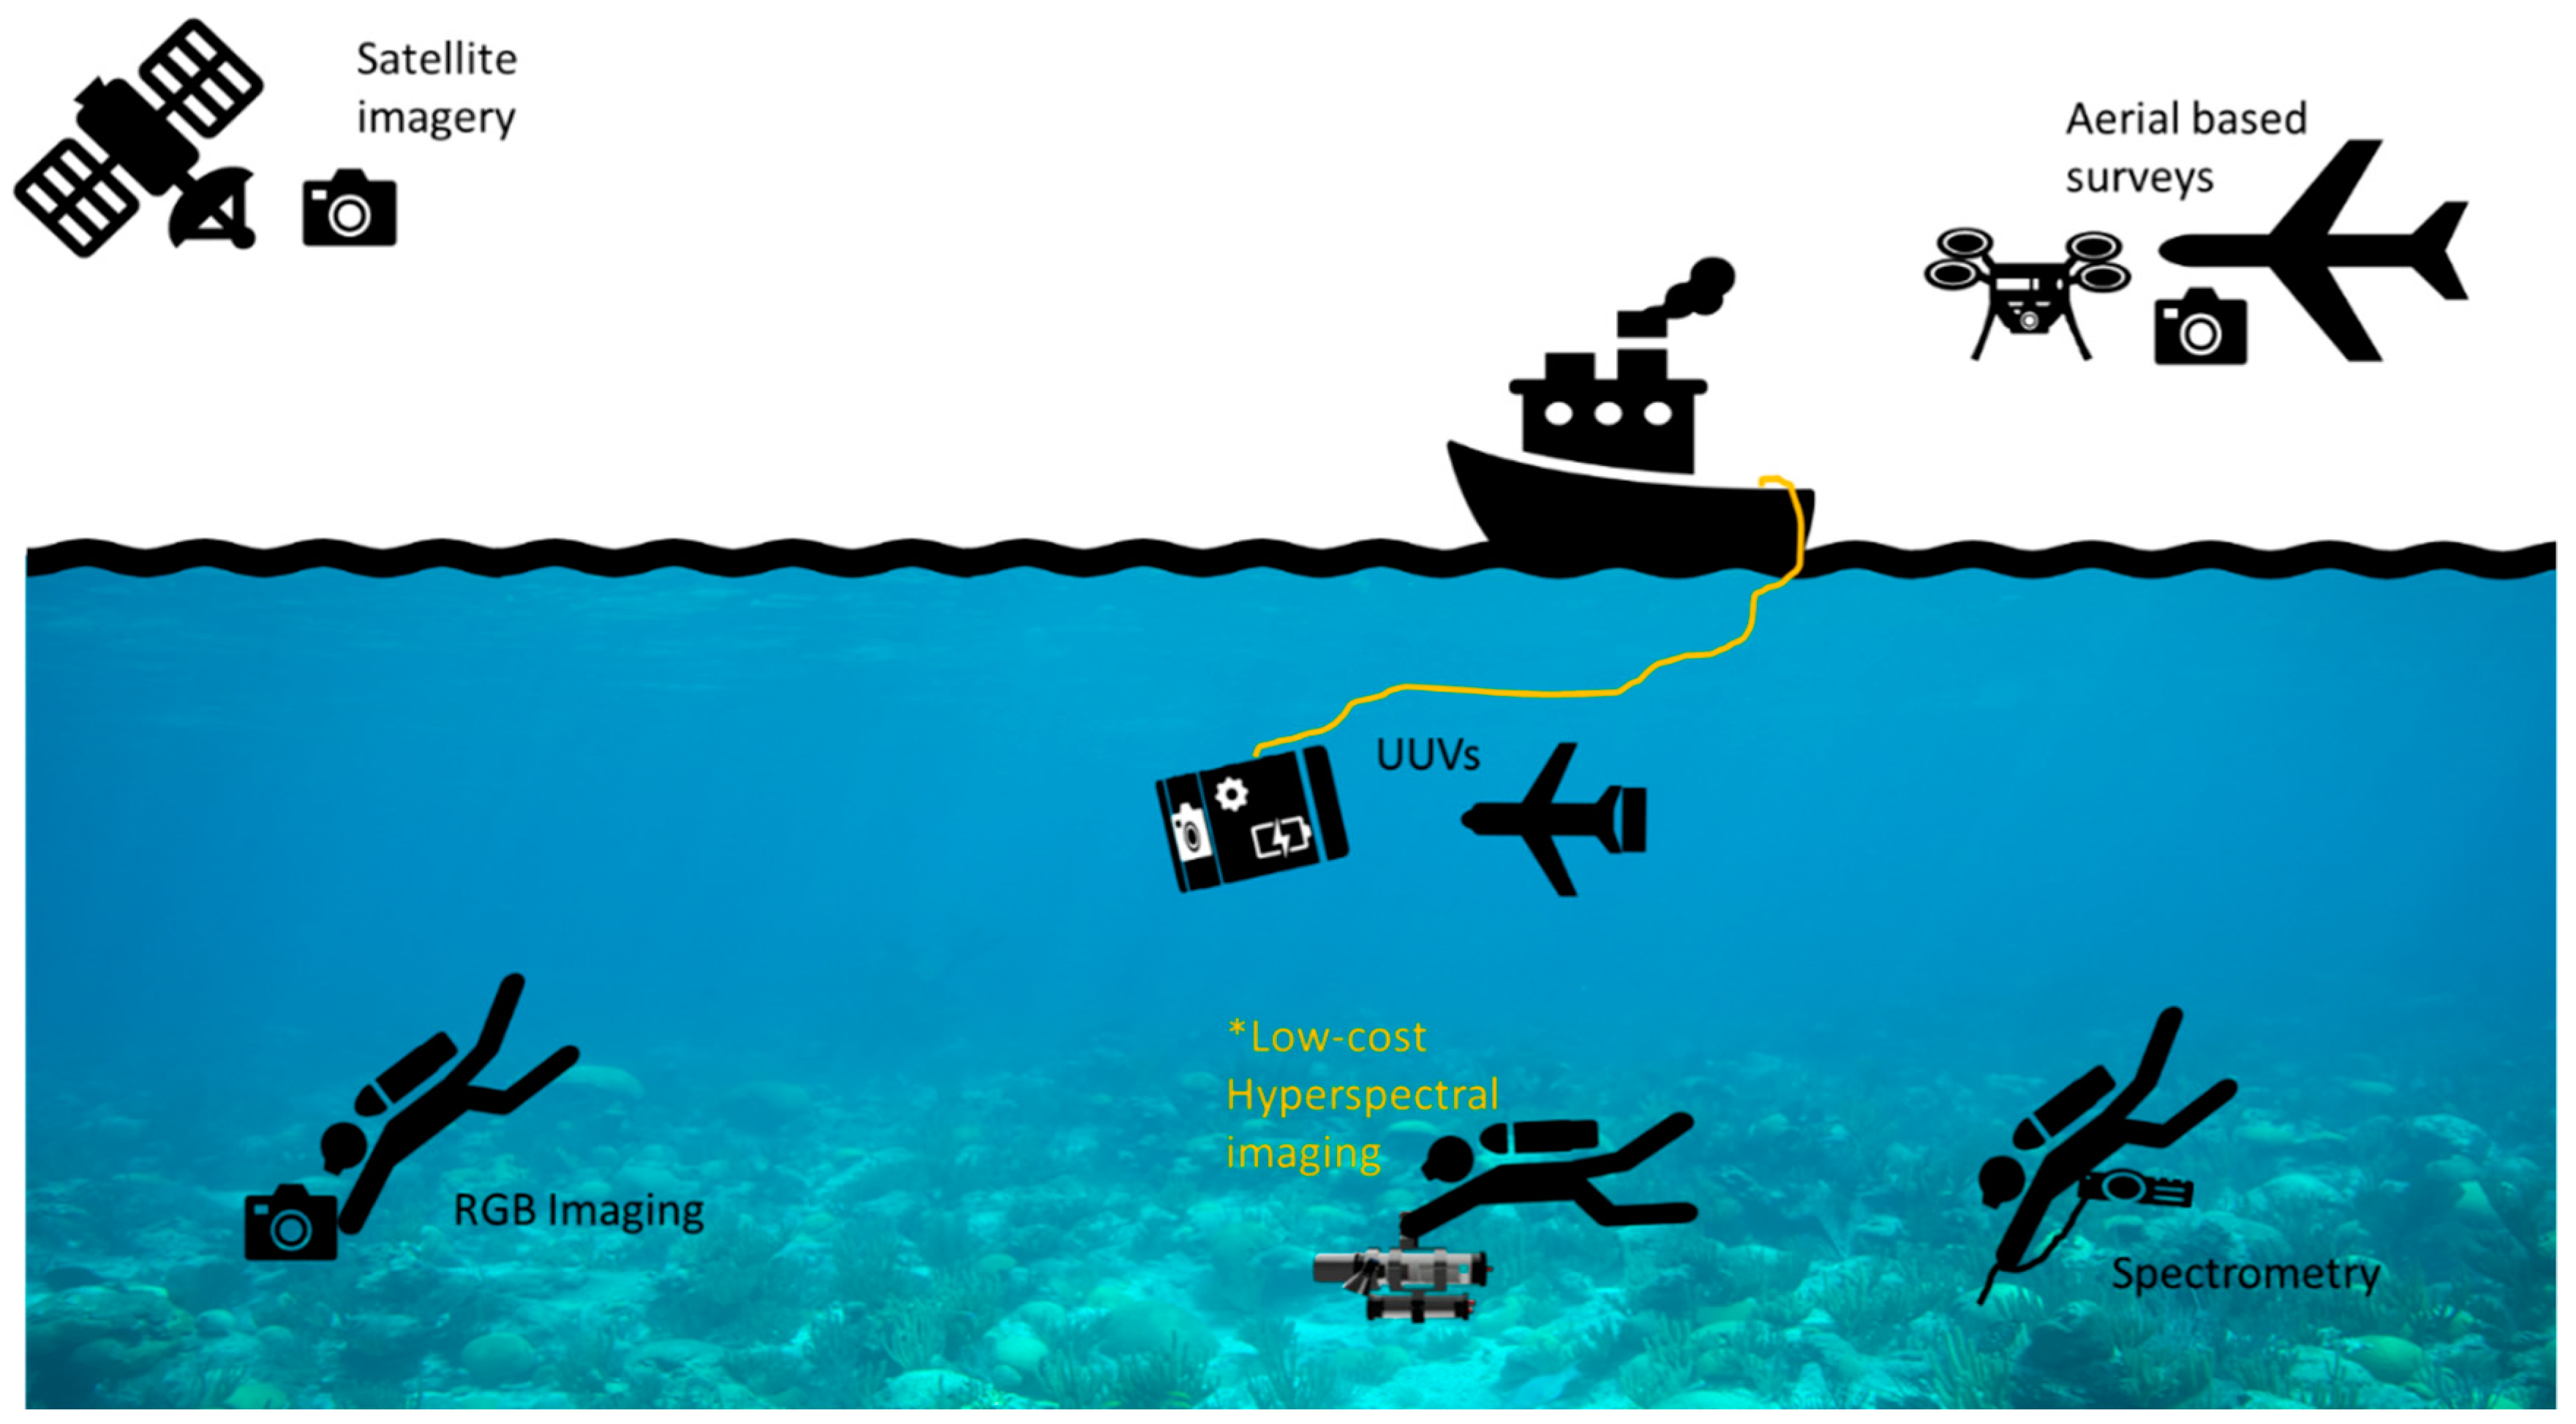
The methodology for gathering HyRi/HyFi data is similar to that of underwater photogrammetry. A delivery platform such as a diver or UUV translates the imager across a target scene in a single line for measurements on a colony scale, or a ‘lawn mower’ pattern for a reef scale [77], ensuring sufficient overlap between line intersects [57] (Figure 2).
Spectral data can be extracted from the raw images generated from Bi-Frost cameras using photogrammetric approaches. Specifically, software was developed to interface with commercially available photogrammetric solutions (Photoscan 1.3.4, Agisoft, Russia). This software can produce hypercubes of intensity data having three spatial and one wavelength coordinate. In this way, its use enables the construction of 3D models with full spectral information for each 3D surface point. The sizes of the datasets are ultimately limited by the computing power required to run the reconstruction software. This approach generates camera positions in 3D space relative to the scene for each image taken. This, in turn, allows for the accurate derivation of the correction factors needed to compensate for optical attenuation between the source and the detector. A single survey with a HyRi system therefore gathers spectral data (enabling for coral identification, zonation, physiological assessments) and 3D data (reef structure, rugosity), giving it twice the value.
2.2. Remote Sensing Techniques
Data on coral can also be gained remotely using satellite or aerial imagery combined with spectral discrimination. However, this approach is usually only able to discriminate between coral colour types and broad benthic communities, and not between coral species [33]. This section describes the remote sensing techniques, which represent the more modern approach to global coral surveyance.
2.2.1. Airborne Multi/Hyperspectral Imaging
Imaging techniques can be deployed above the water’s surface using multispectral/hyperspectral imagers. These surveys primarily look at coral distribution. However, they are limited by low spectral and spatial resolution and are only able to distinguish between coral, algae, and sand [61]. Aerial surveys can be undertaken using light aircraft or helicopters flying at an altitude of approximately 150 m. Aircraft and satellites can be equipped with multispectral and hyperspectral imagers. Aircraft are able to use benthic reflectance signatures to map the composition and condition of shallow water ecosystems in higher spatial resolution than their satellite counterparts, albeit at the cost of lower spatial scale [78]. In bleaching surveys, each reef is typically assigned a number from zero to four, these categories are associated with bleaching severity. The category classifications are as follows: CAT 0, <1% of corals bleached; CAT 1, 1–10%; CAT 2, 10–30%; CAT 3, 30–60%; and CAT 4, >60% of corals bleached [79]. Correction algorithms are required to account for loss of light through factors such as atmospheric scattering and the attenuation coefficient of water. As such, airborne surveys still require underwater ground-truthing to compare and validate these correction procedures [80].
The spatial resolution and cost of remote hyperspectral observations can be further improved by using unmanned aerial vehicles (UAVs). Lightweight hyperspectral cameras deployed on UAVs typically produce images with a spatial resolution of around 15 cm/pixel, allowing for the identification and monitoring of individual corals [81]. In a set period, this method can cover larger areas than diver or UUV solutions. Compared to manned aircraft, UAVs achieve higher resolution primarily due to the lower flight altitude (30–100 m), but at a smaller spatial scale. This technique allows for rapid data of areas of reef for preliminary assessments. For example, a 2017 study by Queensland University of Technology demonstrated that a UAV could photograph 40 hectares of coral reef in approximately 30 min to enable the study of coral bleaching [82].
2.2.2. Satellite Multi/Hyperspectral Imaging
Global programs such as the Coral Reef Watch by the National Oceanographic and Atmospheric Administration (NOAA) use satellite technology to observe and monitor reef conditions across all visible reefs. In practice, this is mainly limited to shallow reefs that are less than 25 m deep. Satellites are used to estimate SSTs and predict the potential extent of coral reef bleaching [83]. Temporal data can be used to monitor the effect of SST anomalies on coral [84]. During the warmest months of the year, often a 1 °C elevation above the monthly mean maximum can be associated with bleaching events [85]. Coral Reef Watch’s HotSpot program uses these satellite observations to provide a “Satellite Bleaching Alert” or SBA [86]. Coral Reef Watch issues four levels of SBA for 24 reef sites in the tropics [87] based on satellite near-real-time HotSpot levels. This provides an early warning system for vulnerable coral reef systems determined by the change in SST from the norm. The technique, however, is largely speculative as there is no actual data taken directly from the corals themselves and should therefore be considered as a top-level predictive tool for bleaching events.
The loss of pigmented Symbiodiniaceae from corals during mass bleaching events results in an optical signal that can be strong enough for detection by remote sensing satellites in low-Earth orbit. Multispectral satellite systems such as the Landsat satellites allow the surveys to cover vast areas quickly with around 30,000 km2 acquired in a 5-h period, with a spatial resolution of 30–60 m [88]. Other satellites such as the European Space Agency’s Sentinel-2, are able to capture data with a 290 km field of view with spatial resolution varying from 10 m to 60 m depending on the spectral band [89].
Satellites equipped with multispectral cameras are able to provide data on coral conditions as outlined below.
The Landsat Thematic Mapper (TM) carried by Landsats 4 and 5 has mapped the geomorphology of Australia’s Great Barrier Reef [90]. Landsat TM and Enhanced Thematic Mapper Plus (ETM+) have also been used to monitor changes in groups of coral reefs [91]. More recently, a detailed survey of the geological features and spectral characteristics of reefs near the Nansha Islands in the South China Sea was conducted using the Landsat 8 operational land imager (OLI) [92]. Specialised, marine focused remote sensors have also been deployed. In 2009, the Hyperspectral Imager for the Coastal Ocean (HICO) was installed on the International Space Station [93]. HICO focused on selected coastal regions and imaged them with full spectral coverage (380 to 960 nm sampled at 5.7 nm intervals). During its five years in operation, HICO collected over 10,000 scenes from around the world [94], collecting data on water clarity, bottom types, bathymetry, and on-shore vegetation maps.
Both airborne systems and instruments deployed in low-Earth orbit provide the ability to conduct large area reconnaissance of coral reef health, albeit with a relatively poor spatial resolution. These systems can image most global shallow reefs but are depth limited and struggle to map deeper reefs [95] whereas light absorption precludes the recognition of features below a critical depth threshold of approximately 20 m water depth, dependent on water clarity [96,97]. Any spectral data taken above the water’s surface require a correction for the attenuation of light through the atmosphere and the water, which are wavelength specific. These corrections vary due to daily conditions and water types, each producing variability of the spectral diffuse attenuation coefficient in coral reefs and adjacent waters [98]. Again, ground truthing is required to validate the spectra used for these corrections.
2.3. Limitations of Non-Invasive Monitoring
As outlined previously, a variety of data can be collected using these different methods of assessment to indicate coral ‘health’. Each technique generally gives multiple metrics that can be used, as summarised in Figure 3 and Figure 4.
The use of spectral techniques to look at other parameters such as distinguishing between coral species and identifying diseases and bleaching suffers from limiting factors that include phenotypic plasticity in the host, differing symbiont pigment compositions [99], and changing physical parameters of the water column [100] such as turbity.
In order to derive meaning from colour and its relation to bleaching, bar a simple presence vs. absence, the exact symbiont density and chlorophyll-a content needs to be quantified to link to their corresponding wavelengths. Unfortunately, this procedure is destructive. Typically, whole corals or tissue samples are removed for laboratory analysis. Coral health is assessed based on the composition of extracted Symbiodiniaceae and chlorophyll content [101]. Laboratory bleaching experiments allow links to be made between the effects of bleaching and pigment intensity. These experiments link the levels of symbiont density to spectral peaks and approximate the stage of bleaching that can be determined using in situ hyperspectral imagery [33]. Effective coral monitoring in this way can thus become a victim of itself; effective identification in a plethora of sites featuring the signatures of coral bleaching creates an insurmountable requirement for downstream laboratory based truthing.
Nevertheless, as outlined in Table 2 and Table 3, the techniques described have many features that contribute to their overall suitability for coral monitoring including cost, spatial scale, spectral resolution, and any additional data taken alongside sample acquisition. The choice of instrumentation is normally governed by research requirements [102,103]. The cost of the instrumentation is often the most prohibitive factor in the adoption of improved sensing strategies. For instance, to determine the global extent of coral bleaching, airborne and satellite imagers are best suited despite their cost and problems assessing deep reefs. However, as stated, ground truthing data would be required to validate and correct for atmospheric and aqueous attenuation correction algorithms. For in situ surveys that require high spectral resolution, an underwater hyperspectral system is best suited. This provides the desired spectral resolution at a non-prohibitive cost whilst simultaneously gathering related supporting measurements (see Table 4).
Therefore, the choice of the underwater spectroscopy tool is also crucial. Each imaging technique has a number of defining qualities and trade-offs regarding spectral range, resolution, scale of operation, depth rating, and cost. These determine their suitability and effectiveness in any given situation.
Looking towards the future, new spectral tools will likely emerge to address these issues. A range of underwater imagers identified by Liu (2020) [69] (Table 1) were compared as well as the new “Bi-Frost” digital single-lens reflex (DSLR) hyperspectral camera system presented in Section 2.1. Whilst spectral performance and cost are key factors, other considerations should be considered. Of particular importance are how the device is interfaced and how portable it is.

Table 1.
A comparison of the selection of underwater spectral imaging systems as outlined by Liu et al., 2020 [69] including the HyRi/HyFi ordered by cost.
Table 1.
A comparison of the selection of underwater spectral imaging systems as outlined by Liu et al., 2020 [69] including the HyRi/HyFi ordered by cost.
| Model | Developer | Spectral Range/Bands | Resolution | Spatial Imaging | Depth Rating | Cost (£) | Notes |
|---|---|---|---|---|---|---|---|
| Bi-Frost DSLR | Bristol University | 339–789 nm/192 | 18 nm@450 nm | Push-broom | 60 m | ~5000 | |
| TuLUMIS | Liu et al., 2018 [104] | 400–700 nm/8 | >10 nm | Staring array | 2000 m | ~5210.00 ($6730) | UUV mounted |
| HyperDiver | Chennu et al., 2017 [70] | 400–900 nm/480 | 1.5 nm | Push-broom | 50 m | ~20,040 (22,000 €) | Air weight ~32 kg |
| LUMIS 2 | Zawada et al., 2010 [105] | 460,522,582,678 nm/4 | 12.0–42.1 nm | Staring array | 20 m | ~46,470 ($60,000) | 4 imagers used |
| U185 | Cubert Gmbh | 450–950 nm/125 | 8 nm @ 532 nm | Snapshot | 5 m | ~49,850 (54,900 €) | |
| WaterCam | Sphere Optics | 450–950 nm/138 | 8 nm @ 532 nm | Snapshot | 5 m | ~49,850 (54,900 €) | |
| UMSI | Wu et al., 2019 [106] | 400–700 nm/31 | 10 nm | Staring | 50 m | ~56,170 ($72,800) | |
| UHI OV | Ecotone | 380–750 nm/150–200 | 2.2–5.5 nm | Push-broom | 2000 m | ~57,800 ($75,000) | UUV mounted |
LUMIS: Low-light-level underwater multispectral imaging system; UMSI: Underwater spectral imaging system; HyRi/HyFi: Hyperspectral reflectance/fluorescence imager; TuLUMIS: Tunable LED-based underwater multispectral imaging system; UHI OV: Ocean Vision (costs derived from manufacturers quotes with exchange rate applied on 8 October 2020.
Table 2.
Optical techniques rated by cost, spatial scale, spatial resolution, and additional data gathered.
Table 2.
Optical techniques rated by cost, spatial scale, spatial resolution, and additional data gathered.
| Technique | Cost | Spatial Scale | Spatial Resolution | Additional Data Gathered | Notes |
|---|---|---|---|---|---|
| RGB imaging (Based on GoPro) | Very Low | Moderate | Very High | Photogrammetry | Limited spectral data obtained |
| Spectrometers (Waltz Diving PAM) | Moderate | Very Low | Very High | N/A | N/A |
| Bi-Frost DSLR | Low | Moderate | Very High | Photogrammetry, Fluorescence (HyFi) | Night-time imaging required for Fluorescence |
| Current UHI systems (See Table 4) | Moderate to High | Moderate | Very High to Moderate | N/A | Often large and cumbersome or designed specifically for UUVs |
| Drone multi/hyperspectral imaging [81] | Moderate to High | Moderate | Moderate | N/A | Requires Ground truthing |
| Aeroplane multi/hyperspectral imaging [61,107] | High | High | Moderate to Low | N/A | Requires Ground truthing |
| Satellite multi/hyperspectral imaging [108] | * Very High | Very High | Low to Very Low | SST, RGB images (Dependant on additional sensors equipped) | Requires Ground truthing |
HyFi: hyperspectral fluorescence imaging, UUV’s: unmanned underwater vehicles, SST: Sea surface temperatures. * Based on total cost of building and launching into orbit.
Table 3.
Guide to rankings for each classification outlined in Table 2.
Table 3.
Guide to rankings for each classification outlined in Table 2.
| Classification | Cost | Spatial Scale | Spatial Resolution |
|---|---|---|---|
| Very Low | <£1000 | mm–cm | km |
| Low | <£5000 | m | <100 m |
| Moderate | <£10,000 | <100 m | <10 m |
| High | >£25,000 | km | m |
| Very High | >£100,000 | 100+ km | mm-cm |
Table 4.
An outline of the ability of the different optical techniques to assess important criteria used in coral surveyance as outlined by Leujak and Ormond, 2007 [103].
Table 4.
An outline of the ability of the different optical techniques to assess important criteria used in coral surveyance as outlined by Leujak and Ormond, 2007 [103].
| Criteria | RGB Imaging | Spectrometers | Bi-Frost DSLR | Drone Multi/Hyperspectral Imaging | Aeroplane Multi/Hyperspectral Imaging | Satellite Multi/Hyperspectral Imaging |
|---|---|---|---|---|---|---|
| Damage (Disease/Bleaching) | Yes | Yes (Local Scale) | Yes | Yes | Yes (Mass Scale) | Yes (Mass Scale) |
| Recruits | Yes (modified camera) | No | Yes (HyFi) | No | No | No |
| Number of Colonies | Yes | No | Yes | Yes | Yes (Height Dependent) | No |
| Growth Measurements | Yes | No | Yes | No | No | No |
| Repeatability * | No | No | Yes (Reef Scale) | Yes | Yes | Yes |
* Repeatability was defined as the possibility of returning to exactly the same sampling unit in future monitoring.
3. Concluding Remarks
Current optical monitoring methods use a range of different approaches to answer the overly simplified question of ‘Is this coral reef healthy?’. Due to coral reefs being physically and ecologically complex ecosystems, each technique offers a different piece of the puzzle, shedding light on parameters pertaining to overall reef health and status.
The Earth’s coral reefs face a difficult and challenging future. If they are to survive the impending onslaught, effective monitoring and assessment will be fundamental to aiding in their recovery. A wealth of technological know-how is already being applied to study coral reefs from the colony to global scale. Consequently, our understanding of the problem and its severity continues to improve. New tools are being developed to help facilitate all survey requirements across all scales. On the larger scale, satellites and aerial multispectral/hyperspectral imaging provide the greatest spatial coverage with the trade-off of reduced spatial resolution. For colony or reef scale surveys, HyRi can produce high spatial resolution but cannot replace remote systems. Rather, it is a tool to complement these assessments and provide ground truth data to look at environments in closer detail. The use of in situ imagers also enables areas to be studied where aerial imaging is not applicable such as deep reefs or reefs with complex structures (i.e., steep reef faces/walls and overhangs). Aerial based imaging is unsuitable for deep coral studies, but tends to work best in mapping shallow lagoons and reef flats as these are within the depth threshold for this type of imaging (20 m) [96].
In the near future, Bi-Frost DSLRs are predicted to be a powerful new addition in the diagnostic toolbox for coral health. The benefits of enabling rapid non-destructive and repeatable measurements [33] address many of the shortcomings of the current generation of UHI instruments. The 3D data obtained with a Bi-Frost DSLR can be used in many ways, making this single tool capable of recording data for several different diagnostic needs from health to population surveys.
Author Contributions
Conceptualization, J.C.C.D. and J.T.; Methodology, J.T.; Software, D.A.M.-S.; Validation, J.C.C.D., J.T. and D.A.M.-S.; Investigation, J.T.; Writing—original draft preparation, J.T.; Writing—review and editing, M.J.A., J.C.C.D., D.A.M.-S. and T.B.S.; Supervision, J.C.C.D. and T.B.S.; Funding acquisition, T.B.S. All authors have read and agreed to the published version of the manuscript.
Funding
Pervioli Foundation, Roddenberry Foundation, and Bristol Alumni Foundation.
Institutional Review Board Statement
Not applicable.
Informed Consent Statement
Not applicable.
Data Availability Statement
Not applicable.
Acknowledgments
We would like to acknowledge the editor Rupert Ormond for his guidance and wisdom to better focus the manuscript. We would also like to thank James Alexandroff for his continued support without which this project would not be possible.
Conflicts of Interest
The authors declare no conflict of interest.
References
- Moberg, F.; Folke, C. Ecological goods and services of coral reef ecosystems. Ecol. Econ. 1999, 29, 215–233. [Google Scholar] [CrossRef]
- Douglas, A.E. Coral bleaching—How and why? Mar. Pollut. Bull. 2003, 46, 385–392. [Google Scholar] [CrossRef]
- Ralph, P.J.; Gademann, R.; Larkum, A. Zooxanthellae expelled from bleached corals at 33 °C are photosynthetically competent. Mar. Ecol. Prog. Ser. 2001, 220, 163–168. [Google Scholar] [CrossRef] [Green Version]
- Willis, B.L.; Page, C.A.; Dinsdale, E.A. Coral Disease on the Great Barrier Reef. Coral Health Dis. 2002, 69–104. [Google Scholar] [CrossRef]
- Sutherland, K.P.; Porter, J.W.; Torres, C. Disease and immunity in Caribbean and Indo-Pacific zooxanthellate corals. Mar. Ecol. Prog. Ser. 2004, 266, 273–302. [Google Scholar] [CrossRef] [Green Version]
- Zaneveld, J.R.; Burkepile, D.E.; Shantz, A.; Pritchard, C.E.; McMinds, R.; Payet, J.P.; Welsh, R.; Correa, A.M.S.; Lemoine, N.P.; Rosales, S.; et al. Overfishing and nutrient pollution interact with temperature to disrupt coral reefs down to microbial scales. Nat. Commun. 2016, 7, 11833. [Google Scholar] [CrossRef]
- Mumby, P.J. The Impact of Exploiting Grazers (Scaridae) on the Dynamics of Caribbean Coral Reefs. Ecol. Appl. 2006, 16, 747–769. [Google Scholar] [CrossRef] [Green Version]
- Mora, C. A clear human footprint in the coral reefs of the Caribbean. Proc. R. Soc. B Boil. Sci. 2008, 275, 767–773. [Google Scholar] [CrossRef] [PubMed] [Green Version]
- Wenger, A.S.; Fabricius, K.E.; Jones, G.P.; Brodie, J.E. Effects of sedimentation, eutrophication, and chemical pollution on coral reef fishes. In Ecology of Fishes on Coral Reefs; Mora, C., Ed.; Cambridge University Press: Cambridge, UK, 2015; pp. 145–153. [Google Scholar]
- Kayal, M.; Vercelloni, J.; De Loma, T.L.; Bosserelle, P.; Chancerelle, Y.; Geoffroy, S.; Stievenart, C.; Michonneau, F.; Penin, L.; Planes, S.; et al. Predator Crown-of-Thorns Starfish (Acanthaster planci) Outbreak, Mass Mortality of Corals, and Cascading Effects on Reef Fish and Benthic Communities. PLoS ONE 2012, 7, e47363. [Google Scholar] [CrossRef] [Green Version]
- Bak, R.P.M.; van Eys, G. Predation of the sea urchin Diadema antillarum Philippi on living coral. Oecologia 1975, 20, 111–115. [Google Scholar] [CrossRef]
- Hoegh-Guldberg, O. Climate change, coral bleaching and the future of the world’s coral reefs. Mar. Freshw. Res. 1999, 50, 839–866. [Google Scholar] [CrossRef] [Green Version]
- Hoegh-Guldberg, O.; Pendleton, L.; Kaup, A. People and the changing nature of coral reefs. In Regional Studies in Marine Science; Elsevier: Amsterdam, The Netherlands, 2019; Volume 30, p. 100699. [Google Scholar] [CrossRef]
- Lamb, J.B.; True, J.D.; Piromvaragorn, S.; Willis, B.L. Scuba diving damage and intensity of tourist activities increases coral disease prevalence. Biol. Conserv. 2014, 178, 88–96. [Google Scholar] [CrossRef]
- Roth, M.S.; Deheyn, D.D. Effects of cold stress and heat stress on coral fluorescence in reef-building corals. Sci. Rep. 2013, 3, 1421. [Google Scholar] [CrossRef] [Green Version]
- Hoegh-Guldberg, O.; Mumby, P.J.; Hooten, A.J.; Steneck, R.S.; Greenfield, P.; Gomez, E.; Harvell, C.D.; Sale, P.F.; Edwards, A.J.; Caldeira, K.; et al. Coral Reefs Under Rapid Climate Change and Ocean Acidification. Science 2007, 318, 1737–1742. [Google Scholar] [CrossRef] [PubMed] [Green Version]
- Glynn, P.W. Coral reef bleaching: Ecological perspectives. Coral Reefs 1993, 12, 1–17. [Google Scholar] [CrossRef]
- Rogers, C.S. The effect of shading on coral reef structure and function. J. Exp. Mar. Biol. Ecol. 1979, 41, 269–288. [Google Scholar] [CrossRef]
- Sheppard, C.; Davy, S.; Pilling, G.; Graham, N. The Biology of Coral Reefs; Oxford University Press: Oxford, UK, 2017. [Google Scholar]
- Field, S.F.; Bulina, M.Y.; Kelmanson, I.V.; Bielawski, J.P.; Matz, M.V. Adaptive Evolution of Multicolored Fluorescent Proteins in Reef-Building Corals. J. Mol. Evol. 2006, 62, 332–339. [Google Scholar] [CrossRef] [PubMed]
- Antonius, A. The ‘band’ diseases in coral reefs. In Proceedings of the Fourth International Coral Reef Symposium, Manila, Philippines, 18–22 May 1981. [Google Scholar]
- Galloway, S.B.; Bruckner, A.W.; Woodley, C.M. The Global Perspective on Incidence and Prevalence of Coral Diseases; NOAA Technical Memorandum NOS NCCOS 97 and CRCP 7; National Oceanic and Atmospheric Administration: Silver Spring, MD, USA, 2009. [Google Scholar]
- Ruiz-Moreno, D.; Willis, B.L.; Page, A.C.; Weil, E.; Croquer, A.; Vargas-Angel, B.; Jordan-Garza, A.G.; Jordán-Dahlgren, E.; Raymundo, L.; Harvell, C.D. Global coral disease prevalence associated with sea temperature anomalies and local factors. Dis. Aquat. Org. 2012, 100, 249–261. [Google Scholar] [CrossRef] [Green Version]
- Dinsdale, A.E. Abundance of black-band disease on corals from one location on the Great Barrier Reef: A comparison with abundance in the Caribbean region. In Proceedings of the 9th International Coral Reef Symposium, Bali, Indonesia, 23–27 October 2000. [Google Scholar]
- Miller, I. Black band disease on the Great Barrier Reef. Coral Reefs 1996, 15, 58. [Google Scholar]
- Cervino, J.M.; Thompson, F.L.; Gomez-Gil, B.; Lorence, E.A.; Goreau, T.J.; Hayes, R.L.; Winiarski-Cervino, K.B.; Smith, G.W.; Hughen, K.; Bartels, E.; et al. The Vibrio core group induces yellow band disease in Caribbean and Indo-Pacific reef-building corals. J. Appl. Microbiol. 2008, 105, 1658–1671. [Google Scholar] [CrossRef]
- Bongiorni, L.; Rinkevich, B. The pink-blue spot syndrome in Acropora eurystoma (Eilat, Red Sea): A possible marker of stress? Zoology 2005, 108, 247–256. [Google Scholar] [CrossRef]
- Ravindran, J.; Raghukumar, C. Pink-line syndrome, a physiological crisis in the scleractinian coral Porites lutea. Mar. Biol. 2006, 149, 347–356. [Google Scholar] [CrossRef]
- Antonius, A. Black band disease infection experiments on hexacorals and octocorals. In Proceedings of the Fifth International Coral Reef Congress, Tahiti, French, 27 May–1 June 1985. [Google Scholar]
- Green, E.P.; Bruckner, A.W. The significance of coral disease epizootiology for coral reef conservation. Biol. Conserv. 2000, 96, 347–361. [Google Scholar] [CrossRef]
- Palmer, C.V.; Modi, C.K.; Mydlarz, L.D. Coral Fluorescent Proteins as Antioxidants. PLoS ONE 2009, 4, e7298. [Google Scholar] [CrossRef] [PubMed] [Green Version]
- Muller, E.M.; Van Woesik, R. Caribbean coral diseases: Primary transmission or secondary infection? Glob. Chang. Biol. 2012, 18, 3529–3535. [Google Scholar] [CrossRef]
- Teague, J.; Willans, J.; Allen, M.; Scott, T.; Day, J. Hyperspectral imaging as a tool for assessing coral health utilising natural fluorescence. J. Spectr. Imaging 2019, 8, a7. [Google Scholar] [CrossRef] [Green Version]
- Holden, H.; LeDrew, E. Spectral Discrimination of Healthy and Non-Healthy Corals Based on Cluster Analysis, Principal Components Analysis, and Derivative Spectroscopy. Remote Sens. Environ. 1998, 65, 217–224. [Google Scholar] [CrossRef]
- Myers, M.R.; Hardy, J.T.; Mazel, C.H.; Dustan, P. Optical spectra and pigmentation of Caribbean reef corals and macroalgae. Coral Reefs 1999, 18, 179–186. [Google Scholar] [CrossRef]
- Leiper, I.A.; Siebeck, U.E.; Marshall, N.J.; Phinn, S.R. Coral health monitoring: Linking coral colour and remote sensing techniques. Can. J. Remote Sens. 2009, 35, 276–286. [Google Scholar] [CrossRef] [Green Version]
- Brown, J.S. Absorption and fluorescence spectra of chlorophyll-proteins isolated from Euglena gracilis. Biochim. Biophys. ActaBioenergy 1980, 591, 9–21. [Google Scholar] [CrossRef]
- Falkowski, P.; Knoll, A.H. Evolution of Primary Producers in the Sea; Academic Press; Elsevier: New York, NY, USA, 2007. [Google Scholar]
- Alieva, N.O.; Konzen, K.A.; Field, S.F.; Meleshkevitch, E.A.; Hunt, M.E.; Beltran-Ramirez, V.; Miller, D.J.; Wiedenmann, J.; Salih, A.; Matz, M.V. Diversity and Evolution of Coral Fluorescent Proteins. PLoS ONE 2008, 3, e2680. [Google Scholar] [CrossRef] [PubMed] [Green Version]
- Gil, T.S.; Corredor, J. Studies of photosynthetic pigments of zooxanthellae in Caribbean hermatypic corals. In Proceedings of the Fourth International Coral Reefs Symposium, Manila, Philippines, 18–22 May 1981. [Google Scholar]
- Venn, A.A.; Wilson, M.A.; Trapido-Rosenthal, H.G.; Keely, B.J.; Douglas, A.E. The impact of coral bleaching on the pigment profile of the symbiotic alga, Symbiodinium. Plant Cell Environ. 2006, 29, 2133–2142. [Google Scholar] [CrossRef] [PubMed]
- Rodriguez-Lanetty, M.; Harii, S.; Hoegh-Guldberg, O. Early molecular responses of coral larvae to hyperthermal stress. Mol. Ecol. 2009, 18, 5101–5114. [Google Scholar] [CrossRef]
- Desalvo, M.K.; Voolstra, C.R.; Sunagawa, S.; Schwarz, J.A.; Stillman, J.H.; Coffroth, M.A.; Szmant, A.M.; Medina, M. Differential gene expression during thermal stress and bleaching in the Caribbean coralMontastraea faveolata. Mol. Ecol. 2008, 17, 3952–3971. [Google Scholar] [CrossRef]
- Hill, J.; Wilkinson, C. Methods for Ecological Monitoring of Coral Reefs; Australian Institute of Marine Science: Townsville, Australia, 2004.
- Bruno, J.F.; Selig, E.R. Regional Decline of Coral Cover in the Indo-Pacific: Timing, Extent, and Subregional Comparisons. PLoS ONE 2007, 2, e711. [Google Scholar] [CrossRef] [Green Version]
- Page, C.A.; Baker, D.M.; Harvell, C.D.; Golbuu, Y.; Raymundo, L.; Neale, S.J.; Rosell, K.B.; Rypien, K.L.; Andras, J.P.; Willis, B.L. Influence of marine reserves on coral disease prevalence. Dis. Aquat. Organ. 2009, 87, 135–150. [Google Scholar] [CrossRef] [PubMed] [Green Version]
- Page, C.A.; Field, S.N.; Pollock, F.J.; Lamb, J.; Shedrawi, G.; Wilson, S.K. Assessing coral health and disease from digital photographs and in situ surveys. Environ. Monit. Assess. 2016, 189, 18. [Google Scholar] [CrossRef]
- Raymundo, L.J.; Couch, C.S.; Bruckner, A.W.; Harvell, C.D. Coral Disease Handbook: Guidelines for Assessment, Monitoring & Management; Coral Reef Targeted Research & Capacity Building for Management (CRTR); Currie Communications: Melbourne, Australia, 2008. [Google Scholar]
- Patterson, M.R.; Relles, N.J. Autonomous Underwater Vehicles resurvey Bonaire: A new tool for coral reef management. In Proceedings of the 11th International Coral Reef Symposium, Fort Lauderdale, FL, USA, 7–11 July 2008. [Google Scholar]
- Williams, S.B.; Pizarro, O.; Jakuba, M.V.; Johnson, C.; Barrett, N.; Babcock, R.; Kendrick, G.; Steinberg, P.D.; Heyward, A.J.; Doherty, P.; et al. Monitoring of Benthic Reference Sites: Using an Autonomous Underwater Vehicle. IEEE Robot. Autom. Mag. 2012, 19, 73–84. [Google Scholar] [CrossRef]
- Bokolonga, E.; Hauhana, M.; Rollings, N.; Aitchison, D.; Assaf, M.; Das, S.R.; Biswas, S.N.; Groza, V.; Petriu, E.M. A compact multispectral image capture unit for deployment on drones. In Proceedings of the Conference Record-IEEE Instrumentation and Measurement Technology Conference, Taipei, Taiwan, 23–26 May 2016. [Google Scholar]
- Beijbom, O.; Edmunds, P.J.; Roelfsema, C.; Smith, J.; Kline, D.I.; Neal, B.P.; Dunlap, M.J.; Moriarty, V.; Fan, T.Y.; Tan, C.J.; et al. Towards Automated Annotation of Benthic Survey Images: Variability of Human Experts and Operational Modes of Automation. PLoS ONE 2015, 10, e0130312. [Google Scholar] [CrossRef]
- Williams, I.D.; Couch, C.; Beijbom, O.; Oliver, T.; Vargas-Angel, B.; Schumacher, B.; Brainard, R. Leveraging Automated Image Analysis Tools to Transform Our Capacity to Assess Status and Trends of Coral Reefs. Front. Mar. Sci. 2019, 6, 222. [Google Scholar] [CrossRef] [Green Version]
- Siebeck, U.E.; Marshall, N.J.; Klüter, A.; Hoegh-Guldberg, O. Monitoring coral bleaching using a colour reference card. Coral Reefs 2006, 25, 453–460. [Google Scholar] [CrossRef]
- Winters, G.; Holzman, R.; Blekhman, A.; Beer, S.; Loya, Y. Photographic assessment of coral chlorophyll contents: Implications for ecophysiological studies and coral monitoring. J. Exp. Mar. Bio. Ecol. 2009, 380, 25–35. [Google Scholar] [CrossRef]
- Fitt, W.K.; McFarland, F.K.; Warner, M.E.; Chilcoat, G.C. Seasonal patterns of tissue biomass and densities of symbiotic dinoflagellates in reef corals and relation to coral bleaching. Limnol. Oceanogr. 2000, 45, 677–685. [Google Scholar] [CrossRef] [Green Version]
- Teague, J.; Scott, T.B. Underwater Photogrammetry and 3D Reconstruction of Submerged Objects in Shallow Environments by ROV and Underwater GPS. J. Mar. Sci. Res. Technol. 2017, 1, 1. [Google Scholar]
- Colomina, I.; Molina, P. Unmanned aerial systems for photogrammetry and remote sensing: A review. ISPRS J. Photogramm. Remote Sens. 2014, 92, 79–97. [Google Scholar] [CrossRef] [Green Version]
- Bayley, D.T.I.; Mogg, A.O.M. A protocol for the large-scale analysis of reefs using Structure from Motion photogrammetry. Methods Ecol. Evol. 2020, 11, 1410–1420. [Google Scholar] [CrossRef]
- Hedley, J.D.; Mumby, P.J. Biological and remote sensing perspectives of pigmentation in coral reef organisms. Adv. Mar. Biol. 2002, 43, 277–317. [Google Scholar] [CrossRef]
- Hochberg, E.J.; Atkinson, M.J. Spectral discrimination of coral reef benthic communities. Coral Reefs 2000, 19, 164–171. [Google Scholar] [CrossRef]
- Jones, R.J.; Kildea, T.; Hoegh-Guldberg, O. PAM Chlorophyll Fluorometry: A New in situ Technique for Stress Assessment in Scleractinian Corals, used to Examine the Effects of Cyanide from Cyanide Fishing. Mar. Pollut. Bull. 1999, 38, 864–874. [Google Scholar] [CrossRef]
- Chauka, L.J.; Steinert, G.; Mtolera, M.S.P. Influence of local environmental conditions and bleaching histories on the diversity and distribution of Symbiodinium in reef-building corals in Tanzania. Afr. J. Mar. Sci. 2016, 63, 57–64. [Google Scholar] [CrossRef]
- Kurihara, H.; Takahashi, A.; Reyes-Bermudez, A.; Hidaka, M. Intraspecific variation in the response of the scleractinian coral Acropora digitifera to ocean acidification. Mar. Biol. 2018, 165, 38. [Google Scholar] [CrossRef]
- Chang, C.I. Hyperspectral Imaging: Techniques for Spectral Detection and Classification; Springer Science & Business Media: Berlin, Germany, 2003. [Google Scholar]
- Zawada, D.G. The Application of a Novel Multispectral Imaging System to the in vivo Study of Flourescent Compounds in Selected Marine Organisms. Ph.D. Thesis, University of California, San Diego, CA, USA, 2002. [Google Scholar]
- Gleason, A.C.R.; Reid, R.P.; Voss, K.J. Automated classification of underwater multispectral imagery for coral reef monitoring. In Proceedings of the Oceans Conference Record (IEEE), Charleston, WV, USA, 29 September–4 October 2007. [Google Scholar]
- Sture, O.; Ludvigsen, M.; Soreide, F.; Aas, L.M.S. Autonomous underwater vehicles as a platform for underwater hyperspectral imaging. In Proceedings of the OCEANS 2017, Aberdeen, UK, 19–22 June 2017. [Google Scholar]
- Liu, B.; Liu, Z.; Men, S.; Li, Y.; Ding, Z.; He, J.; Zhao, Z. Underwater Hyperspectral Imaging Technology and Its Applications for Detecting and Mapping the Seafloor: A Review. Sensors 2020, 20, 4962. [Google Scholar] [CrossRef]
- Chennu, A.; Färber, P.; De’Ath, G.; De Beer, D.; Fabricius, K.E. A diver-operated hyperspectral imaging and topographic surveying system for automated mapping of benthic habitats. Sci. Rep. 2017, 7, 7122. [Google Scholar] [CrossRef] [PubMed]
- Maglione, P. Very High Resolution Optical Satellites: An Overview of the Most Commonly used. Am. J. Appl. Sci. 2016, 13, 91–99. [Google Scholar] [CrossRef] [Green Version]
- Johnsen, G.; Ludvigsen, M.; Sørensen, A.; Sandvik Aas, L.M. The use of underwater hyperspectral imaging deployed on remotely operated vehicles—methods and applications. IFAC-Papers 2016, 49, 476–481. [Google Scholar] [CrossRef]
- Johnsen, G.; Volent, Z.; Dierssen, H.; Pettersen, R.; Ardelan, M.; Søreide, F.; Fearns, P.; Ludvigsen, M.; Moline, M. Underwater hyperspectral imagery to create biogeochemical maps of seafloor properties. In Subsea Optics and Imaging; Elsevier: Amsterdam, The Netherlands, 2013. [Google Scholar]
- Pust, O. Innovative Filter Solutions for Hyperspectral Imaging. Opt. Photonik 2016, 11, 24–27. [Google Scholar] [CrossRef]
- Renhorn, I.G.E.; Bergström, D.; Hedborg, J.; Letalick, D.; Möller, S. High spatial resolution hyperspectral camera based on a linear variable filter. Opt. Eng. 2016, 55, 114105. [Google Scholar] [CrossRef] [Green Version]
- Song, S.; Gibson, D.; Ahmadzadeh, S.; Chu, H.O.; Warden, B.; Overend, R.; Macfarlane, F.; Murray, P.; Marshall, S.; Aitkenhead, M.; et al. Low-cost hyper-spectral imaging system using a linear variable bandpass filter for agritech applications. Appl. Opt. 2020, 59, A167–A175. [Google Scholar] [CrossRef]
- Burns, J.; Delparte, D.M.; Gates, R.D.; Takabayashi, M. Integrating structure-from-motion photogrammetry with geospatial software as a novel technique for quantifying 3D ecological characteristics of coral reefs. PeerJ 2015, 3, e1077. [Google Scholar] [CrossRef] [PubMed]
- Thompson, D.R.; Hochberg, E.; Asner, G.P.; Green, R.O.; Knapp, D.E.; Gao, B.-C.; Garcia, R.; Gierach, M.; Lee, Z.; Maritorena, S.; et al. Airborne mapping of benthic reflectance spectra with Bayesian linear mixtures. Remote Sens. Environ. 2017, 200, 18–30. [Google Scholar] [CrossRef]
- Berkelmans, R.; De’Ath, G.; Kininmonth, S.; Skirving, W.J.S. A comparison of the 1998 and 2002 coral bleaching events on the Great Barrier Reef: Spatial correlation, patterns, and predictions. Coral Reefs 2004, 23, 74–83. [Google Scholar] [CrossRef]
- Hughes, T.P.; Kerry, J.T.; Álvarez-Noriega, M.; Álvarez-Romero, J.G.; Anderson, K.D.; Baird, A.H.; Babcock, R.C.; Beger, M.; Bellwood, D.R.; Berkelmans, R.; et al. Global warming and recurrent mass bleaching of corals. Nature 2017, 543, 373–377. [Google Scholar] [CrossRef]
- Boyd, J. Drones survey the great barrier reef: Aided by AI, hyperspectral cameras can distinguish bleached from unbleached coral-[News]. IEEE Spectr. 2019, 56, 7–9. [Google Scholar] [CrossRef]
- Queensland University of Technology (QUT). Queensland’s Own Rapid Response Tool for Monitoring Coral Bleaching. 2017. Available online: https://www.qut.edu.au/news?news-id=122198 (accessed on 12 June 2018).
- Sully, S.; Burkepile, D.E.; Donovan, M.K.; Hodgson, G.; Van Woesik, R. A global analysis of coral bleaching over the past two decades. Nat. Commun. 2019, 10, 1264. [Google Scholar] [CrossRef] [Green Version]
- Brown, B.E.; Dunne, R.P.; Ambarsari, I.; Le Tissier, M.D.A.; Satapoomin, U. Seasonal fluctuations in environmental factors and variations in symbiotic algae and chlorophyll pigments in four Indo-Pacific coral species. Mar. Ecol. Prog. Ser. 1999, 191, 53–69. [Google Scholar] [CrossRef] [Green Version]
- Strong, A.E.; Barrientos, C.S.; Duda, C.; Sapper, J. Improved satellite techniques for monitoring coral reef bleaching. In Proceedings of the 8th International Coral Reef Symposium, Panama City, Panama, 24–29 June 1996. [Google Scholar]
- Liu, G.; Strong, A.E.; Skirving, W.J.; Arzayus, L.F. Overview of NOAA Coral Reef Watch Program’s Near-Real-Time Satellite Global Coral Bleaching Monitoring Activities. In Proceedings of the 10th International Coral Reef Symposium, Okinawa, Japan, 28 June–2 July 2004. [Google Scholar]
- Liu, G.; Heron, S.F.; Eakin, C.M.; Muller-Karger, F.E.; Vega-Rodriguez, M.; Guild, L.S.; De La Cour, J.L.; Geiger, E.F.; Skirving, W.J.; Burgess, T.F.R.; et al. Reef-Scale Thermal Stress Monitoring of Coral Ecosystems: New 5-km Global Products from NOAA Coral Reef Watch. Remote Sens. 2014, 6, 11579–11606. [Google Scholar] [CrossRef] [Green Version]
- Clark, M.L. Comparison of simulated hyperspectral HyspIRI and multispectral Landsat 8 and Sentinel-2 imagery for multi-seasonal, regional land-cover mapping. Remote Sens. Environ. 2017, 200, 311–325. [Google Scholar] [CrossRef]
- Drusch, M.; Del Bello, U.; Carlier, S.; Colin, O.; Fernandez, V.; Gascon, F.; Hoersch, B.; Isola, C.; Laberinti, P.; Martimort, P.; et al. Sentinel-2: ESA’s Optical High-Resolution Mission for GMES Operational Services. Remote Sens. Environ. 2012, 120, 25–36. [Google Scholar] [CrossRef]
- Joyce, K.E.; Phinn, S.R.; Roelfsema, C.M.; Neil, D.T.; Dennison, W.C. Combining Landsat ETM+ and Reef Check classifications for mapping coral reefs: A critical assessment from the southern Great Barrier Reef, Australia. Coral Reefs 2004, 23, 21–25. [Google Scholar] [CrossRef]
- Palandro, D.; Andréfouët, S.; Muller-Karger, F.E.; Dustan, P.; Hu, C.; Hallock, P. Detection of changes in coral reef communities using Landsat-5 TM and Landsat-7 ETM+ data. Can. J. Remote Sens. 2003, 29, 201–209. [Google Scholar] [CrossRef]
- Duan, Y.; Liu, Y.; Li, M.; Zhou, M.; Yang, Y. Survey of reefs based on Landsat 8 operational land imager (OLI) images in the Nansha Islands, South China Sea. Acta Oceanol. Sin. 2016, 35, 11–19. [Google Scholar] [CrossRef]
- Keith, D.J.; Schaeffer, B.A.; Lunetta, R.S.; Gould, R.W., Jr.; Rocha, K.; Cobb, D.J. Remote sensing of selected water-quality indicators with the hyperspectral imager for the coastal ocean (HICO) sensor. Int. J. Remote Sens. 2014, 35, 2927–2962. [Google Scholar] [CrossRef]
- O. S. University. What Is HICO? 2015. Available online: http://hico.coas.oregonstate.edu/ (accessed on 12 June 2018).
- Stumpf, R.P.; Holderied, K.; Sinclair, M. Determination of water depth with high-resolution satellite imagery over variable bottom types. Limnol. Oceanogr. 2003, 48, 547–556. [Google Scholar] [CrossRef]
- Foo, S.A.; Asner, G.P. Scaling Up Coral Reef Restoration Using Remote Sensing Technology. Front. Mar. Sci. 2019, 6, 79. [Google Scholar] [CrossRef] [Green Version]
- Casella, E.; Collin, A.; Harris, D.; Ferse, S.; Bejarano, S.; Parravicini, V.; Hench, J.L.; Rovere, A. Mapping coral reefs using consumer-grade drones and structure from motion photogrammetry techniques. Coral Reefs 2017, 36, 269–275. [Google Scholar] [CrossRef]
- Hochberg, E.J.; Peltier, S.A.; Maritorena, S. Trends and variability in spectral diffuse attenuation of coral reef waters. Coral Reefs 2020, 39, 1377–1389. [Google Scholar] [CrossRef]
- Takabayashi, M.; Hoegh-Guldberg, O. Ecological and physiological differences between two colour morphs of the coral Pocillopora damicornis. Mar. Biol. 1995, 123, 705–714. [Google Scholar] [CrossRef]
- Anderson, D.A.; Armstrong, R.A.; Weil, E. Hyperspectral Sensing of Disease Stress in the Caribbean Reef-Building Coral, Orbicella faveolate—Perspectives for the Field of Coral Disease Monitoring. PLoS ONE 2013, 8, e81478. [Google Scholar] [CrossRef]
- Johannes, R.E.; Wiebe, W.J. Method for Derterminations of Coral Tissue Biomass and Composition. Limnol. Oceanogr. 1970, 15, 822–824. [Google Scholar] [CrossRef]
- Jokiel, P.L.; Rodgers, K.S.; Brown, E.K.; Kenyon, J.C.; Aeby, G.; Smith, W.R.; Farrell, F. Comparison of methods used to estimate coral cover in the Hawaiian Islands. PeerJ 2015, 3, e954. [Google Scholar] [CrossRef] [Green Version]
- Leujak, W.; Ormond, R.F.G. Comparative accuracy and efficiency of six coral community survey methods. J. Exp. Mar. Biol. Ecol. 2007, 351, 168–187. [Google Scholar] [CrossRef]
- Liu, H.; Sticklus, J.; Köser, K.; Hoving, H.-J.T.; Song, H.; Chen, Y.; Greinert, J.; Schoening, T. TuLUMIS—A tunable LED-based underwater multispectral imaging system. Opt. Express 2018, 26, 7811–7828. [Google Scholar] [CrossRef] [PubMed]
- Zawada, D.G.; Jaffe, J.S. Changes in the fluorescence of the Caribbean coral Montastraea faveolata during heat-induced bleaching. Limnol. Oceanogr. 2010, 48, 412–425. [Google Scholar] [CrossRef] [Green Version]
- Wu, C.; Shentu, Y.; Chaofan, C.; Guo, Y.; Zhang, Y.; Wei, H.; Yang, P.; Huang, H.; Song, H. Development of an underwater multispectral imaging system based on narrowband color filters. In Proceedings of the OCEANS 2018 MTS/IEEE, Charleston, SC, USA, 22–25 October 2019. [Google Scholar]
- Kobryn, H.T.; Wouters, K.; Beckley, L.E.; Heege, T. Ningaloo Reef: Shallow Marine Habitats Mapped Using a Hyperspectral Sensor. PLoS ONE 2013, 8, e70105. [Google Scholar] [CrossRef] [PubMed] [Green Version]
- Hedley, J.D.; Roelfsema, C.M.; Chollett, I.; Harborne, A.R.; Heron, S.F.; Weeks, S.; Skirving, W.J.; Strong, A.E.; Eakin, C.M.; Christensen, T.R.L.; et al. Remote Sensing of Coral Reefs for Monitoring and Management: A Review. Remote Sens. 2016, 8, 118. [Google Scholar] [CrossRef] [Green Version]
Figure 1.
An overview of the current optical techniques from satellites to underwater systems such as unmanned underwater vehicles (UUVs).
Figure 1.
An overview of the current optical techniques from satellites to underwater systems such as unmanned underwater vehicles (UUVs).

Figure 2.
The survey method for the Bi-Frost DSLR hyperspectral imager can either be conducted in a ‘lawn mower’ approach [77] for reef scale surveys or a single line pass for colony scale surveys. To ensure sufficient coverage data, the recorded area must exceed the target survey area. Water attenuations effects are corrected for by imaging white reference objects at various depths. These are variable depth target calibrators (VDTCs) that comprise a series of white references at different depths or a single white reference (only for correcting against incident light where variable depth is not considered).

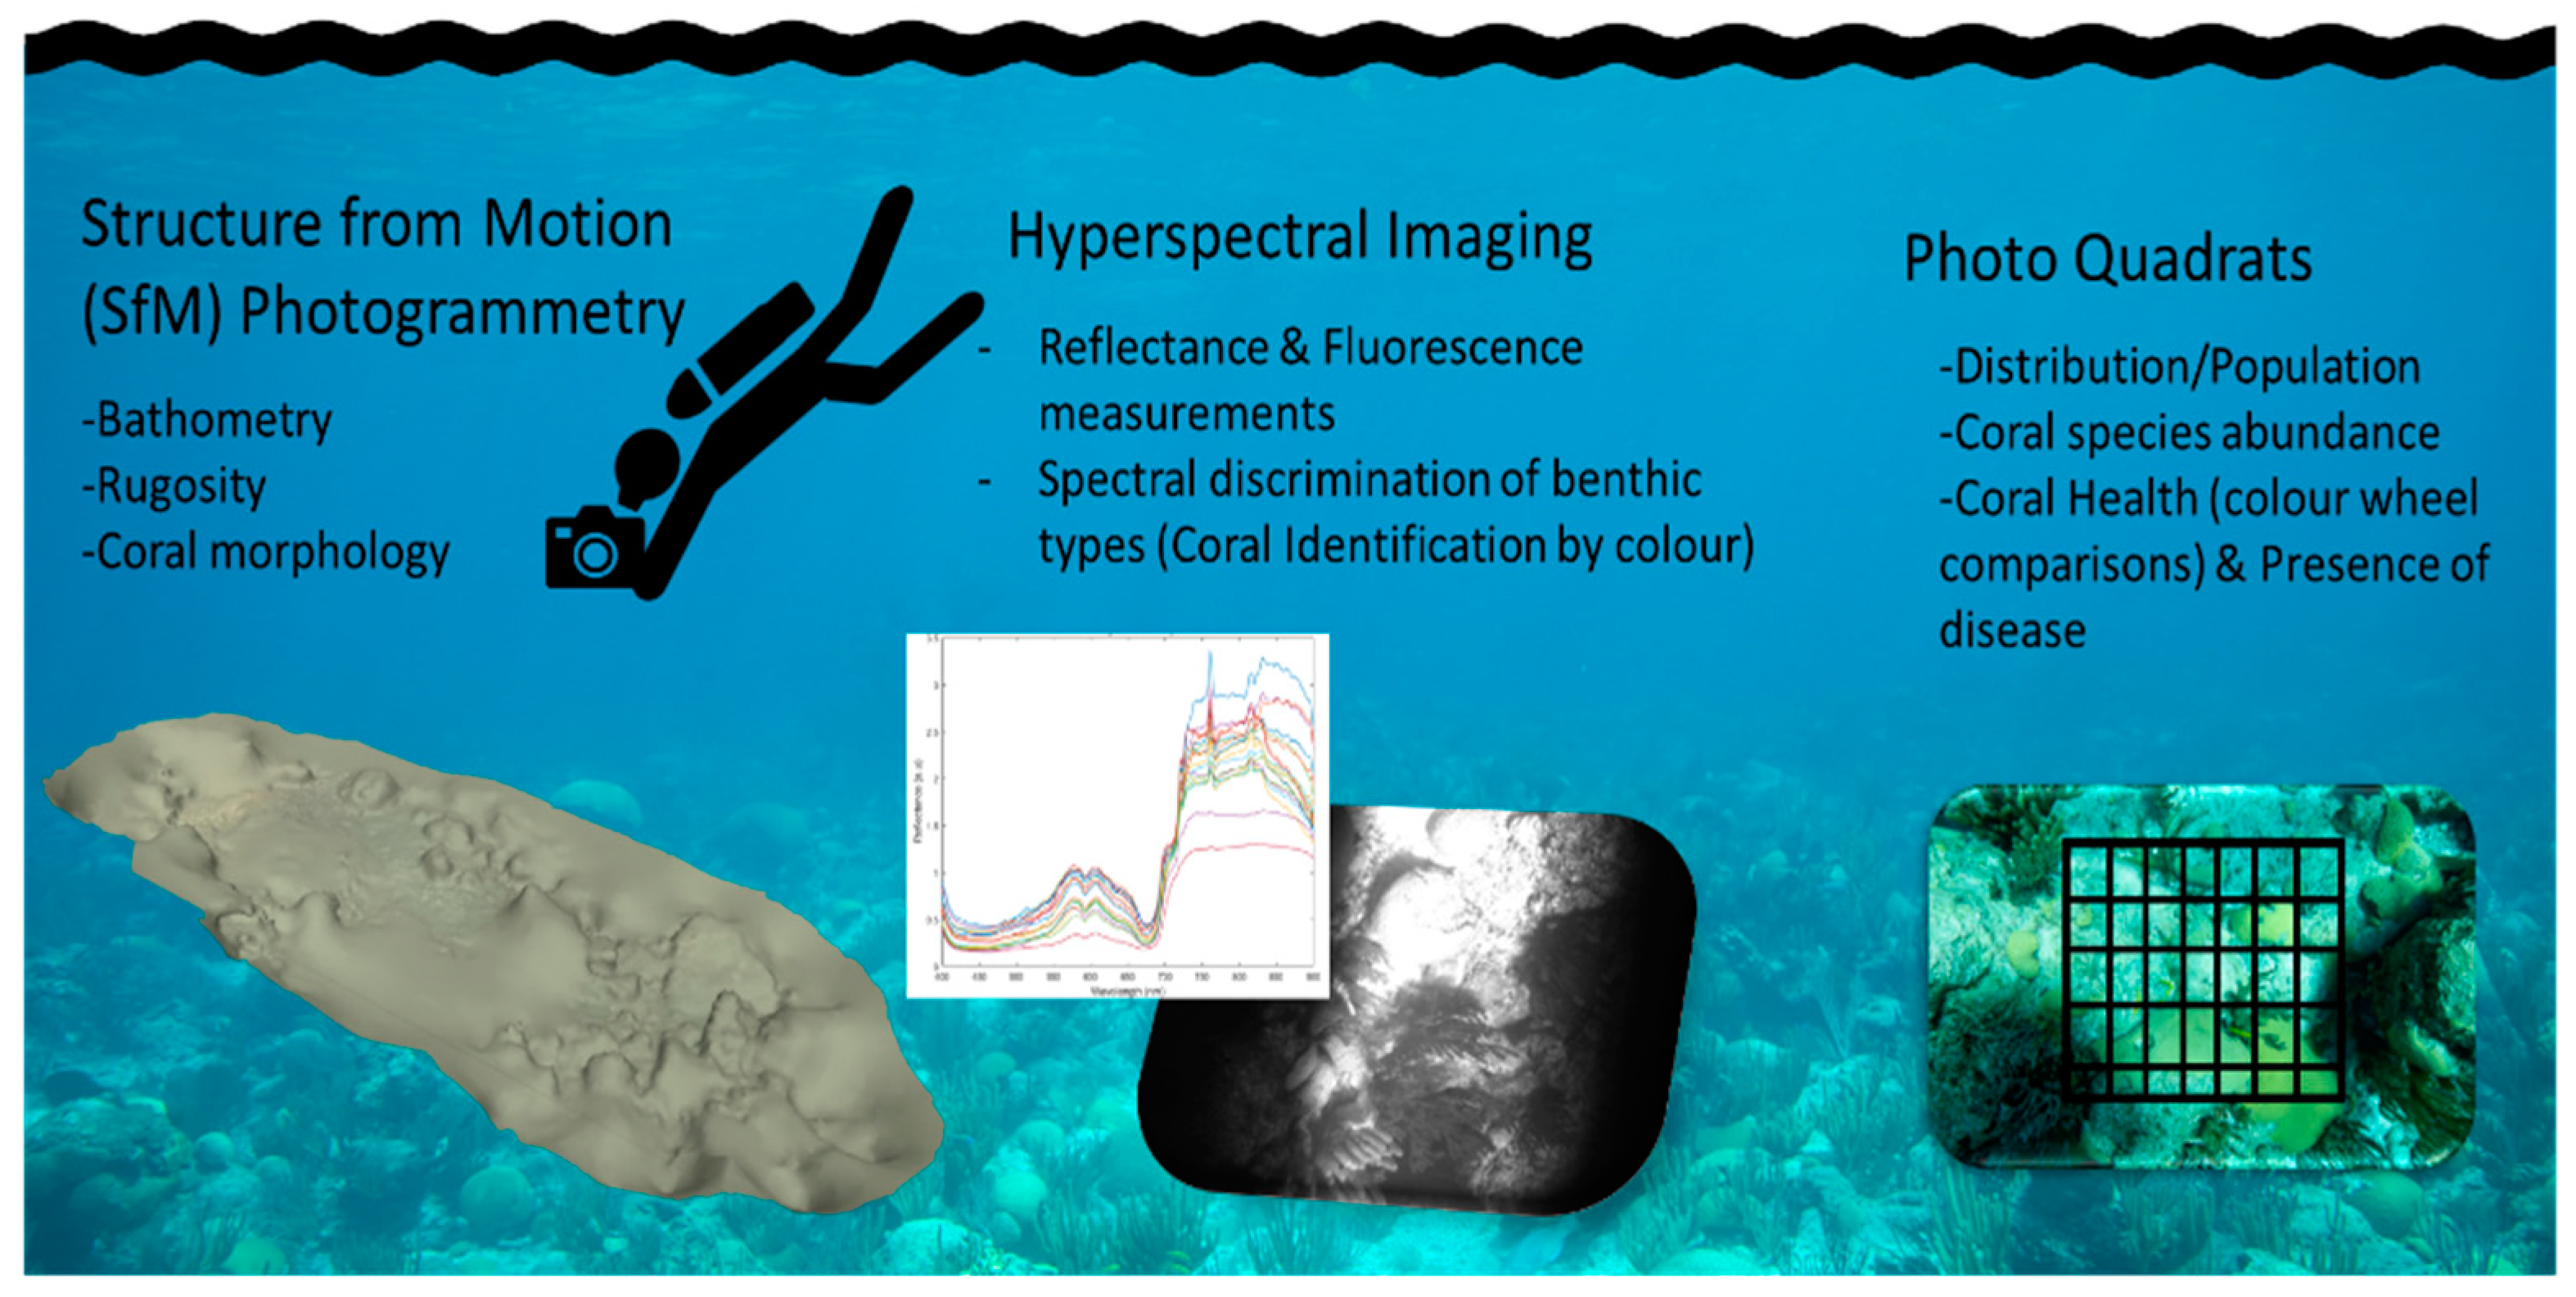
Figure 3.
Diver image based techniques and examples of the types of data produced from the main techniques.
Figure 3.
Diver image based techniques and examples of the types of data produced from the main techniques.

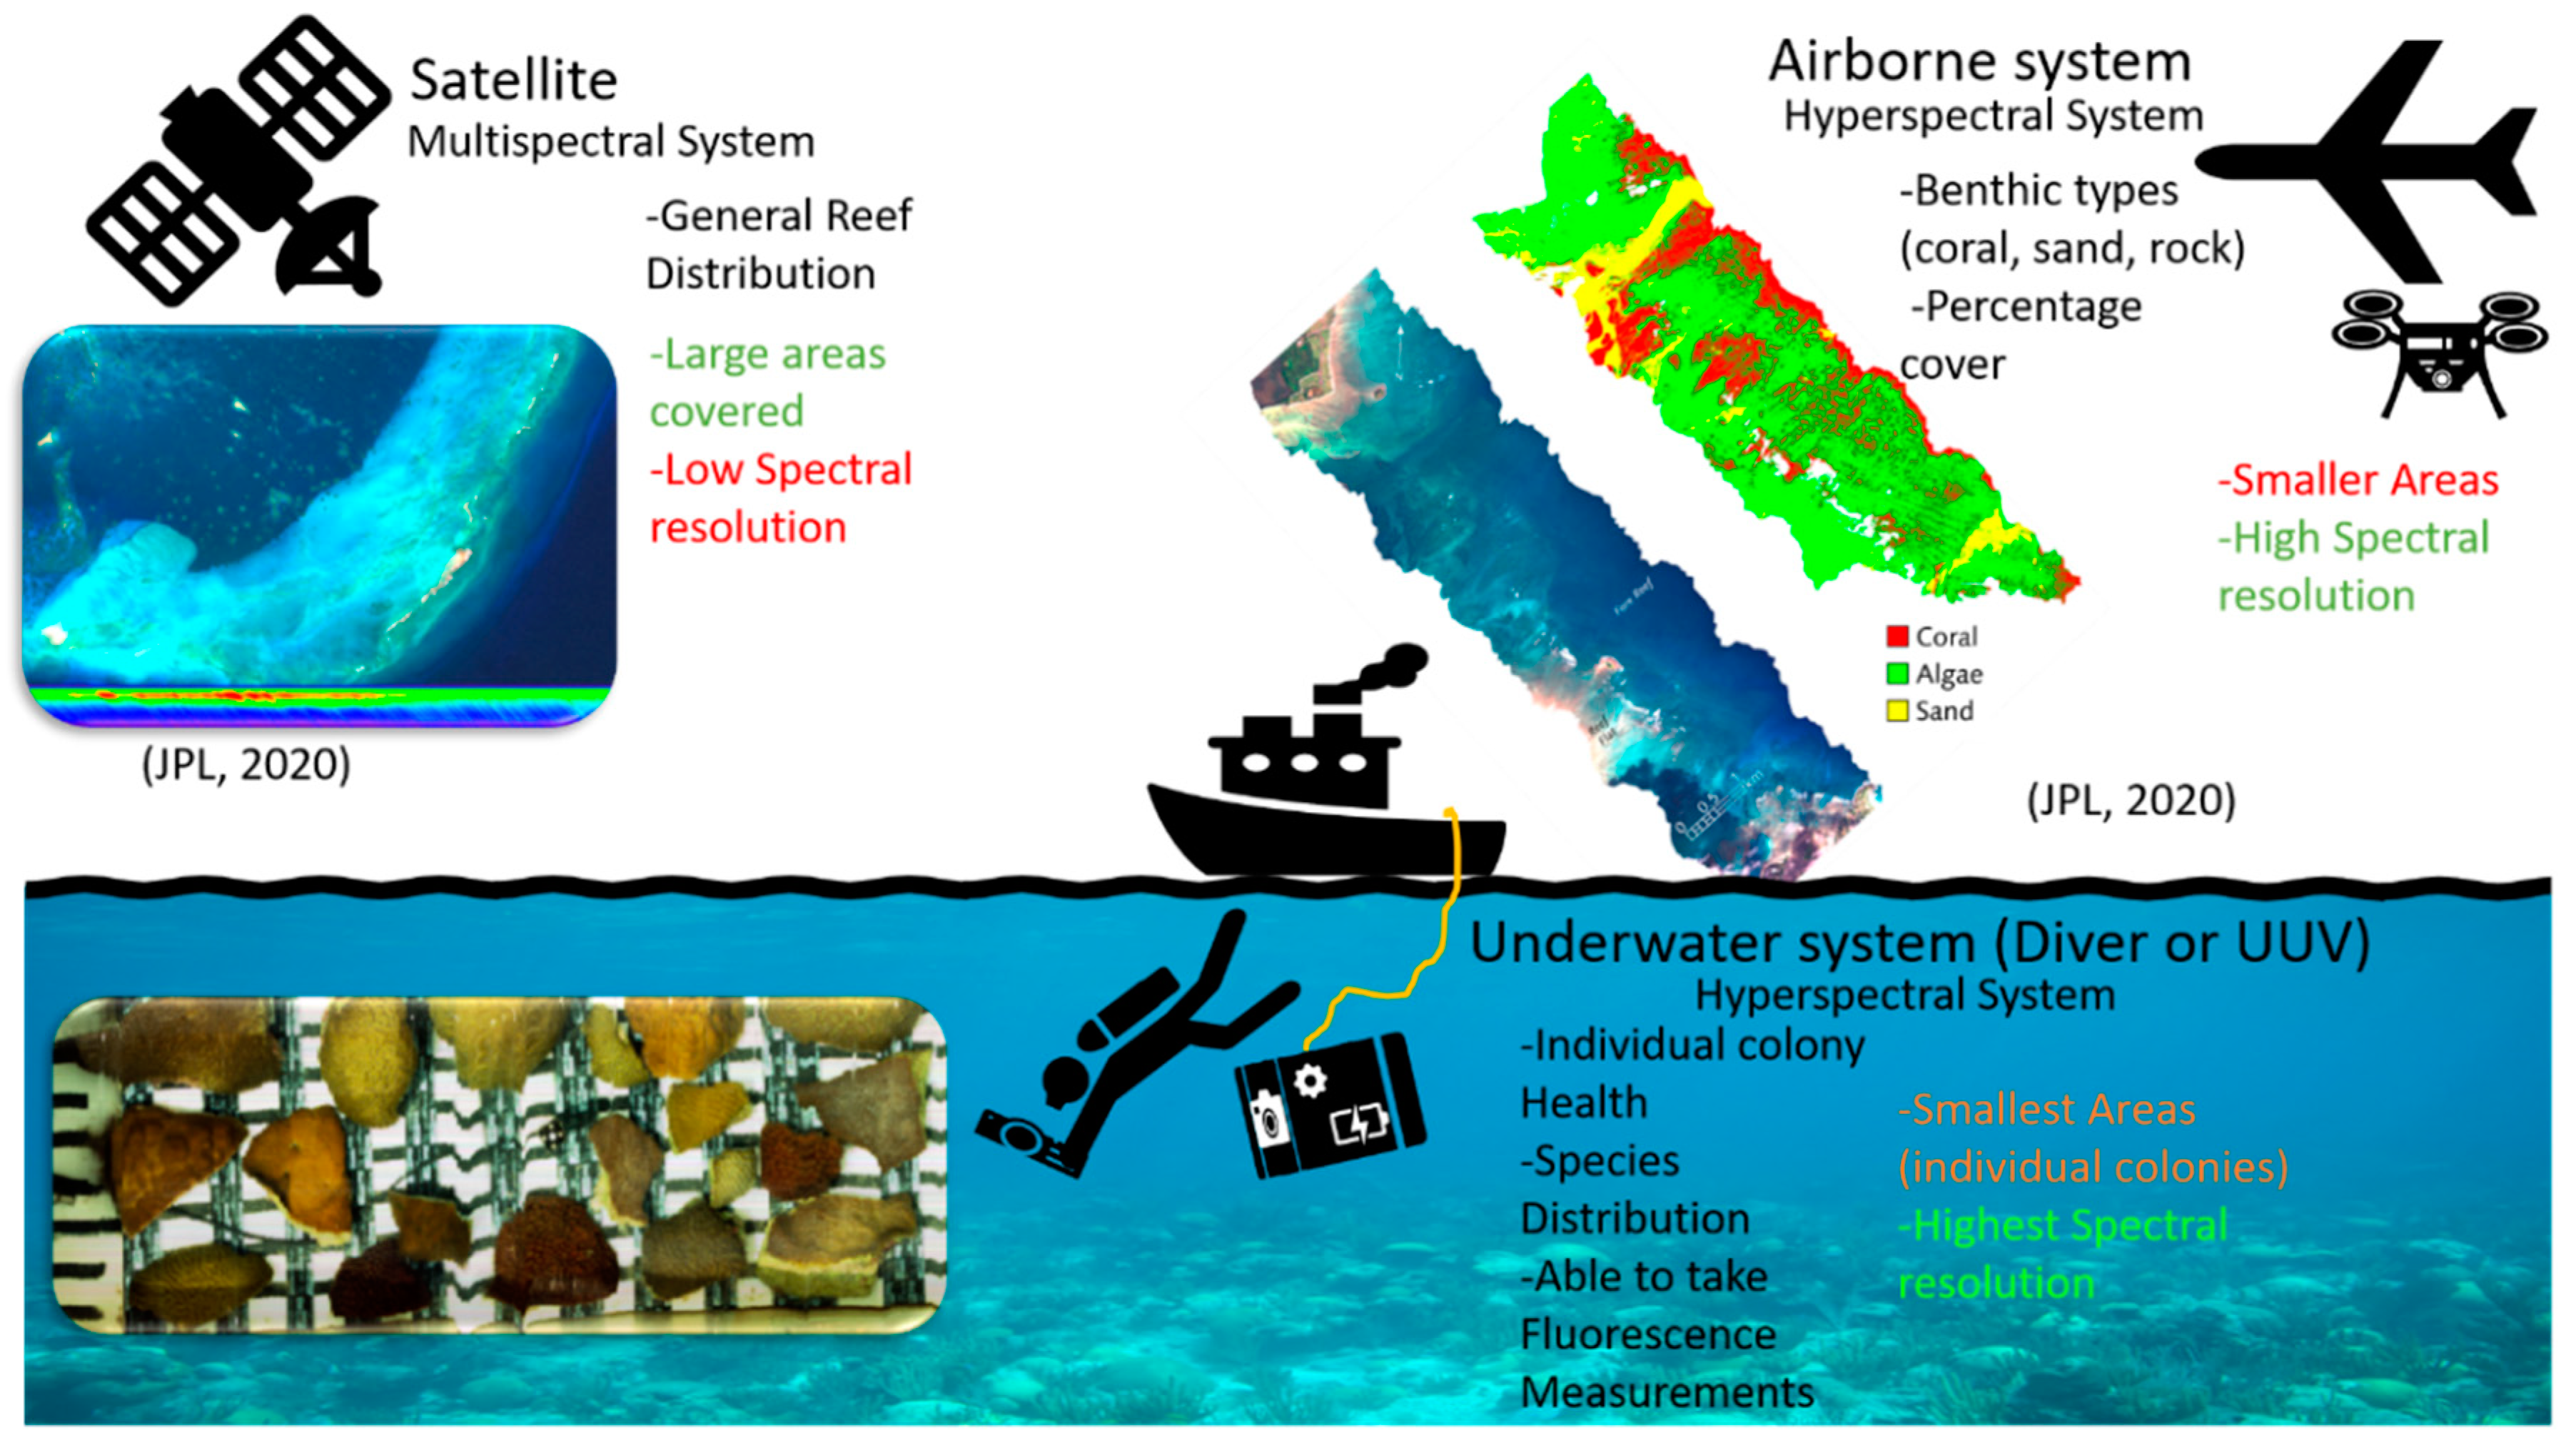
Figure 4.
The types of data from each type of spectral system at the different levels from satellites to underwater systems. Images from the Jet Propulsion Lab (JPL) (2020) and Eric J. Hochberg, Bermuda Institute of Ocean Sciences. UUV: Unmanned underwater vehicle.
Figure 4.
The types of data from each type of spectral system at the different levels from satellites to underwater systems. Images from the Jet Propulsion Lab (JPL) (2020) and Eric J. Hochberg, Bermuda Institute of Ocean Sciences. UUV: Unmanned underwater vehicle.

Publisher’s Note: MDPI stays neutral with regard to jurisdictional claims in published maps and institutional affiliations. |
© 2022 by the authors. Licensee MDPI, Basel, Switzerland. This article is an open access article distributed under the terms and conditions of the Creative Commons Attribution (CC BY) license (https://creativecommons.org/licenses/by/4.0/).
Share and Cite
MDPI and ACS Style
Teague, J.; Megson-Smith, D.A.; Allen, M.J.; Day, J.C.C.; Scott, T.B. A Review of Current and New Optical Techniques for Coral Monitoring. Oceans 2022, 3, 30-45. https://0-doi-org.brum.beds.ac.uk/10.3390/oceans3010003
AMA Style
Teague J, Megson-Smith DA, Allen MJ, Day JCC, Scott TB. A Review of Current and New Optical Techniques for Coral Monitoring. Oceans. 2022; 3(1):30-45. https://0-doi-org.brum.beds.ac.uk/10.3390/oceans3010003
Chicago/Turabian StyleTeague, Jonathan, David A. Megson-Smith, Michael J. Allen, John C.C. Day, and Thomas B. Scott. 2022. "A Review of Current and New Optical Techniques for Coral Monitoring" Oceans 3, no. 1: 30-45. https://0-doi-org.brum.beds.ac.uk/10.3390/oceans3010003