
Hurricane-Induced Oceanic Carbon Changes in the Upper Ocean


Ocean Observing and Modeling Group, Department of Marine, Earth, and Atmospheric Sciences, College of Sciences, North Carolina State University, Raleigh, NC 27695, USA
*
Author to whom correspondence should be addressed.
Oceans 2022, 3(2), 114-124; https://0-doi-org.brum.beds.ac.uk/10.3390/oceans3020010
Submission received: 13 December 2021
/
Revised: 1 March 2022
/
Accepted: 21 March 2022
/
Published: 25 March 2022
Abstract
:Changes in marine carbon cycling due to hurricanes with different intensity and translation speeds have not been systematically investigated. This study uses an idealized coupled physical-biogeochemical model and a suite of model sensitivity analyses to better quantify the relationship between hurricane characteristics and marine property changes, including variations in air-sea carbon flux and partial pressure of carbon dioxide in water (pCO2w). We find that strong (category 4–5), mid-speed (5–8 m/s) storms cause the most carbon flux from the atmosphere to the ocean, and that the relationship between air-sea carbon flux and hurricane properties is non-linear. Climate models that do not consider synoptic-scale, storm-induced physical-biogeochemical coupling may underestimate regional carbon sinks.
1. Introduction
Recent studies suggest that hurricane activity has increased in the North Atlantic since the 1970s [1,2,3]. The hyperactive 2020 Atlantic hurricane season, with a record high number (30) of storms with highly varying translation speeds and intensities, and the highly active 2021 Atlantic hurricane season, with twenty-one named storms, has highlighted the need to understand how hurricanes perturb the ocean’s base state under various conditions. It is known that hurricanes can lead to higher nutrient loading, increased algal biomass, and changes in oceanic carbon concentrations, which may subsequently affect regional and basin-scale carbon flux [4,5,6]. Improved understanding of multifaceted marine property variations and regional atmosphere-ocean CO2 exchange in response to hurricanes is therefore critical for better quantification of the ocean’s role in the global carbon cycle and for predicting future climate change.
The partial pressure of carbon dioxide in water (pCO2w) is a function of ocean temperature, salinity, alkalinity, and dissolved inorganic carbon (DIC) concentrations, which in turn are functions of phytoplankton primary production and gas exchange [4,7,8]. Hurricanes affect pCO2w physically, by upwelling and entraining cold, carbon-rich water, and biologically, by upwelling and entraining nutrients that stimulate phytoplankton blooms [9,10,11]. The resulting high phytoplankton concentrations decrease pCO2w by decreasing the amount of DIC in the water. Studies have shown that the extent of these physical and biological responses depend on the hurricane’s intensity and translation speed, as well as the initial conditions of the upper water column [9,12,13,14,15,16,17]. Increased intensity and decreased translation speed are correlated with lower sea surface temperature (SST), more nutrient injection to surface waters, and larger phytoplankton blooms [4,9,12,18,19,20,21,22]. Due to the time it takes for the water column to stabilize enough to support new growth and for phytoplankton to assimilate nutrients into new growth, phytoplankton response to a hurricane’s passage is time-lagged by a few days [12,23]. Hurricanes can reduce pCO2w to the point where the ocean can switch from a source of carbon into a sink [24,25]. Several studies have shown a net decrease in pCO2w after a hurricane’s passing [10,24,26], though this is dependent on many factors, including the upper ocean condition, the hurricane’s translation speed, and its intensity. Other studies have shown an increase in pCO2w after a hurricane’s passage, and a net efflux of CO2 from the ocean to the atmosphere [8,26]. The many variables involved in predicting and understanding each individual hurricane-ocean interaction make an overall estimation and prediction of future hurricanes’ impact challenging.
While numerous factors affect hurricane impact on pCO2w, we hope to piece apart the most important factors. This effort will begin with an idealized modeling study, using biological and physical profiles from the Gulf of Mexico, that will allow us to examine the effect of translation speed and hurricane intensity in a controlled setting. This is a building block upon which we will later add increasing complexity to better understand how hurricanes affect ocean pCO2w in a wider context. The Gulf of Mexico was chosen because all necessary in situ depth profiles for biological and physical variables were readily available.
This study aims to examine drivers of pCO2w change due to variations in hurricane intensity and translation speed via a coupled physical-biogeochemical idealized model. We will address three specific questions: (1) What is the role of hurricane-induced phytoplankton blooms in reducing, neutralizing, or reversing carbon efflux from the ocean? (2) Is there a spatial asymmetry in pCO2w variation like that of ocean temperature and phytoplankton bloom in response to hurricane passage [9,23,27]? (3) Which combinations of hurricane translation speeds and intensities lead to the largest pCO2w change? Addressing these questions using field data is very challenging because of the scarcity of observations and their limited temporospatial coverage. The advantage of using an idealized model for this investigation lies in the fact that many variables can be controlled, so the influence of the variables of interest (hurricane intensity and translation speed) can be examined separately. This systematic investigation can offer insights that would be difficult to gather with other methods. It is our hope that the idealized modeling and process analyses reported herein, while difficult to be validated directly against in situ observations, can provide valuable information to aid the design of future ocean carbon field campaigns and realistic modeling programs.
2. Materials and Methods
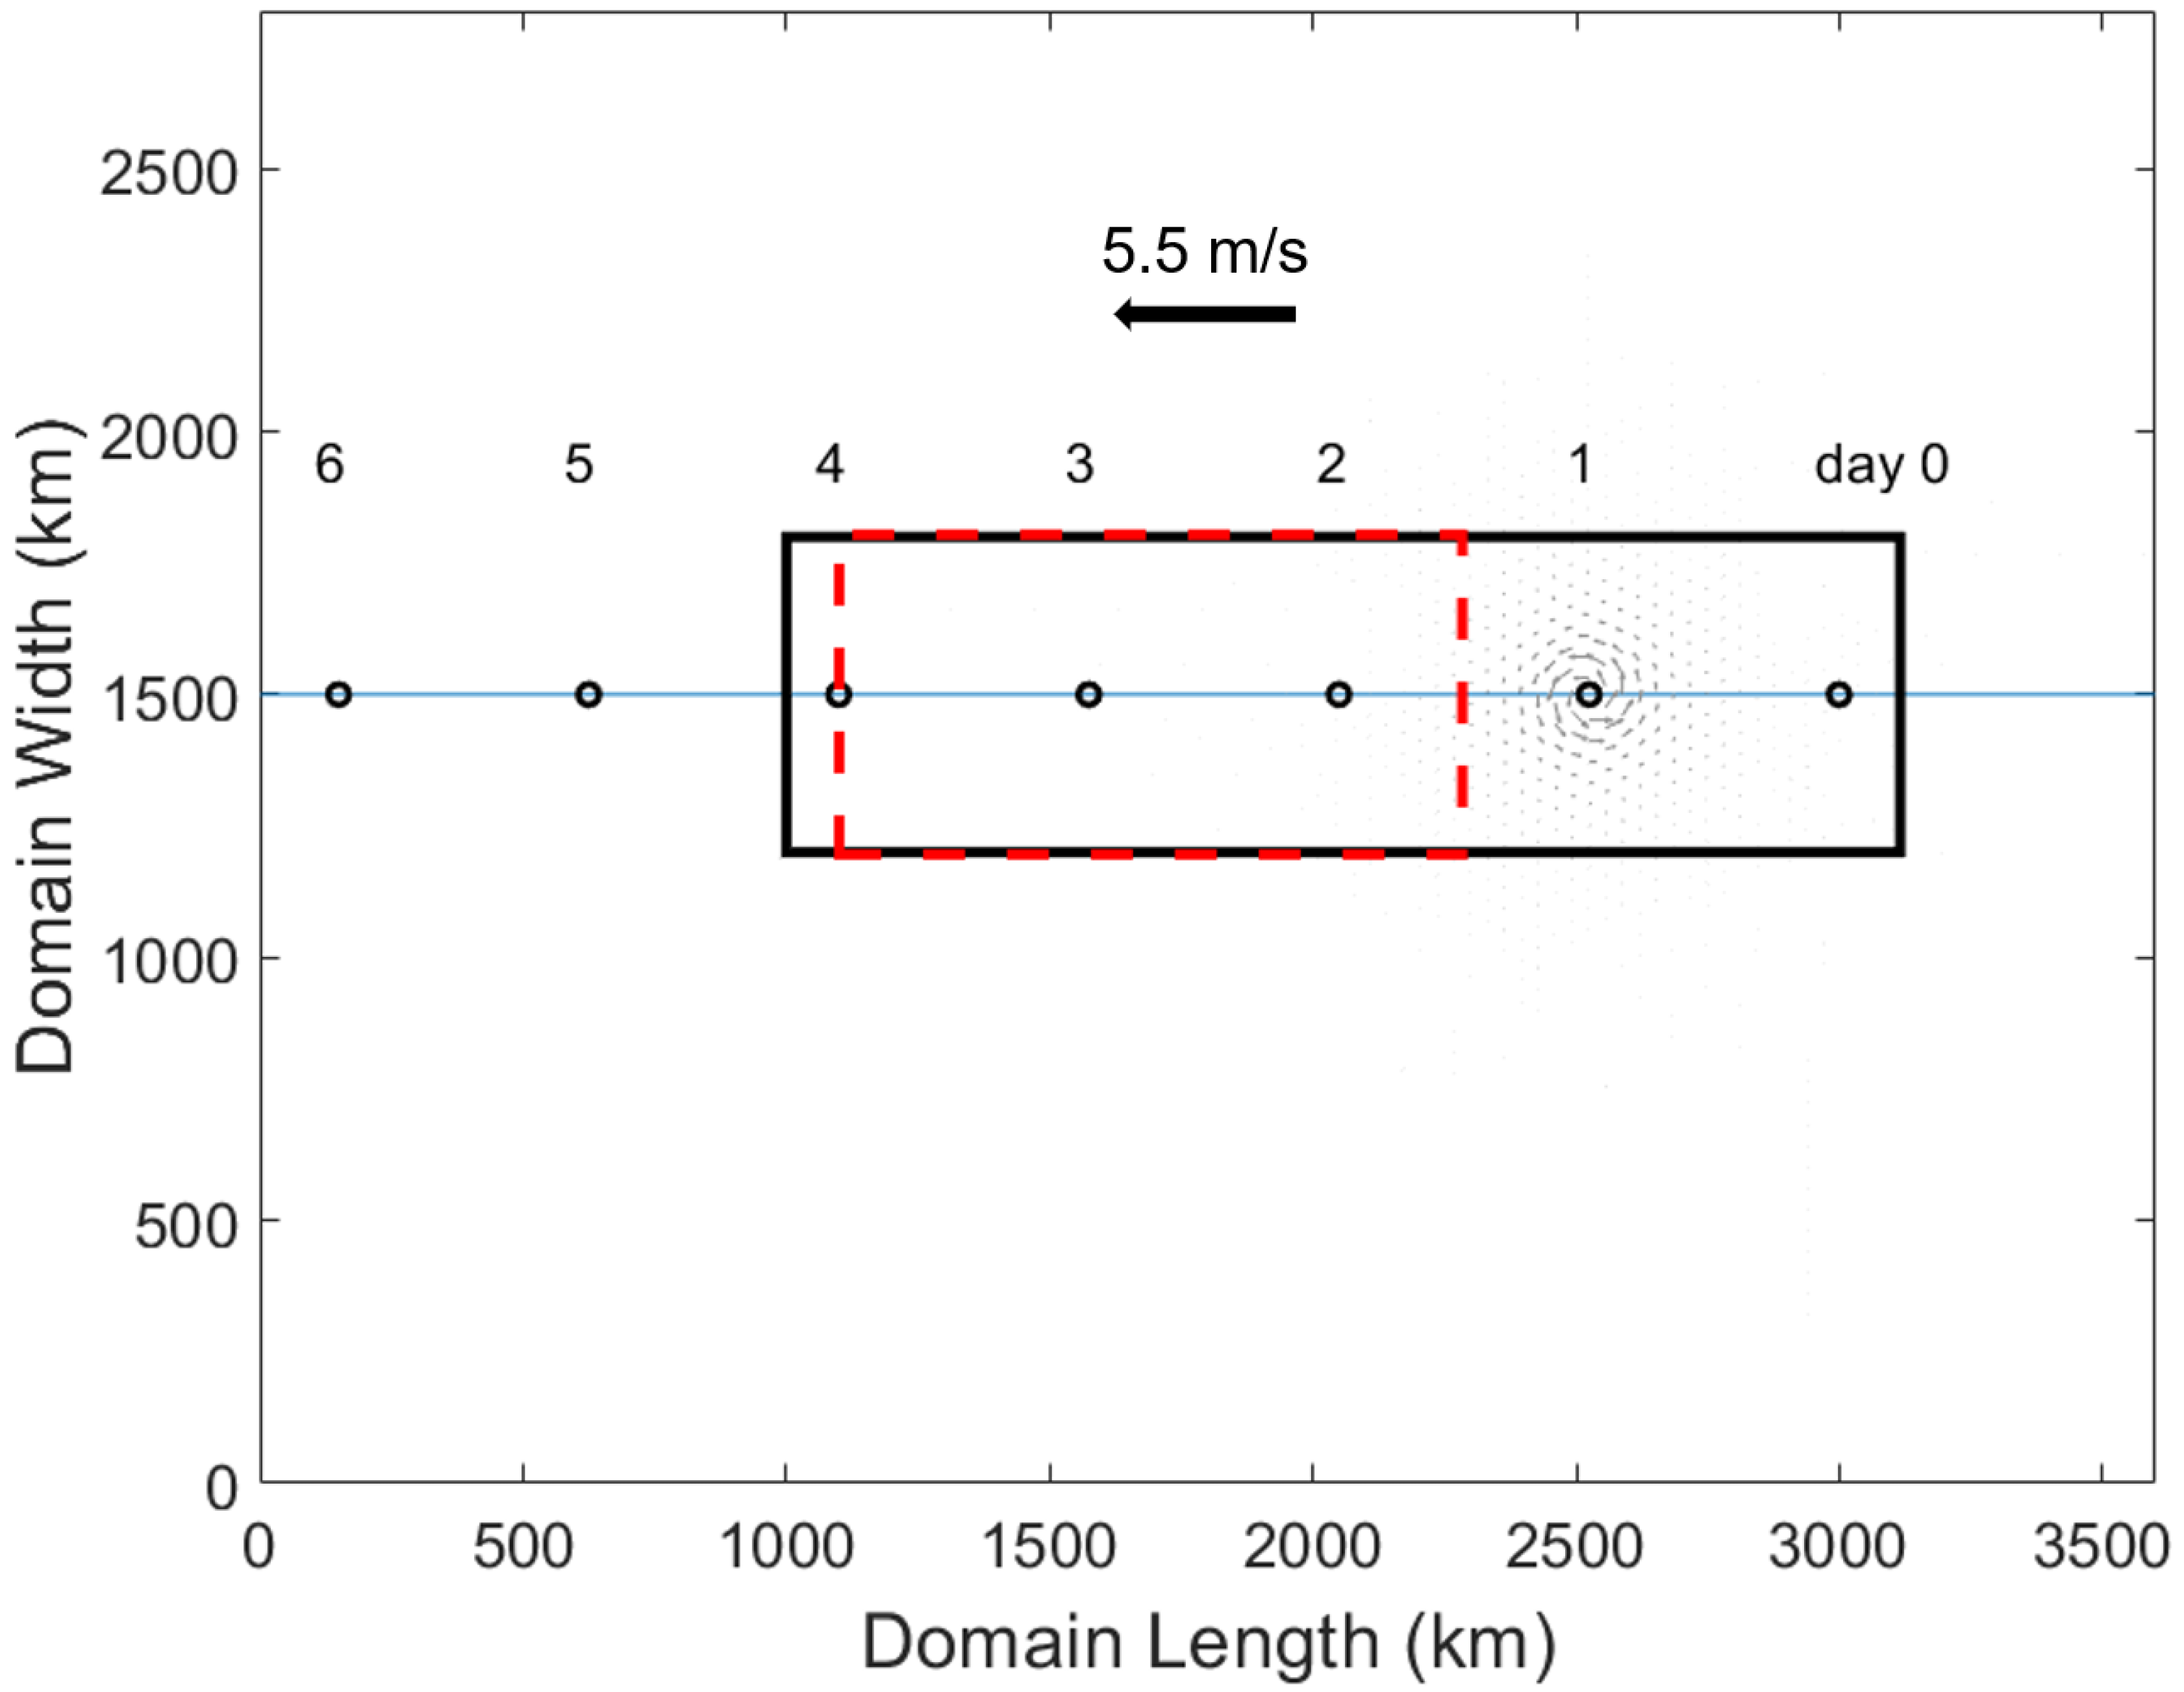
The modeling system used in this study consists of the Regional Ocean Modeling System (ROMS) [28] coupled to a biological model considering both nutrient and carbon cycling [29,30]. The Fennel model has been successfully applied and validated for the Gulf of Mexico [31]. The idealized model domain is a horizontally uniform and vertically stratified ocean basin (3600 km long by 2800 km wide), with 61 vertical levels and grid spacing of 8 km (Figure 1). The Coriolis force has been approximated using an f-plane to simulate 15 N. The boundary conditions are closed on the western boundary and use the gradient condition on all others. The bathymetry is set constant at 2000 m. The Generic Length Scale (GLS) vertical mixing scheme with the Kantha and Clayson stability function was applied [32,33,34]. More details of this coupled modeling system configuration are given in [23].
Our investigation consisted of a control model experiment and a suite of model sensitivity experiments. As was done in [23], in all cases, an idealized hurricane moved due westward with wind speeds calculated from the axisymmetric Holland wind model [35]. The model started with calm winds at the location x = 3000 km, y = 1500 km, and ramped up to full strength in 24 h (Figure 1). The wind speed was converted to wind stress using the formula
where is air density, is the drag coefficient, and W is the wind speed in m s−1. For the control run, the hurricane had a Category 5 (per Saffir-Simpson scale, https://www.nhc.noaa.gov/aboutsshws.php, accessed on 10 December 2021) intensity and a translation speed of 5.5 m s−1. With this speed, the storm system could make landfall (reaching the western ocean boundary) in about 6.4 days. The hurricane wind forcing was one way, from the atmosphere to the ocean; ocean feedback to the hurricane was omitted in this study, but will be discussed in a future correspondence. The simulation was run for 10 days, with output every two hours. Additional sensitivity runs were designed to examine ocean response to each combination of hurricane intensity (Categories 1 through 5) and translation speed (2.5 m s−1, 5.5 m s−1, 7.5 m s−1, and 10 m s−1). The minimum central pressure and maximum wind speeds are shown in Table 1.
Figure 1.
The ROMS model domain, 3600 km by 2800 km. Black circles denote the location of the control run hurricane’s center at the beginning of the day labeled above it. The black rectangle shows the averaged area used in Figure 2, while the dashed red rectangle shows the zonally averaged area used in Figure 3. Grey vectors indicate the hurricane wind field, and the hurricane direction with the control run’s translation speed is shown.

Figure 2.
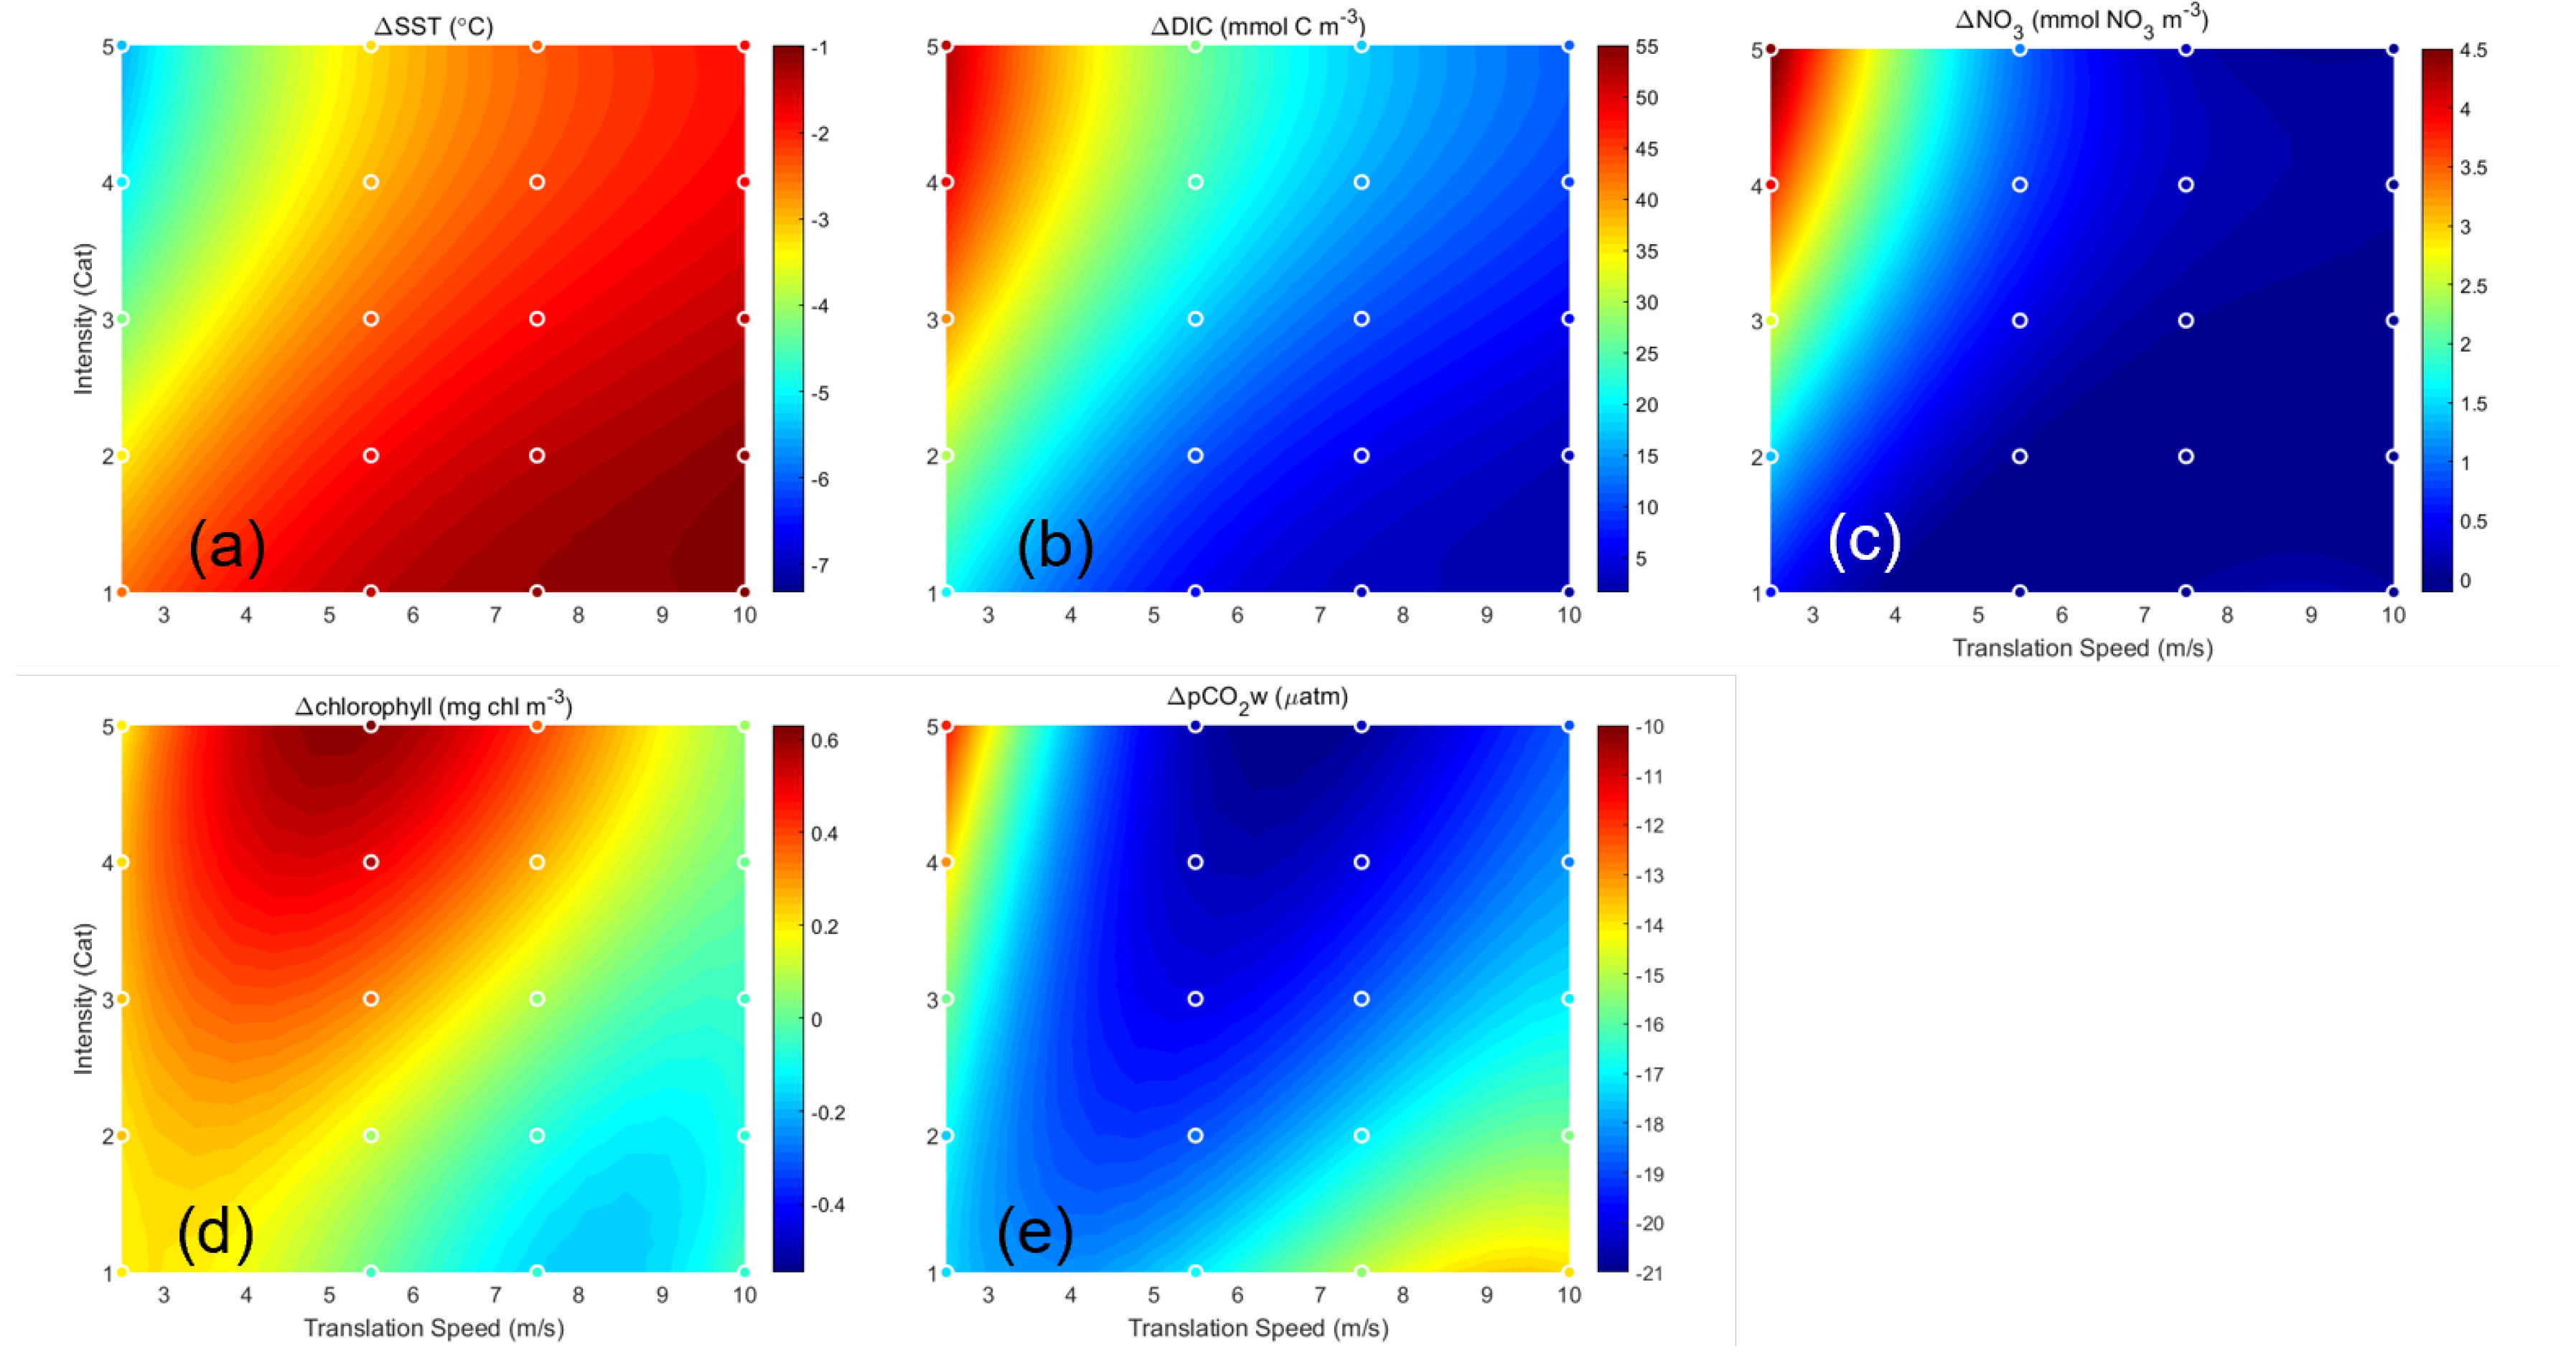
Comparison of the change in surface properties between all combinations of translation speed and intensity. Values were computed by averaging spatially over a subregion defined by 1000 km to 3116 km, and 1200 km to 1800 km (a common area affected by all translation speeds). The difference between the last time step and the first time step was calculated. Dots indicate the calculated values. Overlaid is a third-order polynomial fitting (color shading) of the data points, extrapolated to translation speeds 2.5 through 10 m s−1 for Categories 1–5. Six properties are shown: (a) SST (C), (b) DIC (mmol m−3), (c) NO3 (mmol m−3), (d) chlorophyll (mg m−3), and (e) pCO2w (atm).
Figure 2.
Comparison of the change in surface properties between all combinations of translation speed and intensity. Values were computed by averaging spatially over a subregion defined by 1000 km to 3116 km, and 1200 km to 1800 km (a common area affected by all translation speeds). The difference between the last time step and the first time step was calculated. Dots indicate the calculated values. Overlaid is a third-order polynomial fitting (color shading) of the data points, extrapolated to translation speeds 2.5 through 10 m s−1 for Categories 1–5. Six properties are shown: (a) SST (C), (b) DIC (mmol m−3), (c) NO3 (mmol m−3), (d) chlorophyll (mg m−3), and (e) pCO2w (atm).

Figure 3.
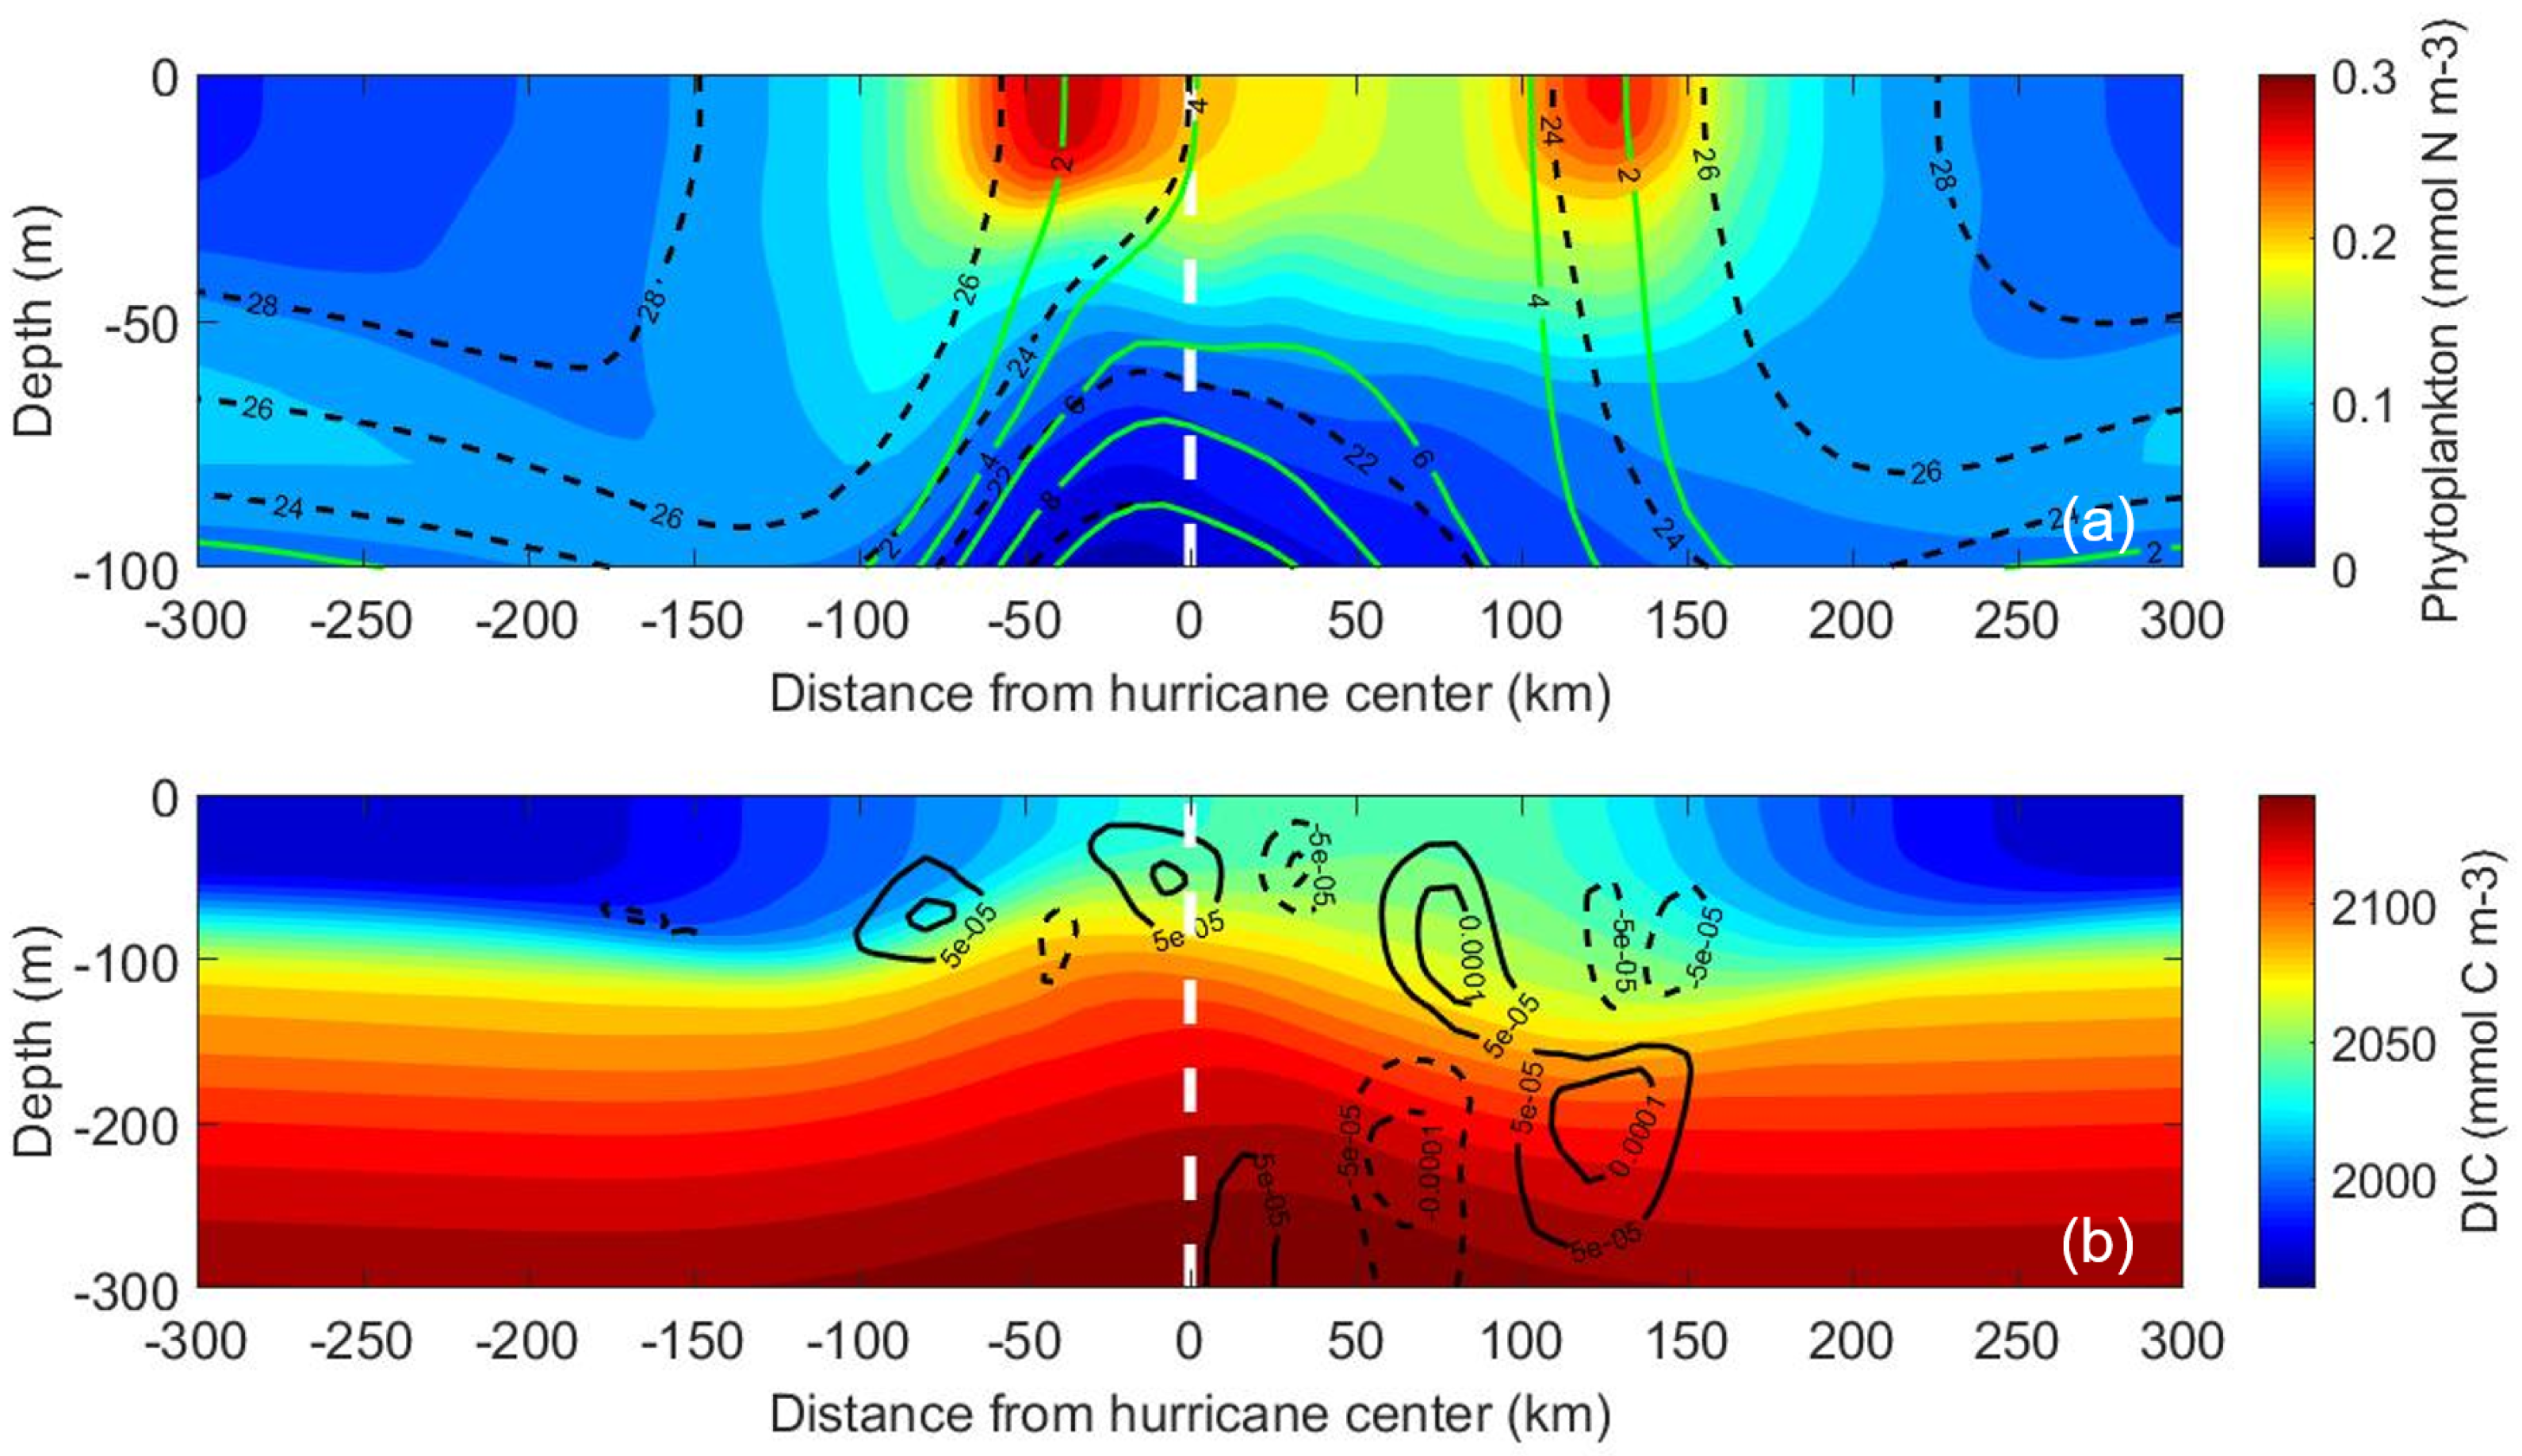
Vertical profiles of the control simulation. (a) Time-averaged phytoplankton (colors), temperature (black dashed contours), and nitrate (green contours). (b) Time-averaged DIC (colors) and vertical velocity (m s−1, black contours; solid lines indicate upward motion, and dashed lines indicate downward motion). All variables have been zonally averaged and time-averaged over three inertial periods. The view is westward in the direction of the translating hurricane, and the white dashed line indicates the hurricane center.
Figure 3.
Vertical profiles of the control simulation. (a) Time-averaged phytoplankton (colors), temperature (black dashed contours), and nitrate (green contours). (b) Time-averaged DIC (colors) and vertical velocity (m s−1, black contours; solid lines indicate upward motion, and dashed lines indicate downward motion). All variables have been zonally averaged and time-averaged over three inertial periods. The view is westward in the direction of the translating hurricane, and the white dashed line indicates the hurricane center.

The biological model of this coupled system included key interactions for both the nitrogen and carbon cycles [29,30,31]. The Fennel biological model computes twelve biological tracers: nitrate (NO3), ammonium (NH4), chlorophyll, phytoplankton, zooplankton, large and small detritus concentration (for both carbon and nitrogen), total inorganic carbon (TIC), alkalinity, and oxygen [29,31]. Chlorophyll concentrations in the model are related to phytoplankton concentrations; they increase based on temperature, photosynthetically available radiation, and concentrations of NO3 and NH4, and decrease as a result of phytoplankton mortality and grazing by zooplankton populations [29]. The physical, biological, and nutrient profiles used for model initial conditions were based on hydrographic observations from Stations 1 and 12 of the Gulf of Mexico and East Coast Carbon Cruise 2 (GOMECC-2, https://www.aoml.noaa.gov/ocd/gcc/GOMECC2/, accessed on 10 December 2021). The initial atmospheric pCO2 (pCO2a) was set at 370 atm and was held constant throughout the 10-day simulation. TIC and alkalinity were chosen so that initial pCO2w was 370 atm as well, making initial CO2 air-sea flux zero. This way, the changes in pCO2w and pCO2 due to the hurricane could be clearly examined. As in McGee and He (2018), a simple day-night cycle was applied for the short-wave radiation (E) in all simulations, given by
where t is time in hours [23,36]. This day-night cycle does not include the effects of cloud cover, which would reduce the amount of short wave radiation available for phytoplankton growth.
3. Results
3.1. Control Run
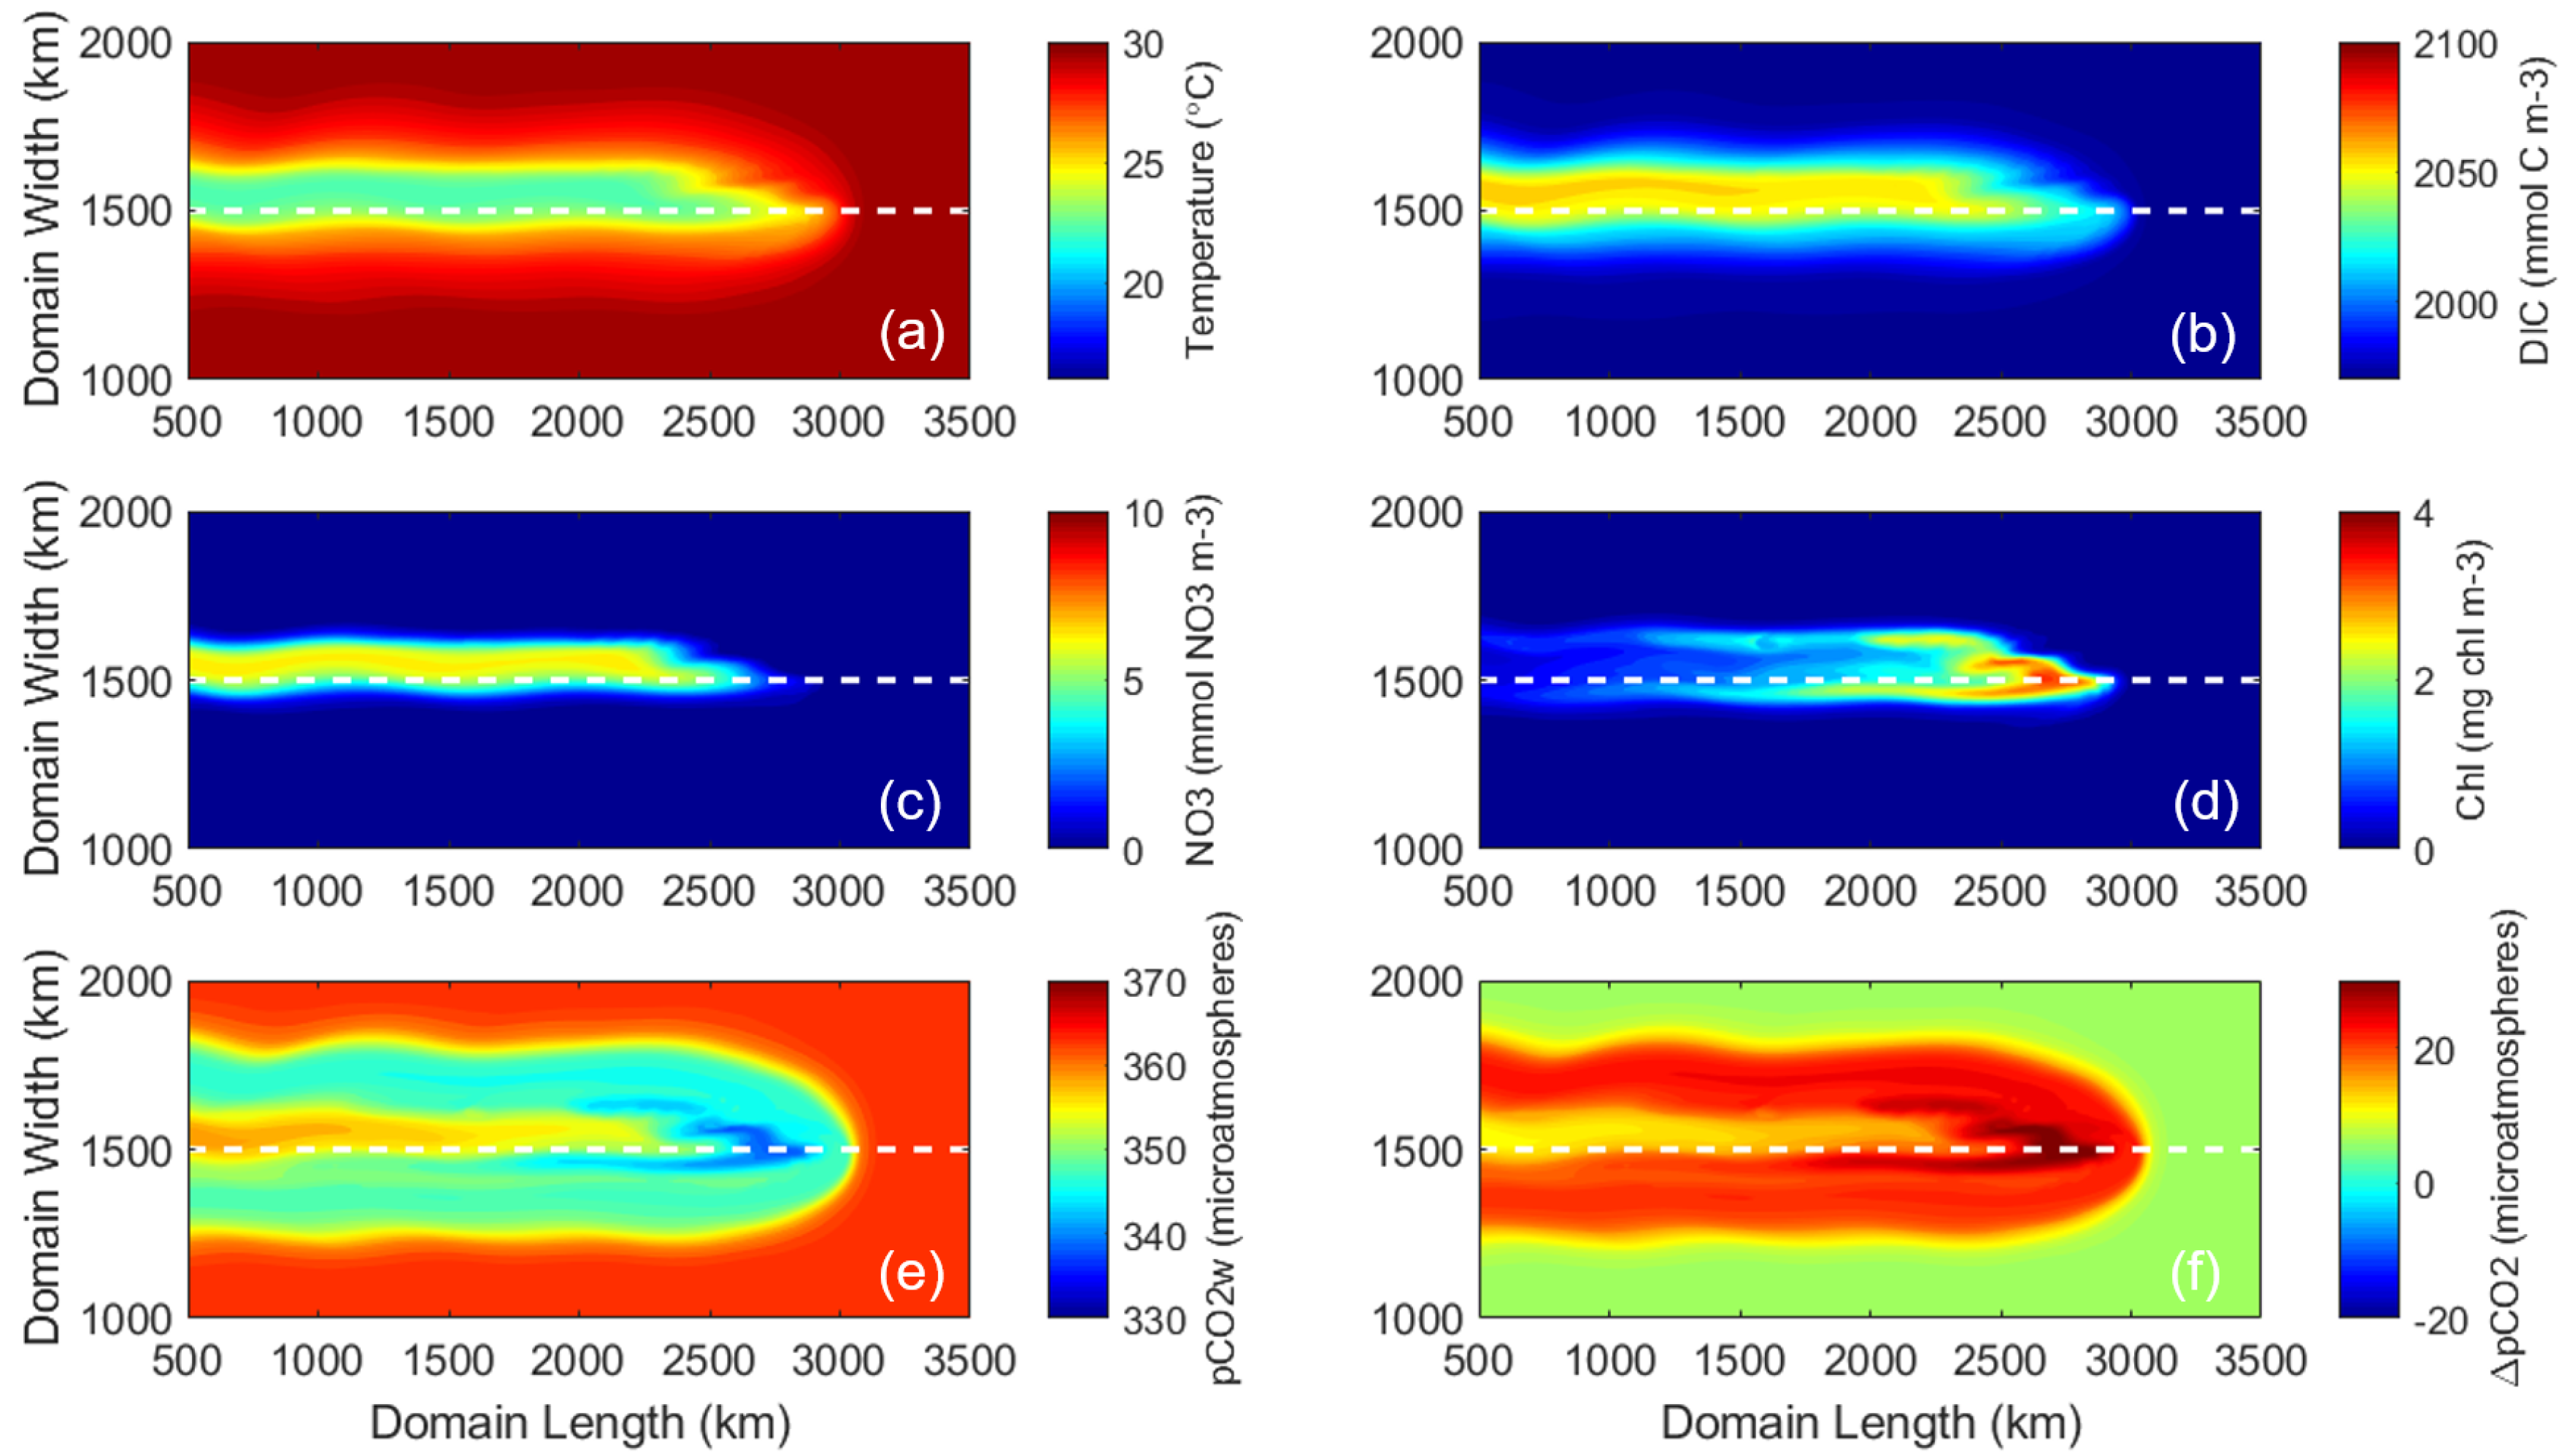
The control run examined the ocean’s response to the idealized hurricane at the surface and subsurface. The tight coupling of the marine physical and biogeochemical systems was evident in the model solutions. Model results show an asymmetric (right-hand biased) upwelling of cold water and nutrients DIC and NO3 (Figure 4a–c). The greatest upwelling occurred on the right side of the storm’s track. Upwelled nutrients stimulated new phytoplankton growth, as indicated by chlorophyll (chl) concentration, which by Day 8 was an order of magnitude larger than the initial concentration (Figure 4d). The chl concentration is highest around the 2800 km length mark where the full-strength storm first enters the study domain. This is because phytoplankton in this area have more time to react to the storm passage and assimilate nutrients that are upwelled than those further to the left/west.
Compared to other marine properties, the response of pCO2 occurred over a larger spatial area (Figure 4e). The initial ocean pCO2w of 370 atm decreased to a minimum of 331.2 atm in response to this hurricane. The area of largest pCO2w decrease (between 2500 and 3000 km domain length marks) corresponded to the region with cool temperatures (Figure 4a), low DIC (Figure 4b), and the highest concentration of phytoplankton growth (thus carbon uptake, Figure 4d). West of this area (between 500 and 2000 km domain length marks), a larger injection of DIC from the deep ocean slowed the decrease of pCO2w due to the physically (temperature) and biologically induced carbon uptake, resulting in an asymmetric (right-hand biased) band of pCO2w with elevated values compared to surrounding waters. Averaged over the common study area (the black box in Figure 1), the change in pCO2w was −20.6 atm; SST decreased by 3.2 C; DIC increased by 27.1 mmol C m−3; and chl increased by 0.63 mg chl m−3. Because pCO2a was held constant at 370 atm and pCO2 (defined as pCO2a-pCO2w) was positive over this area (Figure 4f), the ocean acted as a carbon sink in response to this hurricane.
The three-dimensionality of ocean responses can be examined in a subsurface transect view. The subsurface conditions for phytoplankton, temperature, NO3, DIC, and ocean vertical velocity (Figure 3) were averaged across 1184 km (red box in Figure 1) and over three inertial periods (one inertial period at 15 N is 46.36 h), the same spatial and temporal averages that were done in [23,36]. These spatial and temporal averages reveal the overall trends and allow for direct comparison with the previous two papers. In the subsurface, greater upwelling of colder water, NO3, phytoplankton concentration, and DIC all occurred on the right side of the hurricane’s track (Figure 3a,b). This asymmetry is due to two factors. First, resonance between inertial oscillations in the ocean and the clockwise turning of the hurricane’s wind stress vector with time lead to increased upwelling and entrainment on the right side of the track [9,27,37]. Second, recirculation cells, indicated by alternating upward and downward motions (Figure 3b), destroy potential vorticity at the surface and restratify the water column; the resulting decreased turbulence leads to better conditions for phytoplankton growth [23,36]. These recirculation cells are larger and deeper on the right side of the track than the left.
3.2. Sensitivity Experiments
3.2.1. Effects of Biology
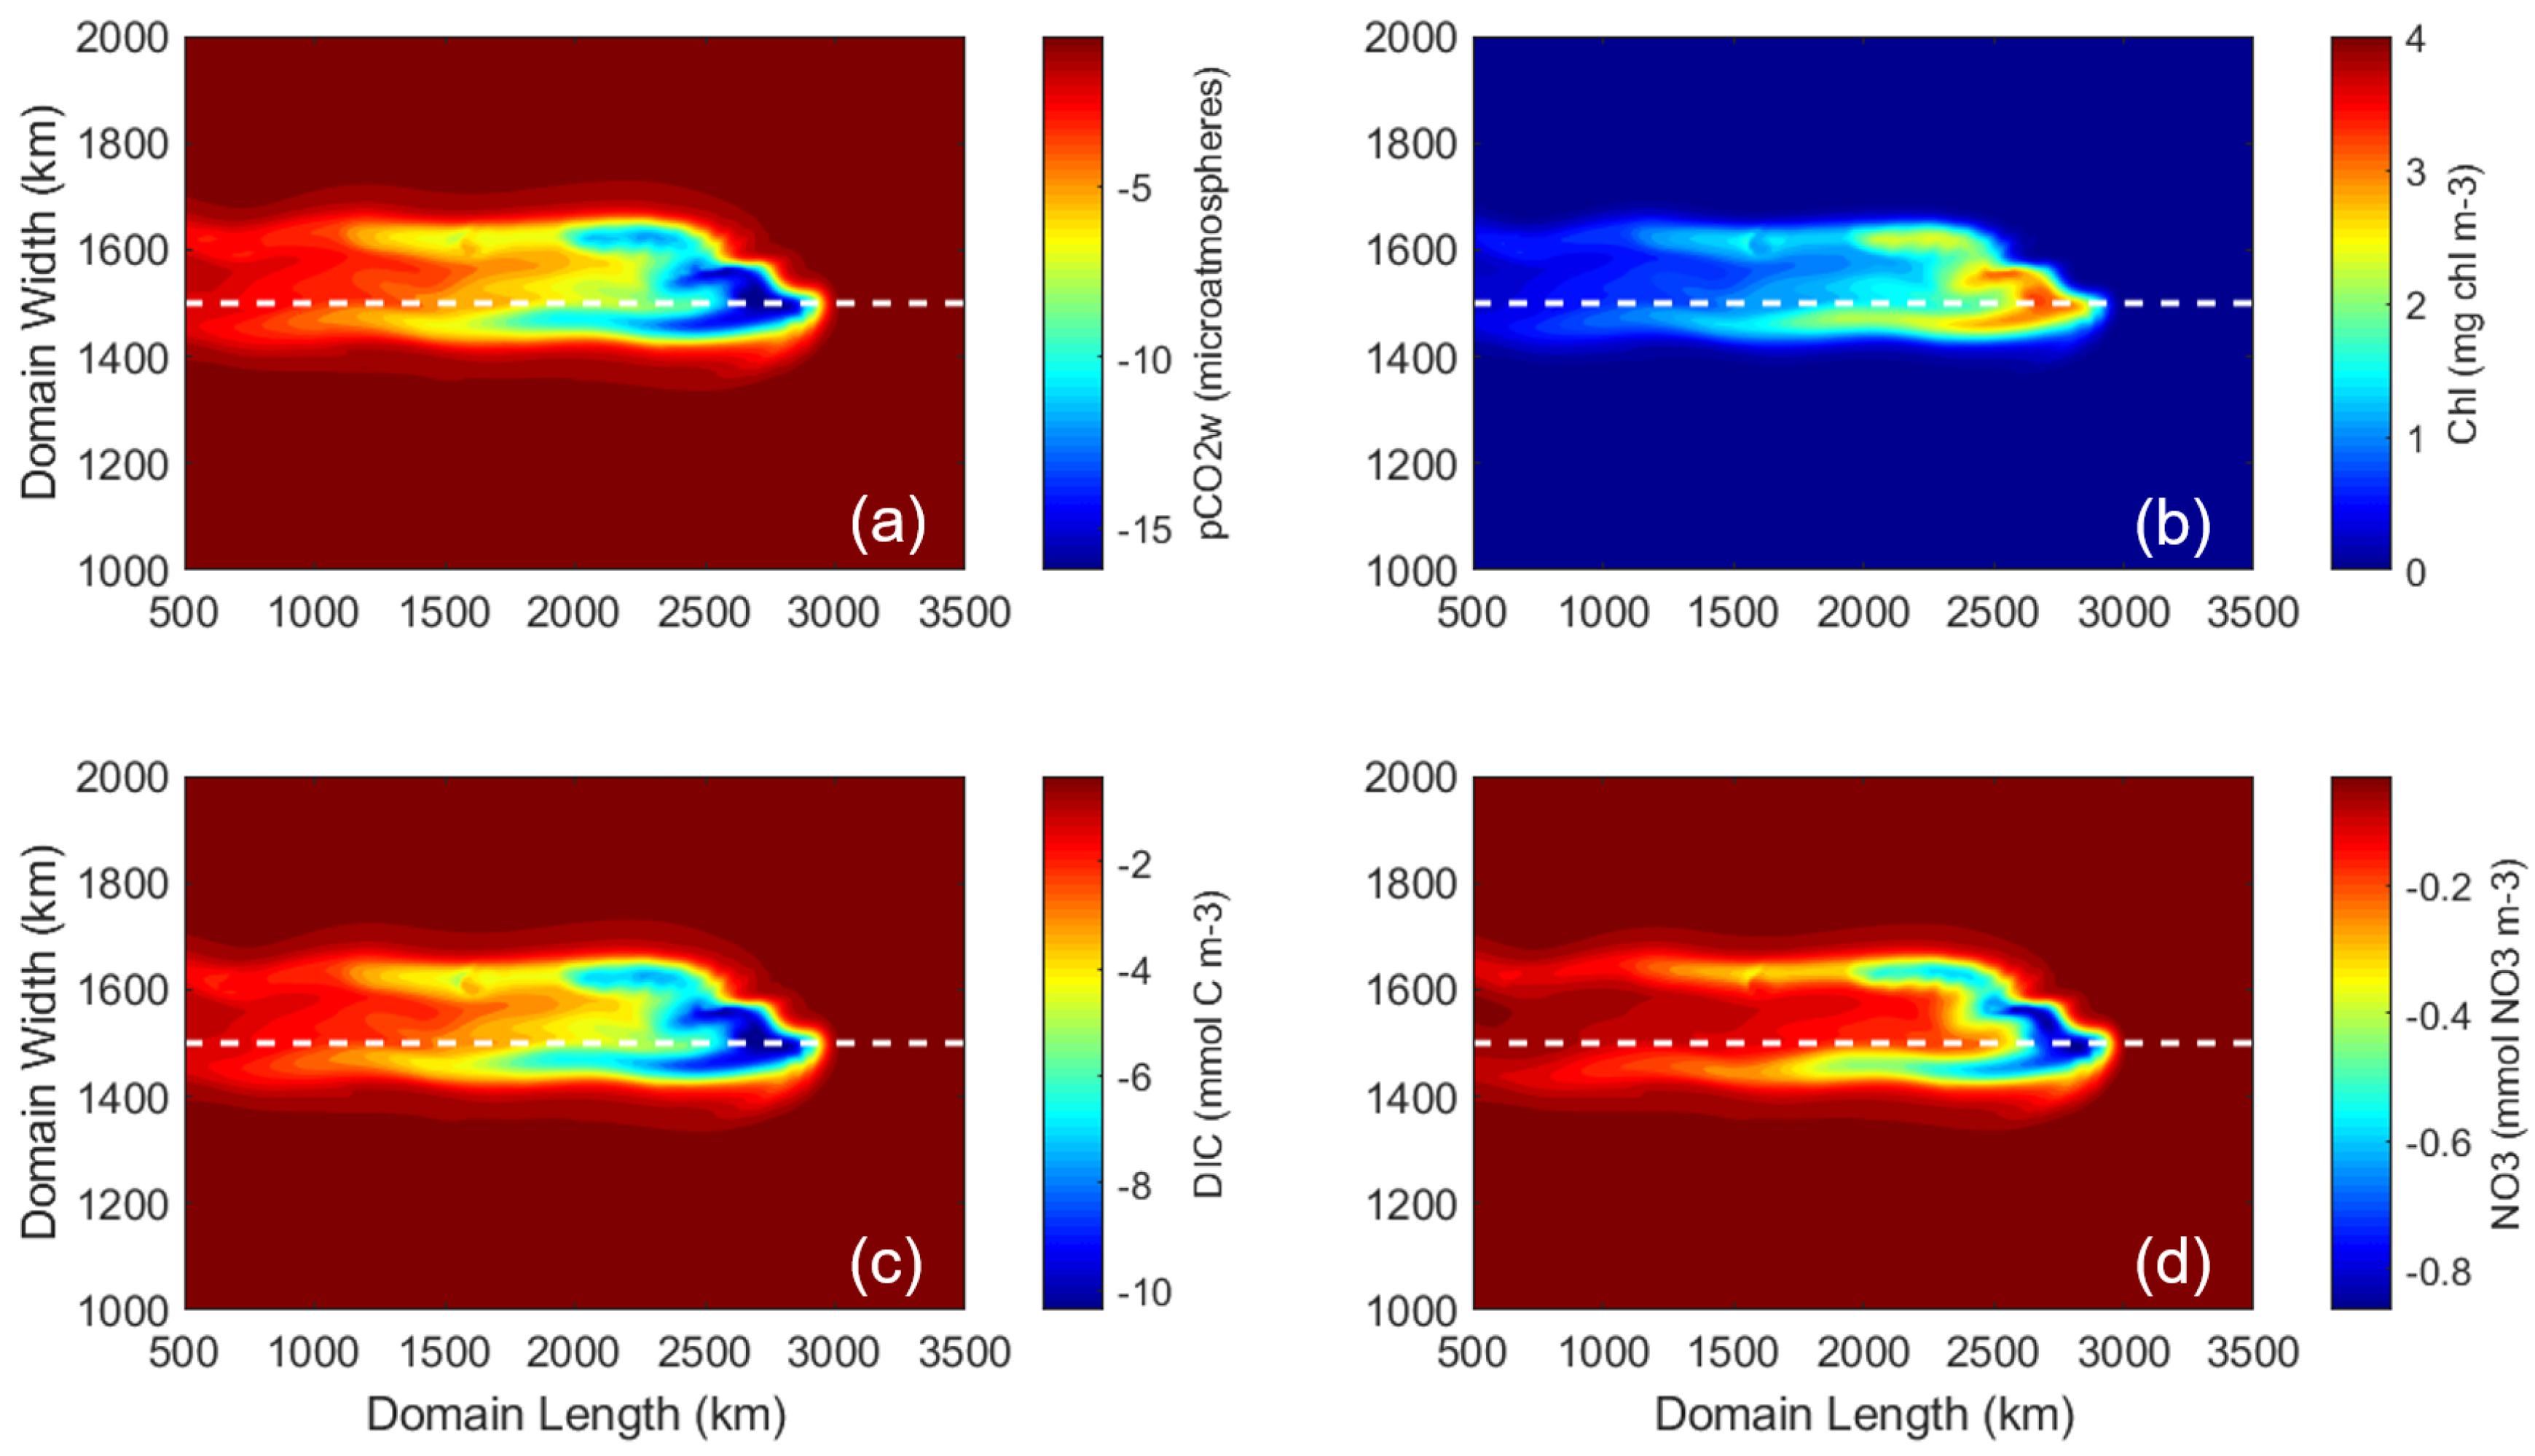
The first sensitivity test (S1) allowed no biological growth. The (Control-S1) difference maps (Figure 5) sampled on Day 8, at 6 h therefore highlight the effect of biological growth in the Control. The chl concentration in the control run was up to 3 mg m−3 higher than in S1 (Figure 5b). In the area with the most new growth, nearly 0.8 mmol m−3 more NO3 as well as approximately 10 mmol m−3 more carbon (Figure 5c,d) were taken up by the phytoplankton. As a result, in the area with new growth, pCO2w in the Control was as much as 16 atm lower than that in S1 (Figure 5a). While pCO2 remained positive in S1 (not shown), without the effect of biology, the ocean in S1 was a less effective carbon sink than in the Control.
3.2.2. Effects of Translation Speed and Intensity
Twenty model sensitivity experiments (each simulation ran for the same 10 days as the Control did) were performed to elucidate variations in SST, surface DIC, NO3, chl, and pCO2w in response to different combinations of hurricane intensities (Categories 1 through 5) and translation speeds (2.5 m s−1, 5.5 m s−1, 7.5 m s−1, and 10 m s−1). To obtain a consistent analysis for each marine property, their mean changes () were quantified by spatially averaging their differences before and after hurricane impacts (sampled at the first and last time step of each model experiment) over a subset of the model domain defined by 1000 km to 3116 km domain length marks, and 1200 km to 1800 km domain width marks (black box in Figure 1). This subdomain is the common region affected by hurricanes in all sensitivity simulations. For each variable, the ensemble of 20 mean change values () were fit into a function of hurricane intensity and translation speed using third-order (in both x and y) polynomials to reveal the intrinsic relationship between the simulated marine property changes and their corresponding hurricane intensity and translation speed. These functional fittings are very successful, with R2 values all above 0.95.
Such an analysis reveals three interesting patterns describing the resulting marine property-hurricane relationships. Pattern 1 is a quasi-linear relationship, as seen in SST (Figure 2a), DIC (Figure 2b), and NO3 (Figure 2c). Here the largest SST cooling (up to −5 C) and the maximum increases in surface DIC (up to 50 mmol C m−3) and surface NO3 (up to 4.5 mmol NO3 m−3) occurred when the ocean was impacted by the Category 5 hurricane moving at the slowest speed under study (2.5 m s−1). As hurricane intensity decreased and translation speed increased, the magnitudes of SST, DIC, and NO3 all rapidly decreased. This pattern occurs due to physical processes and is driven mainly by hurricane-induced upwelling. The weaker storms and the strong, but fast-moving storms are not as capable as the strong and slow-moving storms in transporting cold, nutrient-rich deep ocean water to the surface.
Pattern 2 has a dipole structure, as seen in the surface chl response (Figure 2d). Interestingly, the largest chl increase (0.6 mg chl m−3) occurred when the ocean was impacted by the Category 5 hurricane moving at 5.5 m s−1 and it did not co-locate with the maximum NO3 increase. This is because the maximum phytoplankton growth rate depends on both nutrient concentration (NO3) and water temperature [31,38]. The nutrient and temperature conditions produced by the Category 5 storm moving at 5.5 m s−1 constitute a “sweet spot” for rapid phytoplankton growth. chl decreases as storms become weaker and/or move faster, and can become negative. The most negative chl (up to −0.2 mg chl m−3) occurred when the ocean was impacted by a fast moving (8–9 m s−1) Category 1 hurricane. There SST cooling was weak and fewer nutrients were available. More phytoplankton were lost to mortality and zooplankton grazing than produced, resulting in a surface chl deficit after the storm passage. Pattern 2 is therefore controlled primarily by biological reactions.
Pattern 3, as seen in pCO2w (Figure 2e), has the most complex tripole structure. While pCO2w is negative for all cases, showing that partial pressure of ocean CO2 was reduced after passages of all hurricanes under study, there are two local maxima (representing the smallest pCO2w changes) and one local minimum (representing the largest pCO2w changes). The first local maximum occurred in the fast moving (9–10 m s−1) Category 1 hurricane, where SST cooling was weakest. Higher SST makes CO2 less soluble in seawater, thus increasing pCO2w. The second local maximum occurred in the slowest moving (2.5 m s−1) Category 5 hurricane. Here the large amount of DIC (which increases pCO2w) made available by strong hurricane-induced upwelling outweighed the enhanced solubility (which decreases pCO2w) associated with upwelling cooling. The local minimum occurred during the Category 4–5 hurricane moving at a speed of 5–8 m s−1. Under such storm conditions, pCO2w can become 21 atm lower than its pre-storm condition, making the ocean the greatest carbon sink among all storm cases under consideration. Overall, the complex ocean pCO2w response to hurricanes results from a delicate interplay among chemical process (temperature dependent solubility), physical transport (upwelling of DIC-rich deep water), and biological reactions (phytoplankton uptake of pCO2w).
4. Discussion
Our analyses show that right-side asymmetry in the track of hurricanes in the North Atlantic open ocean, as seen in SST cooling and phytoplankton blooms, is also a feature of ocean pCO2. The comparisons between the control run and S1 illustrate the importance of new phytoplankton growth in reducing oceanic pCO2w. The maximum change in pCO2w between the simulation with phytoplankton growth (Control) and the simulation without (S1) was 16 atm (Figure 5a). Since the maximum pCO2w decrease in the control run was 33 atm (Figure 4e), new growth accounted for nearly half (approximately 48%) of the control run’s maximum decrease in pCO2w.
The three (quasi-linear, dipole, and tripole) patterns identified from model experiments among hurricane characteristics (intensity and speed) and hurricane-induced marine property distributions are intriguing findings that warrant further examinations by future, carefully designed observing programs. Overall, the pCO2w responses to hurricanes result from a delicate interplay among chemical process (temperature dependent solubility), physical transport (upwelling of DIC-rich deep water), and biological reactions (phytoplankton uptake of pCO2w).
There are a number of limitations and simplifications in this study, which will be outlined here. In this study, the vertical ocean profile, hurricane translation speed, and hurricane intensity (after the initial ramp-up) are held constant, in contrast to the highly dynamic condition of the open ocean. The simplified conditions in this study are a deliberate choice made to isolate the effects of hurricane intensity and translation speed, and reveal physical processes that are of further interest. Because of the difficulties in gathering data under hurricane conditions and the idealized nature of this model, there are limited opportunities to provide model validation. Instead, we have relied upon model parameterizations used successfully in previous studies to represent ocean conditions, and based our analysis primarily on the differences in variable responses (variable) instead of on the absolute values themselves. Another limitation of this modeling study is that the ocean variables do not affect the atmospheric variables in the Holland wind model, and so the ocean and atmosphere in this model are not fully coupled. Changes to pCO2a due to a storm’s influence needs to be accounted for as well in future research. Coupling an atmosphere-ocean model will also allow investigations into the effect of light levels on phytoplankton growth, as well as possible effects of hurricane precipitation. Likewise, this study used vertical ocean profiles from the Gulf of Mexico. As ocean vertical profiles change, the response to cyclones will also change. Further studies using different configurations of thermocline and nutricline depth common to the North Atlantic are needed to determine the effect of vertical ocean profiles on hurricane-induced changes in oceanic carbon concentrations.
Over the past 60 years, global tropical cyclone translation speeds have decreased by 10% [3,39]. Cyclone translation speeds have slowed in every basin except the northern Indian Ocean, with the strongest slowing trends found over the western North Pacific Ocean and around Australia (16% and 14%, respectively) [39]. During this time, global temperatures have risen by 0.5 C [39]. This adds evidence to the idea that tropical cyclone behavior will change as the climate warms, with overall increases in intensity and precipitation rates and slower translation speeds [39,40,41]. The average annual translation speeds in the North Atlantic from 1950 to 2010 ranged between 20 and 25 km h−1 (5.5–7 m s−1). Based on our findings, those storms could have caused a significant pCO2w change. There is evidence to suggest that extreme translation events are becoming more common, with extreme slow-translation events (over the past forty years) increasing in the southern portion of the North Atlantic Ocean [42]. As translation speeds decrease over time, the role of phytoplankton blooms in facilitating air-sea carbon exchange may increase, potentially becoming as important as physical factors such as hurricane-induced SST decrease. However, if hurricane translation speeds decrease to an average of 2.5 m s−1, the larger amount of DIC upwelled by such hurricane conditions would make the ocean a less effective carbon sink.
The cumulative effect of synoptic processes such as hurricanes on air-sea carbon cycling can be substantial. Without considering the coupling between physical and biological processes at sufficient temporospatial scales, climate models can underestimate the effect of hurricanes on pCO2w and underestimate the regional ocean’s role as a carbon sink. Current climate models do not resolve synoptic, storm-induced processes, and future improvements may need to resolve synoptic, mesoscale, and even submesoscale physical-biogeochemical coupling in order to accurately capture air-sea carbon carbon exchange before, during, and after hurricanes. With this study, we provide a systematic, idealized study of the effect of varying hurricane translation speed and intensity on SST, phytoplankton, NO3, DIC, and pCO2w in the Gulf of Mexico. This information will aid the design of needed ocean carbon field campaigns and realistic modeling programs that will be able to fully understand and quantify the effect of hurricanes on oceanic carbon concentrations.
Author Contributions
Conceptualization, R.H.; methodology, R.H.; validation, L.M. and R.H.; formal analysis, L.M.; investigation, L.M.; resources, R.H.; data curation, L.M.; writing—original draft preparation, L.M.; writing—review and editing, R.H.; visualization, L.M.; supervision, R.H.; project administration, R.H.; funding acquisition, R.H. and L.M. All authors have read and agreed to the published version of the manuscript.
Funding
This research was made possible by National Science Foundation grant OCE-1559178 and OCE-1851421, NOAA grant NA16NOS0120028, the support by North Carolina Renewable Ocean Energy Program, and the USGS/Marine Hazards and Resources Program. L. McGee also acknowledges fellowship support from Southeast Coastal Ocean Observing Regional Association and North Carolina Sea Grant.
Institutional Review Board Statement
Not applicable.
Informed Consent Statement
Not applicable.
Data Availability Statement
A publicly available dataset and community model were used in this study. The Regional Ocean Modeling System model code can be accessed at https://www.myroms.org (accessed on 10 December 2021) with the permission of The ROMS/TOMS Group. The Gulf of Mexico and East Coast Carbon Cruise 2 data can be publicly accessed at https://www.aoml.noaa.gov/ocd/gcc/GOMECC2/ (accessed on 10 December 2021). Input files to reproduce the results of this study are openly available in Zenodo at https://0-doi-org.brum.beds.ac.uk/10.5281/zenodo.5295831 (accessed on 10 December 2021).
Acknowledgments
We thank J. Warrillow for her help with editing the manuscript.
Conflicts of Interest
The authors declare no conflict of interest. The funders had no role in the design of the study; in the collection, analyses, or interpretation of data; in the writing of the manuscript, or in the decision to publish the results.
Abbreviations
The following abbreviations are used in this manuscript:
| MDPI | Multidisciplinary Digital Publishing Institute |
| DOAJ | Directory of open access journals |
| pCO2w | Partial pressure of carbon dioxide in water |
| pCO2 | Partial pressure of carbon dioxide |
| pCO2a | Partial pressure of carbon dioxide in air |
| DIC | Dissolved inorganic carbon |
| SST | Sea surface temperature |
| ROMS | Regional Ocean Modeling System |
| chl | Chlorophyll |
| NO3 | Nitrate |
| pCO2 | pCO2a-pCO2w |
References
- Webster, P.; Holland, G.J.; Curry, J.A.; Chang, H.R. Changes in Tropical Cyclone Number, Duration, and Intensity in a Warming Environment. Science 2005, 309, 1844–1846. [Google Scholar] [CrossRef] [PubMed] [Green Version]
- Bender, M.A.; Knutson, T.R.; Tuleya, R.E.; Sirutis, J.J.; Vecchi, G.A.; Garner, S.T.; Held, I.M. Modeled Impact of Anthropogenic Warming on the Frequency of Intense Atlantic Hurricanes. Science 2010, 327, 454–458. [Google Scholar] [CrossRef] [PubMed] [Green Version]
- Zhang, G.; Murakami, H.; Knutson, T.R.; Mizuta, R.; Yoshida, K. Tropical cyclone motion in a changing climate. Sci. Adv. 2020, 6, eaaz7610. [Google Scholar] [CrossRef] [PubMed] [Green Version]
- Huang, P.; Imberger, J. Variation of pCO2 in ocean surface water in response to the passage of a hurricane. J. Geophys. Res. 2010, 115, c10024. [Google Scholar] [CrossRef]
- Paerl, H.W.; Bales, J.D.; Ausley, L.W.; Buzzelli, C.P.; Crowder, L.B.; Eby, L.A.; Ramus, J.S. Ecosystem impacts of three sequential hurricanes (Dennis, Floyd, and Irene) on the United States’ largest lagoonal estuary, Pamlico Sound, NC. Proc. Natl. Acad. Sci. USA 2001, 98, 5655–5660. [Google Scholar] [CrossRef] [PubMed] [Green Version]
- Nyadjro, E.; Wang, Z.; Reagan, J.; Cebrian, J.; Shriver, J. Bio-Physical Changes in the Gulf of Mexico During the 2018 Hurricane Michael. IEEE Geosci. Remote Sens. Lett. 2022, 19, 1002205. [Google Scholar] [CrossRef]
- Bates, N.R.; Knap, A.H.; Michaels, A.F. Contribution of hurricanes to local and global estimates of air—Sea exchange of CO2. Nature 1998, 395, 58–61. [Google Scholar] [CrossRef]
- Nemoto, K.; Midorikawa, T.; Wada, A.; Ogawa, K.; Takatani, S.; Kimoto, H.; Ishii, M.; Inoue, H.Y. Continuous observations of atmospheric and oceanic CO2 using a moored buoy in the East China Sea: Variations during the passage of typhoons. Deep. Sea Res. Part Ii Top. Stud. Oceanogr. 2009, 56, 542–553. [Google Scholar] [CrossRef] [Green Version]
- Price, J.F. Upper ocean response to a hurricane. J. Phys. Oceanogr. 1981, 11, 153–175. [Google Scholar] [CrossRef] [Green Version]
- Lemay, J.; Thomas, H.; Craig, S.E.; Burt, W.J.; Fennel, K. Hurricane Arthur and its effect on the short-term variability of pCO2 on the Scotian Shelf, NW Atlantic. Biogeosciences 2018, 15, 2111–2123. [Google Scholar] [CrossRef] [Green Version]
- Yu, P.; Wang, Z.; Churchill, J.; Zheng, M.; Pan, J.; Bai, Y.; Liang, C. Effects of Typhoons on Surface Seawater pCO2 and Air-Sea CO2 Fluxes in the Northern South China Sea. J. Geophys. Res. Ocean. 2020, 125, e2020JC016258. [Google Scholar] [CrossRef]
- Babin, S.M.; Carton, J.A.; Dickey, T.D.; Wiggert, J.D. Satellite evidence of hurricane-induced phytoplankton blooms in an oceanic desert. J. Geophys. Res. Ocean. 2004, 109, c03043. [Google Scholar] [CrossRef]
- Lin, I.I. Typhoon-induced phytoplankton blooms and primary productivity increase in the western North Pacific subtropical ocean. J. Geophys. Res. Ocean. 2012, 117, c03039. [Google Scholar] [CrossRef]
- Shropshire, T.; Li, Y.; He, R.; Dare, R.A.; McBride, J.L. Storm impact of sea surface temperature and chlorophyll a in the Gulf of Mexico and Sargasso Sea based on daily cloud-free satellite data reconstructions. Geophys. Res. Lett. 2016, 43, 12199–12207. [Google Scholar] [CrossRef] [Green Version]
- Haakman, K.; Sayol, J.M.; van der Boog, C.; Katsman, C. Statistical Characterization of the Observed Cold Wake Induced by North Atlantic Hurricanes. Remote Sens. 2019, 11, 2368. [Google Scholar] [CrossRef] [Green Version]
- Eley, E.; Subrahmanyam, B.; Trott, C. Ocean-Atmosphere Interactions during Hurricanes Marco and Laura (2020). Remote Sens. 2021, 13, 1932. [Google Scholar] [CrossRef]
- Ye, H.; Sheng, J.; Tang, D.; Morozov, E.; Kalhoro, M.; Wang, S.; Xu, H. Examining the Impact of Tropical Cyclones on Air-Sea CO2 Exchanges in the Bay of Bengal Based on Satellite Data and In Situ Observations. J. Geophys. Res. Ocean. 2018, 124, 555–576. [Google Scholar] [CrossRef] [Green Version]
- Subrahmanyam, B.; Rao, K.H.; Srinivasa Rao, N.; Murty, V.S.N.; Sharp, R.J. Influence of a tropical cyclone on Chlorophyll-a Concentration in the Arabian Sea. Geophys. Res. Lett. 2002, 29, 22-1–22-4. [Google Scholar] [CrossRef]
- Mahadevan, A.; Tagliabue, A.; Bopp, L.; Lenton, A.; Memery, L.; Levy, M. Impact of episodic vertical fluxes on sea surface pCO2. Philos. Trans. R. Soc. Math. Phys. Eng. Sci. 2011, 369, 2009–2025. [Google Scholar] [CrossRef] [Green Version]
- Chen, K.S.; Hung, C.C.; Gong, G.C.; Chou, W.C.; Chung, C.C.; Shih, Y.Y.; Wang, C.C. Enhanced POC export in the oligotrophic northwest Pacific Ocean after extreme weather events. Geophys. Res. Lett. 2013, 40, 5728–5734. [Google Scholar] [CrossRef]
- Hung, C.C.; Chung, C.C.; Gong, G.C.; Jan, S.; Tsai, Y.; Chen, K.S.; Chou, W.C.; Lee, M.A.; Chang, Y.; Chen, M.H.; et al. Nutrient supply in the Southern East China Sea after Typhoon Morakot. J. Mar. Res. 2013, 71, 133–150. [Google Scholar] [CrossRef] [Green Version]
- Bauer, J.E.; Cai, W.J.; Raymond, P.A.; Bianchi, T.S.; Hopkinson, C.S.; Regnier, P.A.G. The changing carbon cycle of the coastal ocean. Nature 2013, 504, 61–70. [Google Scholar] [CrossRef] [PubMed]
- McGee, L.; He, R. Mesoscale and submesoscale mechanisms behind asymmetric cooling and phytoplankton blooms induced by hurricanes: A comparison between an open ocean case and a continental shelf sea case. Ocean. Dyn. 2018, 68, 1443–1456. [Google Scholar] [CrossRef] [Green Version]
- Ho Ko, Y.; Park, G.H.; Kim, D.; Kim, T.W. Variations in Seawater pCO2 Associated With Vertical Mixing During Tropical Cyclone Season in the Northwestern Subtropical Pacific Ocean. Front. Mar. Sci. 2021, 8, 679314. [Google Scholar] [CrossRef]
- Ye, H.; Sheng, J.; Tang, D.; Siswanto, E.; Kalhoro, M.; Sui, Y. Storm-induced changes in pCO2 at the sea surface over the northern South China Sea during Typhoon Wutip. J. Geophys. Res. Ocean. 2017, 122, 4761–4778. [Google Scholar] [CrossRef]
- Ye, H.; Morozov, E.; Tang, D.; Wang, S.; Liu, Y.; Li, Y.; Tang, S. Variation of pCO2 concentrations induced by tropical cyclones “Wind-Pump” in the middle-latitude surface oceans: A comparative study. PLoS ONE 2020, 15, e0226189. [Google Scholar] [CrossRef] [PubMed] [Green Version]
- Chang, S.W.; Anthes, R.A. Numerical simulations of the ocean’s nonlinear, baroclinic response to translating hurricanes. J. Phys. Oceanogr. 1978, 8, 468–480. [Google Scholar] [CrossRef] [Green Version]
- Haidvogel, D.B.; Arango, H.; Budgell, W.P.; Cornuelle, B.D.; Curchitser, E.; Di Lorenzo, E.; Fennel, K.; Geyer, W.R.; Hermann, A.J.; Lanerolle, L.; et al. Ocean forecasting in terrain-following coordinates: Formulation and skill assessment of the Regional Ocean Modeling System. J. Comput. Phys. 2008, 227, 3595–3624. [Google Scholar] [CrossRef]
- Fennel, K.; Wilkin, J.; Levin, J.; Moisan, J.; O’Reilly, J.; Haidvogel, D. Nitrogen cycling in the Middle Atlantic Bight: Results from a three-dimensional model and implications for the North Atlantic nitrogen budget. Glob. Biogeochem. Cycles 2006, 20. [Google Scholar] [CrossRef] [Green Version]
- Fennel, K.; Wilkin, J.; Previdi, M.; Najjar, R. Denitrification effects on air-sea CO2 flux in the coastal ocean: Simulations for the northwest North Atlantic. Geophys. Res. Lett. 2008, 35. [Google Scholar] [CrossRef] [Green Version]
- Fennel, K.; Hetland, R.; Feng, Y.; DiMarco, S. A coupled physical-biological model of the Northern Gulf of Mexico shelf: Model description, validation and analysis of phytoplankton variability. Biogeosciences 2011, 8, 1881–1899. [Google Scholar] [CrossRef] [Green Version]
- Umlauf, L.; Burchard, H. A generic length-scale equation for geophysical turbulence models. J. Mar. Res. 2003, 61, 235–265. [Google Scholar] [CrossRef]
- Warner, J.C.; Sherwood, C.R.; Arango, H.G.; Signell, R.P. Performance of four turbulence closure models implemented using a generic length scale method. Ocean. Model. 2005, 8, 81–113. [Google Scholar] [CrossRef]
- Kantha, L.H.; Clayson, C.A. An improved mixed layer model for geophysical applications. J. Geophys. Res. 1994, 99, 25235–25266. [Google Scholar] [CrossRef]
- Holland, G. An analytic model of the wind and pressure profiles in hurricanes. Mon. Weather Rev. 1980, 108, 1212–1218. [Google Scholar] [CrossRef]
- Huang, S.; Oey, L. Right-side cooling and phytoplankton bloom in the wake of a tropical cyclone. J. Geophys. Res. Ocean. 2015, 120, 5735–5748. [Google Scholar] [CrossRef]
- Sanabia, E.; Jayne, S. Ocean Observations Under Two Major Hurricanes: Evolution of the Response Across the Storm Wakes. AGU Adv. 2020, 1, e2019AV000161. [Google Scholar] [CrossRef]
- Eppley, R.W. Temperature and Phytoplankton Growth in the Sea. Fish. Bull. 1972, 70, 1063–1085. [Google Scholar]
- Kossin, J.P. A global slowdown of tropical-cyclone translation speed. Nature 2018, 558, 104–107. [Google Scholar] [CrossRef]
- Mei, W.; Xie, S.P. Intensification of landfalling typhoons over the northwest Pacific since the late 1970s. Nat. Geosci. 2016, 9, 753–757. [Google Scholar] [CrossRef]
- Gutmann, E.D.; Rasmussen, R.M.; Liu, C.; Ikeda, K.; Bruyere, C.L.; Done, J.M.; Garrè, L.; Friis-Hansen, P.; Veldore, V. Changes in Hurricanes from a 13-Yr Convection-Permitting Pseudo–Global Warming Simulation. J. Clim. 2018, 31, 3643–3657. [Google Scholar] [CrossRef]
- Zhang, W. Extreme Translation Events of Atlantic Tropical Cyclones. Atmosphere 2021, 12, 1032. [Google Scholar] [CrossRef]
Figure 4.
Surface plots of six variables in the control simulation at Day 8, 6 h. (a) SST (C). (b) DIC (mmol m−3). (c) NO3 (mmol m−3). (d) Chlorophyll (mg m−3). (e) pCO2w (atm). (f) pCO2 (atm), defined as pCO2a-pCO2w.
Figure 4.
Surface plots of six variables in the control simulation at Day 8, 6 h. (a) SST (C). (b) DIC (mmol m−3). (c) NO3 (mmol m−3). (d) Chlorophyll (mg m−3). (e) pCO2w (atm). (f) pCO2 (atm), defined as pCO2a-pCO2w.

Figure 5.
Surface plots of the control simulation results minus S1 (simulation without biological growth) results at day 8, 6 h. (a) pCO2w (atm). (b) Chlorophyll (mg m−3). (c) DIC (mmol m−3). (d) NO3 (mmol m−3).
Figure 5.
Surface plots of the control simulation results minus S1 (simulation without biological growth) results at day 8, 6 h. (a) pCO2w (atm). (b) Chlorophyll (mg m−3). (c) DIC (mmol m−3). (d) NO3 (mmol m−3).


Table 1.
Minimum central pressure (mB) and maximum wind speed (m s−1) for each hurricane category. Minimum central pressure is user-defined in the Holland wind model, while wind speed is calculated by the model.
Table 1.
Minimum central pressure (mB) and maximum wind speed (m s−1) for each hurricane category. Minimum central pressure is user-defined in the Holland wind model, while wind speed is calculated by the model.
| Hurricane Category | Minimum Central Pressure (mB) | Maximum Wind Speed (m s−1) |
|---|---|---|
| Cat 1 | 975 | 37.5 |
| Cat 2 | 965 | 44.6 |
| Cat 3 | 950 | 54.5 |
| Cat 4 | 930 | 66.8 |
| Cat 5 | 920 | 72.8 |
Publisher’s Note: MDPI stays neutral with regard to jurisdictional claims in published maps and institutional affiliations. |
© 2022 by the authors. Licensee MDPI, Basel, Switzerland. This article is an open access article distributed under the terms and conditions of the Creative Commons Attribution (CC BY) license (https://creativecommons.org/licenses/by/4.0/).
Share and Cite
MDPI and ACS Style
McGee, L.; He, R. Hurricane-Induced Oceanic Carbon Changes in the Upper Ocean. Oceans 2022, 3, 114-124. https://0-doi-org.brum.beds.ac.uk/10.3390/oceans3020010
AMA Style
McGee L, He R. Hurricane-Induced Oceanic Carbon Changes in the Upper Ocean. Oceans. 2022; 3(2):114-124. https://0-doi-org.brum.beds.ac.uk/10.3390/oceans3020010
Chicago/Turabian StyleMcGee, Laura, and Ruoying He. 2022. "Hurricane-Induced Oceanic Carbon Changes in the Upper Ocean" Oceans 3, no. 2: 114-124. https://0-doi-org.brum.beds.ac.uk/10.3390/oceans3020010