Article

Analysis of the Influence of Structural Characteristics on the Tensile Properties of Fused Filament Fabricated ABS Polymer Using Central Composite Design

by
Anastasios Tzotzis
1,*,
Athanasios Manavis
1,
Nikolaos Efkolidis
1,
César García-Hernández
2 and
Panagiotis Kyratsis
1,*
1
Department of Product and Systems Design Engineering, University of Western Macedonia, 50100 Kila Kozani, Greece
2
Department of Design and Manufacturing Engineering, University of Zaragoza, 50018 Zaragoza, Spain
*
Authors to whom correspondence should be addressed.
Submission received: 13 November 2023 / Revised: 11 December 2023 / Accepted: 21 December 2023 / Published: 28 December 2023

Abstract

:
This study presents an investigation of the effects of structural characteristics, such as the layer height, infill density, top/bottom layer line directions and infill pattern, on the structural efficiency of Acrylonitrile Butadiene Styrene (ABS)-based specimens. The Fused Filament Fabrication (FFF) technique was utilized for the specimen fabrication, and the Ultimate Tensile Strength (UTS) and Strength-to-Mass (S/M) ratio were examined. The tests were planned according to the Central Composite Design (CCD), and an empirical model for each response was developed, with respect to the applied factors and their interactions. The analysis revealed that the characteristics with the strongest influence on the UTS and the S/M ratio were the infill and the layer height, respectively. Moreover, it was observed that the honeycomb structure contributed to the highest UTS compared to the other patterns. Finally, an optimization analysis based on the desirability function was performed, highlighting the combination of a 0.3 mm layer, 21.81% and 76.36% infill, 0° direction and the honeycomb pattern as the optimal for maximizing both UTS and S/M ratio under different desirability.

1. Introduction

One of the most widespread additive manufacturing technologies currently is the Fused Filament Fabrication (FFF) technique, also known as 3D printing. The area of application extends from home use to industrial applications, such as food processing [1], robotics [2] and consumer products [3],to biomedical uses [4,5]. A number of common materials [6] that are involved in the 3D-printing process are Polylactic Acid (PLA), Acrylonitrile Butadiene Styrene (ABS), Thermoplastic Polyurethane (TPU) and similar Thermoplastic Elastomers (TPEs), Polyamide (PA), Polyethylene Terephthalate Glycol (PETG) and Acrylonitrile Styrene Acrylate (ASA). Each material displays different properties and characteristics, providing solutions to various requirements. Although FFF is a relatively new technology, several studies already exist in the literature dealing with the investigation of 3D-printed material characterization and the manufacturing possibilities, as well as the occurrence and treatment of defects during the process.
Wickramasinghe et al. [7] reviewed the mechanical properties and defects, along with the corresponding treatments for 3D-printed polymers and the associated composites. Marșavina et al. [8] investigated the effects of the printing direction and orientation, the filament color, and the specimen thickness on the tensile properties of PLA by utilizing two different printers, focusing on describing the effects graphically. Sanford et al. [9] studied the effects of the infill angle, build orientation and void fraction on the tensile properties of ASA. Further investigations on similar materials and conditions, describing certain effects, are available in the literature [10,11]. Moreover, statistical processing of the experimental results based on Design of Experiments (DoE) [12,13], such as Taguchi, Response Surface Methodology (RSM) and full factorial, contribute towards the modelling of the process. Atakok et al. [14] worked on three methods, tensile testing, Charpy test, and three-point bending, to examine the strength of PLA and recycled PLA filaments. The authors utilized a Taguchi L18 orthogonal array with three parameters and three levels. Abid et al. [15] employed the RSM to model the 3D printing of ABS with respect to the manufacturing direction and deposition angle. Samykano et al. [16] presented research on the influence of the printing conditions on ABS’s mechanical properties by employing a full factorial design. Similar statistical studies were conducted for polymer specimens under analogous conditions [17,18,19]. The optimization processes followed in the aforementioned studies usually include parameters such as the maximum tensile strength, yield strength, modulus of elasticity, and maximum energy at breakage or strain.
Besides the investigation of standard tensile properties, the fatigue behavior under high cycle bending [20] of additive-manufactured polymers is another research topic in the field. Moreover, the increasing demand in additive-manufactured composite materials led to the investigation of the mechanical properties of materials such as carbon-fiber-reinforced polymers [21,22] and resins [23,24].
It is evident that PLA is widely studied [25,26,27] due to its availability, cost and applicability. However, ABS remains a considerable choice for both prototype and functional additive-manufactured parts, especially when superior properties and resistance are required [28]. Moreover, ABS is a material with a low degradation rate compared to other polymers used in 3D printing [29]. In addition, a number of studies that investigate the effects of the FFF parameters on the produced builds usually deal with a limited number of parameters. Typical printing factors examined are the layer height, build direction and orientation, printing temperature and speed, and infill density. In the light of the above, this paper focuses on the effects of four key structural characteristics on the Ultimate Tensile Strength (UTS) and Strength-to-Mass (S/M) ratio of 3D-printed ABS polymers. The S/M ratio is a feature of great importance to the structural efficiency of a specimen that has been studied to a limited extent, as the mass by itself is not sufficient. The parameters utilized in this study were the layer height (LH), infill density (FD), top/bottom layer line direction (LD), which constitutes a unique parameter that is different to either build orientation or raster angle, and the infill pattern (FP), which together form the core parameters for the structural integrity of a build. Furthermore, a Central Composite Design (CCD) was employed to model the process, as well as to find the optimal combination of the selected characteristics to maximize the UTS and the S/M ratio of the ABS parts.

2. Materials and Methods

2.1. Experimental Testing Workflow

In the present study, the experimental workflow followed (Figure 1) includes the fabrication of the required tensile test specimens, design of the experiments and numbering of the parts according to the selected design, tensile testing, and gathering of the output data. The specimens used in the present study were fabricated with the aid of the CreatBot D600 Pro printer (Henan Creatbot Technology Limited, Zhengzhou, China), whereas the CAD model was prepared according to the features of the UltiMaker Cura 4.20 software (Ultimaker B.V., Geldermalsen, Netherlands). A total of 62 parts were produced according to the specifications generated by the CCD, which are discussed in Section 2.2, and the operation parameters are presented in Table 1. A preliminary study was conducted by testing a set of specimens with identical parameters. The purpose of the preliminary study was to gain insight regarding the influence of each factor, as well as to evaluate the testing method prior to the main experimental work. The specimens were fabricated by setting three factors to the middle values, and the fourth one to all levels, leading to 12 combinations.
The specimens were designed with respect to the recommendations of the ASTM-D638 standard test method for the tensile properties of plastic parts [30]. Figure 2 illustrates the dimensions for the modelling of Type IV specimen, which has gauge length equal to 33 mm, 6 mm width and 3.6 mm thickness. The Instron 3345 universal testing machine (INSTRON, Norwood, MA, USA), loaded with a 5 kN cell, was utilized to carry out the tensile experiments on the 3D-printed parts.

2.2. Central Composite Design and Specimen Specifications

To determine the specifications of the test pieces, the experimental order and the combination of the conditions, a Box–Wilson CCD was implemented. The CCD is an experimental design for RSM, which can be either a full factorial or fractional factorial design with center points, enhanced with a group of axial points that can approximate the curvature of a process [31]. Moreover, it is considered ideal for the estimation of quadratic models during sequential experimentation. In the present study, the selected face-centered CCD corresponded to a full factorial design with 31 tests. Moreover, the tests were composed of 16 cube points, 7 center points and 8 axial points, in addition to the value of α, which is equal to 1. As presented by Table 2, the independent variables that constitute the input were: the LH, FD, LD, and FP, whereas the responses were the UTS and the S/M ratio. Therefore, the present work focuses on four structural characteristics at three levels each. The different variations of each parameter are shown in Figure 3: the LH (Figure 3a), FD (Figure 3b), LD (Figure 3c) and FP (Figure 3d). It is noted that the layer line direction corresponds to the top and bottom layers. The infill direction was kept as the default 45° angle for all builds.
The total number of the produced specimens was 62 since two sets were fabricated, each containing 31 test pieces. The reason for this is that for every trial, two identical specimens were tested, and the mean value for the UTS was calculated. The sets were produced on two consecutive days, and each set of parts was produced as one batch, minimizing the occurrence of flaws and defects, as well as avoiding any possible degradation due to long storage periods [32].
Finally, Table 3 presents the experimental run order, the coded values of the four structural conditions, and the mean value of the UTS. The coded value −1 represents the low level of the factors, whereas the value +1 is the high level of the factors. In addition, the specimen mass mean value for each trial was included, as well as the S/M ratio. The aforementioned data were used in the modelling process and as an index of the structural efficiency. It is noted that the mass was measured with the Denver Instrument P-214 analytical precision balance (Denver Instrument, Denver Colorado, CO, USA). The two-decimal-point accuracy for the UTS was given by the measurement of each specimen’s cross-sectional geometric dimensions.

3. Results and Discussion

Before processing the output data, a set of magnified images of the specimens at the fracture point were taken. Figure 4 illustrates the three different fracture lines developed during the tensile testing according to the layer line direction. By observing Figure 4a, it is evident that the fracture line approximates a curve. However, the individual fractured layer lines indicate that they are perpendicular to the load. Moreover, this observation suggests that shearing is responsible for the weakening and, eventually, the fracturing of the lines, leading to the conclusion that the specific line direction allows for the delamination between layers. Similar findings were reported in [9], as well. Figure 4b indicates that due to the 45° layering, the fracture line follows a similar path, possibly causing the abruption of the layers. It is noted that the side layers forming the walls, which follow a perpendicular to the load pattern, fracture in a similar manner to the fracturing discussed in Figure 4a. Finally, Figure 4c illustrates the fracture line that developed on a specimen with layer lines deposited at 90°. Weakening marks (white areas) are evident on the side layer lines, which indicate that the load was applied perpendicular to the lines, as opposed to the central layer lines that did not fracture but rather were separated, possibly due to the bonding abruption. In addition, the preliminary results revealed that the best S/M ratio per factor was generated by the 0.3 mm layer thickness (7.12 MPa/g), 20% density (6.91 MPa/g), 0° layer line direction (7.15 MPa/g) and honeycomb pattern (6.74 MPa/g).
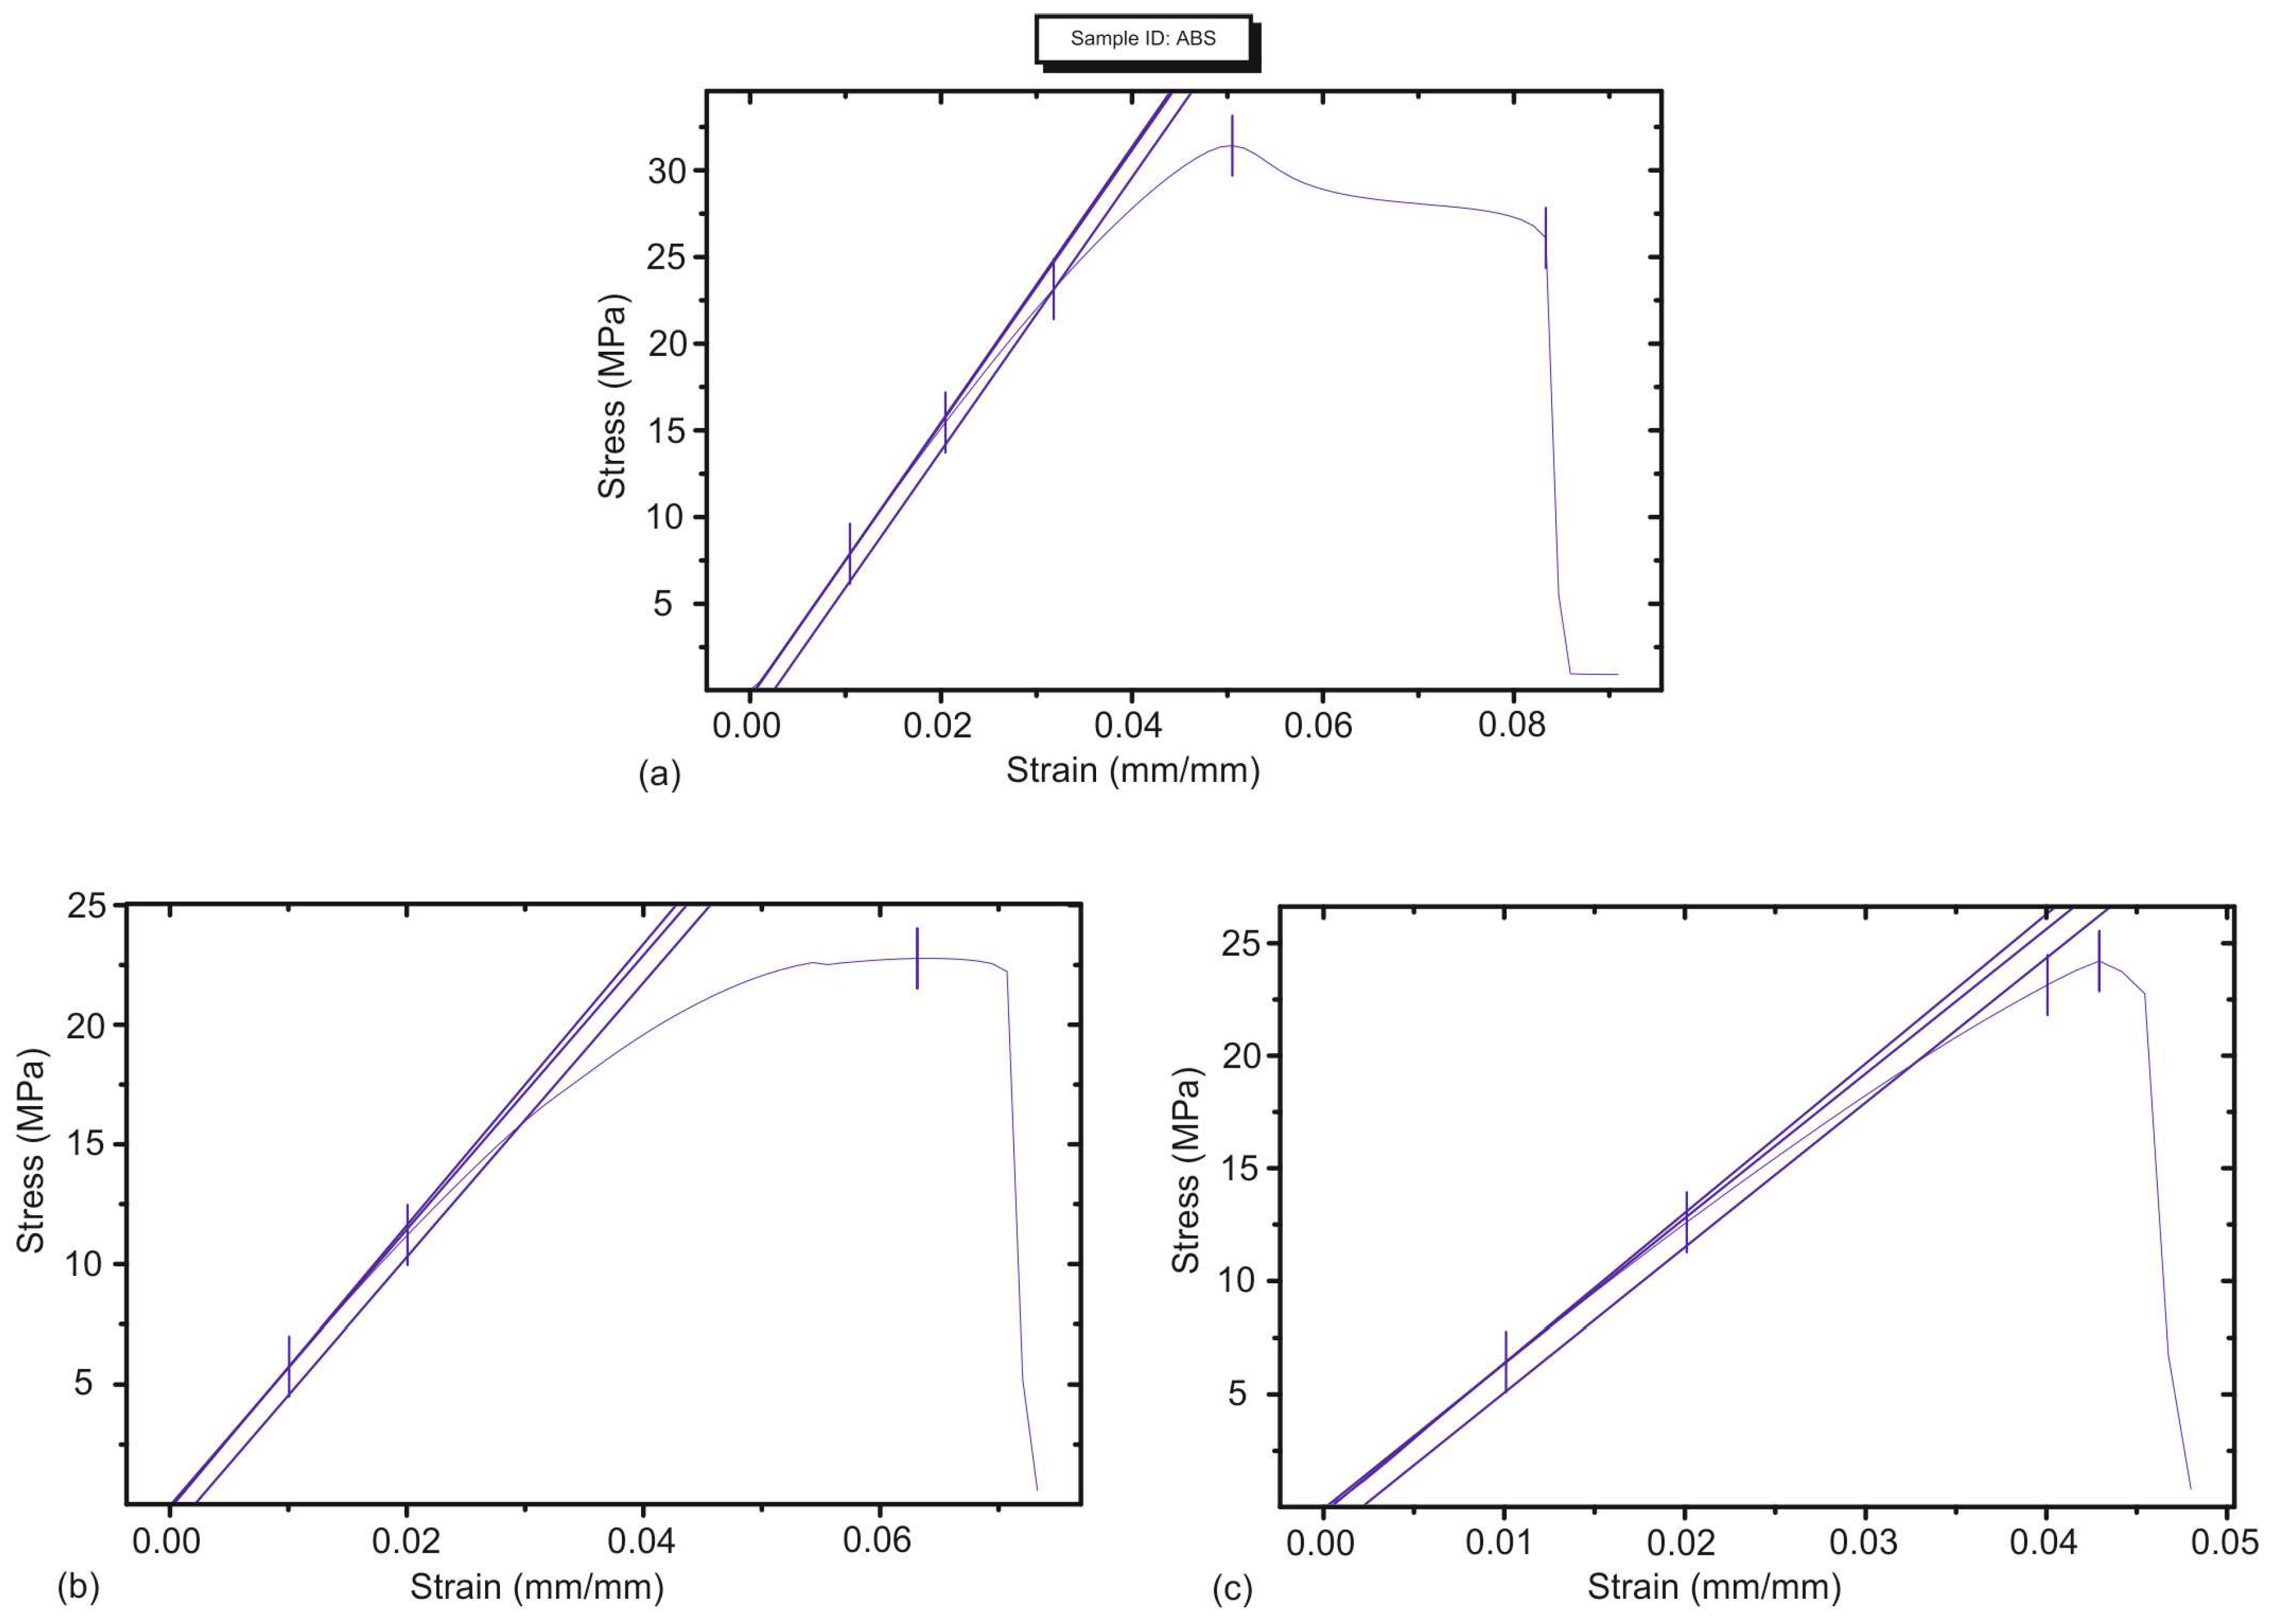
Regarding the direction of the top and bottom layer lines, it was found that it affected the generated stress–strain curve as well. A set of tests that belong to the preliminary study was carried out with specimens of identical parameters (LH = 0.1 mm, FD = 80% and FP = Grid), with the exception of the top/bottom line directions, to assess the generated curves. The 0° direction (Figure 5a) yielded a curve pattern that included the elastic area where the linear relationship between the stress and strain exists. Additionally, it was observed that the plastic area is larger compared to the ones generated by the 45° (Figure 5b) and 90° (Figure 5c) directions. In particular, the 90° layer line angle was responsible for the development of a much smaller plastic area and a rapid fracture point in comparison to the other orientations. Similar findings were mentioned in [19].
Finally, it should be noted that specimen No 12 was found to be the one with the lowest mass, i.e., 3.361 g. The specimen was built according to the following specifications: LH = 0.2 mm, FD = 20%, LD = 45°, and FP = triangles. The specimen with the highest UTS (32.13 MPa) was No 21, which was fabricated with an LH = 0.3 mm, FD = 80%, LD = 0° and FP = honeycomb. Additionally, specimen No 24 was the one with the highest S/M ratio, calculated as 8.57. It was built with an LH = 0.3 mm, FD = 20%, LD = 0° and FP = honeycomb.

3.1. Model Development

A prediction model for both the UTS and the S/M ratio was developed by using the CCD and the experimental results. The generated models are second-order polynomial that can be described by Equation (1) for the UTS and by Equation (2) for the S/M ratio. Such models are derived from the interaction between the input variables and the responses, as described in [31]. The interaction between the input and the output is non-linear; therefore, the equation contains linear, quadratic, and cross-product terms.
The backward elimination technique was implemented in the models to eliminate the included variables of low significance. Therefore, it was used to remove the variables that have p-values higher than the specified significance level, which herein was set to 5%. However, a number of terms with significance levels marginally higher than 0.05 were preserved because they affected the yielded R-square values positively. This means that they are contributing towards the reliability and the robustness of the model, despite the fact that their effect on the response is considered insignificant.
U T S = 16.882 + 33.01 L H + 13.37 F D 0.06611 L D + 0.490 F P + 0.969 F P 2 27.52 L H × F D + 0.0804 L H × L D
S / M = 5.747 + 10.669 L H 1.031 F D 0.01610 L D + 0.0130 F P + 1.879 F D 2 + 0.1537 F P 2 9.12 L H × F D + 0.01434 L H × L D + 0.645 L H × F P

3.2. Analysis and Model Validation

The Analysis of Variance (ANOVA) was carried out to examine the performance [17] of the developed models in terms of the fit, variance, and prediction capabilities, as well as to check the contribution levels of the terms to the models. Moreover, the interactions between the reactive terms were identified. Table 4 and Table 5 contain the ANOVA results for the UTS and the S/M ratio, respectively, by employing a 0.05 confidence level. The calculated coefficient of determination (R-sq) values indicate a strong fit for both models. In addition, the adjusted and predicted values of the coefficient suggest that the model terms included in the models suffice and that the models can predict both the UTS and S/M ratio with increased reliability within the range of conditions of the study.
By examining the p-values, it is shown that every term with a value lower than 0.05 is statistically significant, and thus, its contribution to the models is considerable. Every term included in Table 4 and Table 5 is significant since any high p-value term was removed during the backward elimination process. In contrast, the remaining errors do not affect the reliability and robustness of the models. Lastly, it is noted that the terms LH × LD and LH × FP were maintained in the S/M ratio model because their p-value is marginally higher than the significance level. Although they are not considered statistically significant, it was found that their presence in the model positively influenced the generated coefficient of determination.
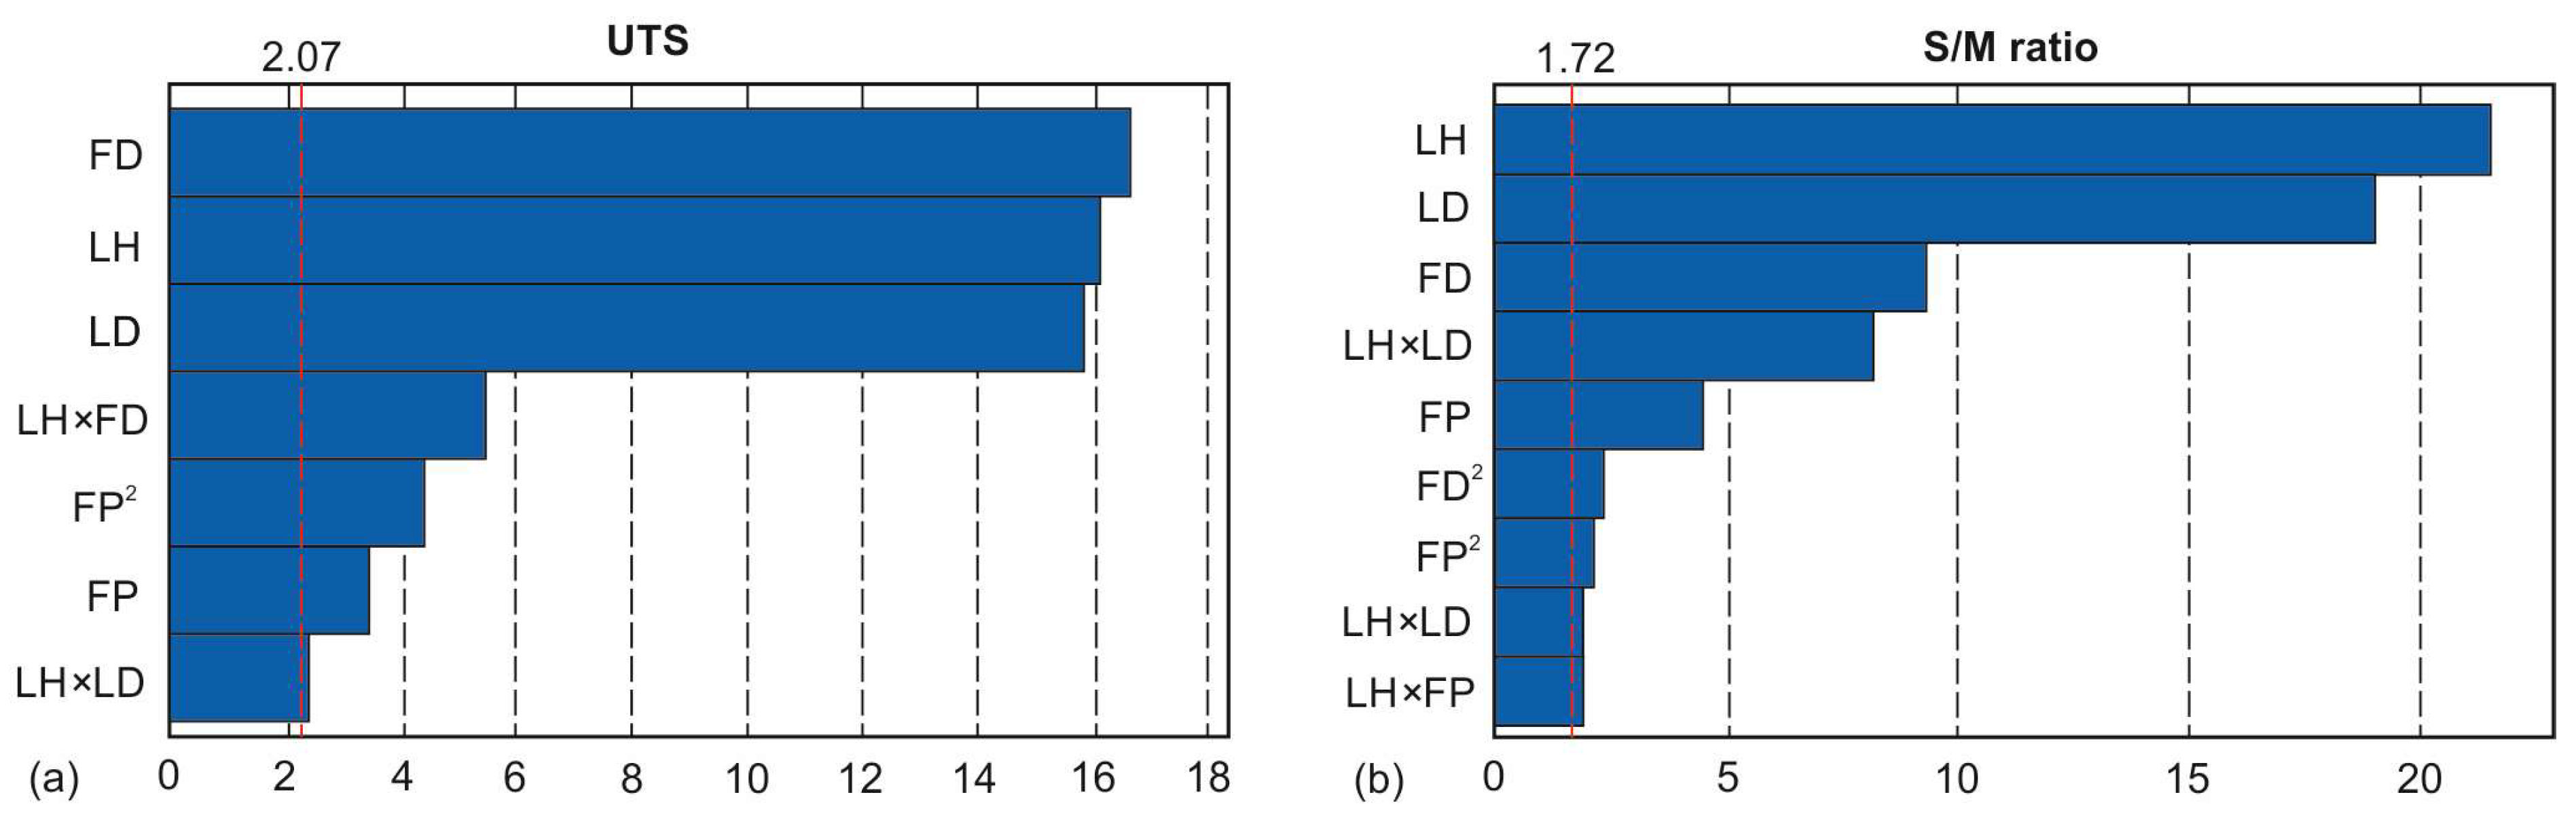
To further analyze the contribution of the factors, as well as to visualize the effects, the Pareto charts were plotted. Figure 6a displays the effects from the largest effect to the smallest, indicating that the FD, LH and LD contribute the most, with percentages equal to 32.31%, 30.38% and 29.43%, respectively. The magnitudes of the rest of the factors are considerably smaller; however, all terms are significant, as indicated by the reference lines (red dashed lines). Similarly, Figure 6b highlights the LH and LD as the most important effects, in addition to the FD and LH × LD, which exhibit weaker, but noticeable effects. The percentage levels of the aforementioned terms are 45.61%, 35.44%, 8.55%, and 6.64%, accordingly.
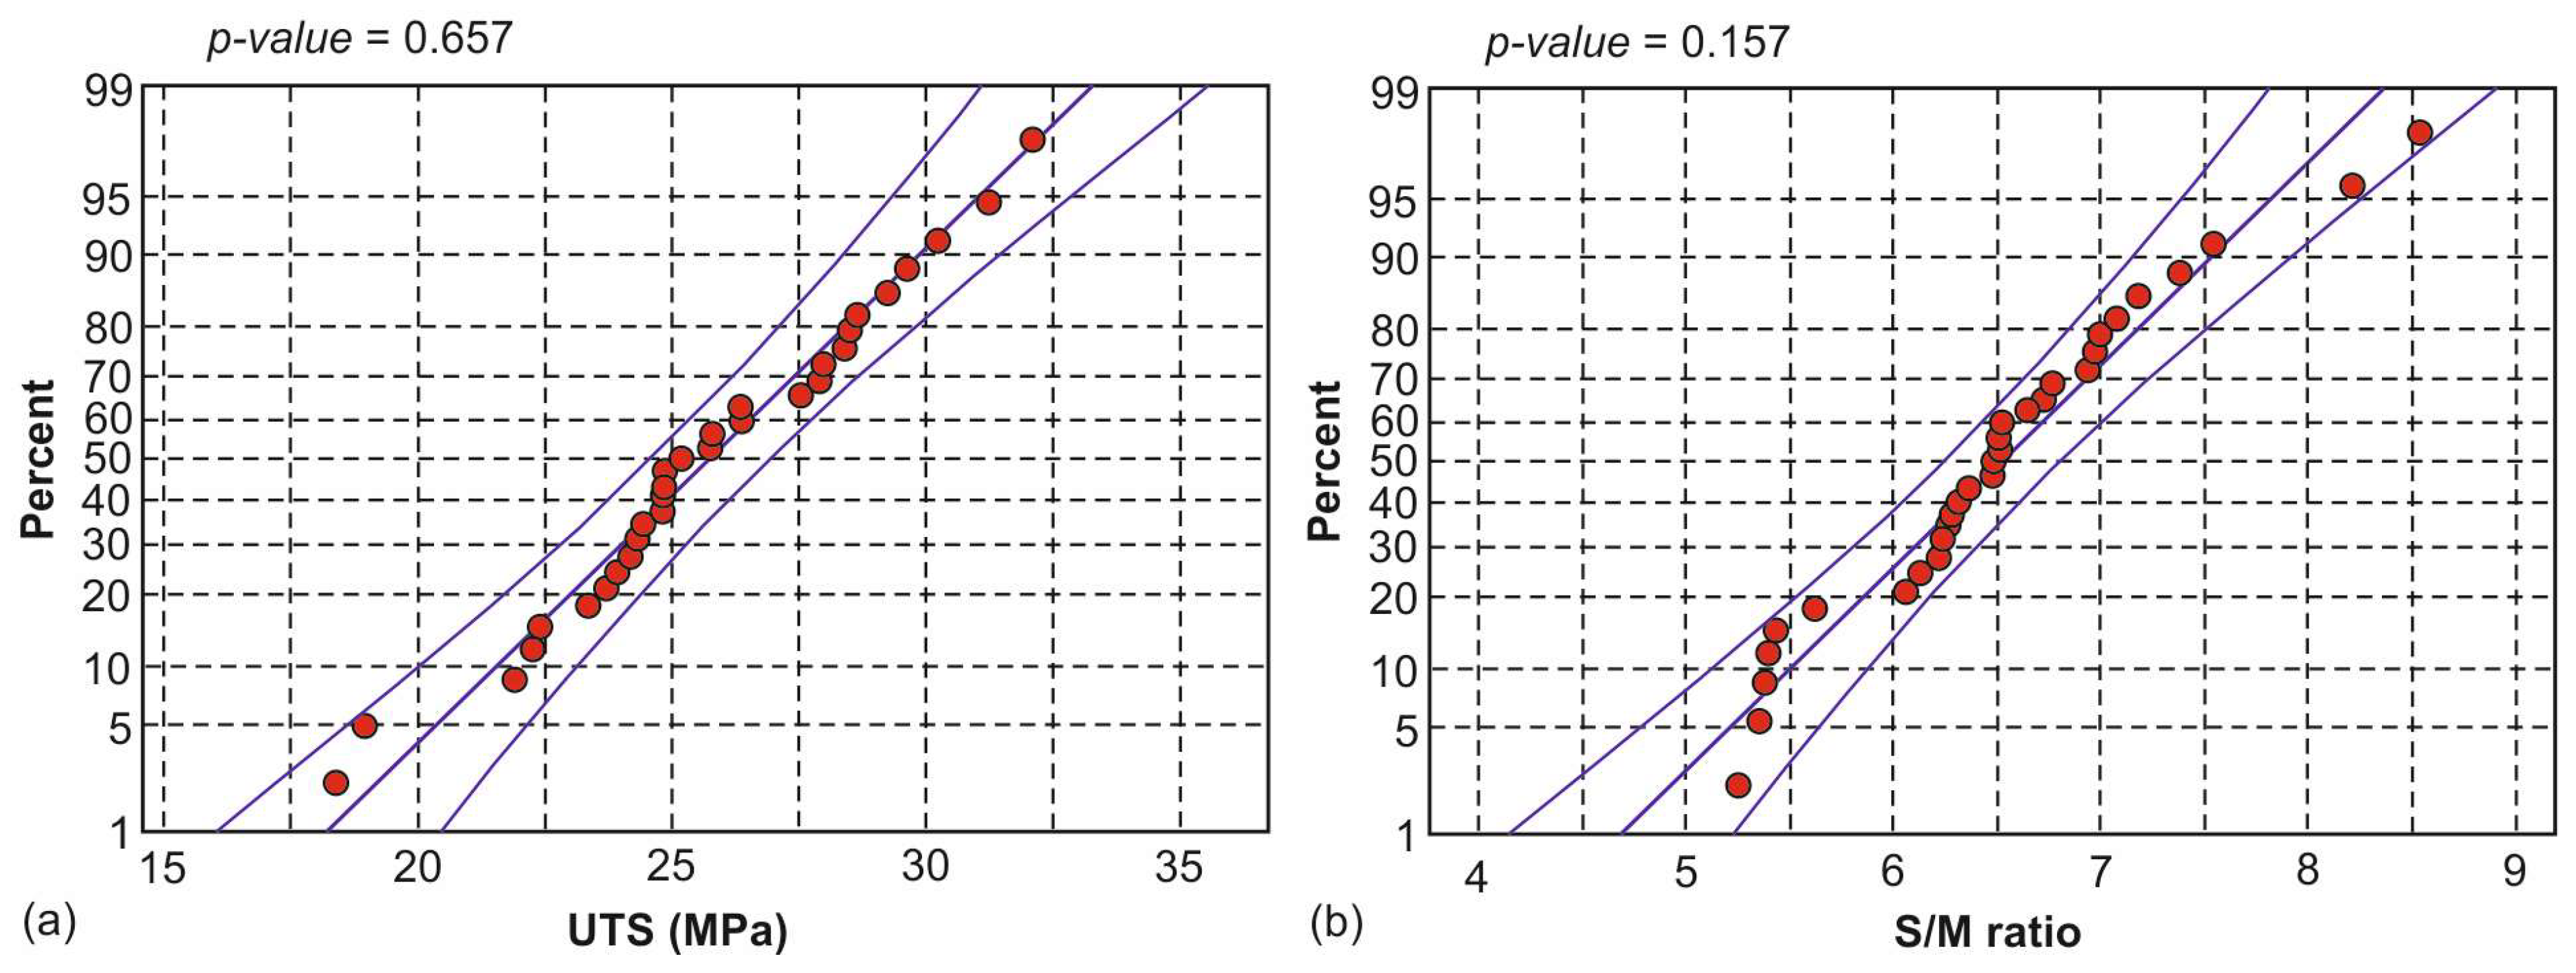
The probability plots (Figure 7) were used to determine whether the data follow the distribution or not. To assess how well the data points follow the distribution, the vertical distance of each point from the fit line was examined. At first, the p-value of each one of the plots suggests that the null hypothesis cannot be rejected, and hence, the data follow the distribution. Furthermore, the data points seem to closely follow the fit line, as seen in Figure 7a,b, which correspond to the UTS and the S/M ratio, accordingly. A number of points pose an exception, one for the UTS and three for the S/M ratio plot, which are more distant compared to the rest of the points. Despite this issue, they are inside the confidence intervals (outer solid lines), a fact that indicates a normal distribution.
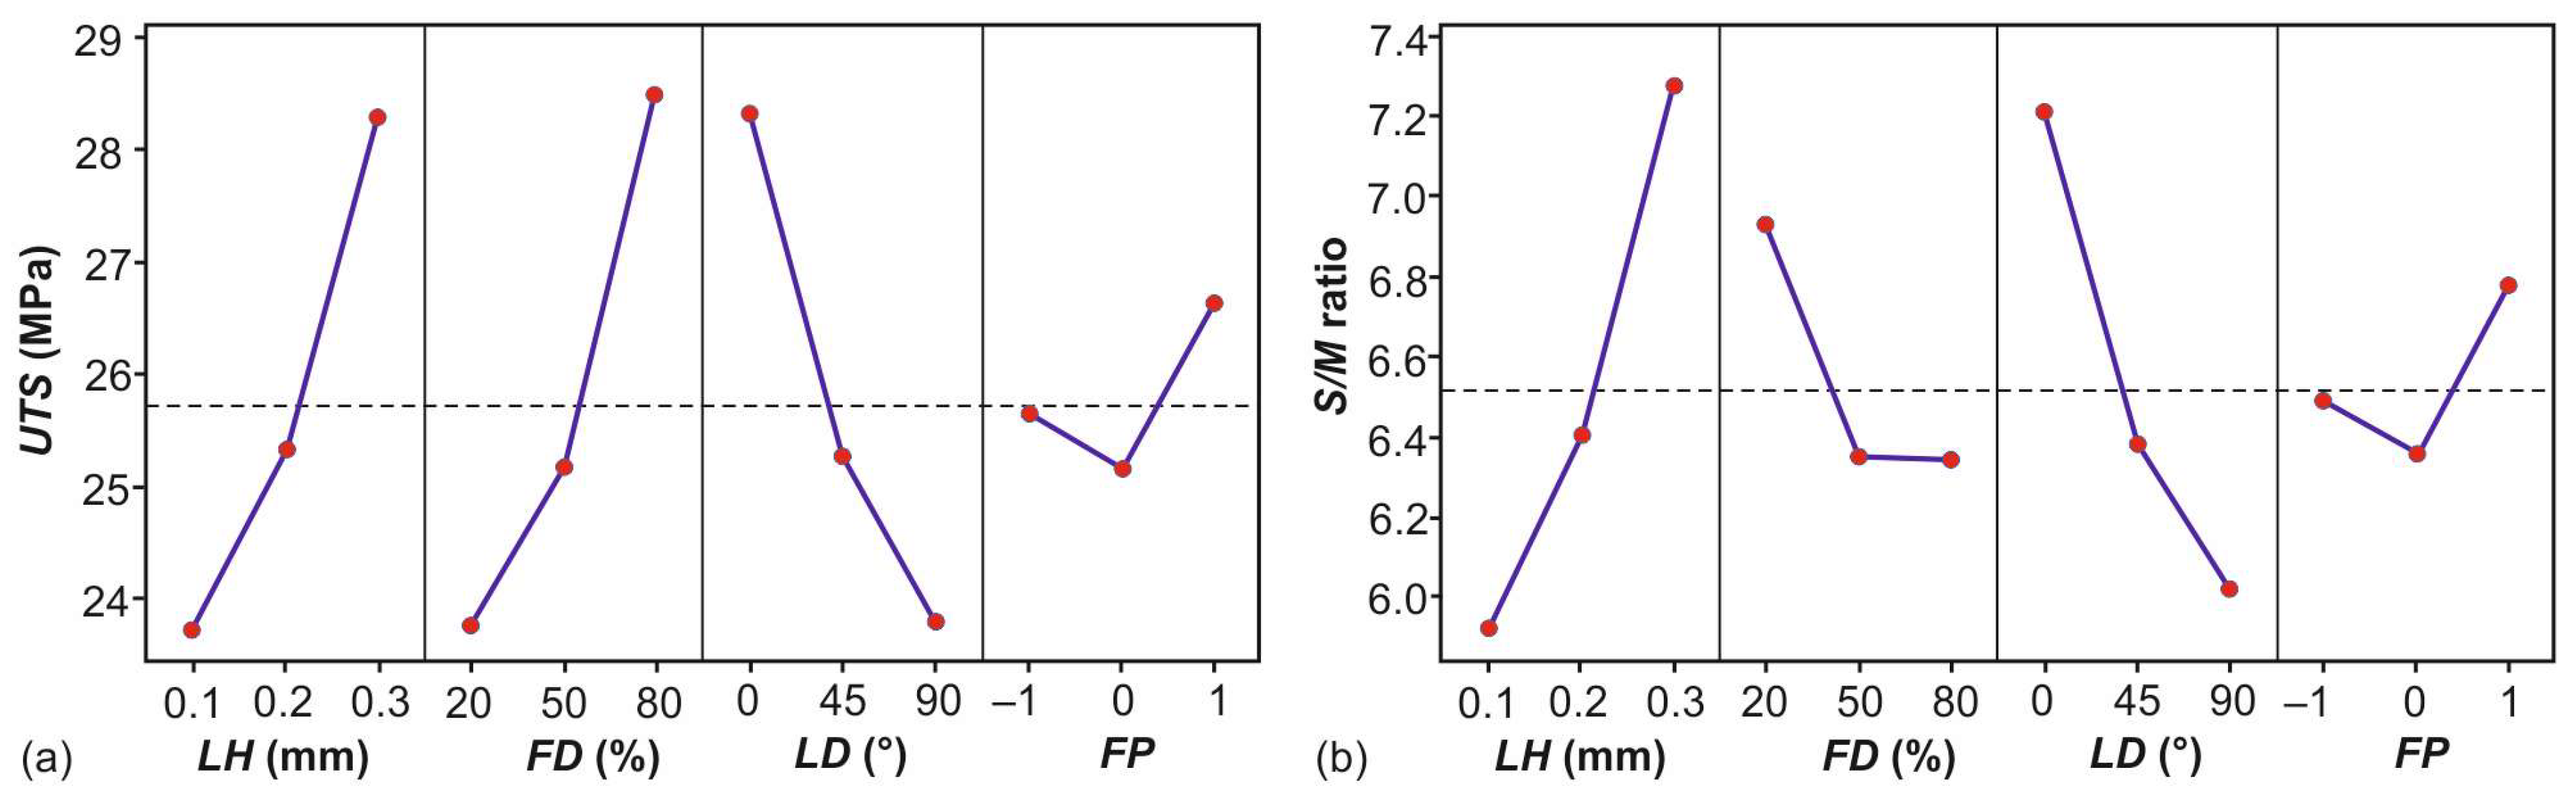
Investigating the main effect plots (Figure 8) revealed the differences between the level means for the four parameters. Figure 8a corresponds to the UTS, whereas Figure 8b represents the mean effect plot for the S/M ratio. By observing Figure 8a, it is evident that the LH acts increasingly on the generated UTS, and especially the 0.3 mm value. It is also clear that a similar pattern applies for the FD. On the other hand, any increase in the LD negatively affects the UTS. Alafaghani et al. [33] concluded that increasing the infill percentage and layer thickness have a strong impact on the tensile strength and stiffness of ABS pieces. Lastly, the FP exhibits a different influence scheme. Specifically, the triangle structure seems to contribute the least to the generated UTS, with the grid being slightly better than the triangles. In contrast, the honeycomb pattern is responsible for more rigid structures and, therefore, for higher UTS values. Tanveer et al. reported similar results for the honeycomb structure [34]. Figure 8b shows that the S/M ratio is affected by both the LH and LD factors, as well as the pattern, in a similar manner to the UTS. Both the 50% and 80% densities produce ratios of approximately equal values. However, the lowest level of density is responsible for increased S/M ratios.
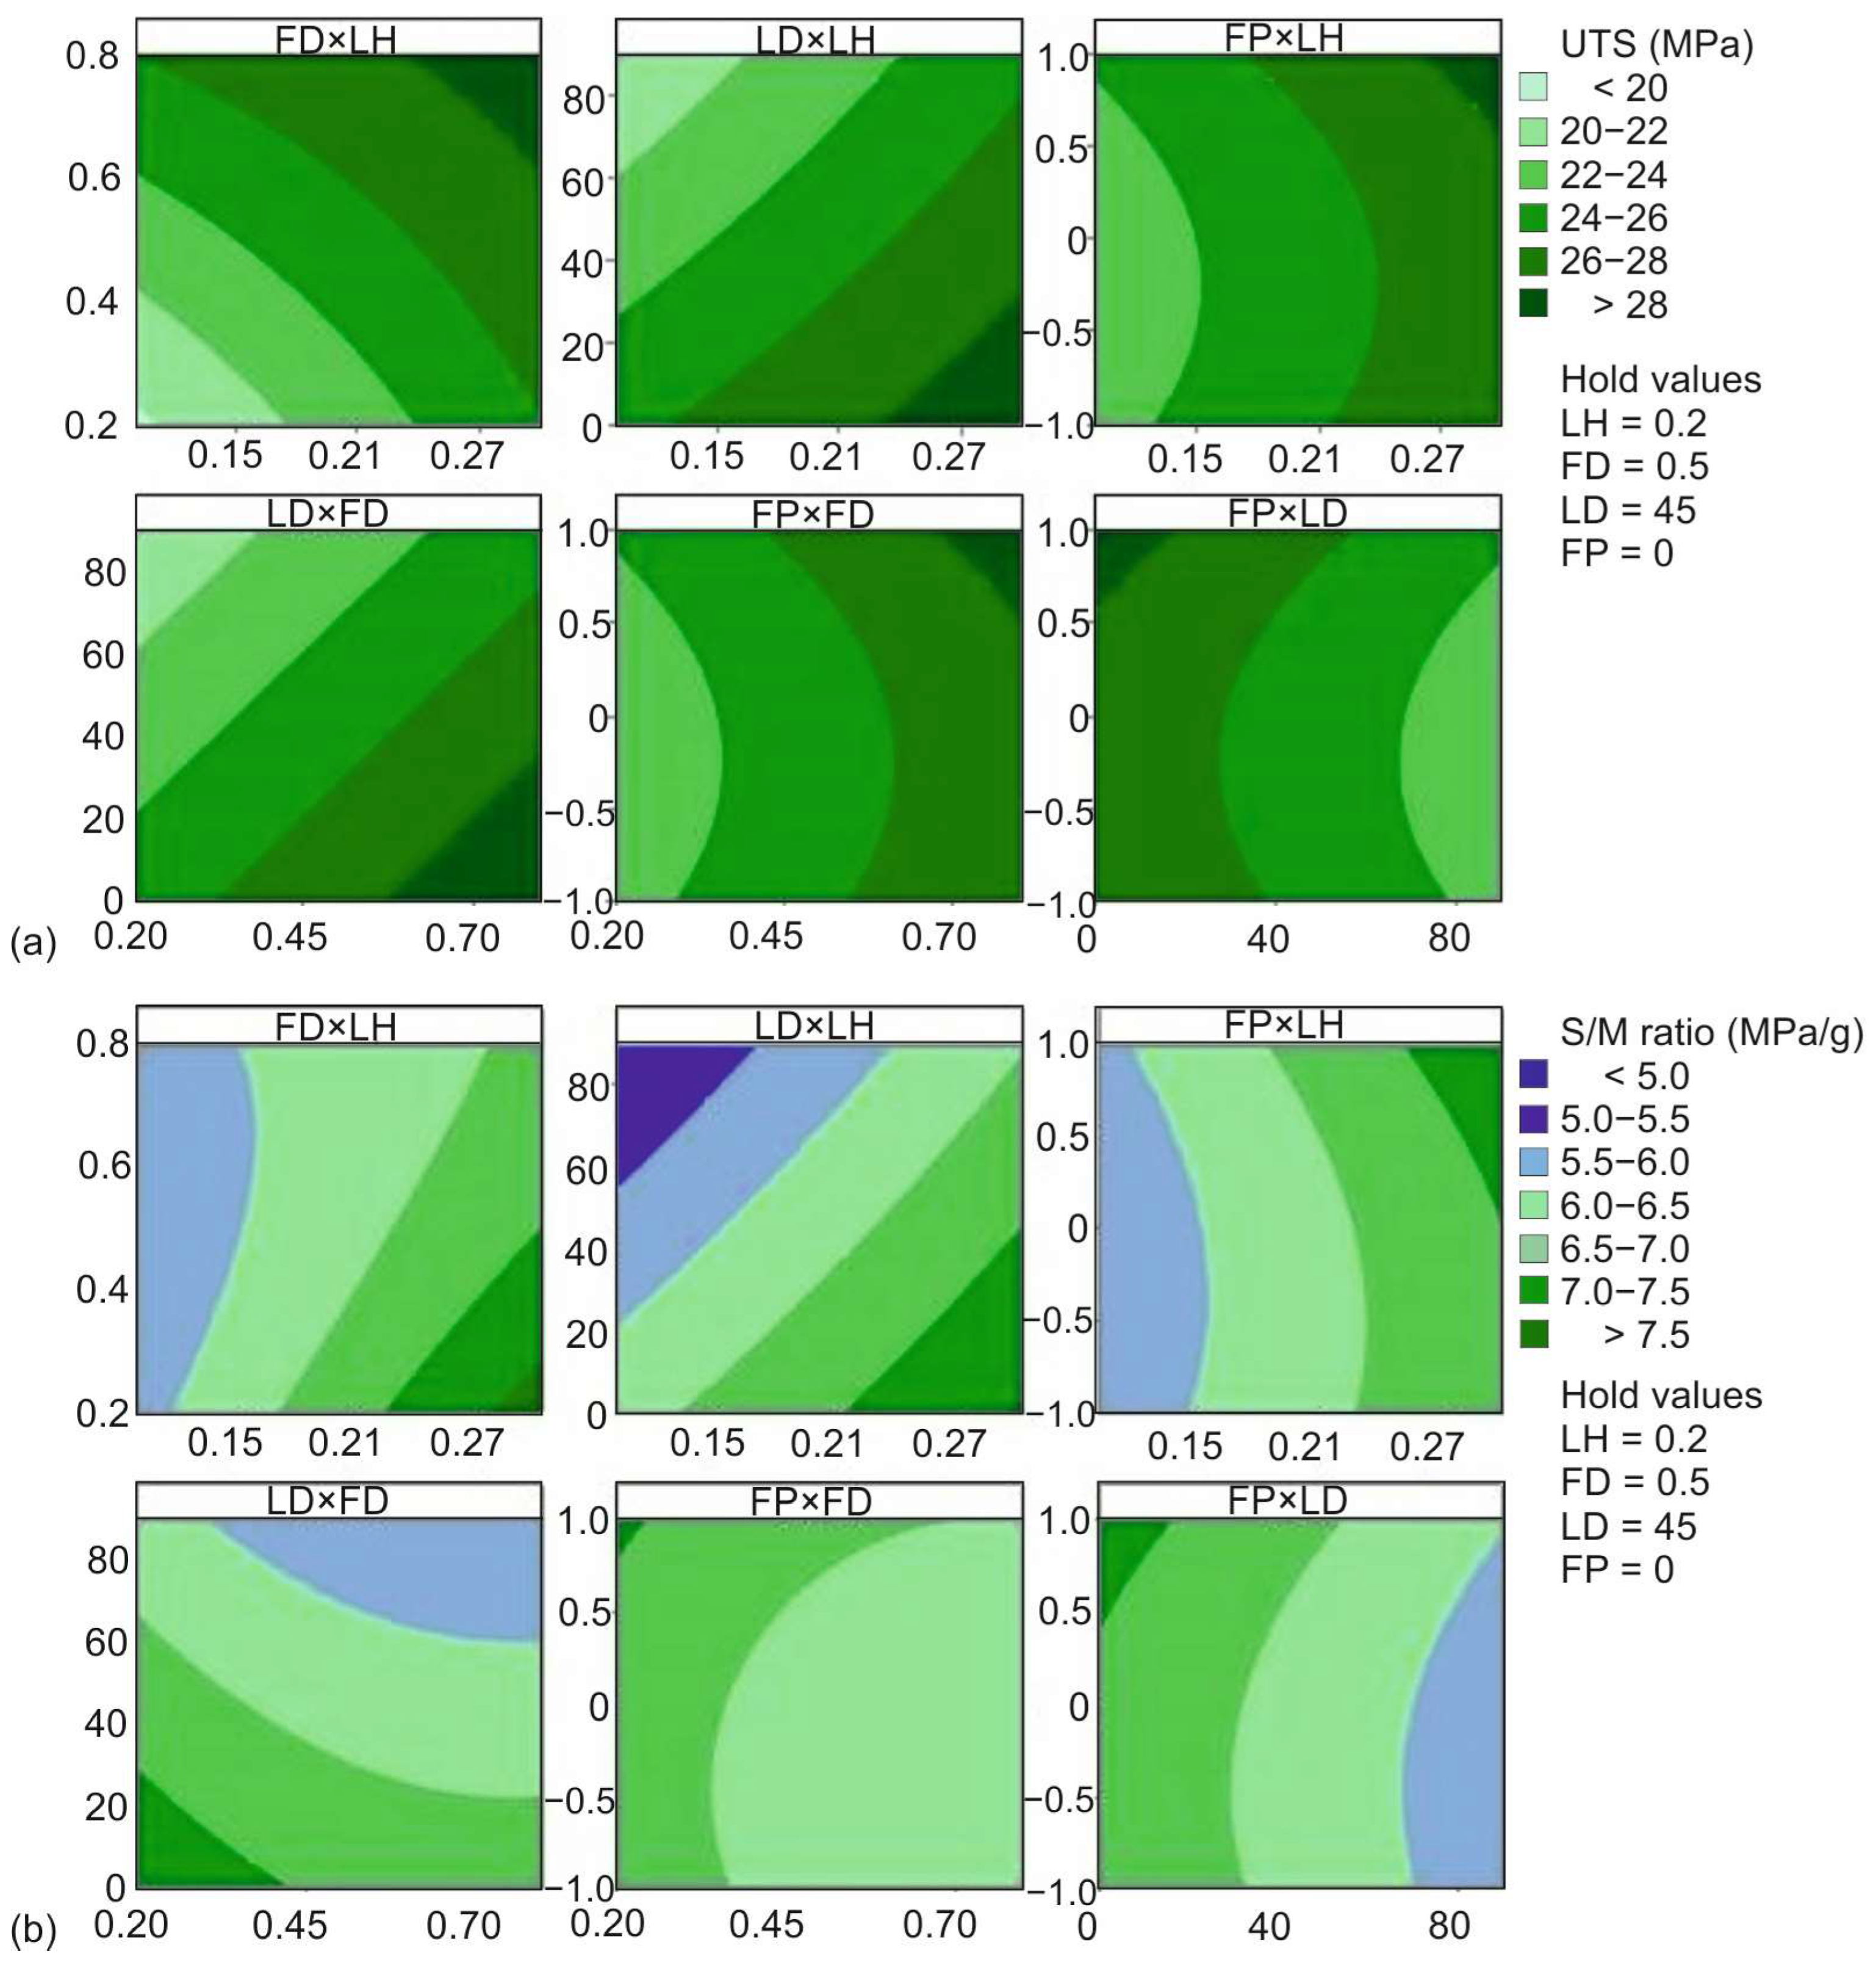
The contour plots of Figure 9 were used to examine the relationship between an output variable with the predictor variables in pairs. It can be seen that the values for the predictor variables are represented on the x and y axes, whereas the values for the output variable are illustrated as shaded regions, the contours of which are similar to the contours found in the topographical diagrams.
Figure 9a illustrates the relationship between the six different combinations of the input variables and the produced UTS. Similarly, Figure 9b depicts the same interaction for the S/M ratio. Areas with darker colors indicate higher values of the response, whereas lighter colored regions represent lower values. By observing the FD × LH interaction of Figure 9a, for instance, it is seen that LH values close to 0.25 mm, coupled with a density of 80%, or FD values close to 65%, combined with a 0.3 mm layer, produce UTS values higher than 28 MPa. Similar patterns, such as triangles and stripes, are observed for the LD × LH interaction, as well as the LD × FD. The rest of the interactive terms tend to form curved regions. According to Figure 9b, the highest S/M ratios, over 7.5, for the FD × LH interaction are observed in the small triangular area formed by the following combinations: 20% infill and 0.3 mm layer thickness, 20% infill and approximately 0.28 mm LH, and close to 26% FD and 0.3 mm LH.
The performance of the models was further evaluated with the Mean Absolute Percentage Error (MAPE). Table 6 presents the estimated error values between the experimental and the predicted response values, as well as the MAPE values. The calculated MAPEs were 1.70% and 1.36% for the UTS and the S/M ratio, respectively. Since the error data fluctuate within a reasonable range and extreme values do not exist, it can be safely assumed that each model is able to yield results of acceptable accuracy with respect to the applied range of the input data.

3.3. Structural Parameter Optimization

The combinations that maximize the UTS and S/M ratio individually were identified and discussed at the beginning of Section 3. It was revealed that the 0.3 mm layer, 0° line direction and honeycomb pattern contribute towards the maximization of both the UTS and S/M ratio. The only difference lies in the infill, with 80% density leading to the maximization of the UTS and 20% density to the S/M ratio.
To identify the combination that maximizes the UTS and S/M ratio simultaneously, the desirability function was utilized in the developed mathematical formulas. This function is widely implemented in studies [35,36,37,38] based on the Design of Experiments (DOE), such as factorial, Taguchi and RSM. The optimization approach using the desirability function generates operating conditions x that are used for the response calculation based on a graded desirability. The calculated values tend to reach either the maximum or minimum value of a response or a specified target. Therefore, the possible values of a response Yi(x) are expressed by a desirability function di(Yi) by assigning a number between 0 and 1. The case that di(Yi) = 0 denotes that the response generated a completely undesirable value. Contrarily, if di(Yi) = 1, the response generated a value of maximized desirability. The overall desirability D, for k responses, is estimated by combining the individual disabilities, as shown in Equation (3). Finally, it is pointed out that the desirability rank is affected considerably by how close the response value is to the specified target.
D = ( d 1 ( Y 1 ) d 2 ( Y 2 ) d 3 ( Y 3 ) d k ( Y k ) ) 1 / k
The UTS is one of the most important mechanical properties that indicates the mechanical performance of the fabricated part. In addition, the S/M ratio includes the mass factor, thus, constituting a more complex structural index. Table 7 contains the constraints and the limits for the optimization process, in addition to Table 8, which presents the yielded solutions for two cases: one that favors UTS over S/M ratio (Solution 1) and another with the opposite result (Solution 2). Both optimization solutions express the simultaneous maximization of the two responses.
To verify the optimal solutions, four extra specimens, two for each solution, were fabricated and tested under the same conditions. Table 9 presents the predicted responses for the optimal solutions, as well as the output values extracted from the tests. The calculated relative error values suggest that the models can generate accurate predictions.

4. Conclusions

In the present study, the structural efficiency of FFF ABS polymer parts in terms of the UTS and S/M ratio was investigated by utilizing tensile testing. The LH, FD, LD and FP were the parameters under investigation since they affect the performance of the specimens significantly. Specifically, the FD contributes towards both the mass and strength of the fabricated specimens. Typically, more material results in increased mass and strength. Similarly, a denser pattern usually results in higher mass and strength. Moreover, the complexity of the pattern seems to have a strong influence on the S/M ratio. The LD, combined with the right type of pattern, is able to direct the induced forces away from the critical points of the cross section. Finally, the LH affects the generated area of the cross section and, thus, the area where the induced forces are applied.
Two experimental sets, each comprising thirty-one tests, were conducted according to the face-centered CCD, and two prediction models were developed, in addition to the investigation of the interaction between the experimental parameters. Finally, ANOVA was carried out to examine the validity of the models. Moreover, the optimization of the structural characteristics, with the maximization of both responses in mind, was performed. The conclusions drawn from this study are as follows:
  • The direction of the layer lines is responsible for the fracture line pattern. In addition, it affects the stress–strain curve. Specifically, the colinear to the load orientation yielded a curve similar to the ones generated from ductile materials, as opposed to the 45° and 90°, which generated curves that resemble the ones found in brittle materials.
  • The density, layer and line direction are the parameters with the strongest influence on both the UTS and S/M ratio. Although the pattern does not affect the UTS as much as the other three factors, it has a noticeable effect on the S/M ratio.
  • Both the LH and FD act increasingly on the UTS, with their upper level generating the highest values of UTS. The opposite effects were noticed for the LD.
  • Similar influence patterns were observed on the S/M ratio, with the exception of the FD. It is seen that both the 50% and 80% densities have the same influence on the ratio, whereas the 20% density is responsible for achieving higher values of S/M ratios.
  • The honeycomb pattern is the one with the strongest contribution to both responses, followed by the grid and triangles.
  • Both prediction models have performed well, demonstrating increased prediction capabilities.
  • The optimal conditions that favor the UTS are LH = 0.3 mm, FD = 76.36%, LD = 0° and FP = honeycomb. On the other hand, LH = 0.3 mm, FD = 21.81%, LD = 0° and FP = honeycomb is the ideal combination for a higher S/M ratio, rather than a higher UTS.
Future work includes the testing of FFF composite materials under a wider range of parameters, as well as the modelling of the process with the finite element method, since the interest of the industrial sector for composite parts fabricated with this technique continuously increases. In particular, the utilization of hybrid methodologies, including finite element and machine learning, can be considered a top priority.

Author Contributions

Conceptualization, A.T. and P.K.; methodology, A.T.; software, A.T.; validation, A.T., C.G.-H. and P.K.; formal analysis, A.T.; investigation, A.T.; resources, P.K.; data curation, A.T.; writing—original draft preparation, A.T., A.M., N.E., C.G.-H. and P.K.; writing—review and editing, A.T., A.M., N.E., C.G.-H. and P.K.; visualization, A.T., A.M. and N.E.; supervision, C.G.-H. and P.K.; project administration, C.G.-H. and P.K.; funding acquisition, A.T. and P.K. All authors have read and agreed to the published version of the manuscript.

Funding

This research received no external funding.

Institutional Review Board Statement

Not applicable.

Informed Consent Statement

Not applicable.

Data Availability Statement

The data presented in this study are available in the article.

Conflicts of Interest

The authors declare no conflicts of interest.

References

  1. Nachal, N.; Moses, J.A.; Karthik, P.; Anandharamakrishnan, C. Applications of 3D Printing in Food Processing. Food Eng. Rev. 2019, 11, 123–141. [Google Scholar] [CrossRef]
  2. Li, J.; Pumera, M. 3D Printing of Functional Microrobots. Chem. Soc. Rev. 2021, 50, 2794–2838. [Google Scholar] [CrossRef] [PubMed]
  3. Jeong, J.; Park, H.; Lee, Y.; Kang, J.; Chun, J. Developing Parametric Design Fashion Products Using 3D Printing Technology. Fash. Text. 2021, 8, 1–25. [Google Scholar] [CrossRef]
  4. Arefin, A.M.E.; Khatri, N.R.; Kulkarni, N.; Egan, P.F. Polymer 3D Printing Review: Materials, Process, and Design Strategies for Medical Applications. Polymers 2021, 13, 1499. [Google Scholar] [CrossRef] [PubMed]
  5. Kantaros, A.; Piromalis, D. Fabricating Lattice Structures via 3D Printing: The Case of Porous Bio-Engineered Scaffolds. Appl. Mech. 2021, 2, 289–302. [Google Scholar] [CrossRef]
  6. Jandyal, A.; Chaturvedi, I.; Wazir, I.; Raina, A.; Ul Haq, M.I. 3D Printing—A Review of Processes, Materials and Applications in Industry 4.0. Sustain. Oper. Comput. 2022, 3, 33–42. [Google Scholar] [CrossRef]
  7. Wickramasinghe, S.; Do, T.; Tran, P. FDM-Based 3D Printing of Polymer and Associated Composite: A Review on Mechanical Properties, Defects and Treatments. Polymers 2020, 12, 1529. [Google Scholar] [CrossRef]
  8. Marșavina, L.; Vălean, C.; Mărghitaș, M.; Linul, E.; Razavi, N.; Berto, F.; Brighenti, R. Effect of the Manufacturing Parameters on the Tensile and Fracture Properties of FDM 3D-Printed PLA Specimens. Eng. Fract. Mech. 2022, 274, 108766. [Google Scholar] [CrossRef]
  9. Sanford, L.T.; Jaafar, I.H.; Seibi, A.; Gohn, A. The Effect of Infill Angle, Build Orientation, and Void Fraction on the Tensile Strength and Fracture of 3D Printed ASA via Fused Filament Fabrication. Manuf. Lett. 2022, 33, 569–573. [Google Scholar] [CrossRef]
  10. Rismalia, M.; Hidajat, S.C.; Permana, I.G.R.; Hadisujoto, B.; Muslimin, M.; Triawan, F. Infill Pattern and Density Effects on the Tensile Properties of 3D Printed PLA Material. J. Phys. Conf. Ser. 2019, 1402, 2–8. [Google Scholar] [CrossRef]
  11. Torrado Perez, A.R.; Roberson, D.A.; Wicker, R.B. Fracture Surface Analysis of 3D-Printed Tensile Specimens of Novel ABS-Based Materials. J. Fail. Anal. Prev. 2014, 14, 343–353. [Google Scholar] [CrossRef]
  12. Tzotzis, A.; García-Hernández, C.; Huertas-Talón, J.-L.; Kyratsis, P. 3D FE Modelling of Machining Forces during AISI 4140 Hard Turning. Stroj. Vestn./J. Mech. Eng. 2020, 66, 467–478. [Google Scholar] [CrossRef]
  13. Tzotzis, A.; García-Hernández, C.; Huertas-Talón, J.-L.; Kyratsis, P. Influence of the Nose Radius on the Machining Forces Induced during AISI-4140 Hard Turning: A CAD-Based and 3D FEM Approach. Micromachines 2020, 11, 798. [Google Scholar] [CrossRef] [PubMed]
  14. Atakok, G.; Kam, M.; Koc, H.B. Tensile, Three-Point Bending and Impact Strength of 3D Printed Parts Using PLA and Recycled PLA Filaments: A Statistical Investigation. J. Mater. Res. Technol. 2022, 18, 1542–1554. [Google Scholar] [CrossRef]
  15. Abid, S.; Messadi, R.; Hassine, T.; Ben Daly, H.; Soulestin, J.; Lacrampe, M.F. Optimization of Mechanical Properties of Printed Acrylonitrile Butadiene Styrene Using RSM Design. Int. J. Adv. Manuf. Technol. 2019, 100, 1363–1372. [Google Scholar] [CrossRef]
  16. Samykano, M.; Selvamani, S.K.; Kadirgama, K.; Ngui, W.K.; Kanagaraj, G.; Sudhakar, K. Mechanical Property of FDM Printed ABS: Influence of Printing Parameters. Int. J. Adv. Manuf. Technol. 2019, 102, 2779–2796. [Google Scholar] [CrossRef]
  17. Kafshgar, A.R.; Rostami, S.; Aliha, M.R.M.; Berto, F. Optimization of Properties for 3D Printed PLA Material Using Taguchi, ANOVA and Multi-Objective Methodologies. Procedia Struct. Integr. 2021, 34, 71–77. [Google Scholar] [CrossRef]
  18. Kumar, K.R.; Soms, N.; Kumar, M. Investigation of Fused Deposition Modeling Parameters on Mechanical Properties and Characterization of ABS/Carbon Fiber Composites. Proc. Inst. Mech. Eng. Part E J. Process Mech. Eng. 2023. [Google Scholar] [CrossRef]
  19. Moradi, M.; Hashemi, R.; Kasaeian, M. Experimental Investigation of Parameters in Fused Filament Fabrication 3D Printing Process of ABS plus Using Response Surface Methodology. Int. J. Adv. Manuf. Technol. 2023. [Google Scholar] [CrossRef]
  20. Azadi, M.; Dadashi, A.; Dezianian, S.; Kianifar, M.; Torkaman, S.; Chiyani, M. High-Cycle Bending Fatigue Properties of Additive-Manufactured ABS and PLA Polymers Fabricated by Fused Deposition Modeling 3D-Printing. Forces Mech. 2021, 3, 100016. [Google Scholar] [CrossRef]
  21. Dou, H.; Cheng, Y.; Ye, W.; Zhang, D.; Li, J.; Miao, Z.; Rudykh, S. Effect of Process Parameters on Tensile Mechanical Properties of 3D Printing Continuous Carbon Fiber-Reinforced PLA Composites. Materials 2020, 13, 3850. [Google Scholar] [CrossRef] [PubMed]
  22. Yavas, D.; Zhang, Z.; Liu, Q.; Wu, D. Fracture Behavior of 3D Printed Carbon Fiber-Reinforced Polymer Composites. Compos. Sci. Technol. 2021, 208, 108741. [Google Scholar] [CrossRef]
  23. Riccio, C.; Civera, M.; Grimaldo Ruiz, O.; Pedullà, P.; Rodriguez Reinoso, M.; Tommasi, G.; Vollaro, M.; Burgio, V.; Surace, C. Effects of Curing on Photosensitive Resins in SLA Additive Manufacturing. Appl. Mech. 2021, 2, 942–955. [Google Scholar] [CrossRef]
  24. Menegozzo, M.; Cecchini, A.; Just-Agosto, F.A.; Serrano Acevedo, D.; Flores Velez, O.J.; Acevedo-Figueroa, I.; De Jesús Ruiz, J. A 3D-Printed Honeycomb Cell Geometry Design with Enhanced Energy Absorption under Axial and Lateral Quasi-Static Compression Loads. Appl. Mech. 2022, 3, 296–312. [Google Scholar] [CrossRef]
  25. Papas, N.; Tsongas, K.; Karolidis, D.; Tzetzis, D. The Integration of 3D Technologies and Finite Element Analysis (FEA) for the Restoration of an Ancient Terra Sigillata Plate. Digit. Appl. Archaeol. Cult. Herit. 2023, 28, e00260. [Google Scholar] [CrossRef]
  26. Efstathiadis, A.; Symeonidou, I.; Tsongas, K.; Tzimtzimis, E.K.; Tzetzis, D. Parametric Design and Mechanical Characterization of 3D-Printed PLA Composite Biomimetic Voronoi Lattices Inspired by the Stereom of Sea Urchins. J. Compos. Sci. 2023, 7, 3. [Google Scholar] [CrossRef]
  27. Mazaheri, A.S.; Abedini, V.; Kami, A. Effects of Raster Angle and Composition of Layers on Tensile and Flexural Properties of PLA-PLA/Al Multimaterial Manufactured by Fused Deposition Modeling. Proc. Inst. Mech. Eng. Part E J. Process Mech. Eng. 2023. [Google Scholar] [CrossRef]
  28. Dhinesh, S.K.; Arun, P.S.; Senthil, K.K.L.; Megalingam, A. Study on Flexural and Tensile Behavior of PLA, ABS and PLA-ABS Materials. Mater. Today Proc. 2021, 45, 1175–1180. [Google Scholar] [CrossRef]
  29. Polli, H.; Pontes, L.; Araujo, A.; Barros, J.; Fernandes, V. Degradation Behavior and Kinetic Study of ABS Polymer. J. Therm. Anal. Calorim. 2009, 95, 131–134. [Google Scholar] [CrossRef]
  30. ASTM D638-22; Standard Test Method for Tensile Properties of Plastics. American Society for Testing and Materials: West Conshohocken, PA, USA, 2022. Available online: https://www.astm.org/d0638-22.html (accessed on 31 August 2023).
  31. Tzotzis, A.; Tapoglou, N.; Verma, R.K.; Kyratsis, P. 3D-FEM Approach of AISI-52100 Hard Turning: Modelling of Cutting Forces and Cutting Condition Optimization. Machines 2022, 10, 74. [Google Scholar] [CrossRef]
  32. Fontana, L.; Minetola, P.; Iuliano, L.; Rifuggiato, S.; Khandpur, M.S.; Stiuso, V. An Investigation of the Influence of 3d Printing Parameters on the Tensile Strength of PLA Material. Mater. Today Proc. 2022, 57, 657–663. [Google Scholar] [CrossRef]
  33. Alafaghani, A.; Ablat, M.A.; Abedi, H.; Qattawi, A. Modeling the Influence of Fused Filament Fabrication Processing Parameters on the Mechanical Properties of ABS Parts. J. Manuf. Process. 2021, 71, 711–723. [Google Scholar] [CrossRef]
  34. Tanveer, Q.; Mishra, G.; Mishra, S.; Sharma, R. Effect of Infill Pattern and Infill Density on Mechanical Behaviour of FDM 3D Printed Parts—A Current Review. Mater. Today Proc. 2022, 62, 100–108. [Google Scholar] [CrossRef]
  35. Tafaoli-Masoule, M.; Shakeri, M.; Zahedi, S.A.; Vaezi, M. Experimental Investigation of Process Parameters in Polyether Ether Ketone 3D Printing. Proc. Inst. Mech. Eng. Part E J. Process Mech. Eng. 2022. [Google Scholar] [CrossRef]
  36. Radhwan, H.; Shayfull, Z.; Abdellah, A.E.-H.; Irfan, A.R.; Kamarudin, K. Optimization Parameter Effects on the Strength of 3D-Printing Process Using Taguchi Method. AIP Conf. Proc. 2019, 2129, 20154. [Google Scholar] [CrossRef]
  37. Ali, S.; Abdallah, S.; Devjani, D.H.; John, J.S.; Samad, W.A.; Pervaiz, S. Effect of Build Parameters and Strain Rate on Mechanical Properties of 3D Printed PLA Using DIC and Desirability Function Analysis. Rapid Prototyp. J. 2023, 29, 92–111. [Google Scholar] [CrossRef]
  38. Ouhsti, M.; El Haddadi, B.; Belhouideg, S. Effect of Printing Parameters on the Mechanical Properties of Parts Fabricated with Open-Source 3D Printers in PLA by Fused Deposition Modeling. Mech. Mech. Eng. 2018, 22, 895–907. [Google Scholar] [CrossRef]
Figure 1. The experimental workflow.
Applmech 05 00002 g001
Figure 2. Dimensions of the tensile test specimens according to the ASTM-D638 standard.
Applmech 05 00002 g002
Figure 3. The structural characteristics used in the study: (a) layer height; (b) infill density; (c) layer line direction; (d) infill pattern.
Applmech 05 00002 g003
Figure 4. Enhanced view of the fracture points of sample specimens: (a) No 26, (b) No 29 and (c) No 17.
Applmech 05 00002 g004
Figure 5. Sample stress–strain curves: (a) 0°; (b) 45°; (c) 90° specimens.
Applmech 05 00002 g005
Figure 6. The Pareto chart of the contribution effects on (a) the UTS; (b) the S/M ratio.
Applmech 05 00002 g006
Figure 7. The normal probability plot for (a) the UTS; (b) the S/M ratio.
Applmech 05 00002 g007
Figure 8. The main effects plot of: (a) the UTS; (b) the S/M ratio.
Applmech 05 00002 g008
Figure 9. The contour plot with respect to the structural characteristics of (a) the UTS and (b) the S/M ratio.
Applmech 05 00002 g009
Table 1. Operation parameters for the ABS filament printing.
Operation ParameterValue
Nozzle temperature240 °C
Build plate temperature115 °C
Filament diameter1.75 mm
Nozzle diameter0.4 mm
Feed rate60 mm/s
Filament flow100%
Build orientationHorizontal
Top/bottom layer patternLines
Build plate adhesion typeBrim
Adhesion width2 mm
Table 2. Specimen fabrication parameters and the corresponding levels.
LevelLayer Height (mm)Infill Density (%)Top/Bottom Layer Line Directions (°)Infill PatternResponse
+10.38090HoneycombUTS (MPa)
00.25045TrianglesS/M ratio
−10.1200Grid(MPa/g)
Table 3. Design of experiments coded data and tensile testing results.
TestLHFDLDFPMass (g)UTS (MPa)S/M Ratio (MPa/g)
1−10004.02521.855.43
2000−13.96725.766.49
301004.59828.626.22
41−1113.48626.347.56
500−103.95428.417.19
6−1−1−113.50123.696.77
700003.96424.896.28
800003.96624.846.26
900003.96025.216.37
1010003.93427.897.09
11−111−14.59924.155.25
120−1003.36123.356.95
1300103.95622.265.63
14−11−114.48630.186.73
15−1−1−1−13.45222.356.47
1600003.96025.796.51
17−11114.52824.455.40
18−1−1113.50018.845.38
19−11−1−14.54729.626.51
2011−1−14.48031.226.97
2111−114.34932.137.39
2200013.96126.336.65
23−1−11−13.42318.325.35
241−1−113.41029.218.57
2500003.97224.356.13
261−1−1−13.37027.958.29
27111−14.54427.566.07
281−11−13.41123.877.00
2900003.98124.836.24
3000003.93824.866.31
3111114.35528.456.53
Table 4. Analysis of variance results for the UTS.
SourceDegree of
Freedom
Sum of SquaresMean Squaref-Valuep-ValueContribution %
Model7309.95044.279121.720.000
Error238.3670.364
Total30318.317
R-sq = 97.37%  R-sq (adj) = 96.57%  R-sq (pred) = 95.35%
Term
LH194.16594.165258.860.00030.38
FD1100.158100.158275.340.00032.31
LD191.21591.215250.750.00029.43
FP14.3224.32211.880.0021.39
FP217.0897.08919.490.0002.29
LH × FD110.90710.90729.980.0003.52
LH × LD12.0952.0955.760.0250.68
Lack of fit177.1977.1972.170.172
Pure error60.1950.195
Table 5. Analysis of variance results for the S/M ratio.
SourceDegree of
Freedom
Sum of SquaresMean Squaref-Valuep-ValueContribution %
Model918.51532.05725115.880.000
Error210.37280.01775
Total3018.8881
R-sq = 98.03%  R-sq (adj) = 97.18%  R-sq (pred) = 96.04%
Term
LH18.21538.2153462.730.00045.61
FD11.54021.540286.750.0008.55
LD16.38446.3844359.610.00035.44
FP10.36290.362920.440.0002.01
FD210.09930.09935.590.0280.55
FP210.08200.08204.620.0430.46
LH × FD11.19671.196767.400.0006.64
LH × LD10.06660.06663.750.0660.37
LH × FP10.06660.06663.750.0660.37
Lack of fit150.28860.28861.370.367
Pure error60.08430.0843
Table 6. Error data between the experimental and the predicted responses.
TestAbsolute Percentage Error (%)
UTSS/M Ratio
14.503.96
20.452.43
33.980.33
43.340.16
53.623.79
60.320.52
71.100.77
81.291.02
90.180.61
101.591.23
110.920.63
122.392.32
132.861.84
140.140.51
151.911.55
162.482.92
171.850.49
181.620.53
191.590.37
200.431.62
210.631.45
221.110.36
234.331.81
240.190.74
253.243.12
261.190.94
270.060.72
282.602.19
291.331.43
301.210.23
310.371.52
MAPE (%)1.701.36
Table 7. Constraints of optimization process.
FactorGoalLower LimitUpper Limit
LH (mm)In range0.10.3
FD (%)In range2080
LD (°)In range090
FPIn range−1+1
UTS (MPa)Maximize18.3232.13
S/M ratio (MPa/g)Maximize5.258.57
Table 8. Optimization solutions according to the desirability function.
Solution
Parameter12
LH0.30.3
FD76.36%21.81%
LD00
FP11
UTS fit32.0929.30
S/M fit7.538.58
Desirability0.9813960.988872
Table 9. Verification tests of optimal solutions.
SpecimenUTSexp (MPa)Mean UTSexpUTSpredError (%)S/Mexp (MPa/g)Mean S/MexpS/MpredError (%)
Optimal 1.131.5431.2232.09−2.717.036.977.53−7.44
Optimal 1.230.896.90
Optimal 2.129.1529.3629.300.218.558.578.58−0.12
Optimal 2.229.578.59
Disclaimer/Publisher’s Note: The statements, opinions and data contained in all publications are solely those of the individual author(s) and contributor(s) and not of MDPI and/or the editor(s). MDPI and/or the editor(s) disclaim responsibility for any injury to people or property resulting from any ideas, methods, instructions or products referred to in the content.

