
Biochemical Profiles of In Vivo Oral Mucosa by Using a Portable Raman Spectroscopy System

 ,
,
Abstract
:1. Introduction
2. Materials and Methods
2.1. Clinical Protocol and Research Ethics
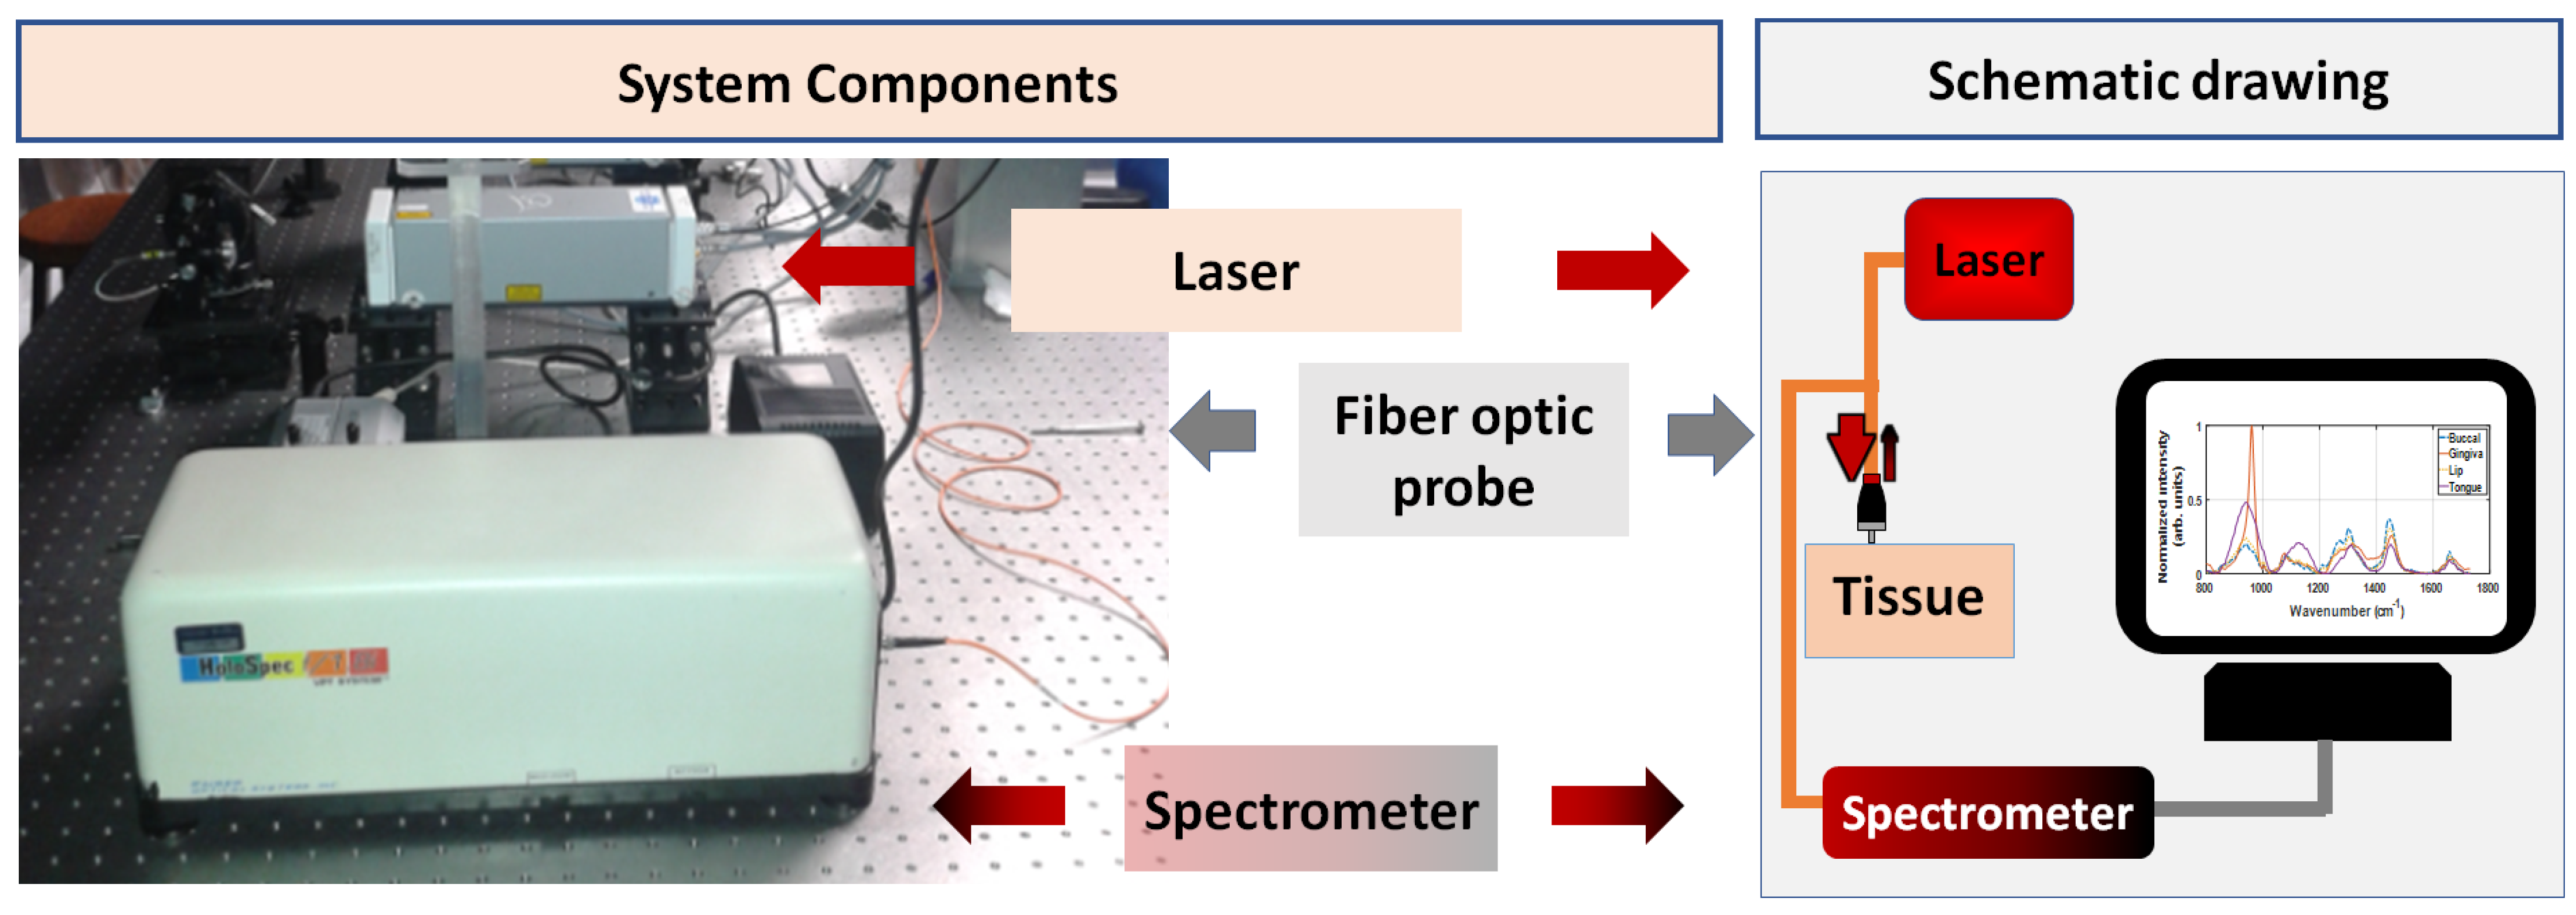
2.2. Raman Spectroscopy Equipment and Data Collection
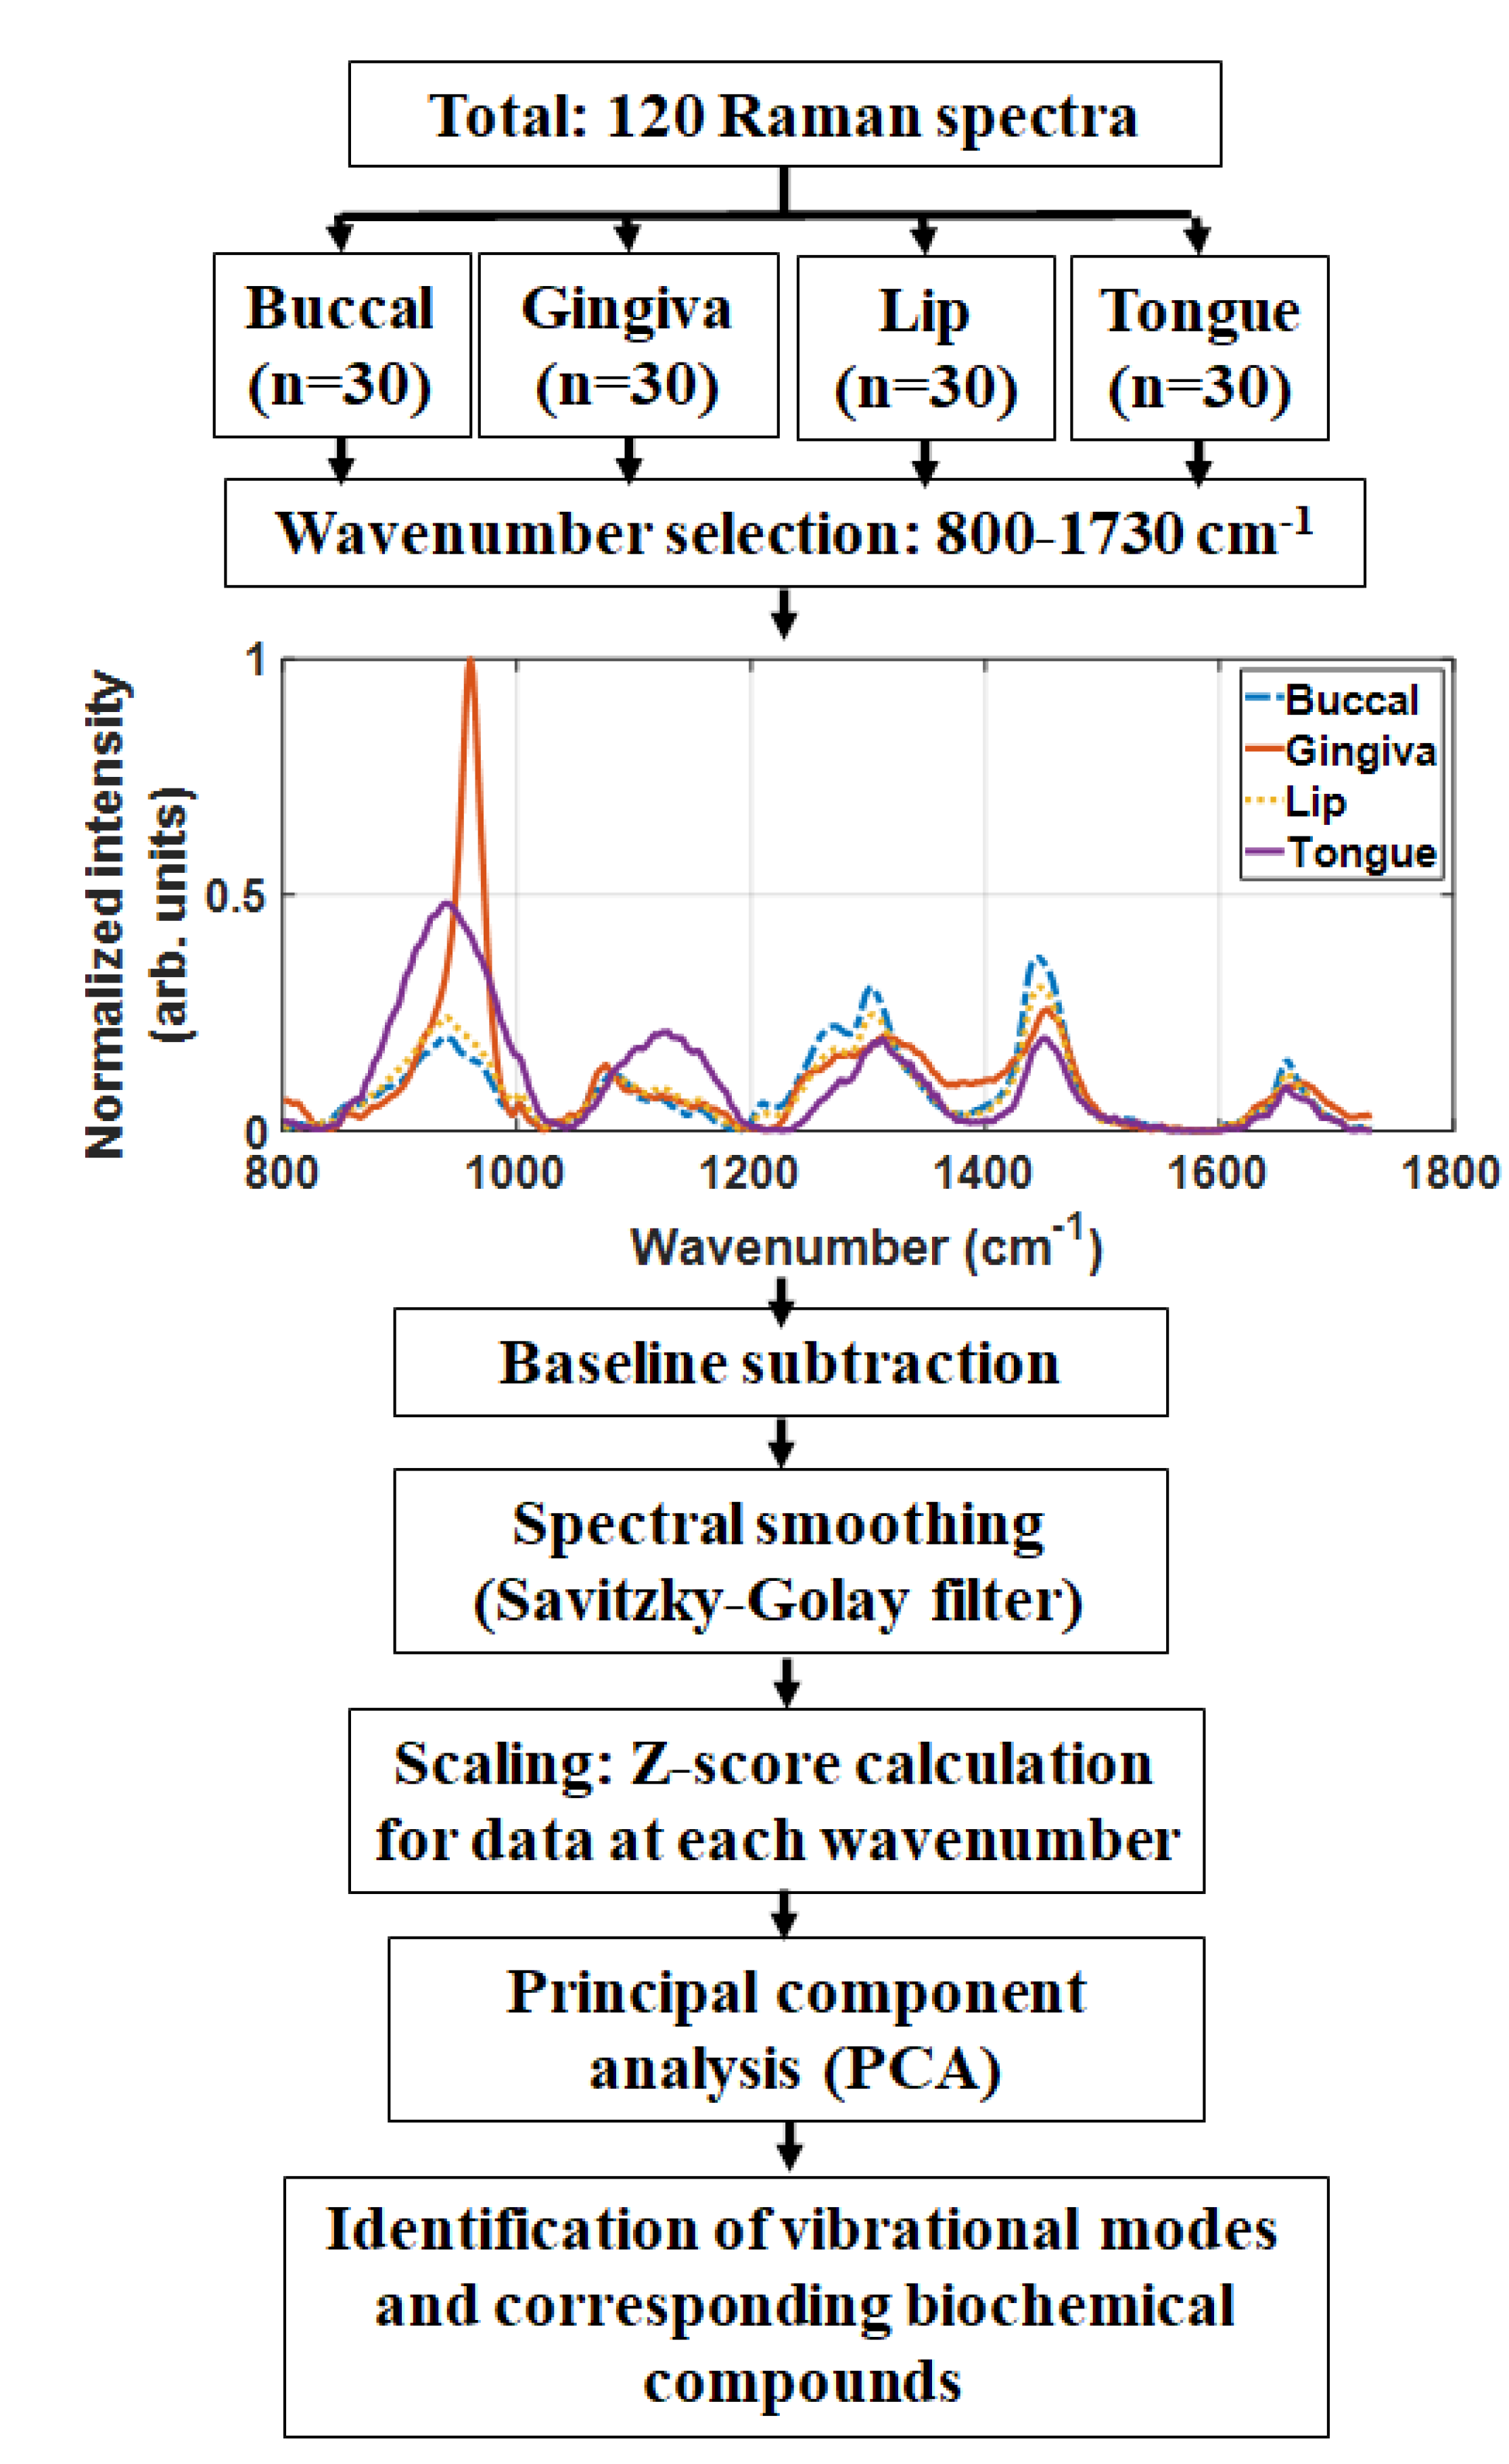
2.3. Data Analysis
3. Results
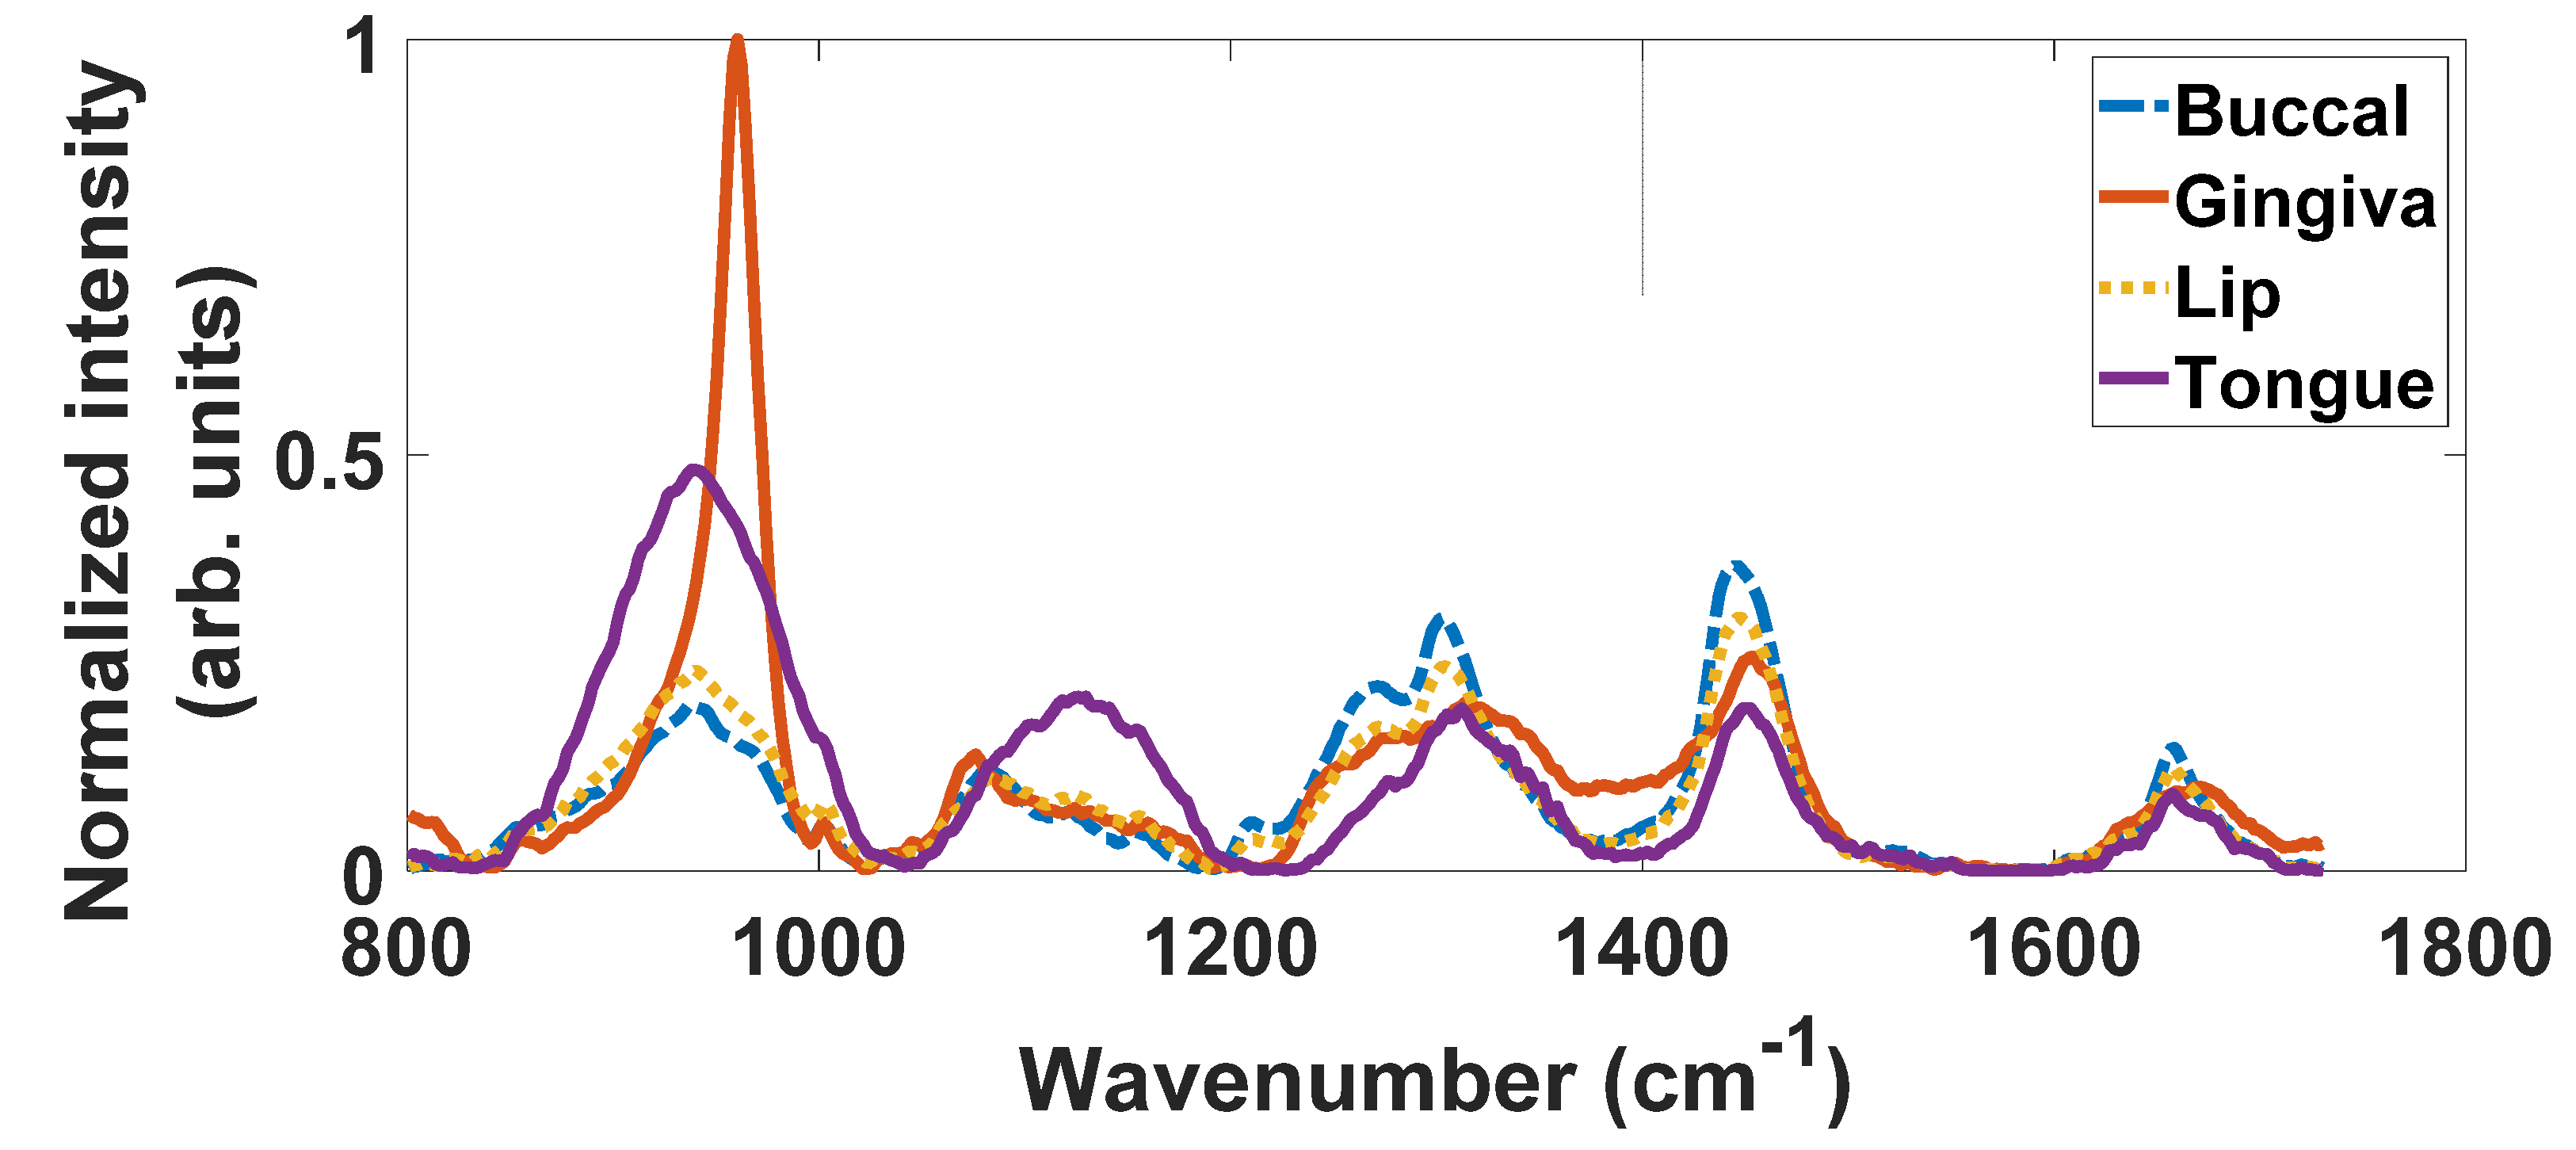
3.1. Biological Variability and Tissue Heterogeneity
3.2. Raman Vibrational Modes Leading to Differentiation of Healthy Oral Subsites
4. Discussion
5. Conclusions
Author Contributions
Funding
Institutional Review Board Statement
Informed Consent Statement
Data Availability Statement
Acknowledgments
Conflicts of Interest
References
- Carvalho, L.F.C.S.; Dos Santos, L.; Bonnier, F.; O’Callaghan, K.; O’Sullivan, J.; Flint, S.; Neto, L.P.M.; Martin, A.A.; Lyng, F.M.; Byrne, H.J. Can ethanol affect the cell structure? A dynamic molecular and Raman spectroscopy study. Photodiagn. Photodyn. Ther. 2020, 30, 101675. [Google Scholar] [CrossRef]
- Mousavi, M.; Moriyama, L.T.T.; Grecco, C.; Nogueira, M.S.; Svanberg, K.; Kurachi, C.; Andersson-Engels, S. Photodynamic therapy dosimetry using multiexcitation multiemission wavelength: Toward real-time prediction of treatment outcome. J. Biomed. Opt. 2020, 25, 063812. [Google Scholar] [CrossRef] [Green Version]
- Carvalho, L.F.C.S.; Nogueira, M.S.; Neto, L.P.M.; Bhattacharjee, T.T.; Martin, A.A. Raman spectral post-processing for oral tissue discrimination—A step for an automatized diagnostic system. Biomed. Opt. Express 2017, 8, 5218–5227, Erratum in 2018, 9, 649. [Google Scholar] [CrossRef] [PubMed]
- Pires, L.; Nogueira, M.S.; Pratavieira, S.; Moriyama, L.T.; Kurachi, C. Time-resolved fluorescence lifetime for cutaneous melanoma detection. Biomed. Opt. Express 2014, 5, 3080–3089. [Google Scholar] [CrossRef] [PubMed] [Green Version]
- Nogueira, M.S.; Cosci, A.; Pratavieira, S.; Takahama, A., Jr.; Azevedo, R.S.; Kurachi, C. Evaluation of Actinic Cheilitis Using Fluorescence Lifetime Spectroscopy. In Proceedings of the SPIE 9703 Optical Biopsy XIV: Toward Real-Time Spectroscopic Imaging and Diagnosis, San Francisco, CA, USA, 15–17 February 2016; Volume 9703. [Google Scholar]
- Cosci, A.; Nogueira, M.S.; Prataviera, S.; Takahama, A.; de Souza Azevedo, R.; Kurachi, C. Time-resolved fluorescence spectroscopy for clinical diagnosis of actinic cheilitis. Biomed. Opt. Express 2016, 7, 4210–4219, Erratum in 2018, 9, 648. [Google Scholar] [CrossRef] [PubMed] [Green Version]
- Ono, B.A.; Nogueira, M.; Pires, L.; Pratavieira, S.; Kurachi, C. Subcellular localization and photodynamic activity of Photodithazine (glucosamine salt of chlorin e6) in murine melanoma B16-F10: An in vitro and in vivo study. Proc. SPIE 2018, 10476, 1047616. [Google Scholar] [CrossRef]
- Kurachi, C.; Pires, L.; Nogueira, M.S.; Pratavieira, S. Lifetime fluorescence for the detection of skin lesions. Biomed. Opt. 2014, 4, 3. [Google Scholar] [CrossRef]
- de Andrade, C.T.; Nogueira, M.S.; Kanick, S.C.; Marra, K.; Gunn, J.; Andreozzi, J.; Samkoe, K.S.; Kurachi, C.; Pogue, B.W. Optical Spectroscopy of Radiotherapy and Photodynamic Therapy Responses in Normal Rat Skin Shows Vascular Breakdown Products. In Proceedings of the SPIE 9694 Optical Methods for Tumor Treatment and Detection: Mechanisms and Techniques in Photodynamic Therapy XXV, San Francisco, CA, USA, 13–14 February 2016; Volume 9694. [Google Scholar]
- Medeiros-Neto, L.P.; Soto, C.A.T.; Chagas, M.J.; Carvalho, L.F.C.; Rajasekaran, R.; Martin, A.A. In vivo Raman spectroscopic characterization of papillary thyroid carcinoma. Vib. Spectrosc. 2019, 101, 1–9. [Google Scholar] [CrossRef]
- Carvalho, L.F.C.S.; Bonnier, F.; O’Callaghan, K.; O’Sullivan, J.; Flint, S.; Byrne, H.J.; Lyng, F.M. Raman micro-spectroscopy for rapid screening of oral squamous cell carcinoma. Exp. Mol. Pathol. 2015, 98, 502–509. [Google Scholar] [CrossRef] [Green Version]
- Leal, L.B.; Nogueira, M.S.; Mageski, J.G.A.; Martini, T.P.; Barauna, V.G.; Dos Santos, L.; Carvalho, L.F.C.S. Diagnosis of Systemic Diseases Using Infrared Spectroscopy: Detection of Iron Overload in Plasma—Preliminary Study. Biol. Trace Elem. Res. 2021, 1–15. [Google Scholar] [CrossRef]
- Leal, L.B.; Nogueira, M.S.; Canevari, R.A.; Carvalho, L. Vibration spectroscopy and body biofluids: Literature review for clinical applications. Photodiagn. Photodyn. Ther. 2018, 24, 237–244. [Google Scholar] [CrossRef] [PubMed]
- Carvalho, L.F.d.C.e.S.d.; Saito Nogueira, M. Optical techniques for fast screening--towards prevention of the coronavirus COVID-19 outbreak. Photodiagn. Photodyn. Ther. 2020, 30, 101765. [Google Scholar] [CrossRef] [PubMed]
- Carnevalli, A.C.; Leal, L.; Scherma, A.; Morais, C.; Martin, F.; Bonnier, F.; Baker, M.; Byrne, H.J.; Nogueira, M.S. Identification of Diabetic Patients Via Urine Analysis by FTIR: Preliminary Study (Conference Presentation). In Proceedings of the Photonic Diagnosis and Treatment of Infections and Inflammatory Diseases II, San Francisco, CA, USA, 4–5 February 2019; Volume 10863. [Google Scholar]
- Nogueira, M.S. Optical theranostics and treatment dosimetry for COVID-19 lung complications: Towards increasing the survival rate of vulnerable populations. Photodiagn. Photodyn. Ther. 2020, 31, 101892. [Google Scholar] [CrossRef] [PubMed]
- Nogueira, M.S. Ultraviolet-based biophotonic technologies for control and prevention of COVID-19, SARS and related disorders. Photodiagn. Photodyn. Ther. 2020, 31, 101890. [Google Scholar] [CrossRef] [PubMed]
- Nogueira, M.S. Biophotonic telemedicine for disease diagnosis and monitoring during pandemics: Overcoming COVID-19 and shaping the future of healthcare. Photodiagn. Photodyn. Ther. 2020, 31, 101836. [Google Scholar] [CrossRef] [PubMed]
- Nogueira, M.S.; Maryam, S.; Amissah, M.; Lu, H.; Lynch, N.; Killeen, S.; O’Riordain, M.; Andersson-Engels, S. Evaluation of wavelength ranges and tissue depth probed by diffuse reflectance spectroscopy for colorectal cancer detection. Sci. Rep. 2021, 11, 1–17. [Google Scholar]
- Nogueira, M.S.; Cosci, A.; Rosa, R.G.T.; Salvio, A.G.; Pratavieira, S.; Kurachi, C. Portable fluorescence lifetime spectroscopy system for in-situ interrogation of biological tissues. J. Biomed. Opt. 2017, 22, 121608. [Google Scholar]
- Nogueira, M.S.; Lacerenza, M.; Sekar, S.K.V.; Buttafava, M.; Pifferi, A.; Tosi, A.; Contini, D.; Andersson-Engels, S. Broadband Extraction of Tissue Optical Properties Using a Portable Hybrid Time-Resolved Continuous Wave Instrumentation: Characterization of Ex Vivo Organs. In Proceedings of the Clinical and Translational Biophotonics, Washington, DC, USA, 20–23 April 2020. [Google Scholar]
- Lacerenza, M.; Pacheco, A.; Sekar, S.K.V.; Nogueira, M.S.; Buttafava, M.; Tosi, A.; Pifferi, A.; Contini, D.; Andersson-Engels, S. Functional Monitoring of Lung Tissue Using a Hybrid Hyperspectral Time-Resolved GASMAS System: A Systematic Study on Ex Vivo Sample. In Proceedings of the Optical Tomography and Spectroscopy, Washington, DC, USA, 20–23 April 2020. [Google Scholar]
- de Paula, D.; Campos, C.; Nogueira, M.S.; Pratavieira, S.; Kurachi, C. Time-Resolved and Steady-State Fluorescence Spectroscopy for the Assessment of Skin Photoaging Process. In Proceedings of the SPIE 9531 Biophotonics South America, Rio de Janeiro, Brazil, 23–25 May 2015; Volume 9531. [Google Scholar]
- Nogueira, M.S.; Komolibus, K.; Grygoryev, K.; Gunther, J.E.; Andersson-Engels, S. Fluorescence Spectroscopy of Mouse Organs Using Ultraviolet Excitation: Towards Assessment of Organ Viability for Transplantation. In Proceedings of the SPIE 10876 Optical Interactions with Tissue and Cells XXX, San Francisco, CA, USA, 2–3 February 2019; Volume 10876. [Google Scholar]
- Nogueira, M.S.; Raju, M.; Gunther, J.; Grygoryev, K.; Komolibus, K.; Lu, H.; Andersson-Engels, S. Diffuse Reflectance Spectroscopy for Determination of Optical Properties and Chromophore Concentrations of Mice Internal Organs in the Range of 350 nm to 1860 nm. In Proceedings of the SPIE 10685 Biophotonics: Photonic Solutions for Better Health Care VI, Strasbourg, France, 23–26 April 2018; Volume 10685. [Google Scholar]
- Nogueira, M.S.; Raju, M.; Komolibus, K.; Grygoryev, K.; Andersson-Engels, S. Assessment of tissue biochemical and optical scattering changes due to hypothermic organ preservation: A preliminary study in mouse organs. J. Phys. D Appl. Phys. 2021, 54, 374003. [Google Scholar] [CrossRef]
- Nogueira, M.S.; Raju, M.; Gunther, J.; Maryam, S.; Amissah, M.; Lu, H.; Killeen, S.; O’Riordain, M.; Andersson-Engels, S. Tissue biomolecular and microstructure profiles in optical colorectal cancer delineation. J. Phys. D Appl. Phys. 2021. [Google Scholar] [CrossRef]
- Nogueira, M.S.; Cosci, A.; Kurachi, C. Assessment of Oxidative Stress and Metabolic Rates in Liver Grafts Using Time-Resolved Fluorescence Spectroscopy. In Proceedings of the SPIE 10685 Biophotonics: Photonic Solutions for Better Health Care VI, Strasbourg, France, 23–26 April 2018; Volume 10685. [Google Scholar]
- Nogueira, M.S.; Kurachi, C. Assessing the Photoaging Process at Sun Exposed and Non-Exposed Skin Using Fluorescence Lifetime Spectroscopy. In Proceedings of the SPIE 9703 Optical Biopsy XIV: Toward Real-Time Spectroscopic Imaging and Diagnosis, San Francisco, CA, USA, 15–17 February 2016; Volume 9703. [Google Scholar]
- Nogueira, M.S.; Guimarães, F.E.G. Photophysical processes on biological tissues and photodynamic therapy using steady-state and time-resolved fluorescence techniques: Diagnosis applications, dosimetry and photodegradation kinetics. Photonics 2016, 1, 530. [Google Scholar] [CrossRef]
- de Paula Campos, C.; de Paula D’Almeida, C.; Nogueira, M.S.; Moriyama, L.T.; Pratavieira, S.; Kurachi, C. Fluorescence spectroscopy in the visible range for the assessment of UVB radiation effects in hairless mice skin. Photodiagn. Photodyn. Ther. 2017, 20, 21–27. [Google Scholar] [CrossRef]
- Nogueira, M.S.; D’Almeida, C.P.; Pratavieira, S.; Kurachi, C. Characterization of a fluorescence lifetime spectroscopy system for diagnostic purposes using an optic fiber probe. Livro Resumos 2014, 9531. [Google Scholar] [CrossRef]
- Pires, L.; Nogueira, M.S.; Moriyama, L.T.; Kurachi, C. Fluorescence lifetime for melanoma murine detection. Tech. Summ. 2014, 5, 3080–3089. [Google Scholar]
- Silami, F.D.J.; Pratavieira, S.; Nogueira, M.S.; Barrett, A.A.; Sinhoreti, M.A.C.; Geraldeli, S.; Pires-de-Souza, F.C. Quantitative image of fluorescence of ceramic and resin-cement veneers. Braz. Oral Res. 2019, 33, e0088. [Google Scholar] [CrossRef]
- Nogueira, M.S.; Panhóca, V.H.; Bagnato, V.S. Fluorescence spectroscopy analysis of light-induced tooth whitening. Proc. SPIE. 2019, 10876. [Google Scholar] [CrossRef]
- Nogueira, M.; D’Almeida, C.P.; Cosci, A.; Pratavieira, S.; Kurachi, C.; Schimdt, P.A. Montagem e Caracterização de Sistema de Espectroscopia e Tempo de Vida de Fluorescência Utilizando Fibra Óptica. In Proceedings of the XXIV Congresso Brasileiro de Engenharia Biomédica—CBEB, Uberlandia, Brazil, 13–14 October 2014; pp. 2468–2471. [Google Scholar]
- Nogueira, M.S. Fluorescence Lifetime Spectroscopy for Diagnosis of Clinically Similar Skin Lesions. Master’s Thesis, Universidade de São Paulo, São Paulo, Brazil, 2016. [Google Scholar]
- Nicolodelli, G.; Tadini, A.M.; Nogueira, M.S.; Pratavieira, S.; Mounier, S.; Huaman, J.L.C.; dos Santos, C.H.; Montes, C.R.; Milori, D.M.B.P. Fluorescence lifetime evaluation of whole soils from the Amazon rainforest. Appl. Opt. 2017, 56, 6936–6941. [Google Scholar] [CrossRef]
- Nogueira, M.S.; D’Almeida, C.P.; Pratavieira, S.; Kurachi, C. Sistema de espectroscopia e tempo de vida de fluorescência para diagnóstico clinico. Anais/Resumos 2015. Available online: http://www.sbpcnet.org.br/livro/67ra/resumos/resumos/3575_2645c02c7d44072c127aeef899d0d1bdd.pdf (accessed on 7 February 2021).
- Nogueira, M.S.; Pratavieira, S.; Kurachi, C. Portable fluorescence microendoscope system for smartphones and imaging processing software. Tech. Summ. 2015, 26, 040902. [Google Scholar] [CrossRef]
- da Silva, A.P.; Saito Nogueira, M.; Jo, J.A.; Salvador Bagnato, V.; Mayumi Inada, N. Optical Based Diagnosis and Treatment of Onychomycosis. Biomed. Opt. 2016, 3, 37. [Google Scholar] [CrossRef]
- Carvalho, L.F.C.S.; Nogueira, M.S.; Bhattacharjee, T.; Neto, L.P.M.; Daun, L.; Mendes, T.O.; Rajasekaran, R.; Chagas, M.; Martin, A.A.; Soares, L.E.S. In vivo Raman spectroscopic characteristics of different sites of the oral mucosa in healthy volunteers. Clin. Oral Investig. 2019, 23, 3021–3031. [Google Scholar] [CrossRef]
- Nogueira, M.S.; Pratavieira, S.; Júnior, A.T.; Azevedo, R.S.; Kurachi, C. Diagnóstico de queilite actinica por espectroscopia de tempo de vida de fluorescência. Anais/Resumos 2015. Available online: http://www.sbpcnet.org.br/livro/67ra/resumos/resumos/3575_1645c02c7d44072c127aeef899d0d1bdd.pdf (accessed on 7 February 2021).
- Salvio, A.G.; Ramirez, D.P.; Inada, N.M.; Stringasci, M.D.; Nogueira, M.S.; Bagnato, V.S. Fractionated Illumination in a Single Visit Photodynamic Therapy for Basal Cell Carcinoma. In Proceedings of the 2017 European Congress of Radiology, Online Conference, 1–5 March 2017. [Google Scholar]
- Salvio, A.G.; Ramirez, D.P.; Nogueira, M.S.; Stringasci, M.D.; Oliveira, E.R.; Inada, N.M.; Bagnato, V.S. Evaluation of Pain and Treatment Effect During Large Area Photodynamic Therapy in 140 Patients with Widespread Actinic Keratosis of Upper Limbs. In Proceedings of the 2017 European Congress of Radiology, Online Conference, 1–5 March 2017. [Google Scholar]
- Nogueira, M.S.; Rosa, R.G.T.; Pratavieira, S.; de Paula, D.; Kurachi, C. Assembly and characterization of a fluorescence lifetime spectroscopy system for skin lesions diagnostic. In Proceedings of the SPIE 9531 Biophotonics South America, Rio de Janeiro, Brazil, 23–25 May 2015; Volume 9531. [Google Scholar]
- Marcelo, S.N.; Fabio Francisco, P.; Raphael Antonio, P.; Kleber Thiago, O.; Vanderlei Salvador, B.; Guimarães, G.; Eduardo, F. Characterization of photophysical properties of curcumin for theranostics of neurodegenerative diseases. Proc. SPIE 2019, 10876. [Google Scholar] [CrossRef]
- Nogueira, M.S.; Bagnato, V.S.; Panhoca, V.H. Characterization of teeth fluorescence properties due to coffee pigmentation: Towards optimization of quantitative light-induced fluorescence for tooth color assessment. Proc. SPIE 2020, 11238. [Google Scholar] [CrossRef]
- Nogueira, M.S.; Pinto, F.F., Jr.; Caface, R.A.; de Oliveira, K.T.; Guimarães, F.E.G. Optimization of curcumin formulations for fluorescence-based applications. Proc. SPIE 2020, 11238. [Google Scholar] [CrossRef]
- Nogueira, M.S.; Bagnato, V.S.; Panhóca, V.H. Calculation of whiteness and yellowness indexes using colorimetric and photographic methods for tooth shade evaluation. Proc. SPIE 2020, 11238. [Google Scholar] [CrossRef]
- Nogueira, M.S.; Bagnato, V.S.; Panhoca, V.H. Evaluation of the whitening effectiveness of violet illumination alone or combined with hydrogen peroxide gel. Photobiomodul. Photomed. Laser Surg. 2021, 39, 395–402. [Google Scholar] [CrossRef]
- Baker, M.J.; Byrne, H.J.; Chalmers, J.; Gardner, P.; Goodacre, R.; Henderson, A.; Kazarian, S.G.; Martin, F.L.; Moger, J.; Stone, N.; et al. Clinical applications of infrared and Raman spectroscopy: State of play and future challenges. Analyst 2018, 143, 1735–1757. [Google Scholar] [CrossRef]
- Carvalho, L.F.C.S.; Bonnier, F.; Tellez, C.; dos Santos, L.; O’Callaghan, K.; O’Sullivan, J.; Soares, L.E.S.; Flint, S.; Martin, A.A.; Lyng, F.M.; et al. Raman spectroscopic analysis of oral cells in the high wavenumber region. Exp. Mol. Pathol. 2017, 103, 255–262. [Google Scholar] [CrossRef] [Green Version]
- Carvalho, L.F.C.S.; Nogueira, M.S. New insights of Raman spectroscopy for oral clinical applications. Analyst 2018, 143, 6037–6048. [Google Scholar] [CrossRef]
- Bergholt, M.S.; Lin, K.; Wang, J.; Zheng, W.; Xu, H.; Huang, Q.; Ren, J.; Ho, K.Y.; Teh, M.; Srivastava, S.; et al. Simultaneous fingerprint and high-wavenumber fiber-optic Raman spectroscopy enhances real-time in vivo diagnosis of adenomatous polyps during colonoscopy. J. Biophotonics 2016, 9, 333–342. [Google Scholar] [CrossRef]
- Slaughter, D.P.; Southwick, H.W.; Smejkal, W. “Field cancerization” in oral stratified squamous epithelium. Clinical implications of multicentric origin. Cancer 1953, 6, 963–968. [Google Scholar] [CrossRef]
- Chai, H.; Brown, R.E. Field effect in cancer—An update. Ann. Clin. Lab. Sci. 2009, 39, 331–337. [Google Scholar]
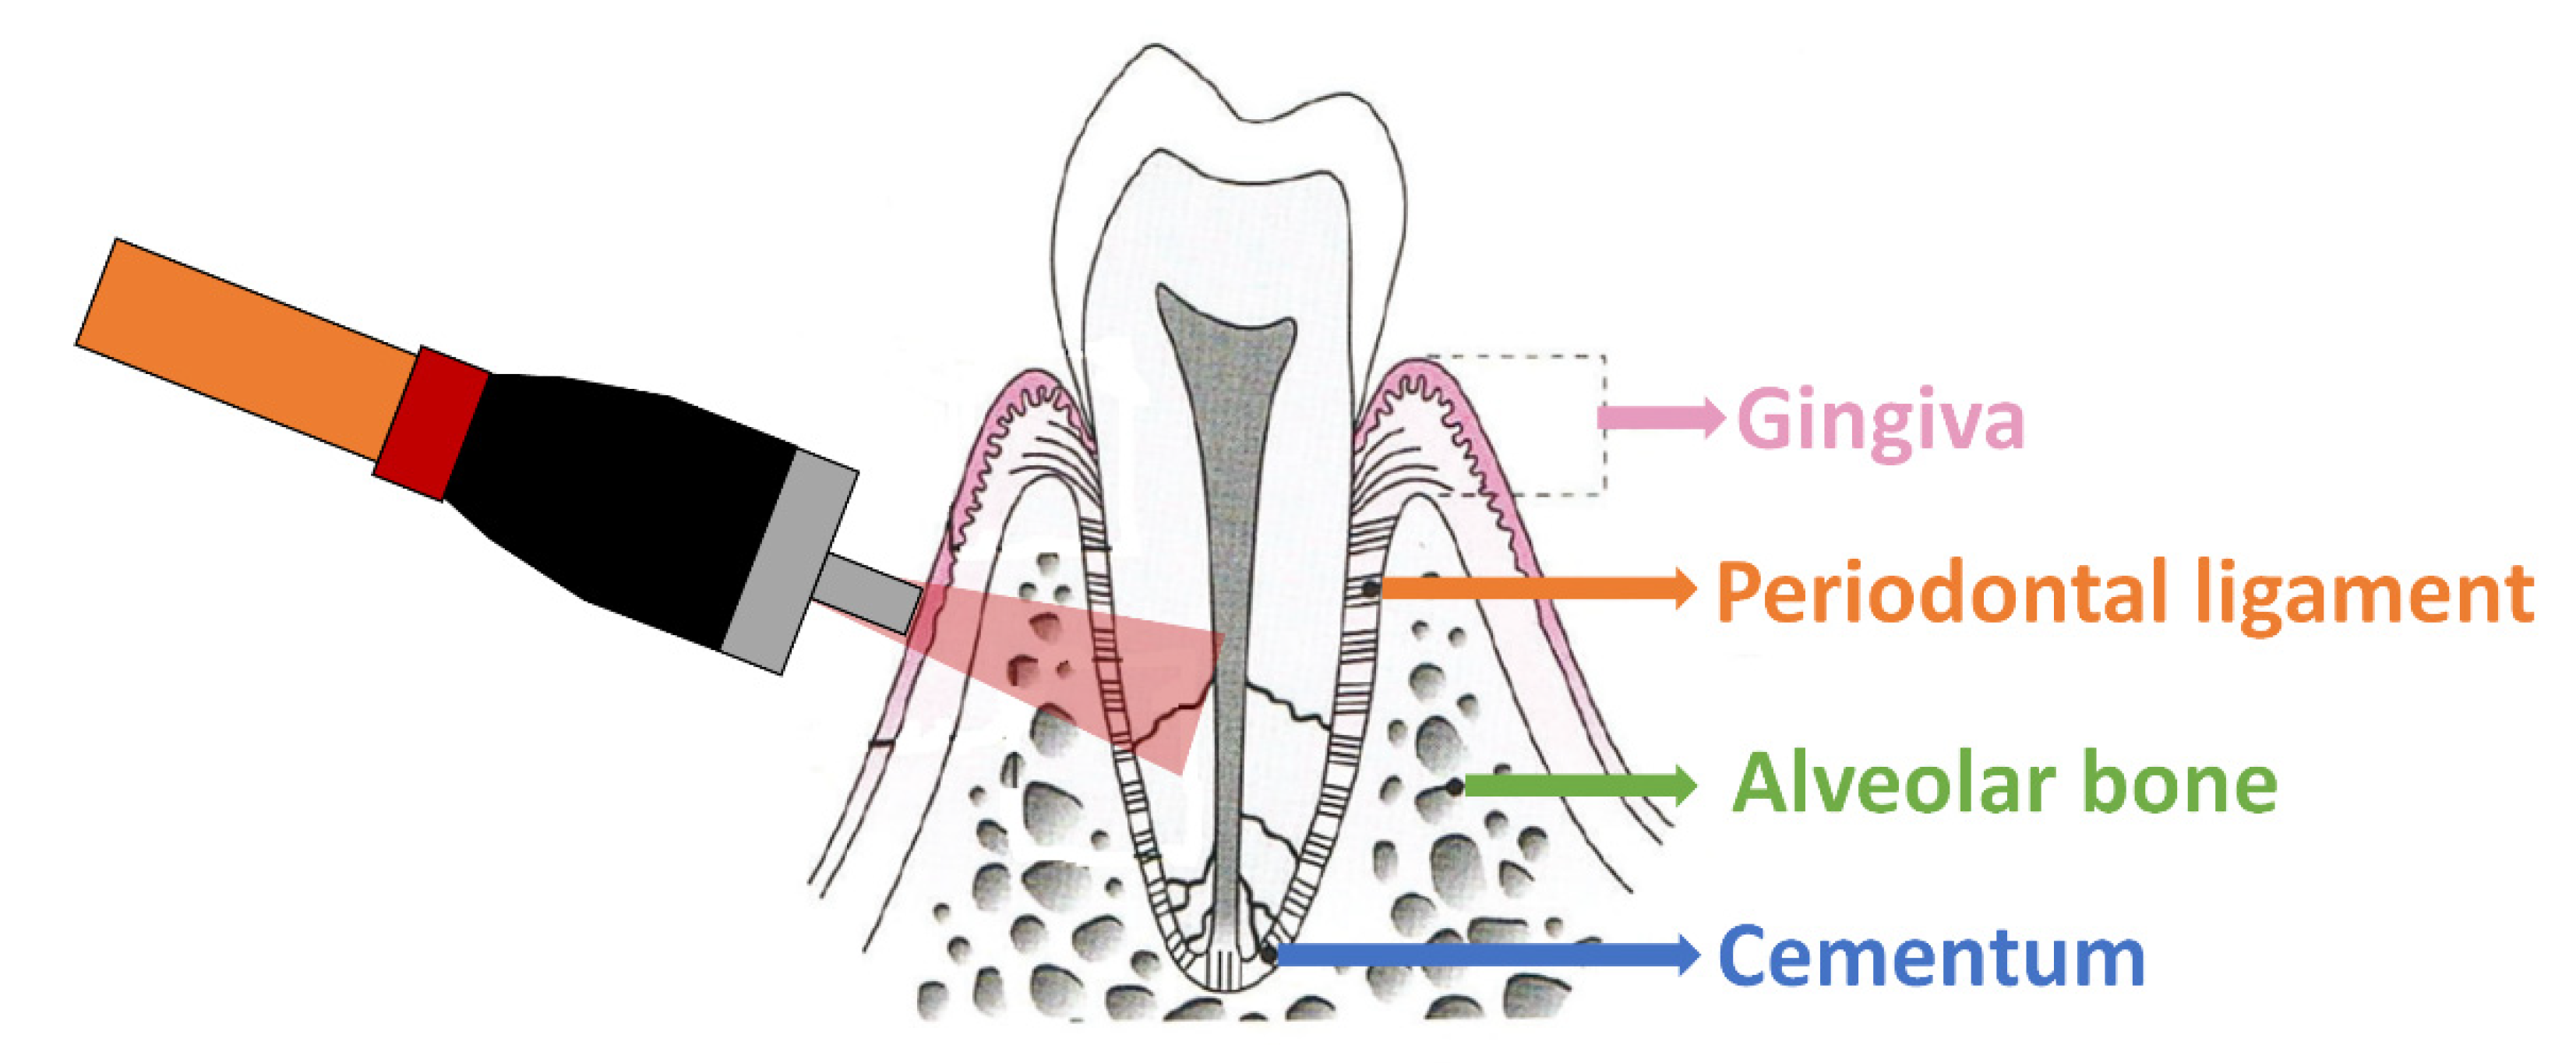
- Cope, G.; Cope, A. The periodontium: An anatomical guide. Dent. Nurs. 2011, 7, 376–378. [Google Scholar] [CrossRef]
- Motz, J.T.; Hunter, M.; Galindo, L.H.; Gardecki, J.A.; Kramer, J.R.; Dasari, R.R.; Feld, M.S. Optical fiber probe for biomedical Raman spectroscopy. Appl. Opt. 2004, 43, 542–554. [Google Scholar] [CrossRef] [PubMed]
- Tsiminis, G.; Chu, F.; Warren-Smith, S.C.; Spooner, N.A.; Monro, T.M. Identification and quantification of explosives in nanolitre solution volumes by Raman spectroscopy in suspended core optical fibers. Sensors 2013, 13, 13163–13177. [Google Scholar] [CrossRef] [PubMed] [Green Version]
- Talari, A.C.S.; Movasaghi, Z.; Rehman, S.; Rehman, I.U. Raman spectroscopy of biological tissues. Appl. Spectrosc. Rev. 2015, 50, 46–111, Erratum in 2007, 42, 493–541. [Google Scholar] [CrossRef]
- Sahu, A.; Deshmukh, A.; Hole, A.R.; Chaturvedi, P.; Krishna, C.M. In vivo subsite classification and diagnosis of oral cancers using Raman spectroscopy. J. Innov. Opt. Health Sci. 2016, 9, 1650017. [Google Scholar] [CrossRef]
- Bergholt, M.S.; Zheng, W.; Huang, Z. Characterizing variability in in vivo Raman spectroscopic properties of different anatomical sites of normal tissue in the oral cavity. J. Raman Spectrosc. 2012, 43, 255–262. [Google Scholar] [CrossRef]
- Lascala, N.T.; Moussalli, N.H. Compêndio Terapêutico Periodontal. In Compêndio Terapêutico Periodontal; Editora Artes Médicas: Porto Alegre, Brazil, 1995; p. 522. [Google Scholar]
- Martinez, I.R., Jr.; Peters, A. Membrane-coating granules and membrane modifications in keratinizing epithelia. Am. J. Anat. 1971, 130, 93–119. [Google Scholar] [CrossRef]
- Berkovitz, B.K.B.; Holland, G.R.; Moxham, B.J. Anatomia, Embriologia e Histologia Bucal; Artmed: Porto Alegre, Brazil, 2004. [Google Scholar]
- Gray, G.M.; Yardley, H.J. Different populations of pig epidermal cells: Isolation and lipid composition. J. Lipid Res. 1975, 16, 441–447. [Google Scholar] [CrossRef]
- Matoltsy, A.G. Keratinization. J. Investig. Dermatol. 1976, 67, 20–25. [Google Scholar] [CrossRef] [PubMed] [Green Version]
- Squier, C.A.; Hall, B.K. The permeability of skin and oral mucosa to water and horseradish peroxidase as related to the thickness of the permeability barrier. J. Investig. Dermatol. 1985, 84, 176–179. [Google Scholar] [CrossRef] [Green Version]
- Yardley, H.J.; Summerly, R. Lipid composition and metabolism in normal and diseased epidermis. Pharmacol. Ther. 1981, 13, 357–383. [Google Scholar] [CrossRef]
- Wertz, P.W.; Downing, D.T. Ceramides of pig epidermis: Structure determination. J. Lipid Res. 1983, 24, 759–765. [Google Scholar] [CrossRef]
- Krinsky, N.I. The biological properties of carotenoids. Pure Appl. Chem. 1994, 66, 1003–1010. [Google Scholar] [CrossRef] [Green Version]
- Mesquita, E.T.; Montera, M.W.; Neto, J.D.S.; Pereira, S.B.; Freitas, A.F.; Volschan, A.; Biolo, A.; Filho, A.C.B.N.; Chagas, A.C.P.; Jorge, A.J.L.; et al. Biomarkers in cardiology--part 1-in heart failure and specific cardiomyopathies. Arq. Bras. Cardiol. 2014, 103, 451. [Google Scholar]
- Schnieders, J.; Gbureck, U.; Vorndran, E.; Schossig, M.; Kissel, T. The effect of porosity on drug release kinetics from vancomycin microsphere/calcium phosphate cement composites. J. Biomed. Mater. Res. Part B Appl. Biomater. 2011, 99, 391–398. [Google Scholar] [CrossRef]
- Kuroki, S.; Yokoo, S.; Terashi, H.; Hasegawa, M.; Komori, T. Epithelialization in oral mucous wound healing in terms of energy metabolism. Kobe J. Med. Sci. 2009, 55, E5–E15. [Google Scholar]
- Fried, D.; Xie, J.; Shafi, S.; Featherstone, J.D.B.; Breunig, T.; Le, C.Q. Imaging caries lesions and lesion progression with polarization sensitive optical coherence tomography. J. Biomed. Opt. 2002, 7, 618–627. [Google Scholar] [CrossRef]
- Wijesinghe, R.E.; Cho, N.H.; Park, K.; Jeon, M.; Kim, J. Bio-photonic detection and quantitative evaluation method for the progression of dental caries using optical frequency-domain imaging method. Sensors 2016, 16, 2076. [Google Scholar] [CrossRef] [Green Version]


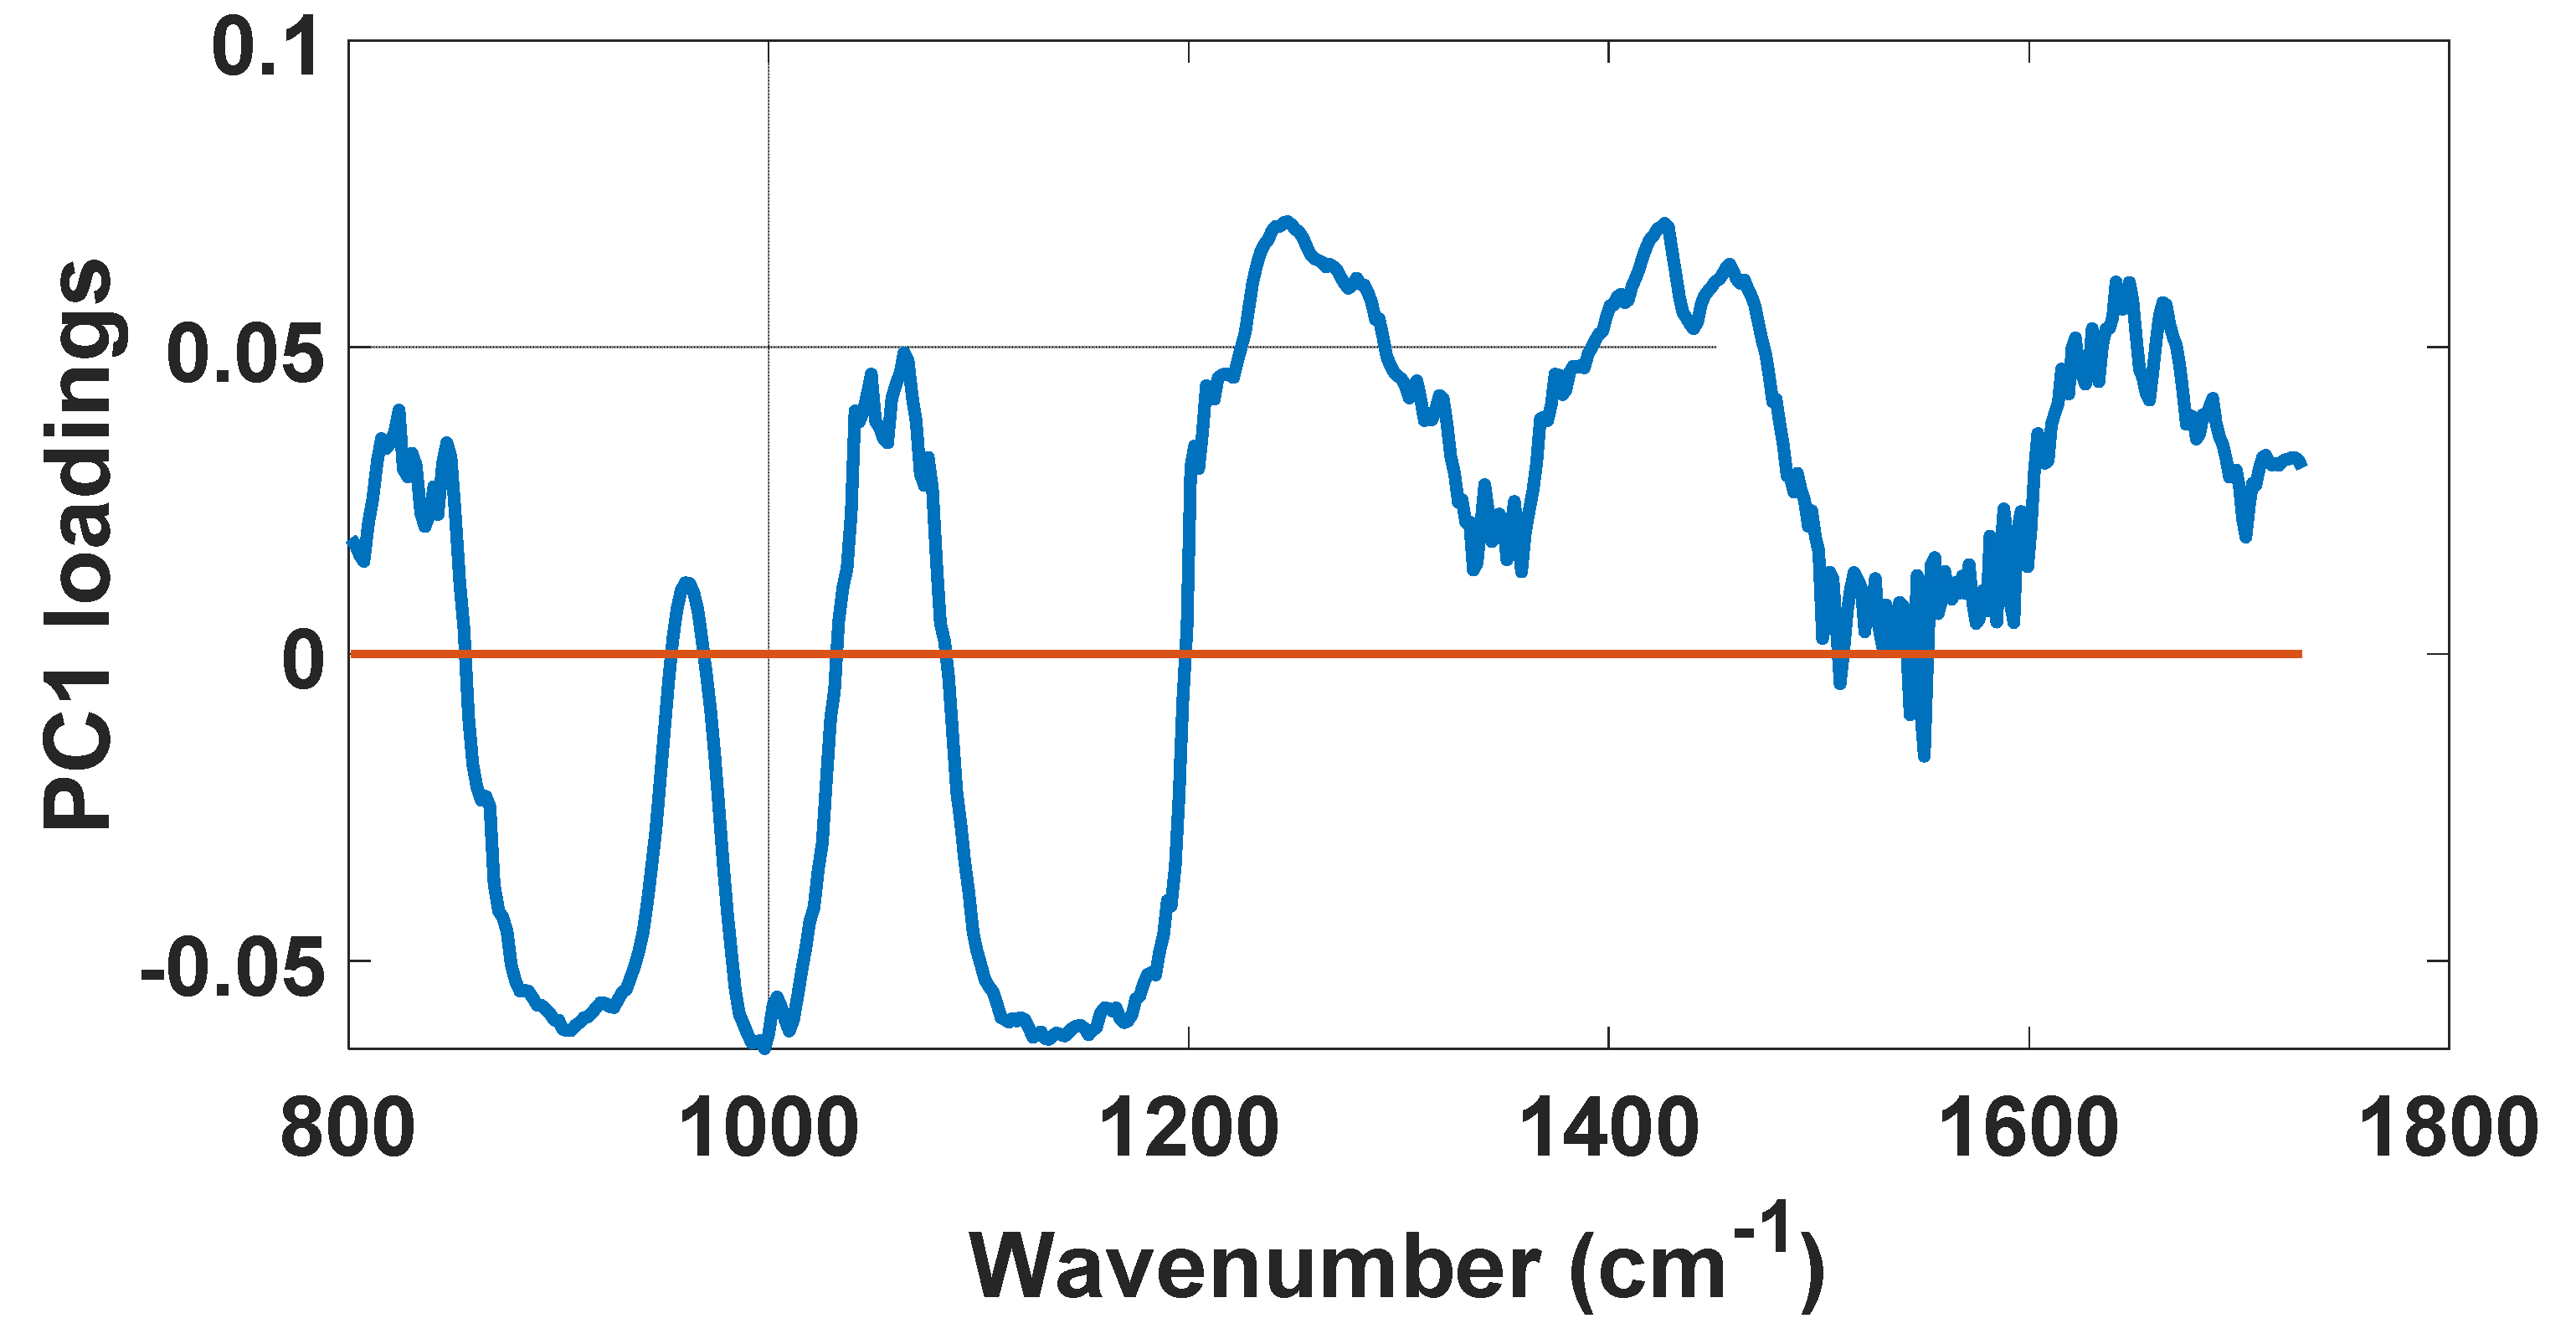
| PC1 Loadings | Vibrational Modes | Biochemical Compound |
|---|---|---|
| 824 cm−1 | Out-of-plane ring breathing | Phosphodiester bonds |
| 906 cm−1 | Out-of-plane ring breathing | Tyrosine |
| 998 cm−1 | ν45(CC) | Red blood cells |
| 1064 cm−1 | Skeletal C-C stretch of lipids | Fatty acids |
| 1133 cm−1 | Out-of-plane ring breathing | Palmitic acid |
| 1245 cm−1 | Out-of-plane ring breathing | Amide III |
| 1428 cm−1 | B, Z-marker | Deoxyribose |
| 1641 cm−1 | Amide I band | Proteins |
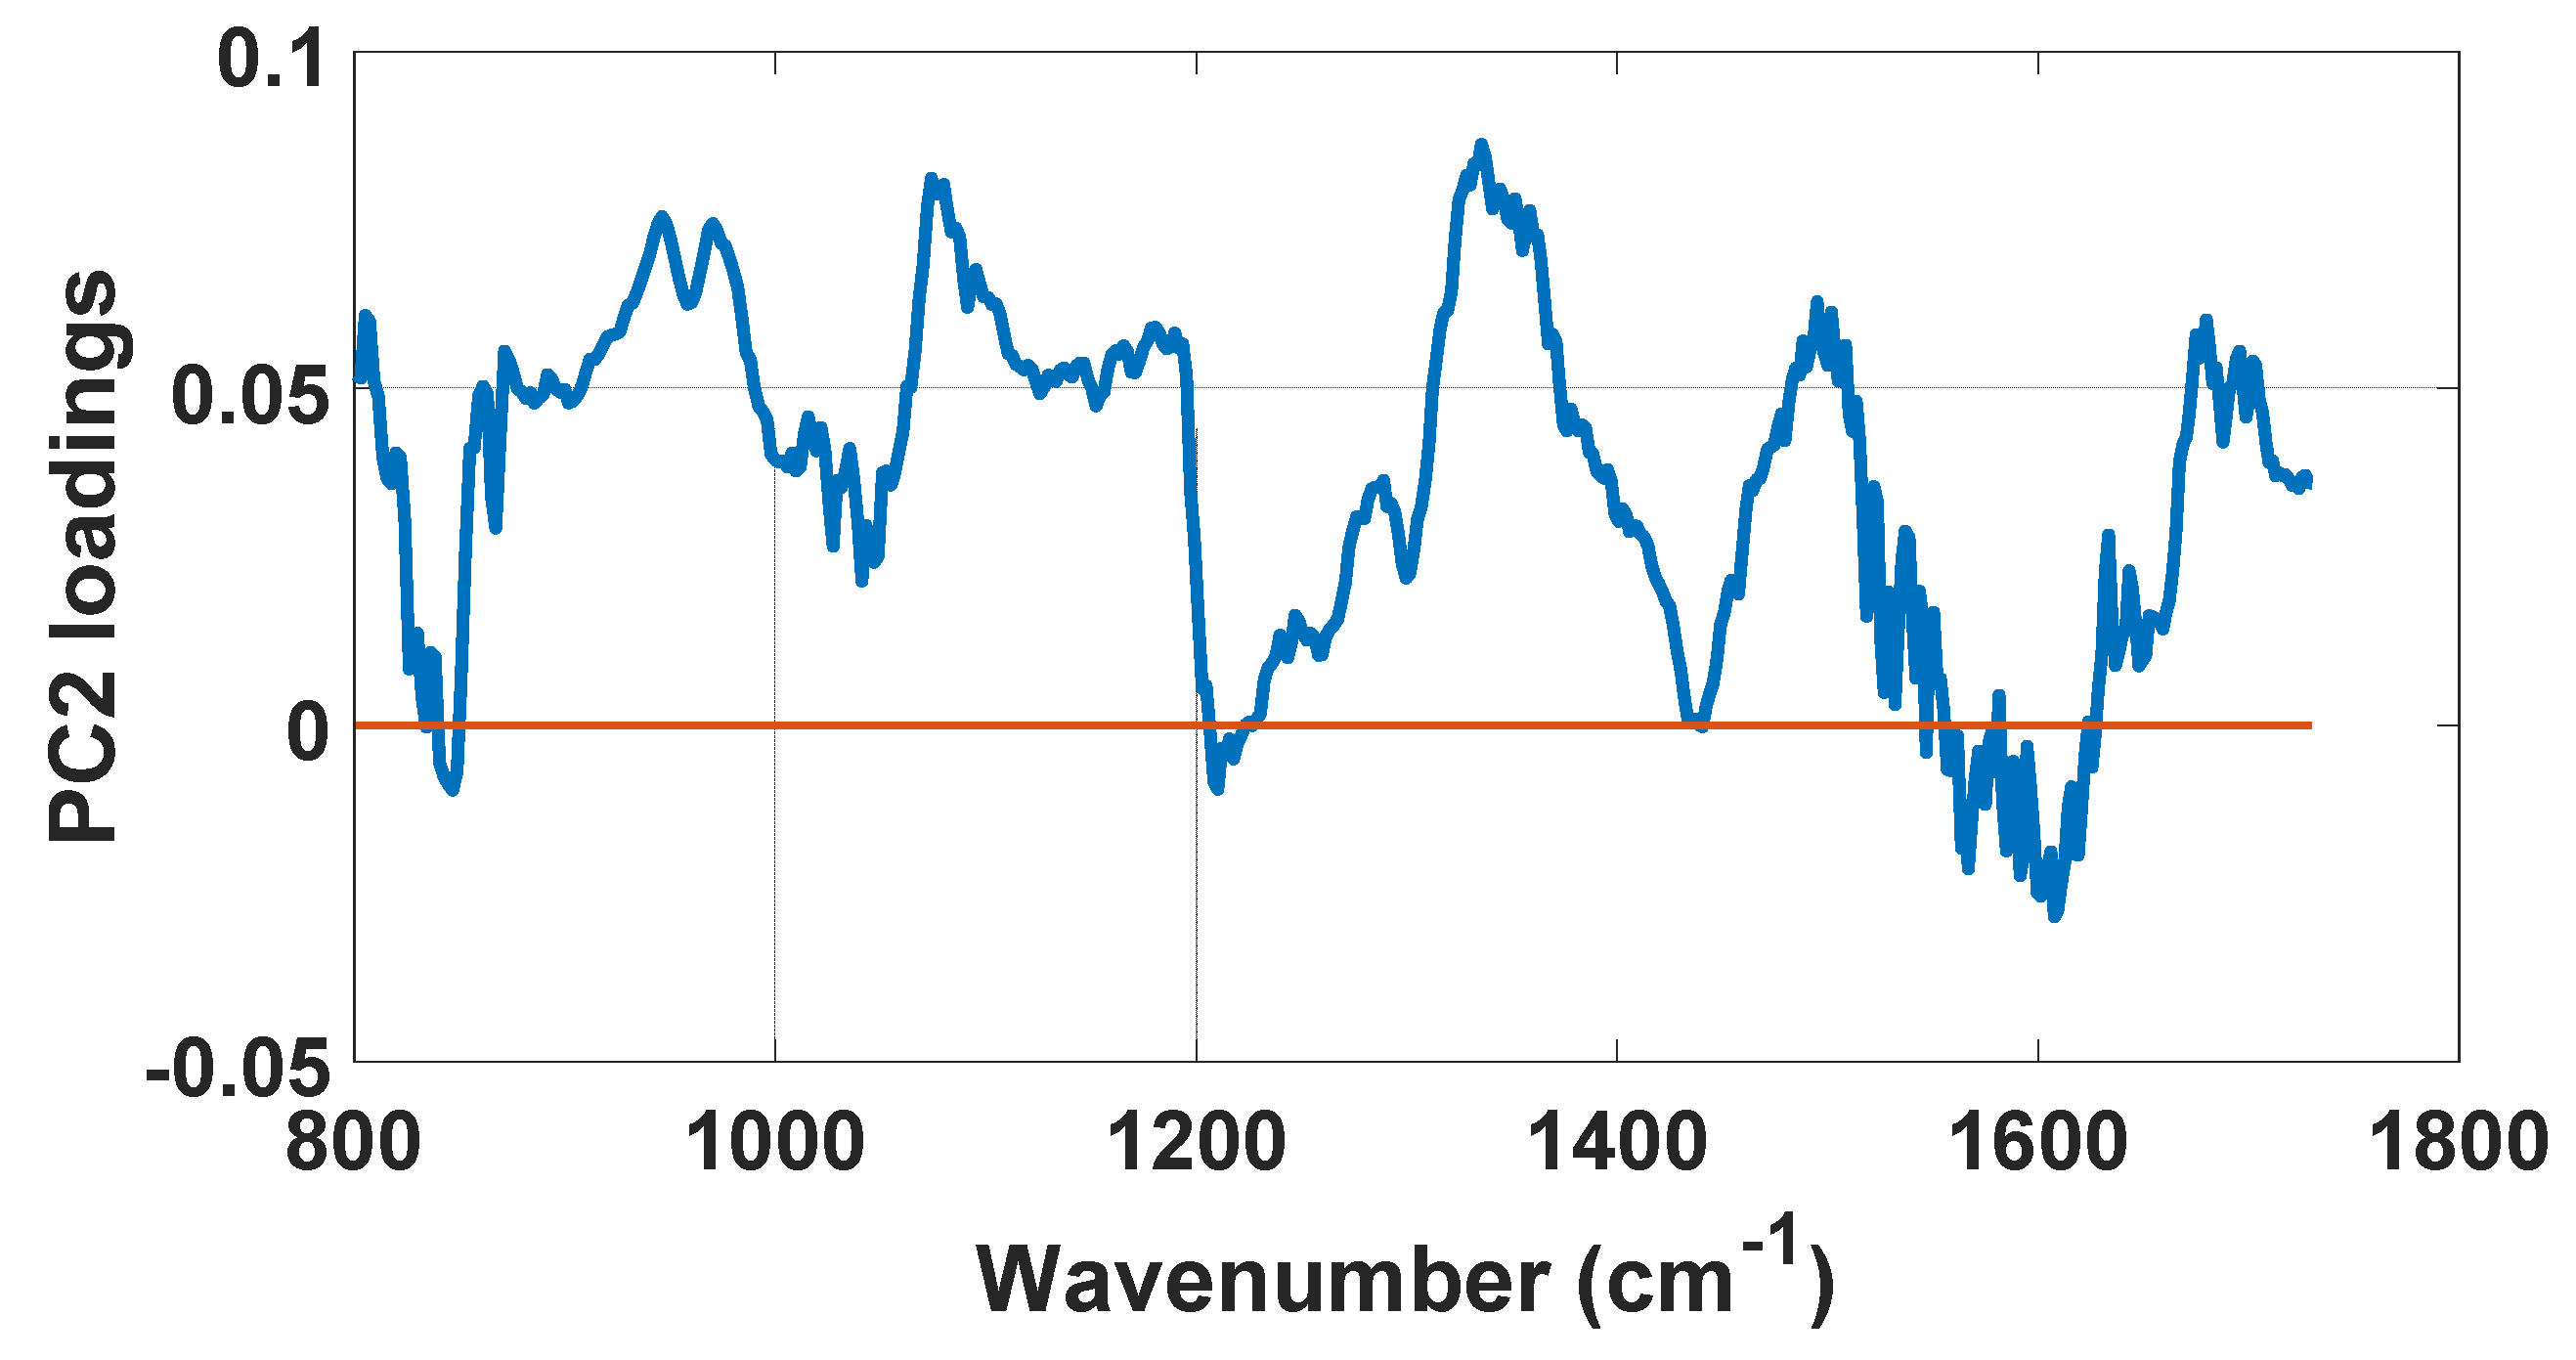
| PC2 Loadings | Vibrational Modes | Biochemical Compound |
|---|---|---|
| 946.3 cm−1 | Skeletal modes or single bond stretching vibrations | Polysaccharides |
| 970.3 cm−1 | Phosphate monoester groups | Phosphorylated proteins and cellular nucleic acids |
| 1074 cm−1 | Glucose, triglycerides, C-C (lipid) | |
| 1335 cm−1 | CH3CH2 wagging or twisting | Collagen or nucleic acids |
| 1495 cm−1 | C-C stretching in benzenoid ring | |
| 1680 cm−1 | Bound and free NADH |
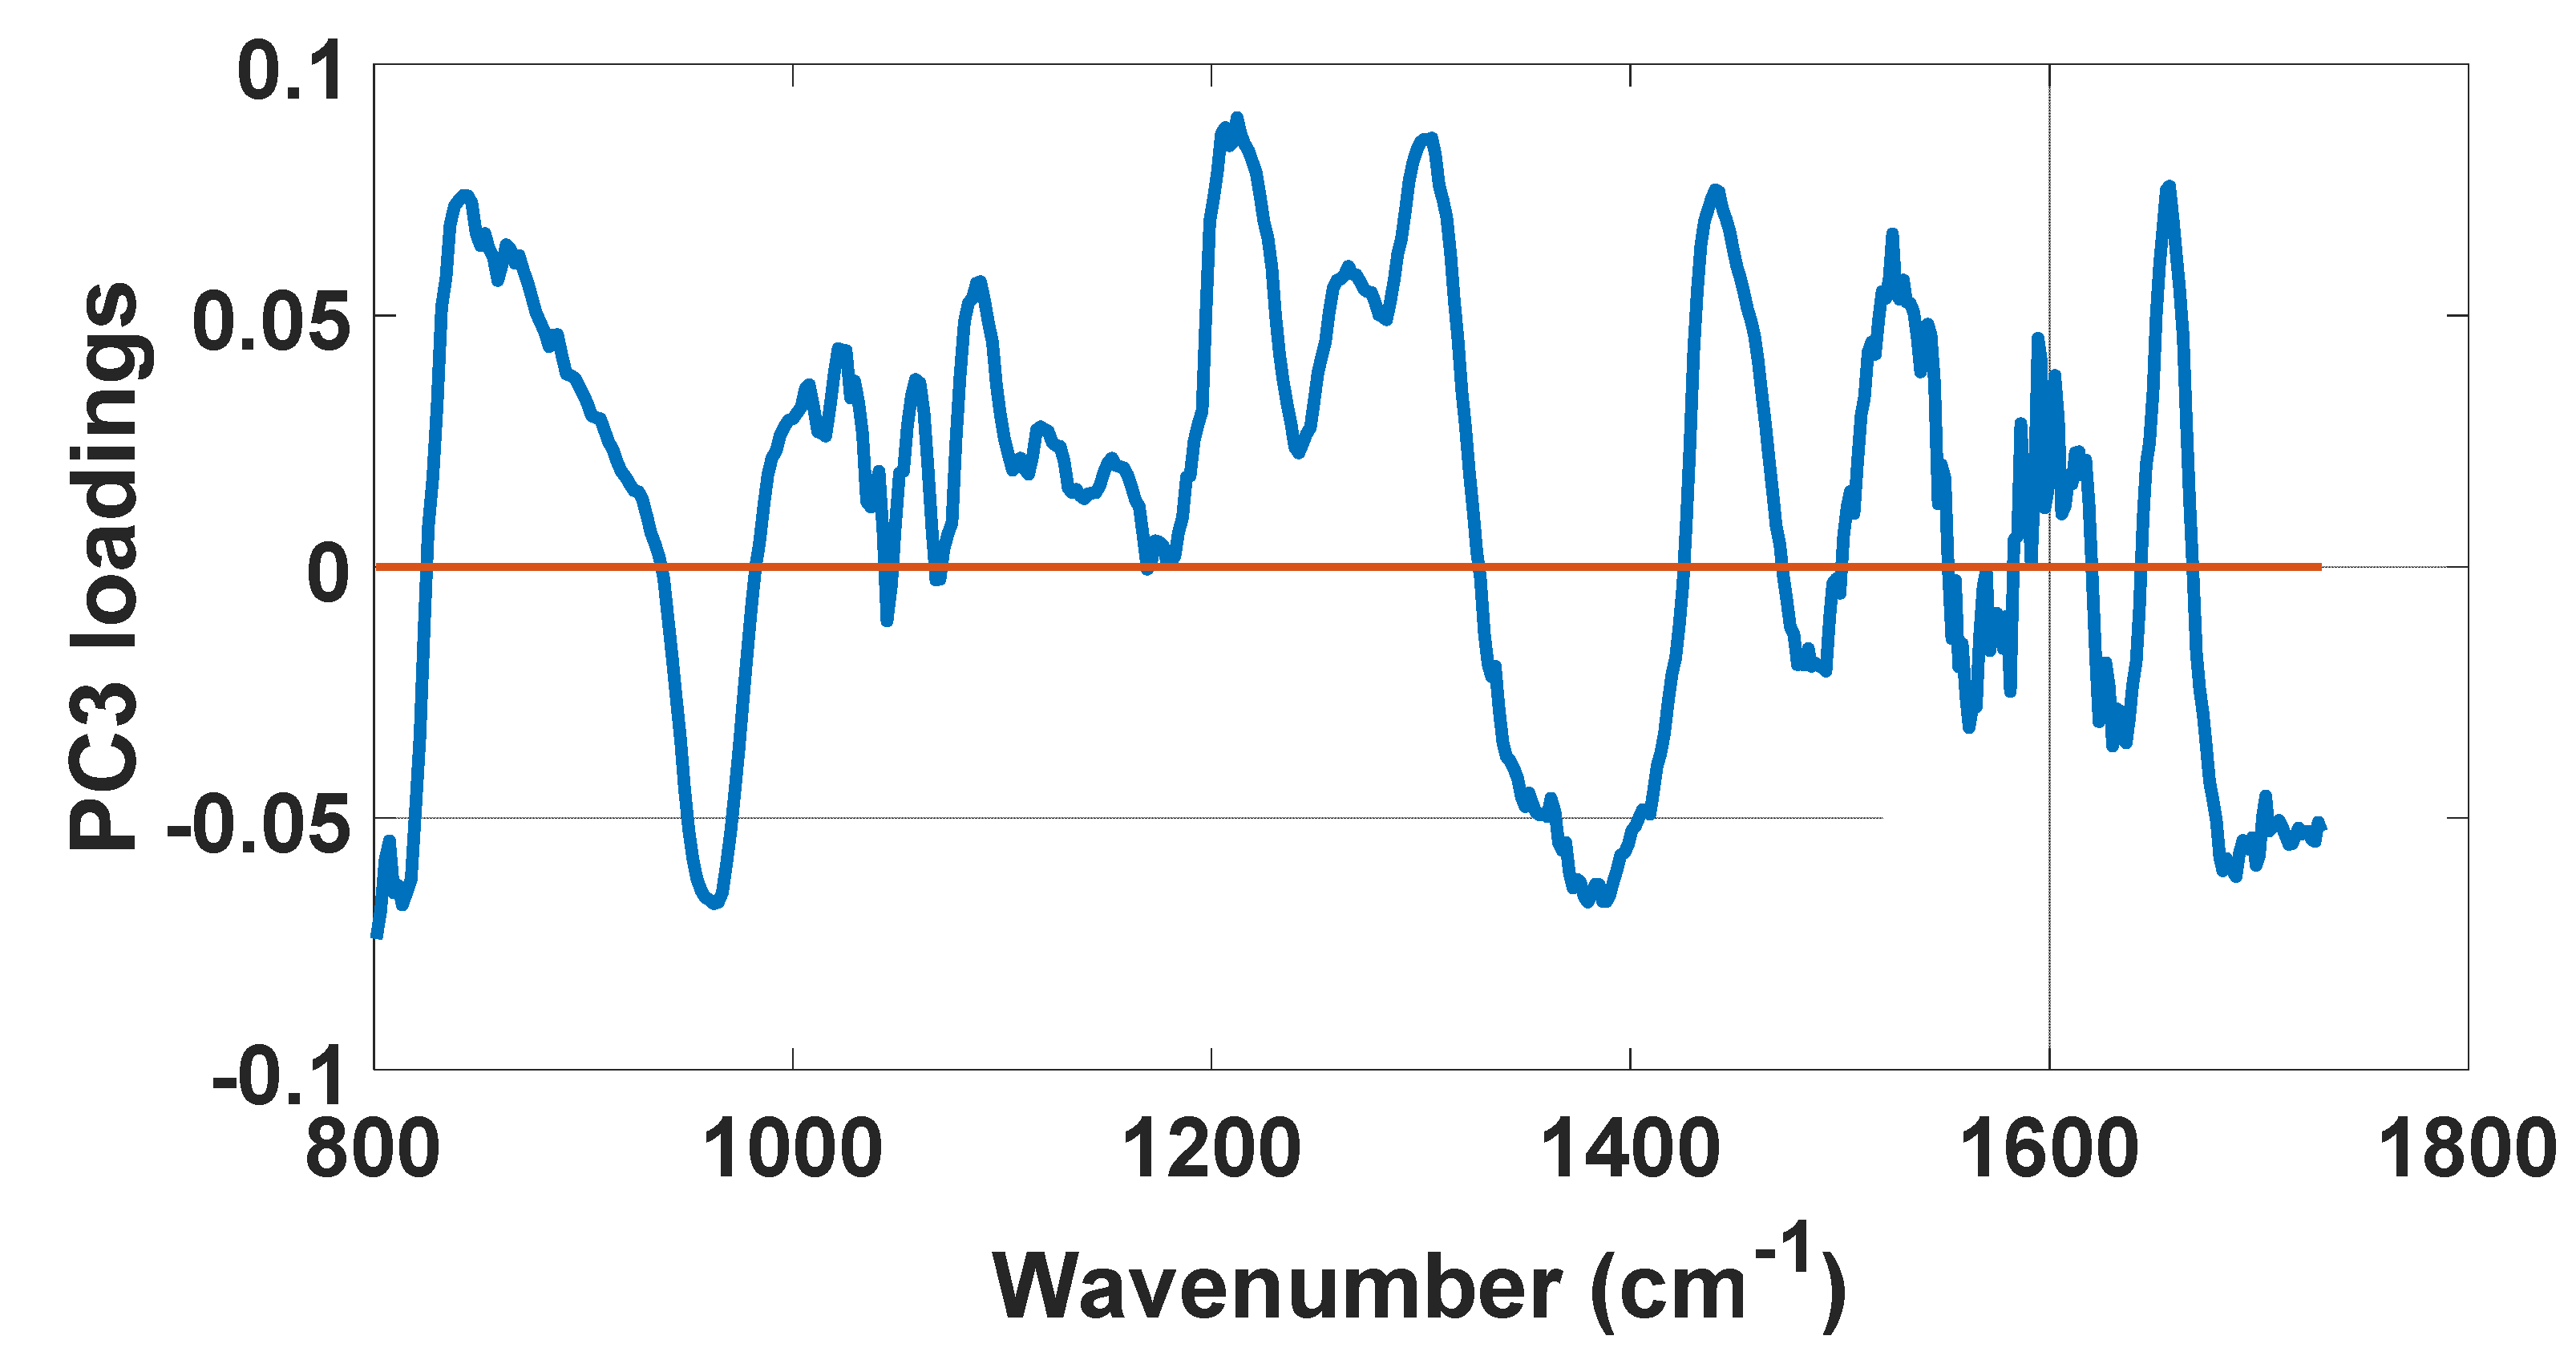
| PC3 Loadings | Vibrational Modes | Biochemical Compound |
|---|---|---|
| 813.6 cm−1 | C-C and C5′-O-P-O-C3′ Stretching of phosphodiester bond | RNA |
| 842.6 cm−1 | Out-of-plane ring breathing | Glucose–saccharide |
| 962.3 cm−1 | Phosphate symmetric stretching vibration | Calcium hydroxyapatite |
| 1212 cm−1 | C C6H5 stretching mode and | Tyrosine and phenylalanine |
| ν18(δ: CmH) | Red blood cells | |
| 1305 cm−1 | CH2 deformation | Lipids, adenine, cytosine |
| 1380 cm−1 | δCH3 symmetric (CH3 bond) | Lipids |
| 1440 cm−1 | δ(CH2), CH2 and CH3 deformation vibrations | Lipids |
| 1525 cm−1 | In-plane vibrations of the conjugated -C=C- | Carotenoids |
| 1627 cm−1 | Cα=Cα stretch and amide C=O stretching absorption | β-form polypeptide films |
| 1688 cm−1 | Disordered structure; non-hydrogen bonded | Amide I |
Publisher’s Note: MDPI stays neutral with regard to jurisdictional claims in published maps and institutional affiliations. |
© 2021 by the authors. Licensee MDPI, Basel, Switzerland. This article is an open access article distributed under the terms and conditions of the Creative Commons Attribution (CC BY) license (https://creativecommons.org/licenses/by/4.0/).
Share and Cite
Saito Nogueira, M.; Ribeiro, V.; Pires, M.; Peralta, F.; Carvalho, L.F.d.C.e.S.d. Biochemical Profiles of In Vivo Oral Mucosa by Using a Portable Raman Spectroscopy System. Optics 2021, 2, 134-147. https://0-doi-org.brum.beds.ac.uk/10.3390/opt2030013
Saito Nogueira M, Ribeiro V, Pires M, Peralta F, Carvalho LFdCeSd. Biochemical Profiles of In Vivo Oral Mucosa by Using a Portable Raman Spectroscopy System. Optics. 2021; 2(3):134-147. https://0-doi-org.brum.beds.ac.uk/10.3390/opt2030013
Chicago/Turabian StyleSaito Nogueira, Marcelo, Victoria Ribeiro, Marianna Pires, Felipe Peralta, and Luis Felipe das Chagas e Silva de Carvalho. 2021. "Biochemical Profiles of In Vivo Oral Mucosa by Using a Portable Raman Spectroscopy System" Optics 2, no. 3: 134-147. https://0-doi-org.brum.beds.ac.uk/10.3390/opt2030013