
A Preliminary Investigation on the Photothermal Properties of Luminescent Solar Concentrators


1
Department of Chemical and Biomolecular Engineering, Rice University, Houston, TX 77005, USA
2
Department of Earth and Environmental Engineering, Columbia University, New York, NY 10027, USA
3
Physical Sciences and Engineering Division, King Abdullah University of Science and Technology, Thuwal 23955, Saudi Arabia
4
School of Chemical Engineering and Bioengineering, Washington State University, Pullman, WA 99164, USA
*
Author to whom correspondence should be addressed.
Optics 2021, 2(3), 148-154; https://0-doi-org.brum.beds.ac.uk/10.3390/opt2030014
Submission received: 11 July 2021
/
Revised: 29 July 2021
/
Accepted: 2 August 2021
/
Published: 5 August 2021
(This article belongs to the Special Issue Novel Research on Solar Photothermal Technology: Theory, Design, System and Applications)
Abstract
:Luminescent solar concentrators (LSCs) are considered promising photovoltaic (PV) devices to circumvent practical issues of applying conventional solar panels to the built environment. However, LSCs suffer from low power conversion efficiencies (PCEs) (typically <2% for devices of over 1 m2), despite numerous efforts having been made to develop novel luminescent materials and optical techniques. In this report, we proposed to utilize photothermal (PT) energy of the LSCs to further improve the PCE. We conducted a preliminary investigation on the PV and PT properties of an LSC with dimensions of 300 mm × 300 mm × 5 mm. The results showed that the PT power (27.05 W) was much higher than the PV power (2.12 W). Further analysis indicated that the PCE could reach 3.41% for a device of 1 m2.
1. Introduction
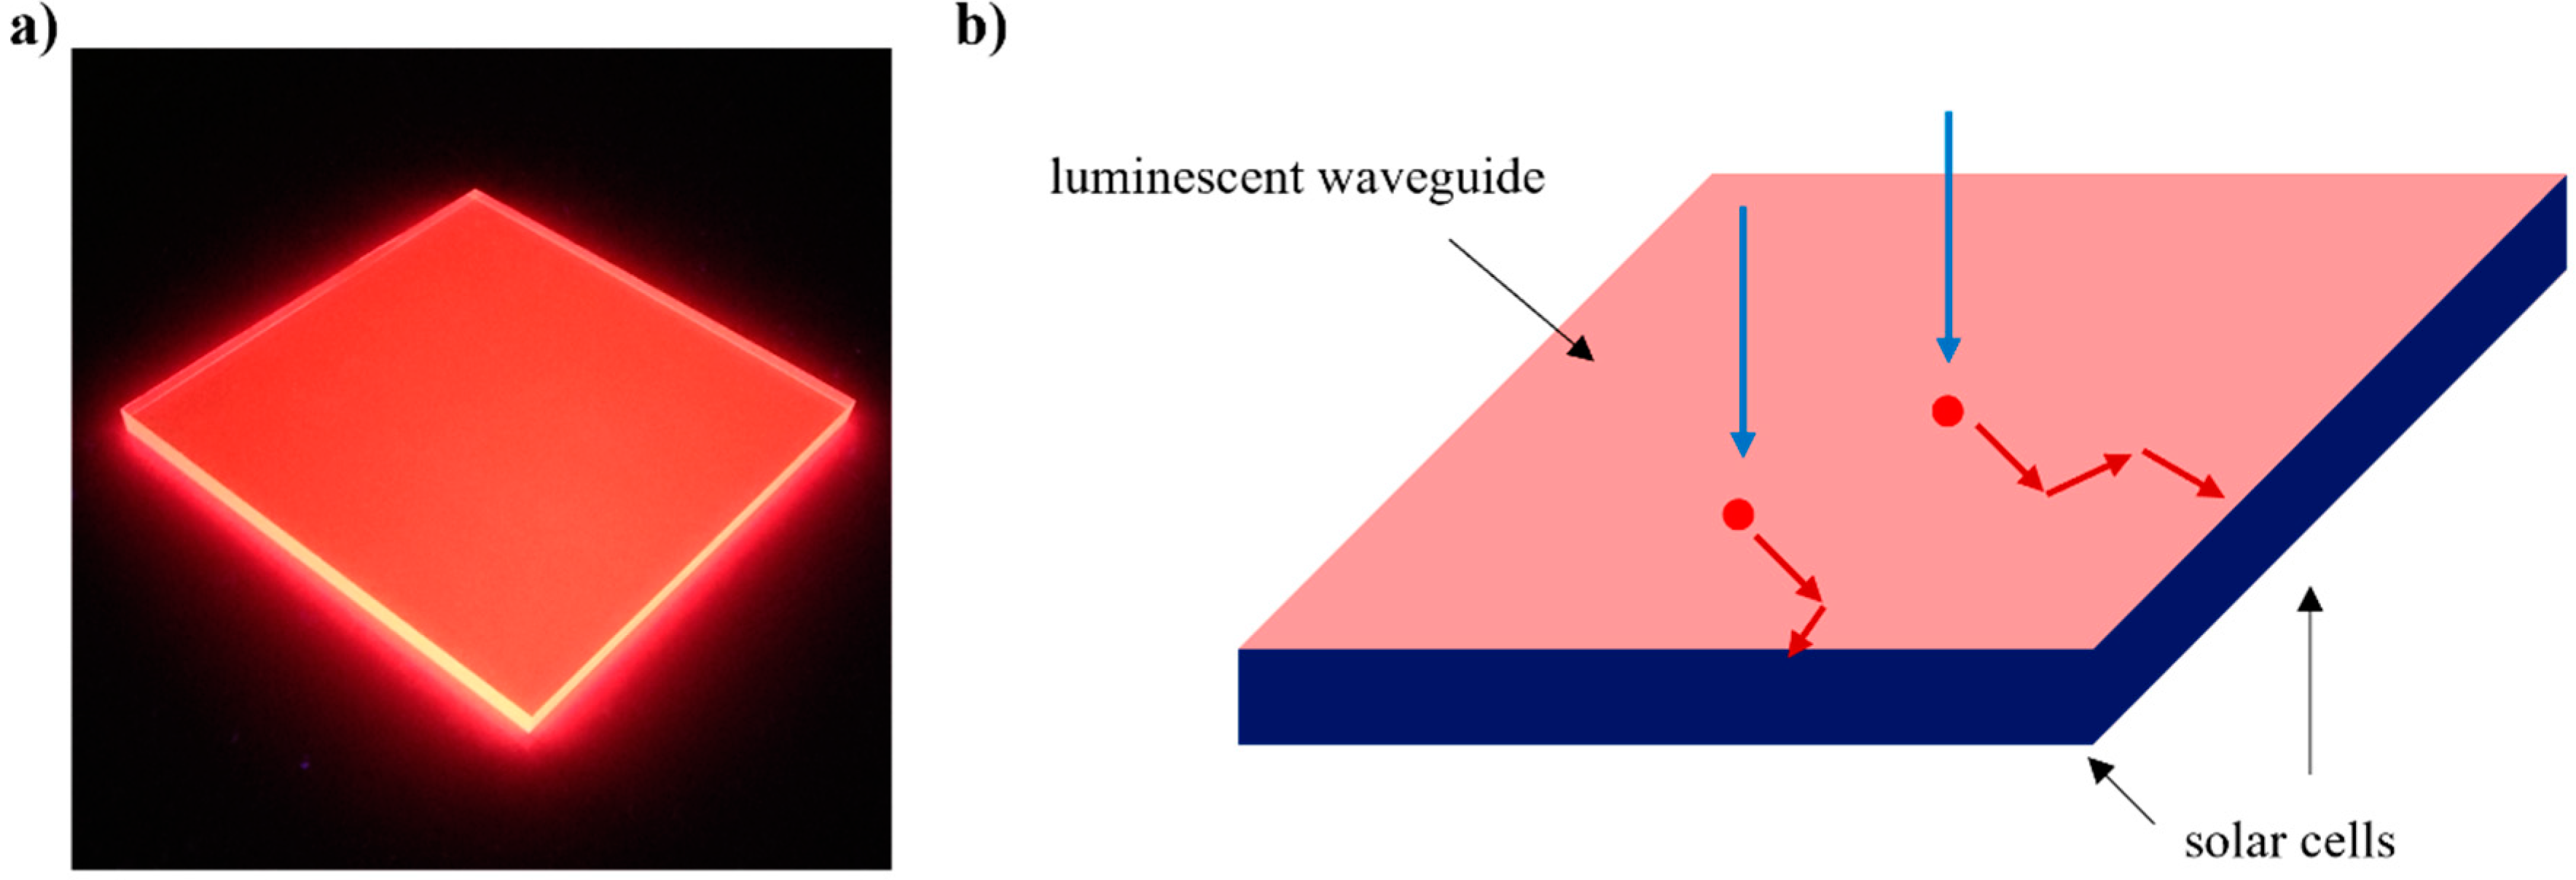
The transformation from conventional cities that are based on fossil energy to zero-carbon cities that are based on renewable energy requires the integration of power facilities that are capable of harvesting and producing energy with the built environment [1,2,3]. Photovoltaic (PV) devices that convert solar energy directly to electrical energy play important roles in achieving this transformation [4,5,6,7]. However, conventional solar panels have limitations when being applied to buildings. They have limited varieties of shapes and colors for building integration and require limited weather conditions for optimal operation [8,9,10,11]. Luminescent solar concentrators (LSCs) emerged to address these issues with conventional solar panels. Although conventional solar cells can be designed to different shapes and colors to meet the building architecture requirements, these designs are typically high cost. One of the biggest advantages of using LSCs is that low-cost solar cells can be utilized with luminescent waveguides to achieve different architecture requirements. It has been proven that LSCs can be utilized as exterior and interior building parts [12,13,14] and operated under different light conditions [15]. A typical LSC consists of a luminescent waveguide with solar cells attached to the edge [16,17,18]. The operational mechanism of LSCs is illustrated in Figure 1. The sunlight is absorbed by the luminophores and converted to luminescent light (i.e., wavelength-shifting effect [19,20,21,22,23]), which transports to the edge of the luminescent waveguide through successive total internal reflection (TIR). The highly intensive luminescent light from the edge of the luminescent waveguide allows the edge-attached solar cells to produce electrical energy much higher than the electrical energy produced by the solar cells that are not attached to the luminescent waveguide.
To date, numerous studies on the LSCs have focused on developing novel luminescent materials [24,25,26] and optical techniques [27,28,29,30] to enhance the performance of LSCs. However, only a handful of reports demonstrated devices with power conversion efficiencies (PCEs) (>5%) and/or high concentration ratios (>2) at large scales [31,32,33,34,35]. According to a theoretical study, LSCs are subjected to over 50% photon loss due to the luminophore self-absorption, host matrix absorption, and waveguide escape [36]. Except for the waveguide escape (i.e., direct photon loss through waveguide escape cone and surface scattering [37]), luminophore-self-absorption and host matrix absorption produce photothermal (PT) energy inside the luminescent waveguide. The PT energy can be potentially utilized and converted to electrical energy so that the PCE of LSCs can be further improved.
In this study, we conducted a preliminary investigation on the PT properties of an LSC with dimensions of 300 mm × 300 mm × 5 mm. We found that the PT power (27.05 W) of the LSC was significantly higher than the PV power (2.12 W). For an LSC of 1 m2, with the conversion of PT energy to electrical energy, the PCE could be enhanced by 81% and the overall PCE could reach 3.41%.
2. Experimental
2.1. Device Fabrication
The fabrication of the LSC consists of the preparation of the luminescent waveguide and the attachment of solar cells. The procedures associated with detailed schematics are provided in our previous reports [37,38,39]. Briefly, the luminescent waveguide was prepared from the two-step polymerization of methyl methacrylate (MMA) (Sigma-Aldrich, St. Louis, MO, USA) with 0.1 w/w% azobisisobutyronitrile (AIBN) (Sigma-Aldrich) and 60 ppm N,N′-bis(2,6-diisopropylphenyl)-1,6,7,12-tetraphenoxy-3,4,9,10-perylenetetracarboxylic diimide (R305) (TCI America, Portland, OR, USA). The raw luminescent waveguide was mechanically processed to a 300 mm × 300 mm × 5 mm slab. Polycrystalline silicon (p-Si) solar cells (eBay) that matched the size of the edge of the luminescent waveguide (300 mm × 5 mm) were utilized. They were connected in parallel and glued using optically clear adhesives to the four edges of the luminescent waveguide. There were no encapsulations for the solar cells and the LSC.
2.2. Device Characterization
The AM1.5G sunlight (1000 W·m−2) was provided by an OAI class AAA solar simulator, which was applied for the solar cells and the LSC. The I–V curves were measured using a Keithley 2401 Sourcemeter. The external quantum efficiencies (EQEs) were measured using an Enlitech QE-R3011 system. The emission spectrum of the luminescent waveguide was measured using an ISS PC1 photon-counting spectrofluorometer.
2.3. Ray-Tracing Simulation
The ray-tracing simulation was performed using a commercial Monte Carlo ray-tracing service provided by Solarathlon. The service was customized to obtain the heat map of the luminescent waveguide. About 1.7 × 10¹⁰ photons across the AM1.5G solar spectrum (280–4000 nm) were simulated.
3. Results and Discussion
3.1. PV Properties
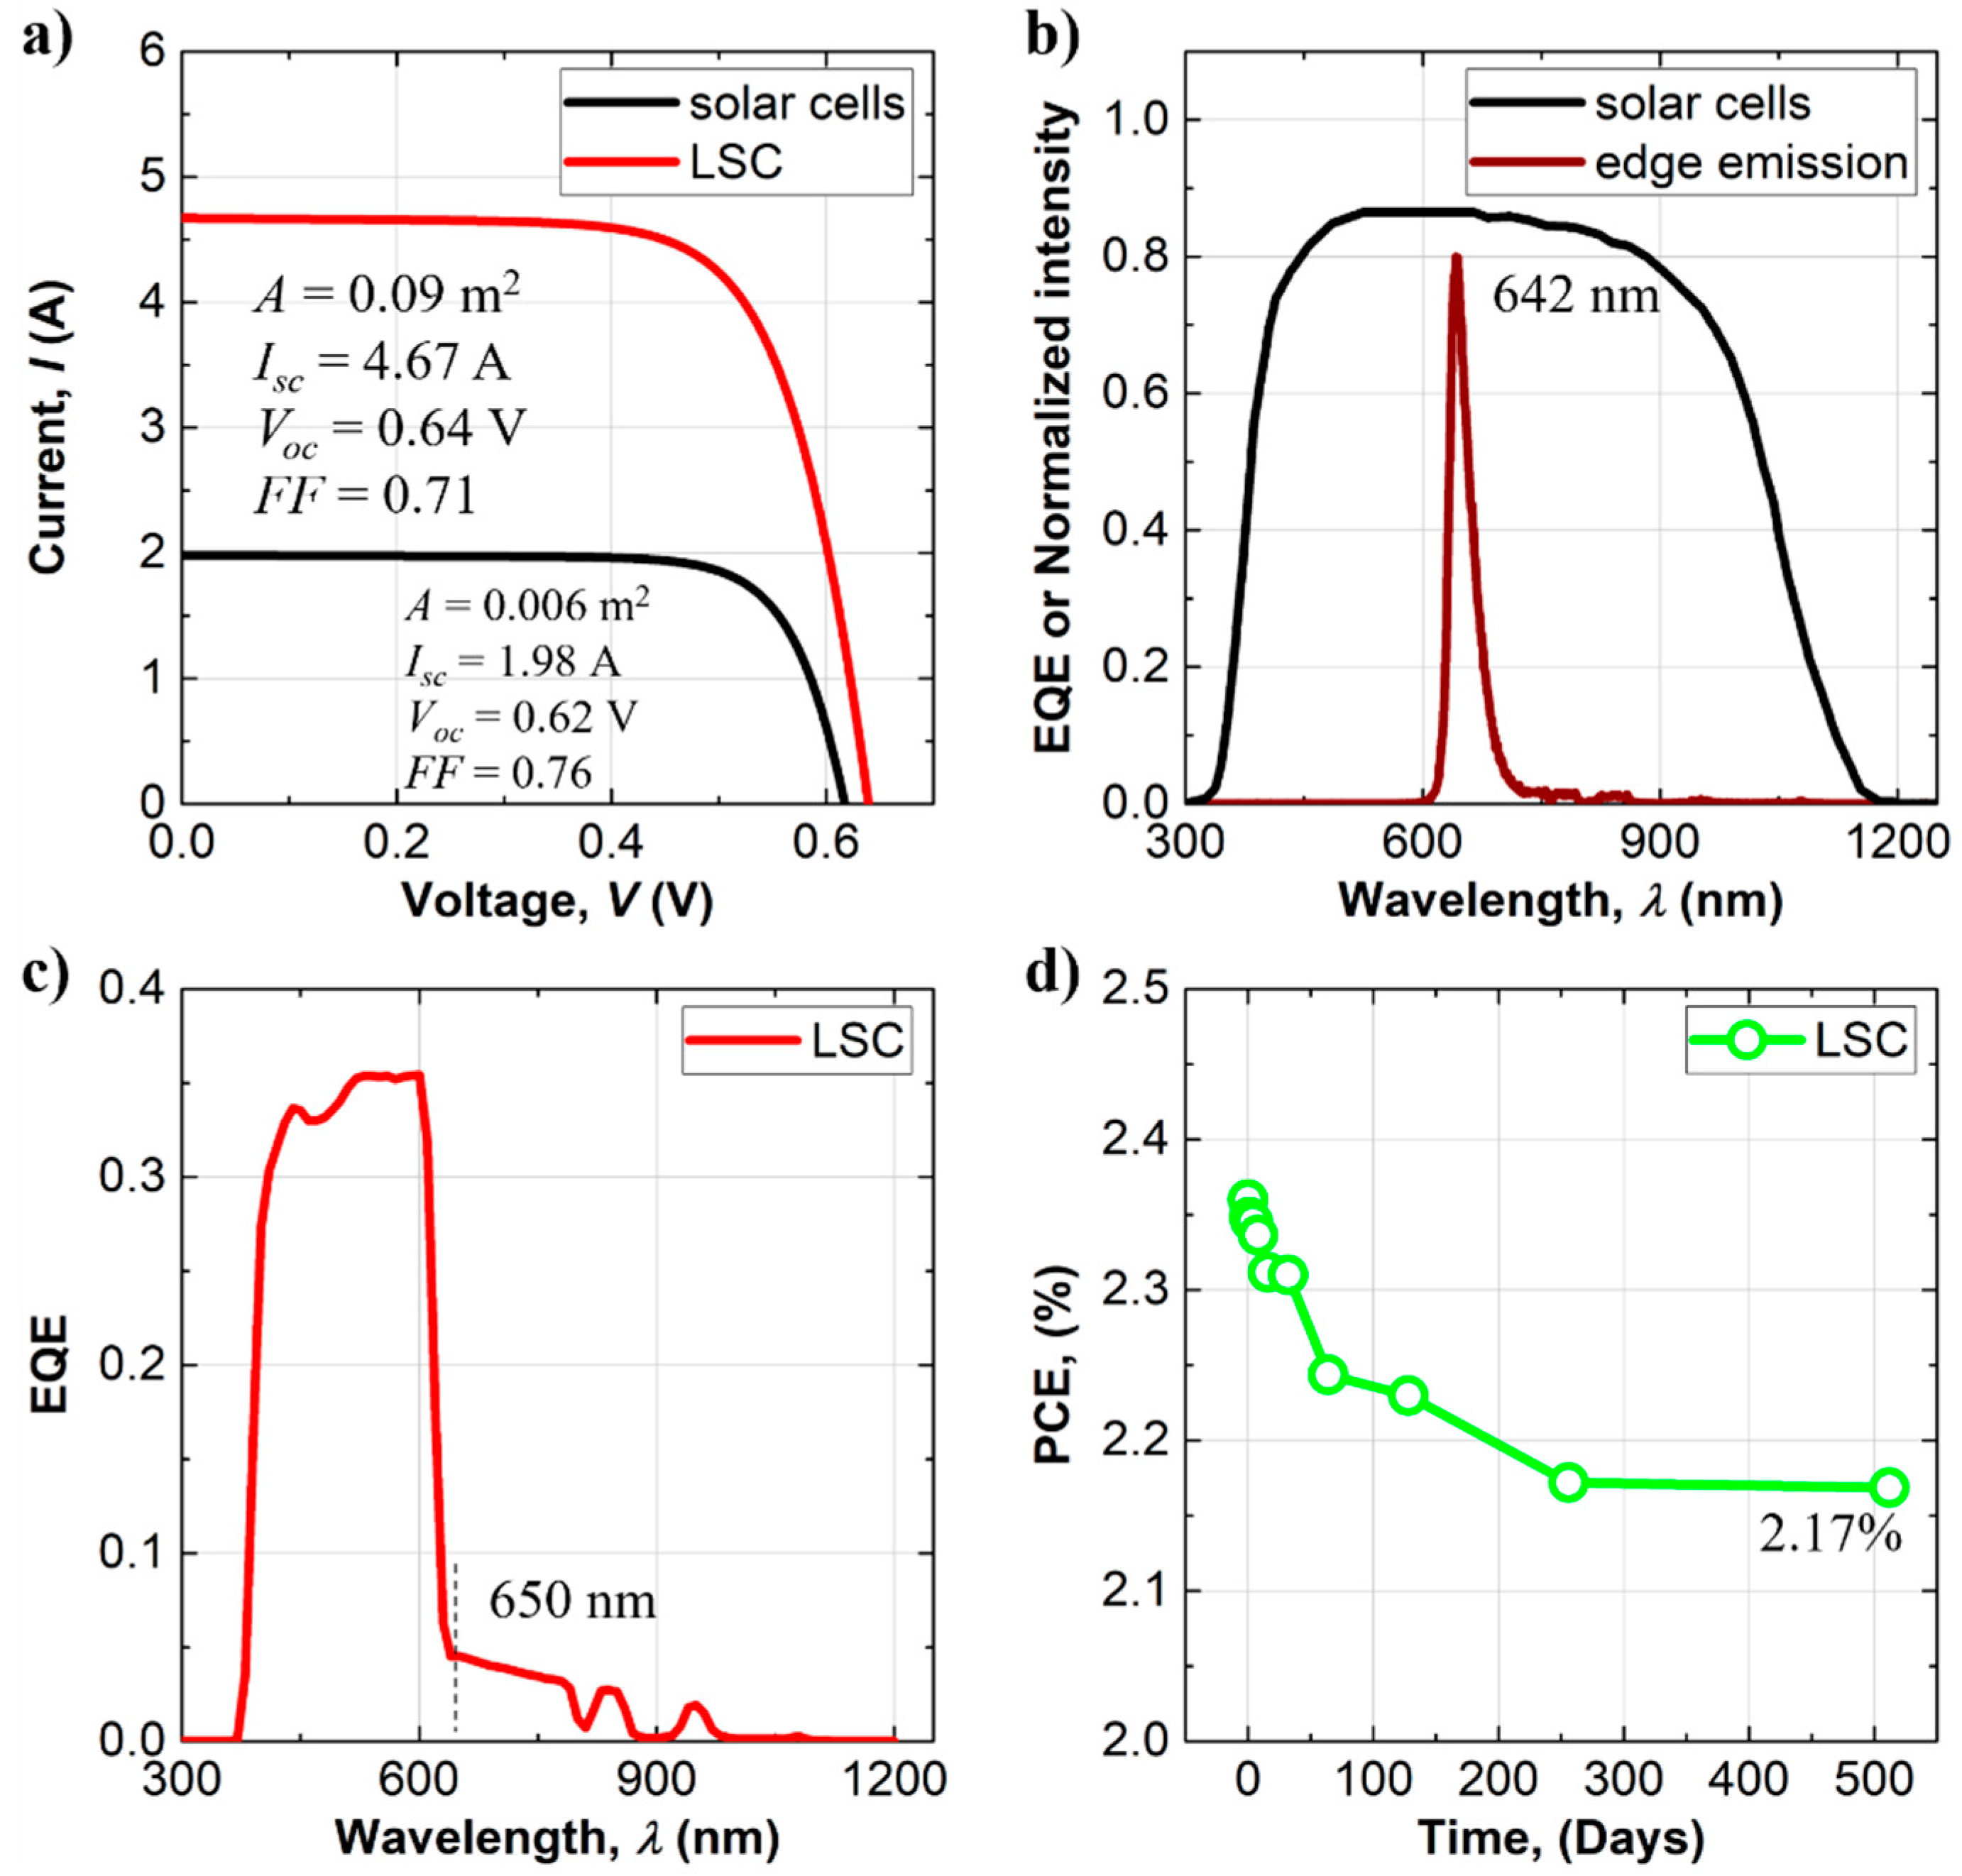
We first reported the PV properties of the parallel-connected solar cells and the LSC. Figure 2a shows the I–V curves of the solar cells and the LSC. Before being attached to the edge of the luminescent waveguide, the solar cells exhibited short-circuit current (Isc) of 1.98 A, open-circuit voltage (Voc) of 0.62 V, and fill factor (FF) of 0.76, which led to maximum power (Pmax) of 0.93 W and PCE of 15.5%. After the solar cells were attached to the edge of the luminescent waveguide, the resulting LSC exhibited Isc of 4.67 A, Voc of 0.64 V, and FF of 0.71, which led to Pmax of 2.12 W and PCE of 2.36%. According to these results, the geometric gain (G, defined as the area of the LSC relative to that of the solar cells) and the concentration ratio (C, defined as the maximum power of the LSC relative to that of the solar cells) of the LSC were 15 and 2.28, respectively. Although the PCE of the LSC was much lower than that of the solar cells, the electrical power from the LSC was more than twice (C = 2.28) that from the solar cells, which indicated that the LSC could reduce the cost of the PV devices by using fewer solar cells while producing more electrical power.
We also measured the edge emission spectrum of the luminescent waveguide and compared it with the EQE of the solar cells. As depicted in Figure 2b, the edge emission maximized at 642 nm, which was close to the highest EQE value (ca. 0.9) of the solar cells. It is noted that the PCE of the LSC can be further improved using luminophores with more red-shifted emission spectra compared with R305. We also measured the EQE of the LSC. Figure 2c signifies that the EQE was strong (up to 0.35 or 35%) before 650 nm but weak (<0.05 or 5%) after 650 nm. The strong EQE was due to the absorption of R305 [15], while the weak EQE was due to the scattering of the luminescent waveguide, which was consistent with previous results [40].
We also studied the photostability of the LSC. The PCE of the LSC was intermittently measured up to 512 days. Figure 2d demonstrates that the PCE of the LSC is 2.17% after 256 and 512 days, which is an 8% drop compared with the initial PCE of 2.36%. Based on the results, we believed that the LSC could sustain at least 90% of its initial PCE, and its lifetime could be comparable to commercial solar panels.
3.2. PT Properties
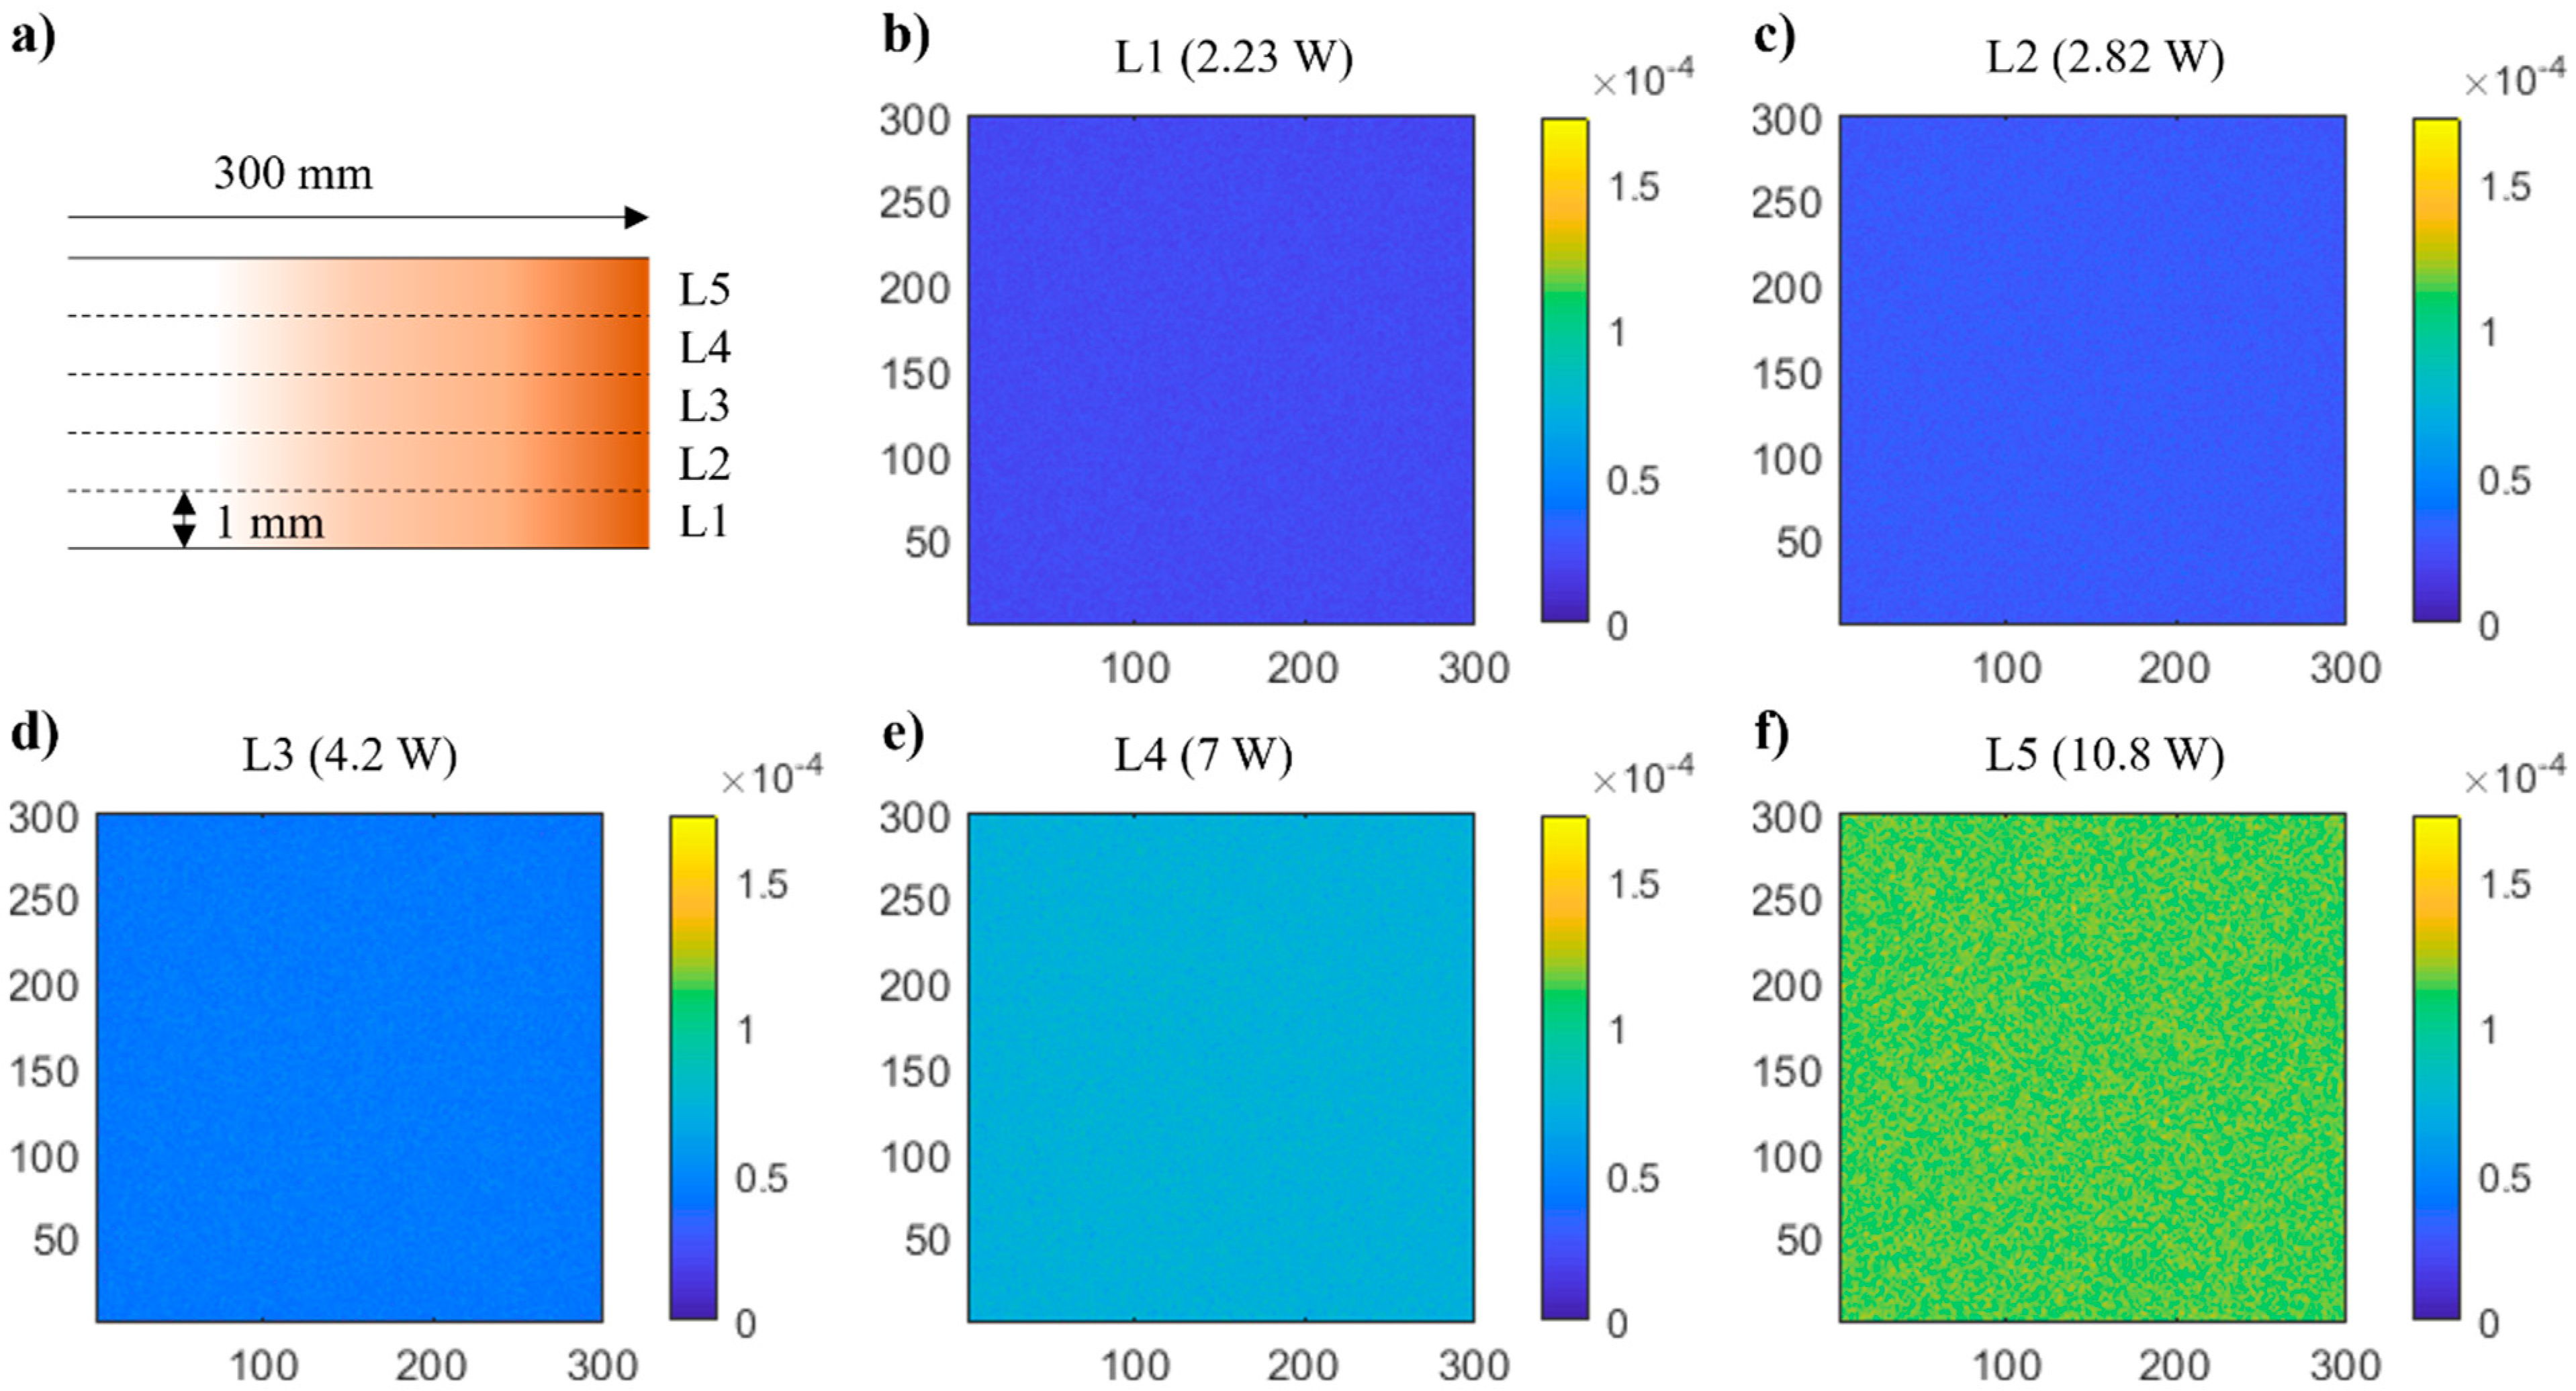
After obtaining the PV properties of the LSC, we then investigated the PT properties by performing a Monte Carlo ray-tracing simulation on the luminescent waveguide. The PT energy consists of the Stokes’ loss (i.e., loss of the excitation energy) of the luminophores and the photon absorbance of the host matrix. In the simulation, we configured the LSC with 5 layers of equal thickness and simulated the heat map of each layer, as shown in Figure 3. The results indicated that the PT power was produced uniformly on each layer. The bottom layer (L1) produced the least PT power (2.23 W) and the top layer (L5) produced the most PT power (10.8 W), which were 8.2% and 39.9% of the total PT power (27.05 W), respectively. The results also suggested that the total PT power (27.05 W) of the luminescent waveguide was significantly higher than the PV power (i.e., Pmax) (2.12 W) of the LSC.
3.3. Projected Performance
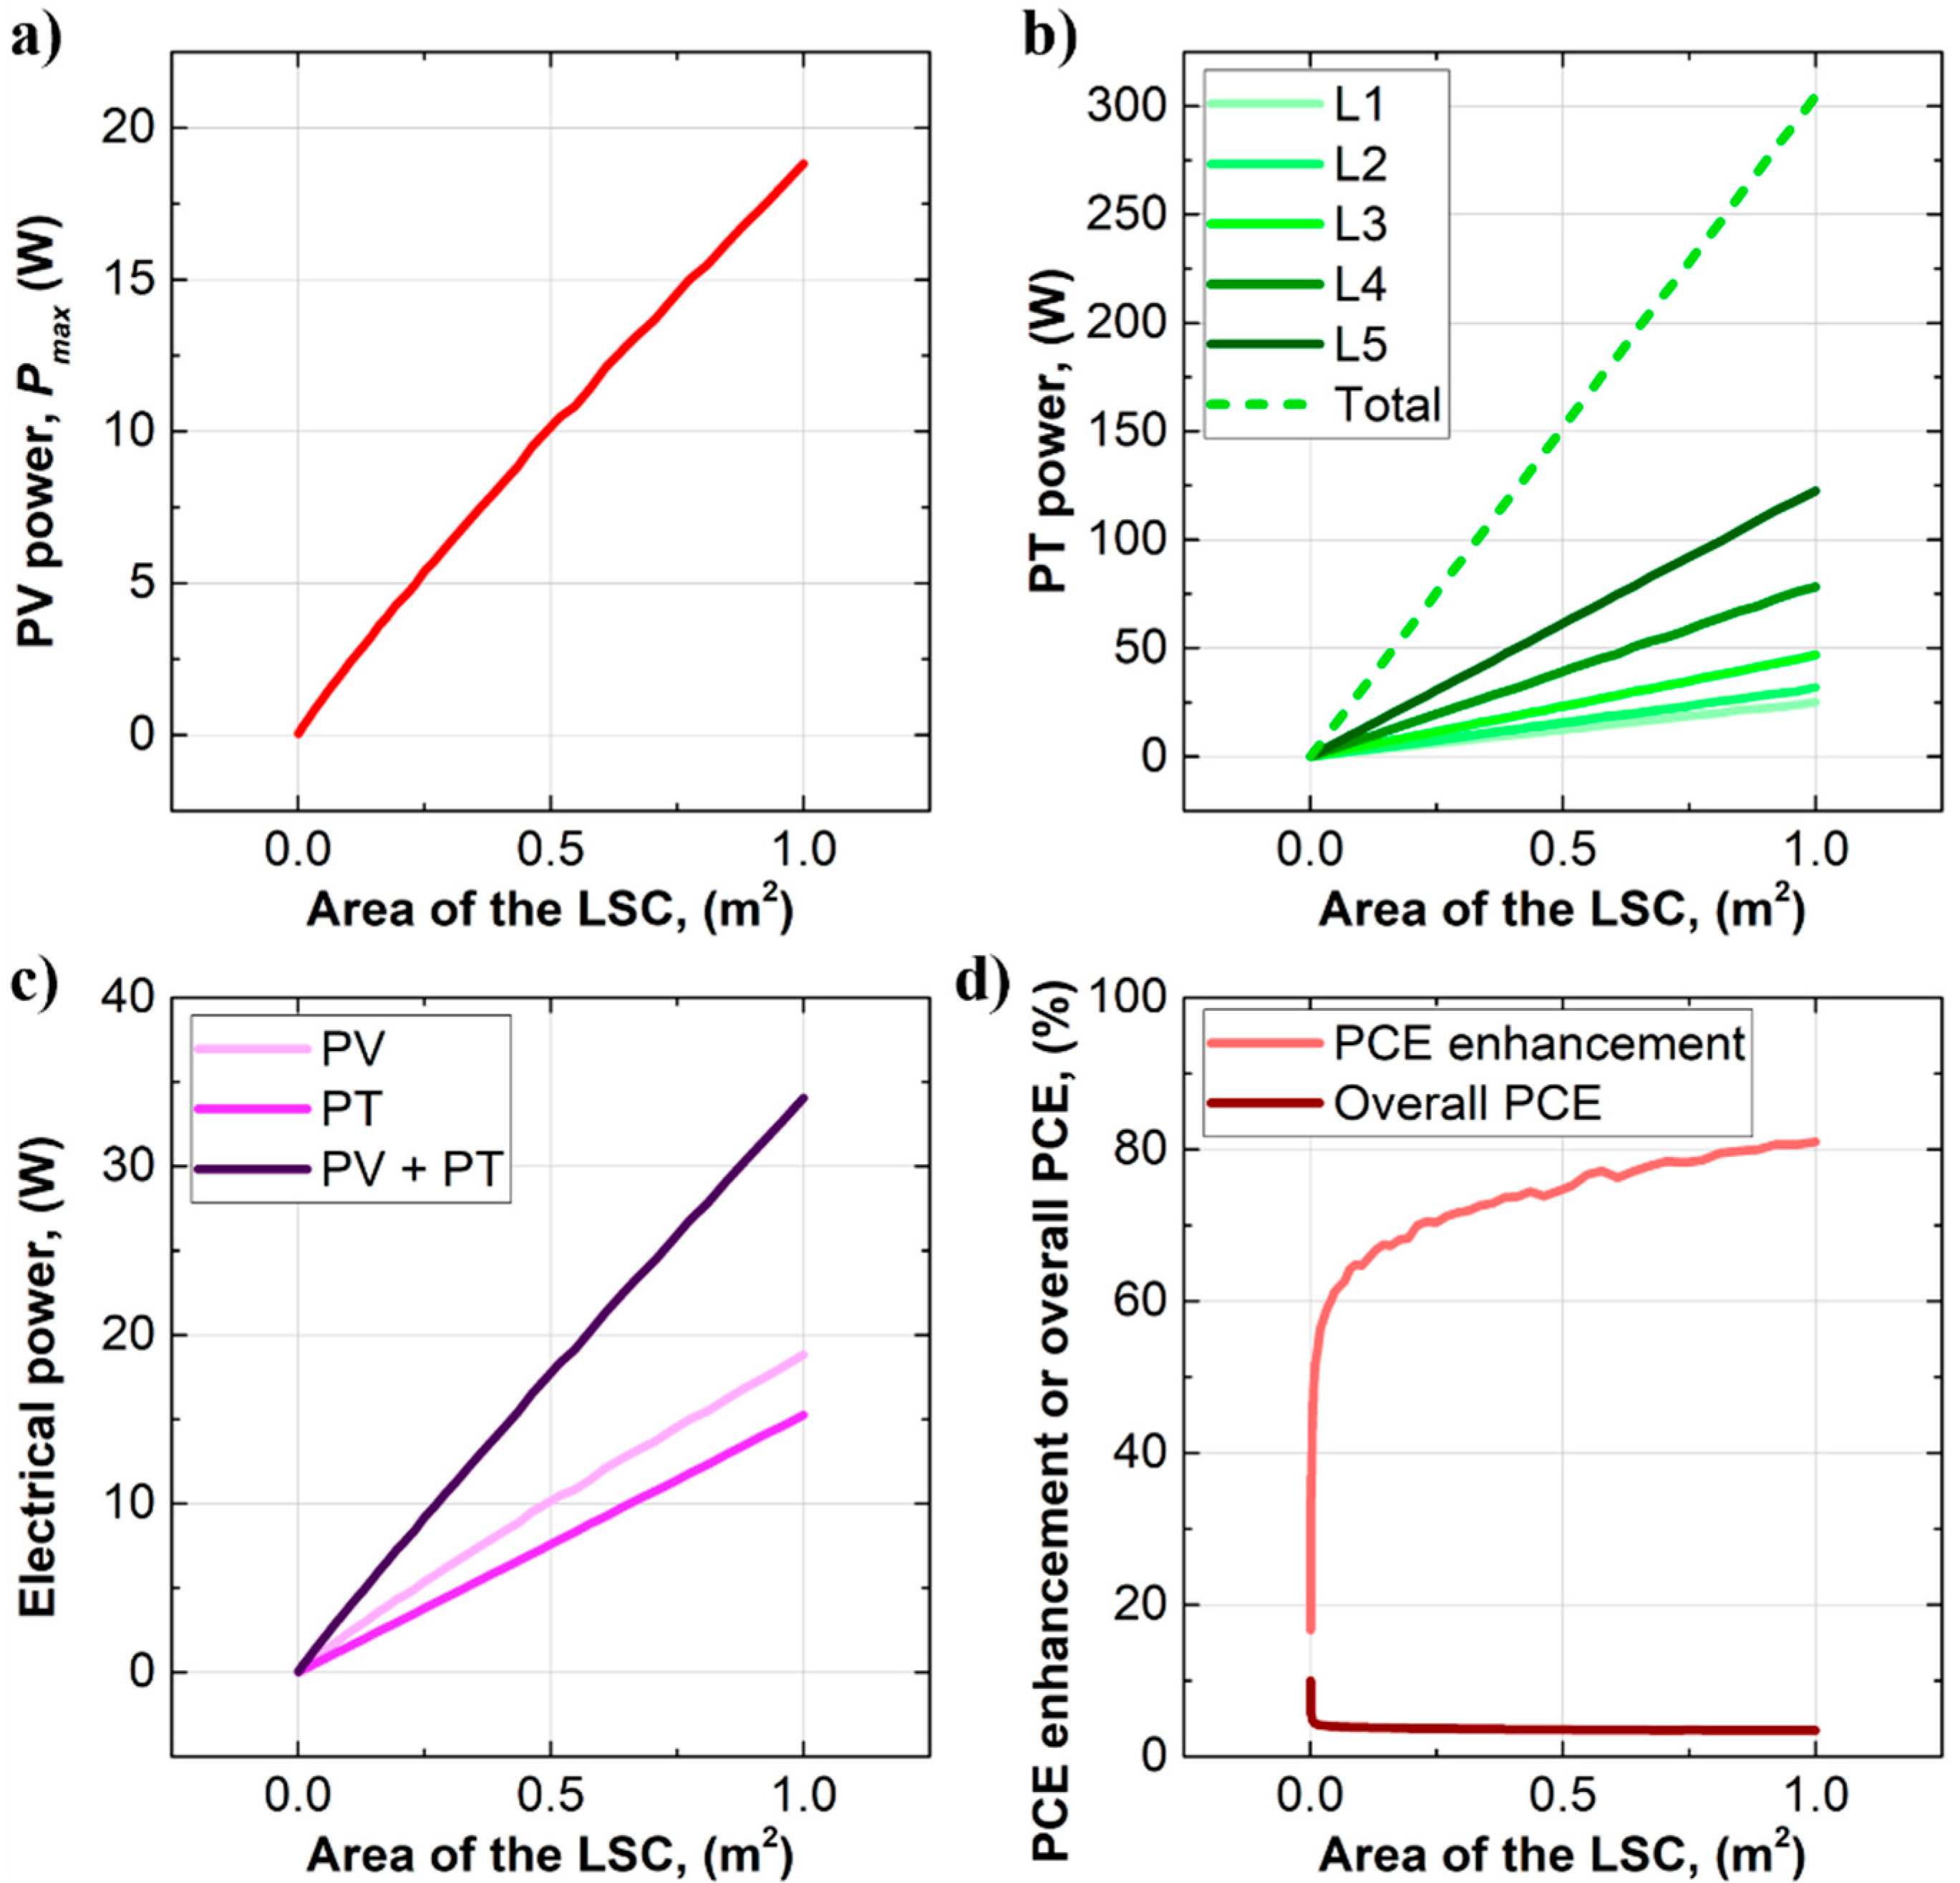
We also used the Monte Carlo ray-tracing simulation to project the performance of the LSC of up to 1 m2. Figure 4a shows a nearly linear relationship between the PV power (i.e., Pmax) and the area of the LSC. For a device of 0.09 m2, the calculated Pmax was 2.09 W, which was consistent with the Pmax in our experiment (2.12 W). When the area of the LSC was increased to 1 m2, the Pmax was increased to 18.8 W, which corresponded to a PCE of 1.88%. Figure 4b depicts the PT power of each layer in the luminescent waveguide with increasing area of the LSC. The results indicated a nearly linear relationship between the PT power of each layer and the area of the LSC. The results were consistent with our experiment, suggesting that the PT power increased from L1 to L5. For an LSC of 1 m2, the total PT power was 305 W, which was more than 15 times the Pmax (18.8 W). Considering a 5% thermoelectric efficiency, the total electrical power could be as high as 34.1 W (=18.8 W + 305 W × 5%) for an LSC of 1 m2, as signified in Figure 4c. Figure 4d demonstrates that the PCE of the LSC could be enhanced by 81% (=305 W × 5%/18.8 W) and the overall PCE could reach 3.41%.
4. Conclusions
In this report, we conducted a preliminary investigation on the PT properties of an LSC with dimensions of 300 mm × 300 mm × 5 mm. The PV properties were measured, and the LSC exhibited a PCE of 2.36% with a C of 2.28. The PT properties were studied using the Monte Carlo ray-tracing simulation. The results showed increasing PT power from the bottom to the top layer of the LSC with a total PT power of 27.05 W. We also investigated the projected performance of the LSC of up to 1 m2. For a device of 1 m2, the PV and PT-based electrical power could be as high as 34.1 W, corresponding to an overall PCE of 3.41%. The utilization of PT energy paves a new way to improve the performance of LSCs.
Author Contributions
Conceptualization, Y.L.; Investigation, Y.L.; Resources, Y.S.; Software, Y.Z.; Writing—original draft preparation, Y.L.; Writing—review & editing, Y.S., Y.Z. and W.D. All authors have read and agreed to the published version of the manuscript.
Funding
This research received no external funding.
Institutional Review Board Statement
Not applicable.
Informed Consent Statement
Not applicable.
Acknowledgments
This work is a part of the project Energy-Harvesting Windows and Panels. The authors would like to thank Solera City Energy for research support and Solarathlon for simulation service.
Conflicts of Interest
The authors declare no conflict of interest.
References
- Kammen, D.M.; Sunter, D.A. City-integrated renewable energy for urban sustainability. Science 2016, 352, 922–928. [Google Scholar] [CrossRef] [PubMed] [Green Version]
- Villa-Arrieta, M.; Sumper, A. Economic evaluation of nearly zero energy cities. Appl. Energy 2019, 237, 404–416. [Google Scholar] [CrossRef]
- Thellufsen, J.Z.; Lund, H.; Sorknæs, P.; Østergaard, P.A.; Chang, M.; Drysdale, D.; Nielsen, S.; Djørup, S.R.; Sperling, K. Smart energy cities in a 100% renewable energy context. Renew. Sustain. Energy Rev. 2020, 129, 109922. [Google Scholar] [CrossRef]
- Tsalikis, G.; Martinopoulos, G. Solar energy systems potential for nearly net zero energy residential buildings. Sol. Energy 2015, 115, 743–756. [Google Scholar] [CrossRef]
- Good, C.; Andresen, I.; Hestnes, A.G. Solar energy for net zero energy buildings—A comparison between solar thermal, PV and photovoltaic-thermal (PV/T) systems. Sol. Energy 2015, 122, 986–996. [Google Scholar] [CrossRef] [Green Version]
- Vanaga, R.; Blumberga, A.; Freimanis, R.; Mols, T.; Blumberga, D. Solar facade module for nearly zero energy building. Energy 2018, 157, 1025–1034. [Google Scholar] [CrossRef]
- Holliday, S.; Li, Y.; Luscombe, C.K. Recent advances in high performance donor-acceptor polymers for organic photovoltaics. Prog. Polym. Sci. 2017, 70, 34–51. [Google Scholar] [CrossRef]
- Hestnes, A.G. Building integration of solar energy systems. Sol. Energy 1999, 67, 181–187. [Google Scholar] [CrossRef]
- Chwieduk, D. Towards sustainable-energy buildings. Appl. Energy 2003, 76, 211–217. [Google Scholar] [CrossRef]
- Baetens, R.; Jelle, B.P.; Gustavsen, A. Properties, requirements and possibilities of smart windows for dynamic daylight and solar energy control in buildings: A state-of-the-art review. Sol. Energy Mater. Sol. Cells 2010, 94, 87–105. [Google Scholar] [CrossRef] [Green Version]
- Poulek, V.; Šafránková, J.; Černá, L.; Libra, M.; Beránek, V.; Finsterle, T.; Hrzina, P. PV Panel and PV Inverter Damages Caused by Combination of Edge Delamination, Water Penetration, and High String Voltage in Moderate Climate. IEEE J. Photovolt. 2021, 11, 561–565. [Google Scholar] [CrossRef]
- Debije, M.G.; Verbunt, P.P.C. Thirty years of luminescent solar concentrator research: Solar energy for the built environment. Adv. Energy Mater. 2012, 2, 12–35. [Google Scholar] [CrossRef]
- Reinders, A.; Kishore, R.; Slooff, L.; Eggink, W. Luminescent solar concentrator photovoltaic designs. Jpn. J. Appl. Phys. 2018, 57, 08RD10. [Google Scholar] [CrossRef]
- Roncali, J. Luminescent solar collectors: Quo vadis? Adv. Energy Mater. 2020, 10, 2001907. [Google Scholar] [CrossRef]
- Li, Y.; Sun, Y.; Zhang, Y. Luminescent solar concentrators performing under different light conditions. Sol. Energy 2019, 188, 1248–1255. [Google Scholar] [CrossRef]
- Weber, W.H.; Lambe, J. Luminescent greenhouse collector for solar radiation. Appl. Opt. 1976, 15, 2299–2300. [Google Scholar] [CrossRef] [PubMed]
- Goetzberger, A.; Greube, W. Solar energy conversion with fluorescent collectors. Appl. Phys. 1977, 14, 123–139. [Google Scholar] [CrossRef]
- Li, Y.; Zhang, X.; Zhang, Y.; Dong, R.; Luscombe, C.K. Review on the role of polymers in luminescent solar concentrators. J. Polym. Sci. A 2019, 57, 201–215. [Google Scholar] [CrossRef] [Green Version]
- Li, Y.; Scudiero, L.; Ren, T.; Dong, W.-J. Synthesis and characterizations of benzothiadiazole-based fluorophores as potential wavelength-shifting materials. J. Photochem. Photobiol. A 2012, 231, 51–59. [Google Scholar] [CrossRef]
- Li, Y.; Ren, T.; Dong, W.-J. Tuning photophysical properties of triphenylamine and aromatic cyano conjugate-based wavelength-shifting compounds by manipulating intramolecular charge transfer strength. J. Photochem. Photobiol. A 2013, 251, 1–9. [Google Scholar] [CrossRef]
- Li, Y.; Li, Z.; Wang, Y.; Compaan, A.; Ren, T.; Dong, W.-J. Increasing the power output of a CdTe solar cell via luminescent down shifting molecules with intramolecular charge transfer and aggregation-induced emission characteristics. Energy Environ. Sci. 2013, 6, 2907–2911. [Google Scholar] [CrossRef]
- Li, Y.; Li, Z.; Ablekim, T.; Ren, T.; Dong, W.J. Rational design of tetraphenylethylene-based luminescent down-shifting molecules: Photophysical studies and photovoltaic applications in a CdTe solar cell from small to large units. Phys. Chem. Chem. Phys. 2014, 16, 26193–26202. [Google Scholar] [CrossRef]
- Li, Y.; Olsen, J.; Dong, W.J. Enhancing the output current of a CdTe solar cell via a CN-free hydrocarbon luminescent down-shifting fluorophore with intramolecular energy transfer and restricted internal rotation characteristics. Photochem. Photobiol. Sci. 2015, 14, 833–841. [Google Scholar] [CrossRef] [PubMed]
- Li, Y.; Olsen, J.; Nunez-Ortega, K.; Dong, W.-J. A structurally modified perylene dye for efficient luminescent solar concentrators. Sol. Energy 2016, 136, 668–674. [Google Scholar] [CrossRef]
- Zhou, Y.; Zhao, H.; Ma, D.; Rosei, F. Harnessing the properties of colloidal quantum dots in luminescent solar concentrators. Chem. Soc. Rev. 2018, 47, 5866–5890. [Google Scholar] [CrossRef]
- Freitas, V.T.; Fu, L.; Cojocariu, A.M.; Cattoën, X.; Bartlett, J.R.; Parc, R.L.; Bantignies, J.-L.; Man, M.W.C.; André, P.S.; Ferreira, R.A.S.; et al. Eu3+-based bridged silsesquioxanes for transparent luminescent solar concentrators. ACS Appl. Mater. Interfaces 2015, 7, 8770–8778. [Google Scholar] [CrossRef] [PubMed]
- Tseng, J.K.; Chen, Y.J.; Pan, C.T.; Wu, T.T.; Chung, M.H. Application of optical film with micro-lens array on a solar concentrator. Sol. Energy 2011, 85, 2167–2178. [Google Scholar] [CrossRef]
- Chandra, S.; Doran, J.; McCormack, S.J.; Kennedy, M.; Chattenc, A.J. Enhanced quantum dot emission for luminescent solar concentrators using plasmonic interaction. Sol. Energy Mater. Sol. Cells 2012, 98, 385–390. [Google Scholar] [CrossRef] [Green Version]
- Debije, M.G.; Van, M.P.; Verbunt, P.P.; Kastelijn, M.J.; van der Blom, R.H.; Broer, D.J.; Bastiaansen, C.W. Effect on the output of a luminescent solar concentrator on application of organic wavelength-selective mirrors. Appl. Opt. 2010, 49, 745–751. [Google Scholar] [CrossRef]
- Xu, L.; Yao, Y.; Bronstein, N.D.; Li, L.; Alivisatos, A.P.; Nuzzo, R.G. Enhanced photon collection in luminescent solar concentrators with distributed bragg reflectors. ACS Photonics 2016, 3, 278–285. [Google Scholar] [CrossRef] [Green Version]
- Slooff, L.H.; Bende, E.E.; Burgers, A.R.; Budel, T.; Pravettoni, M.; Kenny, R.P.; Dunlop, E.D.; Büchtemann, A. A luminescent solar concentrator with 7.1% power conversion efficiency. Phys. Status Solidi RRL 2008, 2, 257–259. [Google Scholar] [CrossRef] [Green Version]
- Goldschmidt, J.C.; Peters, M.; Bösch, A.; Helmers, H.; Dimroth, F.; Glunz, S.W.; Willeke, G. Increasing the efficiency of fluorescent concentrator systems. Sol. Energy Mater. Sol. Cells 2009, 93, 176–182. [Google Scholar] [CrossRef]
- Desmet, L.; Ras, A.J.; de Boer, D.K.; Debije, M.G. Monocrystalline silicon photovoltaic luminescent solar concentrator with 4.2% power conversion efficiency. Opt. Lett. 2012, 37, 3087–3089. [Google Scholar] [CrossRef]
- Li, Y.; Sun, Y.; Zhang, Y.; Li, Y.; Verduzco, R. High-performance hybrid luminescent-scattering solar concentrators based on a luminescent conjugated polymer. Polym. Int. 2021, 70, 475–482. [Google Scholar] [CrossRef]
- Mateen, F.; Li, Y.; Saeed, M.A.; Sun, Y.; Zhang, Y.; Lee, S.Y.; Hong, S.-K. Large-area luminescent solar concentrator utilizing donor-acceptor luminophore with nearly zero reabsorption: Indoor/outdoor performance evaluation. J. Lumin. 2021, 231, 117837. [Google Scholar] [CrossRef]
- Hernandez-Noyola, H.; Potterveld, D.H.; Holt, R.J.; Darling, S.B. Optimizing luminescent solar concentrator design. Energy Environ. Sci. 2012, 5, 5798–5802. [Google Scholar] [CrossRef]
- Li, Y.; Sun, Y.; Zhang, Y. Boosting the cost-effectiveness of luminescent solar concentrators through subwavelength sanding treatment. Sol. Energy 2020, 198, 151–159. [Google Scholar] [CrossRef]
- Li, Y.; Sun, Y.; Zhang, Y. Regional measurements to analyze large-area luminescent solar concentrators. Renew. Energy 2020, 160, 127–135. [Google Scholar] [CrossRef]
- Li, Y.; Sun, Y.; Zhang, Y.; Dong, W.-J. Improving the photostability of printed organic photovoltaics through luminescent solar concentrators. Opt. Mater. 2020, 108, 110194. [Google Scholar] [CrossRef]
- Li, Y.; Zhang, Y.; Sun, Y.; Ren, T. Spectral response of large-area luminescent solar concentrators. Appl. Opt. 2020, 59, 8964–8969. [Google Scholar] [CrossRef]
Figure 1.
(a) A picture of luminescent waveguide under ultraviolet (UV) light, showing highly intensive luminescent light from the edge of the luminescent waveguide, and (b) operational mechanism of LSCs. Incident photons are absorbed and converted to luminescent photons, which transport to the edges of the luminescent waveguide through successive TIR and are delivered to solar cells.

Figure 2.
(a) I–V curves of the parallel-connected solar cells and the LSC, (b) edge emission spectrum of the luminescent waveguide (normalized to 0.8) and EQE of the solar cells, (c) EQE of the LSC, and (d) photostability of the LSC.
Figure 2.
(a) I–V curves of the parallel-connected solar cells and the LSC, (b) edge emission spectrum of the luminescent waveguide (normalized to 0.8) and EQE of the solar cells, (c) EQE of the LSC, and (d) photostability of the LSC.

Figure 3.
(a) Layer configuration of the LSC, and (b–f) heat maps of the layers (color bars with the unit of W).
Figure 3.
(a) Layer configuration of the LSC, and (b–f) heat maps of the layers (color bars with the unit of W).

Figure 4.
(a) Relationship between the Pmax and the area of the LSC, (b) the PT power of each layer in the luminescent waveguide and the total PT power with increasing the area of the LSC, (c) the PV and/or PT-based electrical power of the LSC with increasing the area of the LSC, and (d) the PCE enhancement and the overall PCE with increasing the area of the LSC.

Publisher’s Note: MDPI stays neutral with regard to jurisdictional claims in published maps and institutional affiliations. |
© 2021 by the authors. Licensee MDPI, Basel, Switzerland. This article is an open access article distributed under the terms and conditions of the Creative Commons Attribution (CC BY) license (https://creativecommons.org/licenses/by/4.0/).
Share and Cite
MDPI and ACS Style
Li, Y.; Sun, Y.; Zhang, Y.; Dong, W. A Preliminary Investigation on the Photothermal Properties of Luminescent Solar Concentrators. Optics 2021, 2, 148-154. https://0-doi-org.brum.beds.ac.uk/10.3390/opt2030014
AMA Style
Li Y, Sun Y, Zhang Y, Dong W. A Preliminary Investigation on the Photothermal Properties of Luminescent Solar Concentrators. Optics. 2021; 2(3):148-154. https://0-doi-org.brum.beds.ac.uk/10.3390/opt2030014
Chicago/Turabian StyleLi, Yilin, Yujian Sun, Yongcao Zhang, and Wenji Dong. 2021. "A Preliminary Investigation on the Photothermal Properties of Luminescent Solar Concentrators" Optics 2, no. 3: 148-154. https://0-doi-org.brum.beds.ac.uk/10.3390/opt2030014