Surface Characterization of Carbonaceous Materials Using Inverse Gas Chromatography: A Review

 , ,
, ,
Abstract
:1. Introduction
2. Theoretical Background of Inverse Gas Chromatography
2.1. Dispersive Component of Surface Free Energy
2.1.1. Schultz Method
2.1.2. Dorris–Gray Method
2.1.3. Comparison of Schultz and Dorris–Gray Methods
2.2. Specific Component of Surface Free Energy
3. Applications of IGC for Carbonaceous Materials
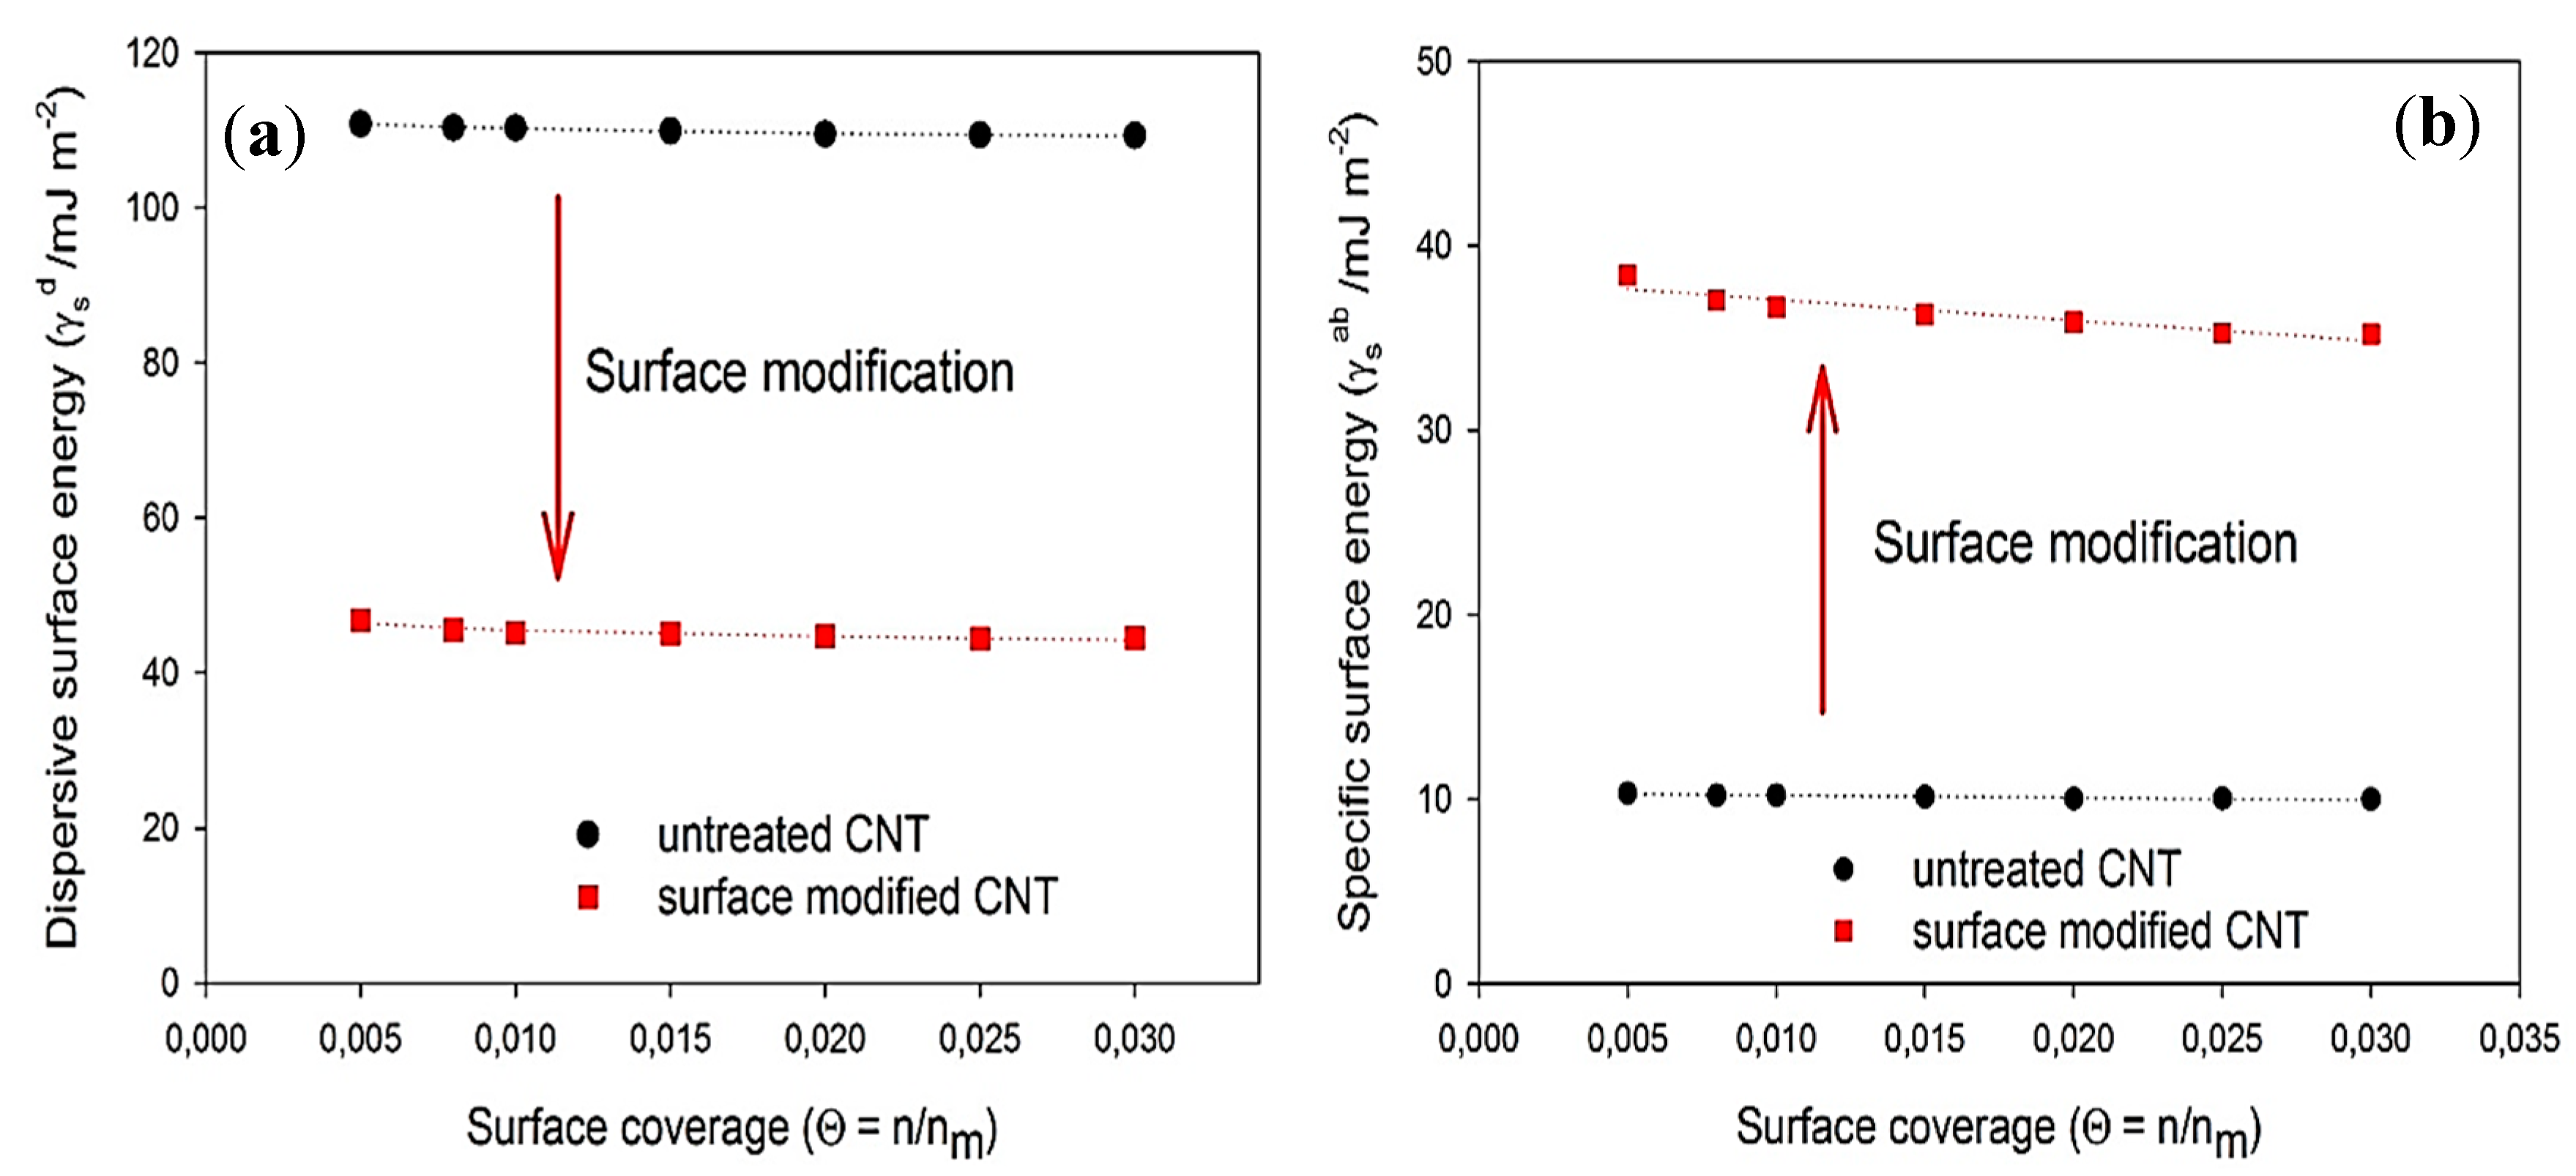
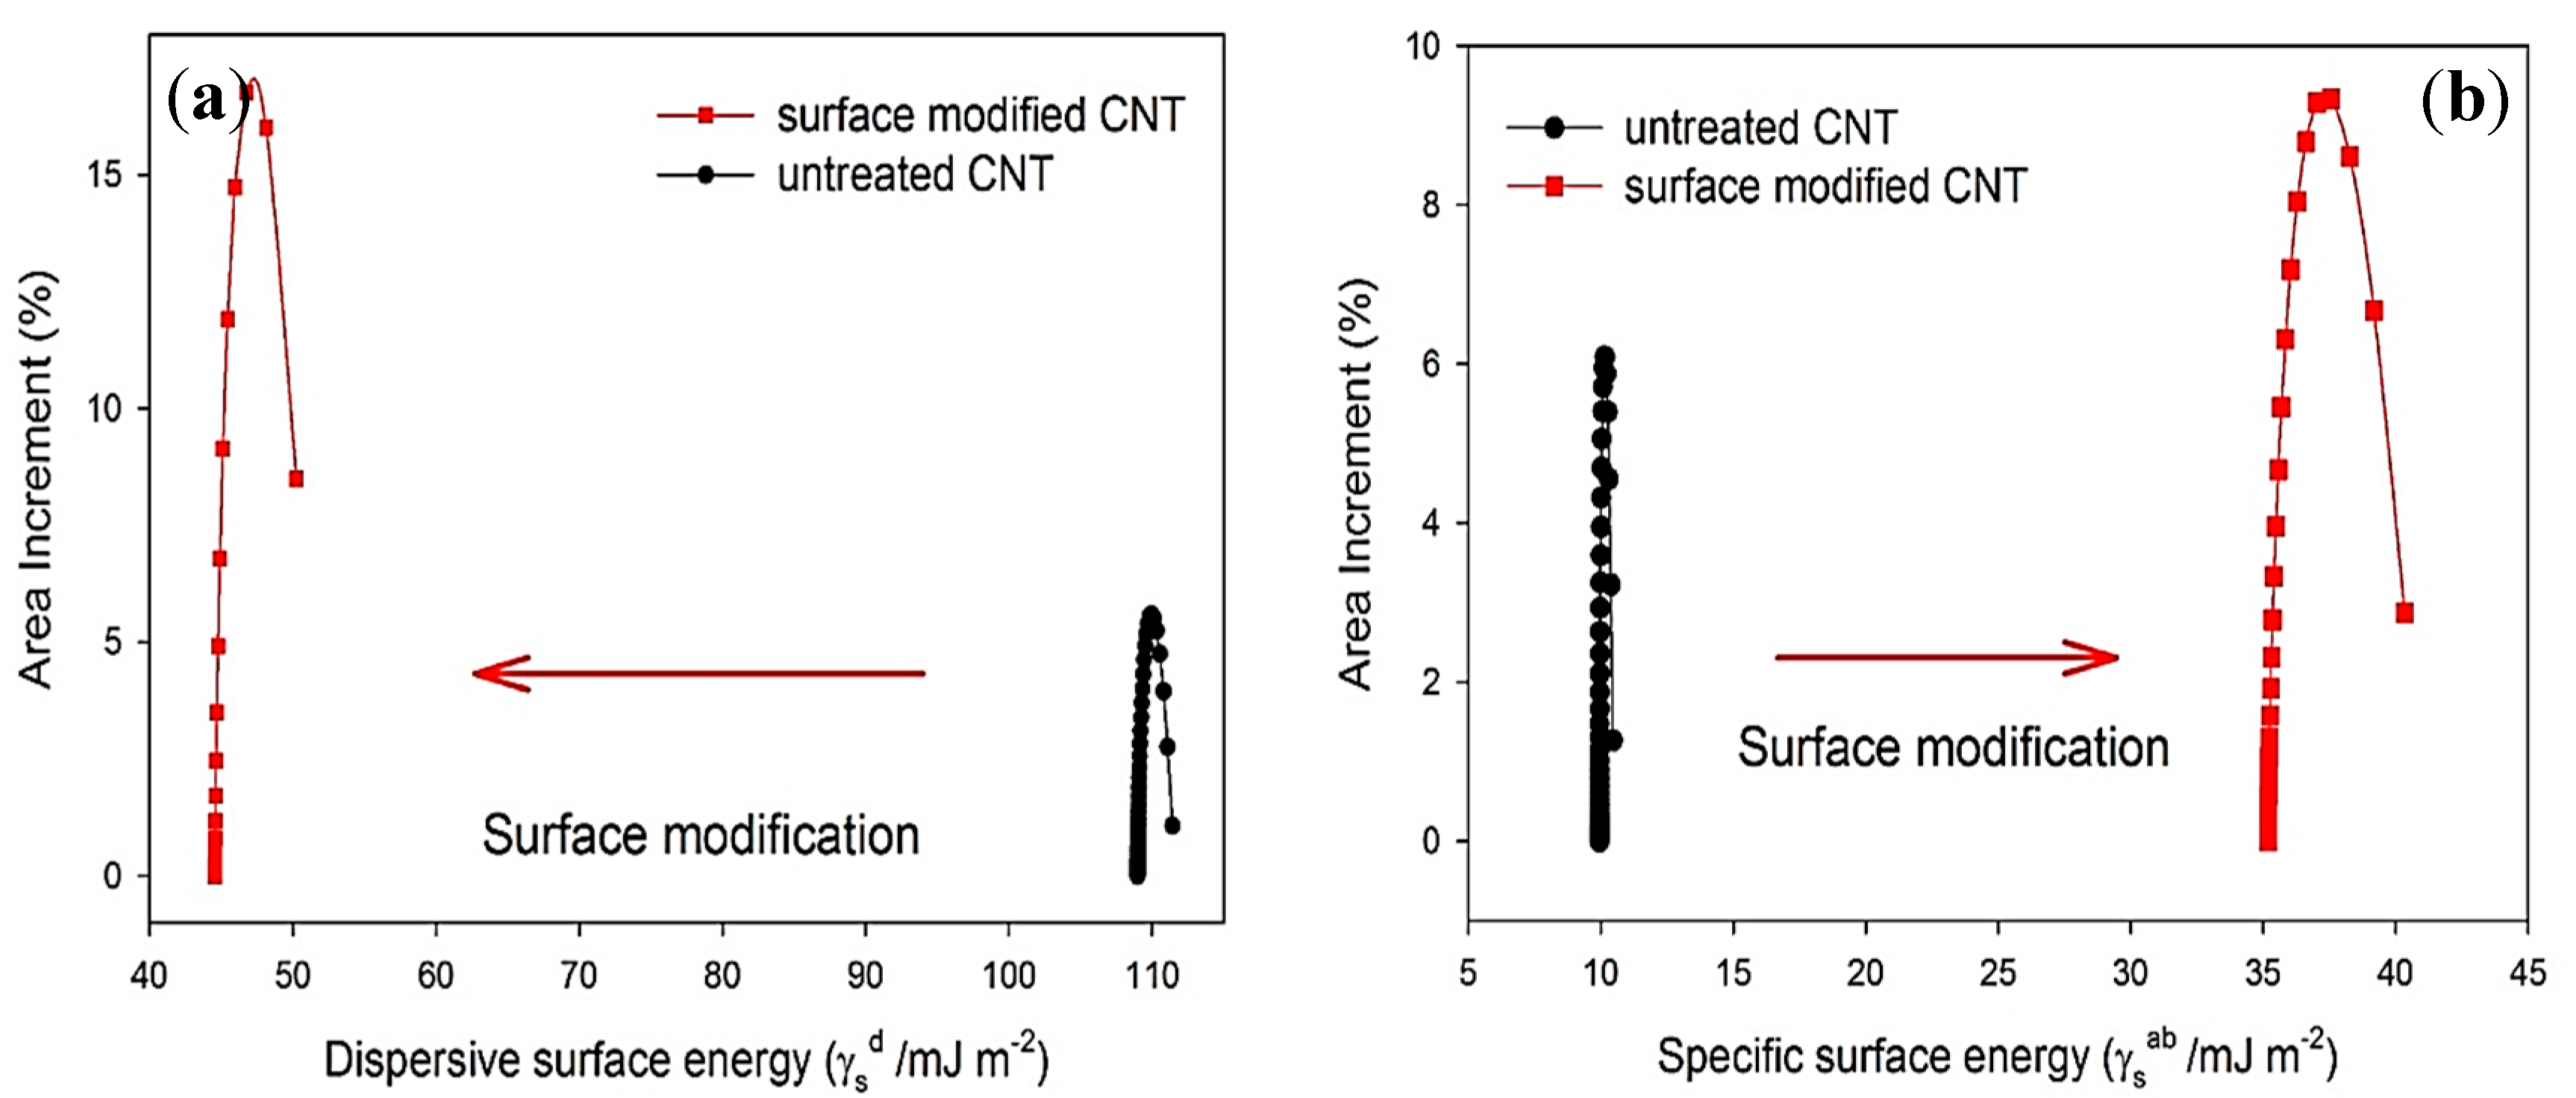
3.1. Carbon Nanotubes
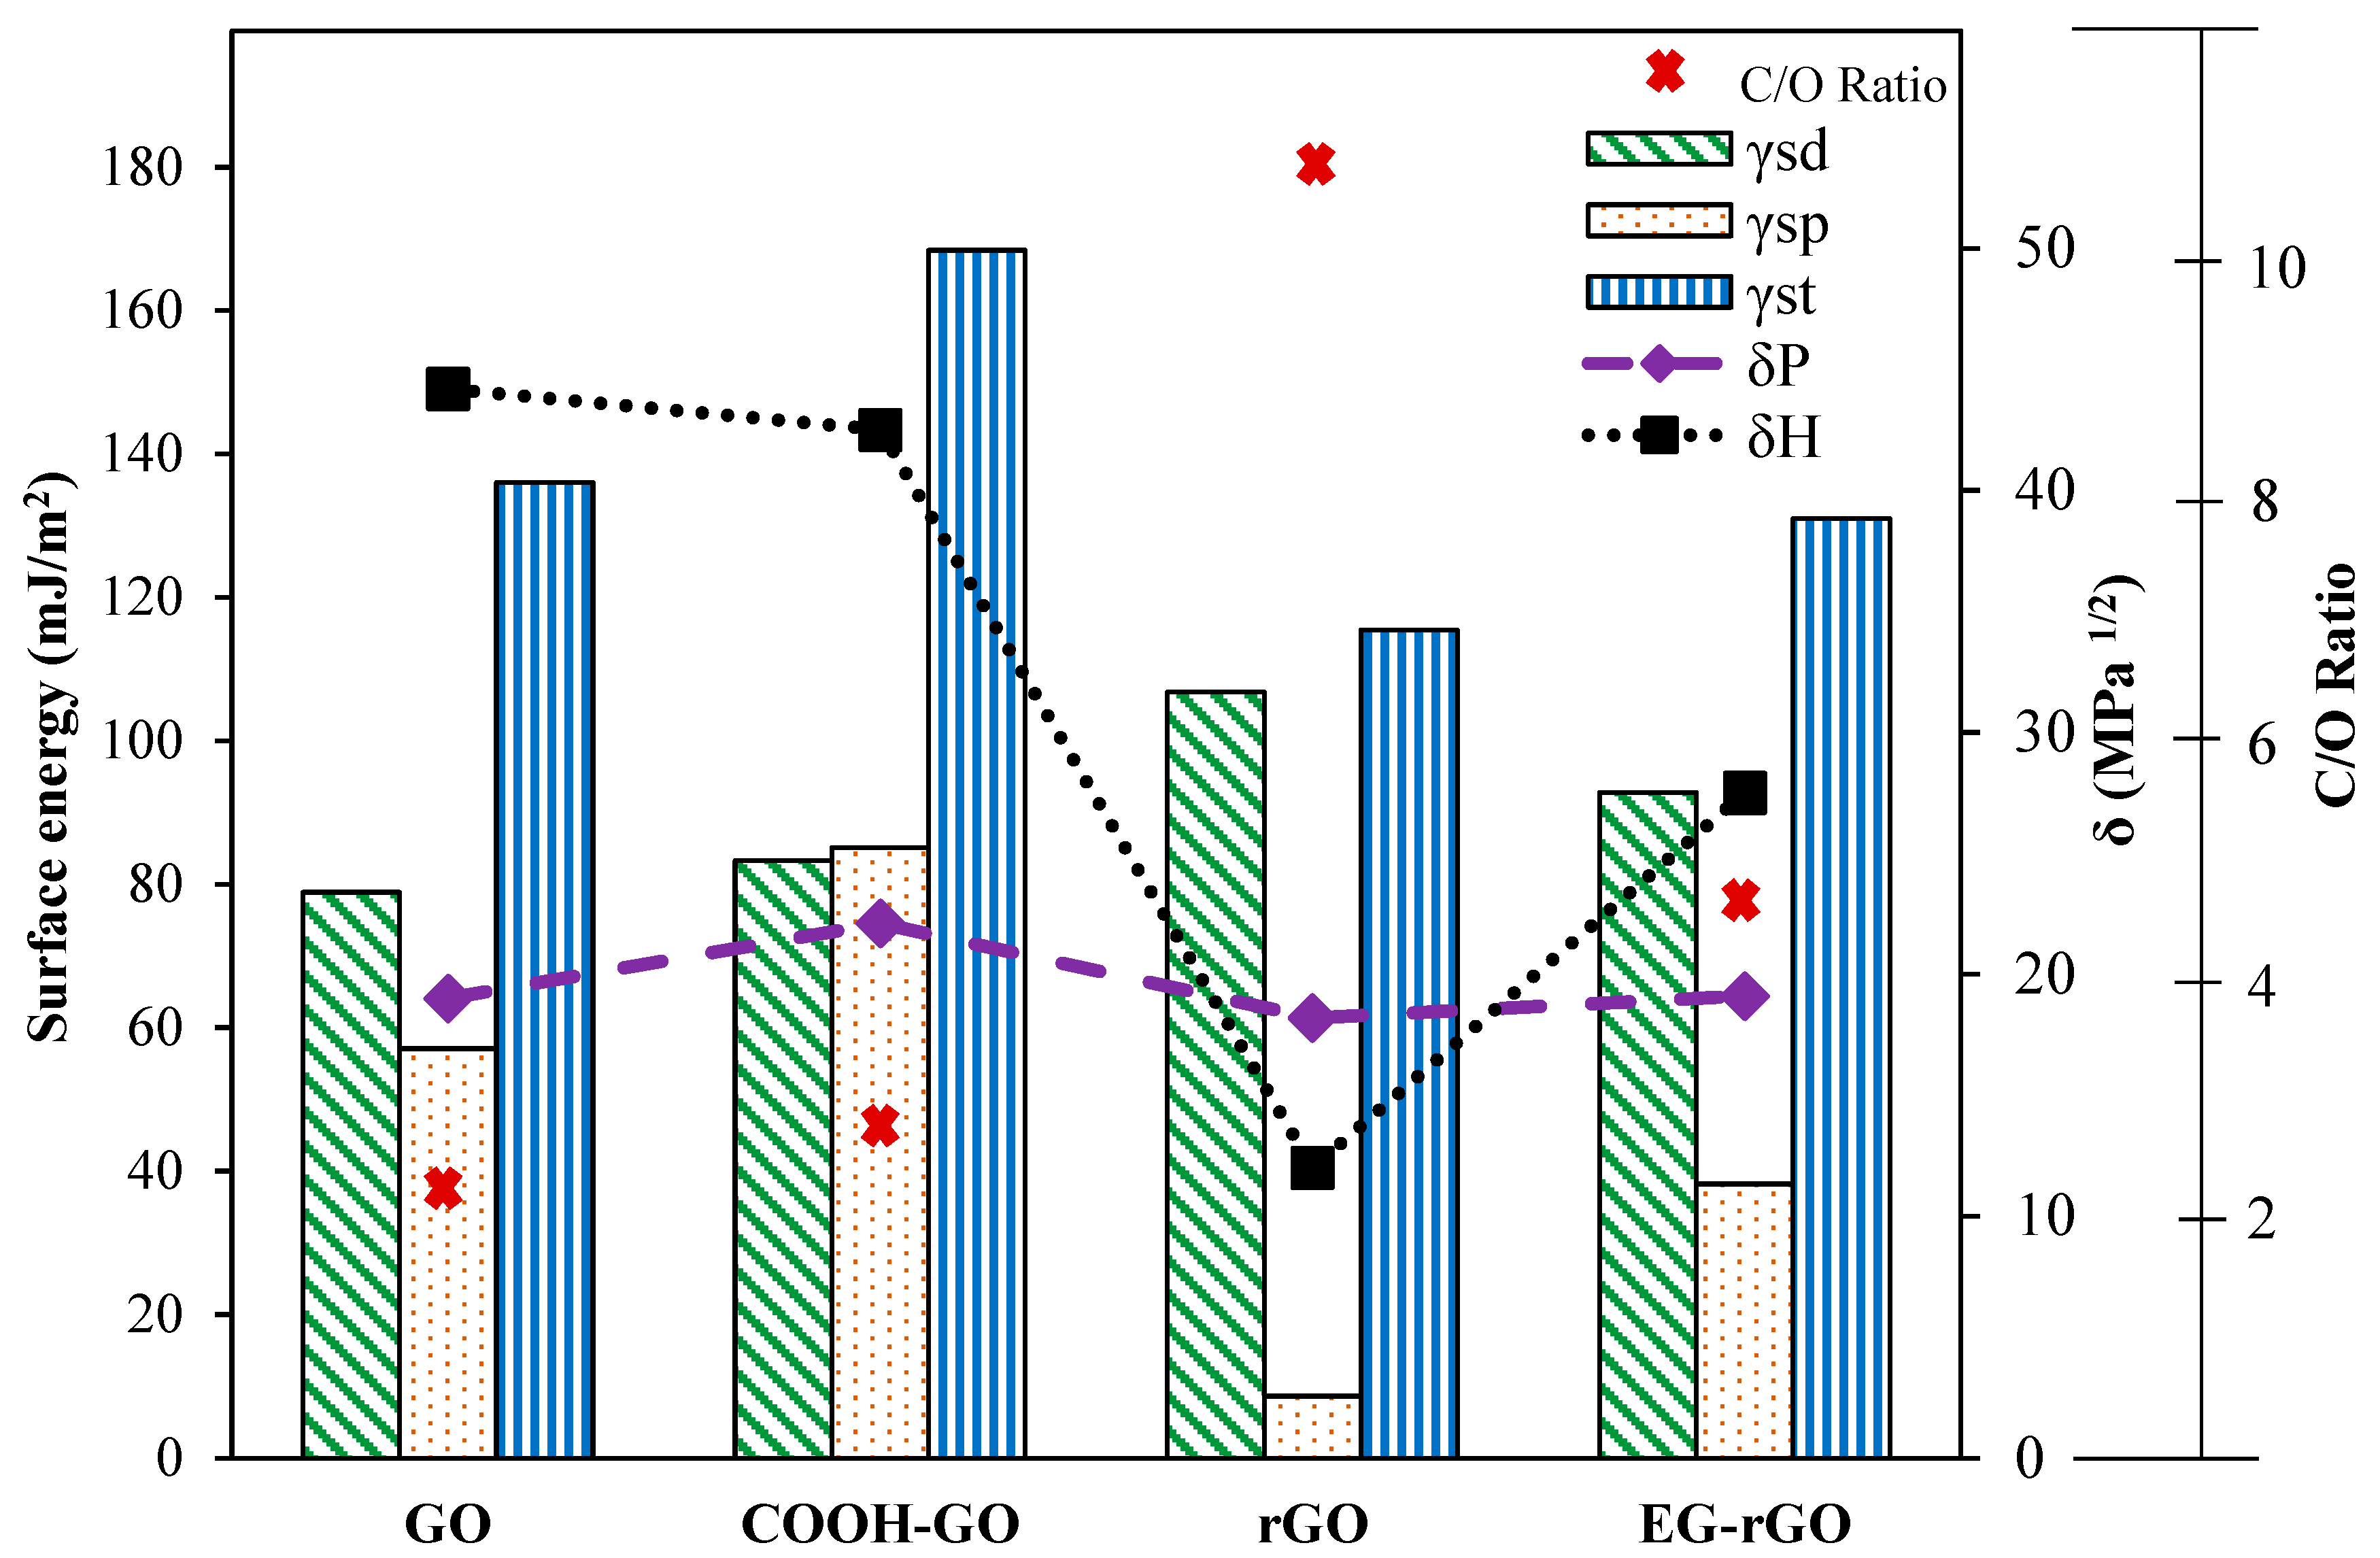
3.2. Graphite and Graphene
3.3. Activated Carbon and Carbon Fibers
4. Conclusions
Author Contributions
Funding
Acknowledgments
Conflicts of Interest
References
- Davis, T.C.; Petersen, J.C. Adaptation of inverse gas-liquid chromatography to asphalt oxidation studies. Anal. Chem. 1966, 38, 1938–1940. [Google Scholar] [CrossRef]
- Voelkel, A. Inverse gas chromatography in characterization of surface. Chemom. Intell. Lab. 2004, 72, 205–207. [Google Scholar] [CrossRef]
- Balard, H. Notes on Inverse Gas Chromatography. 2015. Available online: https://www.researchgate.net/publication/279955104_Notes_on_Inverse_Gas_Chromatography (accessed on 1 August 2020). [CrossRef]
- Mohammadi-Jam, S.; Waters, K. Inverse gas chromatography applications: A review. Adv. Colloid Interface Sci. 2014, 212, 21–44. [Google Scholar] [CrossRef]
- Schultz, J.A.; Lavielle, L.; Martin, C. The role of the interface in carbon fibre-epoxy composites. J. Adhes. 1987, 23, 45–60. [Google Scholar] [CrossRef]
- Dorris, G.M.; Gray, D.G. Adsorption of n-alkanes at zero surface coverage on cellulose paper and wood fibers. J. Colloid. Interface Sci. 1980, 77, 353–362. [Google Scholar] [CrossRef]
- Schultz, J.; Lavielle, L. Interfacial Properties of Carbon Fiber—Epoxy Matrix Composites; ACS Publications: Washington, DC, USA, 1989. [Google Scholar]
- Voelkel, A. Physicochemical measurements (inverse gas chromatography). In Gas Chromatography; Elsevier: Amsterdam, The Netherlands, 2012; pp. 477–494. [Google Scholar]
- Ho, R.; Heng, J.Y. A review of inverse gas chromatography and its development as a tool to characterize anisotropic surface properties of pharmaceutical solids. KONA Powder Part J. 2013, 30, 164–180. [Google Scholar] [CrossRef] [Green Version]
- Lloyd, D.R.; Ward, T.C.; Schreiber, H.P. Inverse Gas Chromatography; American Chemical Society: Washington, DC, USA, 1989. [Google Scholar]
- Grobler, A.; Balizs, G. Computer program for a statistical calculation of retention indices. J. Chromatogr. Sci. 1974, 12, 57–58. [Google Scholar] [CrossRef]
- Milczewska, K.; Voelkel, A. Inverse Gas Chromatography in Characterization of Composites Interaction. Advanced Gas Chromatography-Progress in Agricultural, Biomedical and Industrial Applications; InTech: Rijeka, Croatia, 2012; pp. 421–436. [Google Scholar]
- Bandosz, T. Inverse Gas Chromatography to Determine the Structural and Chemical Features of Activated Carbon Surfaces. In Encyclopedia of Surface and Colloid Science, 3rd ed.; Taylor & Francis, CRC press: Boca Raton, FL, USA, 2015; pp. 3365–3378. [Google Scholar]
- Shi, B.; Wang, Y.; Jia, L. Comparison of Dorris–Gray and Schultz methods for the calculation of surface dispersive free energy by inverse gas chromatography. J. Chromatogr. A 2011, 1218, 860–862. [Google Scholar] [CrossRef]
- Ylä-MäIhäNiemi, P.P.; Heng, J.Y.; Thielmann, F.; Williams, D.R. Inverse gas chromatographic method for measuring the dispersive surface energy distribution for particulates. Langmuir 2008, 24, 9551–9557. [Google Scholar] [CrossRef] [PubMed]
- Kołodziejek, J.; Voelkel, A.; Heberger, K. Characterization of hybrid materials by means of inverse gas chromatography and chemometrics. J. Pharm. Sci. 2013, 102, 1524–1531. [Google Scholar] [CrossRef] [PubMed] [Green Version]
- Papirer, E.; Perrin, J.M.; Siffert, B.; Philipponneau, G. Surface characteristics of aluminas in relation with polymer adsorption. J. Colloid Interface Sci. 1991, 144, 263–270. [Google Scholar] [CrossRef]
- Dimopoulou, M.; Ritzoulis, C.; Panayiotou, C. Surface characterization of okra hydrocolloid extract by inverse gas chromatography (IGC). Colloids Surf. A Physicochem. Eng. Asp. 2015, 475, 37–43. [Google Scholar] [CrossRef]
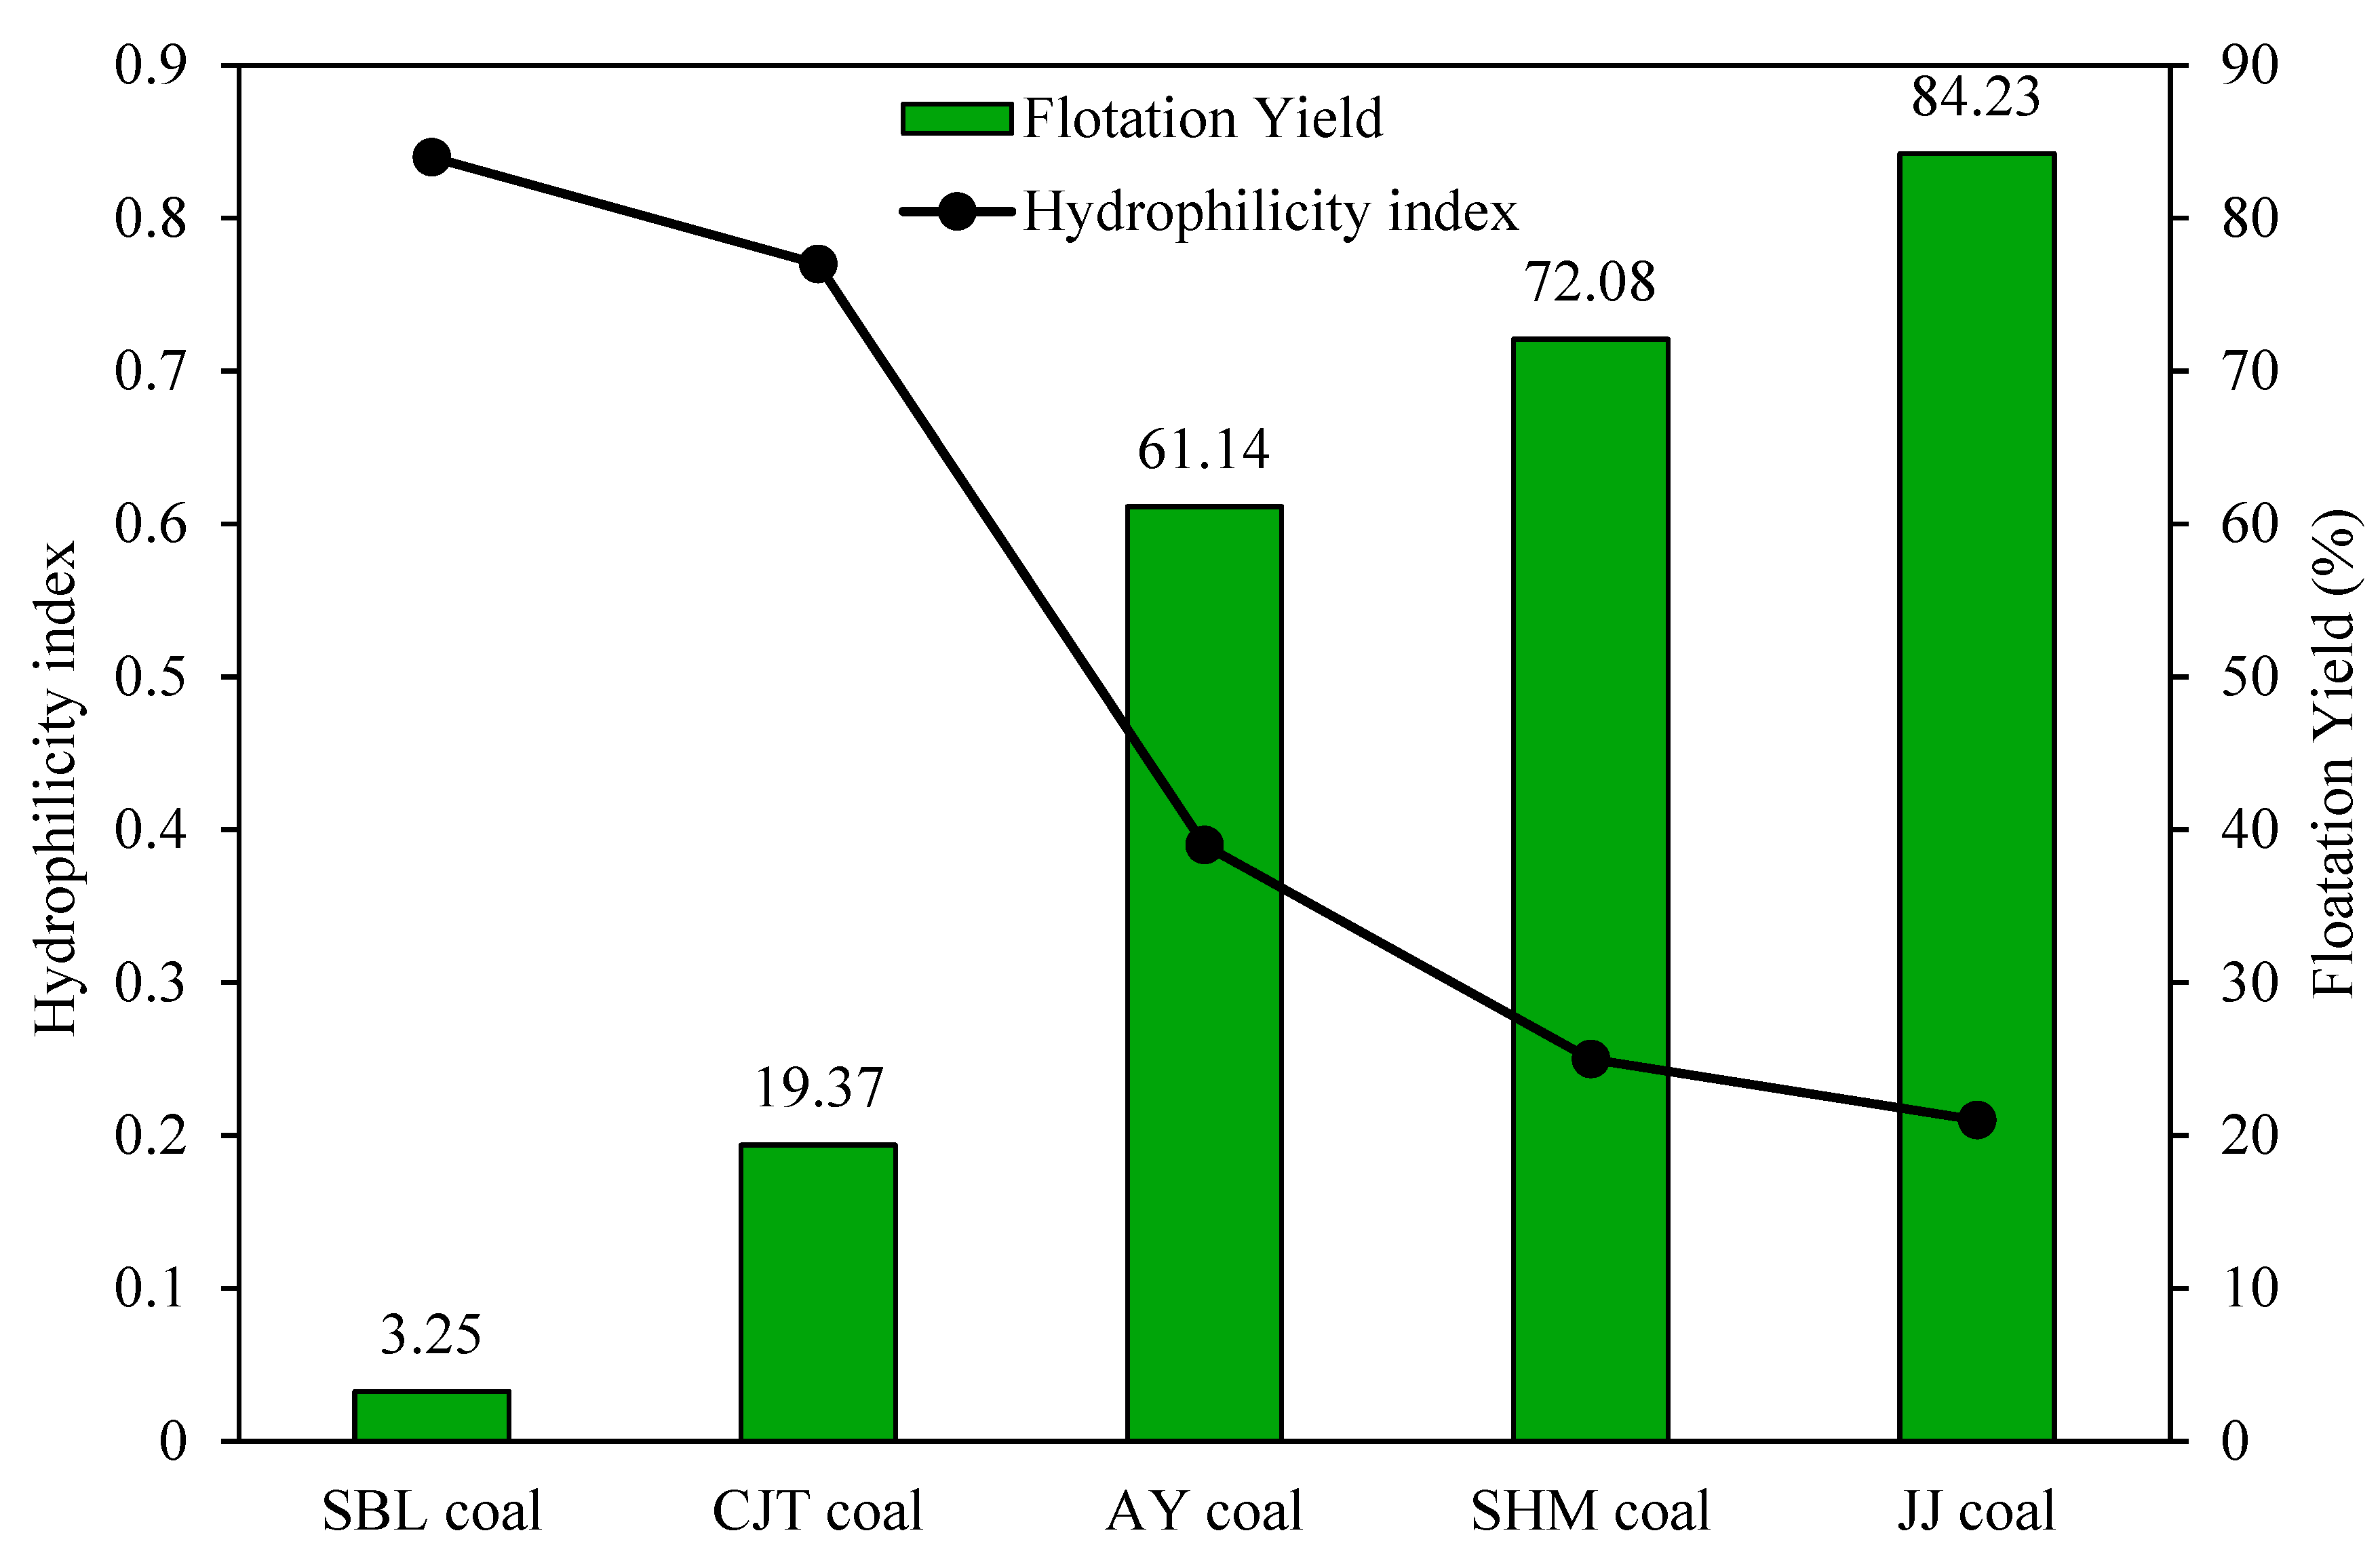
- Niu, C.; Xia, W.; Peng, Y. Analysis of coal wettability by inverse gas chromatography and its guidance for coal flotation. Fuel 2018, 228, 290–296. [Google Scholar] [CrossRef]
- Díaz, E.; Ordóñez, S.; Vega, A.; Coca, J. Comparison of adsorption properties of a chemically activated and a steam-activated carbon, using inverse gas chromatography. Microporous Mesoporous Mater. 2005, 82, 173–181. [Google Scholar] [CrossRef]
- Fulazzaky, M.A. Study of the dispersion and specific interactions affected by chemical functions of the granular activated carbons. Environ. Nanotechnol. Monit. Manag. 2019, 12, 100230. [Google Scholar] [CrossRef]
- Wang, W.; Hua, Q.; Sha, Y.; Wu, D.; Zheng, S.; Liu, B. Surface properties of solid materials measured by modified inverse gas chromatography. Talanta 2013, 112, 69–72. [Google Scholar] [CrossRef]
- Pal, A.; Kondor, A.; Mitra, S.; Thu, K.; Harish, S.; Saha, B.B. On surface energy and acid–base properties of highly porous parent and surface treated activated carbons using inverse gas chromatography. J. Ind. Eng. Chem. 2019, 69, 432–443. [Google Scholar] [CrossRef]
- Sreekanth, T.; Basivi, P.K.; Nagajyothi, P.; Dillip, G.; Shim, J.; Ko, T.; Yoo, K. Determination of surface properties and Gutmann’s Lewis acidity–basicity parameters of thiourea and melamine polymerized graphitic carbon nitride sheets by inverse gas chromatography. J. Chromatogr. A 2018, 1580, 134–141. [Google Scholar] [CrossRef]
- Díaz, E.; Ordóñez, S.; Vega, A. Adsorption of volatile organic compounds onto carbon nanotubes, carbon nanofibers, and high-surface-area graphites. J. Colloid Interface Sci. 2007, 305, 7–16. [Google Scholar] [CrossRef]
- Keru, G.; Ndungu, P.G.; Nyamori, V.O. Effect of boron concentration on physicochemical properties of boron-doped carbon nanotubes. Mater. Chem. Phys. 2015, 153, 323–332. [Google Scholar] [CrossRef]
- Luo, Y.; Zhao, Y.; Cai, J.; Duan, Y.; Du, S. Effect of amino-functionalization on the interfacial adhesion of multi-walled carbon nanotubes/epoxy nanocomposites. Mater. Des. 2012, 33, 405–412. [Google Scholar] [CrossRef]
- Menzel, R.; Bismarck, A.; Shaffer, M.S. Deconvolution of the structural and chemical surface properties of carbon nanotubes by inverse gas chromatography. Carbon 2012, 50, 3416–3421. [Google Scholar] [CrossRef]
- Dai, J.; Wang, G.; Ma, L.; Wu, C. Study on the surface energies and dispersibility of graphene oxide and its derivatives. J. Mater. Sci. 2015, 50, 3895–3907. [Google Scholar] [CrossRef]
- Dai, J.; Wang, G.J.; Wu, C.K. Investigation of the surface properties of graphene oxide and graphene by inverse gas chromatography. Chromatographia 2014, 77, 299–307. [Google Scholar] [CrossRef]
- Grajek, H. The optimisation of chromatographic conditions for the determination of acceptor-donor properties of graphene oxide and reduced graphene oxide. Acta Innov. 2018, 26, 5–20. [Google Scholar] [CrossRef]
- Yuan, X.; Zhu, B.; Cai, X.; Zhao, S.; Qiao, K.; Zhang, M. Effects of particle size and distribution of the sizing agent on carbon fiber/epoxy composites interfacial adhesion. Polym. Compos. 2018, 39, E2036–E2045. [Google Scholar] [CrossRef]
- Lim, H.J.; Lee, K.; Cho, Y.S.; Kim, Y.S.; Kim, T.; Park, C.R. Experimental consideration of the Hansen solubility parameters of as-produced multi-walled carbon nanotubes by inverse gas chromatography. Phys. Chem. Chem. Phys. 2014, 16, 17466–17472. [Google Scholar] [CrossRef]
- Otyepková, E.; Lazar, P.; Čépe, K.; Tomanec, O.; Otyepka, M. Organic adsorbates have higher affinities to fluorographene than to graphene. Appl. Mater. Today 2016, 5, 142–149. [Google Scholar] [CrossRef] [Green Version]
- Karlický, F.E.; Otyepkova, E.; Lo, R.; Pitoňák, M.; Jurečka, P.; Pykal, M.; Otyepka, M. Adsorption of organic molecules to van der Waals materials: Comparison of fluorographene and fluorographite with graphene and graphite. J. Chem. Theory Comput. 2017, 13, 1328–1340. [Google Scholar] [CrossRef] [Green Version]
- Karlický, F.E.; Otyepková, E.; Banáš, P.; Lazar, P.; Kocman, M.S.; Otyepka, M. Interplay between ethanol adsorption to high-energy sites and clustering on graphene and graphite alters the measured isosteric adsorption enthalpies. J. Phys. Chem. C 2015, 119, 20535–20543. [Google Scholar] [CrossRef]
- Strzemiecka, B.; Voelkel, A.; Donate-Robles, J.; Martín-Martínez, J.M. Assessment of the surface chemistry of carbon blacks by TGA-MS, XPS and inverse gas chromatography using statistical chemometric analysis. Appl. Surf. Sci. 2014, 316, 315–323. [Google Scholar] [CrossRef]
- Lazar, P.; Otyepkova, E.; Banáš, P.; Fargašová, A.; Šafářová, K.; Lapčík, L.; Otyepka, M. The nature of high surface energy sites in graphene and graphite. Carbon 2014, 73, 448–453. [Google Scholar] [CrossRef]
- Singh, G.; Lal, D.; Tripathi, V. Study of microporosity of active carbon spheres using inverse gas chromatographic and static adsorption techniques. J. Chromatogr. A 2004, 1036, 189–195. [Google Scholar] [CrossRef] [PubMed]
- Huson, M.G.; Church, J.S.; Kafi, A.A.; Woodhead, A.L.; Khoo, J.; Kiran, M.; Fox, B.L. Heterogeneity of carbon fibre. Carbon 2014, 68, 240–249. [Google Scholar] [CrossRef]
- Jäger, M.; Zabihi, O.; Ahmadi, M.; Li, Q.; Depalmeanar, A.; Naebe, M. Nano-enhanced interface in carbon fibre polymer composite using halloysite nanotubes. Compos. Part A Appl. Sci. Manuf. 2018, 109, 115–123. [Google Scholar] [CrossRef]
- Kafi, A.; Li, Q.; Chaffraix, T.; Khoo, J.; Gengenbach, T.; Magniez, K.J.C. Surface treatment of carbon fibres for interfacial property enhancement in composites via surface deposition of water soluble POSS nanowhiskers. Polymer 2018, 137, 97–106. [Google Scholar] [CrossRef]
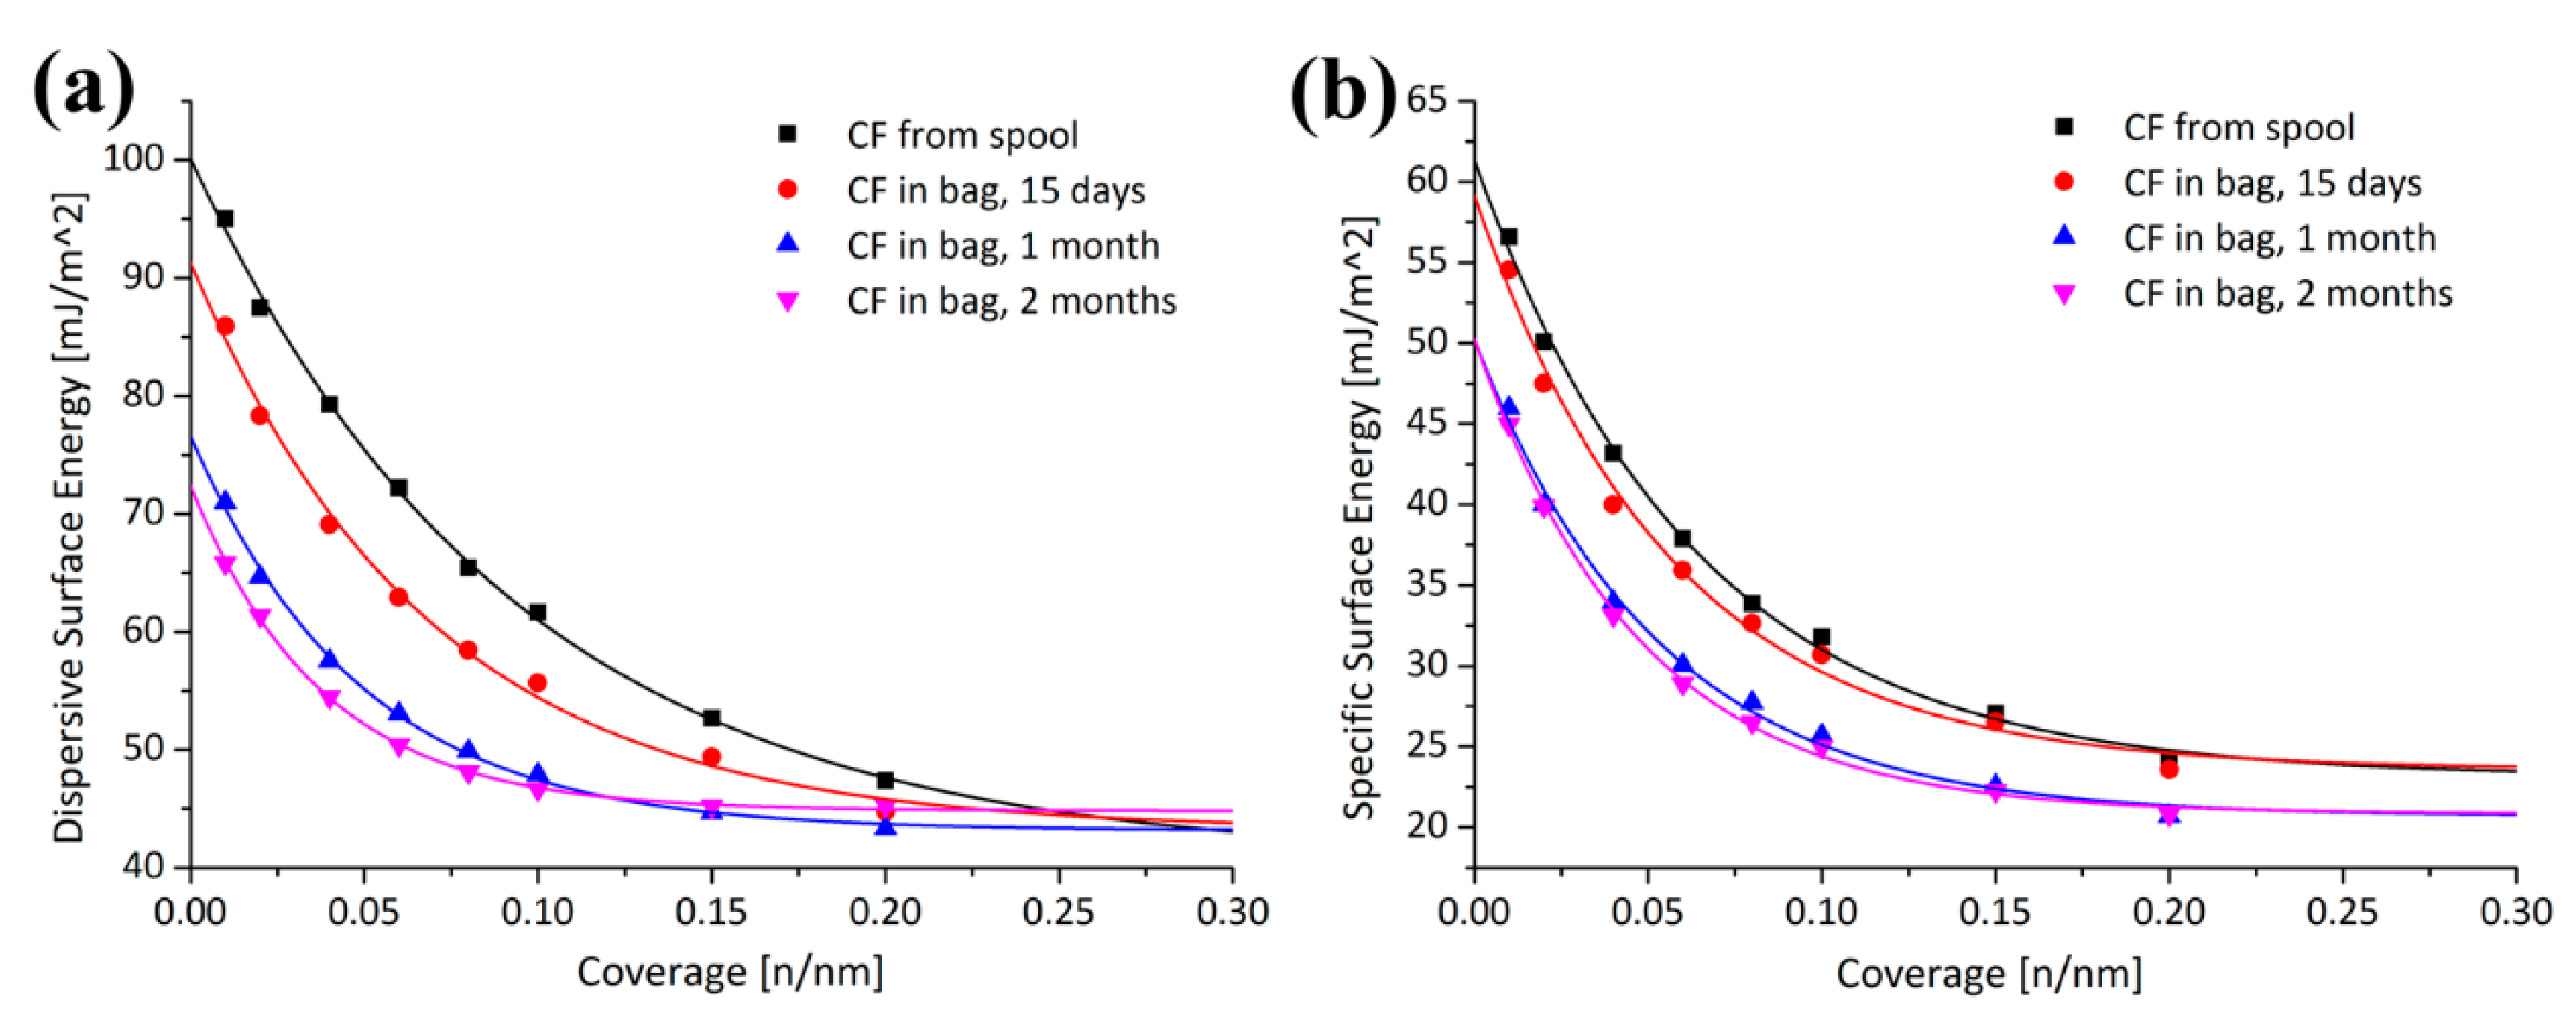
- Li, Q.; Woodhead, A.L.; Church, J.S.; Naebe, M. On the detection of carbon fibre storage contamination and its effect on the fibre–matrix interface. Sci. Rep. 2018, 8, 16446. [Google Scholar] [CrossRef]
- Zabihi, O.; Ahmadi, M.; Li, Q.; Shafei, S.; Huson, M.G.; Naebe, M. Carbon fibre surface modification using functionalized nanoclay: A hierarchical interphase for fibre-reinforced polymer composites. Compos. Sci. Technol. 2017, 148, 49–58. [Google Scholar] [CrossRef]
- Gerencsér, F.; Rieder, N.; Varga, C.; Hancsók, J.; Dallos, A. Surface Energy Heterogeneity Profiles of Carbon Nanotubes with a Copolymer-Modified Surface Using Surface Energy Mapping by Inverse Gas Chromatography. Hung. J. Ind. Chem. 2017, 45, 61–66. [Google Scholar] [CrossRef]
- Mezgebe, M.; Jiang, L.H.; Shen, Q.; Du, C.; Yu, H.R. Studies and comparison of the liquid adsorption behavior and surface properties of single-and multiwall carbon nanotubes by capillary rise method. Colloids Surf. A Physicochem. Eng. Asp. 2012, 415, 86–90. [Google Scholar] [CrossRef]
- Ombaka, L.M.; Ndungu, P.G.; Nyamori, V.O. Tuning the nitrogen content and surface properties of nitrogen-doped carbon nanotubes synthesized using a nitrogen-containing ferrocenyl derivative and ethylbenzoate. J. Mater. Sci. 2015, 50, 1187–1200. [Google Scholar] [CrossRef]
- Ferguson, A.; Harvey, A.; Godwin, I.J.; Bergin, S.D.; Coleman, J.N. The dependence of the measured surface energy of graphene on nanosheet size. 2D Mater. 2016, 4, 015040. [Google Scholar] [CrossRef]
- Ferguson, A.; Caffrey, I.T.; Backes, C.; Coleman, J.N.; Bergin, S.D. Differentiating defect and basal plane contributions to the surface energy of graphite using inverse gas chromatography. Chem. Mater. 2016, 28, 6355–6366. [Google Scholar] [CrossRef]
- Lazar, P.; Otyepková, E.; Karlický, F.; Čépe, K.; Otyepka, M. The surface and structural properties of graphite fluoride. Carbon 2015, 94, 804–809. [Google Scholar] [CrossRef]
- Speltini, A.; Merli, D.; Quartarone, E.; Profumo, A. Separation of alkanes and aromatic compounds by packed column gas chromatography using functionalized multi-walled carbon nanotubes as stationary phases. J. Chromatogr. A 2010, 1217, 2918–2924. [Google Scholar] [CrossRef]
- Fakhrhoseini, S.M.; Li, Q.; Unnikrishnan, V.; Naebe, M. Nano-magnetite decorated carbon fibre for enhanced interfacial shear strength. Carbon 2019, 148, 361–369. [Google Scholar] [CrossRef]
- Kim, Y.S.; Oh, J.Y.; Kim, J.H.; Shin, M.H.; Jeong, Y.C.; Sung, S.J.; Park, C.R. Crucial role of oxidation debris of carbon nanotubes in subsequent end-use applications of carbon nanotubes. ACS Appl. Mater. 2017, 9, 17552–17564. [Google Scholar] [CrossRef]
- Bergin, S.D.; Sun, Z.; Rickard, D.; Streich, P.V.; Hamilton, J.P.; Coleman, J.N. Multicomponent solubility parameters for single-walled carbon nanotube—Solvent mixtures. ACS Nano 2009, 3, 2340–2350. [Google Scholar] [CrossRef] [PubMed]
- Basivi, P.K.; Sreekanth, T.; Sivalingam, R.; Thota, C.; Pasupuleti, V.R. Surface characterization and London dispersive surface free energy of functionalized single-walled carbon nanotubes with a blend of polytetrafluoroethylene by inverse gas chromatography. Surf. Interface Anal. 2019, 51, 516–524. [Google Scholar] [CrossRef]
- Lehman, J.H.; Terrones, M.; Mansfield, E.; Hurst, K.E.; Meunier, V. Evaluating the characteristics of multiwall carbon nanotubes. Carbon 2011, 49, 2581–2602. [Google Scholar] [CrossRef]
- Ismagilov, Z.R.; Shalagina, A.E.; Podyacheva, O.Y.; Ischenko, A.V.; Kibis, L.S.; Boronin, A.I.; Anikeeva, O.B. Structure and electrical conductivity of nitrogen-doped carbon nanofibers. Carbon 2009, 47, 1922–1929. [Google Scholar] [CrossRef]
- Wepasnick, K.A.; Smith, B.A.; Bitter, J.L.; Fairbrother, D.H. Chemical and structural characterization of carbon nanotube surfaces. Anal. Bioanal. Chem. 2010, 396, 1003–1014. [Google Scholar] [CrossRef] [PubMed]
- Yao, Z.; Ge, L.; Yang, W.; Xia, M.; Ji, X.; Jin, M.; Dienstmaier, J.R. Finite dilution inverse gas chromatography as a versatile tool to determine the surface properties of biofillers for plastic composite applications. Anal. Chem. 2015, 87, 6724–6729. [Google Scholar] [CrossRef] [PubMed]
- Meunier, V.; Lambin, P. Scanning tunneling microscopy and spectroscopy of topological defects in carbon nanotubes. Carbon 2000, 38, 1729–1733. [Google Scholar] [CrossRef]
- Maciel, I.O.; Anderson, N.; Pimenta, M.A.; Hartschuh, A.; Qian, H.; Terrones, M.; Novotny, L. Electron and phonon renormalization near charged defects in carbon nanotubes. Nat. Mater. 2008, 7, 878. [Google Scholar] [CrossRef]
- Bauer, B.J.; Hobbie, E.K.; Becker, M.L. Small-angle neutron scattering from labeled single-wall carbon nanotubes. Macromolecules 2006, 39, 2637–2642. [Google Scholar] [CrossRef]
- Branca, C.; Frusteri, F.; Magazu, V.; Mangione, A. Characterization of carbon nanotubes by TEM and infrared spectroscopy. J. Phys. Chem. B 2004, 108, 3469–3473. [Google Scholar] [CrossRef]
- Dresselhaus, M.; Jorio, A.; Saito, R. Characterizing graphene, graphite, and carbon nanotubes by Raman spectroscopy. Annu. Rev. Condens. Matter Phys. 2010, 1, 89–108. [Google Scholar] [CrossRef]
- Hu, H.; Yu, A.; Kim, E.; Zhao, B.; Itkis, M.E.; Bekyarova, E.; Haddon, R.C. Influence of the zeta potential on the dispersability and purification of single-walled carbon nanotubes. J. Phys. Chem. B 2005, 109, 11520–11524. [Google Scholar] [CrossRef]
- Scheibe, B.; Borowiak-Palen, E.; Kalenczuk, R.J. Oxidation and reduction of multiwalled carbon nanotubes—Preparation and characterization. Mater. Charact. 2010, 61, 185–191. [Google Scholar] [CrossRef]
- Kannan, A.M.; Munukutla, L. Carbon nano-chain and carbon nano-fibers based gas diffusion layers for proton exchange membrane fuel cells. J. Power Sources 2007, 167, 330–335. [Google Scholar] [CrossRef]
- Seidenberger, K.; Wilhelm, F.; Haußmann, J.; Markötter, H.; Manke, I.; Scholta, J. Grand canonical Monte Carlo study on water agglomerations within a polymer electrolyte membrane fuel cell gas diffusion layer. J. Power Sources 2013, 239, 628–641. [Google Scholar] [CrossRef]
- Borup, R.; Davey, J.; Garzon, F.; Wood, D.; Welch, P.; More, K. PEM fuel cell durability with transportation transient operation. ECS Trans. 2006, 3, 879–886. [Google Scholar] [CrossRef]
- Zhang, X.; Yang, D.; Xu, P.; Wang, C.; Du, Q. Characterizing the surface properties of carbon nanotubes by inverse gas chromatography. J. Mater. Sci. 2007, 42, 7069–7075. [Google Scholar] [CrossRef]
- Menzel, R.; Lee, A.; Bismarck, A.; Shaffer, M.S. Inverse gas chromatography of as-received and modified carbon nanotubes. Langmuir 2009, 25, 8340–8348. [Google Scholar] [CrossRef]
- Shih, Y.H.; Li, M.S. Adsorption of selected volatile organic vapors on multiwall carbon nanotubes. J. Hazard. Mater. 2008, 154, 21–28. [Google Scholar] [CrossRef]
- Zhou, J.; Yu, T.; Wu, S.; Xie, Z.; Yang, Y. Inverse gas chromatography investigation of rubber reinforcement by modified pyrolytic carbon black from scrap tires. Ind. Eng. Chem. Res. 2010, 49, 1691–1696. [Google Scholar] [CrossRef]
- Papirer, E.; Brendle, E.; Ozil, F.; Balard, H. Comparison of the surface properties of graphite, carbon black and fullerene samples, measured by inverse gas chromatography. Carbon 1999, 37, 1265–1274. [Google Scholar] [CrossRef]
- Brandao, S.; Andrada, D.; Mesquita, A.; Santos, A.; Gorgulho, H.; Paniago, R.; Furtado, C. The influence of oxygen-containing functional groups on the dispersion of single-walled carbon nanotubes in amide solvents. J. Phys. Condens. Matter 2010, 22, 334222. [Google Scholar] [CrossRef]
- Lazar, P.; Karlicky, F.; Jurečka, P.; Kocman, M.S.; Otyepková, E.; Šafářová, K.R.; Otyepka, M. Adsorption of small organic molecules on graphene. J. Am. Chem. Soc. 2013, 135, 6372–6377. [Google Scholar] [CrossRef]
- Balard, H.; Maafa, D.; Santini, A.; Donnet, J. Study by inverse gas chromatography of the surface properties of milled graphites. J. Chromatogr. A 2008, 1198, 173–180. [Google Scholar] [CrossRef] [PubMed]
- Das, S.C.; Larson, I.; Morton, D.A.; Stewart, P.J. Determination of the polar and total surface energy distributions of particulates by inverse gas chromatography. Langmuir 2011, 27, 521–523. [Google Scholar] [CrossRef] [PubMed]
- Kondor, A.; Quellet, C.; Dallos, A. Surface characterization of standard cotton fibres and determination of adsorption isotherms of fragrances by IGC. Surf. Interface Anal. 2015, 47, 1040–1050. [Google Scholar] [CrossRef]
- Thielmann, F.; Pearse, D. Determination of surface heterogeneity profiles on graphite by finite concentration inverse gas chromatography. J. Chromatogr. A 2002, 969, 323–327. [Google Scholar] [CrossRef]
- Huber, L.; Hauser, S.B.; Brendlé, E.; Ruch, P.; Ammann, J.; Hauert, R.; Yoon, S. The effect of activation time on water sorption behavior of nitrogen-doped, physically activated, monolithic carbon for adsorption cooling. Microporous Mesoporous Mater. 2019, 276, 239–250. [Google Scholar] [CrossRef]
- Madhu, R.; Veeramani, V.; Chen, S.M. Heteroatom-enriched and renewable banana-stem-derived porous carbon for the electrochemical determination of nitrite in various water samples. Sci. Rep. 2014, 4, 4679. [Google Scholar] [CrossRef] [Green Version]
- Ania, C.O.; Bandosz, T.J. Importance of structural and chemical heterogeneity of activated carbon surfaces for adsorption of dibenzothiophene. Langmuir 2005, 21, 7752–7759. [Google Scholar] [CrossRef]
- Sajjadi, B.; Chen, W.Y.; Egiebor, N.O. A comprehensive review on physical activation of biochar for energy and environmental applications. Rev. Chem. Eng. 2019, 35, 735–776. [Google Scholar] [CrossRef]
- Kern, A.M.; Zierath, B.; Fey, T.; Etzold, B.J. Adsorption of Nickel Ions on Oxygen-Functionalized Carbons. Chem. Eng. Technol. 2016, 39, 715–722. [Google Scholar] [CrossRef]
- Shafeeyan, M.S.; Daud, W.; Ma, W.; Houshmand, A.; Shamiri, A. A review on surface modification of activated carbon for carbon dioxide adsorption. J. Anal. Appl. Pyrolysis 2010, 89, 143–151. [Google Scholar] [CrossRef]
- Darmstadt, H.; Roy, C.; Kaliaguine, S.; Cormier, H. Surface energy of commercial and pyrolytic carbon blacks by inverse gas chromatography. Rubber Chem. Technol. 1997, 70, 759–768. [Google Scholar] [CrossRef]


| Parameter | Compounds | Reference |
|---|---|---|
| Sorption free energy | Coal | [19] |
| Activated carbon | [20,21,22,23] | |
| Polymerized graphitic carbon nitride sheets | [24] | |
| Carbon nanotubes | [25,26,27,28] | |
| Graphene | [29,30,31] | |
| Sorption enthalpy | Activated carbon | [20,22] |
| Carbon fiber | [32] | |
| Carbon nanotubes | [17,25,33] | |
| Fluorographene | [34,35] | |
| Graphene | [31,36,37] | |
| Graphite | [26,38] | |
| Sorption entropy | Fluorographene | [34,35] |
| Graphene | [31,36] | |
| Carbon nanotubes | [25] | |
| Dispersive surface energy | Coal | [19] |
| Activated carbon | [20,23,39] | |
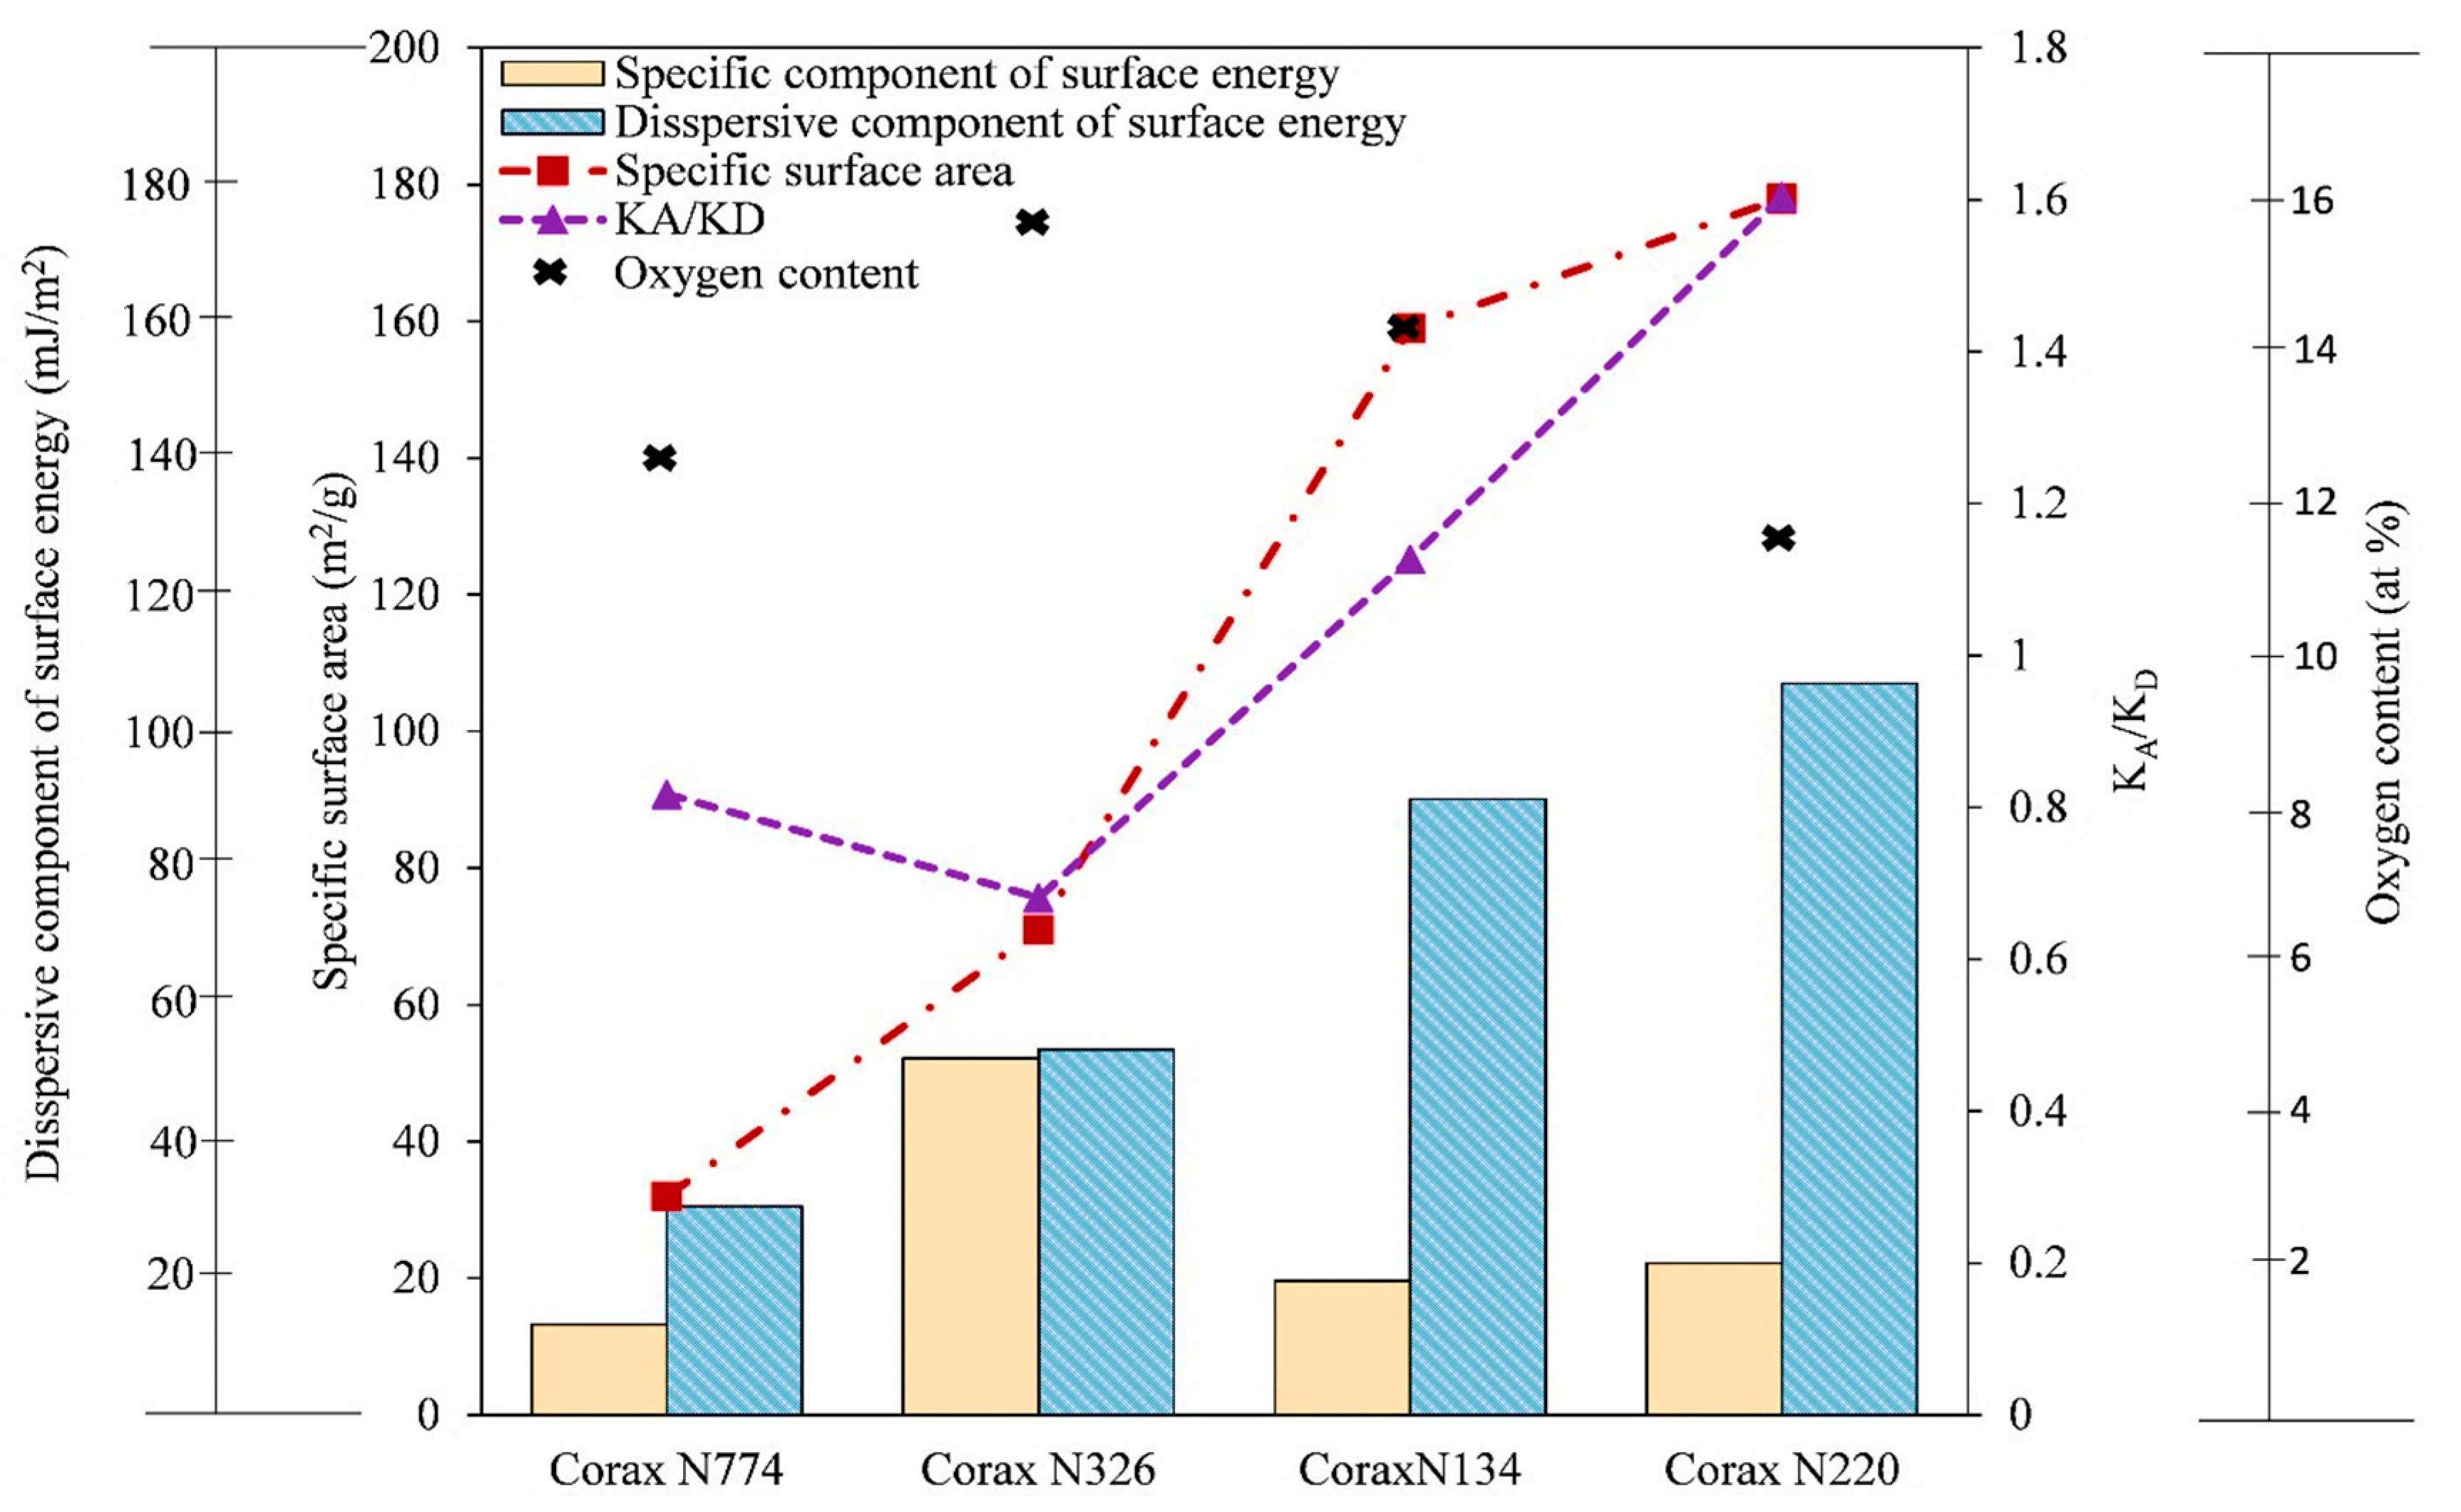
| Carbon black | [37] | |
| Carbon fiber | [32,40,41,42,43,44] | |
| Carbon nanotubes | [17,25,27,28,45,46,47] | |
| Graphene | [29,30,31,48] | |
| Graphite | [24,49,50] | |
| Acid/base number | Activated carbon | [23] |
| Carbon fiber | [18,32,40] | |
| Carbon black | [37] | |
| Polymerized graphitic carbon nitride sheets | [24] | |
| Carbon nanotubes | [17,47,51] | |
| Graphene | [30,31] | |
| Specific interaction parameter | Activated carbon | [20] |
| Carbon nanotubes | [28] | |
| Specific surface area | Activated carbon | [39] |
| Carbon fiber | [52] | |
| Hansen solubility parameters | Carbon nanotubes | [33,53,54] |
| Sample | Net Retention Times, tn (min) | (mJ/m2) | Isp(2-pentanone) (mJ/m2) | Isp(2-pentanol) (mJ/m2) | ||||
|---|---|---|---|---|---|---|---|---|
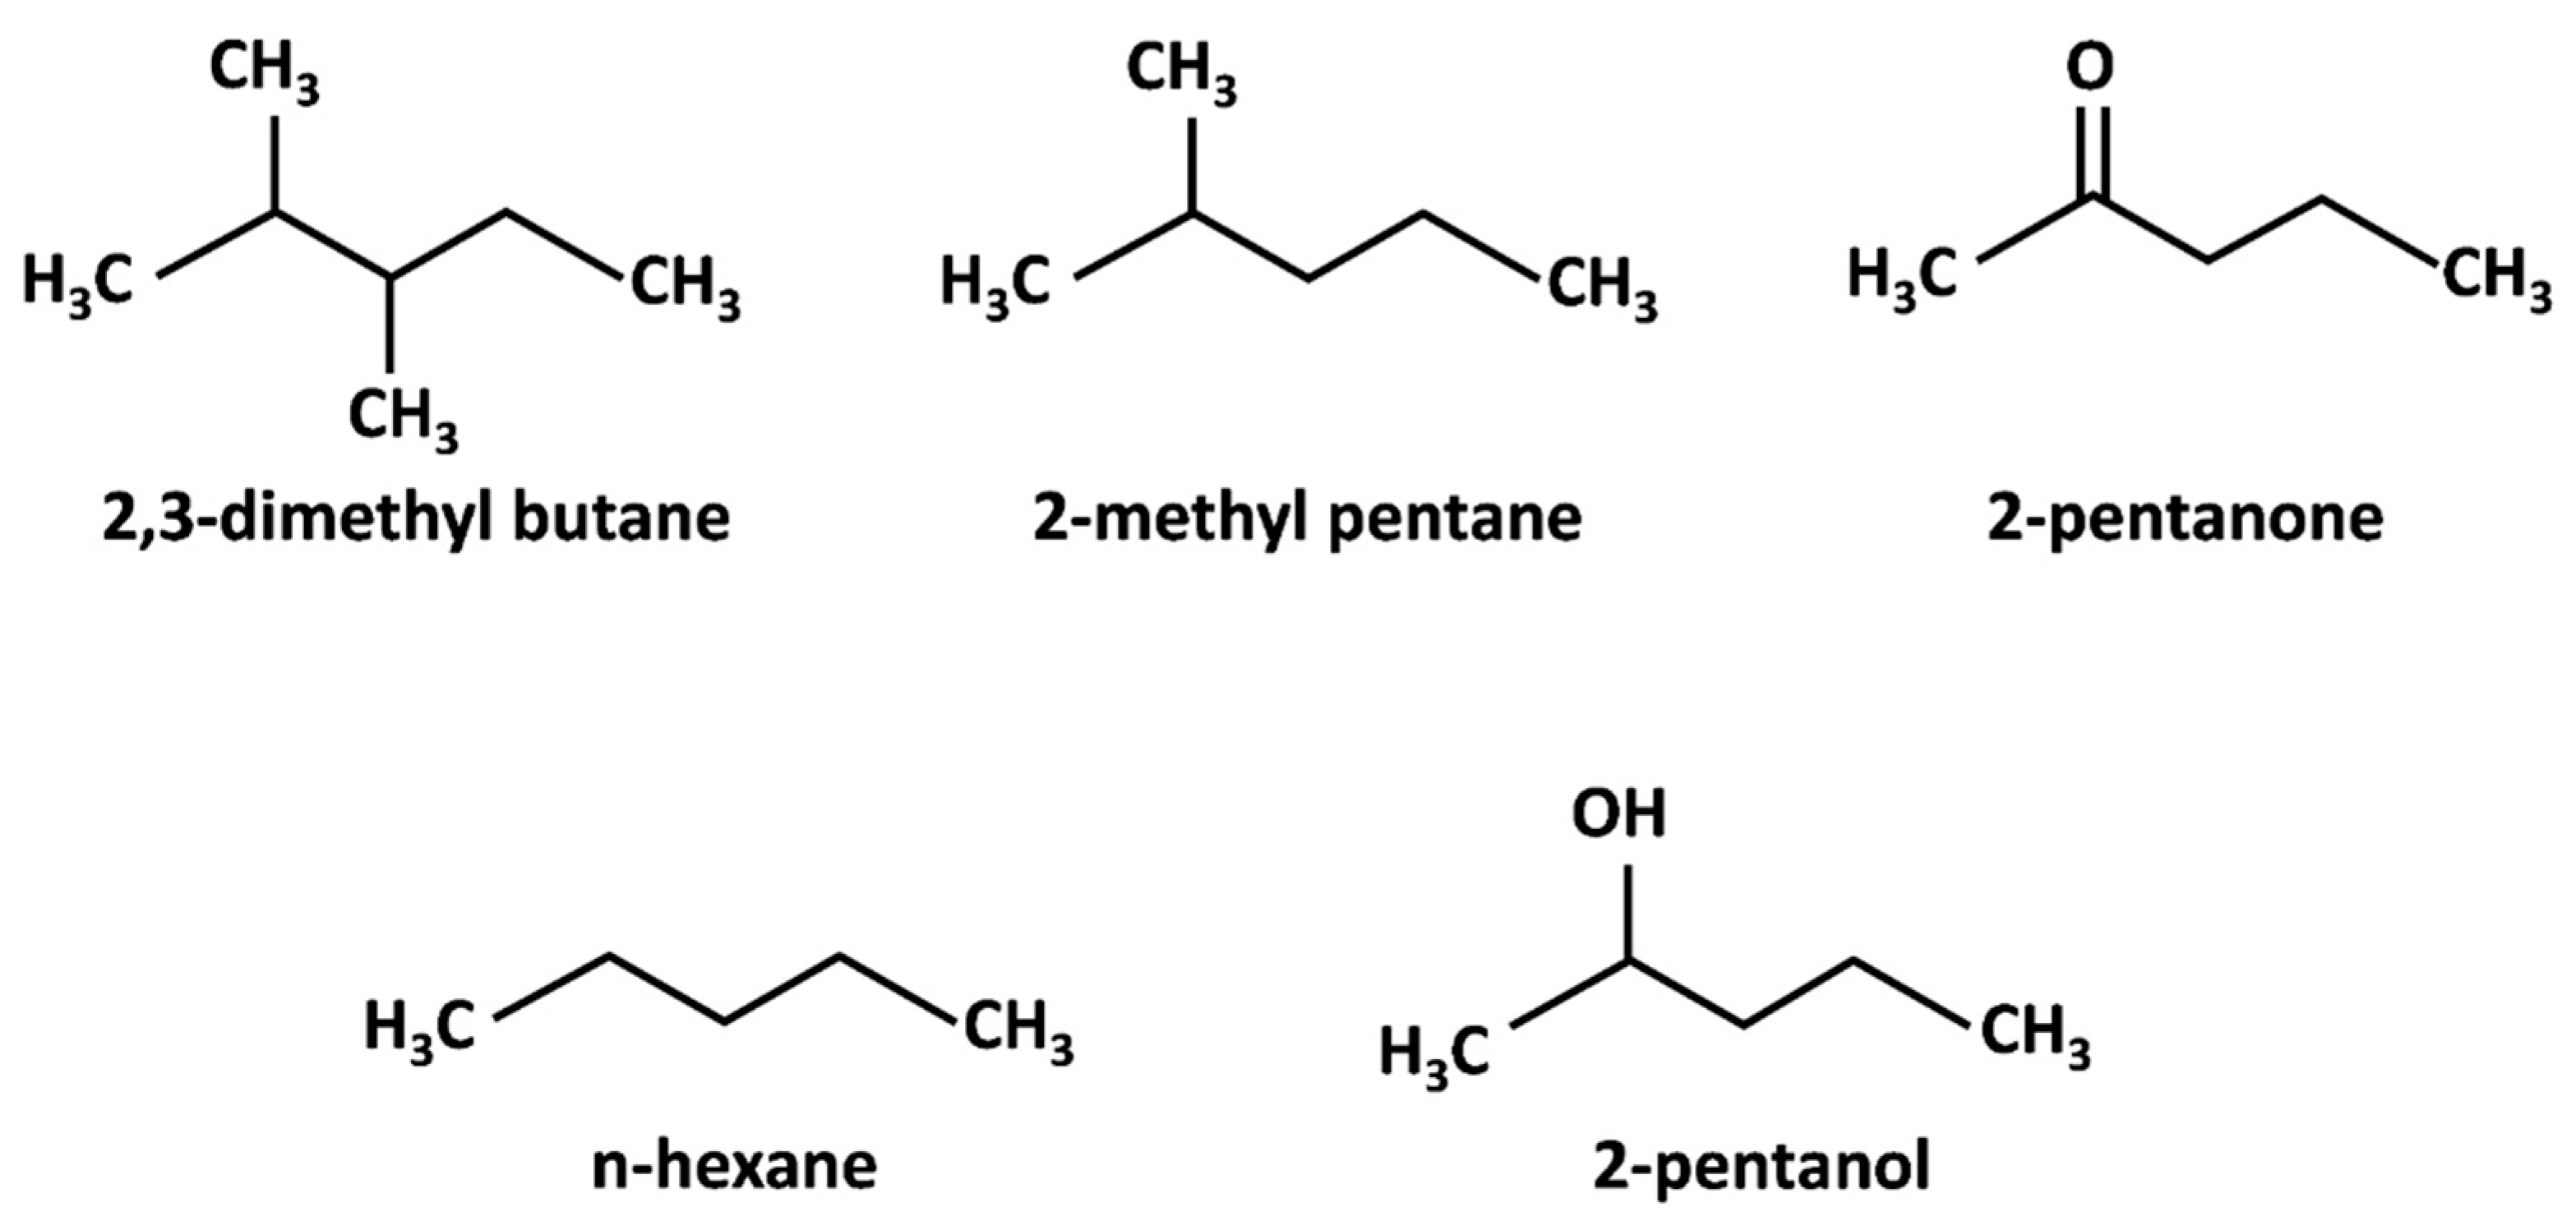
| Structural Probes | Chemical Probes | |||||||
| C4Me2 | C5Me | C6 | C5=O | C5-OH | ||||
| As-received | 0.24 | 0.3 | 0.46 | 0.46 | 1.08 | 94 | 18 | 27 |
| Annealed | 0.21 | 0.27 | 0.4 | 0.32 | 0.45 | 94 | 15 | 15 |
| Oxidized | 0.23 | 0.28 | 0.44 | 0.48 | 2.11 | 94 | 20 | 35 |
| Properties | Samples | ||
|---|---|---|---|
| M-SCN | T-GCN | ||
| (Schultz) | 100 °C | 44.22 | 51.98 |
| 110 °C | 36.36 | 49.7 | |
| 120 °C | 32.38 | 48.3 | |
| 130 °C | 31.25 | 40.7 | |
| (Dorris-Gray) | 100 °C | 41.36 | 48.52 |
| 110 °C | 34.55 | 47.25 | |
| 120 °C | 31.46 | 46.9 | |
| 130 °C | 30.9 | 40.3 | |
| KA (Schultz) | 0.093 | 0.179 | |
| KD (Schultz) | 0.376 | 0.736 | |
| KD/KA | 4.04 | 4.11 | |
| BET (m2/g) | 5.67 | 12.93 | |
| Sample | (mJ/m2) | (mJ/m2) | Method | Alkanes | Polar Probes | Temperature | Ref. |
|---|---|---|---|---|---|---|---|
| Corax N774 | 30.4 | 13.2 | Dorris-Gray | C5–C9 | CH2Cl2, CHCl3, Butan-1-ol, Ethyl acetate, 1,4-dioxane, Pyridine, Tetrahydrofurane | 30 °C | [37] |
| Corax N326 | 53.54 | 52.2 | |||||
| Corax N134 | 90.1 | 19.6 | |||||
| Corax N220 | 107.0 | 22.2 | |||||
| Maxsorb III | 213–250 | 11–15 | Dorris–Gray | C6–C8 | Acetonitrile, Ethyl acetate, Acetone, Ethanol, Dichloromethane, | 140 °C | [23] |
| H2-Maxsorb III | 250–290 | 24–32 | |||||
| KOH-H2-Maxsorb III | 220–260 | 13–18 | |||||
| Carbon fiber (CFs) | 43.2 | 21.5 | Schultz | C6–C9 | Chloroform, Ethyl acetate, Acetone, Ethanol, Dichloromethane | 30 °C | [43] |
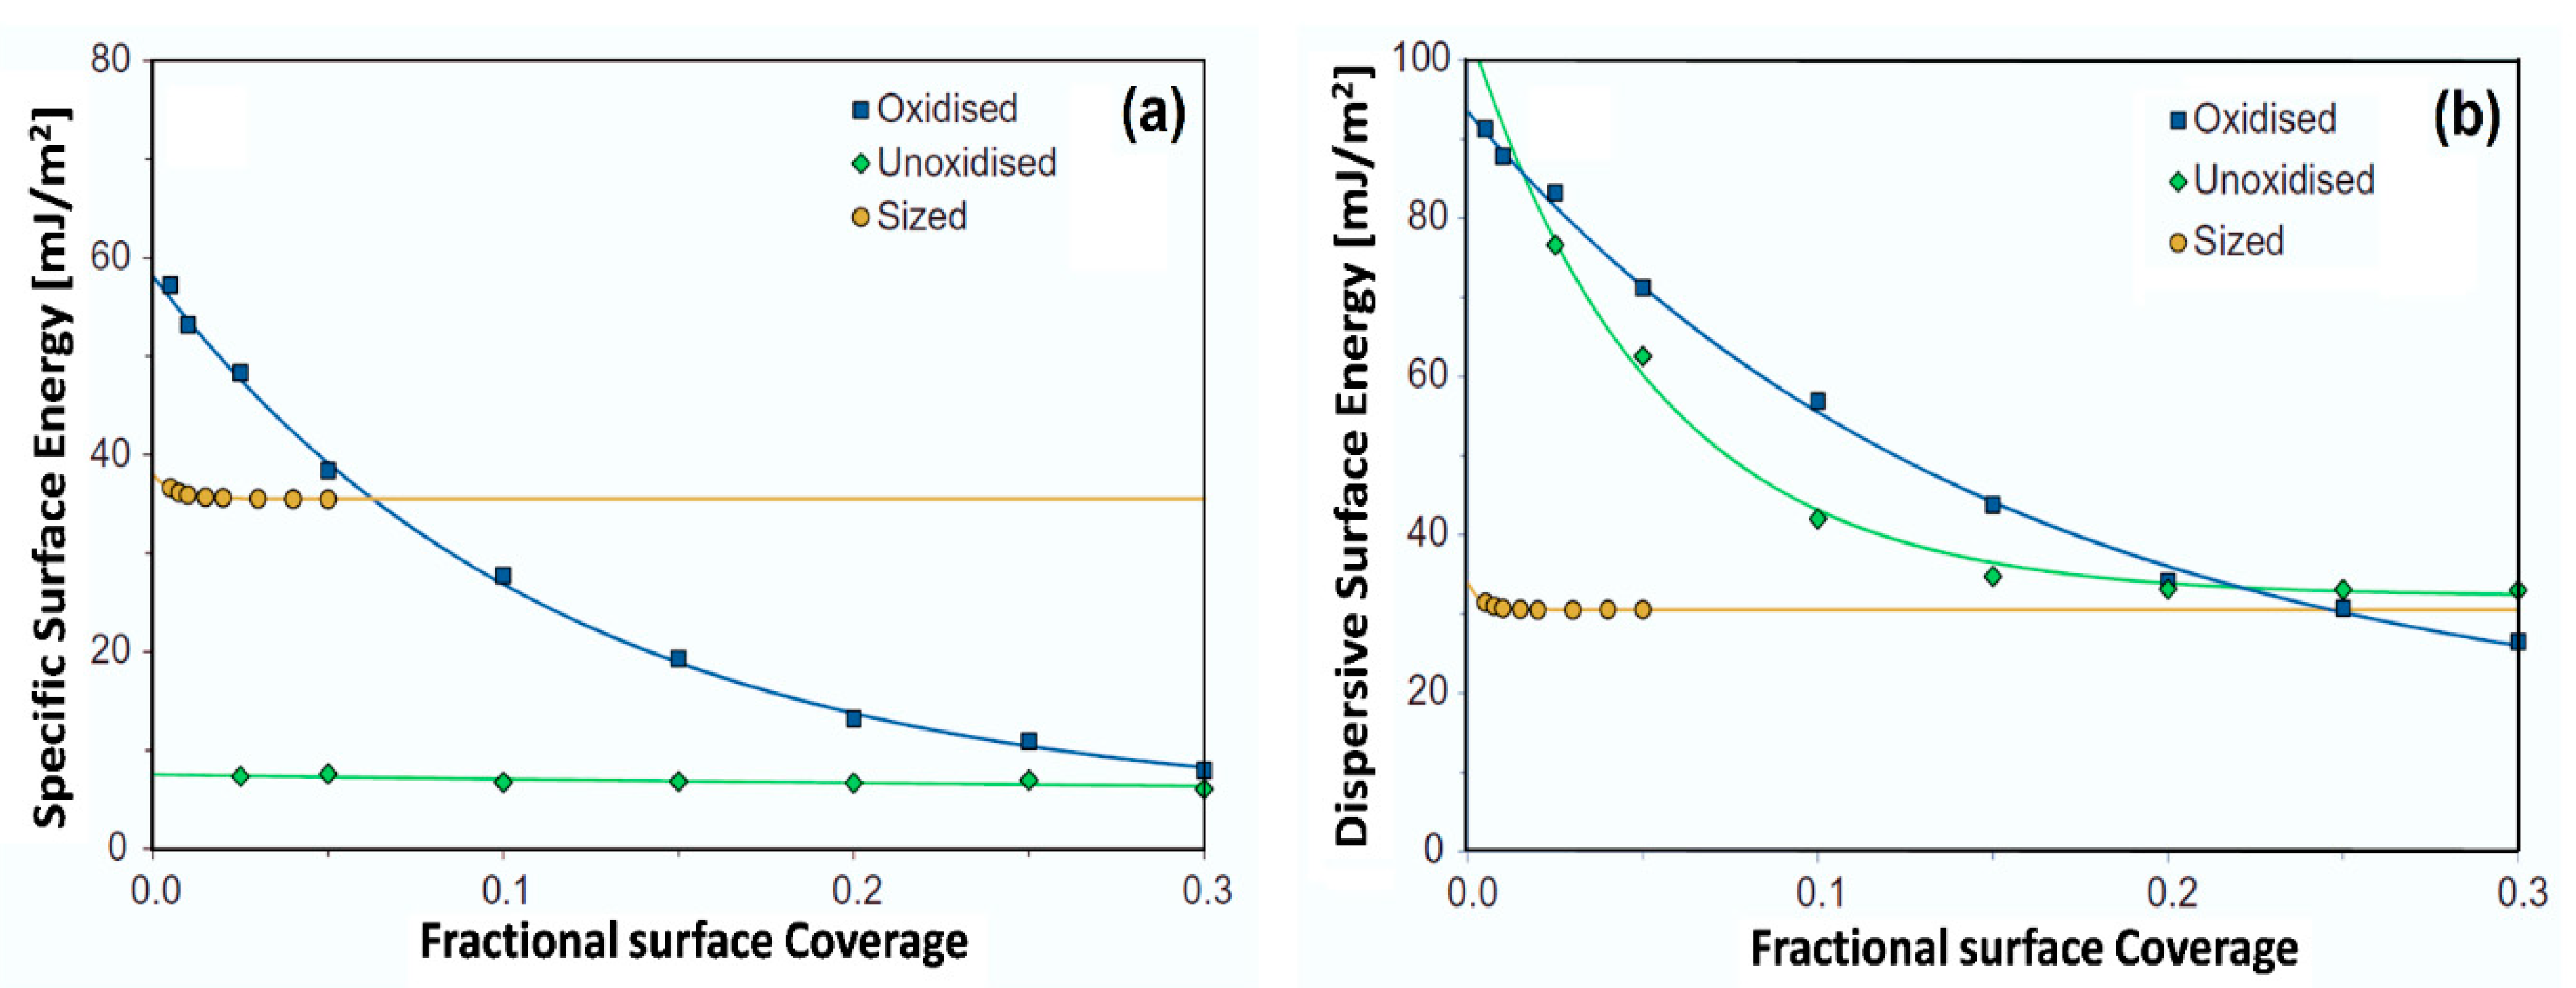
| Oxidized CFs | 93.5 | 58.2 | Schultz | C7–C9 | Chloroform, Ethyl acetate, Acetone, Acetonitrile, 1,4-dioxane | 120 °C | [40] |
| Unoxidized CFs | 104.2 | 7.5 | 70 °C | ||||
| Sized CFs | 33.9 | 38.0 | 70 °C | ||||
| CFs | 53.38 | 41.10 | Schultz | C6–C9 | Chloroform, Ethyl acetate, Acetone, Ethanol, Dichloromethane | 120 °C | [44] |
| Clay@CFs | 63.35 | 67.24 | |||||
| Pristine MWCNTs | 122.95 | 8.84 | Schultz | C7–C10 | Toluene, Dichloromethane, Ethanol, 1,4-dioxane, Acetone | 100 °C | [27] |
| Dicyanodiamide-MWCNTs | 18.65 | 0.56 | |||||
| Phenylbiguanide-MWCNTs | 25.69 | 4.60 | |||||
| GO | 78.9 | 57.1 | Dorris–Gray | C6-C9 | Dichloromethane, Tetrahydrofuran, Ethyl acetate | 40 °C | [29] |
| COOH-GO | 83.3 | 85.1 | |||||
| rGO | 106.8 | 8.64 | |||||
| EG-rGO | 92.8 | 38.2 |
| Sample Name | (mJ/m2) | (mJ/m2) | (mJ/m2) | |||
|---|---|---|---|---|---|---|
| Min | Max | Min | Max | Min | Max | |
| Shanbula (SBL) coal | 11.61 | 79.37 | 9.57 | 164.56 | 22.05 | 189.32 |
| Caojiatan (CJT) coal | 7.44 | 32.53 | 6.12 | 101.86 | 13.51 | 129.01 |
| Anyang (AY) coal | 5.1 | 161.49 | 3.01 | 100.83 | 8.14 | 259.55 |
| Shanghaimiao (SHM) coal | 19.22 | 132.25 | 5.09 | 34.2 | 24.1 | 131.39 |
| Juji (JJ) coal | 10.22 | 87.61 | 5.05 | 20.48 | 15.32 | 103.98 |
© 2020 by the authors. Licensee MDPI, Basel, Switzerland. This article is an open access article distributed under the terms and conditions of the Creative Commons Attribution (CC BY) license (http://creativecommons.org/licenses/by/4.0/).
Share and Cite
Gholami, F.; Tomas, M.; Gholami, Z.; Mirzaei, S.; Vakili, M. Surface Characterization of Carbonaceous Materials Using Inverse Gas Chromatography: A Review. Electrochem 2020, 1, 367-387. https://0-doi-org.brum.beds.ac.uk/10.3390/electrochem1040024
Gholami F, Tomas M, Gholami Z, Mirzaei S, Vakili M. Surface Characterization of Carbonaceous Materials Using Inverse Gas Chromatography: A Review. Electrochem. 2020; 1(4):367-387. https://0-doi-org.brum.beds.ac.uk/10.3390/electrochem1040024
Chicago/Turabian StyleGholami, Fatemeh, Martin Tomas, Zahra Gholami, Somayeh Mirzaei, and Mohammadtaghi Vakili. 2020. "Surface Characterization of Carbonaceous Materials Using Inverse Gas Chromatography: A Review" Electrochem 1, no. 4: 367-387. https://0-doi-org.brum.beds.ac.uk/10.3390/electrochem1040024