Overview of Energy Management and Leakage Control Systems for Smart Water Grids and Digital Water

 ,
,  , and
, and 
Abstract
:1. Introduction
2. Smart Water Management
2.1. Technologies and Improvements
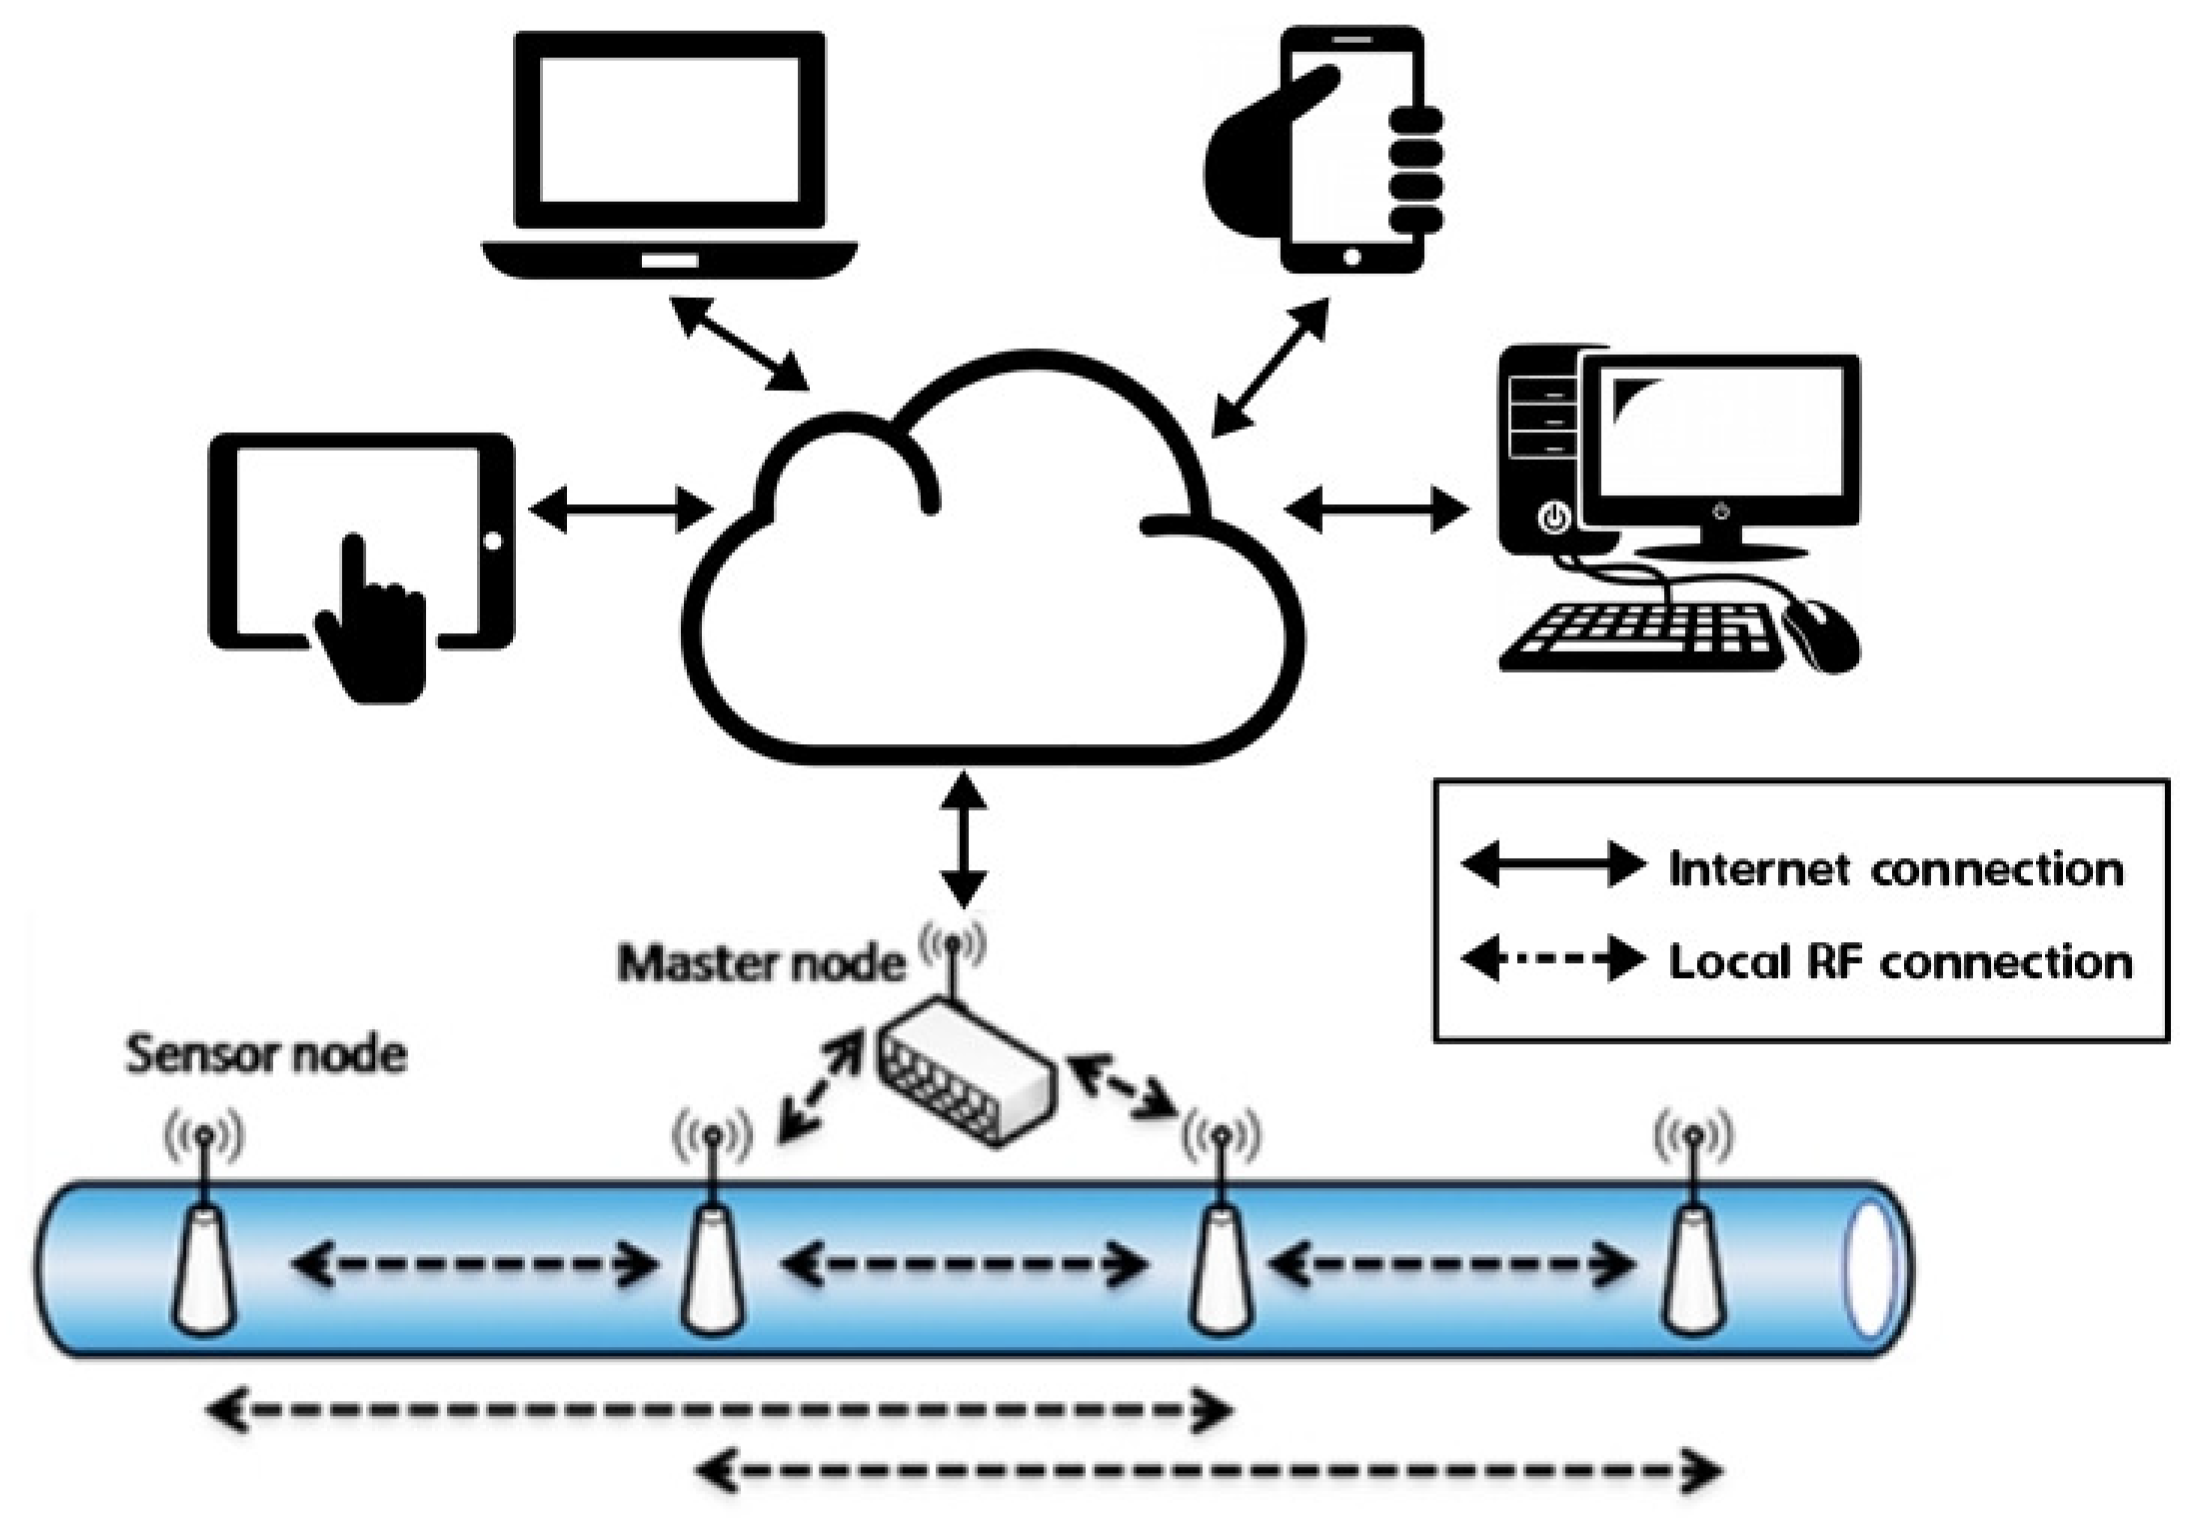
2.1.1. Smart Pipe and Sensors
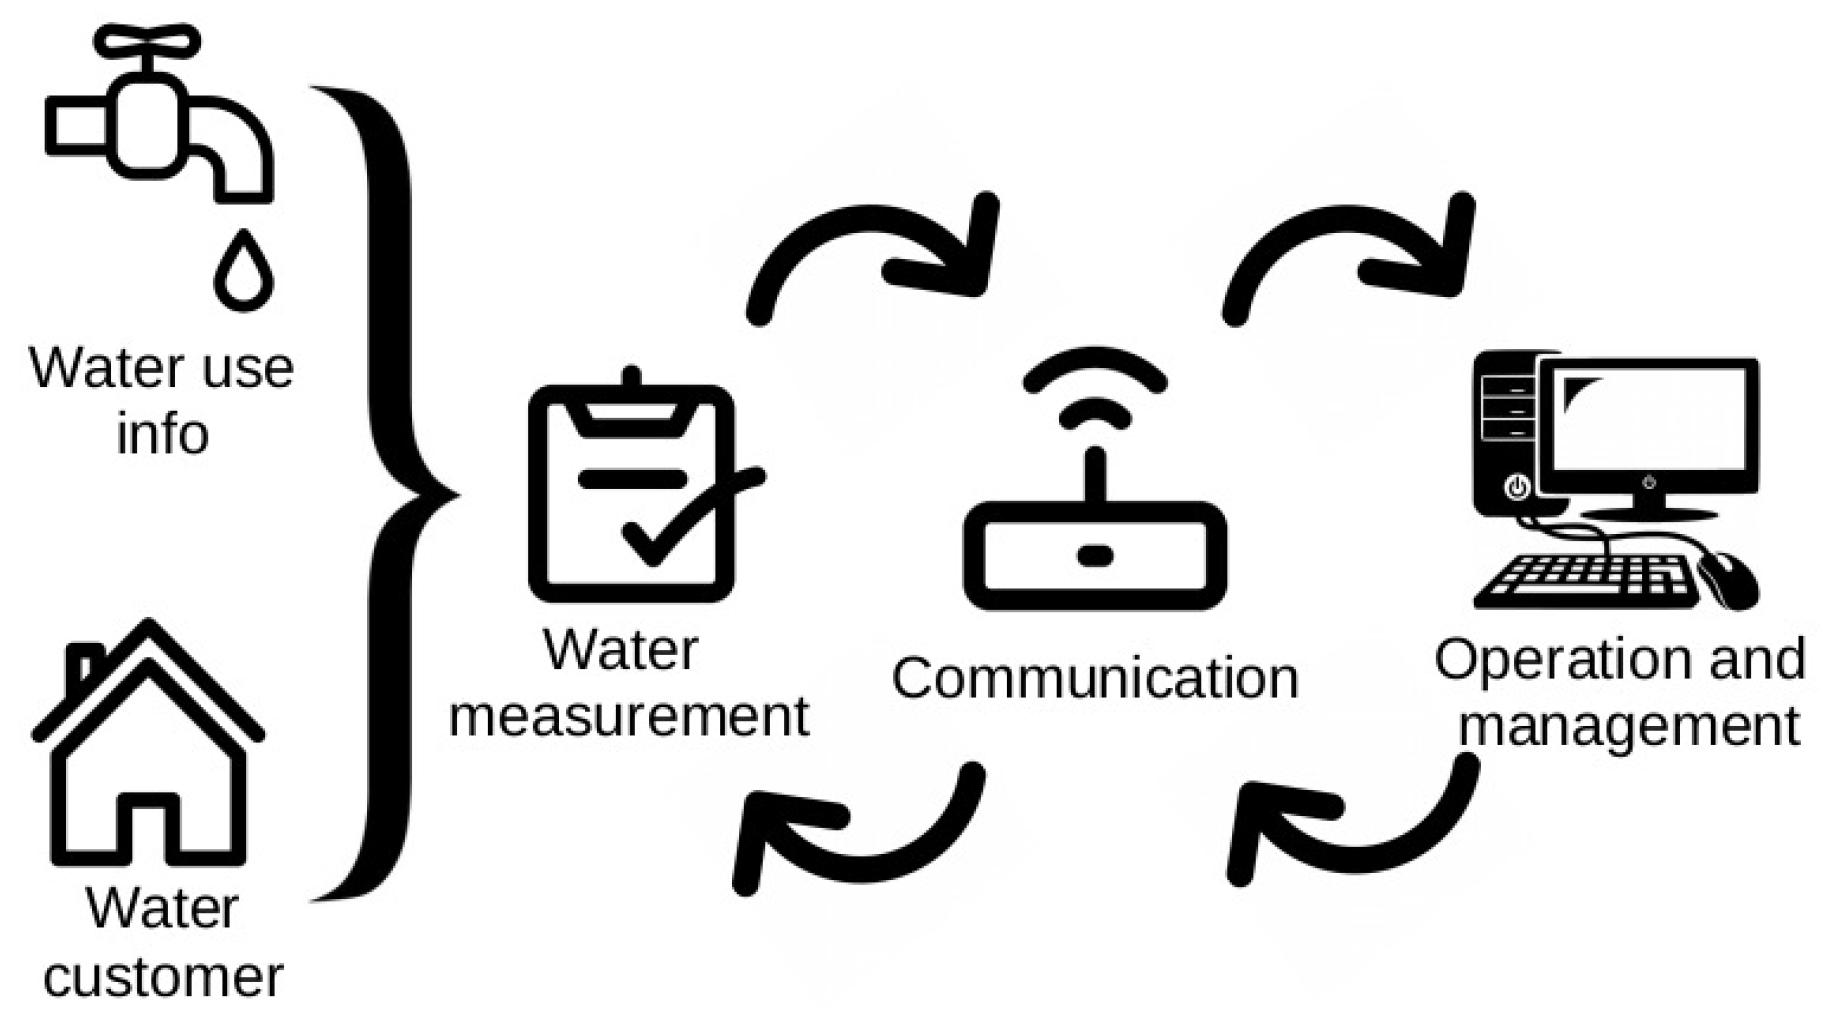
2.1.2. Smart Water Metering
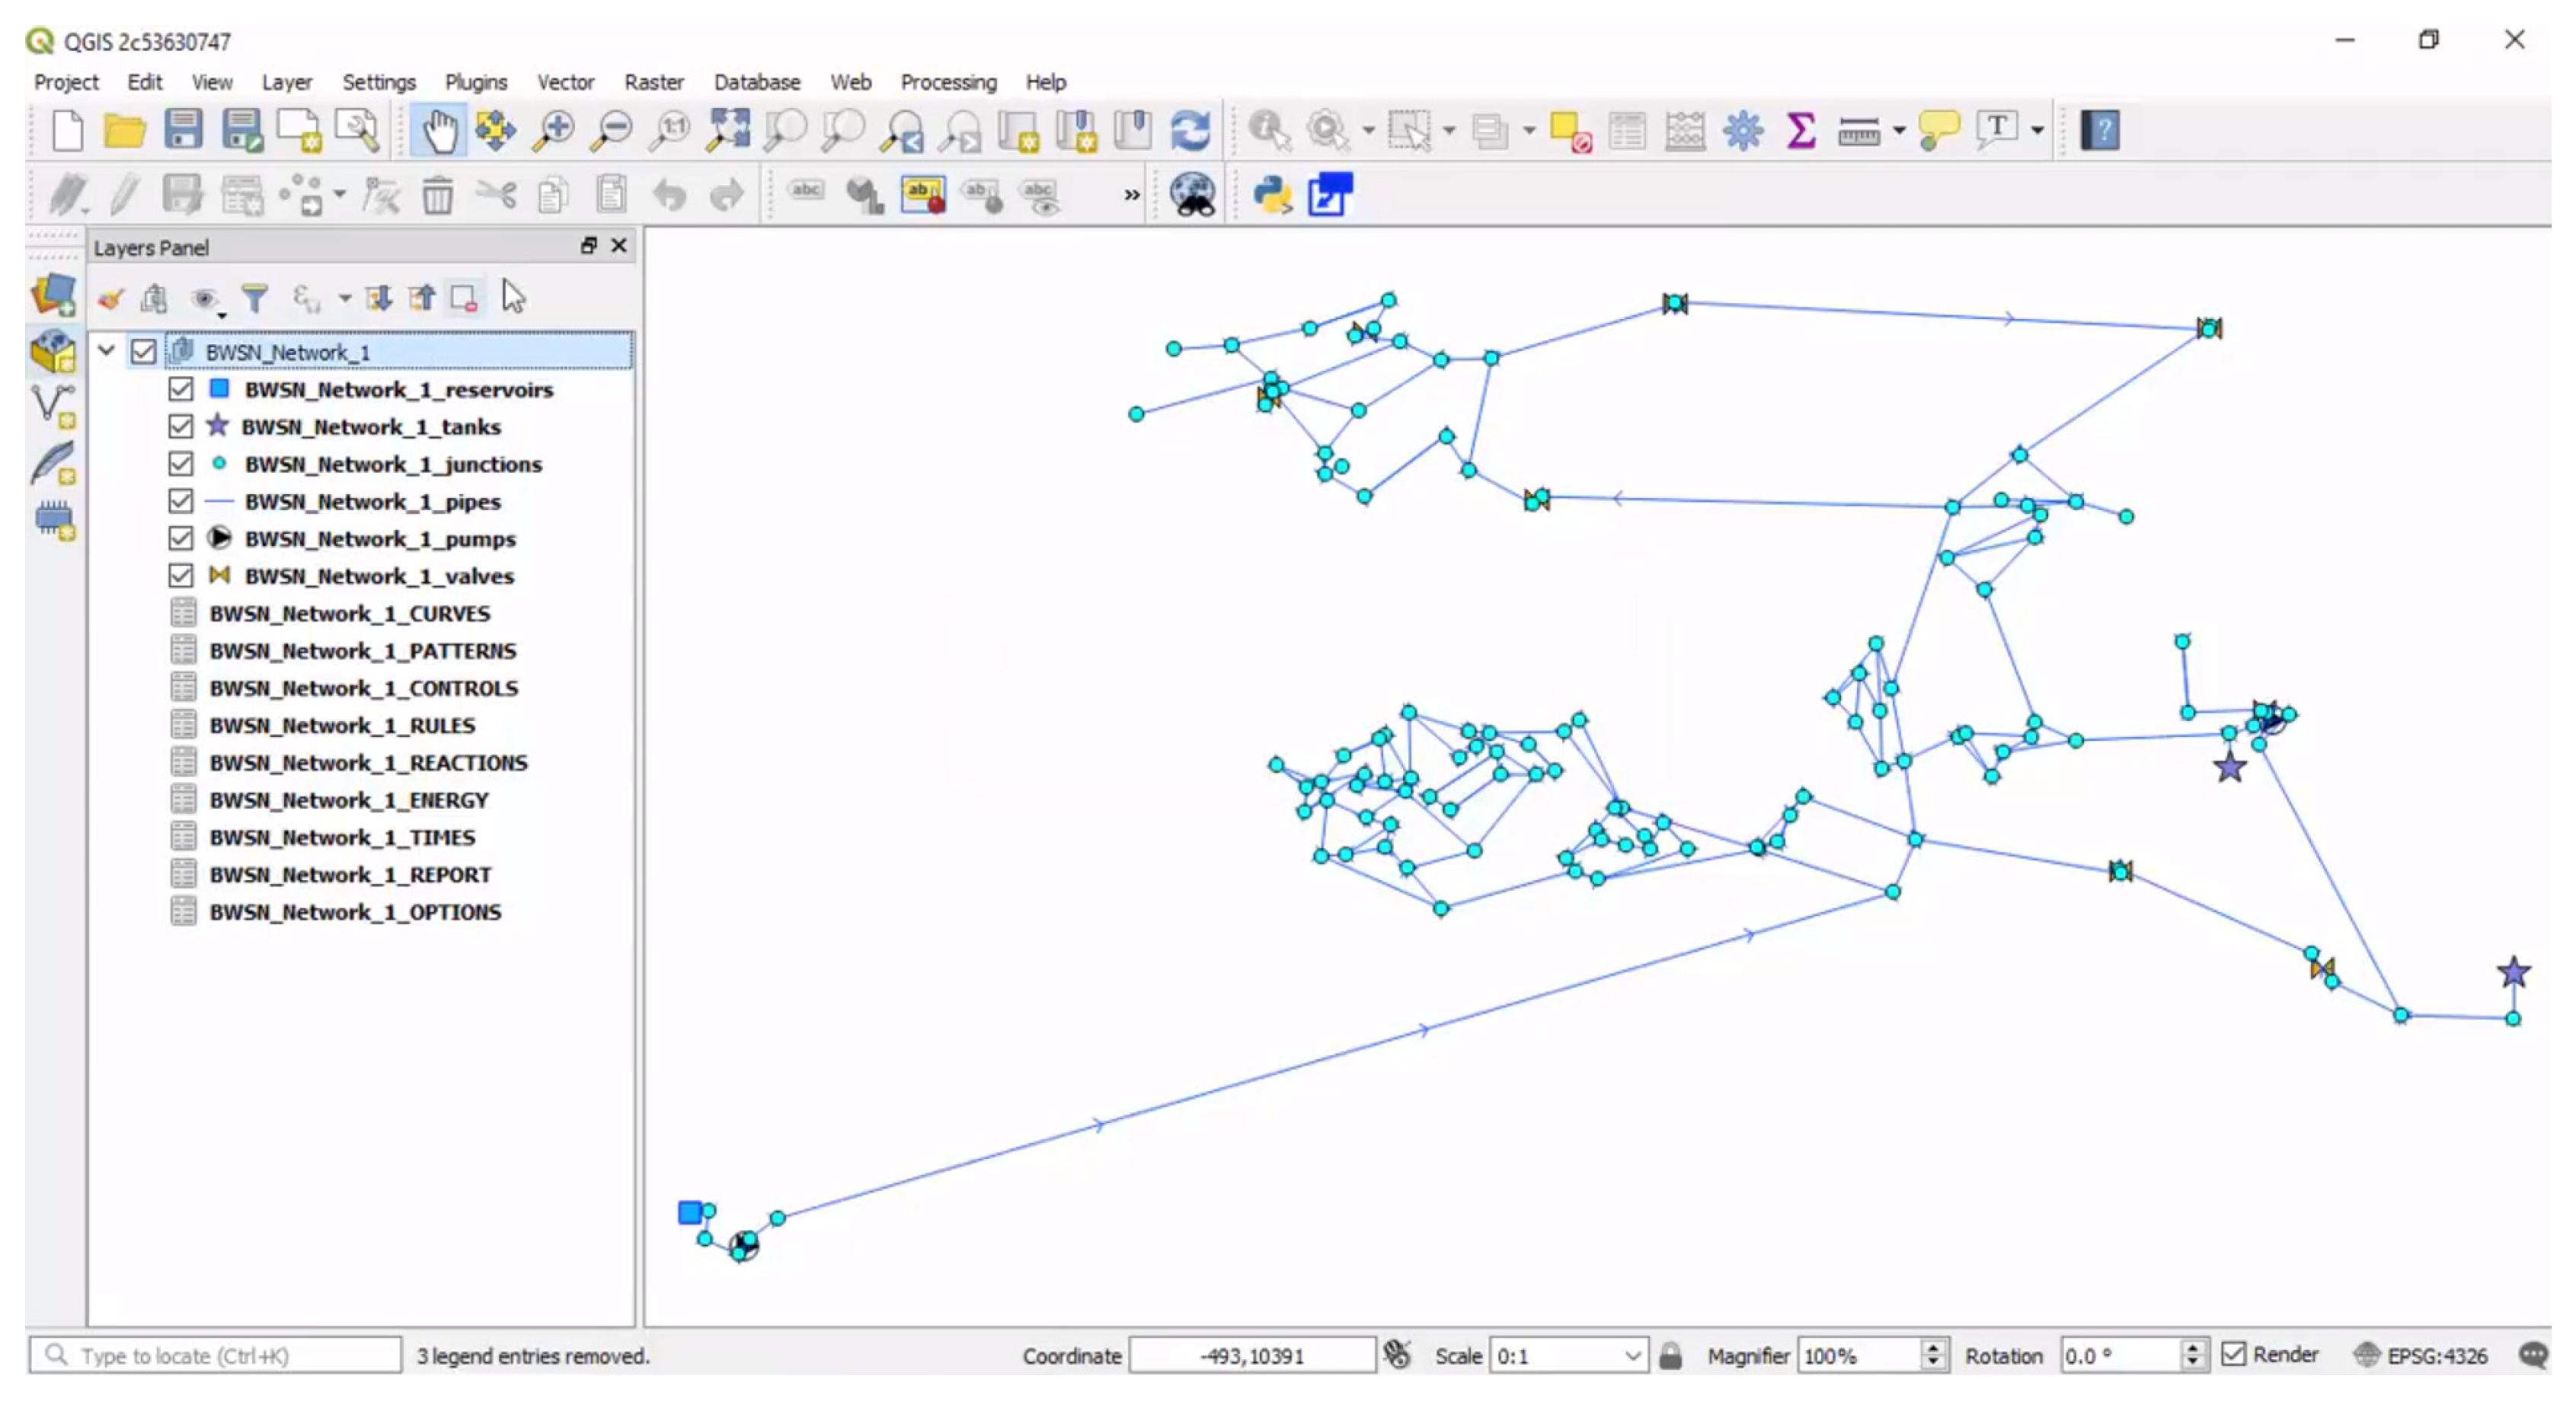
2.1.3. Geographic Information System
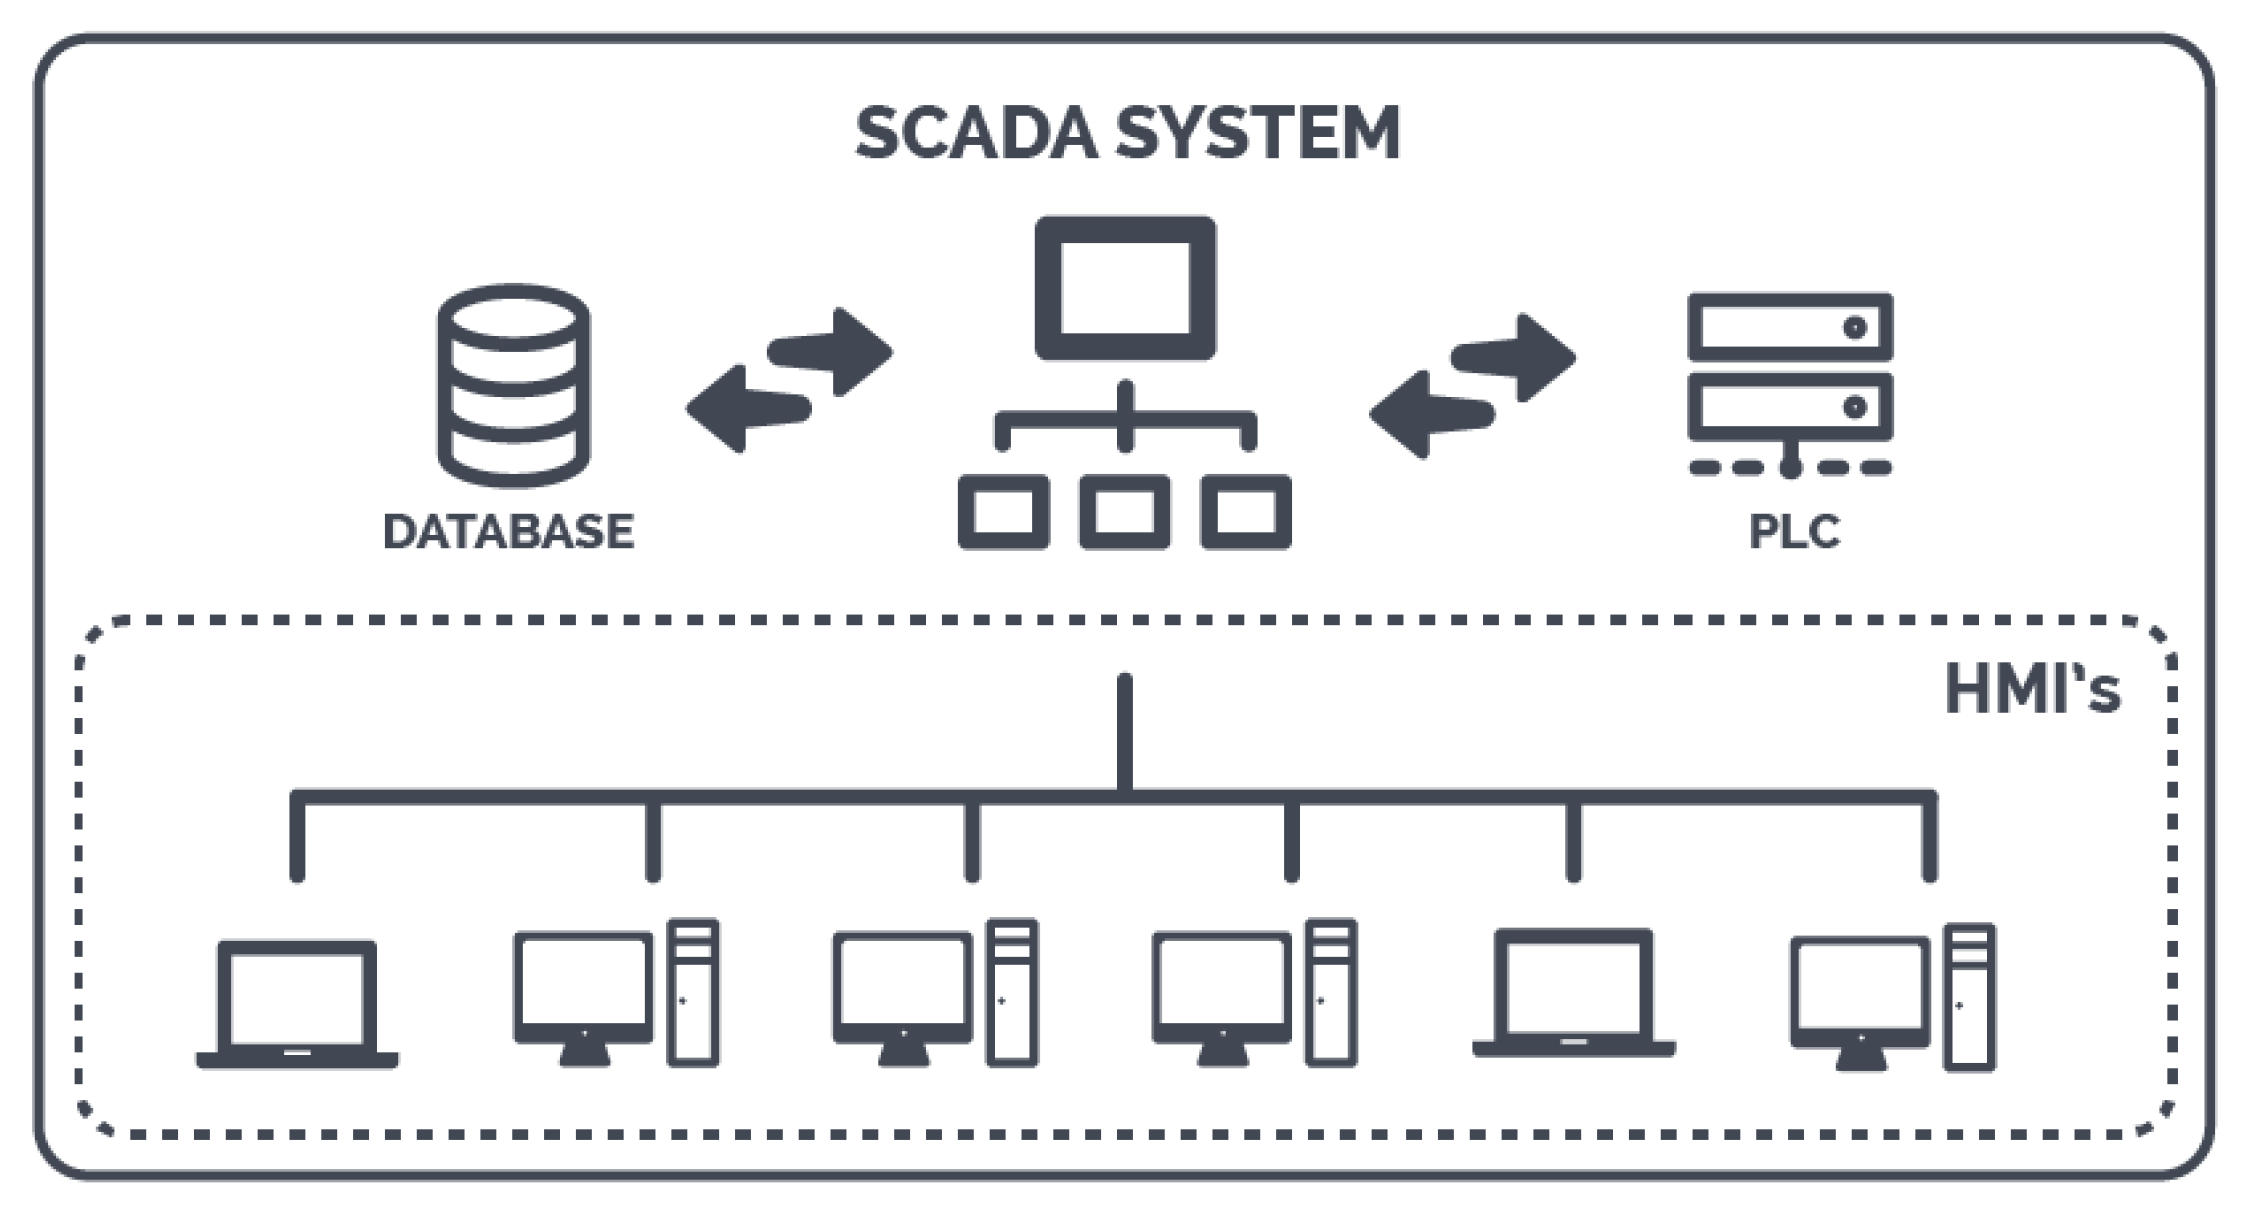
2.1.4. Cloud Computing and Scada
2.2. Management Models and Decision Support Systems
2.2.1. Near Real-Time Models
2.2.2. Asset Management
3. Energy Recovery Systems
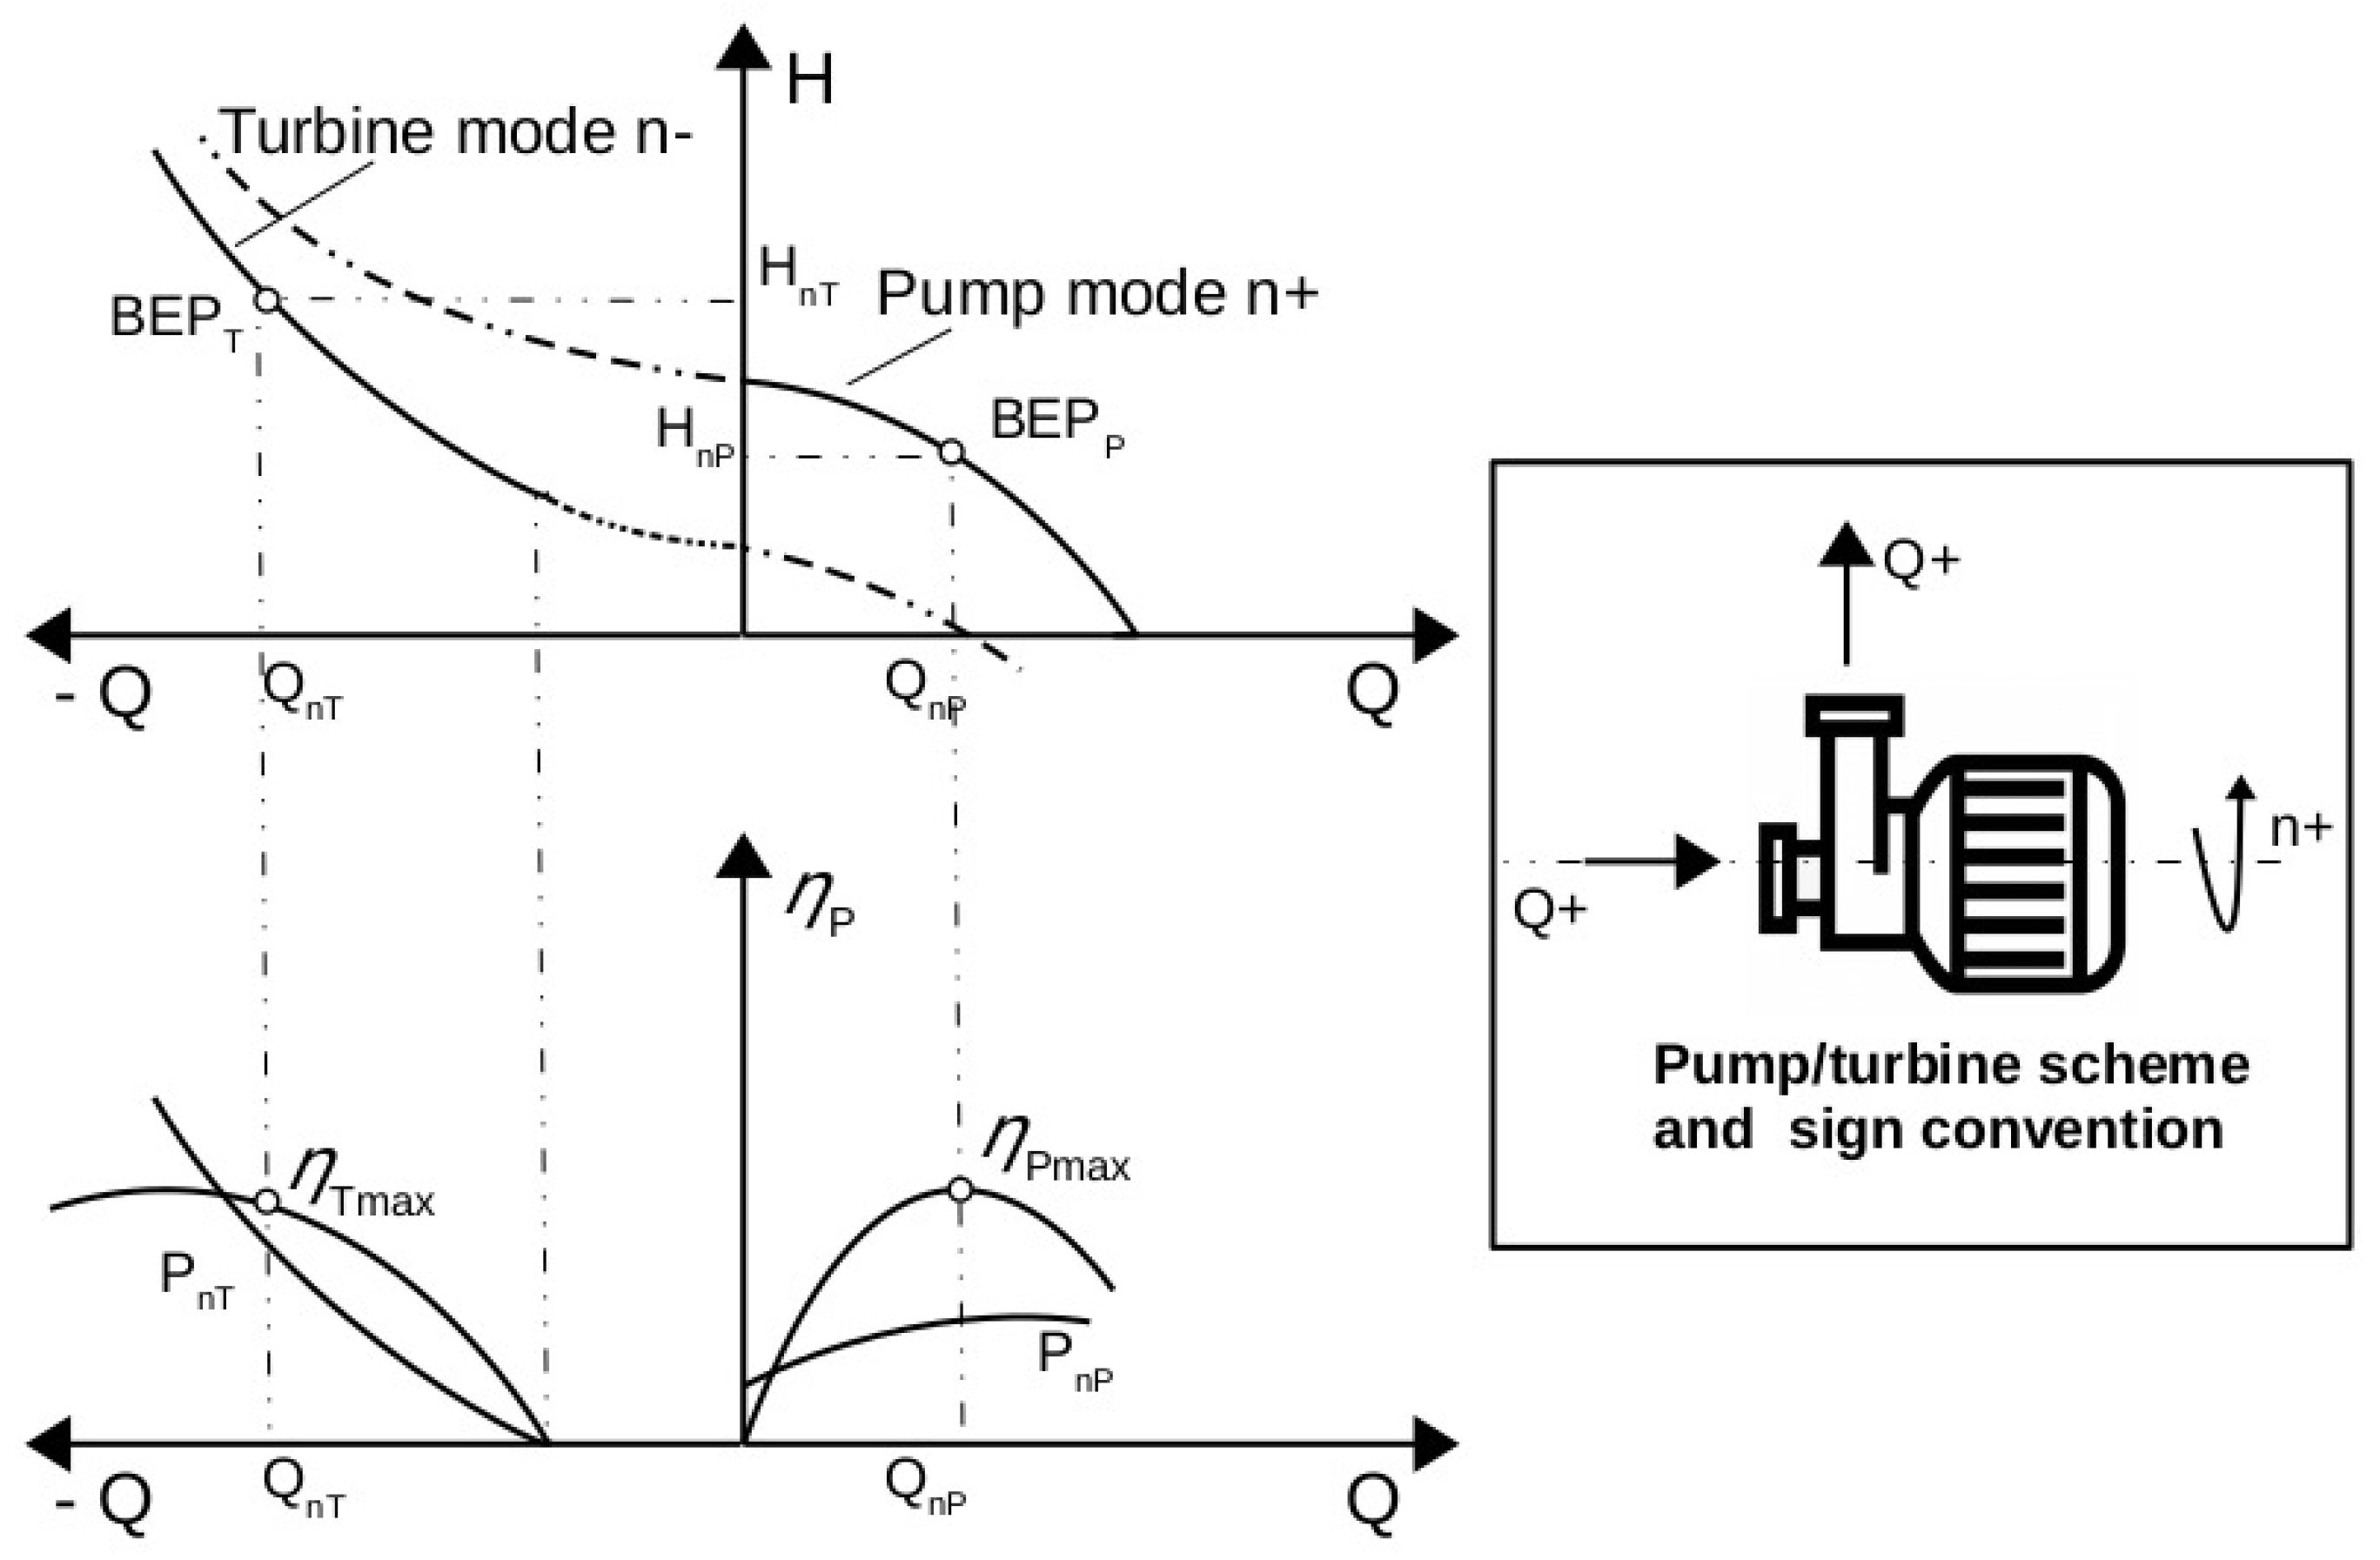
- The main instance of impulse turbines is the Pelton impeller-turbine [57]. These turbines are characterised by the flow passing through, ending up at atmospheric pressure. The flow input by the injectors is shot at the bucket impeller. This makes the runner spin to create kinetic energy. The turbine can lose its efficiency if the water jet is not correctly directed to the buckets.
- Reaction turbine examples include the Francis and the Kaplan turbines. The Francis turbine is a radial-inflow hydraulic turbine that can efficiently work for a large range of head and flow values [58]. Kaplan turbines, on the other hand, are adapted for high flow rates with low heads. This type of propeller turbine has the advantage of having variable vanes that adjust to the flow [57].
- Geometric similarity: Dimension of the turbine cannot be reduced to a smaller scale which can induce scale effects in the prototype.
- Kinematic similarity: The triangle of velocities is equivalent in the inlet and outlet and dynamic similarity the polygon of forces must be similar both in the prototype as in the model.
- Dynamic similarity: This implies that geometric and kinematic similarities are already met. It implies a constant ratio of fluid forces, , for the flow-metering system.
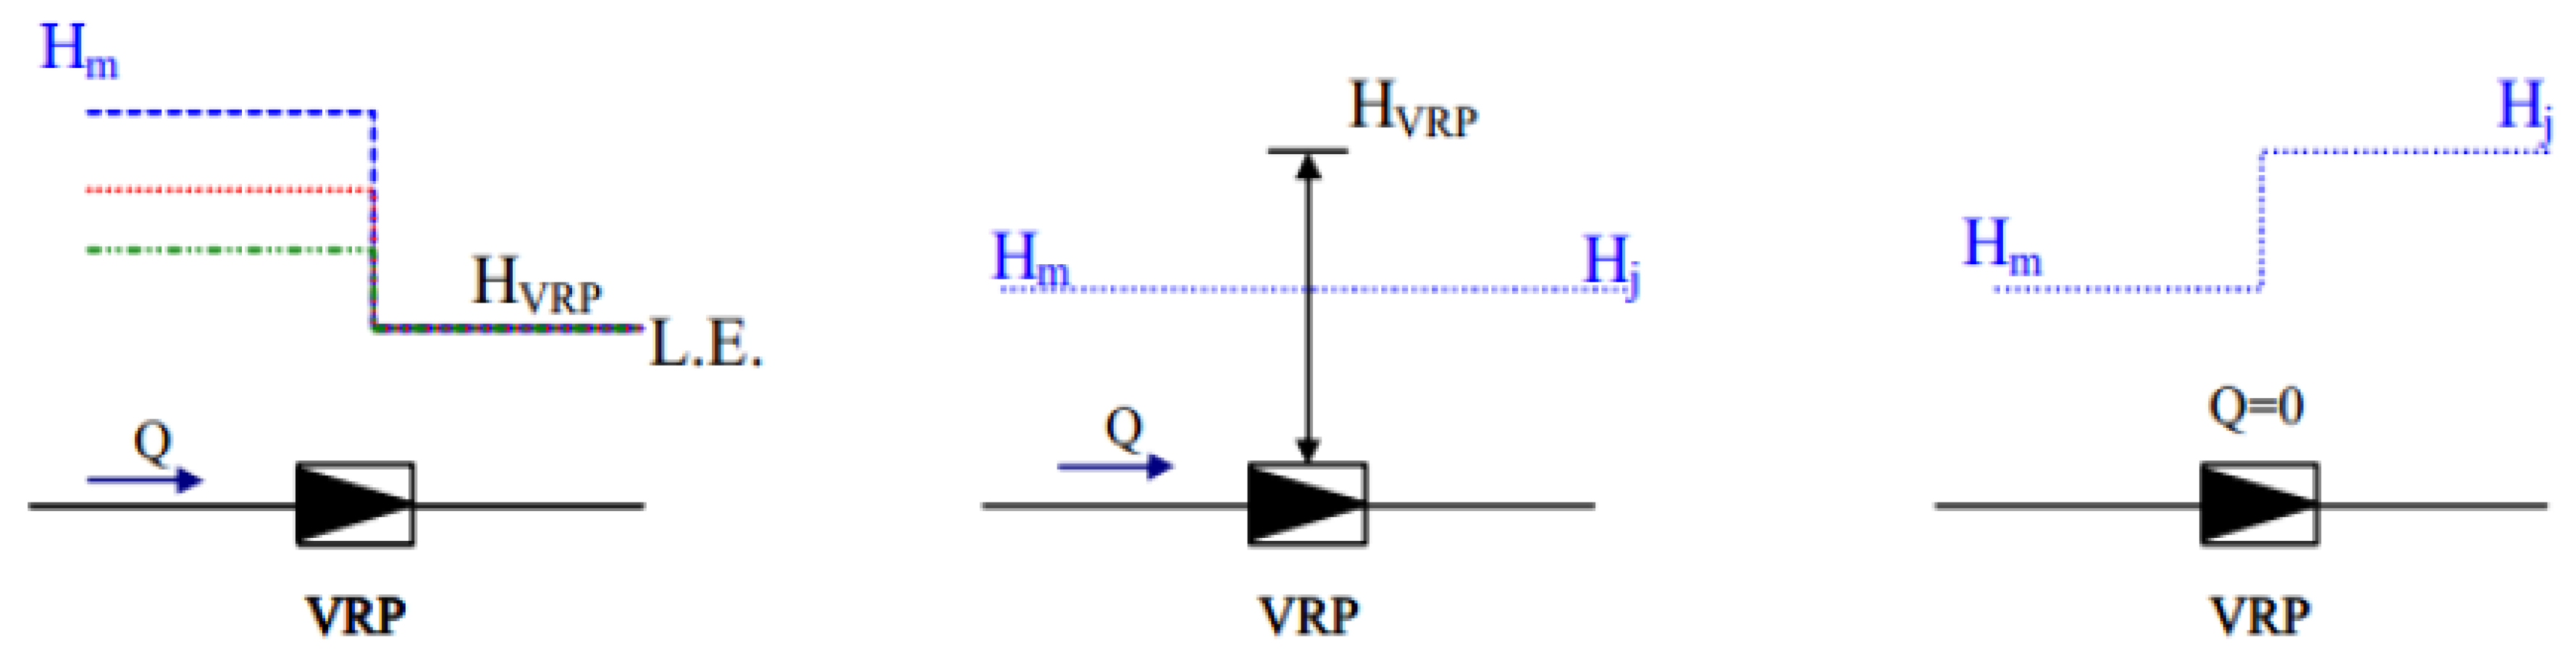
- The first corresponding to , standstill curve, in which values of flow and head lower than this curve do not produce torque.
- Where , shows the values from which the torque is not transmitted to the shaft.
4. Water Network Partitioning and Leakage Control
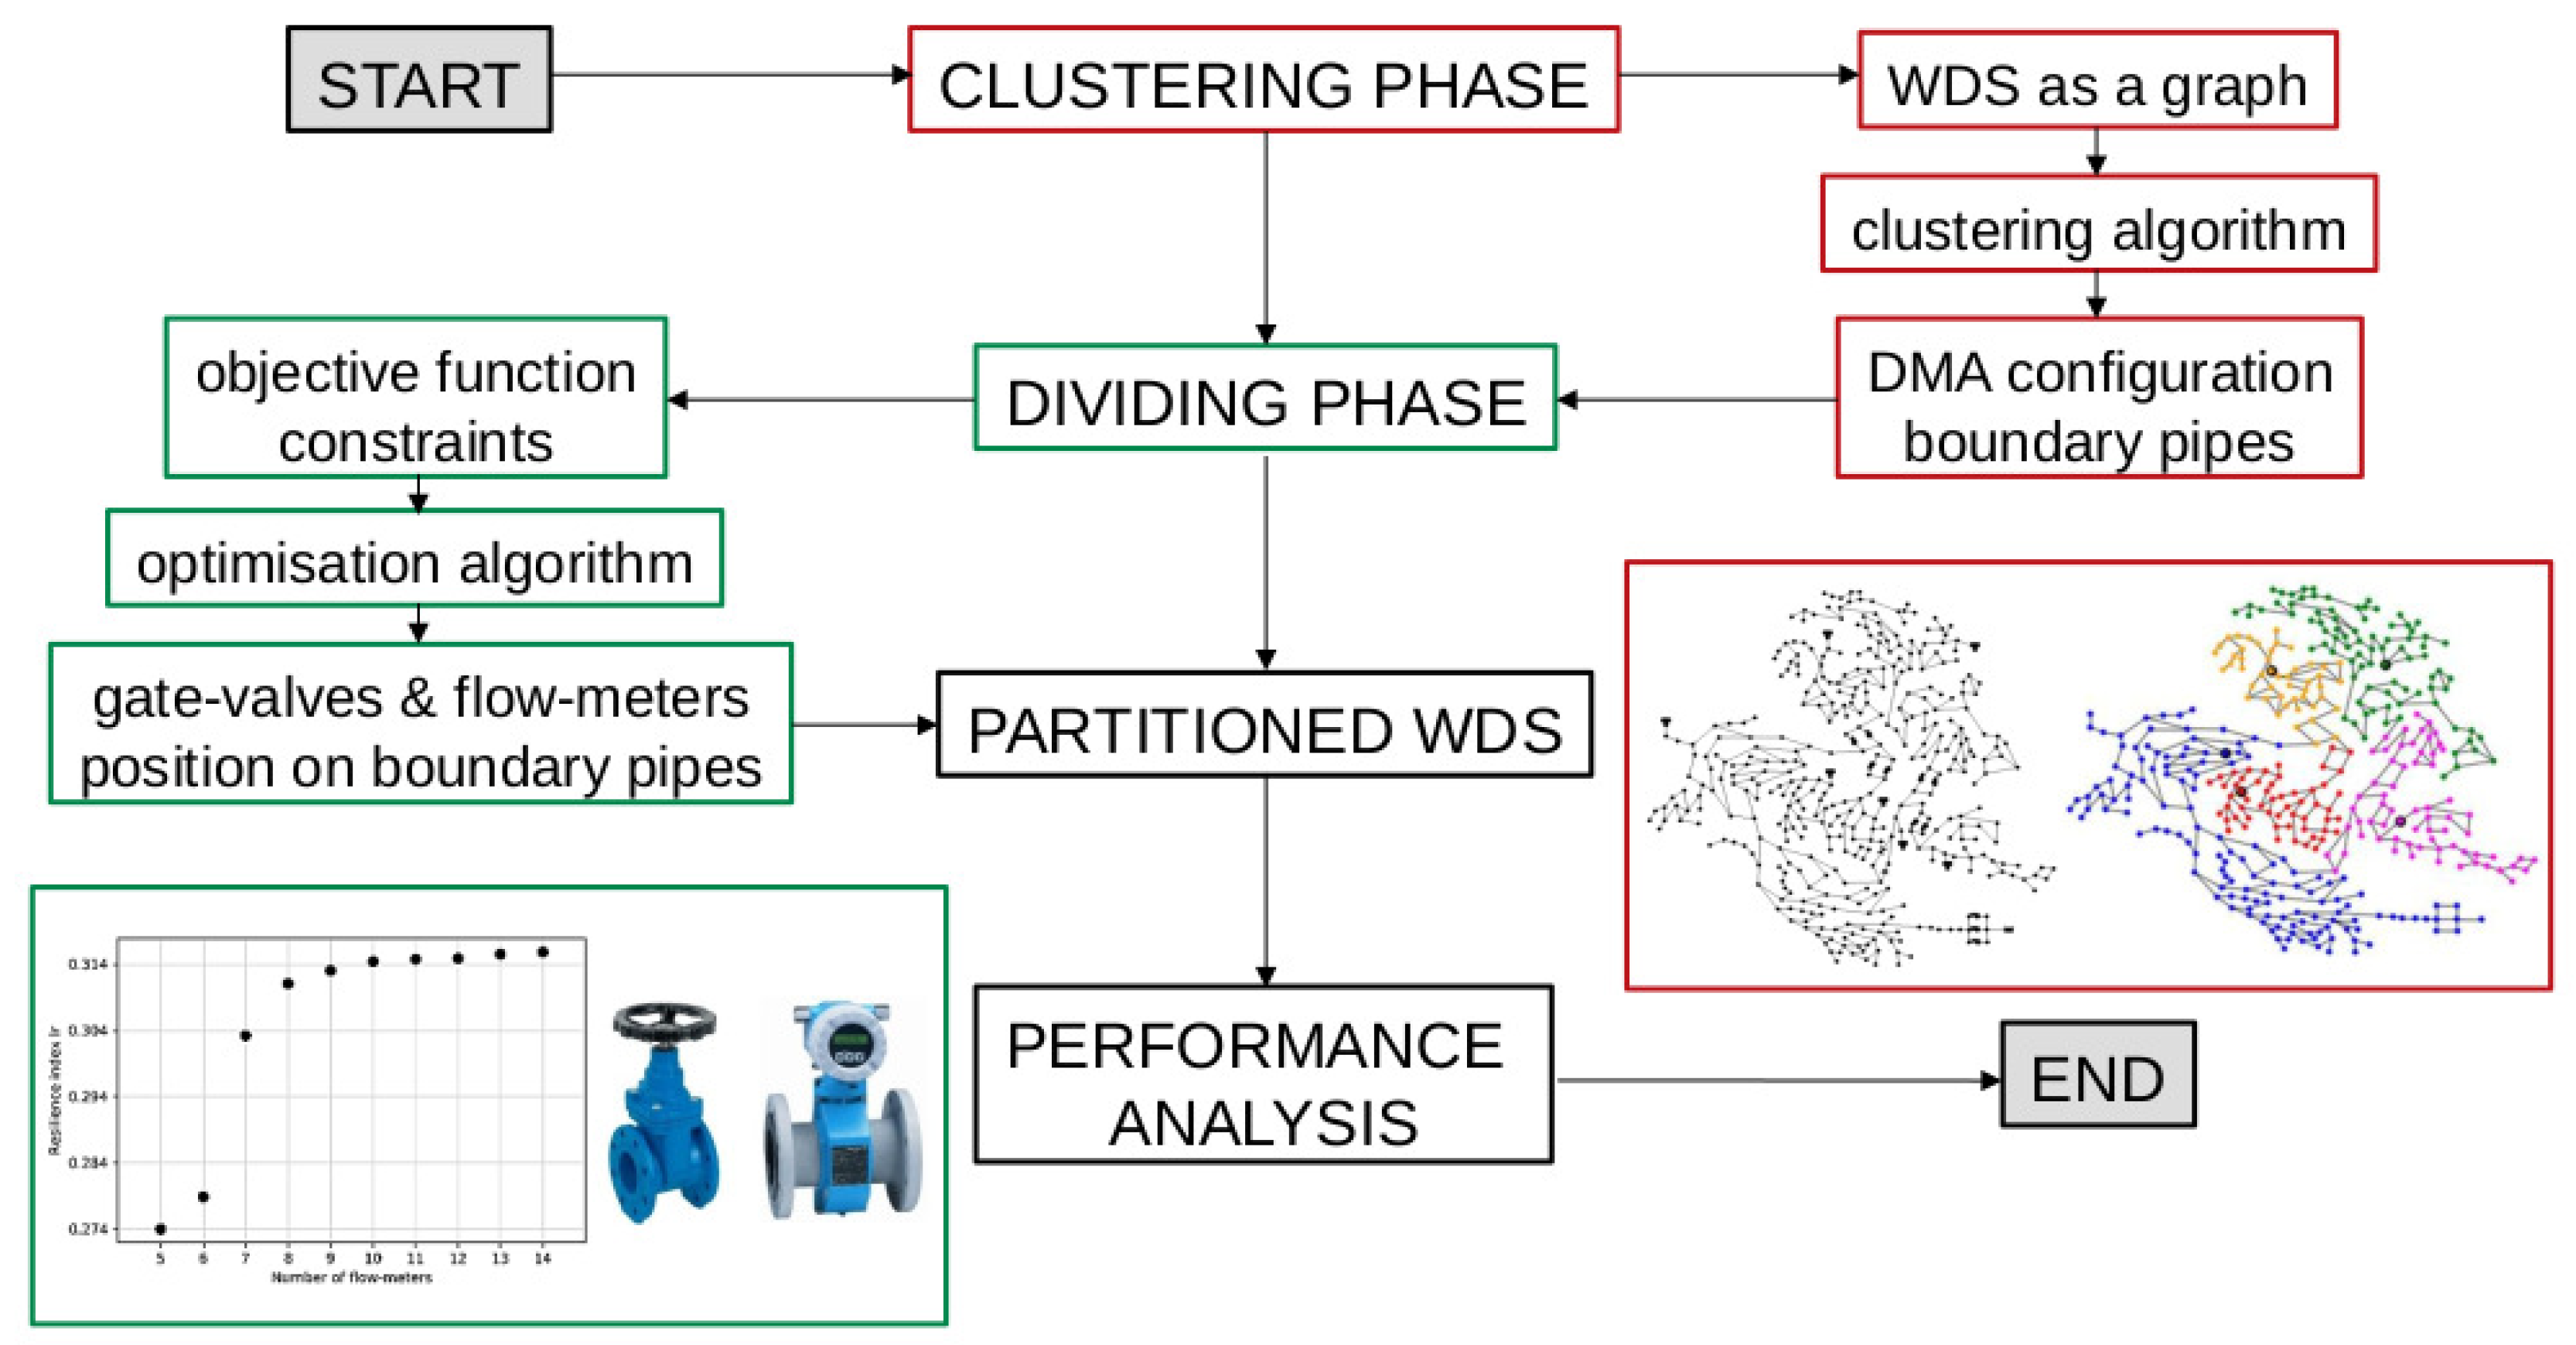
4.1. Water Network Partitioning
- Graph clustering and graph spectral clustering: Graph clustering finds groups in a graph based on different areas of connectivity between nodes. A similarity measure of nodes based on algorithms such as the shortest paths is applied often. There are relevant examples of graph clustering application in the urban water literature [80,81,82]. Spectral clustering has its basis on the Laplacian matrix of the graph representing the water network. The physical properties of the graph Laplacian spectrum, in terms of network connectivity, are further considered to apply traditional clustering algorithms to the subset of eigenvectors associated with the top eigenvalues [83,84,85,86,87].
- Breadth and depth first search: Breadth-first search is a widely used algorithm for traversing a graph, starting from a randomly chosen node of the graph, the procedure then checks its neighbouring nodes (those nodes linked to the initial node) and points to the shorter distance nodes to continue the checking process. A counter of the accumulated distance travelled is recorded if notes are found. A backtrack, depth-first process allows one to return to previous nodes in the path to double check that the route is following the shortest path in this endeavour. This algorithm has been adapted to find groups in networks and is used in urban water studies for network partitioning purposes [88,89].
- Community detection: Community detection algorithms in water networks are based on similarities on such a water network to a social network. Clustering algorithms in social networks are based on detection of areas in which individuals are strongly related (linked) and information is easily spread. This is the fundamental idea, as that adopted in water networks considers consumption points for information sharing [90,91].
- Agent-based systems: Agent-based modelling can model and simulate the evolution of a dynamic, complex system from a distributed approach. That is, by decomposing the system into a collection of autonomous decision-making entities, called agents. Each agent individually assesses its situation and makes decisions on the basis of a set of rules which allow them to reach individual and common objectives. To this end, the agents evolve themselves, interacting with the environment and with other agents via coordination, cooperation and competition, among other actions. To divide a water network into DMAs, agents are considered the consumption nodes and have varying properties (demand, pressure, cluster membership, etc.). Agents communicate/negotiate with others by links representing pipes and valves to finally find a distributed notion of similarity and distance that make the higher similarity and/or lower distance network nodes to form clusters [92,93].
4.2. “Less Is More” in Hydraulic Resilience through Wnp
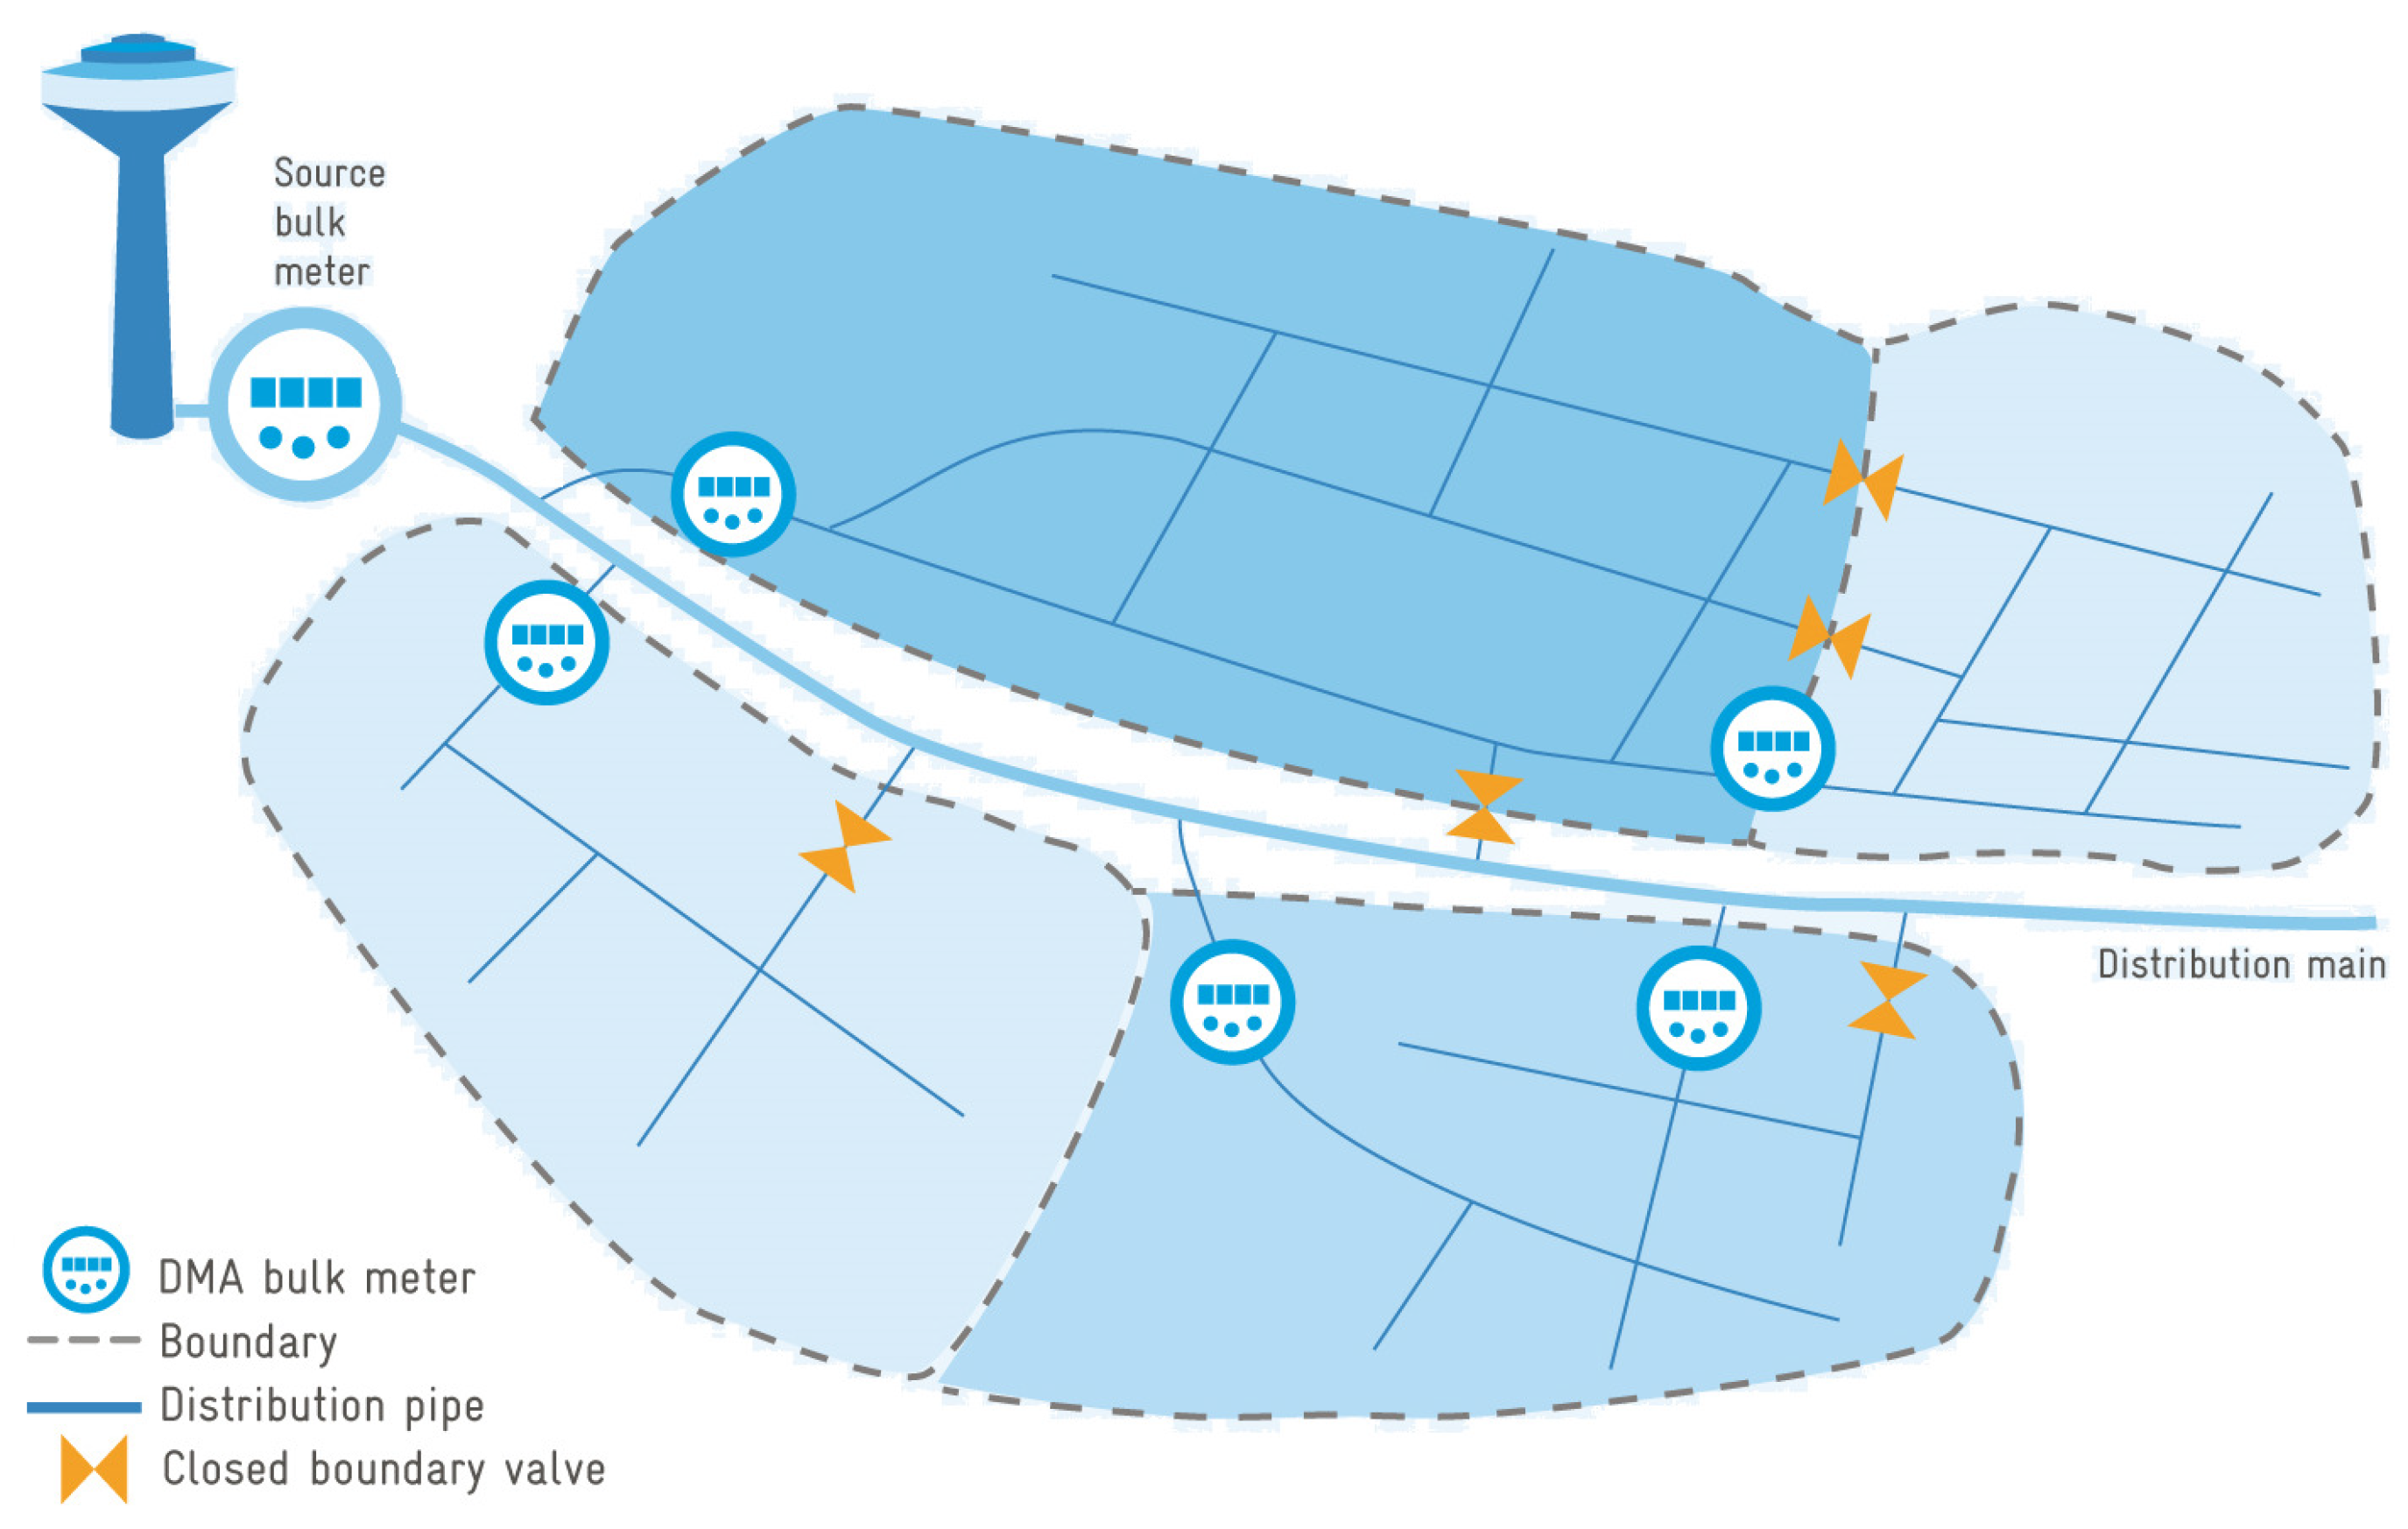
- Robustness: Ability of the system and system elements, to withstand disaster-induced damage and disruption without significant degradation or loss of performance. WNP allows one to divide the system in areas of a similar hydraulic head, uniformly all over the system, and limiting the oscillations between night and day. This leads to a significant reduction in stress on pipes and devices that consequently preserves, for a longer period, their mechanical performance.
- Redundancy: Extent to which system elements are replaceable, or equivalently, extent to which alternative paths and modes can be employed if some elements lose function. Due to the closure of some boundary pipes, WNP leads to a loss in both topological and energy redundancy, since some alternative paths are precluded. However, the possibility to isolate districts from the rest of the system during an abnormal event (e.g., pipe breakage, contamination) allows one to isolate the problem as well as guarantee normal functioning.
- Resourcefulness: Ability to diagnose and prioritise problems and to initiate solutions by identifying and mobilising material, monetary, informational, technological, and human resources. By splitting the system in monitored sub-areas, WNP allows one to separately manage them. Thus, efficiency is increased by the prioritisation of interventions.
- Rapidity: Capacity to restore functionality in a timely way, containing losses and avoiding disruptions. WNP’s inherent division of the system in smaller areas, allows to focus each to operate in a more efficient way and adapt rapidly to any problem in corresponding districts.
5. Emergent Paradigm of Digital Water and Future Research Directions
- Distributed systems management as an efficient methodology to deal with big data streams coming at near real-time from the cyber-physical structure controlling and monitoring the smart water grid.
- Innovative and necessary data analysis methodologies for increasing the efficiency and benefit of the decision-making processes. These methodologies can be found within the subjects of machine learning and artificial intelligence, big data, complexity science, and robotics.
- Water companies are an important, active stakeholder in digital water. This brings to the overall process the need of a business reconfiguration, implying a multiscale thinking in which individual assets play an important role in the global physical and digital infrastructure. Along with their interrelationship to other utilities and the society network as a customer.
- There is a disruption of new markets and business models around the digital water management. Data again plays a pivotal role in this and new technologies, such as blockchain, allow for secure data sharing and decision making in case multiple companies and stakeholders can be involved in the overall approach.
5.1. Future Technologies for Smart Water Grids
- Cyber-physical systems: The concept of a smart water grid is directly related to a CPS [110]. In the case of a water distribution system, these are the set of sensors, smart monitors, and actuators distributed along the physical infrastructure. Internet of Things (IoT) is the main vehicle for communication in a CPS and for endowing the system with an optimal decision-making capability both in a hierarchical and a distributed manner [111]. Directly related to SCADA and a near real-time water operation and management [112], the benefits of a CPS expand to an online knowledge of the hydraulic state of a water distribution system [113], safety and security [114,115], contamination detection in a water distribution system [116], and optimal performance [117], among others.
- Digital twins: The paradigm of the digital twin is closely related to digital water. DT models map near real-time data and updated models from the assets of the CPS to a high resolution digital system reproduction. The aim for digital twins’ models of water distribution systems is to reproduce disruption scenarios for resilience assessment purposes, to validate beforehand new solutions for network configurations, and to analyse asset prognosis and health-status to determine proactive maintenance models. DTs are still a paradigm to explore further in urban water. Conejos et al. [118] presented one of the first scientific articles in this regard, as more of the development so far in DTs for urban water is directly approached by innovation teams within water utilities. DTs have been an enormous development in the last years by the deployment of twins. The challenge for water utilities and urban water researchers is to consider the complexity of dealing with a network of assets, along with their interaction models and data sharing and management.
- Blockchain technologies: Blockchain can be considered a decentralised database with the records partitioned into blocks forming a chain configuration. The information at each block is only a partial view of the data. Therefore, the partition of the records into blocks guarantees a safe and secure access to information, when it is shared by multiple stakeholders. This is a step-forward to address data security issues associated with the new business of digital water. The blocks of information can be considered as network nodes and the operations between them are network links. This complex network approach to blockchain technologies generates new paradigms about the database synchronisation and control [119] and the further use of machine learning models for an optimal database management and representation [120].
5.2. Future Model Analytics for Smart Water Grids
- Network dynamics: Now to consider the difference between “dynamic of networks” (as a variation on time of configuration; network topology—and number of the nodes and links of a network) and “dynamics on networks” as a variation on time of nodes and links weights or values; likely depending on the network flow and node demand. Multilayer networks can be defined as multiple interconnected networks, each can represent another network or a variation of the original network (regarding its topology or element status) [121]. In the latter, through a snapshot of the network at each time and per individual network layer. Considering network dynamics within the formal framework of multilayer networks is, therefore, an open research avenue for researchers and practitioners in smart water grids, where complex network analysis already plays a pivotal role. The challenge of time series processes in networks can be extended to other statistical and machine learning methods approached on networks [122].
- Geometric deep learning: It is a new emergent topic in which convolutional neural networks (CNN), mainly focused so far on image analysis, are used for manifolds and graph-structured databases [123]; having inherited the name for the latest of graph-CNN or directly graph neural networks (GNN). During an image analysis, a series of convolutional filters and pooling CNN layers extract relevant features and patterns in an image. The operations are of similar nature in geometric deep learning but approached over the adjacency or the Laplacian matrix of the graph representing, in this case, the smart water grid. The main characteristic to adopt and adapt CNNs to complex networks is to consider those matrices representing such networks that preserve spatial meaning of that, along with another properties of interest. Problems related to a smart water grid monitor and control can be approached through geometric deep learning in addition to a number of other important applications [124].
6. Conclusions
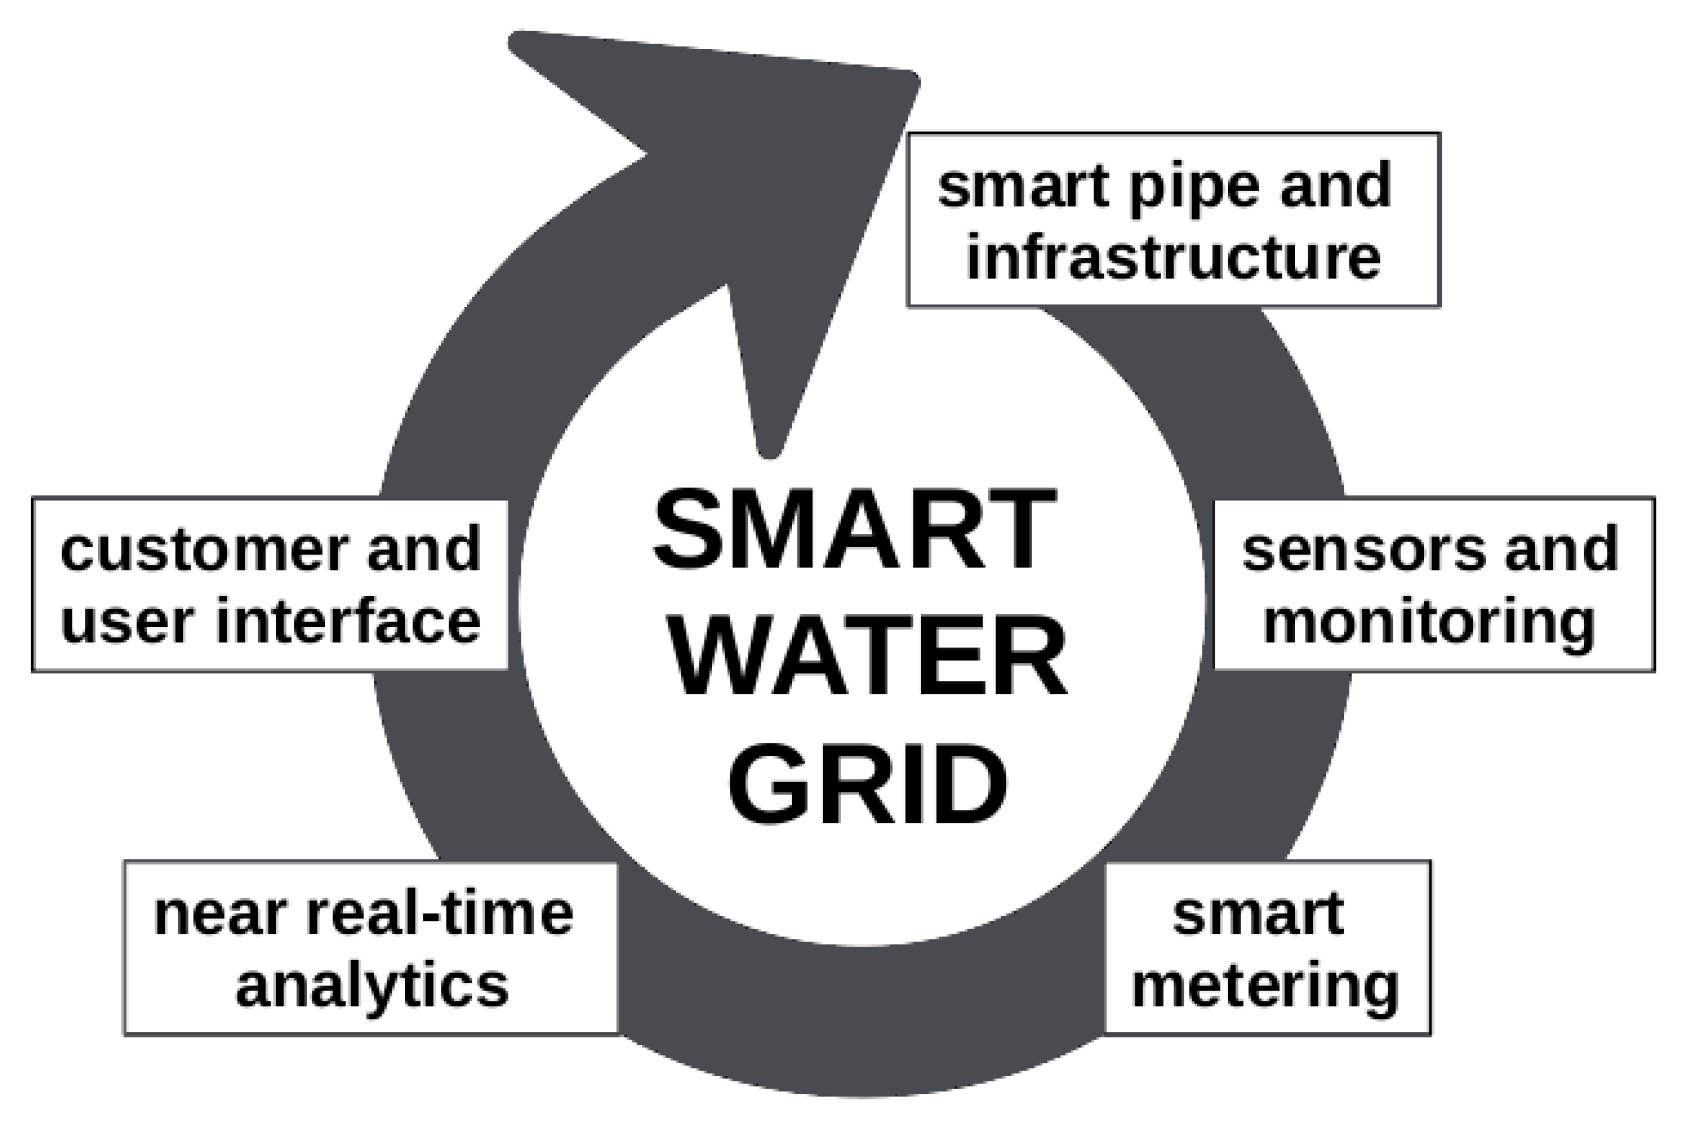
- Technologies: smart pipe and sensors, smart water metering, GIS and SCADA have been introduced in this manuscript as key technologies to accomplish the paradigm of a smart water grid. Cyber-physical systems, digital twins, and blockchain have been identified as future breakthrough technologies.
- Models: The importance of counting on near real-time models has also been highlighted in the document, showing how they may lead to an improved water efficiency and more reliable operations. In this regard, the role of asset management models in smart water grids have also been discussed. Complex networks (dynamics) and geometric deep learning were foreseen as key basis for any future model development in smart water grids.
- Strategies: A main part of the document is dedicated to describe and propose the use of strategies for energy recovery and water network partitioning. Both points have the common objective of improving the water network efficiency.
Author Contributions
Funding
Conflicts of Interest
References
- Herrera, M.; Ferreira, A.A.; Coley, D.A.; de Aquino, R.R. SAX-quantile based multiresolution approach for finding heatwave events in summer temperature time series. AI Commun. 2016, 29, 725–732. [Google Scholar] [CrossRef] [Green Version]
- Hernandez, P.; Kenny, P. From net energy to zero energy buildings: Defining life cycle zero energy buildings (LC-ZEB). Energy Build. 2010, 42, 815–821. [Google Scholar] [CrossRef]
- Keyhani, A. Smart power grids. In Smart Power Grids 2011; Springer: Berlin/Heidelberg, Germany, 2012; pp. 1–25. [Google Scholar]
- Sachidananda, M.; Webb, D.P.; Rahimifard, S. A concept of water usage efficiency to support water reduction in manufacturing industry. Sustainability 2016, 8, 1222. [Google Scholar] [CrossRef] [Green Version]
- Boyle, T.; Giurco, D.; Mukheibir, P.; Liu, A.; Moy, C.; White, S.; Stewart, R. Intelligent metering for urban water: A review. Water 2013, 5, 1052–1081. [Google Scholar] [CrossRef] [Green Version]
- Butler, D.; Farmani, R.; Fu, G.; Ward, S.; Diao, K.; Astaraie-Imani, M. A new approach to urban water management: Safe and sure. Procedia Eng. 2014, 347–354. [Google Scholar] [CrossRef] [Green Version]
- Mala-Jetmarova, H.; Sultanova, N.; Savic, D. Lost in optimisation of water distribution systems? A literature review of system design. Water 2018, 10, 307. [Google Scholar] [CrossRef] [Green Version]
- Anele, A.O.; Hamam, Y.; Abu-Mahfouz, A.M.; Todini, E. Overview, comparative assessment and recommendations of forecasting models for short-term water demand prediction. Water 2017, 9, 887. [Google Scholar] [CrossRef] [Green Version]
- Monks, I.; Stewart, R.A.; Sahin, O.; Keller, R. Revealing unreported benefits of digital water metering: Literature review and expert opinions. Water 2019, 11, 838. [Google Scholar] [CrossRef] [Green Version]
- Rahim, M.S.; Nguyen, K.A.; Stewart, R.A.; Giurco, D.; Blumenstein, M. Machine Learning and Data Analytic Techniques in Digital Water Metering: A Review. Water 2020, 12, 294. [Google Scholar] [CrossRef] [Green Version]
- Makropoulos, C.; Savić, D. Urban hydroinformatics: Past, present and future. Water 2019, 11, 1959. [Google Scholar] [CrossRef] [Green Version]
- Onishi, M.; Kageyama, K. Smart Water Management and Usage Systems for Society and Environment. Hitachi Rev. 2011, 60, 165. [Google Scholar]
- Ramos, H.M.; Carravetta, A.; Nabola, A.M. New Challenges in Water Systems. Water 2020, 12, 2340. [Google Scholar] [CrossRef]
- Howell, S.; Rezgui, Y.; Beach, T. Integrating building and urban semantics to empower smart water solutions. Autom. Constr. 2017, 81, 434–448. [Google Scholar] [CrossRef]
- Mounce, S.; Pedraza, C.; Jackson, T.; Linford, P.; Boxall, J. Cloud based machine learning approaches for leakage assessment and management in smart water networks. Procedia Eng. 2015, 119, 43–52. [Google Scholar] [CrossRef] [Green Version]
- Di Nardo, A.; Di Natale, M.; Giudicianni, C.; Santonastaso, G.; Savic, D. Simplified approach to water distribution system management via identification of a primary network. J. Water Resour. Plan. Manag. 2018, 144, 04017089. [Google Scholar] [CrossRef]
- Lombardi, P.; Giordano, S.; Farouh, H.; Yousef, W. Modelling the smart city performance. Innov. Eur. J. Soc. Sci. Res. 2012, 25, 137–149. [Google Scholar] [CrossRef]
- Colldahl, C.; Frey, S.; Kelemen, J.E. Smart Cities: Strategic Sustainable Development for an Urban World; School of Engineering, Blekinge Institute of Technology: Karlskrona, Sweden, 2013. [Google Scholar]
- Nam, T.; Pardo, T.A. Conceptualizing smart city with dimensions of technology, people, and institutions. In Proceedings of the 12th Annual International Digital Government Research Conference: Digital Government Innovation in Challenging Times, College Park, MD, USA, 12–15 June 2011; pp. 282–291. [Google Scholar]
- Dobbie, M.F.; Brown, R.R.; Farrelly, M.A. Risk governance in the water sensitive city: Practitioner perspectives on ownership, management and trust. Environ. Sci. Policy 2016, 55, 218–227. [Google Scholar] [CrossRef]
- Hellström, D.; Jeppsson, U.; Kärrman, E. A framework for systems analysis of sustainable urban water management. Environ. Impact Assess. Rev. 2000, 20, 311–321. [Google Scholar] [CrossRef]
- Lin, Y.F.; Liu, C.; Whisler, J. Smart pipe—Nanosensors for monitoring water quantity and quality in public water systems. In Proceedings of the World Environmental and Water Resources Congress 2009, Great Rivers, Kansas City, MO, USA, 17–21 May 2009; pp. 1–8. [Google Scholar]
- Sadeghioon, A.M.; Metje, N.; Chapman, D.N.; Anthony, C.J. SmartPipes: Smart wireless sensor networks for leak detection in water pipelines. J. Sens. Actuator Netw. 2014, 3, 64–78. [Google Scholar] [CrossRef]
- Maas, C.; McClenaghan, T.; Pleasance, G. The Water-Energy Nexus. Linking Water and Energy in Ontario Policy; Policy Report; About the Water Conservation Alliance: Otawa, ON, Canada, 2010. [Google Scholar]
- Ntuli, N.; Abu-Mahfouz, A. A simple security architecture for smart water management system. Procedia Comput. Sci. 2016, 83, 1164–1169. [Google Scholar] [CrossRef] [Green Version]
- Britton, T.C.; Stewart, R.A.; O’Halloran, K.R. Smart metering: Enabler for rapid and effective post meter leakage identification and water loss management. J. Clean. Prod. 2013, 54, 166–176. [Google Scholar] [CrossRef] [Green Version]
- Hall, J.; Szabo, J.; Panguluri, S.; Meiners, G. Distribution System Water Quality Monitoring: Sensor Technology Evaluation Methodology and Results. In A Guide for Sensor Manufacturers and Water Utilities; Technical Report; Environmental Protection Agency: Washington, DC, USA, 2009. [Google Scholar]
- Sharvelle, S.; Dozier, A.; Arabi, M.; Reichel, B. A geospatially-enabled web tool for urban water demand forecasting and assessment of alternative urban water management strategies. Environ. Model. Softw. 2017, 97, 213–228. [Google Scholar] [CrossRef]
- Rossman, L.A. EPANET 2: Users Manual; Technical Report; US Environmental Protection Agency Office of Research and Development: Cincinnati, OH, USA, 2000.
- Kyriakou, M.; Eliades, D. ImportEpanetInpFiles. In Import/Export Epanet INP Files; KIOS, Research and Innovation Center of Excellence: Nicosia, Cyprus, 2016; Available online: https://github.com/KIOSResearch/ImportEpanetInpFiles (accessed on 23 October 2020).
- Menapace, A.; Pisaturo, G.R.; De Luca, A.; Gerola, D.; Righetti, M. EPANET in QGIS framework: The QEPANET plugin. J. Water Supply Res. Technol. AQUA 2020, 69, 1–5. [Google Scholar] [CrossRef]
- Martínez Alzamora, F.; Lerma, N.; Bartolin, H.; Vegas Niño, O. Upgrade of the GISRed application for the free analysis of WDN under GIS environment. In Proceedings of the 17th International Computing & Control for the Water Industry Conference, CCWI, Exeter, UK, 1–4 September 2019; pp. 1–3. [Google Scholar]
- Martínez, F.; Bartolín, H.; Sancho, H.; Ayza, M. GISRed v1.0: Una herramienta SIG de ayuda para la confección de modelos y Planes Directores de redes de distribución del agua. Tecnología del Agua 2004, 250, 32–41. [Google Scholar]
- Boyer, S.A. SCADA: Supervisory Control and Data Acquisition; International Society of Automation: Research Triangle Park, NC, USA, 2009. [Google Scholar]
- Ottenburger, S.; Airaksinen, M.; Pinto-Seppä, I.; Raskob, W. Enhancing urban resilience via a real-time decision support system for smart cities. In Proceedings of the 2017 International Conference on Engineering, Technology and Innovation (ICE/ITMC), Funchal, Portugal, 27–29 June 2017; pp. 836–844. [Google Scholar]
- Marti-Puig, P.; Martí-Sarri, A.; Serra-Serra, M. Different approaches to SCADA data completion in water networks. Water 2019, 11, 1023. [Google Scholar] [CrossRef] [Green Version]
- Furht, B.; Escalante, A. Handbook of Cloud Computing; Springer: Boston, MA, USA, 2010. [Google Scholar]
- Boulos, P.F.; Wiley, A.N. Can We make Water systems smarter? Opflow 2013, 39, 20–22. [Google Scholar] [CrossRef]
- Gurung, T.R.; Stewart, R.A.; Beal, C.D.; Sharma, A.K. Smart meter enabled water end-use demand data: Platform for the enhanced infrastructure planning of contemporary urban water supply networks. J. Clean. Prod. 2015, 87, 642–654. [Google Scholar] [CrossRef] [Green Version]
- Romano, M.; Kapelan, Z. Adaptive water demand forecasting for near real-time management of smart water distribution systems. Environ. Model. Softw. 2014, 60, 265–276. [Google Scholar] [CrossRef] [Green Version]
- Herrera, M.; Izquierdo, J.; Pérez-García, R.; Ayala-Cabrera, D. On-line learning of predictive kernel models for urban water demand in a smart city. Procedia Eng. 2014, 70, 791–799. [Google Scholar] [CrossRef]
- Creaco, E.; Campisano, A.; Fontana, N.; Marini, G.; Page, P.; Walski, T. Real time control of water distribution networks: A state-of-the-art review. Water Res. 2019, 161, 517–530. [Google Scholar] [CrossRef]
- Brentan, B.M.; Luvizotto, E., Jr.; Herrera, M.; Izquierdo, J.; Pérez-García, R. Hybrid regression model for near real-time urban water demand forecasting. J. Comput. Appl. Math. 2017, 309, 532–541. [Google Scholar] [CrossRef]
- Berg, S.V. Best Practices in Regulating State-Owned and Municipal Water Utilities; Technical Report; Economic Commission for Latin America and the Caribbean (ECLAC), United Nations: Santiago, Chile, 2013. [Google Scholar]
- Pollard, S. Risk Management for Water and Wastewater Utilities; IWA Publishing: London, UK, 2016. [Google Scholar]
- Cabral, M.; Loureiro, D.; Covas, D. Using economic asset valuation to meet rehabilitation priority needs in the water sector. Urban Water J. 2019, 16, 205–214. [Google Scholar] [CrossRef]
- Alegre, H.; Baptista, J.M.; Cabrera, E., Jr.; Cubillo, F.; Duarte, P.; Hirner, W.; Merkel, W.; Parena, R. Performance Indicators for Water Supply Services; IWA Publishing: London, UK, 2016. [Google Scholar]
- Carriço, N.; Covas, D.; Almeida, M.C.; Leitão, J.; Alegre, H. Prioritization of rehabilitation interventions for urban water assets using multiple criteria decision-aid methods. Water Sci. Technol. 2012, 66, 1007–1014. [Google Scholar] [CrossRef] [PubMed] [Green Version]
- Salehi, S.; Tabesh, M.; Jalili Ghazizadeh, M. HRDM method for rehabilitation of pipes in water distribution networks with inaccurate operational-failure data. J. Water Resour. Plan. Manag. 2018, 144, 04018053. [Google Scholar] [CrossRef]
- Rasoulkhani, K.; Mostafavi, A.; Cole, J.; Sharvelle, S. Resilience-based infrastructure planning and asset management: Study of dual and singular water distribution infrastructure performance using a simulation approach. Sustain. Cities Soc. 2019, 48, 101577. [Google Scholar] [CrossRef]
- Izadi, A.; Yazdandoost, F.; Ranjbar, R. Asset-Based Assessment of Resiliency in Water Distribution Networks. Water Resour. Manag. 2020, 34, 1407–1422. [Google Scholar] [CrossRef]
- Kumar, G.; Jain, V.; Gandhi, O. Availability analysis of mechanical systems with condition-based maintenance using semi-Markov and evaluation of optimal condition monitoring interval. J. Ind. Eng. Int. 2018, 14, 119–131. [Google Scholar] [CrossRef]
- Fecarotta, O.; Aricò, C.; Carravetta, A.; Martino, R.; Ramos, H.M. Hydropower potential in water distribution networks: Pressure control by PATs. Water Resour. Manag. 2015, 29, 699–714. [Google Scholar] [CrossRef]
- Ramos, H.; Covas, D.; Araujo, L.; Mello, M. Available energy assessment in water supply systems. In Proceedings of the 31th International Association for Hydro-Environment Engineering and Research (IAHR) Congress, Seoul, Korea, 11–16 September 2005; pp. 11–16. [Google Scholar]
- Araujo, L.; Ramos, H.; Coelho, S. Pressure control for leakage minimisation in water distribution systems management. Water Resour. Manag. 2006, 20, 133–149. [Google Scholar] [CrossRef]
- Quintela, A.D.C. Hidráulica, 10th ed.; Fundação Calouste Gulbenkian: Lisbon, Portugal, 2007. [Google Scholar]
- Dixon, S.; Hall, C. Chapter 9—Hydraulic Turbines. In Fluid Mechanics and Thermodynamics of Turbomachinery, 6th ed.; Dixon, S., Hall, C., Eds.; Butterworth-Heinemann: Boston, MA, USA, 2010; pp. 303–355. [Google Scholar]
- Bortoni, E.; Souza, Z.D.; Viana, A.; Villa-Nova, H.; Rezek, Â.; Pinto, L.; Siniscalchi, R.; Bragança, R.; Bernardes, J. The Benefits of Variable Speed Operation in Hydropower Plants Driven by Francis Turbines. Energies 2019, 12, 3719. [Google Scholar] [CrossRef] [Green Version]
- Menarin, H.A.; Costa, H.A.; Fredo, G.L.M.; Gosmann, R.P.; Finardi, E.C.; Weiss, L.A. Dynamic modeling of Kaplan turbines including flow rate and efficiency static characteristics. IEEE Trans. Power Syst. 2019, 34, 3026–3034. [Google Scholar] [CrossRef]
- Valavi, M.; Nysveen, A. Variable-speed operation of hydropower plants: Past, present, and future. In Proceedings of the 2016 XXII International Conference on Electrical Machines (ICEM), Lausanne, Switzerland, 4–7 September 2016; pp. 640–646. [Google Scholar]
- Jain, S.V.; Patel, R.N. Investigations on pump running in turbine mode: A review of the state-of-the-art. Renew. Sustain. Energy Rev. 2014, 30, 841–868. [Google Scholar] [CrossRef]
- Derakhshan, S.; Nourbakhsh, A. Experimental study of characteristic curves of centrifugal pumps working as turbines in different specific speeds. Exp. Therm. Fluid Sci. 2008, 32, 800–807. [Google Scholar] [CrossRef]
- Williams, A.; Rodrigues, A.; Singh, P.; Nestmann, F.; Lai, E. Hydraulic Analysis of a Pump as a Turbine with CFD and Experimental Data. In Proceedings of the IMechE Seminar, Computational Fluid Dynamics for Fluid Machinery, London, UK, 18 November 2003. Technical Report. [Google Scholar]
- Ramos, H.; Borga, A. Pumps yielding power. Dam Eng. Water Power Dam Constr. 2000, 10, 197–217. [Google Scholar]
- Ramos, H.; Covas, D.; Gonçalves, F.; Soares, A. Geração de Energia Sustentável em Sistemas de Abastecimento de água—Análise Econômica e Proposta de Optimização; IST/CEHIDRO: Lisbon, Portugal, 2008. [Google Scholar]
- Simão, M.; Ramos, H.M. Hydrodynamic and performance of low power turbines: Conception, modelling and experimental tests. Int. J. Energy Environ. 2010, 1, 431–444. [Google Scholar]
- Nautiyal, H.; Varun, V.; Kumar, A.; Yadav, S.Y.S. Experimental investigation of centrifugal pump working as turbine for small hydropower systems. Energy Sci. Technol. 2011, 1, 79–86. [Google Scholar]
- Carravetta, A.; Del Giudice, G.; Fecarotta, O.; Ramos, H.M. Energy production in water distribution networks: A PAT design strategy. Water Resour. Manag. 2012, 26, 3947–3959. [Google Scholar] [CrossRef]
- Puust, R.; Kapelan, Z.; Savic, D.; Koppel, T. A review of methods for leakage management in pipe networks. Urban Water J. 2010, 7, 25–45. [Google Scholar] [CrossRef]
- Gupta, A.; Kulat, K. A selective literature review on leak management techniques for water distribution system. Water Resour. Manag. 2018, 32, 3247–3269. [Google Scholar] [CrossRef]
- Li, R.; Huang, H.; Xin, K.; Tao, T. A review of methods for burst/leakage detection and location in water distribution systems. Water Sci. Technol. Water Supply 2015, 15, 429–441. [Google Scholar] [CrossRef]
- Chan, T.K.; Chin, C.S.; Zhong, X. Review of current technologies and proposed intelligent methodologies for water distributed network leakage detection. IEEE Access 2018, 6, 78846–78867. [Google Scholar] [CrossRef]
- Poulakis, Z.; Valougeorgis, D.; Papadimitriou, C. Leakage detection in water pipe networks using a Bayesian probabilistic framework. Probabilistic Eng. Mech. 2003, 18, 315–327. [Google Scholar] [CrossRef] [Green Version]
- Izquierdo, J.; López, P.; Martínez, F.; Pérez, R. Fault detection in water supply systems using hybrid (theory and data-driven) modelling. Math. Comput. Model. 2007, 46, 341–350. [Google Scholar] [CrossRef]
- Candelieri, A.; Archetti, F.; Messina, E. Improving leakage management in urban water distribution networks through data analytics and hydraulic simulation. WIT Trans. Ecol. Environ. 2013, 171, 107–117. [Google Scholar]
- Candelieri, A.; Archetti, F. Smart water in urban distribution networks: Limited financial capacity and Big Data analytics. WIT Trans. Built Environ. 2014, 139, 11. [Google Scholar]
- Candelieri, A.; Soldi, D.; Archetti, F. Cost-effective sensors placement and leak localization–the Neptun pilot of the ICeWater project. J. Water Supply Res. Technol. AQUA 2015, 64, 567–582. [Google Scholar] [CrossRef]
- Khoa Bui, X.; S Marlim, M.; Kang, D. Water Network Partitioning into District Metered Areas: A State-Of-The-Art Review. Water 2020, 12, 1002. [Google Scholar] [CrossRef] [Green Version]
- UK Water Industry Research Limited. A Manual of DMA Practice; UK Water Industry Research Limited: London, UK, 1999. [Google Scholar]
- Di Nardo, A.; Di Natale, M. A heuristic design support methodology based on graph theory for district metering of water supply networks. Eng. Optim. 2011, 43, 193–211. [Google Scholar] [CrossRef]
- Perelman, L.; Ostfeld, A. Topological clustering for water distribution systems analysis. Environ. Model. Softw. 2011, 26, 969–972. [Google Scholar] [CrossRef]
- Scarpa, F.; Lobba, A.; Becciu, G. Elementary DMA design of looped water distribution networks with multiple sources. J. Water Resour. Plan. Manag. 2016, 142, 04016011. [Google Scholar] [CrossRef] [Green Version]
- Herrera, M.; Canu, S.; Karatzoglou, A.; Pérez-García, R.; Izquierdo, J. An approach to water supply clusters by semi-supervised learning. In Proceedings of the 5th International Congress on Environmental Modelling and Software, San Sebastian, Spain, 23–25 June 2010; pp. 315–322. [Google Scholar]
- Herrera, M.; Izquierdo, J.; Pérez-García, R.; Montalvo, I. Multi-agent adaptive boosting on semi-supervised water supply clusters. Adv. Eng. Softw. 2012, 50, 131–136. [Google Scholar] [CrossRef]
- Candelieri, A.; Giordani, I.; Archetti, F. Automatic configuration of Kernel-based clustering: An optimization approach. In Proceedings of the International Conference on Learning and Intelligent Optimization, Nizhny Novgorod, Russia, 19–21 June 2017; Springer International Publishing: Cham, Switzerland, 2017; pp. 34–49. [Google Scholar]
- Di Nardo, A.; Di Natale, M.; Giudicianni, C.; Greco, R.; Santonastaso, G.F. Weighted spectral clustering for water distribution network partitioning. Appl. Netw. Sci. 2017, 2, 19. [Google Scholar] [CrossRef] [PubMed] [Green Version]
- Di Nardo, A.; Giudicianni, C.; Greco, R.; Herrera, M.; Santonastaso, G.F. Applications of graph spectral techniques to water distribution network management. Water 2018, 10, 45. [Google Scholar] [CrossRef] [Green Version]
- Deuerlein, J.W. Decomposition model of a general water supply network graph. J. Hydraul. Eng. 2008, 134, 822–832. [Google Scholar] [CrossRef]
- Di Nardo, A.; Di Natale, M.; Santonastaso, G.F.; Tzatchkov, V.G.; Alcocer-Yamanaka, V.H. Water network sectorization based on graph theory and energy performance indices. J. Water Resour. Plan. Manag. 2014, 140, 620–629. [Google Scholar] [CrossRef]
- Diao, K.; Zhou, Y.; Rauch, W. Automated creation of district metered area boundaries in water distribution systems. J. Water Resour. Plan. Manag. 2013, 139, 184–190. [Google Scholar] [CrossRef]
- Brentan, B.M.; Campbell, E.; Goulart, T.; Manzi, D.; Meirelles, G.; Herrera, M.; Izquierdo, J.; Luvizotto, E. Social network community detection and hybrid optimization for dividing water supply into district metered areas. J. Water Resour. Plan. Manag. 2018, 144, 04018020-1. [Google Scholar] [CrossRef] [Green Version]
- Izquierdo, J.; Herrera, M.; Montalvo, I.; Pérez-García, R. Division of water supply systems into district metered areas using a multi-agent based approach. In Proceedings of the International Conference on Software and Data Technologies, Sofia, Bulgaria, 26–29 July 2009; Springer: Berlin/Heidelberg, Germany, 2009; pp. 167–180. [Google Scholar]
- Hajebi, S.; Barrett, S.; Clarke, A.; Clarke, S. Multi-agent simulation to support water distribution network partitioning. In Proceedings of the 27th European Simulation and Modelling Conference-ESM’2013, Lancaster, UK, 23–25 October 2013; pp. 1–6. [Google Scholar]
- Giudicianni, C.; Herrera, M.; Di Nardo, A.; Adeyeye, K. Automatic multiscale approach for water networks partitioning into dynamic district metered areas. Water Resour. Manag. 2020, 34, 835–848. [Google Scholar] [CrossRef] [Green Version]
- Zhang, K.; Yan, H.; Zeng, H.; Xin, K.; Tao, T. A practical multi-objective optimization sectorization method for water distribution network. Sci. Total Environ. 2019, 656, 1401–1412. [Google Scholar] [CrossRef]
- Gomez, P.; Cubillo, F.; Martın, F. Comprehensive and efficient sectorization of distribution networks. Procedia Eng. 2014, 70, 753–762. [Google Scholar] [CrossRef] [Green Version]
- Perelman, L.S.; Abbas, W.; Koutsoukos, X.; Amin, S. Sensor placement for fault location identification in water networks: A minimum test cover approach. Automatica 2016, 72, 166–176. [Google Scholar] [CrossRef] [Green Version]
- Herrera, M.; Abraham, E.; Stoianov, I. A graph-theoretic framework for assessing the resilience of sectorised water distribution networks. Water Resour. Manag. 2016, 30, 1685–1699. [Google Scholar] [CrossRef] [Green Version]
- Ciaponi, C.; Murari, E.; Todeschini, S. Modularity-based procedure for partitioning water distribution systems into independent districts. Water Resour. Manag. 2016, 30, 2021–2036. [Google Scholar] [CrossRef]
- Todini, E. Looped water distribution networks design using a resilience index based heuristic approach. Urban Water 2000, 2, 115–122. [Google Scholar] [CrossRef]
- Tierney, K.; Bruneau, M. Conceptualizing and measuring resilience: A key to disaster loss reduction. TR News 2007, 250, 14–15, 17. [Google Scholar]
- Ayala-Cabrera, D.; Piller, O.; Deuerlein, J.; Herrera, M. Key performance indicators to enhance water distribution network resilience in three-stages. Water Util. J. 2018, 19, 79–90. [Google Scholar]
- Ayala-Cabrera, D.; Piller, O.; Herrera, M.; Gilbert, D.; Deuerlein, J. Absorptive Resilience Phase Assessment Based on Criticality Performance Indicators for Water Distribution Networks. J. Water Resour. Plan. Manag. 2019, 145, 04019037. [Google Scholar] [CrossRef] [Green Version]
- Taormina, R.; Galelli, S.; Tippenhauer, N.O.; Salomons, E.; Ostfeld, A.; Eliades, D.G.; Aghashahi, M.; Sundararajan, R.; Pourahmadi, M.; Banks, M.K.; et al. Battle of the attack detection algorithms: Disclosing cyber attacks on water distribution networks. J. Water Resour. Plan. Manag. 2018, 144, 04018048. [Google Scholar] [CrossRef] [Green Version]
- Hassanzadeh, A.; Rasekh, A.; Galelli, S.; Aghashahi, M.; Taormina, R.; Ostfeld, A.; Banks, M.K. A review of cybersecurity incidents in the water sector. J. Environ. Eng. 2020, 146, 03120003. [Google Scholar] [CrossRef] [Green Version]
- Lu, L.; Wang, X.; Ouyang, Y.; Roningen, J.; Myers, N.; Calfas, G. Vulnerability of interdependent urban infrastructure networks: Equilibrium after failure propagation and cascading impacts. Comput.-Aided Civ. Infrastruct. Eng. 2018, 33, 300–315. [Google Scholar] [CrossRef]
- Sarni, W.; White, C.; Webb, R.; Cross, K.; Glotzbach, R. Digital Water: Industry Leaders Chart the Transformation Journey; Technical Report; IWA Publishing: London, UK, 2019. [Google Scholar]
- Kapelan, Z. Digital Water Approach for Smarter Water Management in Cities with Interconnected Infrastructure. In Proceedings of the EGU General Assembly Conference Abstracts, Online. 4–8 May 2020; p. 7259. [Google Scholar]
- Giudicianni, C.; Herrera, M.; di Nardo, A.; Carravetta, A.; Ramos, H.M.; Adeyeye, K. Zero-net energy management for the monitoring and control of dynamically-partitioned smart water systems. J. Clean. Prod. 2020, 252, 119745. [Google Scholar] [CrossRef]
- Tsakalides, P.; Panousopoulou, A.; Tsagkatakis, G.; Montestruque, L. Smart Water Grids: A Cyber-Physical Systems Approach; CRC Press: Boca Raton, FL, USA, 2018. [Google Scholar]
- Robles, T.; Alcarria, R.; Martín, D.; Morales, A.; Navarro, M.; Calero, R.; Iglesias, S.; López, M. An internet of things-based model for smart water management. In Proceedings of the 2014 28th International Conference on Advanced Information Networking and Applications Workshops, Victoria, BC, Canada, 13–16 May 2014; pp. 821–826. [Google Scholar]
- Saravanan, K.; Anusuya, E.; Kumar, R. Real-time water quality monitoring using Internet of Things in SCADA. Environ. Monit. Assess. 2018, 190, 556. [Google Scholar] [CrossRef]
- Vrachimis, S.G.; Timotheou, S.; Eliades, D.G.; Polycarpou, M.M. Iterative Hydraulic Interval State Estimation for Water Distribution Networks. J. Water Resour. Plan. Manag. 2019, 145, 04018087. [Google Scholar] [CrossRef] [Green Version]
- Wolf, M.; Serpanos, D. Safety and security in cyber-physical systems and internet-of-things systems. Proc. IEEE 2017, 106, 9–20. [Google Scholar] [CrossRef]
- Barrère, M.; Hankin, C.; Nicolaou, N.; Eliades, D.G.; Parisini, T. Measuring cyber-physical security in industrial control systems via minimum-effort attack strategies. J. Inf. Secur. Appl. 2020, 52, 102471. [Google Scholar]
- Vrachimis, S.G.; Lifshitz, R.; Eliades, D.G.; Polycarpou, M.M.; Ostfeld, A. Active contamination detection in water-distribution systems. J. Water Resour. Plan. Manag. 2020, 146, 04020014. [Google Scholar] [CrossRef] [Green Version]
- Leitão, P.; Colombo, A.W.; Karnouskos, S. Industrial automation based on cyber-physical systems technologies: Prototype implementations and challenges. Comput. Ind. 2016, 81, 11–25. [Google Scholar] [CrossRef] [Green Version]
- Conejos Fuertes, P.; Martínez Alzamora, F.; Hervás Carot, M.; Alonso Campos, J. Building and exploiting a Digital Twin for the management of drinking water distribution networks. Urban Water J. 2020. [Google Scholar] [CrossRef]
- Crosby, M.; Nachiappan; Pattanayak, P.; Verma, S.; Kalyanaraman, V. Blockchain technology: Beyond bitcoin. Appl. Innov. 2016, 2, 71. [Google Scholar]
- Salah, K.; Rehman, M.H.U.; Nizamuddin, N.; Al-Fuqaha, A. Blockchain for AI: Review and open research challenges. IEEE Access 2019, 7, 10127–10149. [Google Scholar] [CrossRef]
- Bianconi, G. Multilayer Networks: Structure and Function; Oxford University Press: Oxford, UK, 2018. [Google Scholar]
- Porto, S.; Quiles, M.G. Clustering Data Streams: A Complex Network Approach. In Proceedings of the International Conference on Computational Science and Its Applications, Saint Petersburg, Russia, 1–4 July 2019; pp. 52–65. [Google Scholar]
- Zhang, S.; Tong, H.; Xu, J.; Maciejewski, R. Graph convolutional networks: A comprehensive review. Comput. Soc. Netw. 2019, 6, 11. [Google Scholar] [CrossRef] [Green Version]
- Manessi, F.; Rozza, A.; Manzo, M. Dynamic graph convolutional networks. Pattern Recognit. 2020, 97, 107000. [Google Scholar] [CrossRef]


Publisher’s Note: MDPI stays neutral with regard to jurisdictional claims in published maps and institutional affiliations. |
© 2020 by the authors. Licensee MDPI, Basel, Switzerland. This article is an open access article distributed under the terms and conditions of the Creative Commons Attribution (CC BY) license (http://creativecommons.org/licenses/by/4.0/).
Share and Cite
Giudicianni, C.; Herrera, M.; Nardo, A.d.; Adeyeye, K.; Ramos, H.M. Overview of Energy Management and Leakage Control Systems for Smart Water Grids and Digital Water. Modelling 2020, 1, 134-155. https://0-doi-org.brum.beds.ac.uk/10.3390/modelling1020009
Giudicianni C, Herrera M, Nardo Ad, Adeyeye K, Ramos HM. Overview of Energy Management and Leakage Control Systems for Smart Water Grids and Digital Water. Modelling. 2020; 1(2):134-155. https://0-doi-org.brum.beds.ac.uk/10.3390/modelling1020009
Chicago/Turabian StyleGiudicianni, Carlo, Manuel Herrera, Armando di Nardo, Kemi Adeyeye, and Helena M. Ramos. 2020. "Overview of Energy Management and Leakage Control Systems for Smart Water Grids and Digital Water" Modelling 1, no. 2: 134-155. https://0-doi-org.brum.beds.ac.uk/10.3390/modelling1020009