Article

Alkali-Activated Binders Based on Tungsten Mining Waste and Electric-Arc-Furnace Slag: Compressive Strength and Microstructure Properties

Centre of Materials and Building Technologies (C–MADE/UBI), Department of Civil Engineering and Architecture, University of Beira Interior (UBI), 6201-001 Covilhã, Portugal
*
Author to whom correspondence should be addressed.
Submission received: 17 July 2020 / Revised: 21 August 2020 / Accepted: 27 August 2020 / Published: 4 September 2020
(This article belongs to the Special Issue Early Career Stars in Civil Engineering)

Abstract

:
The valorization and reusing of mining waste has been widely studied in recent years. Research has demonstrated that there is great potential for reusing mining waste for construction applications. This work experimentally investigated the strength development, pore structure, and microstructure of a binary alkali-activated binder. This is based on tungsten mining waste mud (TMWM) and electric-arc-furnace slag (EAF-Slag) using different proportions of TMWM (10, 20, 30, 40, and 50 vt.%). The precursors were activated using sodium silicate (Na2SiO3) and potassium hydroxide (KOH 8M) as alkaline activator solution with solid:liquid weight ratio = 3. Pastes were used to assess the compressive strength of the blended binder and their microstructure. The reaction products were characterized by X-ray diffraction (XRD), scanning electron microscopy with energy dispersive X-ray spectroscopy (SEM-EDS), and Fourier transform infra-red (FT-IR) spectroscopy, while the porosity and the pores size properties were examined by mercury intrusion porosimetry (MIP). The results show that the partial replacement of TMWM with EAF-Slag exhibited better mechanical properties than the 100TM-AAB. A maximum strength value of 20.1 MPa was obtained in the binary-AAB sample prepared with 50 vt.% TMWM and EAF-Slag. The pastes that contained a higher dosage of EAF-Slag became more compact with lower porosity and finer pore-size distribution. In addition, the results obtained by SEM-EDS confirmed the formation of different types of reaction products in the 100TM-AAB, 100FS-AAB, and the binary-AABs mixtures such as N-A-S-H, C-A-S-H and (N, C)-A-S-H gels frameworks in the system as the major elements detected are Si, Al, Ca, and Na.

1. Introduction

The worldwide metallurgical industry produces large amounts of different types of slags that are mainly used in construction and the building sector. According to the European Associations (EUROSLAG, EUROFER and Waste Framework Directive) representing metallurgical slag producers and processors, the totals amount of steel slag generated in the year 2010 in the region of 21.8 million tons, of which approximately 39% was generated as electric arc furnace slag. These were mainly used as aggregates for the road construction field. About 1–10% of steel slag is used for other purposes such as fertilizers, hydraulic engineering and internal use for metallurgical purposes [1]. For the steelmaking and steel refining processes different types of furnaces are used to process the iron ore. Where the different groups of slags are named based on the furnaces from which they are generated. In the iron and steelmaking processes two main types of slags are generated from each process. The process of ironmaking generated blast-furnace slag, whilst in the process of steelmaking, the slag generated is known as steel-furnace slag. The steel furnace slag is divided into three groups [2]:
(a)
Basic-Oxygen-Furnace (BOF) slag,
(b)
Electric-Arc-Furnace (EAF) slag,
(c)
Ladle slag.
The EAF-slag has a similar steel refining process but uses high-power electric arcs to produce high-quality steel from recycled steel scrap [3]. In the last three decades, alkali activation technology is considered a feasible approach for the valorisation of various industrial wastes, being slags one of the three most commonly used precursors in alkaline activation technology [4]. Nowadays, many studies carried out used EAF-Slag as a precursor in the alkaline activation as is the case of the study of Khater [5], which investigated the influence of EAF-slag on the characterisation of the material composites, and it was concluded that EAF-Slag improved the durability of the product in high-temperature environments when compared to conventional cement. Where the presence of Calcium (Ca) as a chemical compound in the EAF-Slag increases the formation of C-S-H gel, which contribute to the maximum development of the compressive strength of the binders. Another study has shown that the durability and the impact of EAF-Slag on the material composites exposed to sulphate solution exhibits better stability against sulphate attack [6].
According to the statistical office of the European Union (Eurostat), the activities of mining and quarrying in Europe generate approximately 55% of the total industrial wastes [7]. The mining activity produces an enormous quantity of solid waste materials during mining’s lifetime which are disposed of in the open air which cause several environmental issues during waste management. The waste generated from mining and quarrying industries accumulated in large deposits present a potential risk of environmental pollution and cause serious landscape impacts. Recent research studies and applications use alkaline activation as an innovative recovery technology. These studies have focused on the reuse of non-conventional mineral waste such as red clay brick waste, different types of mining waste, waste grounded glass and mineral wools. The chemical compositions of this novel precursors are rich in alumina and silicates which are the main needed compounds for the alkaline activation technology. A large number of studies pertinent to the recycling of mining waste and the production of eco-friendly binders have been carried out. A promising alternative for the management of mining waste appears to be alkaline activation for the production of secondary materials [8,9]. Different mine tailings from different mining operations around the world have been investigated regarding their potential. The mine tailings are reused as raw materials for alkaline activation and the mineral carbonation for the storage of carbon dioxide to combating the climate change [10,11,12,13]. Tungsten mining waste mud is a mine tailing leftover from the ore processing which is conveyed out and stored as a slurry in the dump area. The mining waste mud dump poses an environmental risk, by causing contamination of the soil, pollution of the water and air in the surrounding areas [14]. The processing industries of tungsten lead to possible adverse health effects for humans because tungsten and some of its compounds have low solubility [15]. According to Castro-Gomes et al. [9], the mineralogy of tailings from Panasqueira tungsten mining waste was found to be mainly quartz and muscovite. TMWM have shown the possibility of being a precursor for the production of alkali-activated materials. Pacheco-Torgal et al. [16], in their initial study reused TMWM as precursor in the alkaline activation by subjecting the precursor (TMWM) to a thermal treatment at 950 °C for 2 h. The calcinated TMWM was mixed with (Sodium Hydroxide and Sodium Silicate) solutions and minor quantities of calcium hydroxide. The obtained alkali-activated concrete was a mixture of limestone aggregates and the alkali-activated binder (aggregate/binder ratio =1.5). In turn, the alkali-activated binder consisted of a mix of the precursor and 10 % of Calcium hydroxide (Ca (OH)2) with sodium hydroxide solution (NaOH 20 M). For this combination, the resulted alkali-activated concrete reached a compressive strength of fc (56) = 65.3 MPa at 56 days of curing.
Recently, several studies have been conducted to reuse TMWM in its natural state (without calcination), by blending TMWM with other reactive and aluminosilicate rich materials such as Metakaolin or mineral waste (red clay brick waste, blast furnace slag and ground waste glass) to improve the microstructure and the mechanical performance of the tungsten mining waste-based alkali-activated binder.
This study will investigate the feasibility of producing binary alkali-activated binders (binary-AABs) using TMWM and EAF-Slag as precursors. The main precursor (TMWM) was partially replaced by EAF-Slag with different proportions EAF-Slag/TMWM (10/90; 20/80; 30/70; 40/60; 50/50 vt.%), to investigate the effect of the different dosages of EAF-Slag on the compressive strength results, microstructure properties, and pore structure of the tungsten mining waste-based alkali-activated binder. Moreover, two mixtures contain 100% from each precursor were alkaline activated and examined for comparison purposes.

2. Materials and Experimental Methods
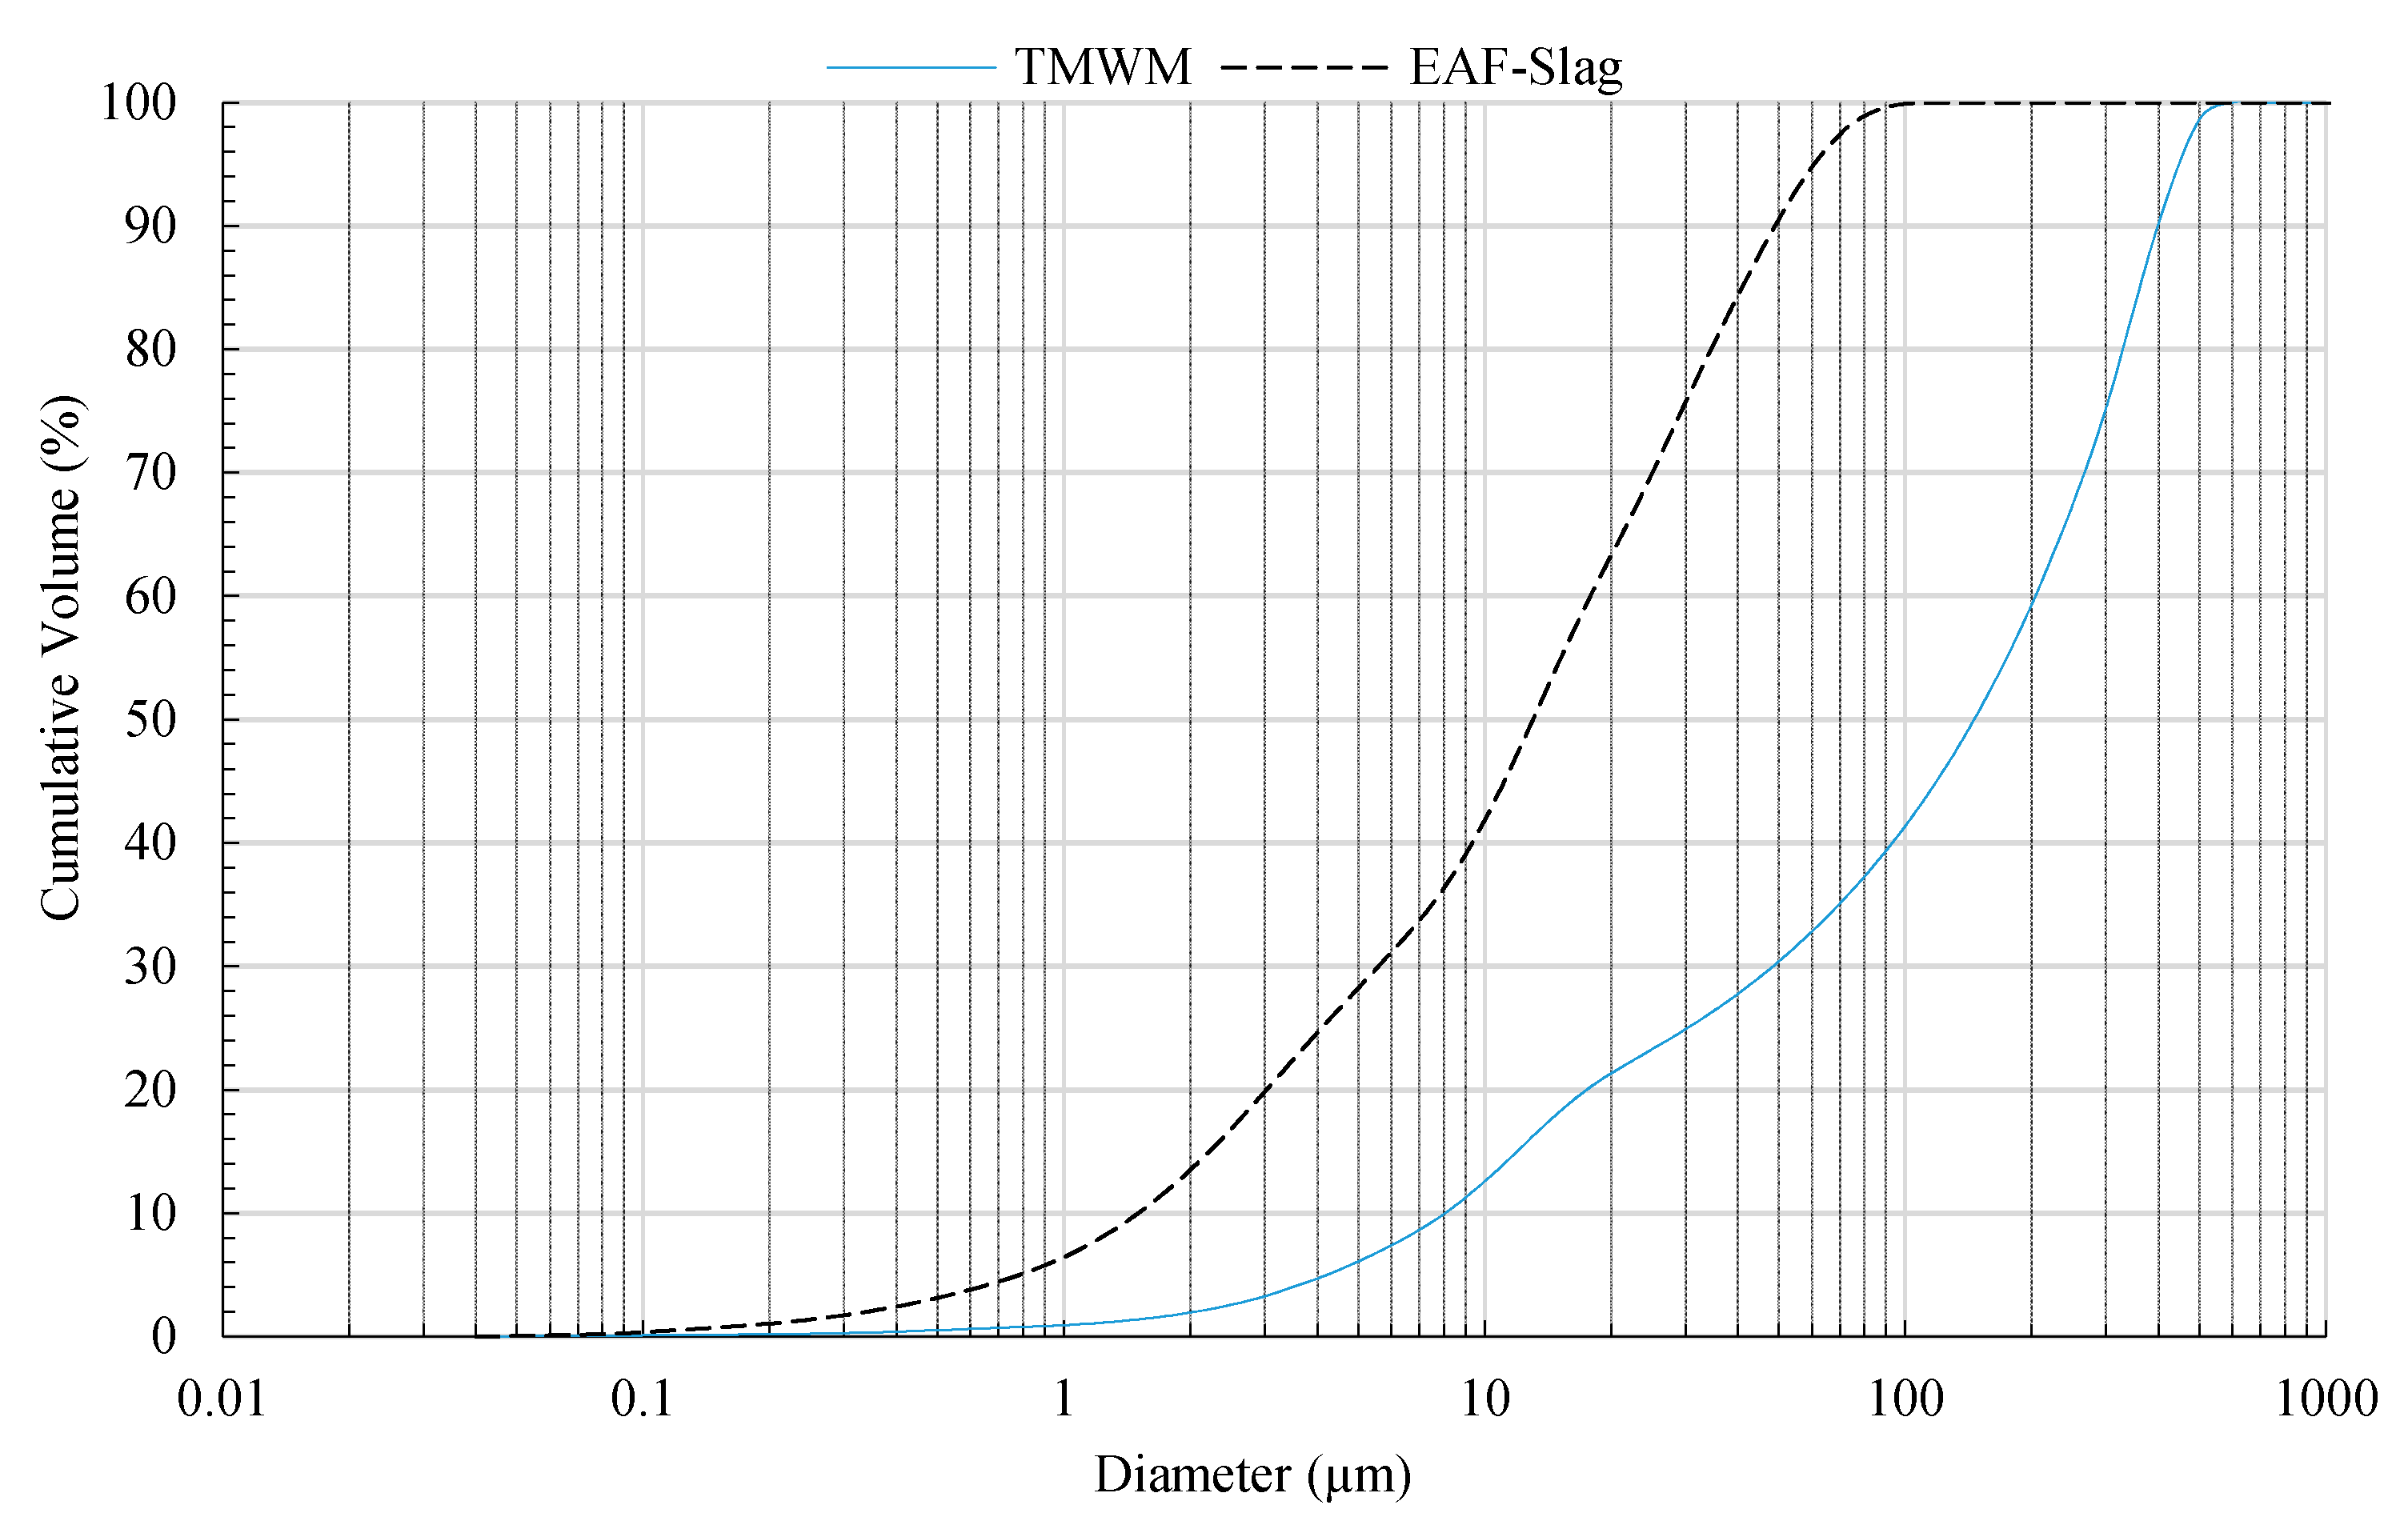
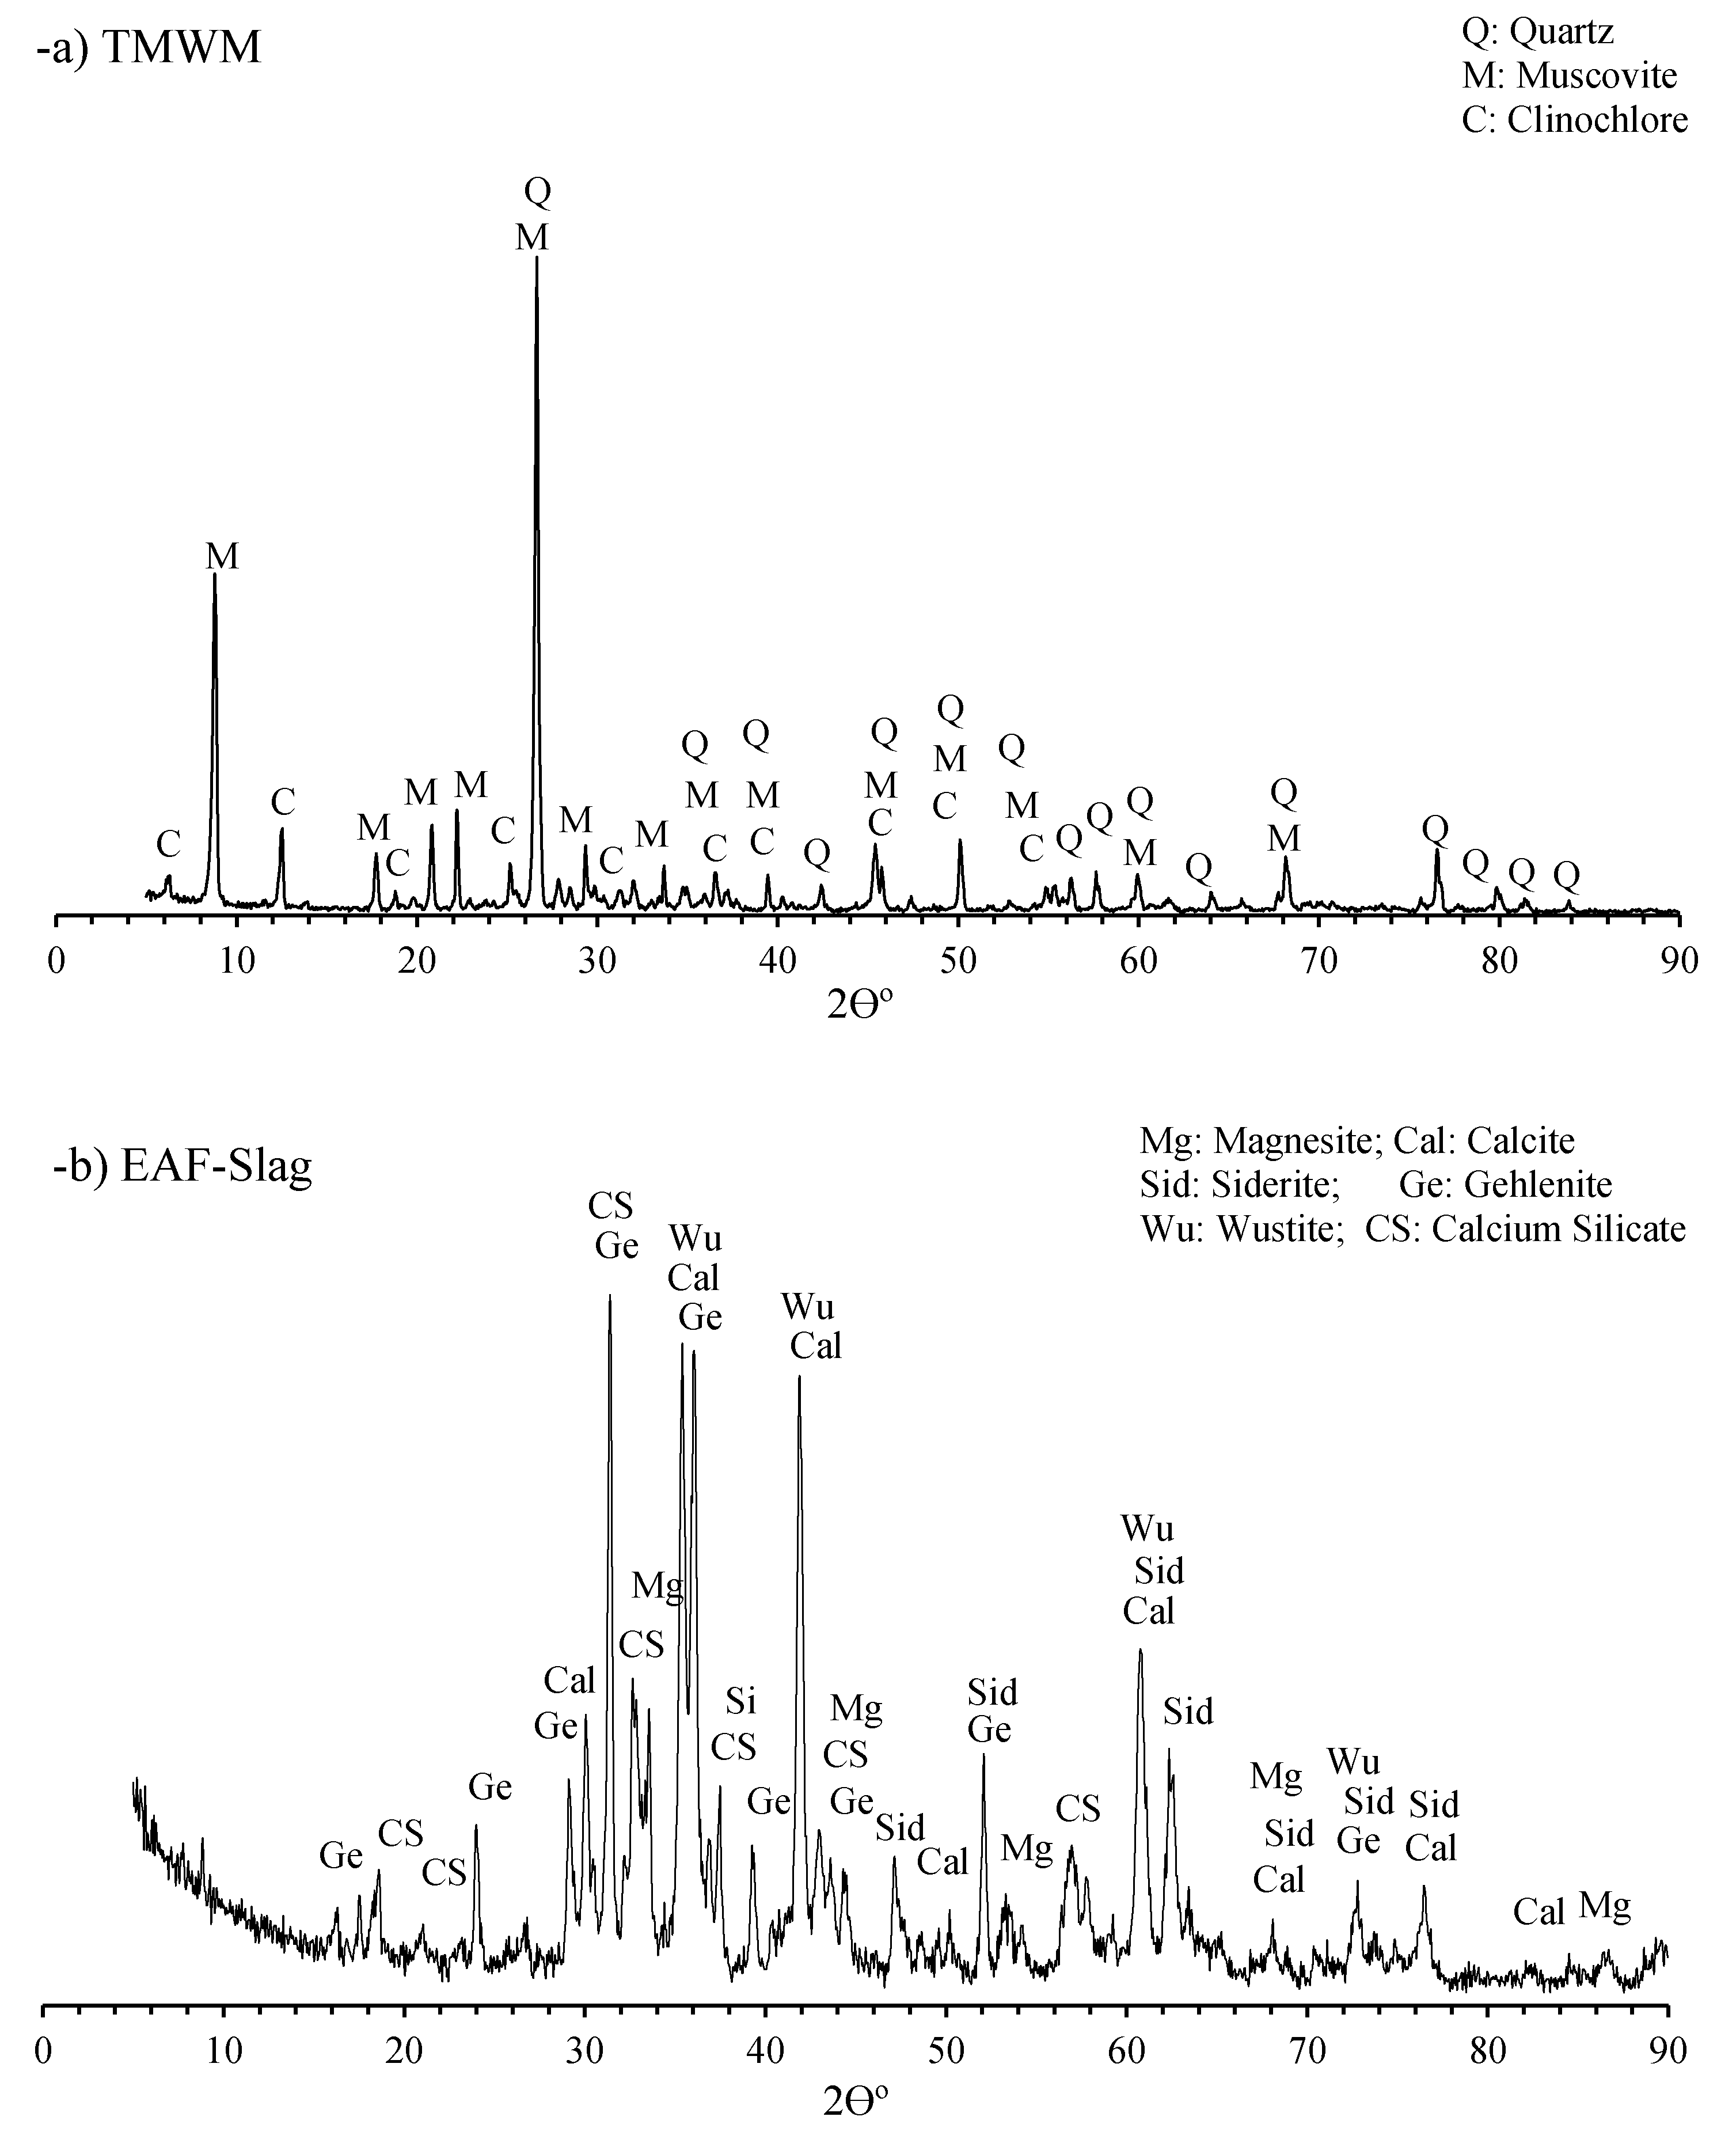
2.1. Raw Materials

2.1.1. Precursors

The prime materials used in this study were TMWM, collected from Panasqueira mine mud waste deposits and EAF-Slag supplied by the national steel industry in Maia and Aldeia de Paio Pires, Seixal (Portugal). After the collection of the TMWM from the mud lagoon in Panasqueira mine deposits, the mud was first dried for 24 h in the oven at a temperature of 60 °C; afterwards, the dried mud was mechanically disaggregated using a crushing machine; finally, the mud was sieved to obtain particle sizes under 500 µm.
EAF-Slag was received in the form of aggregates from the national steel industry in Maia and Aldeia de Paio Pires, Seixal. The EAF-Slag was first dried for 24 h in the oven at a temperature of 60 °C; Later, the EAF-Slag aggregates were crushed to transform the EAF-Slag into a powder; finally, the EAF-Slag powder was sieved to get EAF-Slag particle sizes under 125 µm. Considering the practical aspect of sieving each waste in case of industrial application a retained fraction below of 500 µm was considered TMWM and of 150 µm for EAF-Slag. The oxide compositions of raw materials were evaluated by Scanning Electron Microscopy with Energy Dispersive Spectroscopy (SEM-EDS) microanalysis using HITACHI S-3400N, and the test results are both listed in Table 1. The main oxide compositions of TMWM are (SiO2; 46.7 wt.%), (Al2O3; 17 wt.%) and (Fe2O3; 15.5 wt.%), and for EAF-Slag the main oxide compositions are (CaO; 33.3 wt.%), (Fe2O3; 30.5 wt.%), (SiO2; 15 wt.%) and (Al2O3; 10.1 wt.%). The Basicity Coefficient (Kb) defines the ratio of base to acid oxides in the slag (which are not those employed in aqueous solutions). This coefficient is suitable indicator for the definition of an oxidative capacity of the slag. The Kb = (CaO + MgO + MnO)/(SiO2 + Al2O3) determined for EAF-Slag was equal to 1.64 [5,17]. In addition, the Hydraulic Modulus (HM) also defined as HM = (CaO + MgO + Al2O3)/SiO2 [18] suggested that the HM of the slag materials should exceed 1.40 to ensure sound hydration property. In the current study, the HM of EAF-Slag is equal to 3.19 atomic mass ratio, which reflects the better hydration properties of EAF-Slag.
The raw materials (TMWM and EAF-Slag) powder were sieved and subjected to particle size distribution using laser diffraction (CILAS, 1190 apparatus). Figure 1 shows the particle size distribution curves of the raw TMWM and EAF-Slag, the mean particle size 177.37 µm, and 19.67 µm, respectively. In addition, the median diameter (D50) of TMWM D50 is 145.83 µm and EAF-Slag is 13.01 µm, thus corresponding to the diameter of 50% of the sample which will have a diameter lower than the determined D50 by volume. TMWM has a D90 and D10 particle sizes D90 = 398.62 μm and D10 = 8.06 µm, while the EAF-Slag has a D90 and D10 particle sizes of 48.96 μm and 1.50 µm, respectively. The values D10 and D90 correspond to the diameters of 10% and 90% of the sample which will have a diameter lower than the determined D10 and D90 by volume.
Furthermore, the bulk powder densities of TMWM and EAF-Slag were determined using a gas displacement pycnometer (model. AccuPyc1340, Micromeritics, Norcross, Georgia apparatus): 3.03 and 3.70 g/cm3. The Blaine fineness of the different powders was determined according to EN 196-6, by using Blaine air permeability (model. ACMEL LABO BSA1 apparatus), which were determined as 889 and 1360 cm2/g, respectively. The basic physical properties of the raw materials are shown in Table 2.
The mineralogical analysis of the raw materials is presented in Figure 2. The X-ray diffraction (XRD) patterns of TMWM shown in Figure 2a indicate their crystalline nature and consist mainly of muscovite and quartz, which were identified by their characteristic, as follows: muscovite (Ref. PDF#46–1409), quartz (Ref. PDF#46–1045) and clinochlore (Ref. PDF#29–0701). Muscovite is a dioctahedral layered structure in which a sheet of octahedral Al ions is sandwiched between two sheets of linked SiO4 tetrahedral with a general formula KAl2(Si3Al)O10(OH)2 [16].
The XRD analysis of the EAF-Slag present very complex XRD spectra as shown in Figure 2b. Different mineral phases with distinct peaks of high intensities and some overlapping peaks of low intensities were detected. The slow cooling conditions of the EAF-Slag allows the formation of various crystalline phases [2], the primary ones being magnetite (Ref. PDF#08-0479), calcite (Ref. PDF#86-2339), siderite (Ref. PDF#83-1764), gehlenite (Ref. PDF#87-0968), wustite (Ref. PDF#06-0615) and calcium silicate (Ref. PDF#20-0237).

2.1.2. Alkaline Activator Solution

The alkaline activator solution used in the current investigation was a mixture of aqueous solutions of potassium hydroxide (KOH) and sodium silicate (SS).
The sodium silicate solution (D40 reference, chemical composition: Na2O = 8.6%, SiO2 = 27.8%, Al2O3 = 0.4% and H2O = 63.2%) was obtained from Solvay SA, Portugal.
Potassium hydroxide (KOH) was dissolved using distilled water to provide an 8M alkaline solution. The KOH solution was prepared one day before use. Potassium hydroxide (98% purity) was supplied by Quimialmel Chemical Minerals Ltd., Portugal.
Before the preparation of the paste mixtures both alkaline activators were mixed in the proportion two thirds sodium silicate with one third potassium hydroxide. The two solutions stirred together for 5 min using a Hobart mixer (medium speed), to get the final alkaline activator solution.

2.2. Experimental Methods

2.2.1. Preparation of Specimens

Three alkali-activated binders (AABs) were prepared: 100TM, 100FS and five blended proportions of binary alkali-activated binders (binary-AABs) containing different partial replacements of TMWM by EAF-Slag (90:10; 80:20; 70:30; 60:40; 50:50 vt.%). The volume ratio between the two waste materials, liquid:solid (L:S) ratio and the different initial theoretical Al:Si, Ca:Si, Na:Si and K:Si atomic mass ratios, which are calculated from weight conservation and chemical analyses of solids precursors, and the activator solutions are presented in Table 3. These ratios were calculated by including the chemical composition of the raw materials (powders), and the alkaline activator solutions in the mixtures. Although this approach implicitly assumed the full dissolution of the starting raw materials, in fact and experimentally, the precursor was not fully dissolved (existence of unreacted particles) which is observed in the SEM images of the alkali-activated binders as described in Section 3.3.
All the alkali-activated mixes were prepared at room temperature. First, the TMWM and EAF-Slag were dry-mixed to get a homogeneous powder. Then, the alkaline activator solution was blended with the precursors’ powder with L:S ratio = 3. The resulting mixtures of the precursor and the alkaline activator solution were mechanically stirred using a Hobart mixer with a mixing time of five minutes (about 3 min at low speed followed by 2 min at high speed). The alkali-activated pastes were poured into the curing molds (with the dimensions 150*25*25 mm) by gravity. Afterwards, the molds were hand vibrated for 2 min.

2.2.2. Curing Condition

After mixing and molding, the filled molds were stored in an oven at a temperature of 60 °C for 24 h. For synthesis and to avoid water evaporation of the AABs during curing, the filled molds were wrapped with plastic film during the oven curing synthesis. After the initial 24 h oven curing period, the specimens were de-molded and were left to cure in laboratory condition (open air and about 20 °C) and were placed inside sealed plastic bags, until being tested after (7, 14 and 28 days). The samples were cut to have a cubic dimension (25 cubic mm) using a masonry block saw that has a small disc diameter to avoid micro-cracks. All these mixtures were prepared to study the influence of the partial replacement quantity of EAF-Slag in the TMWM alkali-activated binder.

2.2.3. Analytical Techniques

Compressive Strength

The compressive strength values of synthesized alkali-activated binders (100TM and 100FS) and the binary-alkali-activated binders were measured using a 3000 kN electro-hydraulic mechanical testing machine “ADR Touch 3000 BS EN Compression Machine with Digital Readout and Self-Centering Platens”, with a loading rate of 0.05 kN/s. Compressive strength tests were performed on 25 cubic mm size samples, after curing times ranging from 1 to 28 days. For each period and paste type, five specimens were tested, and the results were averaged.

X-ray Diffraction Analyses

The XRD analysis was chosen to analyze the raw materials, the AABs (100TM-AAB and 100FS-AAB) as well as the binary-alkali-activated binders. The raw precursor powders and the alkali-activated powders were selected from the crashed AABs samples (AABs were smashed using marble rod). Both powders (raw materials and AABs) were sieved under 75 µm before testing. The XRD analyses were carried out using a Rigaku model D-Max III/C equipment, with Cu tube and K-α radiation (40 kV, 40 mA). The 2θ operational range was from 5° to 90°. The preparation of the sample for the XRD was as follows: first, the samples were extremely finely grained to achieve good signal-to-noise ratio (and avoid fluctuation in intensity). Then the powder (ground sample) was spread in the sample holder and finally a microscope glass was used to press in the powder. A Stanley knife or glass plat was used to remove the surplus of powder. Finally, the samples showed a smooth and flat sample surface. The qualitative analysis was assessed with the use of the “MDI Jade 6.5” software and the Powder Diffraction File (PDF-2) database.

Scanning Electron Microscopy

SEM observations were carried out using a Hitachi S-4800 microscope instrument at an accelerating voltage of 15 kV. The EDS analyses were carried out using a Bruker Xflash 5010 Cooled by Peltier with a resolution of ≤129 eV of the Mn Detector EDS instrument. The specimens examined by SEM-EDS were selected from cleaned small fractured pieces of the AABs taken from the original 28 days samples to use under the back-scattered electron detector (BSE). The Tested AABs specimens were coated with gold before the SEM-EDS examination to improve the imaging of the samples at the SEM. The microstructural analyses were performed to see and compare the reaction products and the matrix structures of the different AABs pastes.

Fourier Transform Infra-Red Analyses

Fourier transform infra-red (FT-IR) spectroscopy data were obtained to examine not only the precursors used in the investigation but also the local structure of the reaction products in each alkali-activated binder samples. FT-IR analyses spectra were recorded from 600 to 4000 cm−1 using Nicolet iS10 FT-IR Spectrometer (Thermo Scientific), Smart iTR accessory instrument by diamond HATR crystal.

Mercury Intrusion Porosimetry Analyses

Mercury Intrusion Porosimetry (MIP) analysis method was used to investigate the pore structure of the AABs (100TM-AAB and 100FS-AAB) and the binary-alkali-activated binder contained different blends of TMWM and EAF-Slag. MIP was performed using Microporometrics AutoPore IV 9500 V1.07 with maximum and minimum applied pressures of 413.7 MPa and 3.63 kPa, corresponding to a minimum pore size of 5 nm and maximum pore size of 345 µm. For MIP testing, a specimen with a weight of (1.5–2.5 g) was taken from the original 28 days specimens. The samples left in a Glass Desiccator contained Silica gel to ensure the removal of the moisture from the samples.

3. Results and Discussion

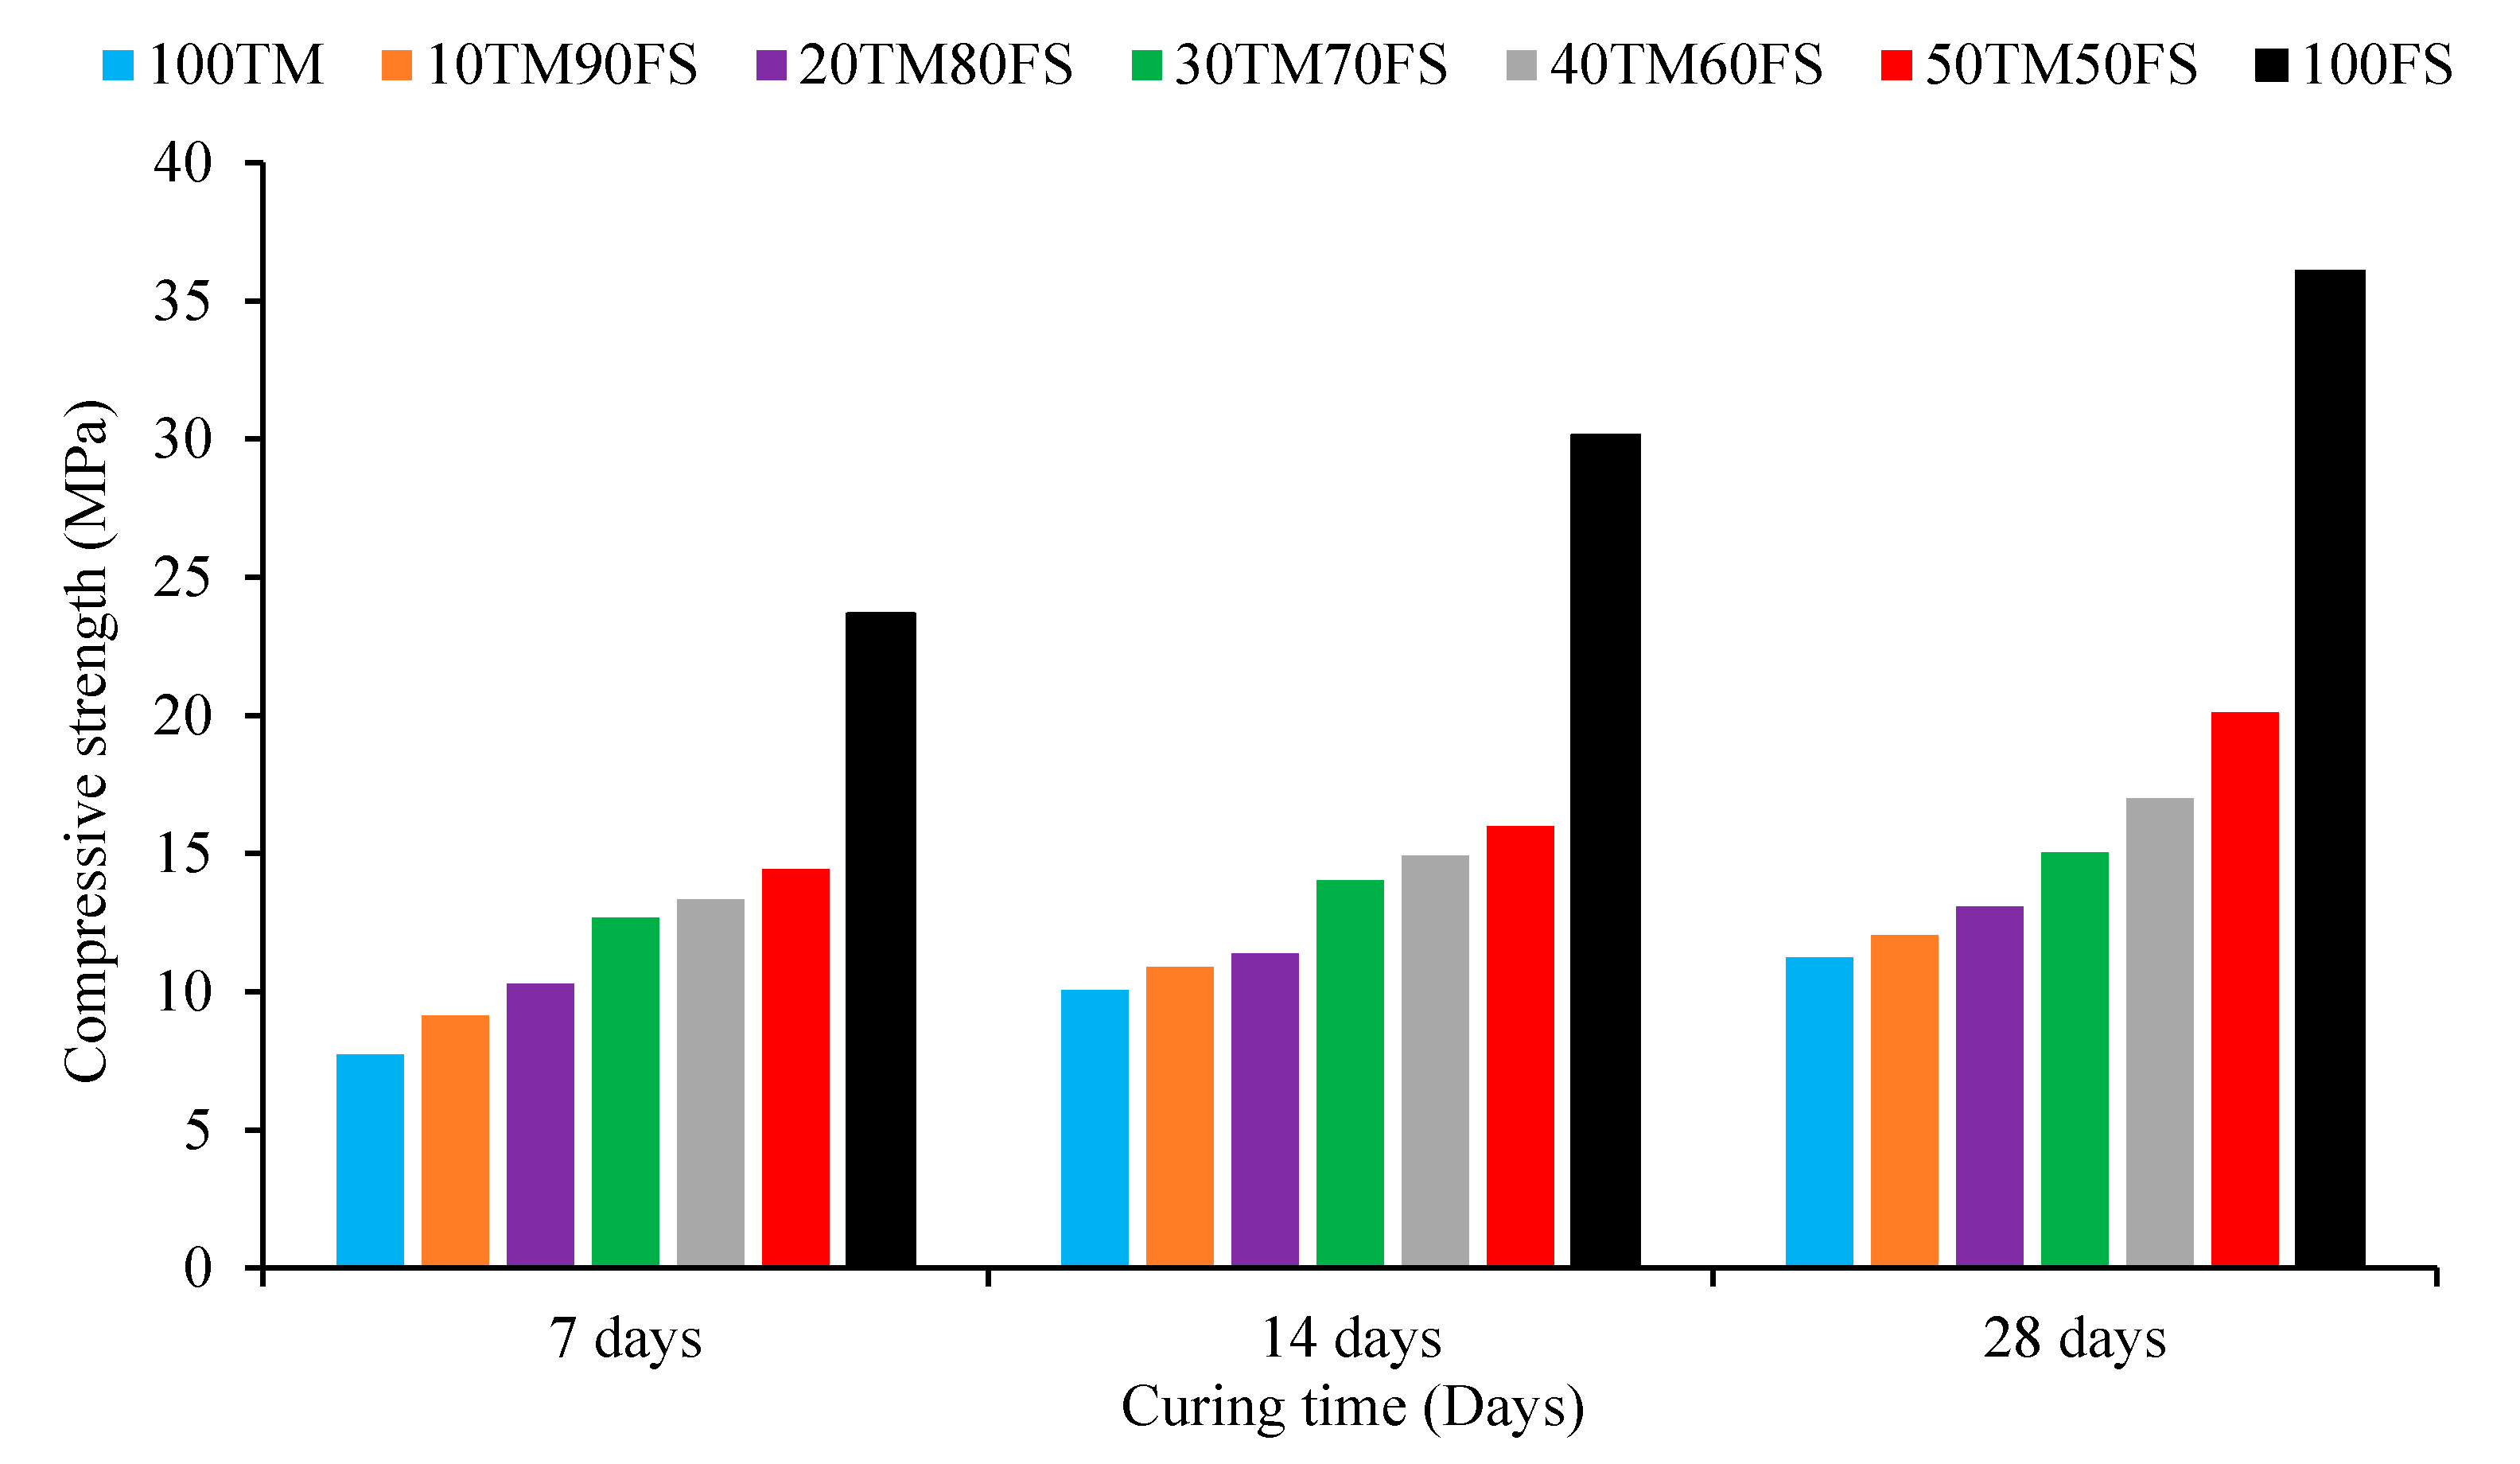
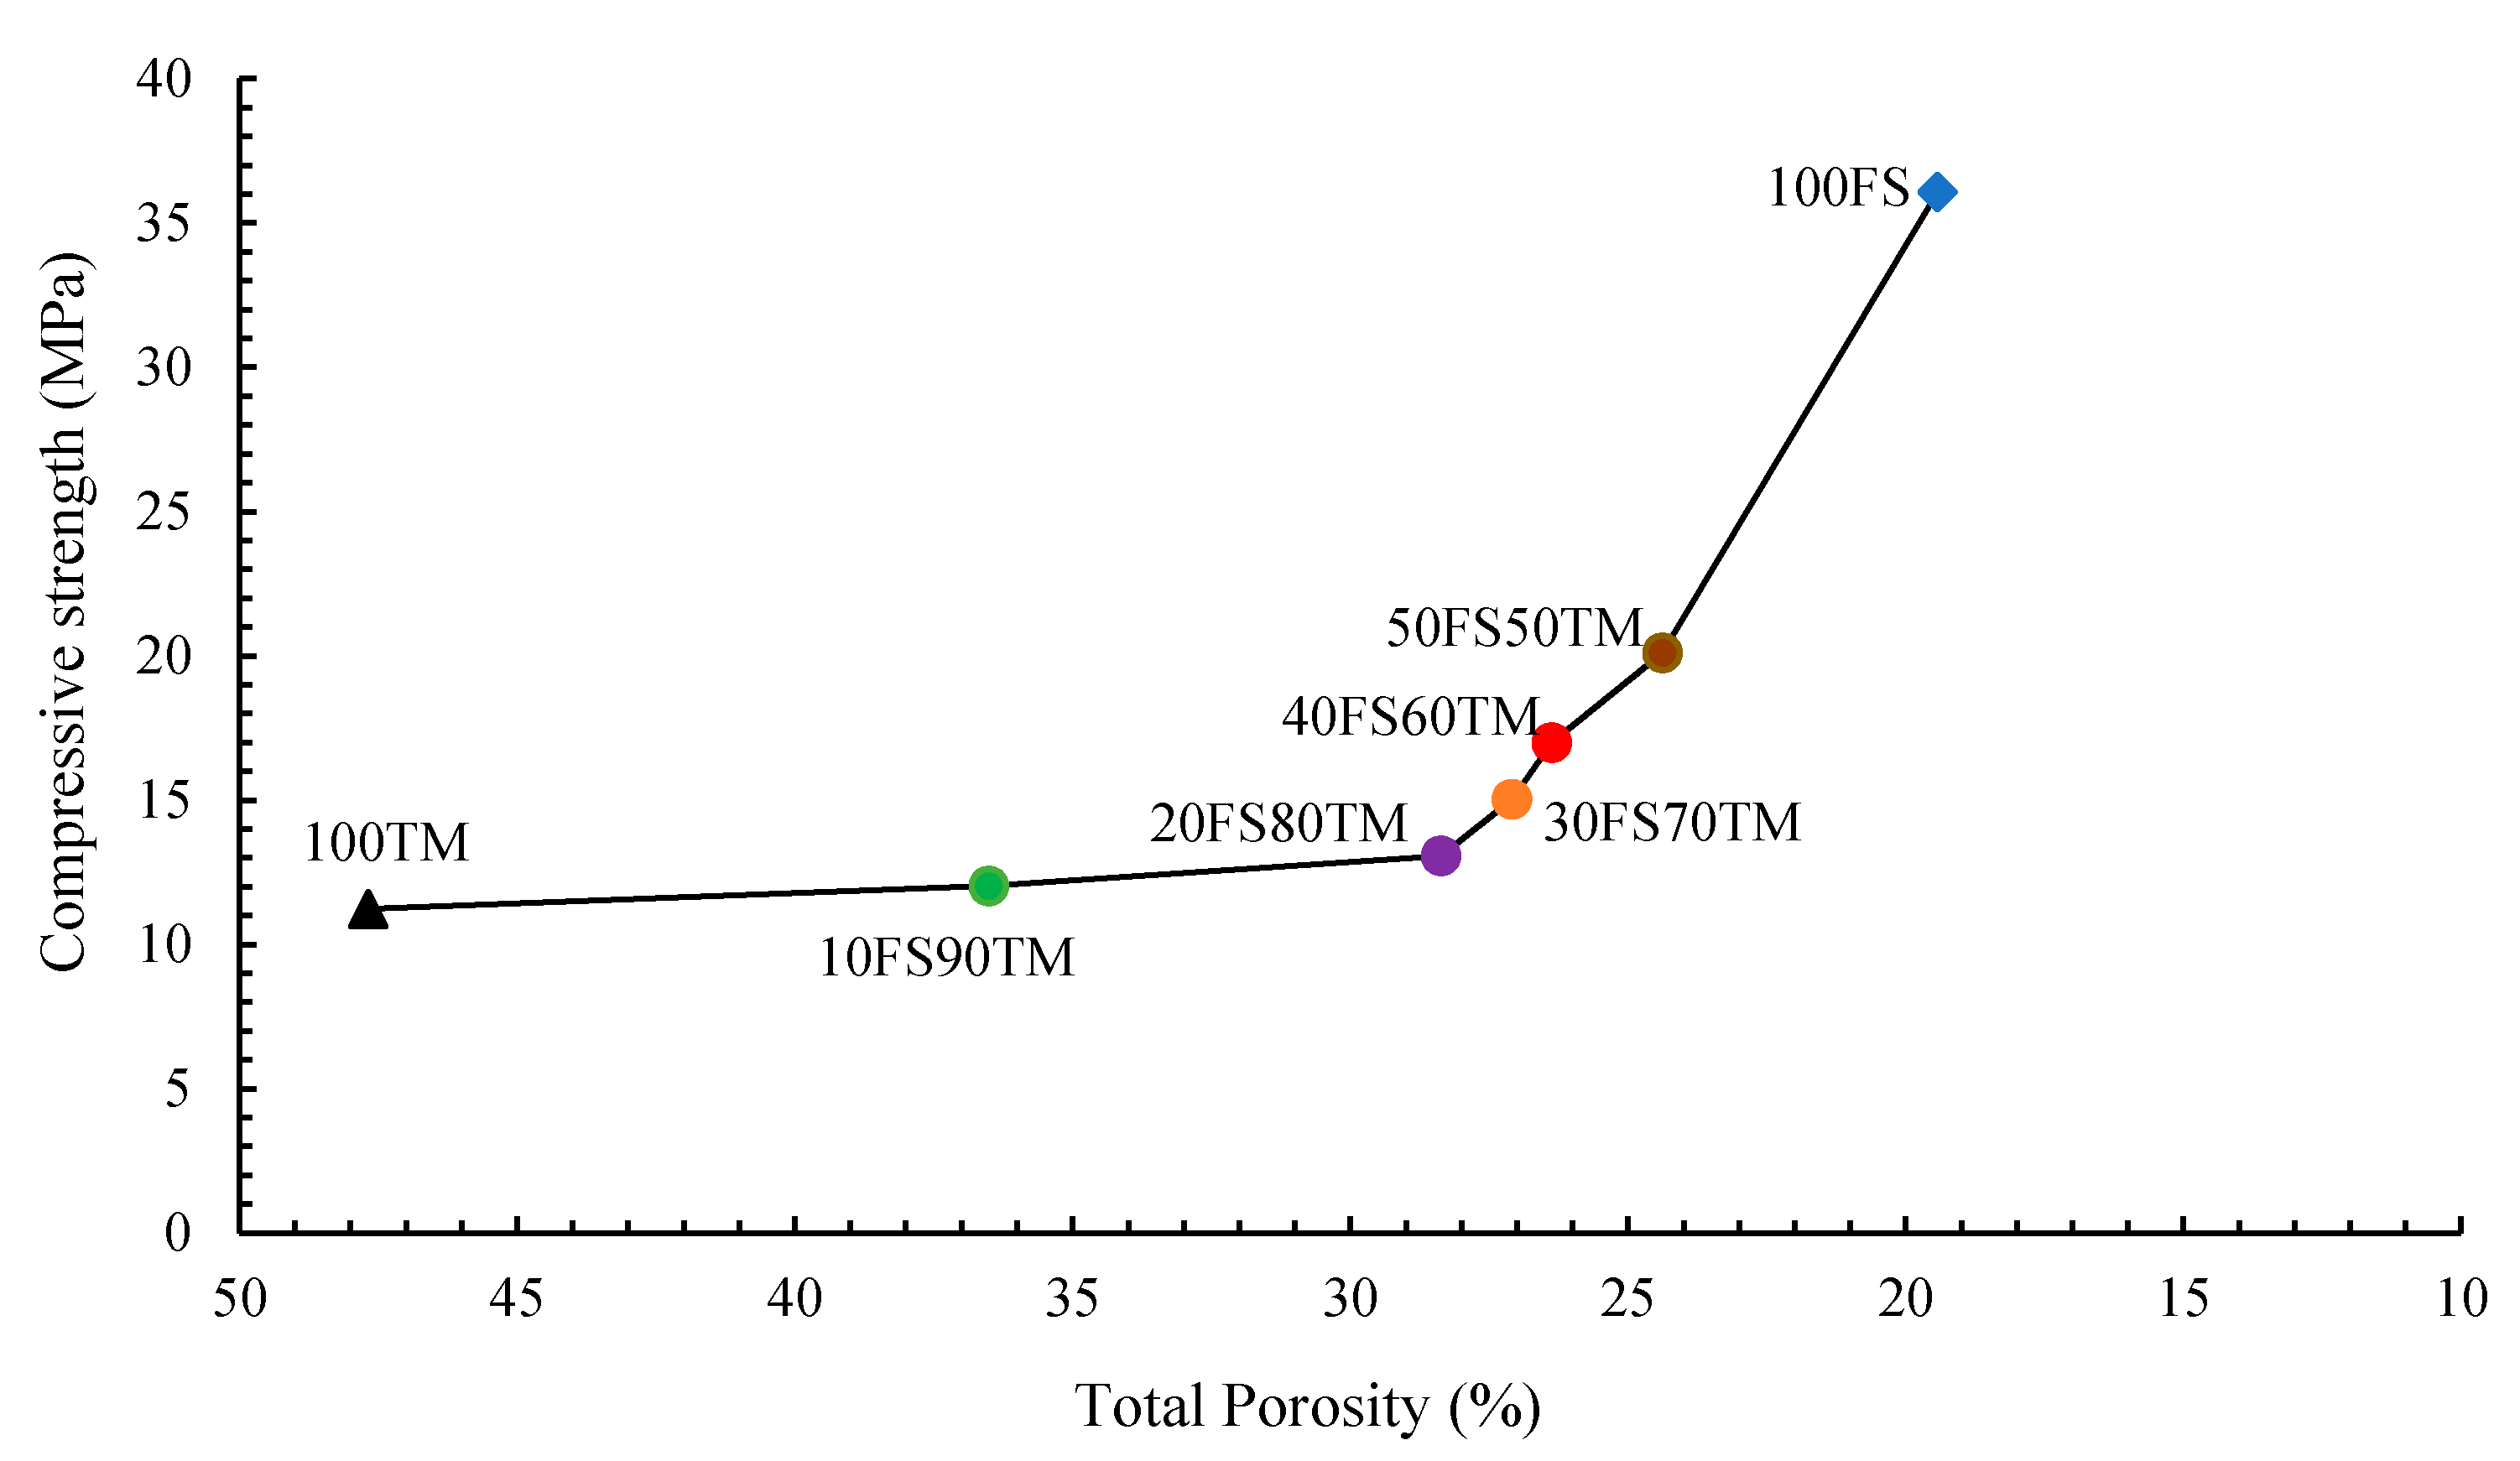
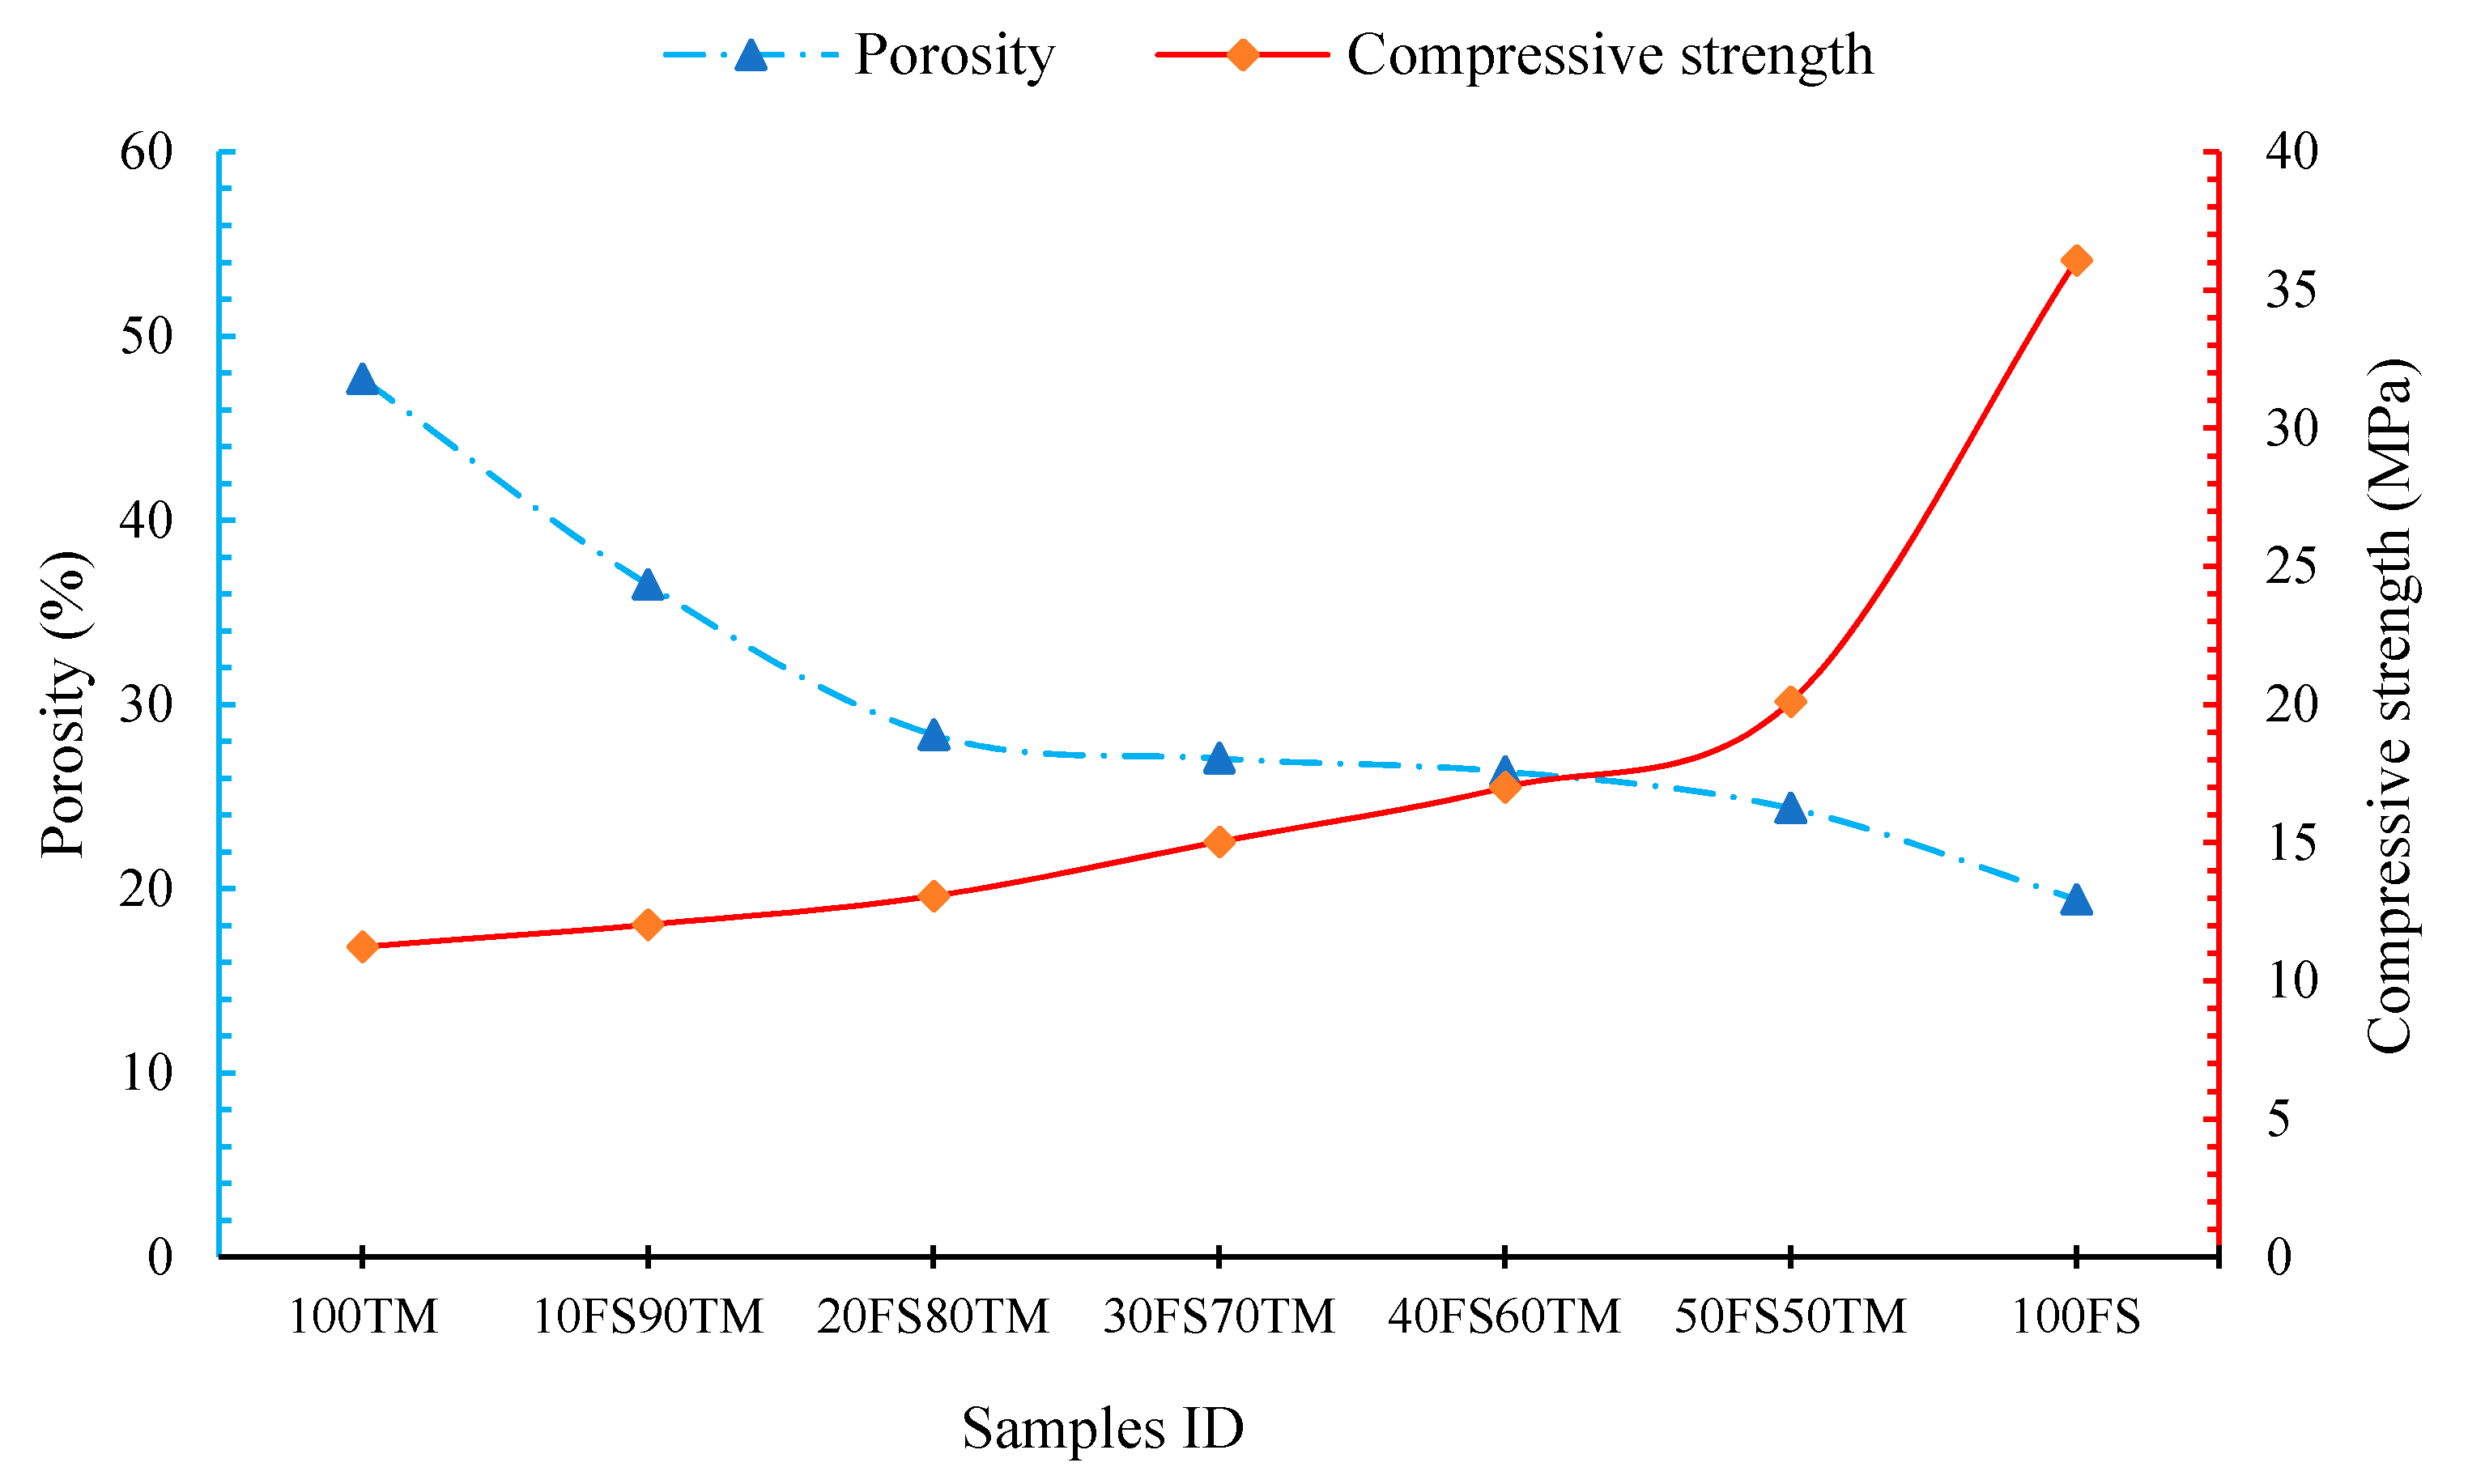
3.1. Compressive Strength
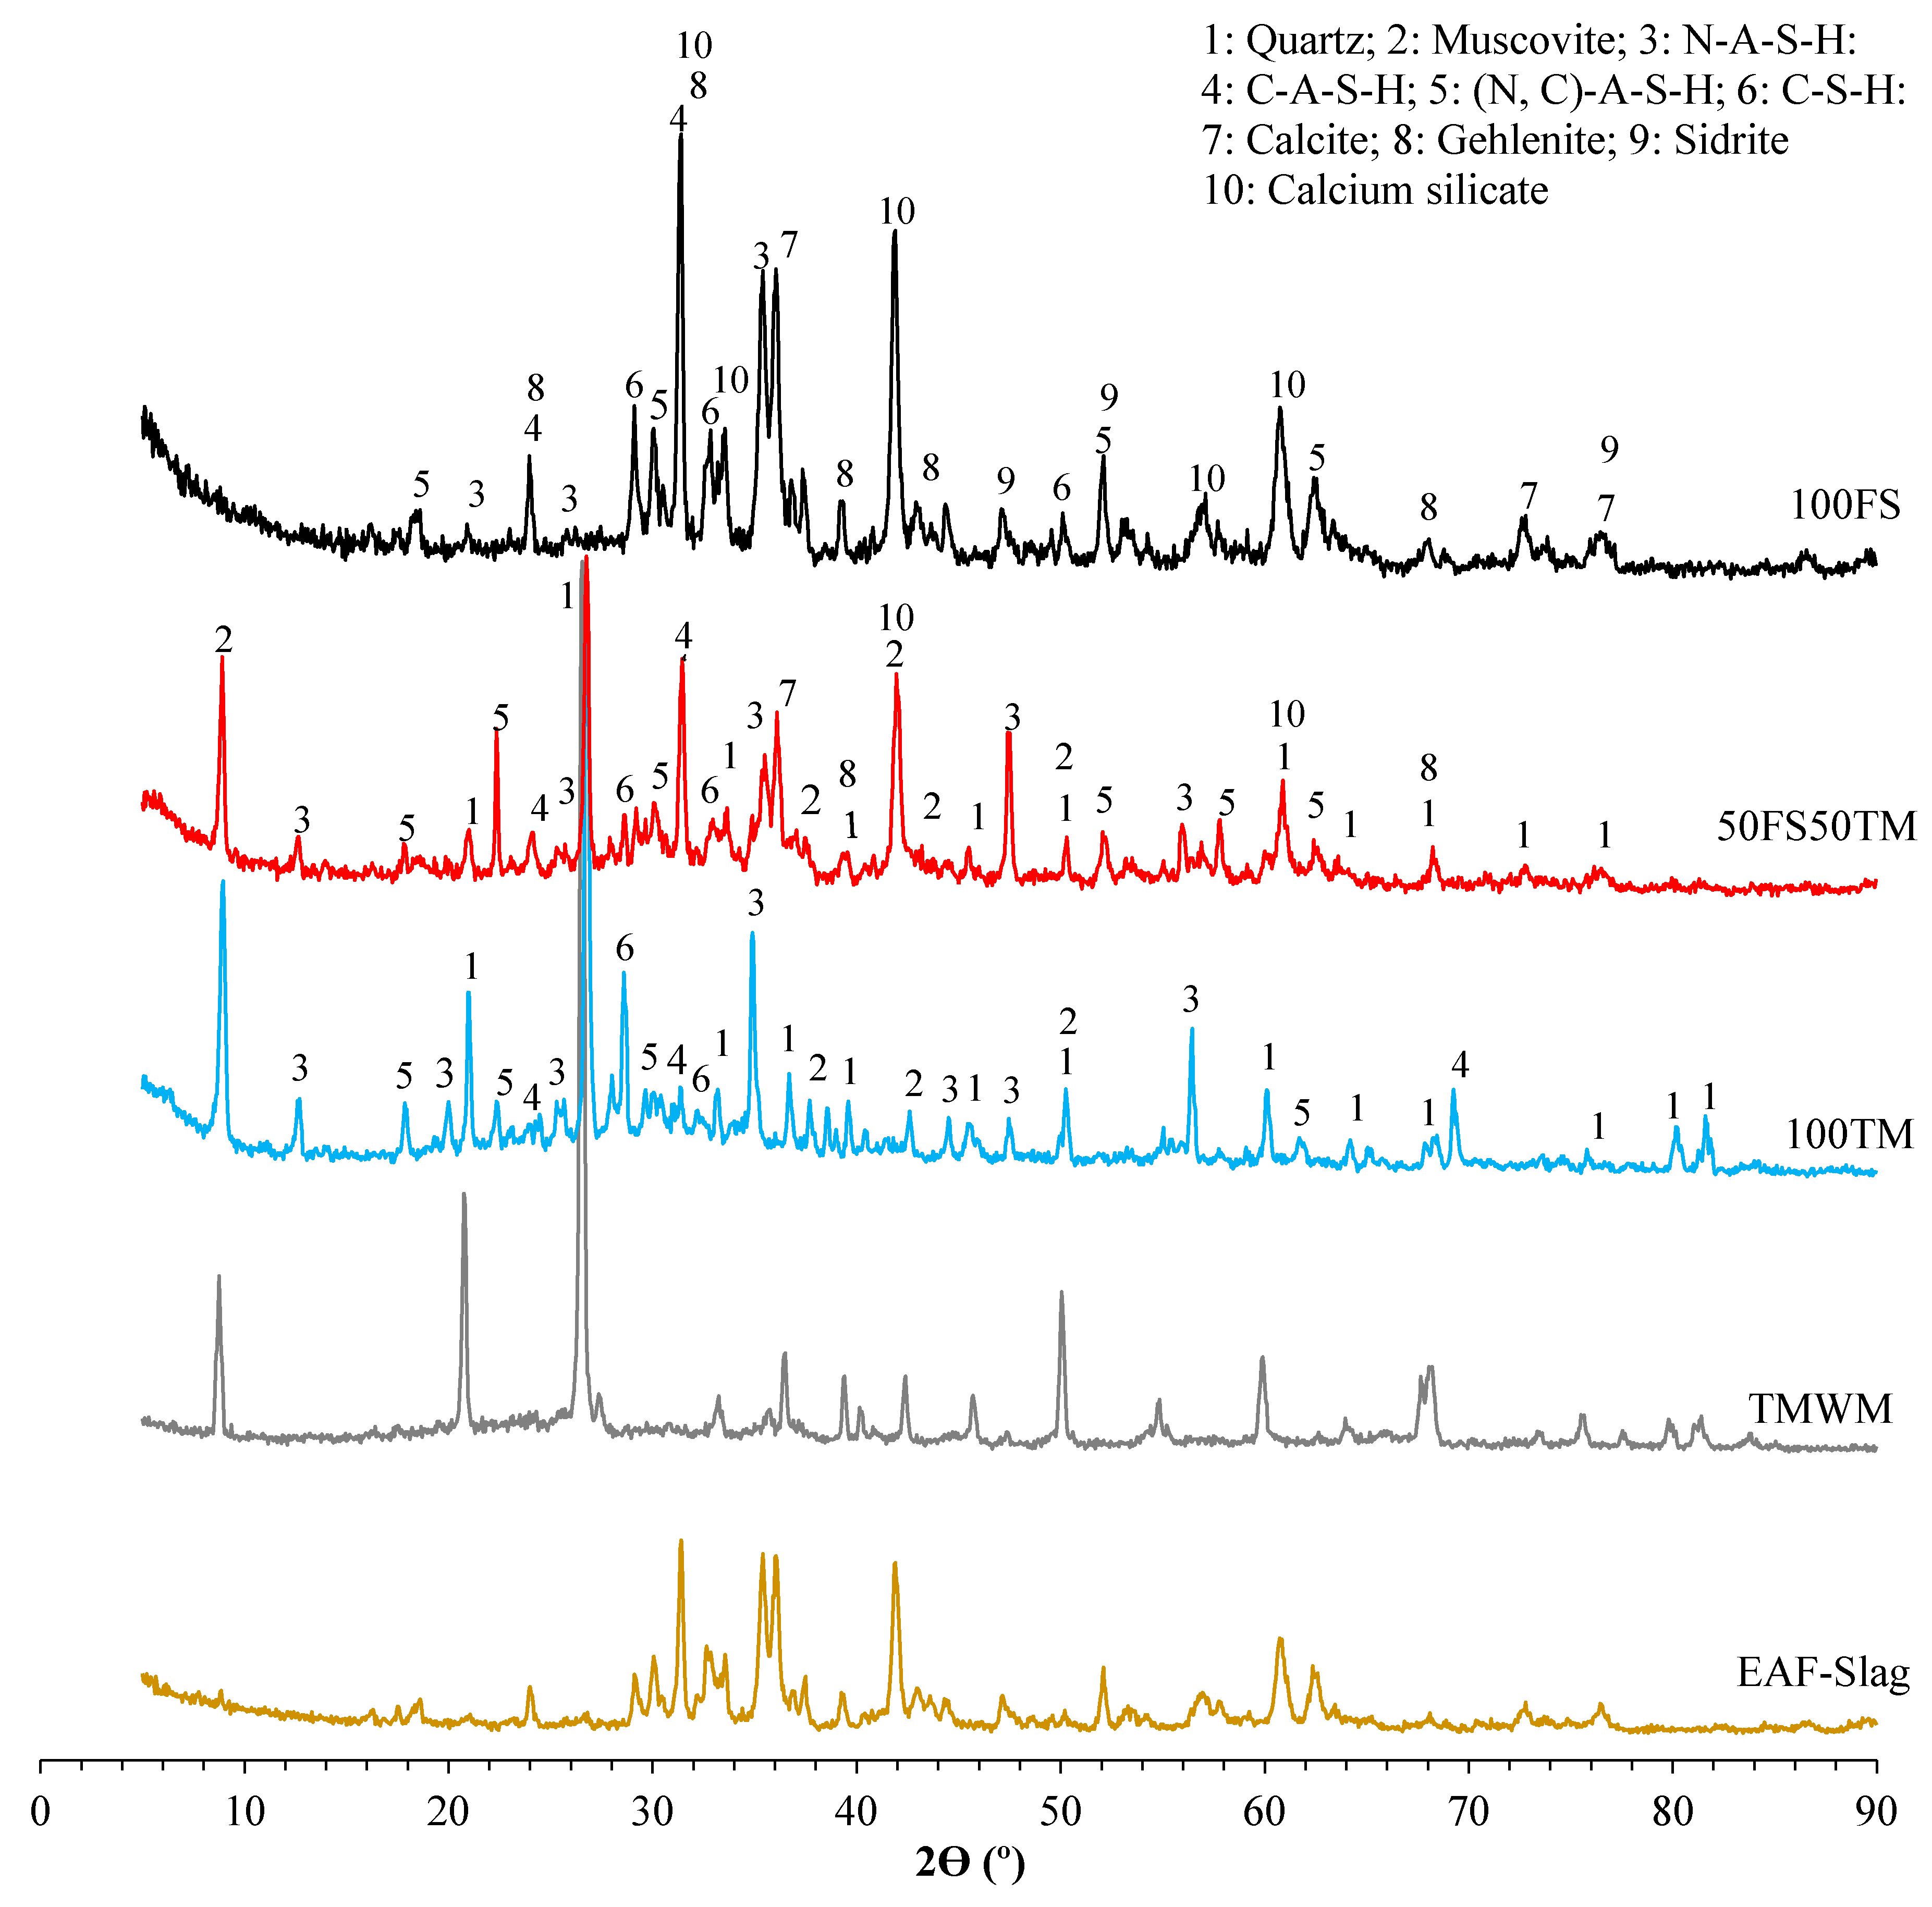
The compressive strength development of the hardened tungsten mining waste-based AABs (100TM-AAB) and EAF-Slag-based alkali-activated binder (100FS-AAB) pastes specimens, and the binary alkali-activated binder (binary-AABs) pastes specimens prepared with different blended TMWM and EAF-Slag; and cured for different periods are shown in Figure 3. The results of the compressive strength show that the 100TM-AAB sample had the lowest compressive strength value 11.23 MPa at 28 days. As for the binary-AABs’ samples, the compressive strength increased gradually when the EAF-Slag content in the mixtures increased. The compressive strength of the sample 100TM-AAB increased from 11.23 MPa to reach 20.1 MPa for the sample (50FS50TM) with an increase rate of 178.98%. Generally, the more content of EAF-Slag in the mixtures with the proportions (10, 20, 30, 40, 50, and 100 vt.%) increases, the higher the compressive strengths at all the tested ages. It is inferred that the EAF-Slag could have a positive effect on the chemical reaction process to improve the compressive strength of the binary-alkali-activated binder samples due to the chemical composition of the raw EAF-Slag. Notably, the compressive strength results of the binary alkali-activated binder follow a somewhat increasing trend with increasing of the initial Ca:Si, and K:Si ratios, and deceasing of Al:Si, and Na:Si ratios. Furthermore, there was a positive direct correlation between the development of the compressive strength results and the increase of the initial Ca:Si ratios in the mixtures as shown in Figure 4. The sample 100FS-AAB showed a higher compressive strength due to the high content of calcium in the mixtures, and the high Ca:Si ratio. In contrast, the 100TM-AAB showed lower compressive strength due to the low reactivity of the TMWM.
The binary-alkali-activated mixtures that contain higher dosages of EAF-Slag generated better compressive strength performance. Their chemical characteristics and, especially, their content of calcium had an influence on binder strengths in any curing period. With high hydration modulus of EAF-Slag and most specifically its role in supplying soluble Ca2+ ions, forming additional C-S-H phases. In addition the formation of N-A-S-H gel after the alkali activation of TMWM and EAF-Slag, as well as the formation of (N, C)-A-S-H gel in the binders matrix leads to an extra strengthening of the matrix structure [19]. An increment in the compressive strength resulted when the TMWM was partially replaced by EAF-Slag with different proportions in tungsten mining waste-based alkali-activated mixtures. Indeed, the compressive strength development rates are much greater in the mixtures that contain a higher dosage of EAF-Slag, particularly, in the early stage (first 7 days). It was also observed that during the curing age period (14 to 28 days), the increase in the compressive strength rate was higher in the samples that had a higher proportion of EAF-Slag. Overall, the 100TM-AAB revealed lower compressive strength development than the binary-AABs and the 100FS-AAB in all tested ages due to the low reactivity of TMWM. The results show that the most promising binary alkali-activated mixture is the sample (50FS50TM) that has a compressive strength of 20.1 MPa after 28 days curing. This mixture also has the eco-efficient advantage of containing a high percentage of EAF-Slag as an industrial by-product.

3.2. XRD Analysis

The XRD patterns of the 100TM and 100FS alkali-activated binders and the binary-alkali-activated binder (50FS50TM) samples are shown in Figure 5. The starting raw materials (TMWM and EAF-Slag) patterns were plotted for comparison purposes and their peaks were identified in Figure 2 Section 2.1. In the current study, the obtained XRD diffraction patterns data were analyzed using the Jade software. After the alkaline activation process, all the samples showed a formation of the same reaction products type presented in the semi-crystalline phases which correspond to the humps centered at approximately 30° and 50°. However, the differences were found in the quantity of the reaction products, and the dominant reaction products that formed in the different systems. In the XRD patterns of all the alkali-activated samples, most of the peaks correspond to the crystalline phases that remained unaltered after the alkaline activation of the precursors.
The main peaks presented in the 100TM-AAB sample are crystal substances which remained unreactive such as quartz (ref. PDF #46.1045) and muscovite (ref. PDF #07.0042). However, in the sample prepared with 100% EAF-Slag (100FS-AAB), the main peaks are the unreacted crystal substances of the raw material such as calcite (ref. PDF #05.0586); gehlenite (ref. PDF#87-0968); siderite (ref. PDF#83-1764) and calcium silicate (ref. PDF#20-0237). For the binary-AAB sample (50FS50TM), the XRD pattern shows that the peaks of the crystal substances that remained as unreacted correspond to the crystalline phases of both raw materials (TMWM and EAF-Slag). Concerning the reaction products that were formed, the diffraction pattern for the 100TM-AAB differed clearly from the 100FS-AAB trace. The main alkaline activation product was an X-ray semi-crystalline N-A-S-H gel. The diffractogram also revealed the formation of calcium silicate hydrate (C-S-H) gel, calcium aluminosilicate hydrate (C-A-S-H) and (sodium, calcium) aluminosilicate hydrate ((N, C)-A-S-H) types reaction products. However, the main alkaline activation product for the activated EAF-Slag was a C-S-H and C-A-S-H type gels. The diffractograms for the 50:50 TMWM:EAF-Slag paste showed a decrease in the intensity of the crystalline phase peaks such as (quartz, mullite and hematite) which were detected in the initial materials (TMWM and EAF-Slag). The peaks corresponding to the crystalline phases (quartz and muscovite) from the original TMWM are centered at the angles 2θ = 8.5, 20.8, 26.7, 33.4, 36.65, 42, 45.6, 50.1, 60, 64.4, 68.1 and 76.2. In addition, the peaks of the crystalline phases are calcite, gehlenite, siderite and calcium silicate from the EAF-Slag precursor which centered at the angles 2θ = 8.5, 20.8, 26.7, 33.4, 36.65, 42, 45.6, 50.1, 60, 64.4, 68.1 and 76.2. The previous peaks related to both starting materials remained apparently unaltered after the chemical reaction between the alkaline activator and the binary precursor. However, in the XRD patterns of the binary-alkali-activate binder (50FS50TM), some quartz phase peaks present in the raw TMWM at the angles 2θ = 80.15 and 81.5 are consumed. The same peaks (angles 2θ = 80.15 and 81.5) still appear in the 100TM-AAB sample after the alkaline activation. The consume of the previously indicated quartz peaks in the TMWM XRD spectra (amorphous phases and some semi-crystalline phases), led to generating more reaction products.
In the binary-alkali-activated binder, the broad peaks at the angle 20–40° become more intense, indicating the formation of the amorphous alkaline activation phases. The peak located at the angle 2θ = 24.2° and 31.4° corresponds to the presence of C-A-S-H gels in the binders. The peaks intensity for the binary-AAB is higher than the peaks of the 100TM-AAB sample which means that the binary-AAB sample generated more quantity of C-A-S-H than the 100TM-AAB sample. However, the intensities of the peaks located at same angles in the 100FS-AAB sample were more intense than in both AABs (100TM-AAB and binary-AAB) due to the formation of more C-A-S-H in the sample made with 100% EAF-Slag. In addition, there was the formation of (N, C)-A-S-H type gel related to the peaks centered at the angle 2θ = 18.75°, 30.1°, 52.15° and 62.5°. The formation of C-A-S-H and (N, C)-A-S-H type gels is favored by the incorporation of EAF-Slag in the mixture and its chemical interaction with the alkaline activator solution [20].

3.3. Scanning Electron Microscope-Energy Dispersive X-ray Spectroscopy (SEM-EDS)

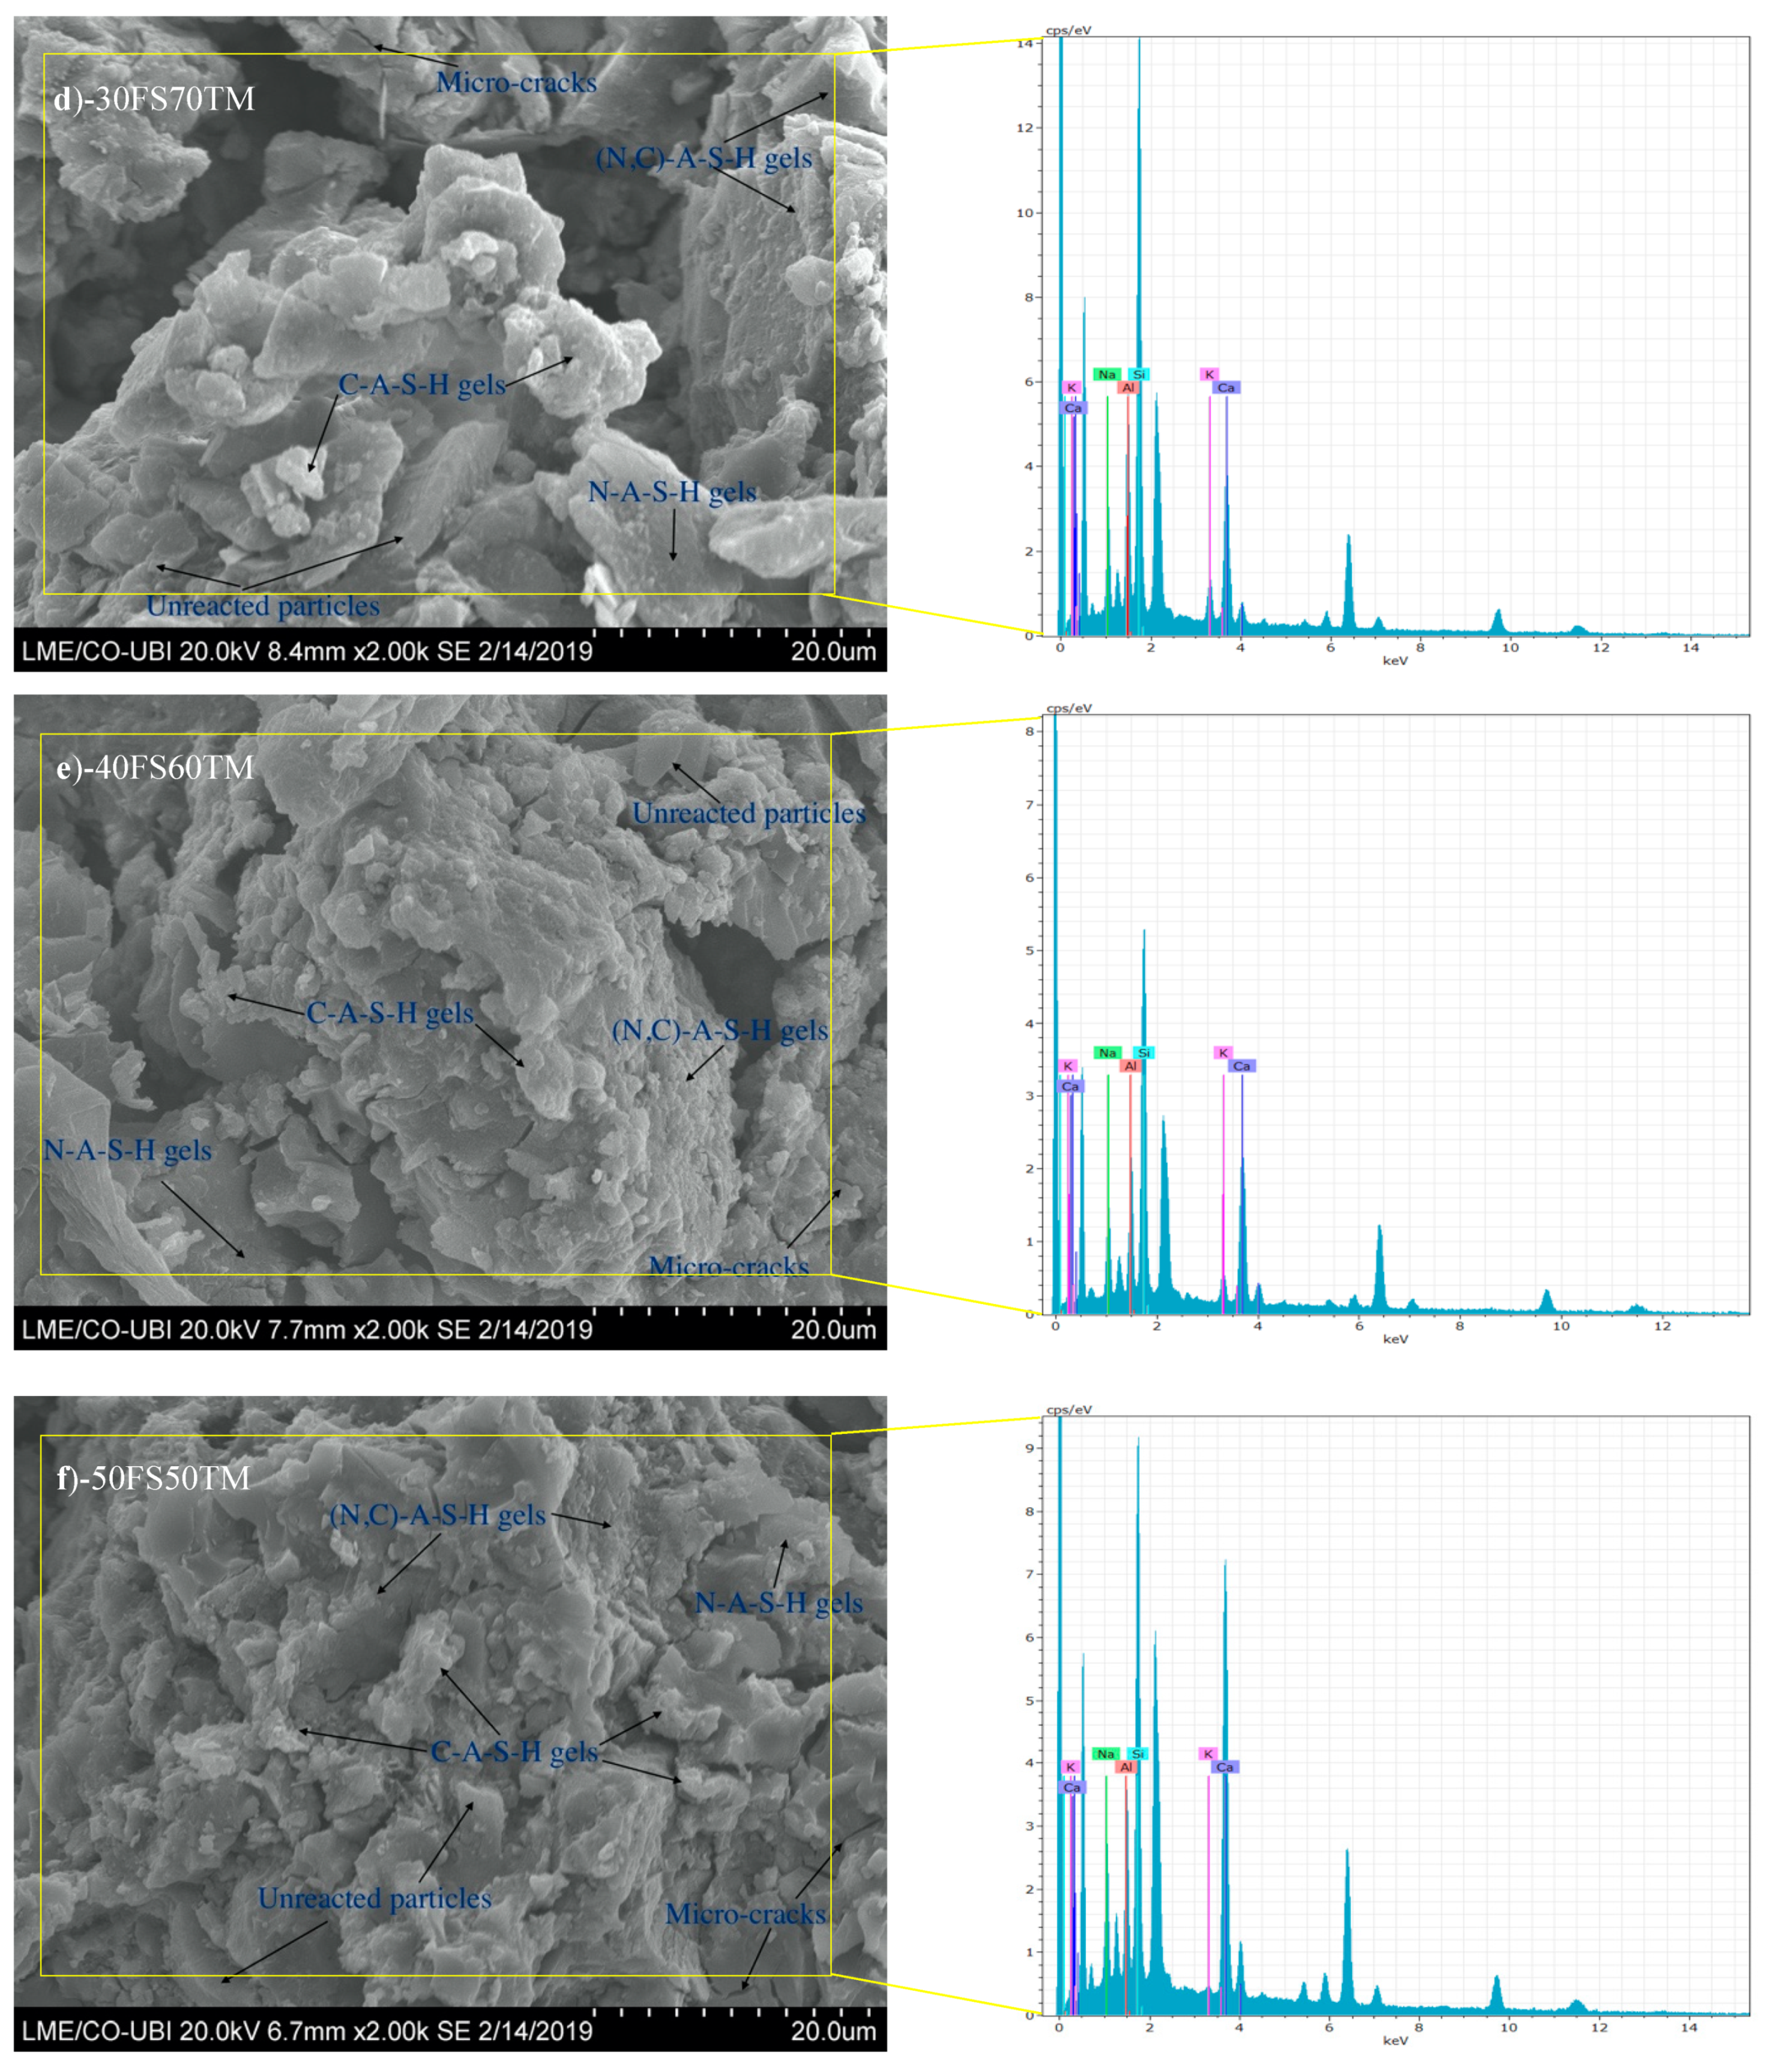
3.3.1. Scanning Electron Microscope (SEM)

Figure 6a–g demonstrate SEM-EDS analysis of the broken surface of the tungsten mining waste-based alkali-activated binder (Figure 6a), binary alkali-activated binders (Figure 6b–f), and an EAF-Slag-based alkali-activated binder (Figure 6g). As the figures indicate, the difference of microstructures between the six samples was evident. Three main features were observed in all the alkali-activated samples: (1) Unreacted particles, (2) Reaction products (were different between 100TM-AAB, the binary-AABs and 100FS-AAB) and (3) Micro-cracks.
The 100TM-AAB sample (Figure 6a) had relatively poor surface conditions with a high quantity of unreacted particles (irregular shape geometry) which are embedded in the matrix and partially covered by reaction product and small needle-like phase dispersed on the surface of the matrix. The presence of the needles in the TMWM-AAB sample after the alkaline activation may correspond to the formation of carbonates (such as potassium carbonate (K2CO3) and sodium carbonate (Na2CO3)) and reaction products (sodium aluminosilicate hydrates (N-A-S-H), and (sodium, calcium) aluminosilicate hydrates (N, C)-A-S-H). The existence of a high quantity of unreacted particles was due to the low reactivity of TMWM precursor (its natural crystalline mineralogy). After the alkaline activation kinetics of TMWM, SEM-EDS analyses confirmed the formation of two types of gels i.e., N-A-S-H and (N, C)-A-S-H. The formation of sodium aluminosilicate hydrates (N-A-S-H) due to the presence of the elements in (Si, Al, Na) with high content. Moreover, the formation of hybrid gels sodium and calcium aluminosilicate hydrates (N, C)-A-S-H, corresponded to a different gel that was obtained for the mixtures with low Ca content in the precursor. The presence of the needles in the 100TM-AAB after the alkaline activation may correspond to the formation of Natrite (Na2CO3) needles due to the low reactivity of TMWM, while the Na content in the mixture remained unreactive. During the curing time the Na reacted with the CO2 in the atmosphere and formed Na2CO3 under the efflorescence phenomena. In addition, the presence of unreacted potassium (in a system with potassium as an activator) under the efflorescence phenomena may form potassium carbonate (K2CO3) [21].
For the binary-AABs (Figure 6b–f), it is seen that the morphology of the AABs has changed and became denser upon the increase of the EAF-Slag content in the mixtures. Comparing the SEM images of the binary-AABs samples from (Figure 6b–f), it is observed that the increase of the EAF-Slag dosages in the mixtures leads to the formation of a denser microstructure due to higher reactivity of the EAF-Slag. In the binary-AABs samples, there was a formation of different reaction products (N, C)-A-S-H and C-A-S-H phases) with a globular morphology. When compared to the sample 100TM-AAB, the amount of the globular morphology of the reaction products increased with the increase of the EAF-Slag content in the mixtures. The increase of the aluminosilicate reaction products in the sample was able to cause an increase in mechanical strength. However, the N-A-S-H decreased with the increase of EAF-Slag content in the mixtures.
The microstructure of EAF-Slag alkali-activated binder sample (Figure 6g) shows the presence of some EAF-Slag particles that have not reacted with the alkali activator solution yet. Moreover, different microstructures were developed because of the reactive nature of the EAF-Slag. The alkaline activation of EAF-Slag provided a large amount of globular morphology due to the formation of C-A-S-H and (N, C)-A-S-H, but, the formation of N-A-S-H was observed in a lower quantity. When compared to the 100TM-AAB and binary-AABs matrixes, the microstructure shows a high formation of reaction products in the 100FS-AAB. This cluster, identified as calcium-substituted N-A-S-H gels ((N, C)-A-S-H), is associated with the only gel that has a globular morphology [22].

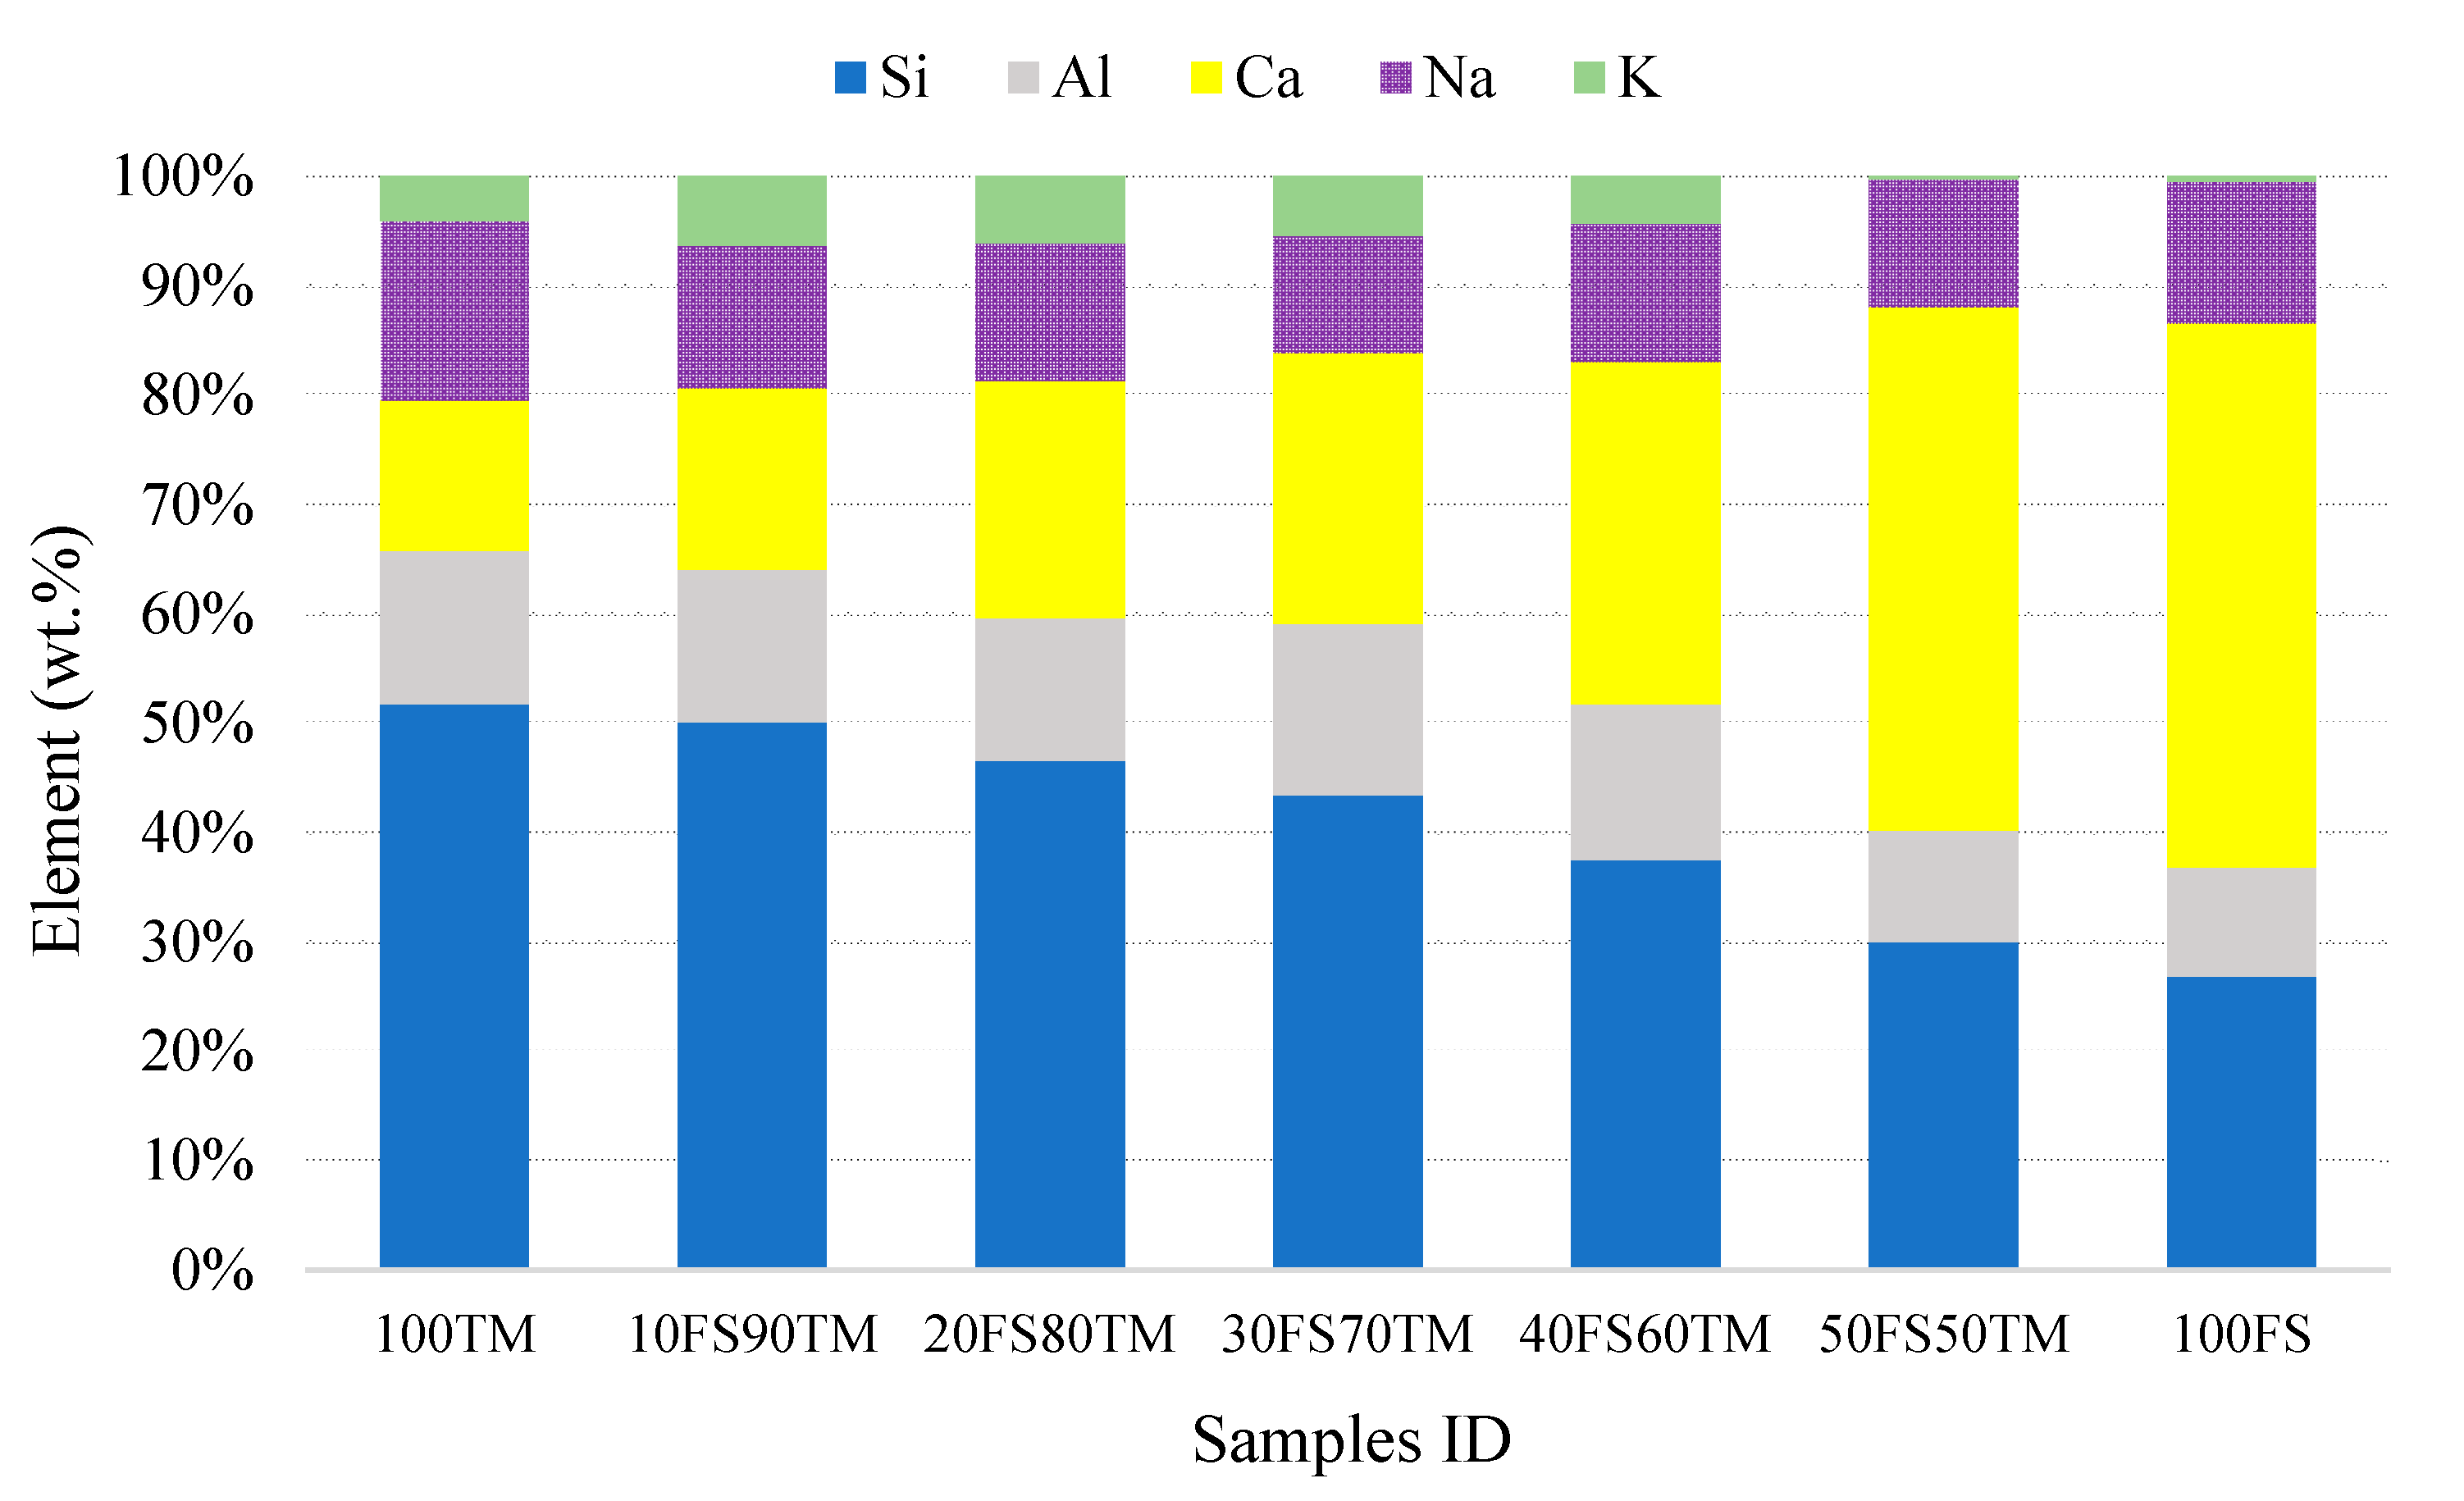
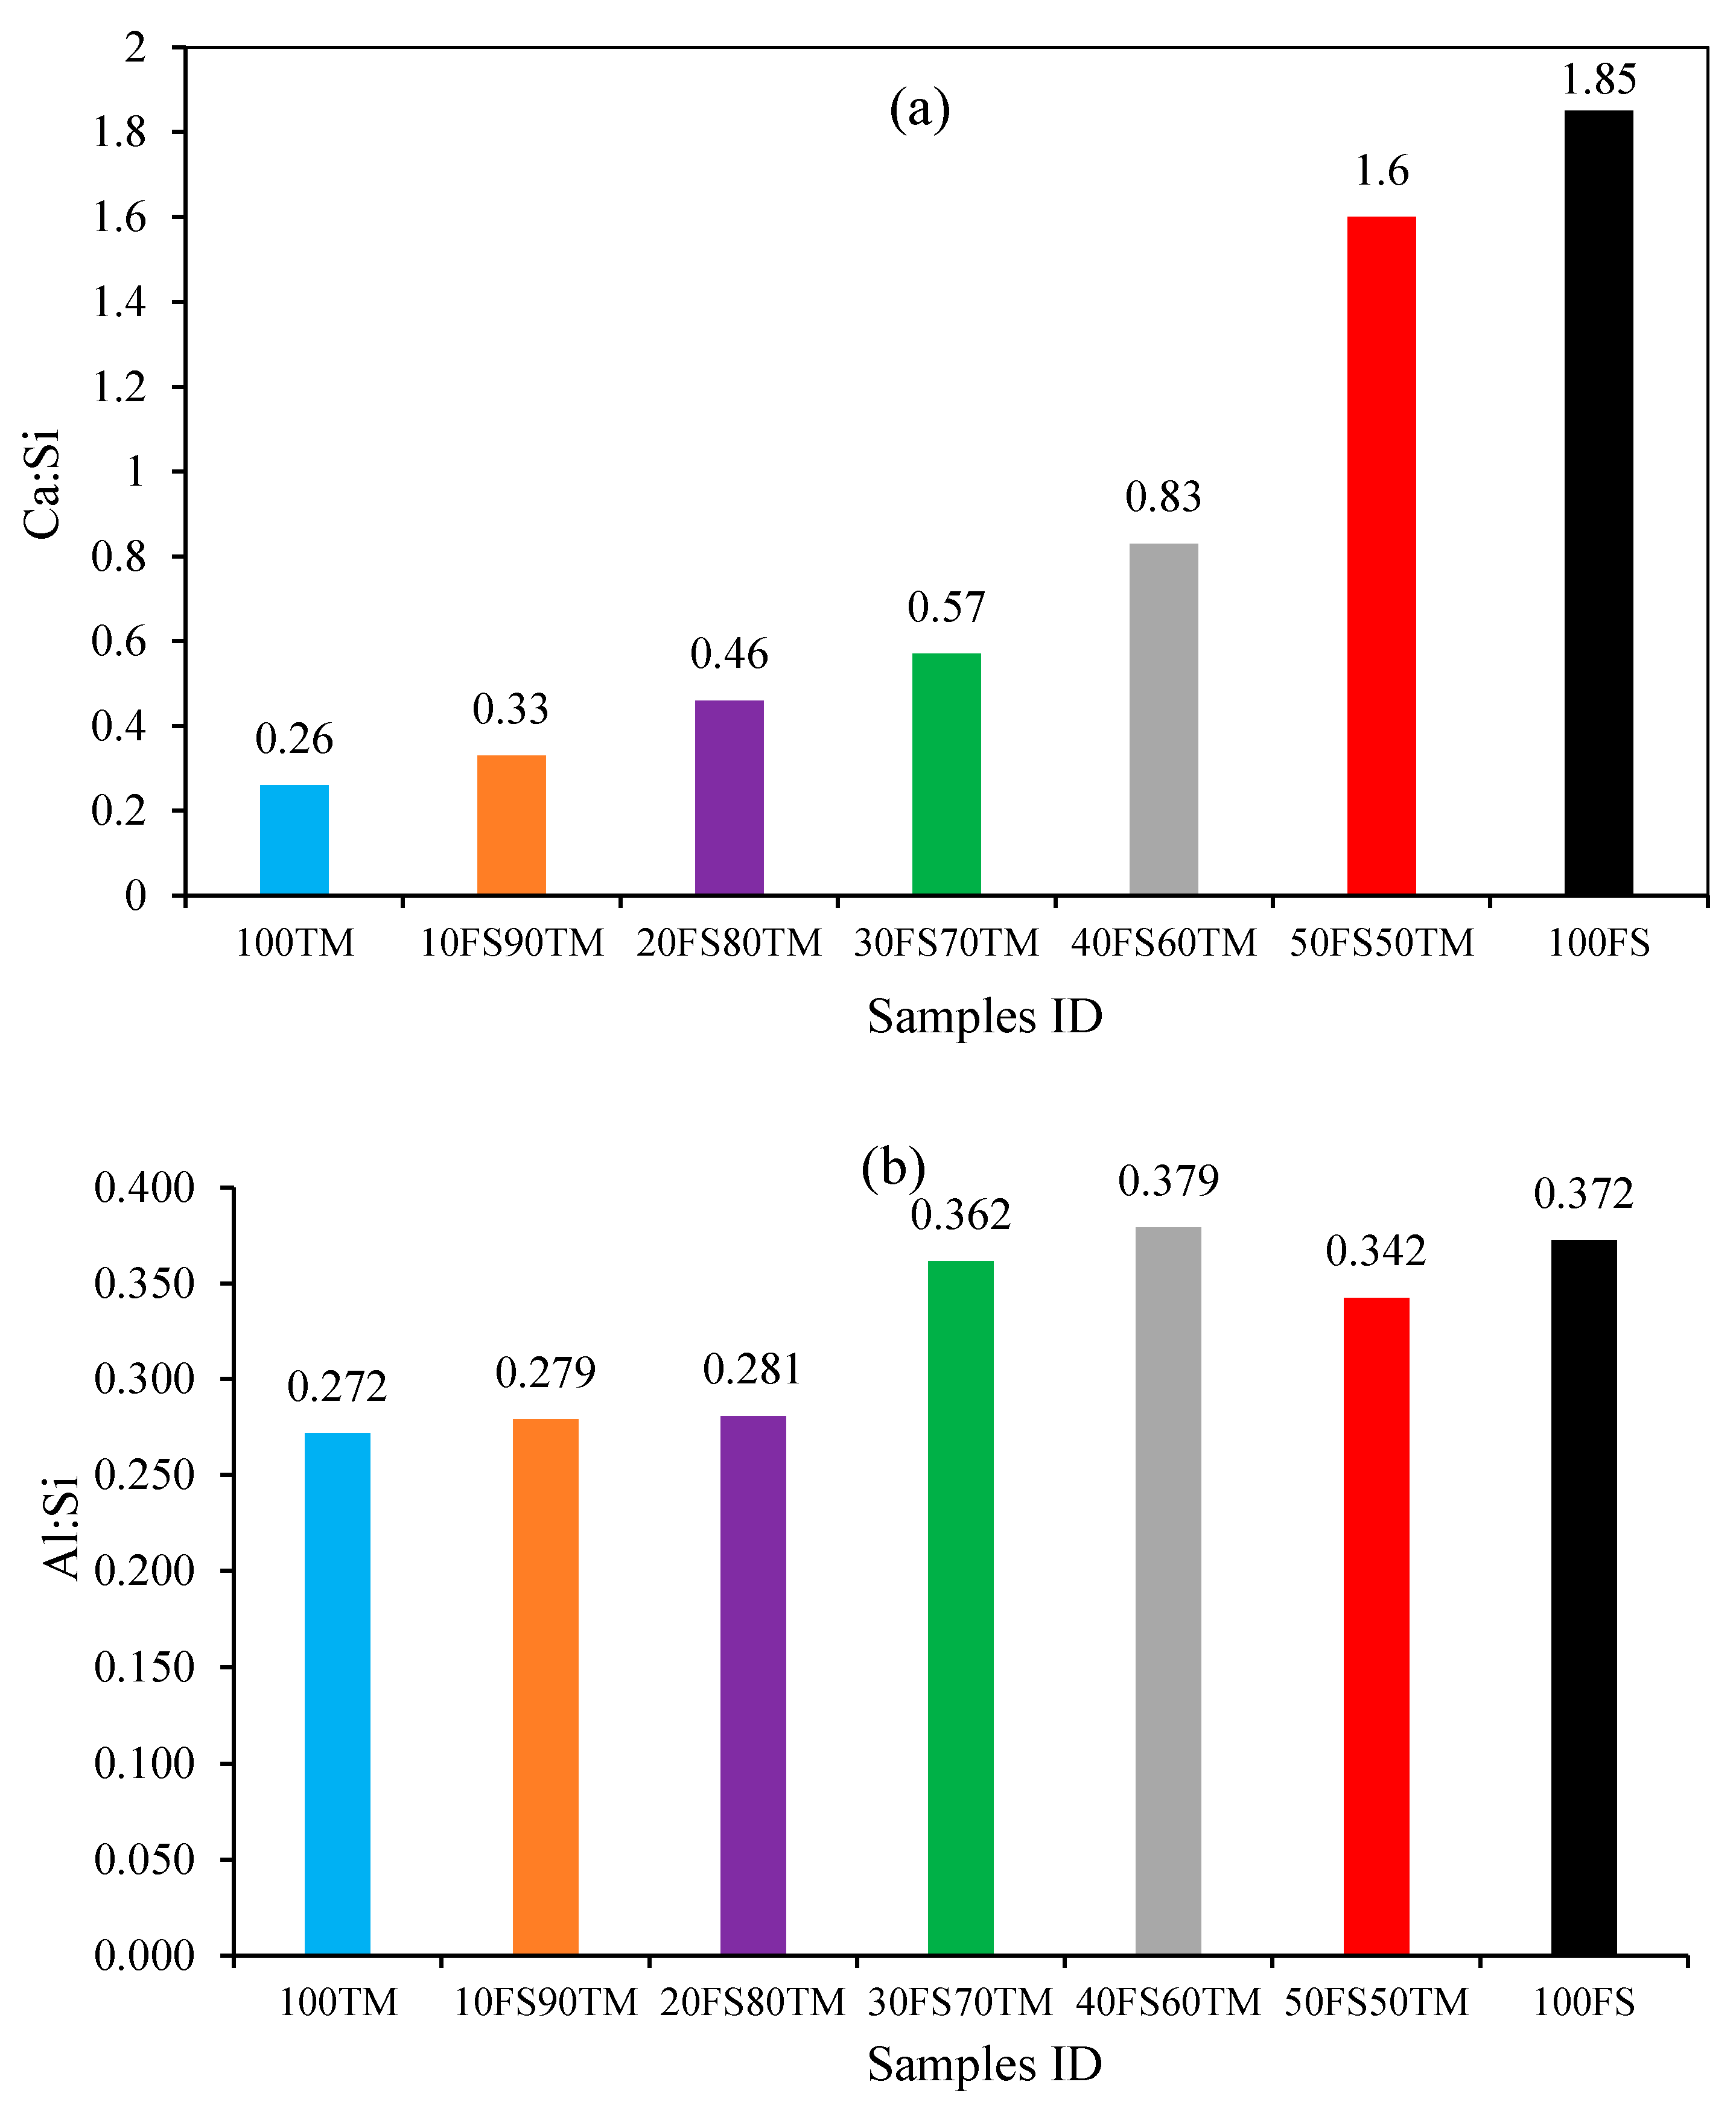
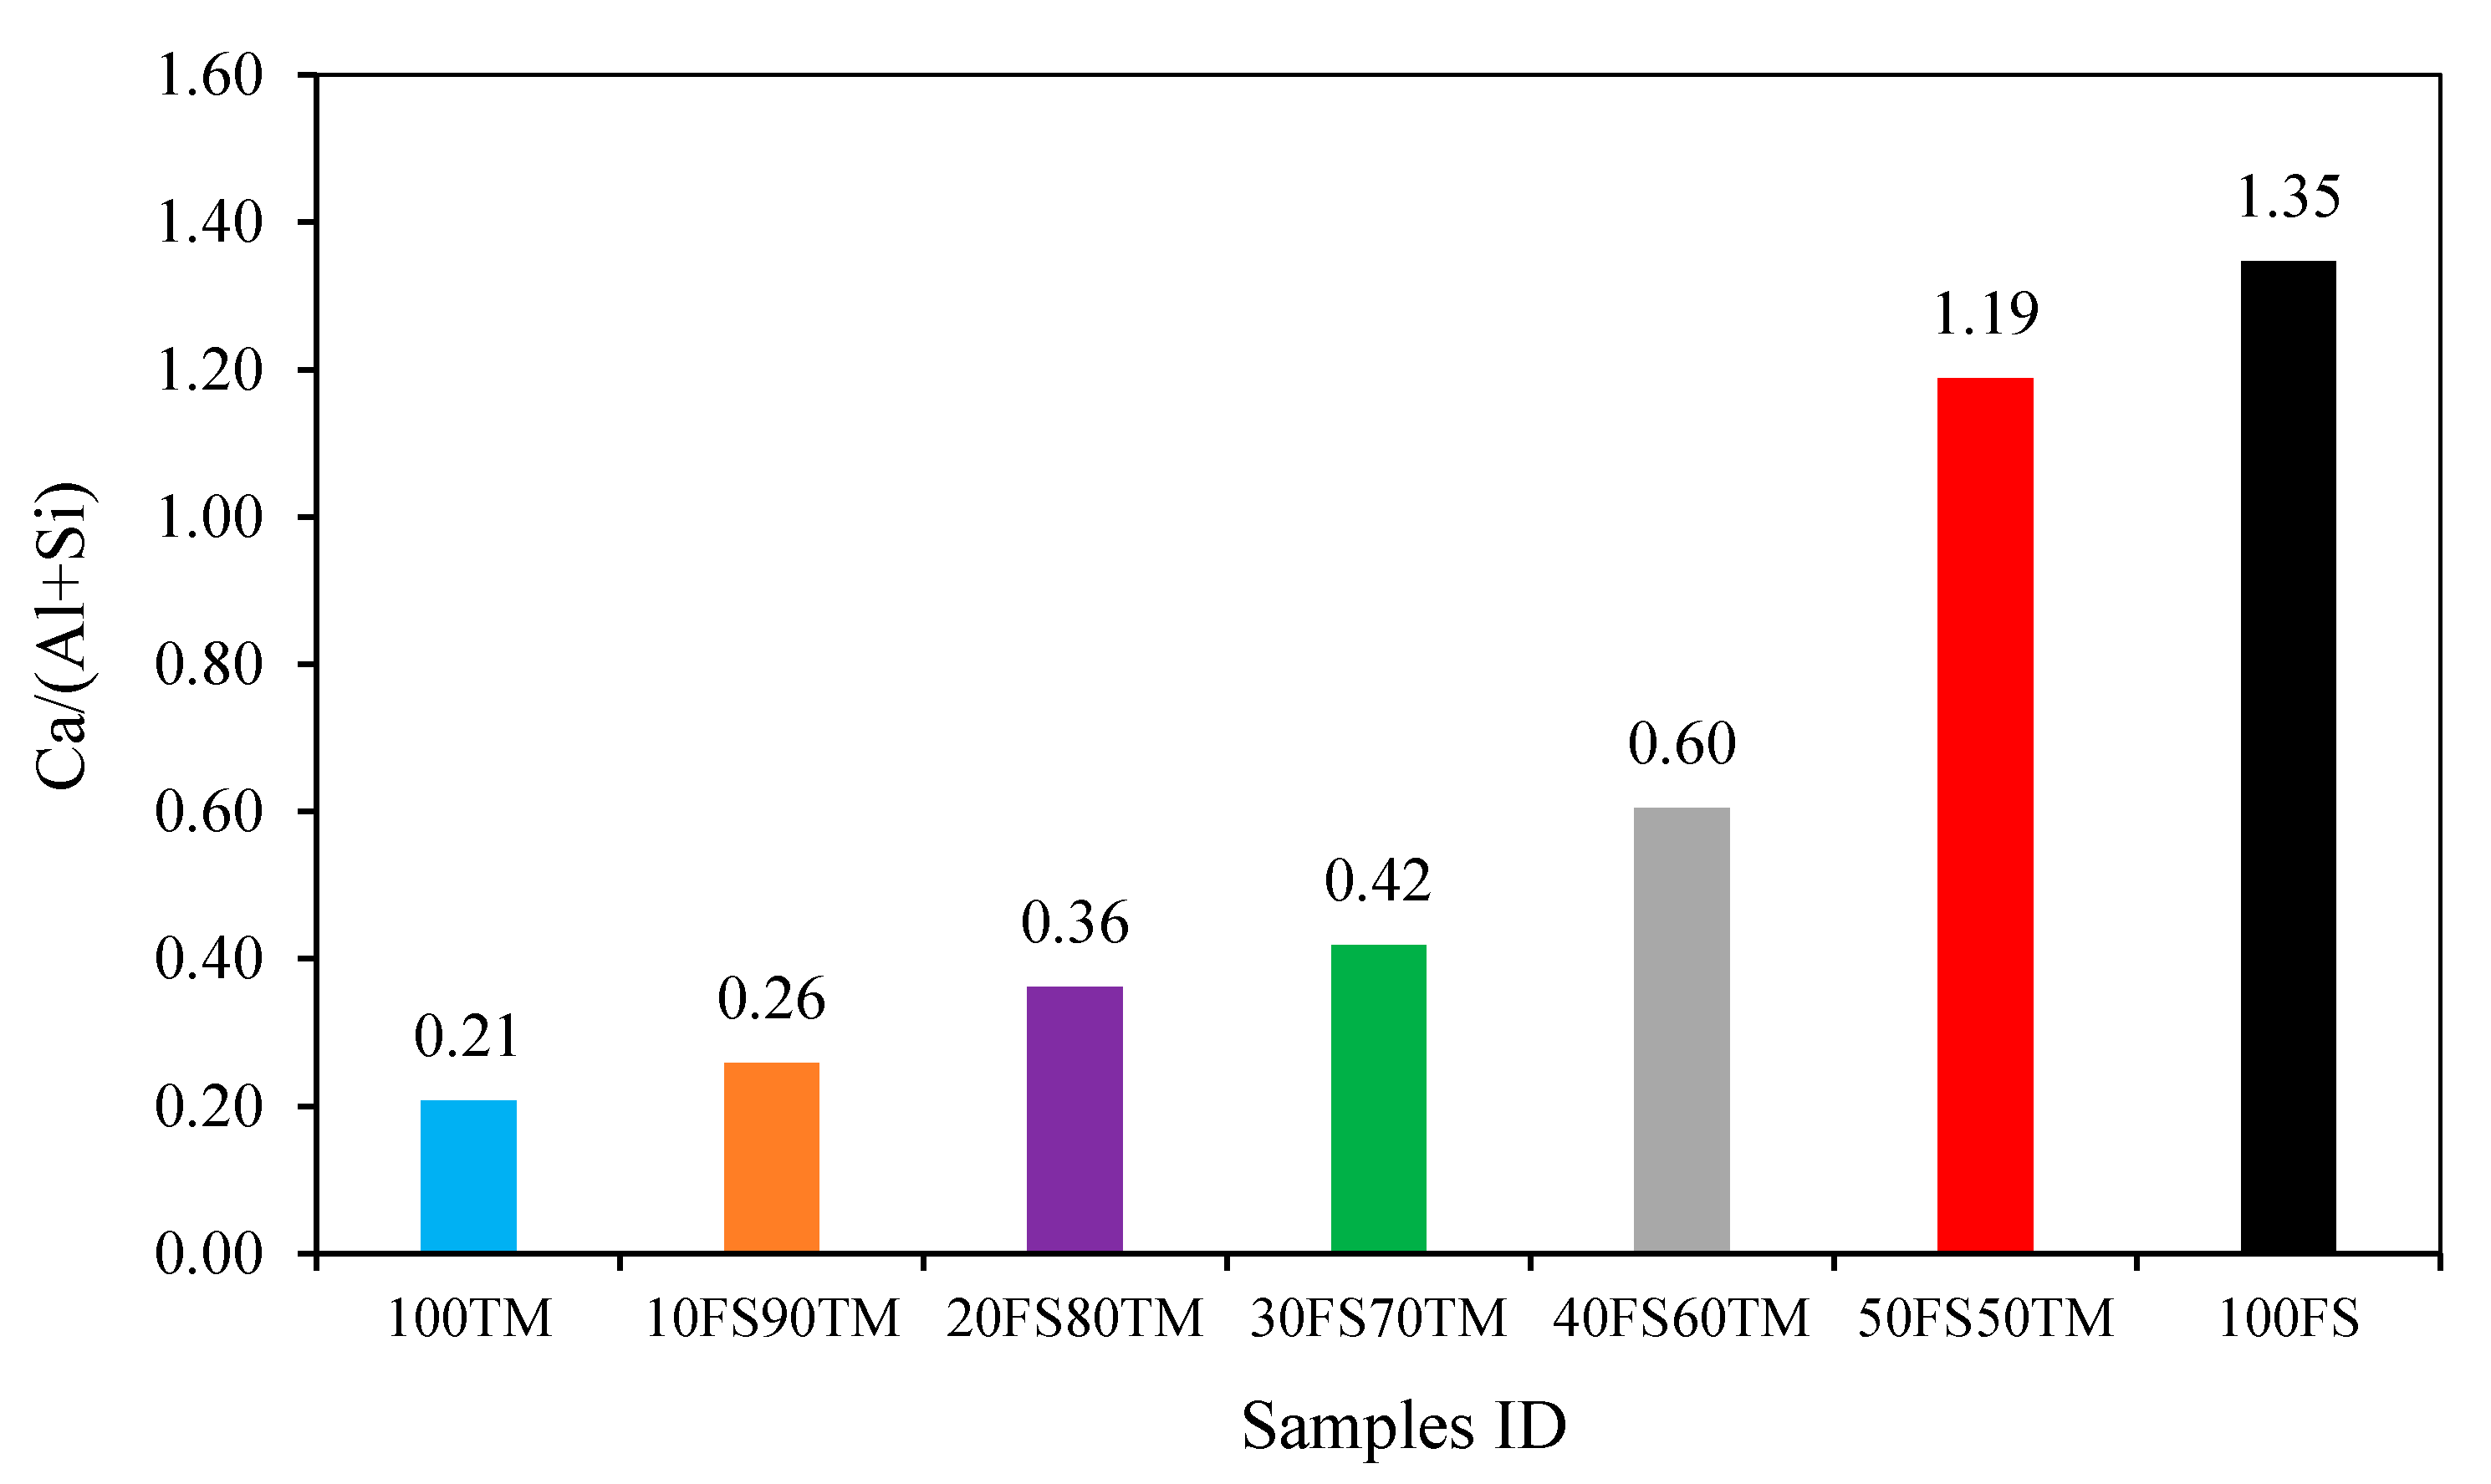
3.3.2. Energy Dispersive X-ray Spectroscopy (EDS)

Figure 6 and Table 4 present the SEM-EDS results of different solidified alkali-activated binders’ matrix that was investigated in this study. The chemical composition results showed that the major elements in the pastes are silicon (Si), sodium (Na), aluminum (Al), and calcium (Ca). Moreover, it seemed that there was a variation in the amount of the major elements in the different samples. The number of elements (silicon, sodium, and aluminum) decreased but the amount of calcium increased due to the decrease of TMWM and on the increase of EAF-Slag dosages in the mixtures as shown in Figure 7. It was seen that the percentage of silicon (Si) was more than 51% for the sample 100TM-AAB. The percentage of (Si) gradually decreased to reach 29.96% for 50FS50TM and 26.85% for the sample 100FS-AAB prepared with 100% EAF-Slag. However, the percentage of calcium of the sample 100TM-AAB (Ca) increased from 13.67% to 47.79% in the binary-AAB sample (50FS50TM). The high calcium content was found in the sample prepared with 100% EAF-Slag (100FS), with a Ca content of more than 49%. The increase of the percentage of calcium in the mixtures leads to the development of compressive strength of the alkali-activated binders.
The calculated Ca:Al and Ca:Si atomic ratios are shown in Figure 8a,b. It was observed that the variation of the major elements in the mixtures affects the Si:Al, Ca:Si and Al:Ca ratios. The Ca:Si follow an increasing trend with the increase in the amount of EAF-Slag in the mixtures. The increase in Ca:Si ratio was also noticed and indicated that this phase has a stronger influence on the development of compressive strength results. However, the ratios (Si:Al) and (Al:Ca) follow a decreasing trend with the increase of the amount of EAF-Slag in the mixtures.
The reaction products formed in the AABs (100TM-AAB and 100FS-AAB) and the binary alkali-activated binders (10FS90TM, 20FS80TM, 30FS70TM, 40FS60TM, 50FS50TM) consisted of Si, Al, Na, and Ca. The differences in the content and ratios of the main elements as a result of the blend composition indicated the formation of reaction products with different compositions and structures. Moreover, the number of reaction products formed depend on the amount of Ca content in the mixtures which depends on the EAF-Slag dosage. However, based only on SEM-EDS analysis results, it could not be asserted whether C-S-H, C-A-S-H and N-A-S-H coexisted in these mixtures or one hybrid (N, C)-A-S-H gel.
The reaction product of the tungsten mining waste-based alkali-activated mixture (sample 100TM) had the chemical compositions: Si = 51.74%, Na = 16.4%, Al = 14.0% and Ca = 13.67%, with Al:Si, Ca:Si and Al:Ca ratios equal to 0.27, 0.26 and 1.03 respectively. These values and ratios indicate the formation of a gel richer in Na and Al and poorer in Ca corresponding to sodium aluminum-silicate hydrate (N-A-S-H) gel. The low Ca:Si ratio exhibited by this gel was consistent with the presence of tetrahedral aluminum (AlO4) together with sodium ions (Na+) in the mix; the gels take up substantial amounts of tetrahedral aluminum in their structure to form (N, C)-A-S-H gel [23]. However, the reaction products formed in the binary alkali-activated mixtures had a chemical composition clearly different from the reaction products formed in the 100% alkali-activated raw materials mixtures. For the binary alkali-activated sample (50FS50TM) the ratios of the Al:Si, Ca:Si and Al:Ca are 0.34, 1.6 and 0.21, respectively. However, the Al:Si and Ca:Si ratios increased with the increase of EAF-Slag content in the mixtures (from 10 vt.% to 50 vt.%). The Al:Si ratio increased from 0.28 to 0.37 and the Ca:Si ratio increased from 0.33 to 1.6, and it could indicate the formation of a different types of gel richer in Ca, Si, and Al such as C-A-S-H and N-A-S-H. Moreover, the increase of calcium content in the mixtures and the increasing of Ca:Si ratio to reach higher value could modify the structure of N-A-S-H gels by replacing part of the Na with Ca form (N, C)-A-S-H gel in which sufficient Ca is available [24]. According to Criado et al. [25], the increase of the dosage of slag in the mixtures led to an increasing in the amount of C-A-S-H gel and decreasing in the amount of N-A-S-H gel. For the EAF-Slag-based alkali-activated binder, the main reaction products formed are calcium silicate hydrate (C-S-H) gel; and with the Al in its structure formed (C-A-S-H gel) in addition to N-A-S-H and (N, C)-A-S-H types of gel products. The formation of these gels depends on the high content of Ca (49.65%) and the higher Ca:Si ratio of 1.85. Figure 9 shows that Ca:(Al + Si) distribution increased from 0.21 for the sample 100TM and 1.19 for the sample 50FS50TM and reached 1.35 for the sample 100FS. This indicates that the samples are chemically heterogeneous. The increase of Ca:(Al + Si) ratio in the mixtures generates a larger amount of pure reaction product C-A-S-H in the samples [26].

3.4. Pore Structure

3.4.1. Porosity

The total intruded volume of mercury allows the measurement of the porosity accessible to mercury at maximum applied pressure. Although it has been suggested that the pressure range close to the maximum applied pressure may crush pore walls, the total intruded volume remains a useful index for comparing pore structure between different mixture designs [27,28]. The total porosity is the total intruded Hg volume in the sample and graphically the total porosity represents the maximum value on the intrusion curve [29].
In this investigation, the porosity of all alkali-activated pastes was determined by MIP and all results are illustrated in Figure 10 and Table 5. The first observation shows that the partial replacement of TMWM by EAF-Slag has a determinant influence on the total porosity. Although the total porosity decreased with the increase of the EAF-Slag dosages in the mixtures, the experimental results show that the total porosity and compressive strength are directly correlated: the higher the compressive strength of the binders is, the lower the total porosity, as shown in Figure 11. Moreover, there is a positive correlation between the total porosity and compressive strength that was affected by the content of EAF-Slag in the mixtures. Therefore, the EAF-Slag content increased in the mixtures’ offset by lower total porosity in the samples, thus positively affecting and enhancing the compressive strength of the binary binders.

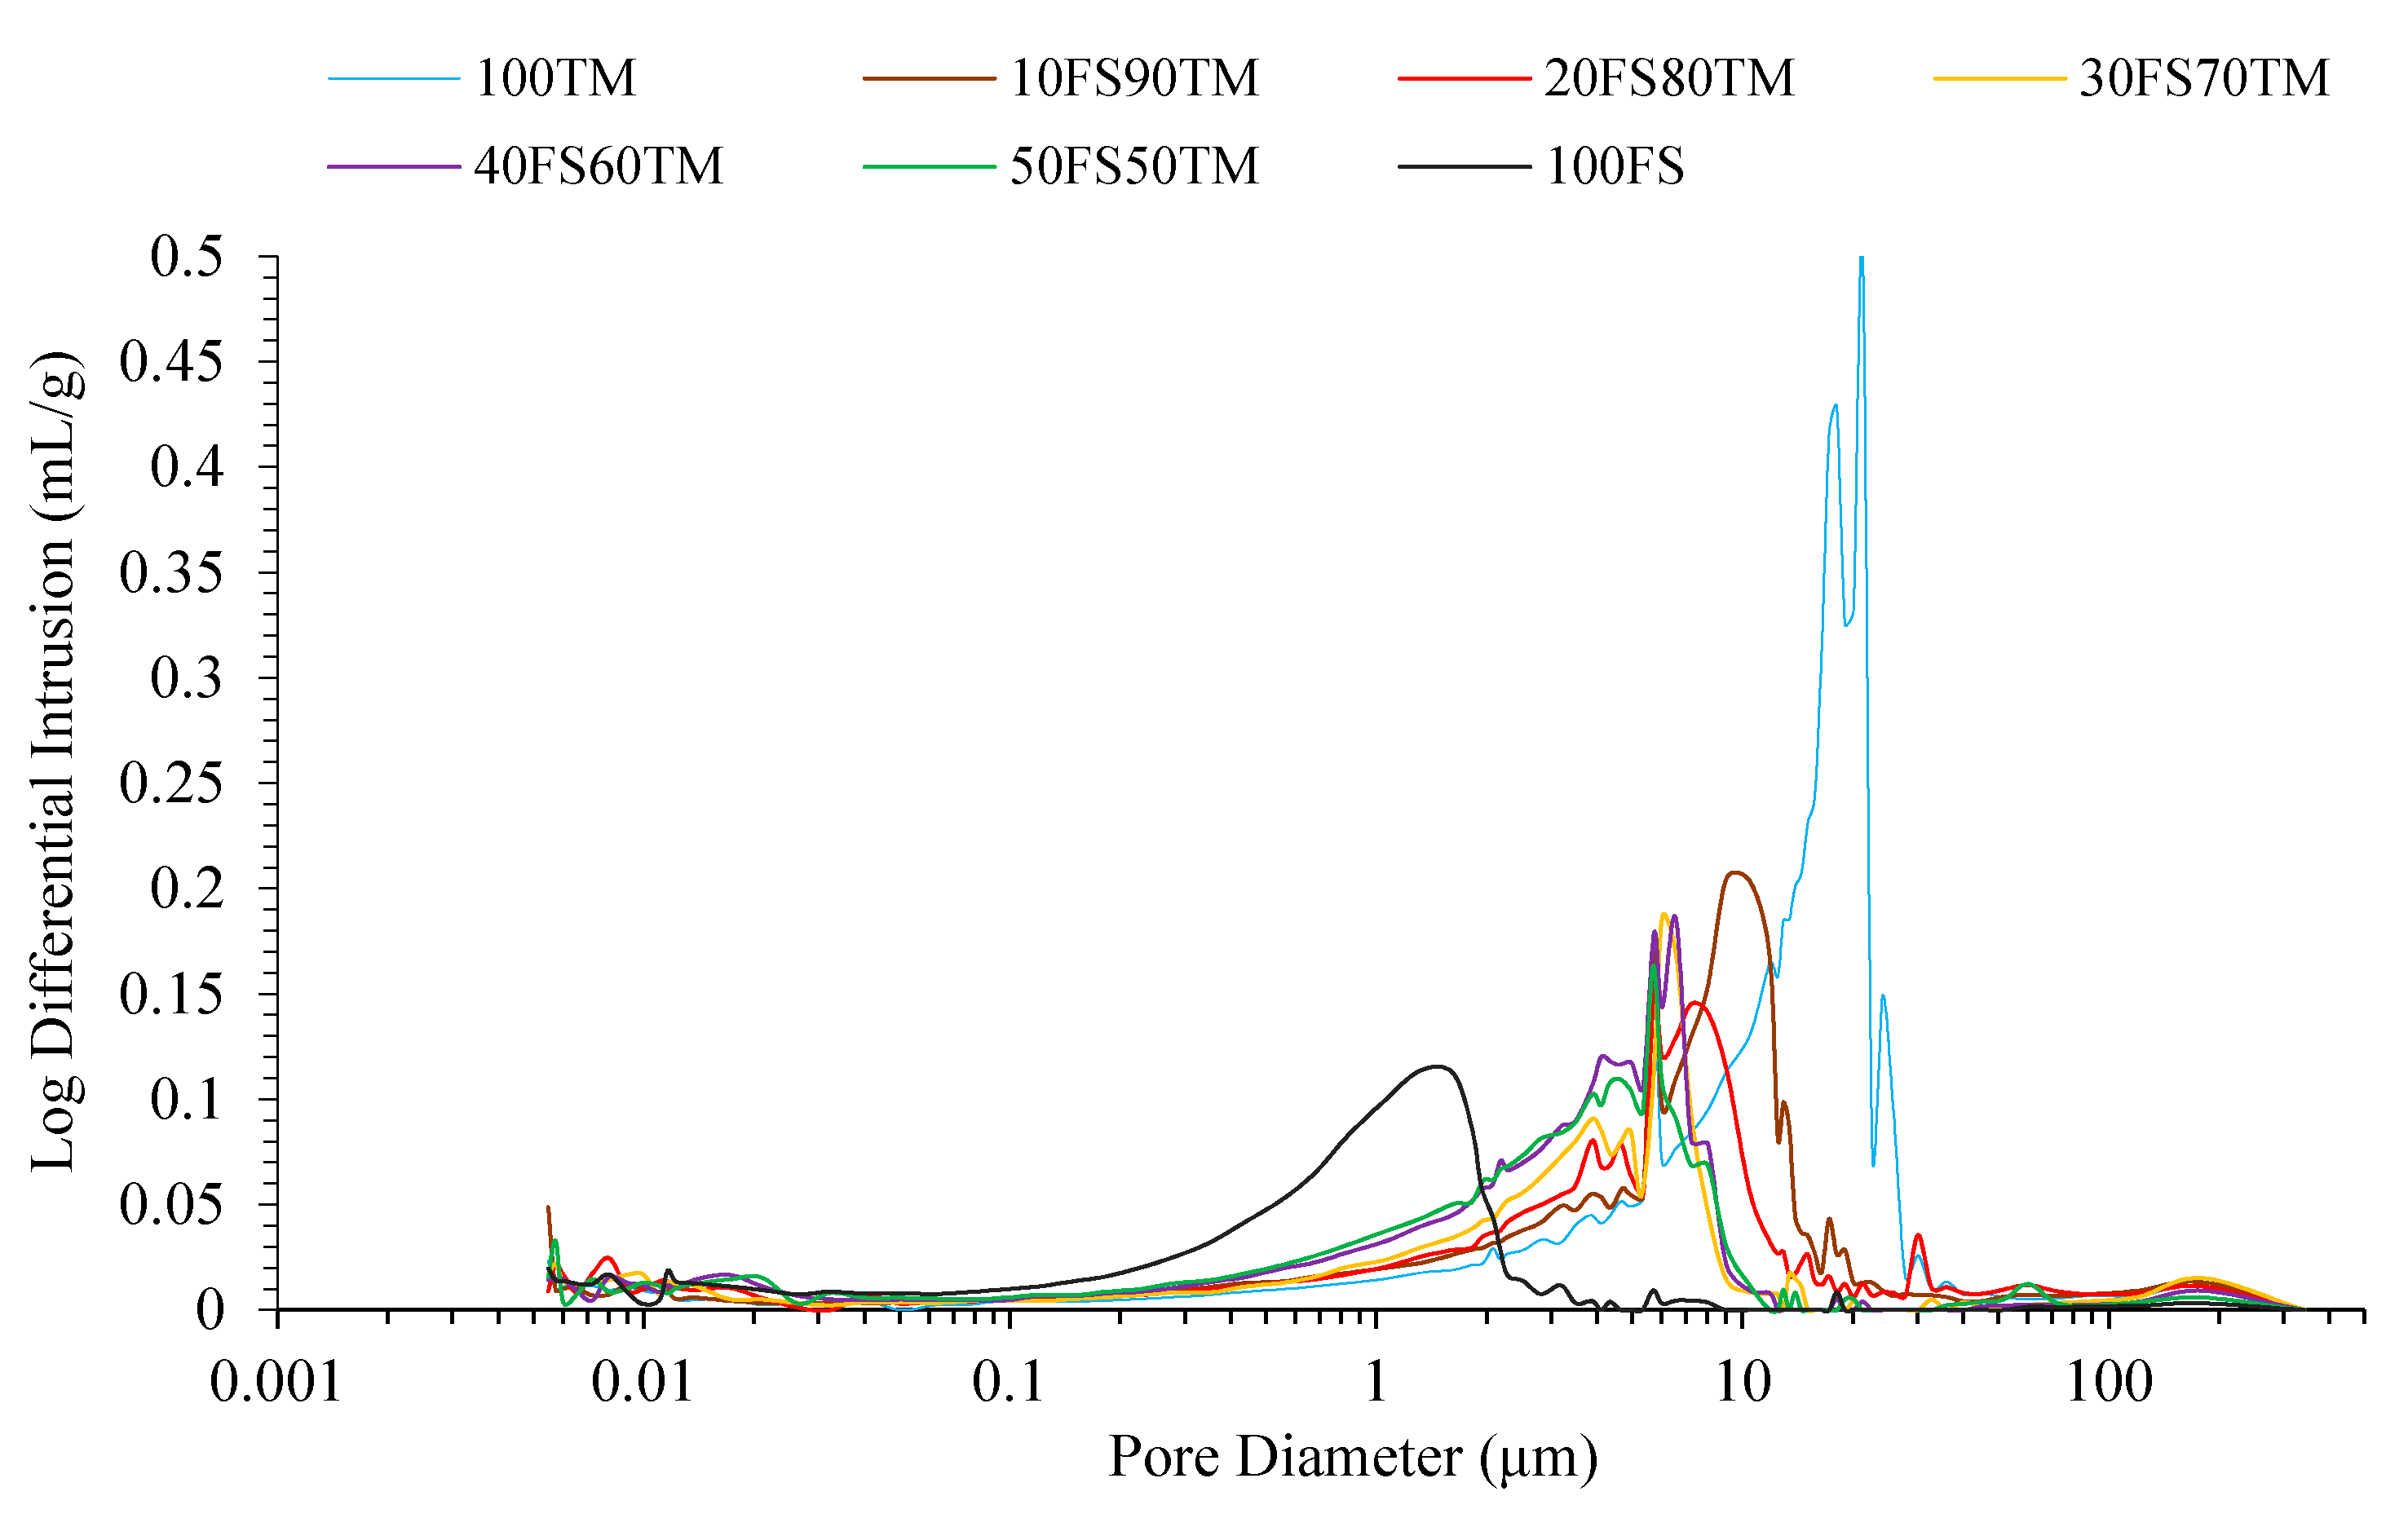
3.4.2. Pore-Size Distribution

Figure 12 and Figure 13 shows the pore-size distribution and differential curves derived from MIP for all the alkali-activated pastes with 28 days of curing time. The MIP data of the 100TM-AAB, 100FS-AAB, and the binary-AABs are also presented in Table 5. To gain more insight into the pore-size distribution of the AABs with the partial replacement of EAF-Slag content in the mixtures, the measured pore distribution is divided into four size ranges according to the International Union of Pure and Applied Chemistry (IUPAC) system [30]. Pores in the cementitious materials can be classified as micropores (d < 2 nm), mesopores (2 nm < d < 50 nm), macropores (50 nm < d < 10 µm) and voids and micro-cracks (d > 10 µm). The micropores (ranges d > 2 nm) cannot be measured using the MIP technique because the data given is limited and only a minimum pore diameter of 0.005 µm (5 nm) can be evaluated. However, it is possible to measure the mesopores, macropores, and voids and microcrack. In the current study, the pore sizes classifications are shown in Figure 12, and Table 5 for all the alkali-activated samples [(100TM-AAB, 100FS-AAB) and (the binary binders)]. It is noticed that the pore ranges changes significantly in the samples with a higher content of EAF-Slag (40–50%) when compared to the original sample containing 100% TMWM (100TM-AAB sample).
For the 100TM-AAB sample, the dominant range is the range of air voids/cracks (65.44%) followed by macropores (30.89%) and a small range of mesopores (3.67%). However, for the binary-AABs samples (10FS90TM, 20FS80TM and 30FS70TM) the dominant ranges are the macropores followed by air void/cracks range or followed by the mesopores range for the samples (40FS60TM, 50FS50TM and 100FS) whose changes depend on the content of EAF-Slag in the mixtures. In terms of mesopores (5–50 nm) and macropores (50 nm–10 µm), all samples tend to have larger mesopores and macropores fraction with the increase of EAF-Slag content. However, in terms of air voids/cracks (>10 µm), all samples, tend to have smaller air voids/cracks fraction with an increase of EAF-Slag content. It is clear that when the content of EAF-Slag in the mixtures increases the pore-size distribution curves shifts to smaller pore sizes indicating a denser microstructure of the binary-AABs samples.

3.4.3. Average Pore Diameter

The average pore diameter or mean pore diameter was calculated in terms of pore volume and the surface area by the ratio between 4 total pore volume and the pore surface area (4 V/A). This average value simplifies the real pore structure by a cylindrical tube with its equivalent diameter. All these pore diameters are evaluated and presented in Table 5 for all alkali-activated samples. It was observed that the average pore diameter decreases proportionally when the EAF-Slag content in the (TMWM and EAF-Slag) mixtures increased. When TMWM was partially replaced by EAF-Slag, the average pore diameter decreased 41.1% from 146 nm to the 100TM-AAB sample to reach 86 nm for the binary alkali-activated binder (50FS50TM) sample. There is a correlation between the average pore diameter and compressive strength of the binary alkali-activated binders. The compressive strengths tend to increase as the average diameters of pores decreased. According to H. moon et al. [31], the average pore diameter has a significant influence on chloride diffusivity. The partial replacement of TMWM with EAF-Slag in the precursors’ mixtures has been proven to be effective in reducing the average pore diameter and reduce the chloride diffusivity of the paste.

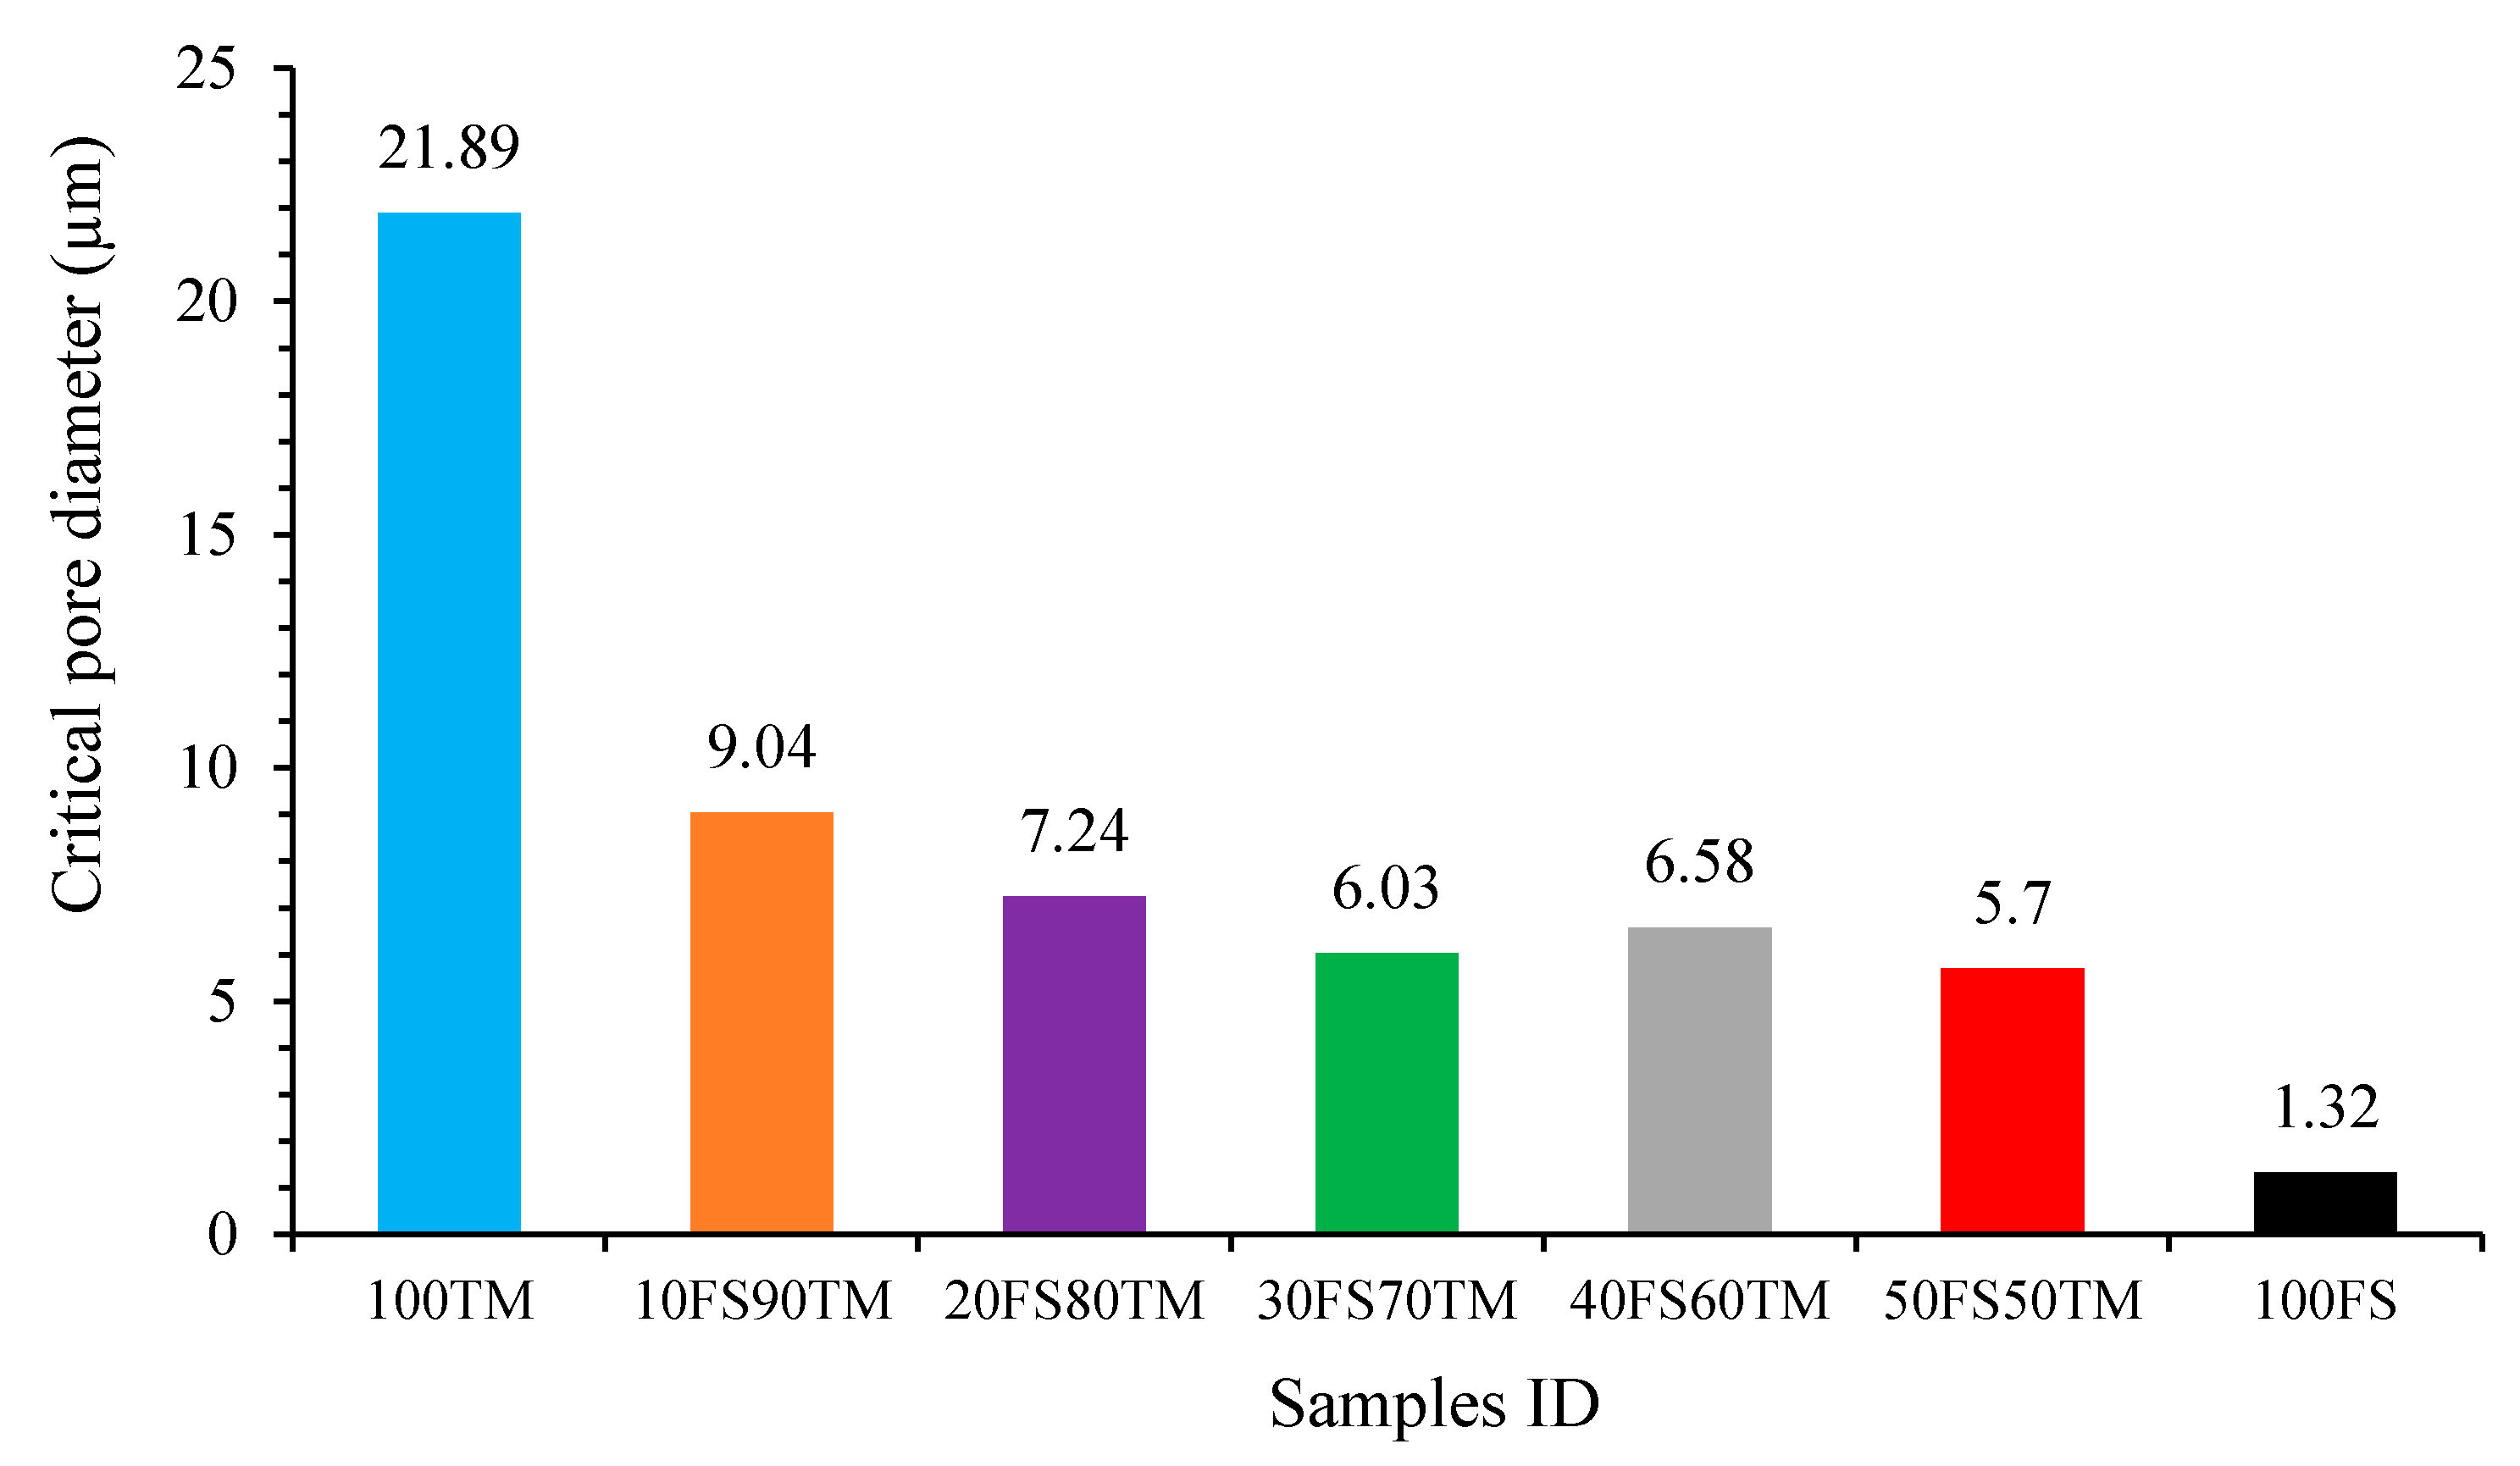
3.4.4. Critical Pore Diameter

The pore diameter corresponding to the highest rate of mercury intrusion per change in pressure is known as the characteristic of continuous pore diameter (size), “critical,” or “percolation” pore diameter [32,33,34]. From the Differential Pore-Size Distributions (DPSD) curve, the highest point on the corresponding logarithmic differential pore volume curve corresponds to the critical pore (size) diameter. However, from the cumulative porosity curve the critical pore (size) diameter measured at the steepest slope of the curve. It is considered that all pore sizes refer to the percolation of mercury into the size pore diameter in an interconnected structure the critical pore diameter provides an index to compare pore structures between different alkali-activated mix designs [29,35,36]. The critical pore diameter, though, may provide a better indicator of material durability as it has an important influence on the permeability and diffusion characteristics of the alkali-activated binder paste [36,37]. However, there is no relation between the critical pore diameter and the degree of the alkaline activation or the related gel/space. The reason for this is that the pore structure depends on the quantity of the reaction products formed and how they are packed in the pore space [35]. Table 5 shows that the critical pore diameter of the alkali-activated binder gradually decreased with the increase of the EAF-Slag dosages in the binary-alkali-activated mixtures. For the 100% TMWM mixture, the critical pore diameter was 21.89 µm and this value decreased 74% by ratio to reach a critical pore diameter of 5.7 µm when 50 vt.% of TMWM was blended with 50 vt.% of EAF-Slag. The critical pore diameter significantly decreased when TMWM and EAF-Slag are blended, which influences the permeability and diffusion characteristics of the binary-alkali-activated binders. Comparing the 100% TMWM alkali-activated mixture (100TM sample) with the sample prepared with 100% EAF-Slag, the critical pore diameter decreased by 94% to reach 1.32 µm for the 100FS-AAB sample. Moreover, as seen in Figure 14 the 100TM sample has a higher critical pore diameter than the binary-AABs and 100FS-AAB sample that can be a factor of reduction of compressive strength.

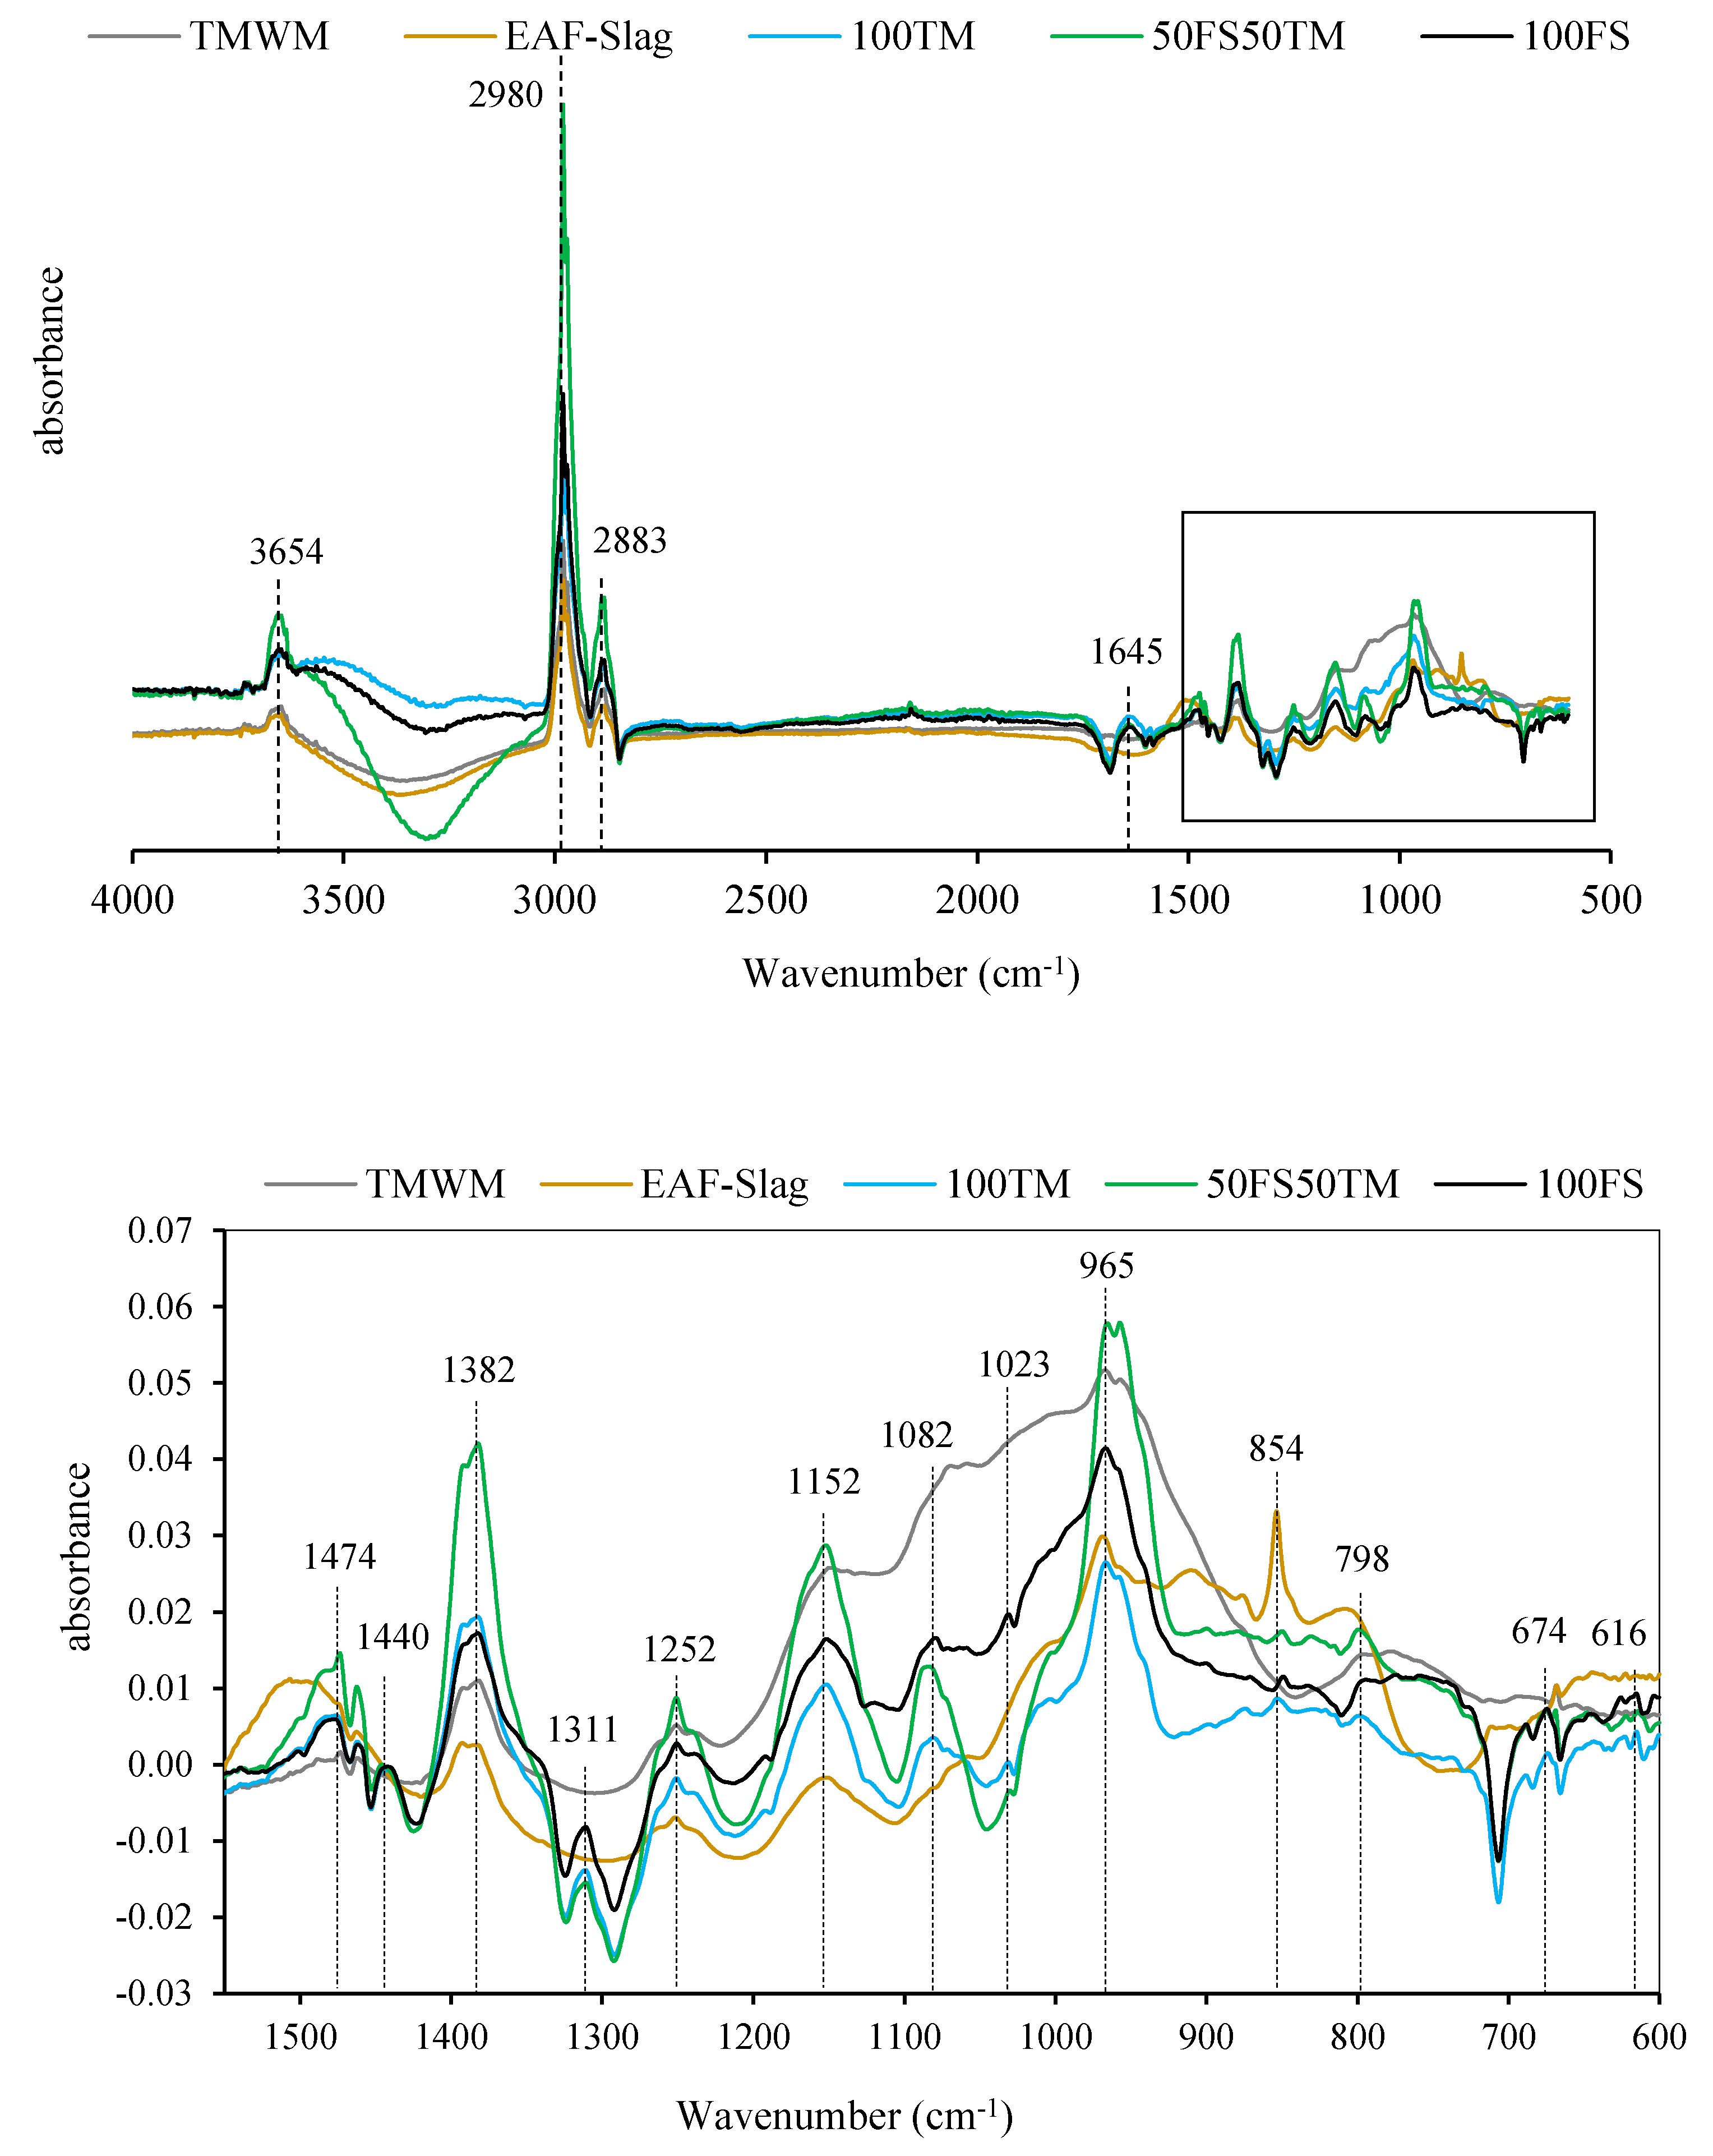
3.5. Fourier Transform Infra-Red (FT-IR) Spectroscopy

Figure 15 shows the FT-IR spectra of the unreacted precursors (TMWM and EAF-Slag), and the alkali-activated binders (100TM, 100FS, and the binary (50FS50TM)) samples. The TMWM consisted mostly in a vitreous phase comprising SiO2 and Al2O3, quartz, muscovite, and clinochlore. As the data shows, the bands generated by quartz, mullite and the vitreous phase of the TMWM overlap in the area between 1200 and 900 cm−1 generating a wide intense, where the asymmetric stretching vibration T-O (T = Si or Al) bonds appears [38,39]. The presence of quartz in the original TMWM gives rise in the FT-IR spectrum to a series of bands located at 1152, 1082, 798 and 675 cm−1. The main vibration band for TMWM is at the absorption band located at 965 cm−1 typical of the Si-O asymmetric stretching vibrations [40], this band may correspond to the asymmetric stretching vibration T-O-Si (T: Si or Al) [41]. Moreover, the peaks at 1152 and 616 cm−1 correspond to octahedral aluminum, which is partially covered by the main band (Si-O-T) indicate the presence of mullite [42,43]. The bands at 1252 cm−1 is attributed to the length as well as the angle of the Si-O and Al-O bonds in the silicates and other XRD-amorphous silicate phases [44]. The absorption bands of free O-H stretching at the band 3654 cm−1 [45], was due to the absorbs of moisture where both precursors (TMWM and EAF-Slag) were in open air. In addition, this band might correspond to the presence of muscovite as a crystalline phase in the TMWM precursor [46,47].
The difference seen in the main bands’ wavenumber of the two raw materials (TMWM and EAF-Slag) is attributed to their different glassy structure. The unreacted EAF-Slag also shows main absorption vibration peaks at about 965 cm−1 and 854 cm−1. The peak at ~854 cm−1 is associated with the asymmetric stretching vibration of Al-O bond of the AlO4 groups [43] that indicate the presence of gehlenite. Although the peak at 965 cm−1 is assigned to the stretching vibration of the Si-O bond [48], the band is originated from calcium silicate. This band can also be attributed to the asymmetric stretching vibration T-O-Si where (T = Si or Al) [41], thus indicating the presence of åkermanite [49]. In addition, diopside has been identified at the peaks located at the wavenumbers 965 cm−1 and 669 cm−1 [50]. The FT-IR spectra of the EAF-Slag also shows a peak at wavenumber 1510 cm−1 corresponding to the stretching vibrations of O-C-O [51,52]. This peak indicates the existence of carbonates and traces of calcite (CaCO3) and dolomite in the EAF-Slag [53]. The FT-IR spectra, after the alkaline activation shows almost the same absorption wavenumbers bands that were observed in TMWM and EAF-Slag raw materials. All samples showed the characteristic bands attributed to unreacted phases. For the TMWM, the unreacted elements were quartz (at 1152, 1082, 798, 675 cm−1), mullite (at 1152 and 616 cm−1) and muscovite (at 3654 cm−1). However, for EAF-Slag, the unreacted phases were gehlenite (at 854 cm−1), calcium silicate and åkermanite (at 965 cm−1), diopside (at 965 and 669 cm−1), carbonate, calcite and dolomite (at 1510 cm−1). The FT-IR results showed that the crystalline phases in both precursors were unreactive. However, there was a change in the intensity of the bands and the appearance of new bands at the wavenumbers 1032 cm−1, 1311 cm−1, 1440 cm−1, and 1645 cm−1, which are related to the formation of new components. In addition, the width of the broadband in the FT-IR spectra of the raw materials in the range 1200–850 cm−1 becomes sharper after the alkaline activation, which corresponds to the asymmetric stretching vibration of Si-O-Si and the Si-O-Al bonds. According to Garcia-Lodeiro et al. [54], the main band around 965 cm−1 is associated with asymmetric Si-O stretching vibrations bonds that indicate the formation of the gels C-S-H and C-A-S-H after the alkaline activation [55]. The appearance of shoulder bands corresponds to Si-O stretching vibrations at wavenumber 1032 cm−1. These are associated with the possible formation of a silicon-rich gel with some sodium in its composition such as N-A-S-H and (N, C)-A-S-H gels [40]. However, the appearance of the peaks at wavenumber 1082 cm−1 asymmetric stretching vibrations (Si-O-Si and Al-O-Si) in the alkali-activated binders indicate the formation of a new product assigned to the amorphous aluminosilicate phases [56]. The T-O vibration bands at around 1152 cm−1 are associated with quartz and mullite vibrations [57]. A narrow band at the wavenumber 1380 cm−1 is assigned to the N-O stretching vibrations and indicates the presence of a small amount of sodium carbonate in the samples. This is due to the atmospheric carbonation between the unreacted Na in the mixtures and CO2 in the air where the typical reaction product are nitrates [54]. Concerning the carbonates in the FT-IR spectra region of 1410–1550 cm−1, this bands correspond to the asymmetric stretching vibration of O-C-O bonds [58,59], which is the result of the overlapping of several contributions from different carbonates such as dolomite and calcite from the raw materials which remained unreactive [53]. The small band at about 1440 cm−1 in the alkali-activated binders that was not in the raw materials indicate the presence of carbonate [60], or the presence of Na2CO3 [61]. The double peak at wavenumbers 2881 and 2981 cm−1 in all samples are assigned to H-O-H stretching and bending vibrations of bound water molecules [62]. In this FT-IR spectra, the band seen at 1630 cm−1 in the samples after the alkaline activation is attributed to bending vibrations modes of (H-O-H) bonds [63]. This band is also typical of the bending vibrations generated by the -OH groups in water and bending the -OH bonds adsorbed into the aluminosilicate gel structure (≡Si-OH⋯H2O and/or ≡Al-OH⋯H2O) [43,64,65]. Moreover, the narrow absorption band at 3654 cm−1 is typical of O-H stretching band [47]. The spectrum of bending and stretching vibration of H-O-H and O-H groups from the weakly bound water molecules were adsorbed on the surface or trapped in the large cavities between the rings of the alkaline activation products [66]. The absorption band at 3654 cm−1 corresponds to muscovite band that is already indicated in FT-IR spectra of the raw TMWM.

4. Conclusions

The aim of this study was to investigate the compressive strength and microstructure (reaction product formed, pore structure) of an alkali-activated binder obtained by blending EAF-Slag and TMWM. The following conclusions can be drawn from this experiment:
  • The increase of EAF-Slag:TMWM volume ratios in the binary mixtures substantially enhanced the compressive strength development and the microstructure properties of the binary alkali-activated binders.
  • The SEM micrographs showed that the morphology of 100TM-AAB sample was different, such as a monolayer of products with no sharp geometric outline (unreacted particles) and small sharp geometric needles dispersed on the surface of the matrix. The blend of 50 vt.% of TMWM with an amount of 50 vt.% EAF-Slag results in the growth of the amorphous content of N-A-S-H gel and the binding gels C-A-S-H which has a positive effect on enhancement in the microstructure properties of the binary binder.
  • The EDS results indicated that the Ca:Si and Ca:(Al + Si) ratios were significant to the mechanical performance of the binary alkali-activated specimens. The Ca:Si ratio changed from 0.33 and 1.6 and the Ca:(Al + Si) changed from 0.26 and 1.19 when the EAF-Slag content in the mixtures increased from 10 to 50 vt.%, which revealed that the increase of the Ca:Si and Ca:(Al + Si) ratios resulted in the increasing strength of the binary alkali-activated specimens.
  • The inclusion of an alternative calcium source to the TMWM system such as EAF-Slag increases the compressive strength when compared 100TM-AAB because the coexistence of three reaction products such as C-A-S-H, N-A-S-H and (N, C)-A-S-H enhanced the microstructure by filling the range of the pores [air voids/cracks]. Moreover, the increase of the EAF-Slag dosage in the mixtures generated more reaction products (alumino-silicate phases).
  • The increase of EAF-Slag content led to a reduction of the total porosity, the average pore diameter and the critical pore diameter which resulted in a refinement of the pore structure and an enhancement of the compressive strength as a result of the binary alkali-activated binders.
  • The FT-IR studies indicate the presence of some phases that remained unreactive from both precursors. However, the alkaline activation of TMWM and EAF-Slag led to the formation of new reaction products (alumino-silicates and carbonates).

Author Contributions

Supervision, J.C.-G.; Writing—original draft, N.S.; Writing—review & editing, J.C.-G. All authors have read and agreed to the published version of the manuscript.

Funding

This work was also partially financed by Portuguese national funds through FCT-Foundation for Science and Technology, IP, within the research unit C–MADE, Centre of Materials and Building Technologies (CIVE–Central Covilhã–4082), University of Beira Interior, Portugal.

Acknowledgments

This research was partially supported by European Commission under Horizon 2020, Marie Skłodowska-Curie Actions, Research and Innovation Staff Exchange (RISE), by REMINE—“Reuse of Mining Waste into Innovative Geopolymeric-based Structural Panels, Precast, Ready Mixes and Insitu Applications”. Project no 645,696 (https://reminemsca.wordpress.com).

Conflicts of Interest

The authors declare no conflict of interest.

References

  1. EUROSLAG; EUROFER; Waste Framework Directive. Position Paper on the Status of Ferrous Slag Complying with the Waste Framework Directive (Articles 5/6) and the REACH Regulation; The European Slag Association: Duisburg, Germany; The European Steel Association: Brussels, Belgium, 2012; Volume 32. [Google Scholar]
  2. Yildirim, I.Z.; Prezzi, M. Chemical, mineralogical, and morphological properties of steel slag. Adv. Civ. Eng. 2011, 2011, 463638. [Google Scholar] [CrossRef] [Green Version]
  3. Humbert, P.S.; Castro-Gomes, J. CO2 activated steel slag-based materials: A review. J. Clean. Prod. 2019, 208, 448–457. [Google Scholar] [CrossRef]
  4. Provis, J.; Van Deventer, J.S.J. Geopolymers—Structure, Processing, Properties and Industrial Applications; Woodhed Publishing Limited and CRC Press LLC: Cambridge, UK, 2009. [Google Scholar]
  5. Khater, M.M. Influence of electric arc furnace slag on characterisation of the produced geopolymer composites. Epa. J. Silic. Based Compos. Mater. 2015, 67, 2015. [Google Scholar] [CrossRef]
  6. Khater, H.M. Impact of electric arc furnace slag on geopolymer composites exposed to sulphate solution. J. Build. Mater. Struct. 2017, 2, 12–26. [Google Scholar]
  7. Sedira, N.; Castro-Gomes, J.; Kastiukas, G.; Zhou, X.; Vargas, A. A review on mineral waste for chemical-activated binders: Mineralogical and chemical characteristics. Min. Sci. 2017, 24, 29–58. [Google Scholar]
  8. Eurostat Waste Statistics Main Statistical Findings-Total Waste Generation. 2016. Statistics Explained. Available online: https://ec.europa.eu/eurostat/statistics-explained/index.php/Waste_statistics#Total_waste_generation (accessed on 3 September 2020).
  9. Castro-Gomes, J.P.; Silva, A.P.; Cano, R.P.; Durán Suarez, J.; Albuquerque, A. Potential for reuse of tungsten mining waste-rock in technical-artistic value added products. J. Clean. Prod. 2012, 25, 34–41. [Google Scholar] [CrossRef]
  10. Kiventerä, J.; Lancellotti, I.; Catauro, M.; Poggetto, F.D.; Leonelli, C.; Illikainen, M. Alkali activation as new option for gold mine tailings inertization. J. Clean. Prod. 2018, 187, 76–84. [Google Scholar] [CrossRef]
  11. Kiventerä, J.; Golek, L.; Yliniemi, J.; Ferreira, V.; Deja, J.; Illikainen, M. Utilization of sulphidic tailings from gold mine as a raw material in geopolymerization. Int. J. Miner. Process. 2016, 149, 104–110. [Google Scholar] [CrossRef]
  12. Li, J.; Hitch, M.; Power, I.M.; Pan, Y. Integrated mineral carbonation of ultramafic mine deposits—A review. Minerals 2018, 8, 147. [Google Scholar] [CrossRef] [Green Version]
  13. Azadi, M.; Edraki, M.; Farhang, F.; Ahn, J. Opportunities for mineral carbonation in Australia’s mining industry. Sustainability 2019, 11, 1250. [Google Scholar] [CrossRef] [Green Version]
  14. Wilson, B.; Pyatt, F.B. Bio-availability of tungsten in the vicinity of an abandoned mine in the English Lake District and some potential health implications. Sci. Total Environ. 2006, 370, 401–408. [Google Scholar] [CrossRef]
  15. Kraus, T.; Schramel, P.; Schaller, K.H.; Zöbelein, P.; Weber, A.; Angerer, J. Exposure assessment in the hard metal manufacturing industry with special regard to tungsten and its compounds. Occup. Environ. Med. 2001, 631–634. [Google Scholar] [CrossRef] [PubMed] [Green Version]
  16. Pacheco-Torgal, F.; Castro-Gomes, J.; Jalali, S. Tungsten mine waste geopolymeric binder: Preliminary hydration products investigations. Constr. Build. Mater. 2009, 23, 200–209. [Google Scholar] [CrossRef] [Green Version]
  17. Bernal, S.A.; Rodriguez, E.D.; Mejia De Gutiérrez, R.; Provis, J.L.; Delvasto, S. Activation of metakaolin/slag blends using alkaline solutions based on chemically modified silica fume and rice husk ash. Waste Biomass Valoriz. 2012, 3, 99–108. [Google Scholar] [CrossRef]
  18. Chang, J.J. A study on the setting characteristics of sodium silicate-activated slag pastes. Cem. Concr. Res. 2003, 33, 1005–1011. [Google Scholar] [CrossRef]
  19. Sedira, N.; Castro-gomes, J. Effects of EAF-S on alkali-activation of tungsten mining waste: Mechanical properties. In MATEC Web of Conferences; Castro-Gomes, J., Zhou, X., Durán-Suárez, J., Sangiorgi, C., Górski, M., Yang, S., Eds.; EDP Sciences: Ulysse, France, 2019. [Google Scholar] [CrossRef] [Green Version]
  20. Allahverdi, A.; Kani, E.N.; Yazdanipour, M. Effects of blast furnance slag on natural pozzolan-based geopolymer cement. Ceram. Silik. 2011, 55, 68–78. [Google Scholar]
  21. Longhi, M.A.; Zhang, Z.; Rodríguez, E.D.; Kirchheim, A.P.; Wang, H. Efflorescence of alkali-activated cements (geopolymers) and the impacts on material structures: A critical analysis. Front. Mater. 2019, 6, 89. [Google Scholar] [CrossRef]
  22. García-Lodeiro, I.; Palomo, A. Variation in hybrid cements over time. Alkaline activation of fly ash—Portland cement blends. Cem. Concr. Res. 2013, 52, 112–122. [Google Scholar] [CrossRef]
  23. Fernandez-Jimenez, A.; Flores, E.; Maltseva, O.; Garcia-Lodeiro, I.; Palomo, A. Hybrid Alkaline Cements. Part III. Durability and Industrial Applications. Rev. Rom. Mater. J. Mater. 2013, 43, 195–200. [Google Scholar]
  24. Reig, L.; Soriano, L.; Borrachero, M.V.; Monzó, J.; Payá, J. Influence of calcium aluminate cement (CAC) on alkaline activation of red clay brick waste (RCBW). Cem. Concr. Compos. 2016, 65, 177–185. [Google Scholar] [CrossRef]
  25. Criado, M.; Aperador, W.; Sobrados, I. Microstructural and mechanical properties of alkali activated Colombian raw materials. Materials 2016, 9, 158. [Google Scholar] [CrossRef] [PubMed] [Green Version]
  26. Pardal, X.; Pochard, I.; Nonat, A. Experimental study of Si-Al substitution in calcium-silicate-hydrate (C-S-H) prepared under equilibrium conditions. Cem. Concr. Res. 2009, 39, 637–643. [Google Scholar] [CrossRef]
  27. Feldman, R.F. Pore Structure Damage in Blended Cements Caused by Mercury Intrusion. J. Am. Ceram. Soc. 1984, 67, 30–33. [Google Scholar] [CrossRef] [Green Version]
  28. Wild, S. A discussion of the paper “mercury porosimetry—An inappropriate method for the measurement of pore size distributions in cement-based materials” by S. Diamond. Cem. Concr. Res. 2001, 31, 1653–1654. [Google Scholar] [CrossRef]
  29. Panesar, D.K.; Francis, J. Influence of limestone and slag on the pore structure of cement paste based on mercury intrusion porosimetry and water vapour sorption measurements. Constr. Build. Mater. 2014, 52, 52–58. [Google Scholar] [CrossRef]
  30. Everett, D.H. IUPAC Manual of symbols and terminology, appendix 2, part 1, Colloid and Surface Chemistry. Pure Appl. Chem. 1972, 31. [Google Scholar] [CrossRef]
  31. Moon, H.Y.; Kim, H.S.; Choi, D.S. Relationship between average pore diameter and chloride diffusivity in various concretes. Constr. Build. Mater. 2006, 20, 725–732. [Google Scholar] [CrossRef]
  32. Cook, R.A.; Hover, K.C. Mercury porosimetry of hardened cement pastes. Cem. Concr. Res. 1999, 29, 933–943. [Google Scholar] [CrossRef]
  33. Ma, H. Mercury intrusion porosimetry in concrete technology: Tips in measurement, pore structure parameter acquisition and application. J. Porous Mater. 2014, 21, 207–215. [Google Scholar] [CrossRef]
  34. Kalliopi, K. Aligizaki Pore structure of Cement-Based Materials: Testing, Interpretation and Requirements; Taylor & Francis Group: London, UK, 2006; ISBN 0419228004. [Google Scholar]
  35. Zeng, Q.; Li, K.; Fen-Chong, T.; Dangla, P. Pore structure characterization of cement pastes blended with high-volume fly-ash. Cem. Concr. Res. 2012, 42, 194–204. [Google Scholar] [CrossRef]
  36. Halamickova, P.; Detwilera, R.J.; Bentz, D.P.; Garboczi, E.J. Water permeability and chloride ion diffusion in Portland cement mortars: Relationship to sand content and critical pore diameter. Cem. Concr. Res. 1995, 25, 790–802. [Google Scholar] [CrossRef]
  37. Garboczi, E.J. Permeability, diffusivity, and microstructural parameters: A critical review. Cem. Concr. Res. 1990, 20, 591–601. [Google Scholar] [CrossRef]
  38. Criado, M.; Fernández-Jiménez, A.; Palomo, A. Alkali activation of fly ash: Effect of the SiO2/Na2O ratio. Part I: FTIR study. Microporous Mesoporous Mater. 2007, 106, 180–191. [Google Scholar] [CrossRef]
  39. Garcia-Lodeiro, I.; Fernandez-Jimenez, A.; Palomo, A. Hydration kinetics in hybrid binders: Early reaction stages. Cem. Concr. Compos. 2013, 39, 82–92. [Google Scholar] [CrossRef]
  40. Lodeiro, I.G.; Macphee, D.E.; Palomo, A.; Fernández-jiménez, A. Effect of alkalis on fresh C-S-H gels. FTIR analysis. Cem. Concr. Res. 2009, 39, 147–153. [Google Scholar] [CrossRef]
  41. Komnitsas, K.; Zaharaki, D.; Perdikatsis, V. Effect of synthesis parameters on the compressive strength of low-calcium ferronickel slag inorganic polymers. J. Hazard. Mater. 2009, 161, 760–768. [Google Scholar] [CrossRef]
  42. Lee, W.K.W.; Van Deventer, J.S.J. Structural reorganisation of class F fly ash in alkaline silicate solutions. Colloids Surf. A Physicochem. Eng. Asp. 2002, 211, 49–66. [Google Scholar] [CrossRef]
  43. Mejia, J.M.; Rodríguez, E.; de Gutiérrez, R.M.; Gallego, N. Preparation and characterization of a hybrid alkaline binder based on a fly ash with no commercial value. J. Clean. Prod. 2015, 104, 346–352. [Google Scholar] [CrossRef]
  44. Onisei, S.; Pontikes, Y.; Van Gerven, T.; Angelopoulos, G.N.; Velea, T.; Predica, V.; Moldovan, P. Synthesis of inorganic polymers using fly ash and primary lead slag. J. Hazard. Mater. 2012, 205–206, 101–110. [Google Scholar] [CrossRef]
  45. Zawrah, M.F.; Khattab, R.M.; Saad, E.M.; Gado, R.A. Effect of surfactant types and their concentration on the structural characteristics of nanoclay. Spectrochim. Acta Part A Mol. Biomol. Spectrosc. 2014, 122, 616–623. [Google Scholar] [CrossRef]
  46. Šontevska, V.; Jovanovski, G.; Makreski, P.; Raškovska, A.; Šoptrajanov, B. Minerals from Macedonia. XXI. Vibrational spectroscopy as identificational tool for some phyllosilicate minerals. Acta Chim. Slov. 2008, 55, 757–766. [Google Scholar]
  47. Vaculíková, L.; Plevová, E. Identification of clay minerals and micas in sedimentary rocks. Acta Geodyn. Geomater. 2005, 2, 167–175. [Google Scholar]
  48. Socrates, G. Infrared and Raman Characteristic Group Frequencies, 7th ed.; John Wiley & Sons, Ltd.: Chichester, UK, 2005. [Google Scholar]
  49. Chukanov, N.V.; Chervonnyi, A.D. Infrared Spectroscopy of Minerals and Related Compounds; Springer International Publishing: Cham, Switzerland, 2016; ISBN 3319253492. [Google Scholar]
  50. Medeghini, L.; Mignardi, S.; De Vito, C.; Conte, A.M. Evaluation of a FTIR data pretreatment method for Principal Component Analysis applied to archaeological ceramics. Microchem. J. 2016, 125, 224–229. [Google Scholar] [CrossRef]
  51. Panias, D.; Giannopoulou, I.P.; Perraki, T. Effect of synthesis parameters on the mechanical properties of fly ash-based geopolymers. Colloids Surf. A Physicochem. Eng. Asp. 2007, 301, 246–254. [Google Scholar] [CrossRef]
  52. Ye, N.; Yang, J.; Ke, X.; Zhu, J.; Li, Y.; Xiang, C.; Wang, H.; Li, L.; Xiao, B. Synthesis and characterization of geopolymer from bayer red mud with thermal pretreatment. J. Am. Ceram. Soc. 2014, 97, 1652–1660. [Google Scholar] [CrossRef]
  53. Huang, C.K.; Kerr, P.F. Infrared Study of the Carbonate Minerals. Am. Mineral. 1960, 45, 313–324. [Google Scholar]
  54. García Lodeiro, I.; Fernández-Jimenez, A.; Palomo, A.; Macphee, D.E. Effect on fresh C-S-H gels of the simultaneous addition of alkali and aluminium. Cem. Concr. Res. 2010, 40, 27–32. [Google Scholar] [CrossRef]
  55. Garcia-Lodeiro, I.; Palomo, A.; Fernández-Jiménez, A.; MacPhee, D.E. Compatibility studies between N-A-S-H and C-A-S-H gels. Study in the ternary diagram Na2O-CaO-Al2O3-SiO2-H2O. Cem. Concr. Res. 2011, 41, 923–931. [Google Scholar] [CrossRef]
  56. Vempati, R.K.; Rao, A.; Hess, T.R.; Cocke, D.L.; Lauer, H.V. Fractionation and characterization of Texas lignite class “F” fly ash by XRD, TGA, FTIR, and SFM. Cem. Concr. Res. 1994, 24, 1153–1164. [Google Scholar] [CrossRef]
  57. Temuujin, J.; Okada, K.; MacKenzie, K.J.D. Effect of mechanochemical treatment on the crystallization behaviour of diphasic mullite gel. Ceram. Int. 1999, 25, 85–90. [Google Scholar] [CrossRef]
  58. Yousuf, M.; Mollah, A.; Hess, T.R.; Tsai, Y.N.; Cocke, D.L. An FTIR and XPS investigations of the effects of carbonation on the solidification/stabilization of cement based systems-Portland type V with zinc. Cem. Concr. Res. 1993, 23, 773–784. [Google Scholar] [CrossRef]
  59. Bernal, S.A.; Provis, J.L.; Rose, V.; Mejía De Gutierrez, R. Evolution of binder structure in sodium silicate-activated slag-metakaolin blends. Cem. Concr. Compos. 2011, 33, 46–54. [Google Scholar] [CrossRef]
  60. Barbosa, V.F.F.; Mackenzie, K.J.D.; Thaumaturgo, C. Synthesis and characterisation of materials based on inorganic polymers of alumina and silica: Sodium polysialate polymers. Int. J. Inorg. Mater. 2000, 2, 309–317. [Google Scholar] [CrossRef]
  61. Komnitsas, K.; Zaharaki, D. Geopolymerisation: A review and prospects for the minerals industry. Miner. Eng. 2007, 20, 1261–1277. [Google Scholar] [CrossRef]
  62. Zaharaki, D.; Galetakis, M.; Komnitsas, K. Valorization of construction and demolition (C&D) and industrial wastes through alkali activation. Constr. Build. Mater. 2016, 121, 686–693. [Google Scholar]
  63. Yu, P.; Kirkpatrick, R.J.; Poe, B.; McMillan, P.F.; Cong, X. Structure of Calcium Silicate Hydrate (C-S-H): Near-, Mid-, and Far-Infrared Spectroscopy. J. Am. Ceram. Soc. 1999, 48, 742–748. [Google Scholar] [CrossRef]
  64. Bakharev, T. Resistance of geopolymer materials to acid attack. Cem. Concr. Res. 2005, 35, 658–670. [Google Scholar] [CrossRef]
  65. Puertas, F.; Torres-Carrasco, M. Use of glass waste as an activator in the preparation of alkali-activated slag. Mechanical strength and paste characterisation. Cem. Concr. Res. 2014, 57, 95–104. [Google Scholar] [CrossRef]
  66. Palomo, A.; Blanco-Varela, M.T.; Granizo, M.L.; Puertas, F.; Vazquez, T.; Grutzeck, M.W. Chemical stability of cementitious materials based on metakaolin—Isothermal conduction calorimetry study. Cem. Concr. Res. 1999, 29, 997–1004. [Google Scholar] [CrossRef]
Figure 1. Particle size distribution of TMWM and EAF-Slag.
Civileng 01 00010 g001
Figure 2. XRD patterns of TMWM and EAF-Slag phases identified are quartz (Q), muscovite (M), clinochlore (C), magnesite (Mg), calcite (Cal), siderite (Sid), gehlenite (Ge), wustite (Wu), and calcium silicate (CS).
Civileng 01 00010 g002
Figure 3. Development in the compressive strength of AABs mixtures containing 100TM-AAB and 100FS-AAB, and the binary-AABs mixtures containing 10, 20, 30, 40, and 50 vt.% of EAF-Slag, according to curing time.
Civileng 01 00010 g003
Figure 4. Compressive strength development of all samples after 28 days according to the initial Ca:Si ratio in the mixtures (Precursors + Activator solution).
Civileng 01 00010 g004
Figure 5. X-ray diffraction data for unreacted (TMWM, EAF-Slag) and the alkali-activated binder (100TM and 100FS) and the binary-alkali-activated binder (50FS50TM).
Civileng 01 00010 g005
Figure 6. SEM images and EDS analysis of the selected specimens produced from TMWM and EAF-Slag waste (specimen codes are presented in Table 4).
Civileng 01 00010 g006aCivileng 01 00010 g006bCivileng 01 00010 g006c
Figure 7. Percentage of element (Si, Al, Ca, Na and K) content in different samples examined by EDS.
Civileng 01 00010 g007
Figure 8. Evolution of Ca:Si (a) and Al:Si (b) ratios of the 100TM-AAB, Binary-AABs, and 100FS-AAB. The ratios values are calculated from the SEM-EDS analysis with the atomic mass ratio of all the binders.
Civileng 01 00010 g008
Figure 9. Evolution of Ca:(Al + Si) ratio in the 100TM-AAB, Binary-AABs, and 100FS-AAB. The ratio values are calculated from the SEM-EDS analysis for all AABs.
Civileng 01 00010 g009
Figure 10. Effect of the changing in total porosity on the compressive strength development of the AAB-samples.
Civileng 01 00010 g010
Figure 11. The relation between the EAF-Slag content and the variation of total porosity and compressive strength of the AABs samples.
Civileng 01 00010 g011
Figure 12. Overlay of cumulative intrusion curves of the alkali-activated binders (100TM and 100FS) and the binary-AABs specimens.
Civileng 01 00010 g012
Figure 13. Overlay of differential pore-size distribution curves of the alkali-activated binders (100TM and 100FS) and the binary-AABs specimens.
Civileng 01 00010 g013
Figure 14. Critical pore diameter changes with the increasing of the dosage of EAF-Slag content in the binary-alkali-activated mixtures as determined by MIP.
Civileng 01 00010 g014
Figure 15. The FT-IR absorbance spectra of the TMWM and EAF-Slag raw materials, the alkali-activated binders, and the binary-alkali-activated binder.
Civileng 01 00010 g015
Table 1. Oxide compositions (% mass) of raw materials.
Raw MaterialsOxide Composition (% Mass)
Al2O3SiO2TiO2SO3K2OCaOFe2O3MgONa2OMnOCrZnO
TMWM17.0546.670.67.94.90.6915.474.830.85--1.04
EAF-Slag10.08150.820.19-33.2930.484.540.133.232.08-
Table 2. The basic physical properties of the precursors.
Precursor PowdersDensity (g/cm3)Specific Surface Area (cm2/g)Median Particle Size (µm)Appearance
TMWM3.0319889177.37Grey
EAF-Slag3.7030136019.67Black
Table 3. Alkali-activated (100TM and 100 FS) and the binary alkali-activated mixtures compositions.
Samples IDMixes Proportions (vt.%)Ratios (Atomic Mass)
Al:SiCa:SiNa:SiK:SiL:S Ratio
100TM100%TMWM0.4570.0180.1280.0443.00
10FS90TM90%TMWM + 10%EAFS0.4370.1250.1270.0453.00
20FS80TM80%TMWM + 20%EAFS0.4160.2350.1250.0463.00
30FS70TM70%TMWM + 30%EAFS0.3950.3490.1230.0483.00
40FS60TM60%TMWM + 40%EAFS0.3720.4650.1210.0493.00
50FS50TM50%TMWM50%EAFS0.3490.5860.1180.0503.00
100FS100%EAFS0.2231.2500.1070.0583.00
Table 4. The average content of the main elements (at wt.%) and their ratios in the different matrix of the alkali-activated binders.
Samples IDElementsAtomic Ratios
SiAlCaNaKAl:SiCa:SiAl:Ca
100TM51.7414.0613.6716.44.130.270.261.03
10FS90TM50.0813.9716.5613.016.380.280.330.84
20FS80TM46.5813.0821.5912.626.130.280.460.61
30FS70TM43.4215.724.7310.75.450.360.570.63
40FS60TM37.514.2231.2612.714.310.380.830.45
50FS50TM29.9610.2647.7911.70.290.341.60.21
100FS26.851049.65130.50.371.850.2
Table 5. Mercury intrusion porosimetry (MIP) parameters of TM-FS-AABs in 28 days.
Samples ID100TM10FS90TM20FS80TM30FS70TM40FS60TM50FS50TM100FS
Porosity (%)47.6936.5128.3727.0926.3724.3819.43
Average pore diameter 4V/A (nm)1461181081121148671
Critical pore diameter (µm)21.899.047.246.036.585.71.32
Pore classification based on IUPAC (%)Mesopores (5–50 nm)3.675.558.379.399.229.5711.94
Macropores (50 nm–10 µm)30.8961.787280.0384.9383.6484.74
Air Voids/Cracks (>10 µm)65.4432.6719.6310.585.856.893.32

