1. Introduction
Infrastructure is crucial to the functioning of society, providing fundamental services such as health care, living, education, and transport of people and goods.
To accomplish this critical goal, infrastructure is designed, operated, and maintained to deliver the required service under a defined set of contextual conditions [
1], e.g., profile of use and environmental conditions. These conditions are often treated as static from infrastructure managers, under the assumption that the fluctuations can be approximated to the average, i.e., considering that maintenance programs can be developed to counteract the deterioration resulting from an average—or prudentially slightly over-dimensioned—profile of use.
Despite this stability of condition being desirable, it is unfortunately not realistic in many cases [
2]. This is particularly true for some assets, such as hospitals, that can be subject to significant variations, if not even shock, in the operational conditions, e.g., the need to treat an unusually high number of patients during a widespread severe virus outbreak [
3].
These stress situations can easily trigger an anomalous (i.e., faster or different) deterioration of objects and components that, under a standard regime of maintenance, can result in a substantial increase in their probability of failure [
4].
Given the consequences that the failure of objects and components can have on the society if, due to them, one or multiple services provided by the hospital is restricted or interrupted, the risk related to their functioning under variable conditions is not negligible.
A proactive maintenance based on smart monitoring, able to detect critical states of objects and components, can reduce this risk substantially. Even though this is undisputable in principle, a methodology does not exist yet to rigorously quantify the risk on assets in real time, due to historical difficulties in developing adequate data-driven models to constantly interpret the stream of data made available by sensing technologies.
Data-driven models have though been developing substantially in the last decade, permeating the vast majority of industrial sectors, including the construction sectors [
5].
In light of the abundance of solid and consolidated methods for risk assessments of construction and infrastructure, the new development on data gathering technologies (e.g., sensing and responding systems, IoT), and new data storage (big data) and data-driven decision making (e.g., artificial intelligence, machine learning algorithms)—full details on the state of the art of research in these areas are presented in the background section—the time seems now ripe to overcome the traditional limitation of static risk management tools by developing a dynamic risk management methodology for infrastructure based on real-time monitoring and dynamic interventions.
In this paper a methodology is presented to rigorously estimate the risk reduction, i.e., the benefit, on the service of implementing smart monitoring of objects of components. This is done using: (i) impact hierarchies to orthogonally estimate the impacts on the society, (ii) neural network to detect the critical state of components, (iii) sensing technologies, such as sensors and actuators, to start collecting relevant variables to be processed and analyzed through machine learning and (iii) fault trees to estimate the effect on the service. The use of this methodology is trust to enhance the transition from a static risk identification strategy to a more dynamic risk identification strategy leveraged by the enabling technologies—which include advanced manufacturing solutions, additive manufacturing, augmented reality, Internet of Things (IoT), cloud, cyber-security, and data-driven models—as proposed by
Piano Nazionale Industria 4.0 from the Italian Ministry of Economic Development [
6].
The remainder of the paper is structured as follows: in
Section 2 a literature review is reported to present the state of the art on dynamic risk assessment of construction and infrastructure.
Section 3 contains the general methodology description, and
Section 4 the application of the methodology is presented on an air handling unit. In
Section 5 a discussion on the use of the methodology is provided and in
Section 6 some conclusions are drawn and an outlook proposed.
2. Background
The risk management of an asset embeds both the phase of risk assessment, i.e., the process which allows estimatation of the probability, and consequences of events affecting their service, such as failures, and risk mitigation, i.e., the procedure which enables optimization of the balance between the resources invested in interventions and the risk that these help in reducing.
Currently, risk management of assets in complex buildings shows an average degree of proactiveness in managing failures and disruptive events based on the observations of occurred down states and off-duty; however, this approach results in acceptance of the faults in the assets (such as equipment and civil works). This reflects a gap of applications of proactive approaches, within the risk management of assets in complex buildings, which on the contrary are intended to develop learning about failure patterns of assets before they occur, avoiding therefore interruption of the service provided.
However, the traditional risk management approaches, supported by data-driven models, which empower and enable the learning of failure patterns in assets, can help to fill this gap of proactiveness.
The use of data-driven models to enable more effective risk management has been growing considerably in recent years. Some prominent examples are described in the following paragraphs.
Chen et al. [
7] highlight how the use of vibration data—achieved from different sources such as camera- based measurements, vibrometer and accelerometer—can be used to monitor the displacements of the physical assets. In their application, the displacements of a cantilever beam and a pipe are analyzed to detect operational deflection shapes.
The automation process for enabling real time inspections in concrete structures have been shown by [
8]. In particular, crack detection is performed by using a deep architecture of convolutional neural networks (CNNs), which does not use the defect features, but it is trained with images subjected to various conditions such as strong light spot, shadows, and very thin cracks. Their model allows 98% of accuracy to be reached in the crack detection through 40 K images of 256 × 256 pixel resolutions. Cha et al. [
9] continue to analyze the benefit reached by using a Faster Region-based Convolutional Neural Network (Faster R-CNN) model for performing real time structural visual inspection of concrete and steel cracks. Their model adopts five types of labelling for training the Faster R-CNN and achieves a high average (87.8%) of accuracy in crack recognition.
Mohandas et al. [
10] propose an approach which integrates the facility management of the smart city with the big data analysis coming from lighting sensors, motion sensors, passive infrared sensors to predict the risk which can arise from high energy consumption and failure in the use of street lighting. Their approach takes advantage of an artificial neural network (ANN), for identifying more complex patterns and trend which are not directly recognizable from human analysis, and the support of a fuzzy logic controller for simulating five scenarios of decision making. The connection between ANN and the fuzzy logic control allows the unwanted utilization to be reduced by 34% with a reduced power consumption rate of 13.5%.
ANN can be used directly to assess the status of a system, if appropriated big data are collected and analyzed. Actually, Karami-Mohammadi et al. [
11] present a vibration-based approach for damage detection of a cylindrical equipment, using an ANN. The extracted frequencies from a vibration sensor are first analyzed with a principal component analysis (PCA), for data reduction of significant features, and then used to feed an ANN to detect changes in damage pattern of the cylindrical equipment. Their interesting contribution consists in the deployment of just one accelerometer for performing the construction of the whole damage detection model.
The innovation reached by ANN for risk identification has been deepened by [
12], who suggest their approach is based on the recurrent neural network (RNN) model. The main benefit in using RNN consists in the possibility to classify sequential time-series data, such as big data, with recurrent lateral connections and the learning of representative features from big data through the network, which makes it more suitable for complex activity recognition. Their approach has been tested on construction equipment (such as excavator and a loader), whose performance is monitored by three accelerometers and a gyroscope. The useful dataset, for performing the first analysis with RNN, is reached with two hours for each piece of equipment, with a frequency of 80 Hz, and approximately 576,000 data points for each channel of the sensor. In addition to big data collection from accelerometers and gyroscope, the two pieces of equipment were recorded, by a camera sensor, for their whole duration of the operative phase, in order to support the labelling of the dataset. The labelling step, in supervised learning machine learning, is functional to classify the time-series with information regarding the status of the equipment, in order to facilitate the learning of the neural network. Their RNN model allows the classification in advance of the different failure and operative status of the equipment.
In the construction sector, when equipment works in an environment characterized by multiple parameters, it could be useful to create a robust learning approach, such as a deep neural network (DNN), which is able to capture the multivariate logic of both equipment and boundary condition (environment) in the same time.
Li et al. [
13] through an approach based on DNN with multiple hidden layers, are able to train their predictive model with multiple nonlinear parameters, which supports the learning of the main variations and the discriminative information from big data of a rotating machinery. Big data, in their application, have been collected from three accelerometers, whereas the learning of the DNN, in the training phase, is performed with the initial injection of three failures, to be predicted in the real operation of the machinery. For each type of failure, the vibration frequency is quantified through the use of accelerometers, at different failure degradation and rotating speed, by taking advantage of proximity sensors and tachometer for control. The test phase of DNN allows in advance the failure and the degradation mechanism of the equipment to be detected.
The prediction of the failure of the complex equipment through neural network-based approach, was carried out with a DNN also by [
14]. They took advantage of vibration big data, collected from the bearings of the equipment, to further extract three different domain features for training the network in failure prediction.
Scalabrini et al. [
15] implement an ANN-based approach to predict the failure time of a motor associated with vibration parameters, such as: vibration amplitude and vibration signal growth rate. Their main contribution is related to the creation of a prediction model which is further implemented with a formula that considers the linear growth of the signal, after the processing phase of the ANN.
Failure detection analysis, achieved with the real-time analysis of electrical signals, has been carried out by [
16] with the use of convolutional neural network (CNN). His approach was tested on the performance of a fan, in order to scale the CNN model to major systems of asset management which can be monitored with the use of images or by transforming 1-dimensional dataset (such as that composed by structured data—time series) to a 2-dimensional dataset, with the features of an image, which can feed the CNN model.
Kiangala and Wang [
17] proposed a proactive maintenance approach based on the CNN model, which use the data coming from a conveyor motor, for reducing the risk due to the loss of production of a manufacturing plant. Their model allows the classification in advance if the observed abnormalities are production-threatening or not. The useful big data for their model consists of a combination of 12 time-series parameters (Vibration speed, Motor torque, Acceleration, Motor Speed, Air pressure, Product Weight, Deceleration, Current, Belt tension, Motor tension, Temperature), which are further pre- processed with a PCA for reducing the number of dimensions to a maximum of two channels and transforming the value of the entire dataset in images. This allows shorter computational time in CNN classification of three states of the conveyor motor: no-fault, minor fault, and critical fault with urgent need of maintenance.
The risks arising from poor maintenance and human error in plant have been addressed by [
18], who implemented three methods for learning defective images using CNN and found that blob detection processing improves learning accuracy. Their method was tested on the prediction of the pitting corrosion mechanism of a metal component.
Failure prediction through a 5-layer CNN approach was performed by [
19] who trained the model with signals (such as current, energy consumption, power factor, outdoor humidity, outdoor temperature, reactive, apparent and active power, and impedance) coming from different fans with one hour of data acquisition. Even in this application, the structured big data, represented by the numerical values, were pre-processed, transformed in an image-like representation (unstructured big data), and then fed to a tuned classifier.
Bagave et al. [
20] propose their approach based on CNN to assess a rotating motor status in two operative conditions, providing a classification of its future performance. They observed that CNN models are suitable to classify the speeds of motors with regards to certain critical thresholds.
The use of a CNN model in a risk identification approach was applied by [
21] to pursue a remaining useful life analysis for a high-velocity oxyfuel machine. The breakdown of the equipment represents the output of the CNN models, while the maintenance log information and the five years of collected data come from the equipment.
The remaining useful life of two components was assessed on two publicly available run-to-failure datasets of a turbofan engine and a milling, by [
22] using a DNN, consisting of two steps. In the first step, the time to failure data are elaborated by an RNN, in the form of an Autoencoder Neural Network, to convert them into low-dimensional embeddings, useful for health index construction. In the second step, the health index curves are built and compared with those related to the degradation patterns, from which the remaining useful life can be deducted.
A prediction model on compressor status achieved with a particular sub-model of RNN was proposed by [
23]. They created a risk identification approach which uses a Long Short-Term Memory (LSTM) architecture for predicting compressor failures using aggregated sensory data and historical information, in one year of operation. Their aim was to adopt their approach in a new proactive maintenance strategy, so that component replacement can be scheduled before the failure happens. The advantage of using an LSTM model consists in its possibility to predict different classes among good operative conditions and many fault states.
Moreover, the risk identification in improving the safety of gas turbine operation was studied by [
24], who adopted an RNN and a statistical process control chart to predict the condition of the gas turbine exhaust system. The critical gas temperature of the gas chamber was predicted by using fuel flow and air flow as an input of the RNN model. Then, the process control chart was built by comparing the current predicted exhaust gas temperature with that measured by sensors. The chart can be used to control if there is any failure in the gas turbine exhaust system or in the temperature sensors.
A comparison table of the different approaches to pursue the risk identification in advance through data-driven models as a data elaboration technique is provided in
Table 1.
The possibility of a dynamic risk management in the construction sector, which is supported by a data-driven model, can be enabled by the full application of the enabling technologies to the relevant asset to be monitored. In particular, if neural network-based strategies are adopted for dynamic risk identification of the building management, it is possible to predict the undesired event through big data analysis and to plan in advance the suitable actions to not interrupt service deliveries (such as indoor comfort, energy provision, ICT power, reliability of facility).
However, despite the rather vast set of applications of risk management approaches, supported by data-driven models, no research has attempted yet to use CNN for estimating the probability of failures in real time to then connect it to the estimated impact on the service. This is due to a lack of methods in the past to rigorously quantify the consequences of a system failure on the service provided to multiple stakeholders. To overcome this limitation, in the following section a new methodology is proposed to do it, allowing the infrastructure managers to intake the potentialities offered by the rise of enabling technologies from Industry 4.0 and reconfigure the traditional building management towards more controlled and sustainable outcomes.
3. A New Risk Management Methodology for Infrastructure Based on Real-Time Monitoring and Dynamic Adaptation
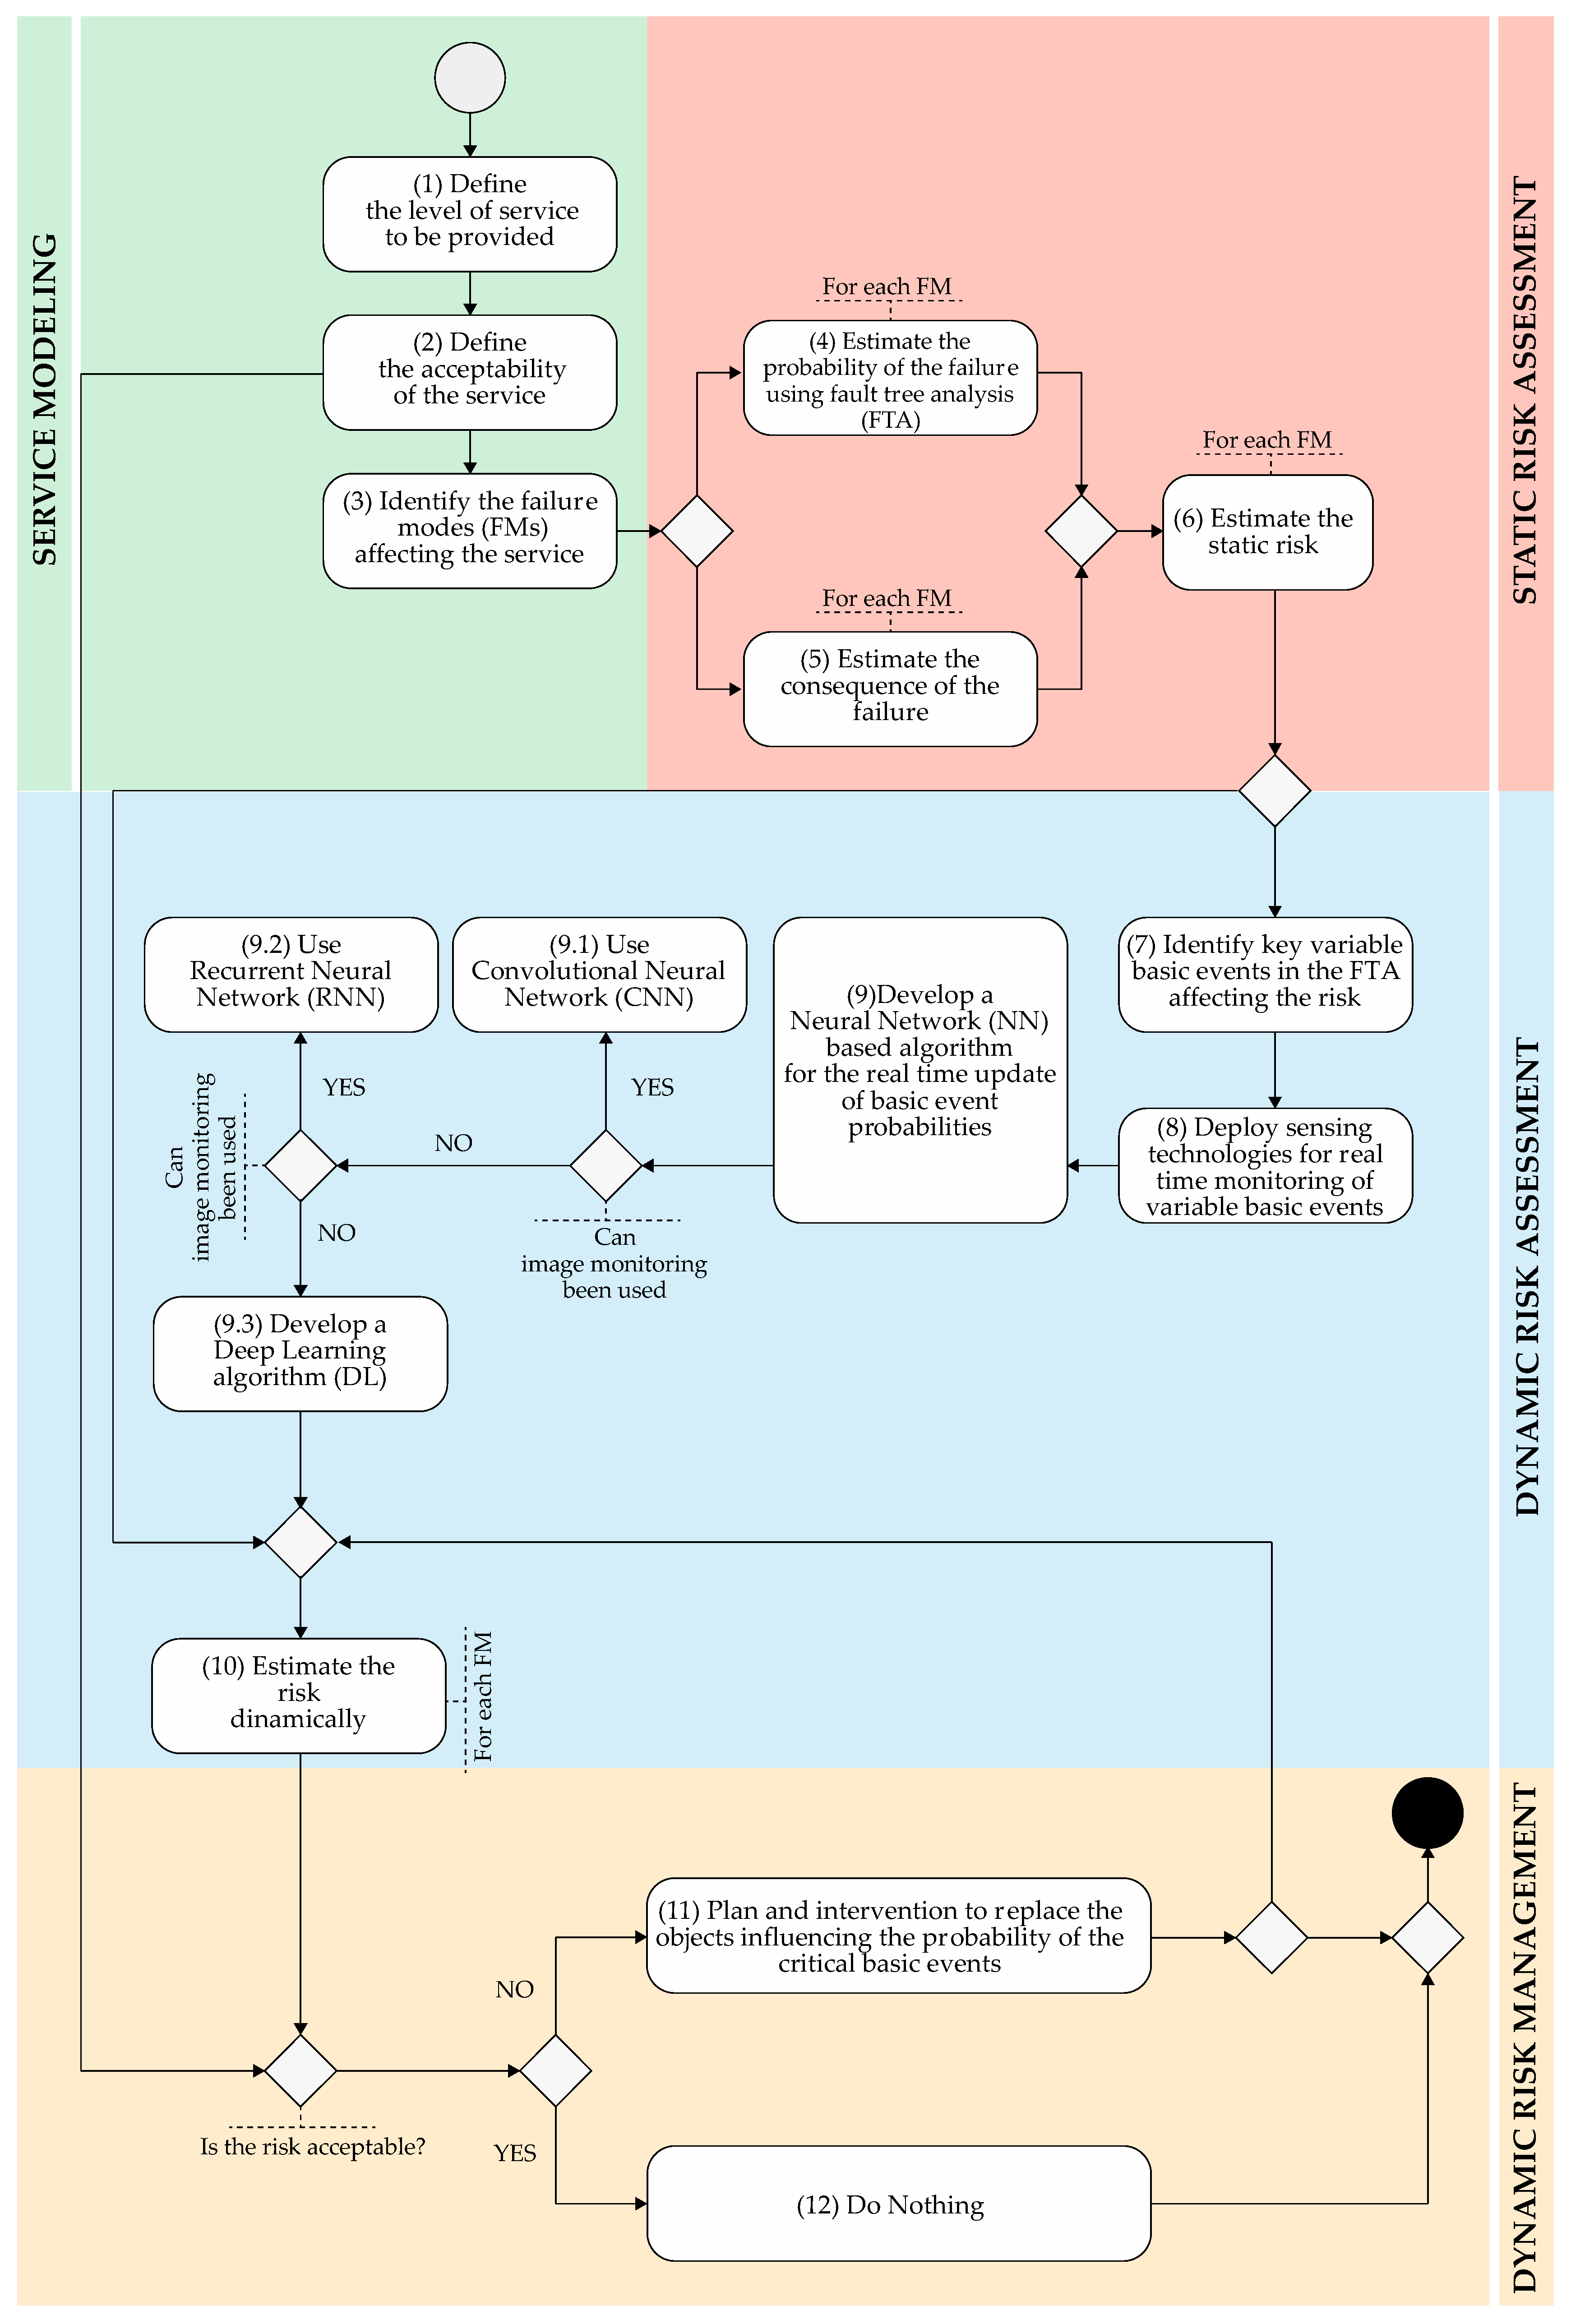
In this section a new methodology is presented to dynamically manage the risk on infrastructure using fault-tree analysis, real-time monitoring, and machine learning algorithms. The outline of the methodology is shown in
Figure 1, using Business Process Model and Notation (BPMN), and then described in details in the following text.
The methodology develops along four phases: first the service is modeled and then the risk on the service is assessed statically using fault-tree analysis. Next, the risk is assessed dynamically. This is done by developing a real-time data analysis algorithm—using machine learning—to constantly update the probability of critical basic events in the fault trees. Finally, a dynamic risk management system is proposed to decide on actions based on the actual risk to the service. The four phases are deployed in 12 steps.
The service is modeled by: (step 1) developing an exhaustive impact hierarchy structure to define and quantify the level of service to be provided, as in [
25,
26]. At this scope, a framework of requirements is to be developed for the stakeholders involved. The framework includes all relevant service requirements of users (the requirements from the categories of the Italian standard UNI 8289–1981, e.g., safety, security, comfort, usability, aesthetics, energy management), owners (e.g., incomes from rents) and managers of residential buildings (e.g., running costs), as well as those of the broad society (e.g., the environmental impacts due to CO
2 emission, energy consumption, and waste production). Then, stakeholders—supported by expert opinion—define the acceptable level of service to be provided (step 2) and identify the failure modes that most affect the service (step 3).
Once the failure modes connected to quantifiable consequences are identified, it is then possible to estimate statically the risk on the service (step 6) by estimating: the probability of occurrence of the failures (step 4) and their consequences (step 5).
The probability of occurrence of the failures is estimated through Fault Tree Analysis (FTA). The construction of a fault tree for a specific failure can be moreover backed by the Failure Mode, Effects, and Criticality Analysis (FMECA) process.
Actually, after putting in system the components which contribute to the asset risk, an FMECA registry can specify the failures associated with those components. This step is relevant as on the selected failure of components constituting the fault tree, depend later the variables to be collected (e.g., if one of the failures of components responsible for risk initiating is the excessive motor bearing vibration, then the frequency would be a suitable parameter to dynamically analyze this single failure).
The fault tree related to that risk can be considered as completed if all the included components appear as basic event of the tree. A basic event represents an event beyond which the analysis does not provide other information for the accuracy level of the risk which is considered.
Having developed the fault tree in a good level of accuracy with basic events, it is possible to detect the so-called minimal cut set, on which to focus the attention and the deployment of sensing technologies. Indeed, if the unique combinations of component failures that can cause system failure are highlighted, then it is easy to focus the data collection and analysis for the dynamic risk assessment only on a few critical components rather than all the components which constitute the fault tree.
The identification of variables involved in the failures (step 7), represented by the minimal cut sets, allows a sensors deployment project to be initiated for the asset to be managed and maintained, considering the risk. For an organization, willing to create value from its asset management, the sensors-deployment project (step 8) involves the decisions on: sensors typologies, communication protocol choices (wireless or wired), storage capacity definition, machine learning choice, and data/information output visualization.
However, differently from physical-based and heuristic machine learning models, the use of big data can support the adoption of all data-driven models useful to deal with the failures and the variables of minimal cut set failure. Hence, each minimal cut set can be monitored by a specific data- driven model which allows the failure involved in the risk mechanism to be predicted. The link between the single failure and data-driven to be adopted is represented by the specific variable to analyze (i.e., if the frequency of the motor bearing has to be monitored and predicted, then a recurrent neural network can be a useful data-driven model to use, thanks to its ability to learn the operative and failure conditions of frequency amplitude in order to provide a time to failure).
The development of a dynamic risk assessment has to take into account how to deal with the different failure sources represented by the minimal cut sets. As the selection of a data-driven model is related to the particular failures, this phase strongly deals with the nature of big data, related to the variables of minimal cut sets. Actually, the nature of big data, beyond their features of 5Vs (velocity, volume, variety, veracity, and value), also considers the sources which generate them. This allows a distinction to be made between structure and unstructured big data. Structure big data refer to all those kinds of big data (time-series data such as pressure, frequency, temperature, etc.) which can be stored in a structure, whereas unstructured big data refer to all those kinds of big data (time-series data such as images, sound recording, e-mail, video, etc.) which cannot be stored in predefined data models but can be deployed in other non-predefined schema such as NoSQL database.
The understanding of the specific nature of data (structured and unstructured), which reflects the variables to be collected, can help in the selection of the suitable data-driven model. Some data-driven model work well with a particular kind of big data, both in terms of supervised data-driven models, with the help of labels and data, and unsupervised data-driven model, only with time-series variables.
In an organization, this risk management phase, enabled by sensors and machine learning, must be assisted by figures such as asset manager or maintenance manager and data scientist teams. As a matter of fact, the management roles specify the need of the monitoring and predictive purpose, whereas the data scientist teams specify the best tool and methods to pursue the outcomes, by considering the current enabling technologies.
To update basic events’ probability in real-time different types of Neural Network (NN) based algorithms can be used depending on the data available (step 9). Typically, the choice of using an Artificial Neural Network (ANN), as data-driven model, perfectly combines with the 5Vs of big data.
Among the ANN, the specification of sub-models, such as (step 10) Recurrent Neural Network (RNN) and (step 11) Convolutional Neural Network (CNN) can respectively support the analysis of structured and unstructured big data towards failure prediction and monitoring.
If RNN or CNN cannot be used to analyze the failure represented by the component minimal cut set, ad hoc techniques of Deep Learning (DL) or unsupervised learning should be created (step 12) by the data scientist team to deal with particular failure mechanisms.
Once the data-driven models have been applied to each minimal cut set, it is possible to continuously asses the risk of on the service dynamically (step 13).
At this stage, the risk on the service can be managed dynamically by deciding on the actions to take, i.e., either conducting or not the actions to replace the objects influencing the probability of the critical basic events (steps 14 and 15).
The continuous and real time monitoring system, reached in the risk management phase thanks to the adoption of enabling technologies, can transform the traditional asset management of the construction and real estate sector into a more integrated and sustainable discipline more asset- oriented (ISO 55000). This new asset-oriented vision can become nowadays smarter through IoT deployment so that economic and environmental benefit may be pursued, in a controlled way.
4. Application of the Risk Management Methodology to the Example of the Infrastructure of an Air Handling Unit
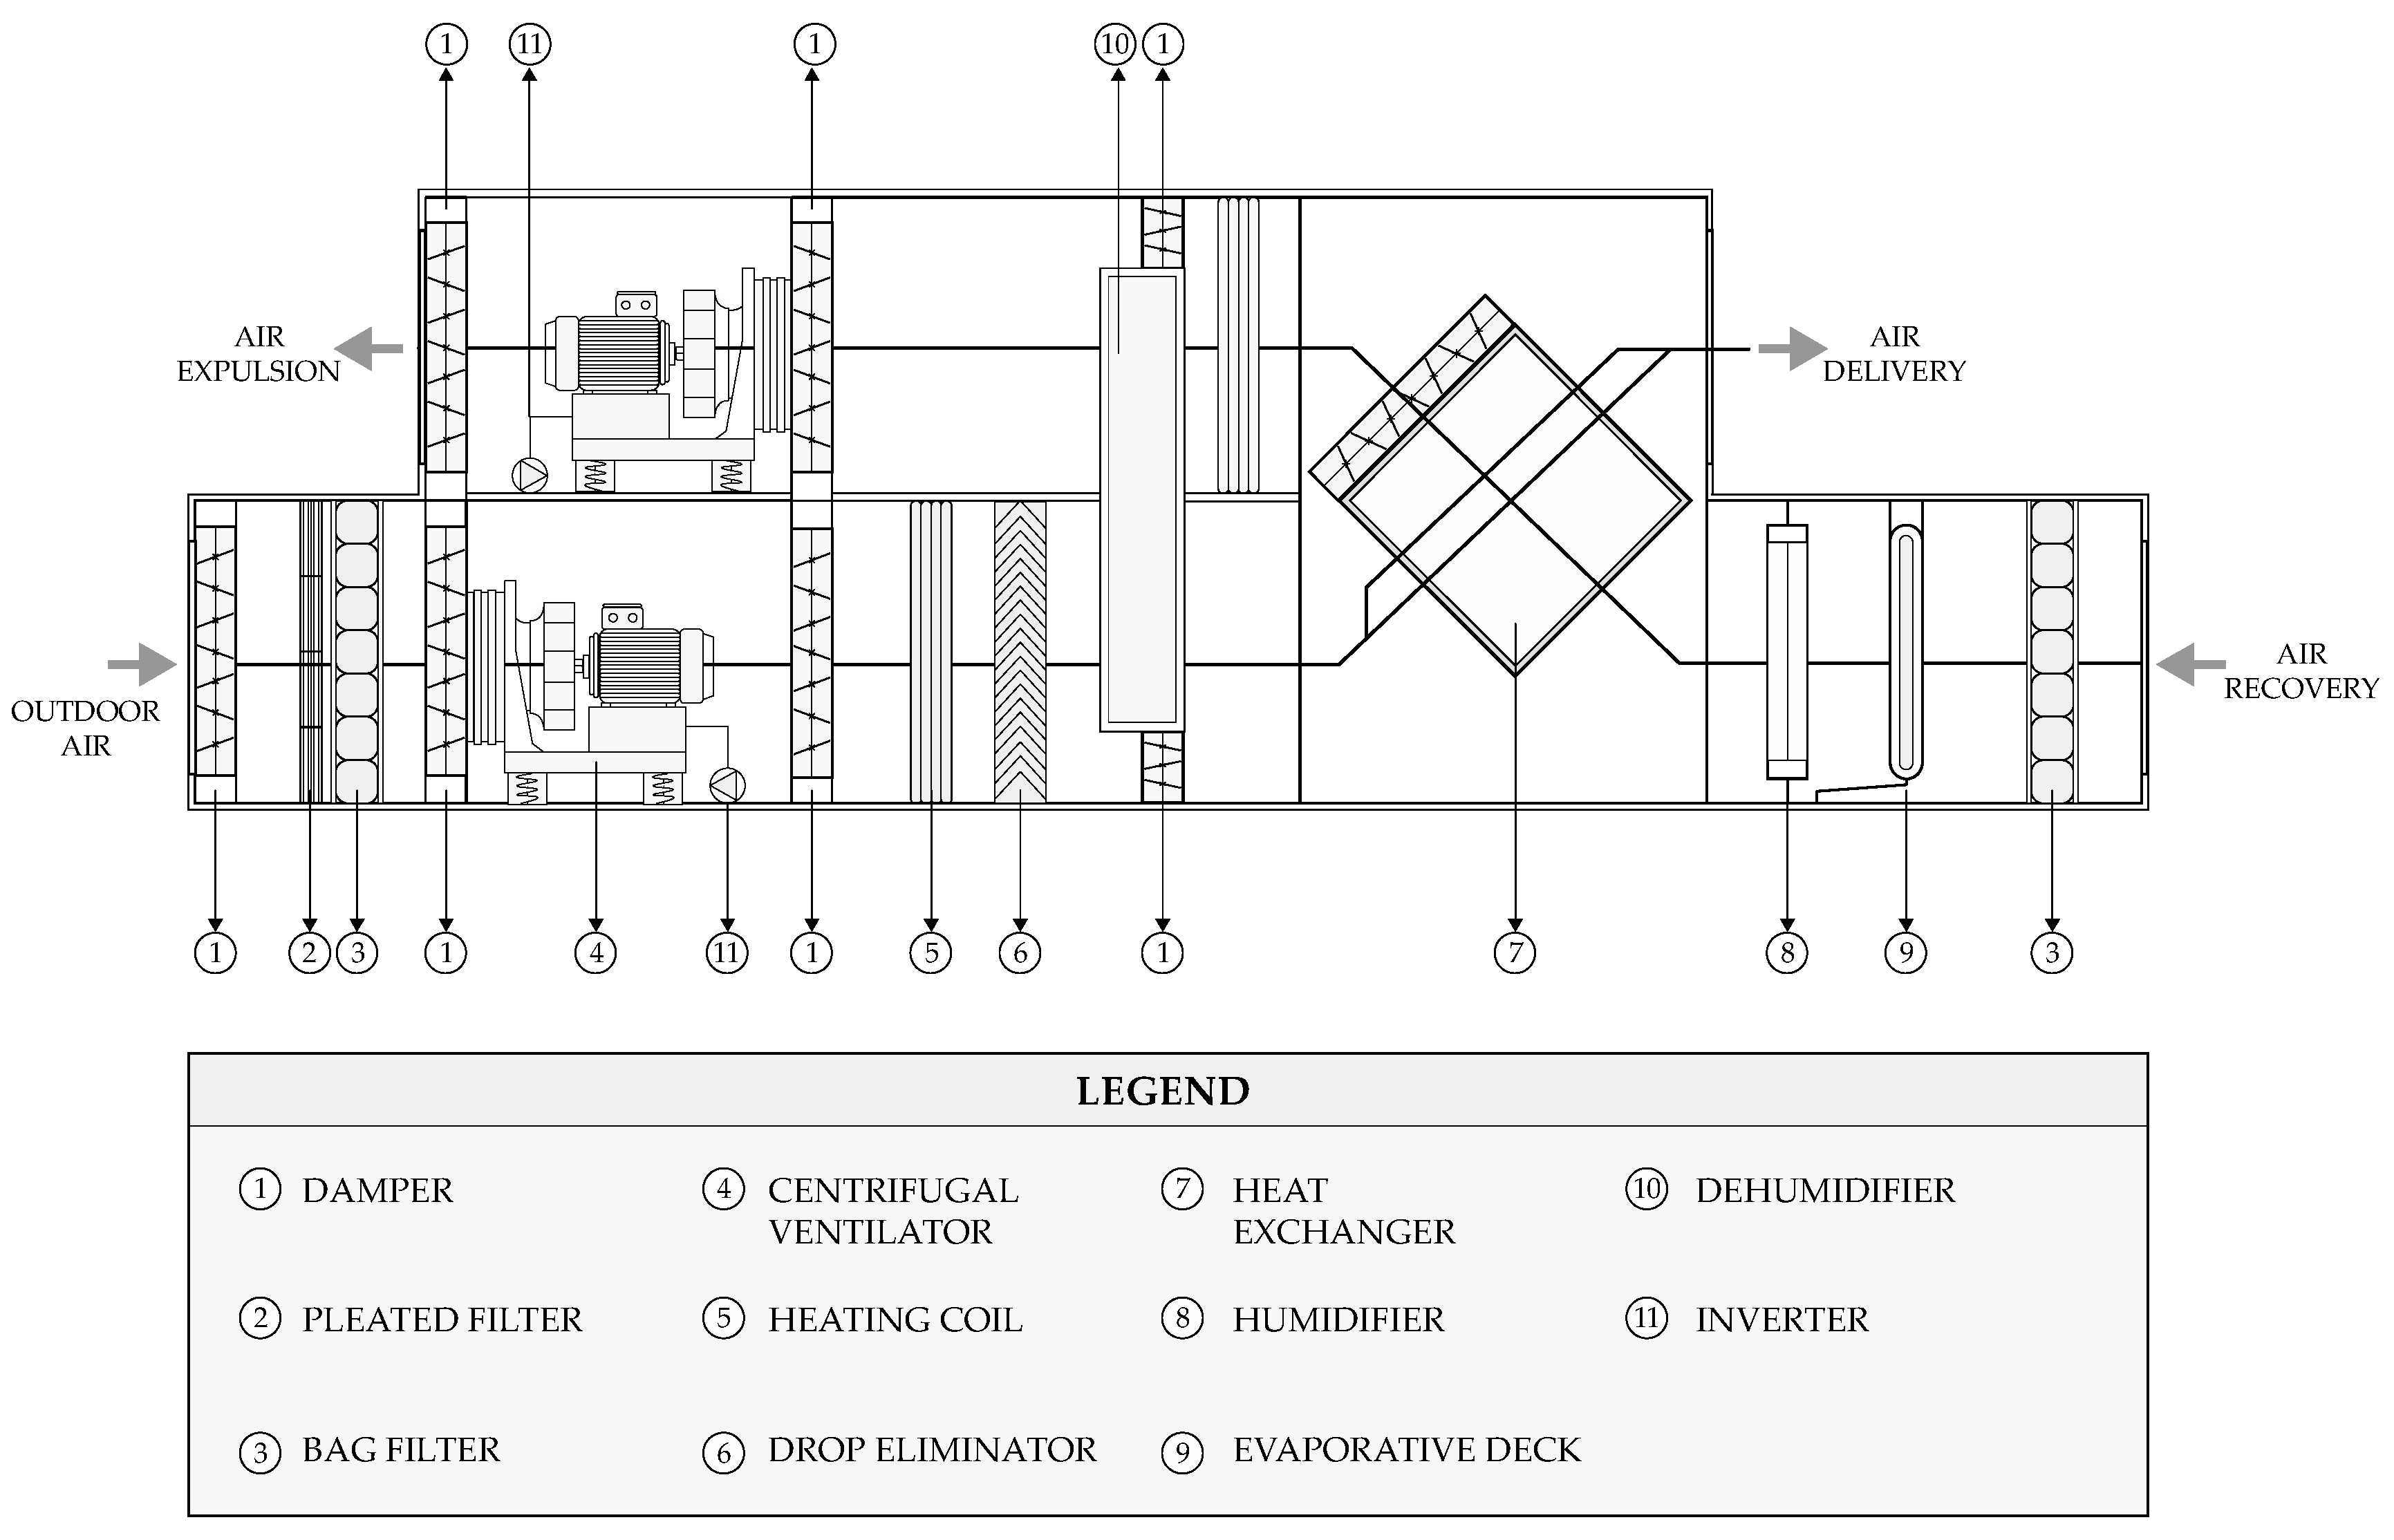
The risk management process presented in the previous section is here applied to the example of the infrastructure of an AHU (Air handling unit) system, as shown in
Figure 2. In order to deal with the risk to be dynamically managed and quantified, the risk identification phase is initiated through the application of an FTA.
The AHU system was chosen as test bed for the methodology in light of its crucial role in ensuring the service of critical infrastructures, such as hospitals, i.e., in reason of the prominent risk connected to its functioning. Indeed, failures that may interrupt the provision of services of an AHU could result in catastrophic consequences due to the reduction of vital services, such as ventilation and air filtering. The dynamic risk assessment here will allow to better control the risk on the service through a real time risk assessment based on the continuous elaboration of data on the functioning of the equipment. To this purpose a convolutional neural network (CNN) used to elaborate time- series images from thermal infrared (IR) sensors, which represent the level of saturation of a bag filter, is descripted in the following paragraph. The data used for the application were generated from thermal IR sensors, placed on the AHU of an operating hospital, and saved on the server of the hospital building manager. The dataset consists of a time series of 40,000 images, collected for a period of three months (from June 2019 to September 2019). The images from the dataset were divided into a training dataset of 32,000 images (i.e., 80% of the original dataset), and a test dataset of 8000 images (i.e., the remaining 20%). To perform the analysis, the images of 256 × 256 pixel resolutions of both the training and the test datasets were chunked into different patches and then a tensor (i.e., the weight matrix) was created with a 2 × 2 sliding window × 64 convolutions.
4.1. Example Infrastructure for the Application: An Air Handling Unit
The air handling unit used in this article is a fictive system set to realistically mimic the one that could belong to a complex building (such as an airport or a hospital building), which uses a water system for delivering cooling and heating power to the endpoints, as shown in
Figure 1.
Its components are mainly related to the following: the AHU plenum, the heating, pre-heating and cooling coils, an heat exchanger, filters (pre-filters, bag filters and Hepa filters), centrifugal ventilators, inverters and sensors related to pressure, temperature and airflow.
In the following sub-sections the identification and management phases are highlighted in the case of an AHU management, by considering the adoption of a data-driven model to predict the top event, which represents the risk to be kept under control, of a designed fault tree for the AHU.
4.2. Service Model
In this example the level of service to be provide by the AHU is the minimization of the impacts on the owner and the users of the system, where the specific impacts for each stakeholder and the pertinent unit cost is given in
Table 2.
With reference to the objective of minimizing the costs for owner and users, it is consider in this example that the stakeholder has agreed that an annual total impact of €50,000 is the maximum tolerable, e.g., the need to replace 500 components (500 pieces 115 €/piece = €57,000) entails an unacceptable service.
When both the level of service to be provided and the acceptability of the service have been defined, the main failure modes affecting the service have to be identified. In the risk asset management of a complex building, the identification of relevant failures is a huge task. As an early step of the service provided by an asset, in order to stimulate the recognition of risks, beyond their aleatory and epistemic uncertainty sources, an expert elicitation phase can offer the opportunity to list some of them. Expert elicitation phase, a typical tool of Bayesian inference approaches for brainstorming in the variable node probabilities of the network, can here represent the chance to gather figures or experts related to the life cycle of an asset, so that consideration of its major risk can be deducted. The output of this phase, for an asset to be managed by a building owner or by an organization, is constituted by the risk list which must be further studied for reducing its aleatory probability of occurrence. However, difference methods to firstly identify risks can be used, such as FMECA, HAZOP, Event trees, Bayesian network, and others.
In this example, the top event identified as critical for the AHU with reference to the service modeled is the block of the air flow.
4.3. Static Risk Assessment
Once it is established that, in the operation of the AHU, the block of the air flow to the end points is the failure mode that mostly affects the performance of the service, the risk connected to this failure has to be assessed. For this scope two elements need to be defined: its probability of occurring and its consequences, in case it does occur.
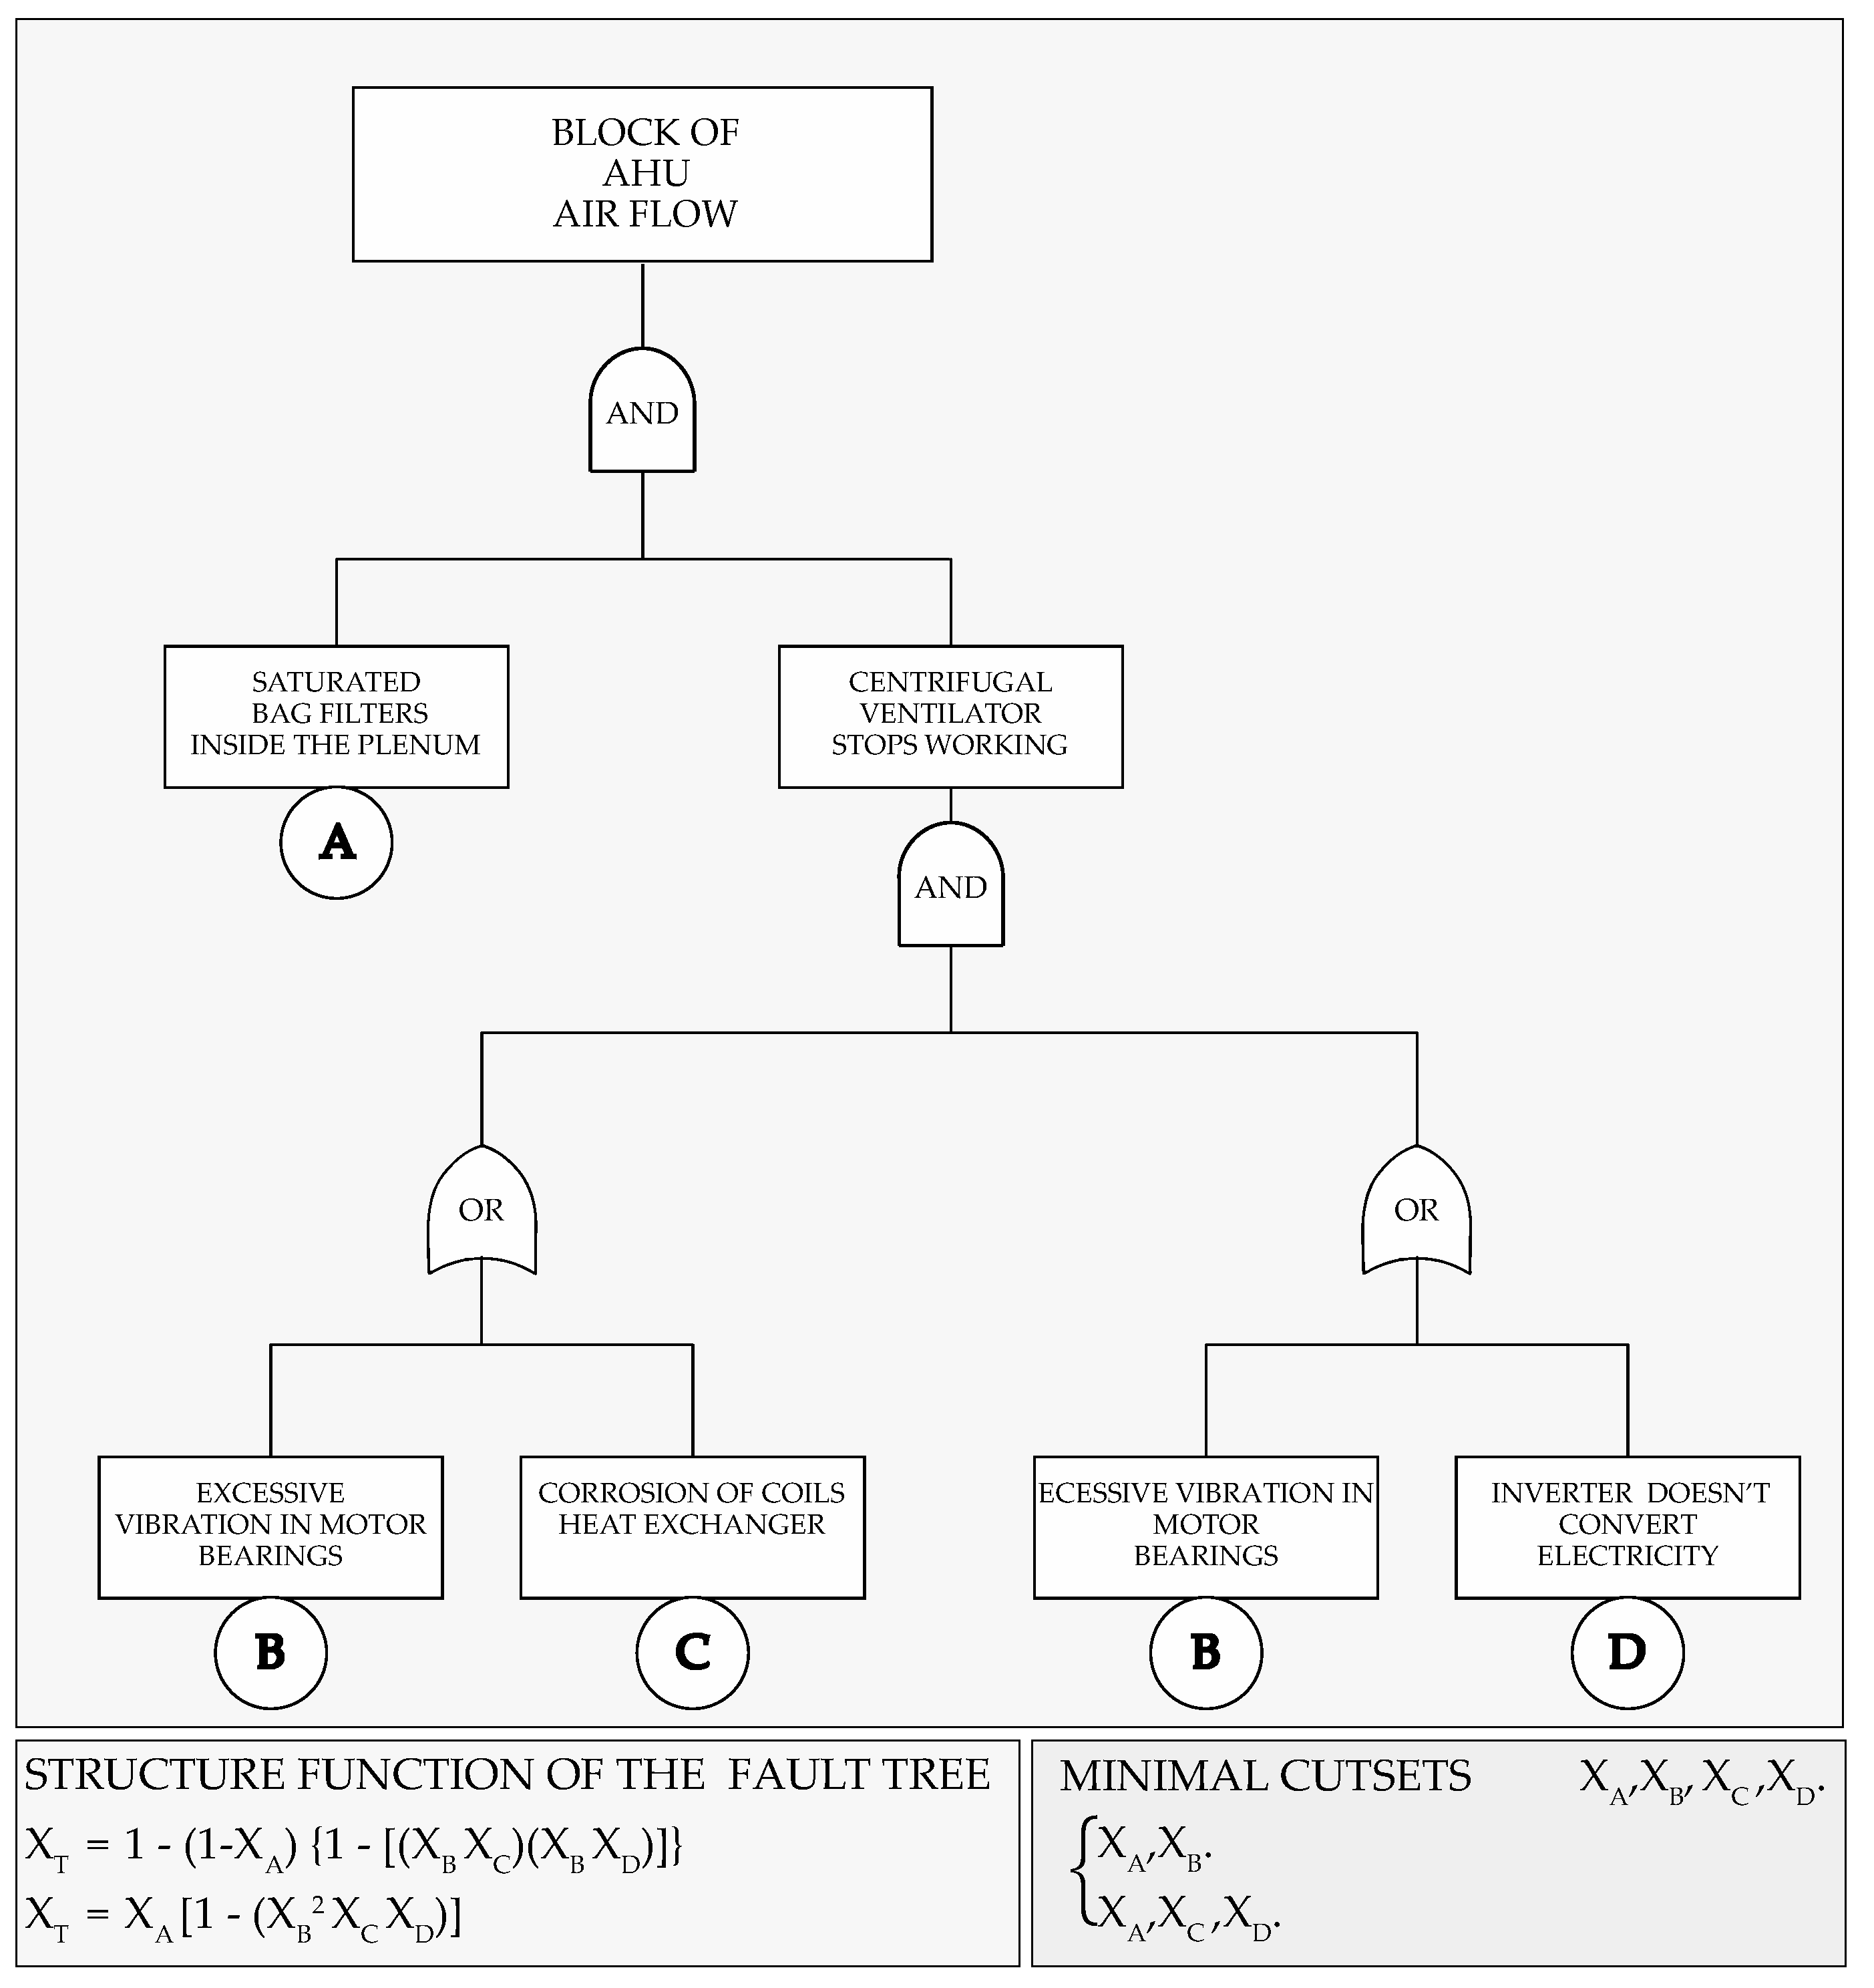
For the estimate of the probability, an FTA is conducted (
Figure 3): to this purpose the root causes (i.e., basic events) responsible for the top event (block of the AHU air flow) need to be identified, first.
Having set that particular top event, the construction of the fault tree involves those components whose failures activate the mechanism of risk, through the configuration of the basic events, which do not need any further investigation, and the Boolean gates (OR and AND).
The resulting fault tree for the block of AHU air flow is depicted in
Figure 2. Its purpose is represented by the individuation of those components which must be further monitored to mitigate the trigger of the top event, through the determination of the minimal cut sets. In particular, not all the components figuring in the fault tree must be necessarily minimal cut set. This allows possible sensors to be deployed only on the asset components which are responsible of the asset performance and asset life cycle.
The computation of the minimal cut sets requires the structure function (
XT) of the fault tree to be defined, which represents, according to the fault tree architecture, the function responsible for risk activation based on the Boolean algebraic equations of the minimal cut sets probabilities [
27].
In the fault tree under investigation the structure function (
XT) has the following configuration:
which can be written as:
where the two minimal cut sets represented by the simultaneous occurrence of
XA and
XB (first minimal cut set) and by
XA,
XC and
XD (second minimal cut set) are responsible for the block for AHU air flow. By computing the minimal cut sets, the probability of the failure to occur (
) is estimated, which in the case of the block of the air flow of the example AHU is actually particularly low (i.e., 0.0004629).
Once the minimal cut sets (MCS) are identified, it is important to notice which are the variables related to those particular failure events held in the components of MCS. This will allow the control and monitoring of the variables (i.e., the internal corrosion of a heat exchanger can be monitored through the analysis of variables such as: water quality, pH of water, temperature of the coils, internal pressure and others) in the dynamic risk management phase (
Section 4.4), through the sensor deployment and data gathering.
In
Figure 4 a list of variables and data-driven methods, used by some case studies and scholars, is provided by considering the MCS monitoring of this work.
The adoption of one or more of the data-driven models (AdNN, ANN, CNN, DL, GA, RNN, and SVM) offers the advantages of:
punctually controlling the single components (MCS) in terms of performance and maintenance budget, if forms of proactive maintenance are considered as an approach to reconfigure the traditional strategy (reactive, preventive, and opportunity);
mitigate or eventually eliminate the risk of the asset represented by the top event;
link to an existing common central system, such as a BMS or a SCADA, the new big data for a precise complex building control;
lengthen the life cycle of the assets, in order to move forward in the future the end of life of the assets and to prepare more accurate CAPEX (Capital Expenditure) and OPEX (Operating Expense).
The average consequence of the block of the air flow (
) is estimated as the sum of the costs of the owner in case of a block (
) and the cost of the users (
). As it is here assumed that in the case of a block of the air flow, the system will require 6 h to be repaired and it implies the need to repair, on average, 120 deteriorated components and replace, on average, 30 broken components, the consequences of the events are estimated as given in Equations (3)–(5).
As it can be noticed, in the case of block of the air flow the majority of the consequences are suffered by the users, due to the relatively long time required to repair the system.
The risk for the stakeholders due to the block of the air flow (
) is then assessed as the product of its probability of occurrence, as estimated with the FTA (
), and the consequences (
), estimated above, as in Equation (6).
The risk connected to the block of the air flow is actually very marginal (i.e., € 7.43). This is due to the almost negligible probability of occurrence of the event (i.e., 0.0004629) that nearly nullifies the rather significant consequences in case the block occurs (i.e., €16,050). For this reason in order to keep the risk low it is necessary that remains at this order of magnitude over time (i.e., any increase in the probability would escalate the risk). For this reason, a dynamic risk assessment is developed in the next section that monitors the probability over time in its evolution.
4.4. Dynamic Risk Assessment
For the dynamic risk assessment phase, the selection of methods and procedures to estimate the actual risk of the minimal cut sets is fundamental. The need of adopting real time and continuous monitoring techniques, leveraged by the enabling ones of Industry 4.0, should invest all the failures of minimal cut sets. In this way, different strategies based on the adoption of different data-driven models can be exploited, according to the following:
the kind of variables which are willing to be monitored and controlled through big data;
the quantity of minimal cut set components which are effectively controlled with the data-driven models;
the immersivity of the IoT architecture (sensing technologies, big data, machine learning, storage solution, platform) which has been designed for all complex building management;
the typology of the IoT solution chosen for the elaboration power (Cloud, Edge, Dew or Fog computing);
the velocity and latency between transferred big data and data-driven model output, which is based mainly on the degree of risk of the monitored asset.
For the sake of simplicity, the degree of bag filter saturation, which is related with XA—which is an event of the minimal cut set represented by XA XB—is chosen to be analyzed through a data-driven model.
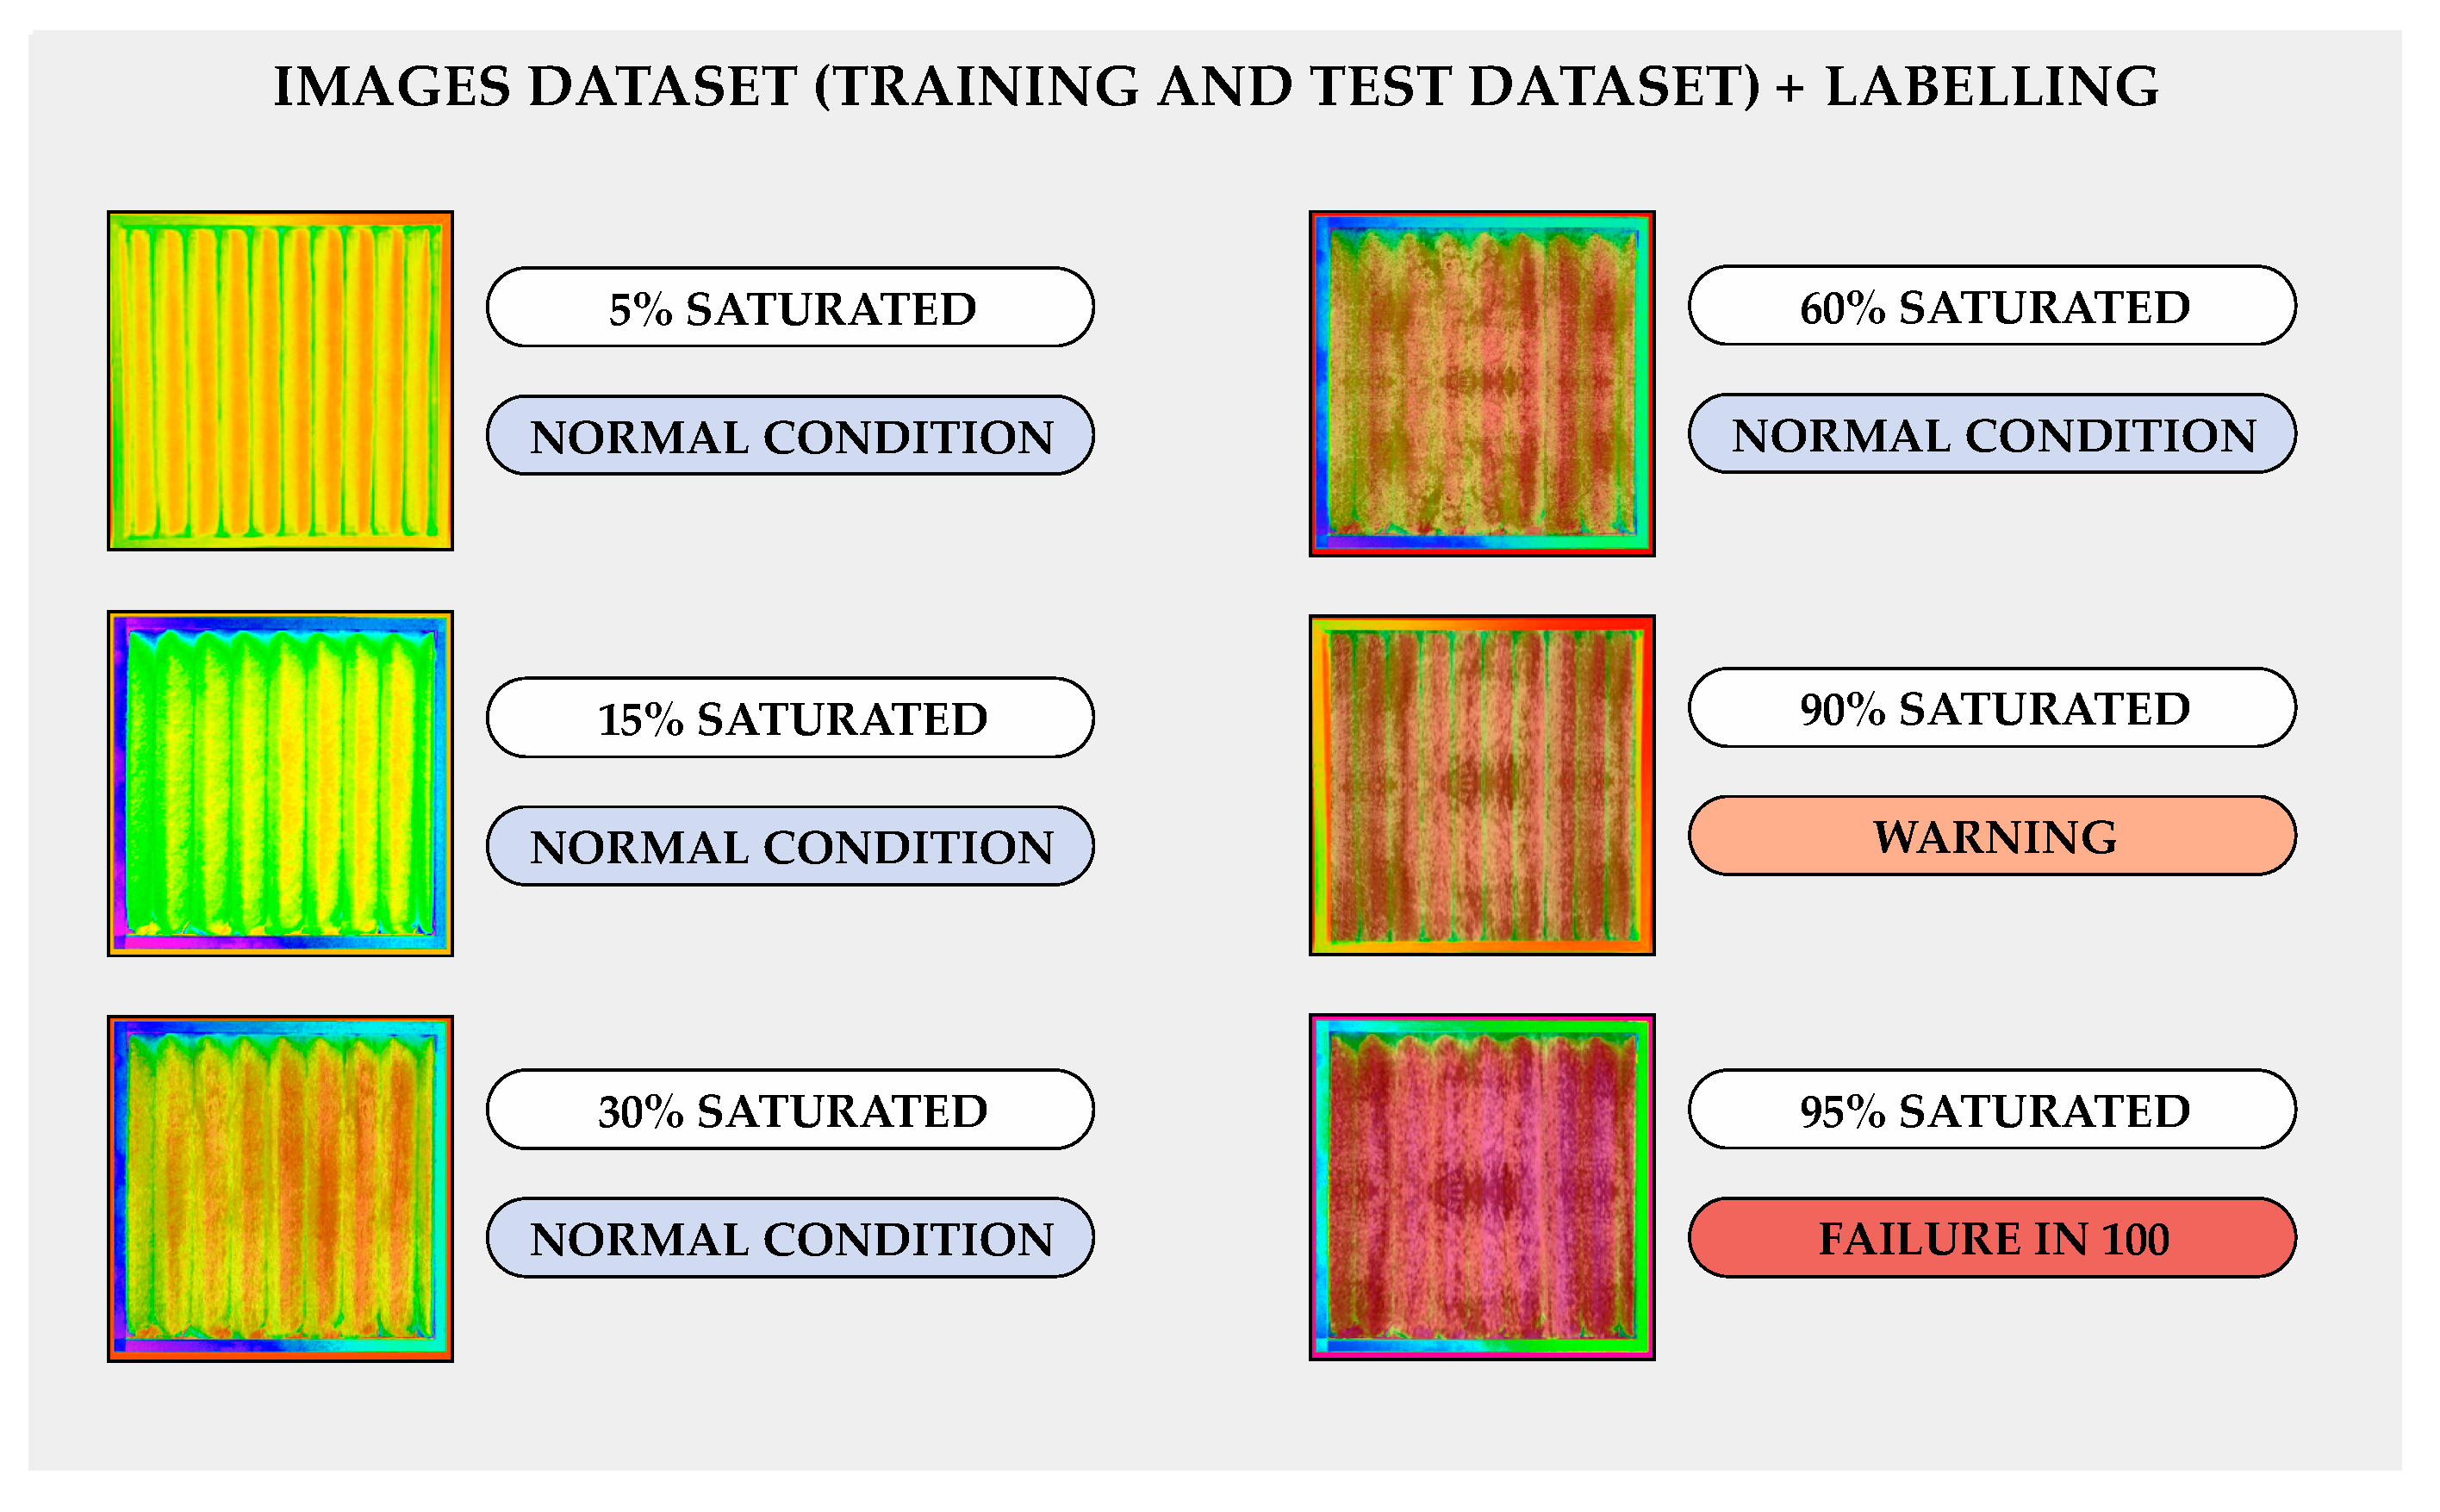
The selected variable which can be continuously monitored is given by the degree of saturation with regard to the particulate matter moved from the air flow inside the AHU plenum. The degree of saturation may be monitored by taking advantage of the images taken by thermal infrared (IR) sensors. The thermal IR sensor allows depiction of the thermal radiation of the images and the degree of saturation derived from the stored particulate in the filter. Images are a particular kind of unstructured big data which can be analyzed with the time-series techniques, these data are periodically sampled.
However, before the application of a data-driven model for failure prediction, the collected images must be further classified on the basis of their degree of saturation. This step can be realized with data mining or classification algorithms, after which the responsible asset management has set the acceptable levels of saturation (i.e., from 5% to 89%), the warning levels of saturation (i.e., from 90% to 94%) and the unacceptable levels of saturation (i.e., from 95% to 100%), by considering that after 95% of saturation of the bag filter 100 h are left before full saturation, which can cause the activation of the top event. In
Figure 5 some thermal image data are shown with respect to the aforementioned levels of saturation.
Moreover, the realization of a particular bag filter saturation (i.e., 5%, 15%, 30%, 60%, 90%, 95%) is not directly time dependent, but it can occur after any temporal period, according to different factors, such as:
the supplied airflow speed;
the operative time of the whole AHU;
seasonal effects (temperature, building occupancy, air pollution).
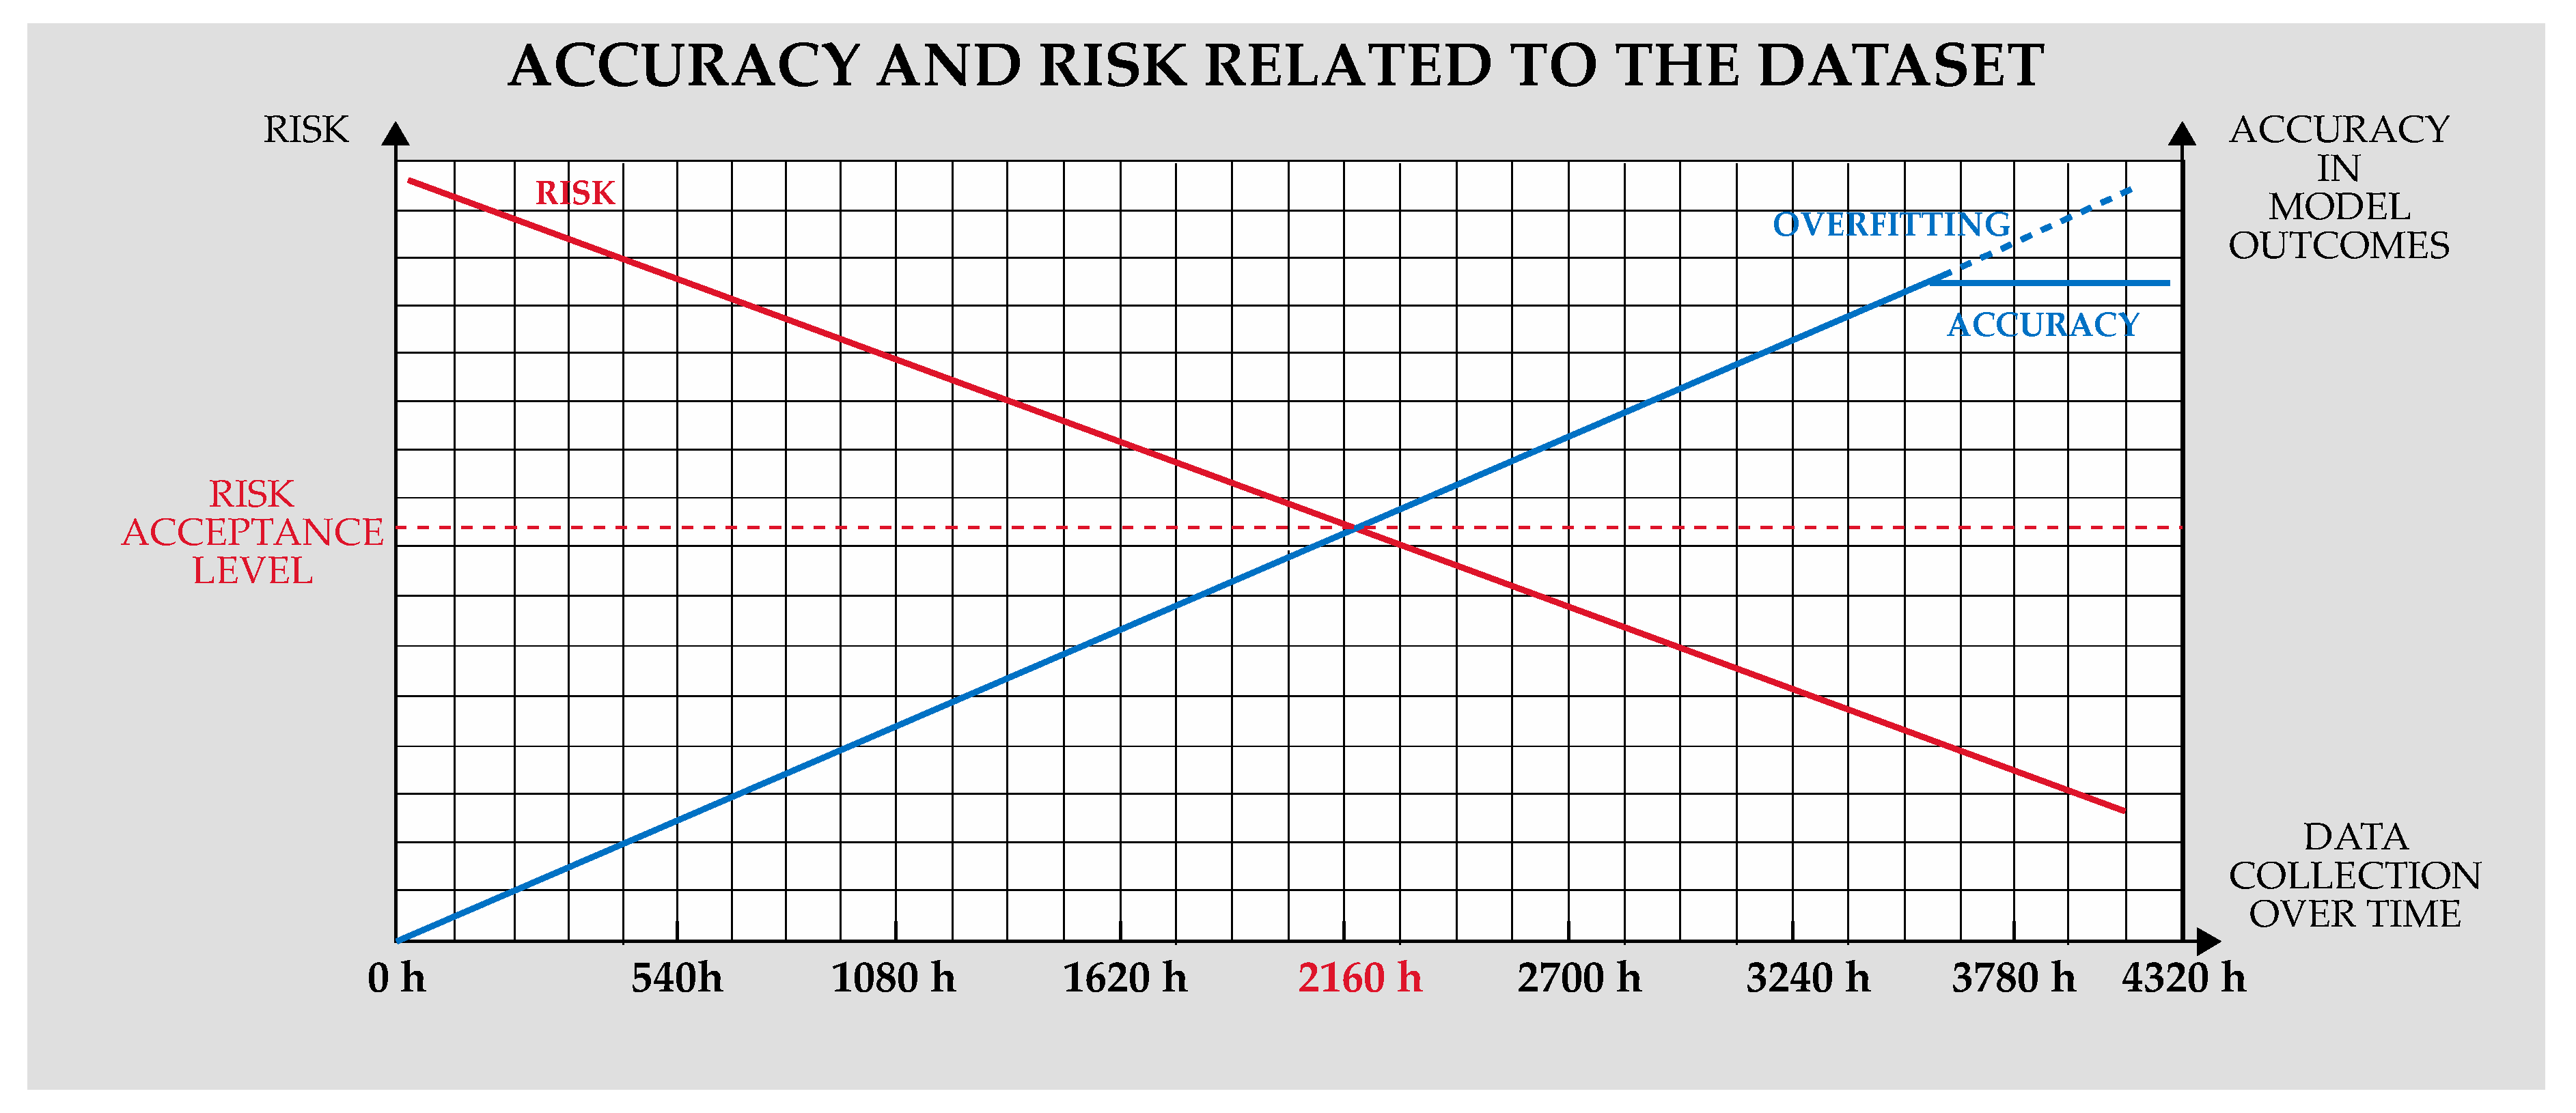
The collection of the big data, from a first period of 0 operative hours to a second period of 4320 operative hours, could:
This is represented in
Figure 6, in which two main issues are shown in:
the possibility of the data-driven model overfitting;
the irreducibility of the epistemic uncertainty component of the risk, which must be accepted.
Three months of data collection (2160 h) can be sufficient to create a dataset which contains both good operative filter saturation (<89%) and failing condition of filter (≥90%).
The selected data-driven model, which deals with the complexity of image data elaboration, is a Convolutional Neural Network (CNN), which is a particular kind of Artificial Neural Network (ANN) in the ecosystem of data-driven models.
The CNN model gives the chance to continuously elaborate the received data in order to classify the inputs, learning their features and predicting an output based on those features.
The output here sought after is represented by the information regarding:
good operation of the bag filter which can be still in use, as it has not yet reached a critical level of saturation;
the failing pattern towards the full saturation of the bag filter, after which 100 h are left until the obstruction.
The CNN is composed of many layers, which form the network, such as one input layer, several convolution-pool layers, some fully connected layers, and the output layers.
The input layer is fed by the acquired images, each of which represent a tuple (collection of values which is ordered and unchangeable) formed by the amount of images, x dpi, y dpi, and the number of channels (amount of numbers used to specify the color of each pixel, which is three for a colored image). This tuple represents a feature map whose aim is to reduce the images size and achieve a faster processing, at the expense of some lost data features.
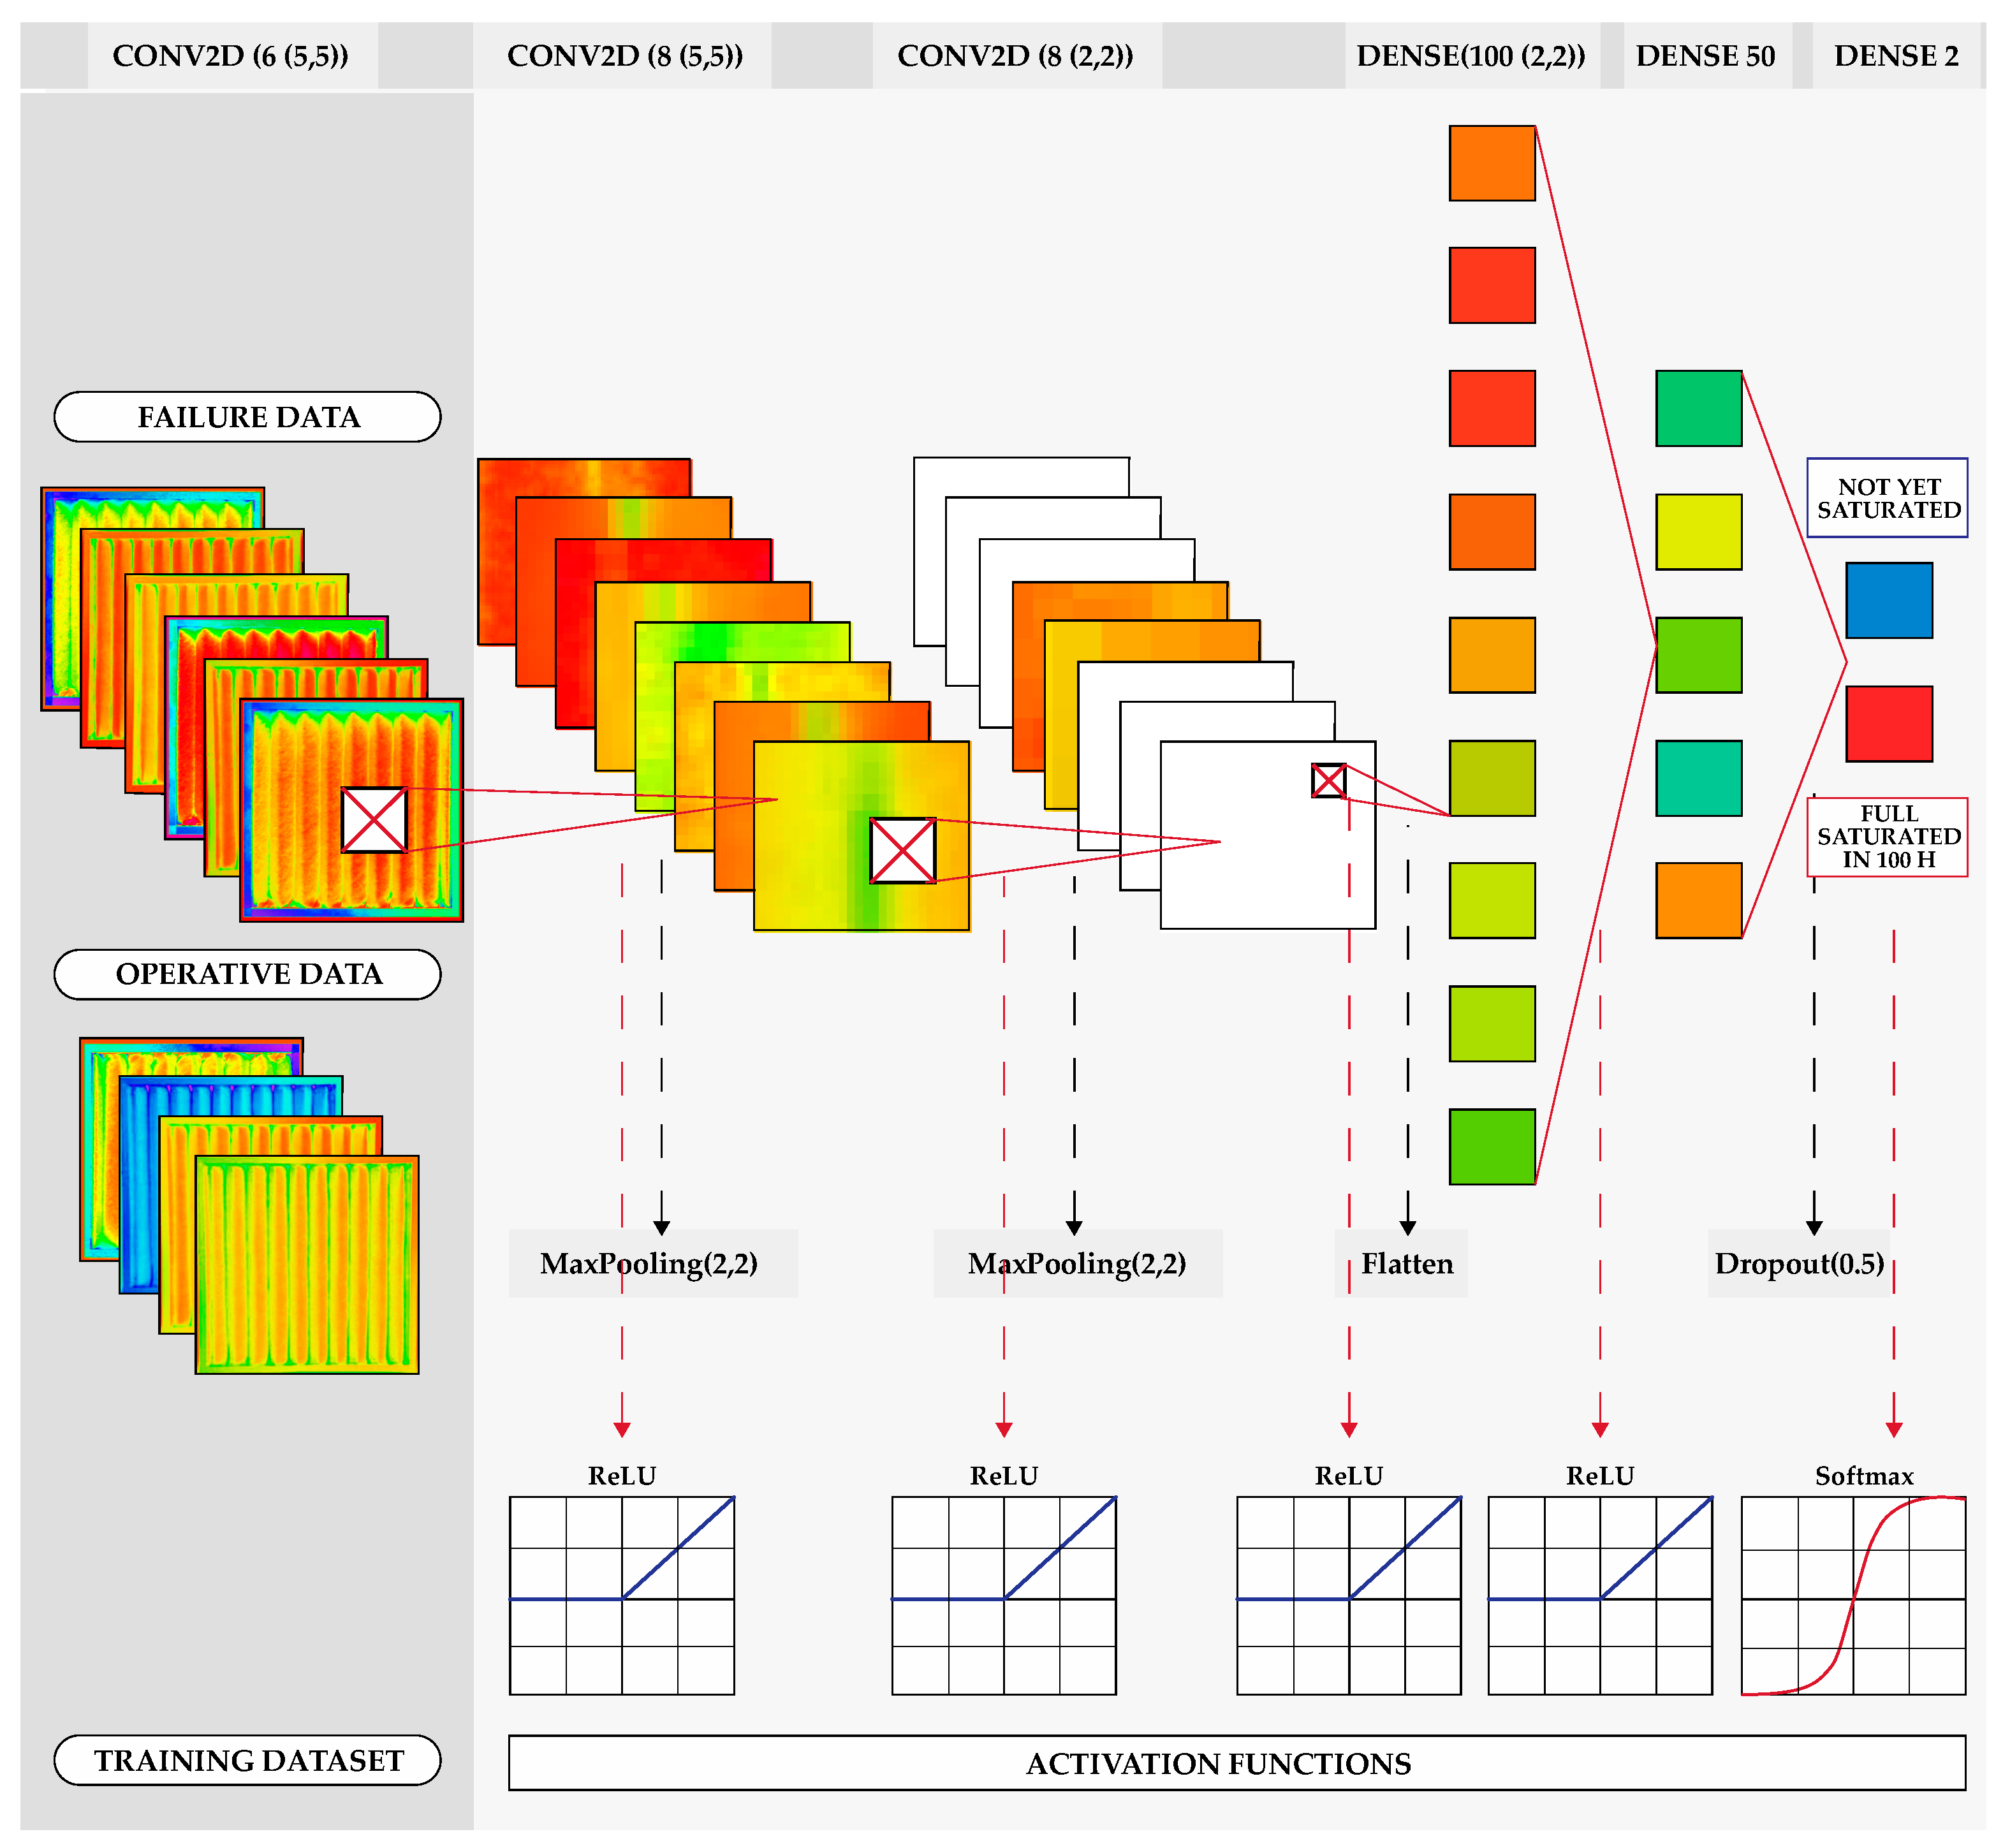
In
Figure 7 a scheme of the used CNN is provided with regard to the training dataset of the images.
The transformation of the linear problem in a non-linear problem, typical of images, to be treated with the CNN processing (pooling, flattening, dropout) is performed by the application of some activation functions, such as ReLU and Softmax functions, useful for the following classification problem of the final output.
The Pooling step allows the first image features to be gathered, independently of the differences in each image with respect to disturbance. Here the adoption of a MaxPooling (2,2) enables the creation of a 2 × 2 matrix which examines the feature map of the images as input of the CNN, by scanning from left to right the whole feature map and choosing the major value, as a representative one. The output of this step is the creation of several pooled feature matrixes, with reduced dimension with respect to the initial training dataset, which are then processed in the flatten step.
In the flatten step, the realization of one column vector from the pooled feature matrixes is computed. This allows the CNN neurons to be easily given an additional input to be further elaborated.
The full connection of all the pooled feature matrixes is performed in a so-called fully connected step, which provides the final CNN output, as in the hidden layers of the RNN and the ANN. The number of neurons is performed through different experimentation. In this CNN nine neurons were implemented in the fully connected layer. The output, represented by the prediction of the two classes (not yet saturated and fully saturated in 100 h) is achieved with:
the passed column vectors, which non-linearly simplified some features;
the error prediction calculation through the Loss function, after which it is back propagated through the system to improve the accuracy of the prediction;
the application of the Softmax function, as activation function, which weights the probabilities of the two output classes.
The fitting of CNN models is realized with Python, taking advantage of the open-source neural network library Keras.
The adoption of CNN has shown that it can classify, in real time and with an accuracy of 98%, when the filter has reached the critical threshold (>90% saturation) and when it can continue to operate without concurring to the top event activation. The adoption of CNN for other filter saturation problem offers the opportunity to detect a useful time window in which the filter reaches total obstruction.
This allows the probability of a basic event of the fault tree to be minimized, i.e., the saturation of the filter to reach a critical threshold and as a consequence, reduces the probability of the connected top failures. This reduced probability on the top-event multiplied by the pertinent consequences (estimated as in
Section 4.2) allows the estimation of the risk on the service over time.
With the application of CNN to the analysis of the saturation level of bag filter, it has been seen how, in 1 year of AHU operations in which the bag filters are changed four times (one changed bag filter each three months) with a predetermined maintenance strategy, the bag filter could have remained in operation for longer periods (from 1 week to 2.5 weeks). Probably this extension of bag filter operative life cycle can depend on the seasonal effect of AHU service and the variable airflow.
4.5. Dynamic Risk Management
Once the failure is predicted with the application of enabling technologies, the management phase can be empowered through the execution of specific actions to reduce the probability of occurrence of the top-event failure, also minimizing the connected risk. Some of these interventions might include:
the planning of a set of actions to deal with the predicted failure, if this is predicted in plenty of time;
the creation of a common risk indicator to deal with the sum of the different MCS failures, representing the top event probabilities or time to activation.
the execution of interventions to repair and replace deteriorated components affecting the probability of basic events.
Actually, the major finding of the dynamic risk management is the possibility to extend the operative life cycle of the bag filter beyond the traditional three months, typically used in the O&M activities, with benefit with regard to the environmental sustainability and OPEX for the organization and building owner.
5. Discussion
From the application, a number of advantages appear in the use of the proposed methodology for the management of an AHU system.
On the more practical side, it has emerged how the use of the CNN to support a dynamic preventive maintenance offers the possibility to extend the service life of systems and components without raising the risk on the service that they offer. For instance, with the traditional maintenance approach the replacement of the bag filters in the AHU of the hospital building occurs according to a predetermined maintenance program in which every three months the filters are totally replaced, regardless of the actual condition of the component. This operation, in a building which has 61 AHU systems, in which each system has from 3–5 bag filters, has relevant implications on economic resources, the safety of the maintenance operations, and the air quality. Moreover, the bag filter, in the non-dynamic approach, could experience an acceleration towards its end of life, depending on its operating conditions, which can anticipate the three month replacement rule.
The use of a dynamic risk management based on CNN has allowed, in the example, an extension of the operation with the bag filters, from three months to three months and a half, which reflects the possibility to extend this dynamic approach to the maintenance of the other filters (such as pre-filters and Hepa filters) which in buildings, such as the hospital ones, represent one of the great sources of consumable materials in the accounts of the financial statement.
With reference to more theoretical implications, the application of the methodology has proved that the dynamic risk assessment methodology can enable the systemic use of numerous innovative methods to dynamically assess the risk and optimize decisions on interventions. These methods include: impact hierarchies to rigorously quantify the service, fault trees to estimate the probability of failure, RI to monitor constantly the performances of elements and components, and CNN to update the failure probabilities, i.e., the probabilities of the basic events of the trees, in real time.
From the application it is possible realize the possibility reached with approaches using big data, arising from the operative life cycle of the assets. This means that customized solutions taking account of the future trends of each asset can be achieved, with data-driven models, starting from the actual performance of the facilities. This may also represent a possible innovation, in building management, towards direct sectors such as proactive maintenance and energy management.
If all the MCS components are continuously collected by the sensors and monitored online by the machine learning, risk determination for the critical asset can be easily performed.
From the system level of the asset it is possible further to switch to the system of systems level ([
45]) of the entire building, in order to achieve a good knowledge of the latent risks which may arise, from the points detected by the brainstorming in the aforementioned Expert elicitation phase.
However, the possibility to adopt machine learning tools (both the data-driven and physical-based model) is consequential to the creation of an ICT network to promote the information flow, from the start nodes (sensors on asset/component) to the end nodes (machine learning or smart devices, which receive the output).
Often, the information flow in complex buildings or infrastructure are facilitated by the inclusion of a BMS or a SCADA, which allow monitoring and controlling asset performance. These ICT tools can be enabled towards the proactivity represented by the data-driven models through sensor projects, which implement the traditional scenario in a smarter and dynamic one. This implementation has to consider certain new hardware and software specifications, such as:
the deployment of the necessary sensors to collect the relevant big data;
the communication protocol used by the BMS or a SCADA to communicate the existing information, which can be used to direct the new big data (if a new communication network is not desired);
the expansion of the accesses for the network controller, if these are already saturated by the existing sampled signals, or the inclusion of new gateways to transfer the big data;
the possibility to use the BMS/SCADA to integrate the machine learning tools or the adoption of a new server, which uses a relational or non-relational storage, and which feeds the data-driven model.
These four specifications can be extended if other enabling technologies (such as smart devices, dynamic maintenance plans and others) are considered to better manage the daily management of the complex buildings or infrastructure.
This risk determination process, if fully implemented, can be branched out to the monitoring of the building contract, if this is based on the outcomes (Service level agreement (SLA) and key performance indicator (KPI).
Actually, if the complex building or the infrastructure is managed by an external company different from the building/infrastructure owner, typically their partnership is subordinated to a contract, as a multi-service or a global service contract, whose compliance and fulfillment are reached through the SLAs. These SLAs can be easily monitored, especially by the management company, if data-driven models consider the SLA contents as the final output to be predicted and kept under control.
The benefits in adopting data-driven models in the management of the complex building/infrastructure are represented by:
the alignment of agreed service and actual outsourced service by the management company;
a sustainable use of the resources, as they are used just when they are needed and not on predetermined or corrective strategies;
a more continuous provided service from the assets, which can be reflected in the health, safety, and wellbeing of the building users.
6. Conclusions
Enabling technologies from I4.0 have revolutionized traditional data collection and elaboration techniques in industrial sectors. Their inclusion in building management can support a more dynamic risk identification and management, which can allow the achievement of failure prediction, extension of remaining useful life of the assets, better conditions for the building’s user and an efficiency energy management.
However, these innovations can be systematically transferred from the industrial sector to the construction one only if hardware (such as sensors, gateways, platforms, database) and software (machine learning and automation algorithms) architecture, jointly with the expertise on maintenance strategy are included in the building management process.
The know-how of the traditional tools and procedures for the risk identification and management can be enabled with the new products of Industry 4.0. Among these, the use of the Neural Network-based algorithms seems to support both operations and risk management, thanks to their abilities in learning and creating patterns in fault detection. As the assets can be supported from sensors, these can take advantage of the critical variables elaborated by a Neural Network to describe their future performance and the possible risks linked to a particular asset.
This new proactive approach in risk identification and management, enabled by Neural Networks, can innovate the traditional maintenance management also in the reconfiguration of new maintenance strategies, for risk mitigation, by redefining the traditional corrective, preventive, and opportunity strategies.
The major limitation of the example application presented in this article is the limited data sources available to implement the data-driven model. Indeed, it would have been of most interest to couple the time series-images with other types of data describing the relevant environmental condition for the functioning of the system (e.g., air pressure, air velocity, and air temperature), for a cross validation of the used unstructured data in the CNN. In addition, the sampling rate of the collected images could be further investigated to find an optimum between more accurate prediction and the needed quantity of unstructured data with the CNN models.
Moreover, it would have also been of interest to validate the results also on the offline phase (using the data once they have been collected and stored in the database) rather than in the on-line phase only (using the data in real time). Indeed, even if the offline phase is used to test the effectiveness of the methodology, the experimentation of CNN in the offline phase could distort the time to intervention in the case of a real time failure in the hospital building management.
In line with the limitations underlined in this work, several outlooks can be suggested for further research. The first outlook is the envisioned possibility to confront the outcomes of the risk management methodology, using different types of neural network to estimate the probabilities of basic events. Indeed, it would be interesting to confront how the accuracy of different neural networks models can vary in monitoring the same critical system, with different big data variables and sampling rate. On a longer perspective, the next step in promoting a fully automatized dynamic risk management on the built environment, will be the development of proper autonomous decision- making algorithms, e.g., using Dynamic Bayesian Network or Neural Network, to overcome man-made decisions on the intervention, in favor of an automatic selection of the best actions under particular asset conditions, constraints, and utility.


