Article

Phytoplankton Indicators in the Assessment of the Ecological Status of Two Reservoirs with Different Purposes in Southern Ukraine

by
Tatiana Novoselova
1,
Sophia Barinova
2,* and
Alexander Protasov
1
1
Institute of Hydrobiology of NAS of Ukraine, Geroyev Stalingrada Ave., 12, 04210 Kiev, Ukraine
2
Institute of Evolution, University of Haifa, Abba Khoushi Ave., 199, Mount Carmel, Haifa 3498838, Israel
*
Author to whom correspondence should be addressed.
Submission received: 17 April 2022 / Revised: 7 May 2022 / Accepted: 10 May 2022 / Published: 13 May 2022

Abstract

:
A comparison of two closely located reservoirs on the Southern Bug River and its tributary in the southern region of Ukraine is carried out. One of them (Tashlyk reservoir on a small river, tributary of the Southern Bug River) is a cooling reservoir (pond) for the nuclear power plant, the other (Alexandrovskoye reservoir, on the Southern Bug River) is used for agricultural purposes, for the production of electricity at a hydroelectric power plant, and as a lower reservoir for a pumped storage power plant. Comparison of the main indicators of phytoplankton in the reservoirs was carried out together with its spatial distribution. It was found that the distribution of coenotic groups of plankton in the cooling reservoir corresponds to thermal conditions. In the Alexandrovskoye reservoir, separate communities of plankton are formed along its length. The description of indicator species of algae in two reservoirs is given. The important role of the catchment basin was demonstrated with statistical maps. It was shown that a significant increase in temperature in the cooling pond did not lead to the depletion of phytoplankton.

1. Introduction

Water bodies created specifically for technical purposes are complex technoecosystems [1,2]. In aquatic technoecosystems, natural biotopes are supplemented or replaced by technogenic ones. Certain technical processes can significantly change natural environmental factors such as temperature. The complex of technogenic conditions and factors of water bodies subject to technogenic impact has a certain originality [3]. For complex-purpose reservoirs created for hydropower on rivers, the main environmental factors are slowdown in runoff and flow velocity, and fluctuations in water levels [3,4]. For reservoirs used as coolers of thermal and nuclear power plants, the main technogenic factors are the thermal factor and changes in the hydrodynamic regime and periodic transfer of organisms through cooling systems [5,6]. The diversity of hydrobiont communities, in particular planktonic communities, depends on the diversity of conditions in technoecosystems [7]. In addition, when studying the conditions of extreme technogenic loads and impacts, the question of the tolerance limits of aquatic organisms is always raised.
Long-term dynamics of plankton was earlier described in the Tashlyk reservoir [7]. It was found changes in plankton occurred primarily due to changes in the regime of exploitation of the reservoir, changes in its thermal regime. At the initial stages of the study of the reservoir (1980s), an increase in the biomass of phytoplankton was recorded against the background of an increase in the power of the power plant. In the summer of 1985, the recorded maximum biomass level (average 9.6 mg/dm3) was associated with the abundant reproduction of diatoms Aulacoseira granulata (Ehrenberg) Simonsen during the entire observation period. In 1986, an increase in the average annual air temperature by 2 °C was recorded at the nuclear power plants (NPP) site compared to the previous year [8,9]. Moreover, after the accident at the Chernobyl Nuclear Power Plant and its shutdown in the summer months, the South Ukraine NPP operated at full capacity. The death of phyto- and zooplankton was observed when the discharge water temperature increased to 45 °C [10,11] and small forms of Cyanobacteria were numerically predominant, in accordance with [12]. The minimum biomass of phytoplankton was noted during this period with average 0.3 mg/dm3. The phytoplankton abundance increased over the next ten years, but the range of fluctuations in the summer phytoplankton biomass did not go beyond the previously recorded values.
Research on the Alexandrovskoye reservoir was carried out as part of the study of the effect of a pumped storage power plant on biota [13,14]. According to the results of these studies, it was established that the composition of phytoplankton was formed mainly due to green and diatom algae. In some years and seasons, the mass development of algae was noted, when their abundance and biomass reached 22.8 million cells/dm3 and 22.6 mg/dm3 with the predominance of Miozoa species. The abundance of algae increased in the direction downstream.
The reservoirs studied by us are technical; therefore, in addition to natural factors, the influence of technogenic factors is also observed. It can be assumed that the Tashlyk reservoir, as a cooling pond for nuclear power plants with a typical thermal regime for this type of reservoir, could have oppressed underdeveloped phytoplankton, especially in areas with high temperatures.
Our task in this work was comparative characteristics of plankton microalgae in two closely located reservoirs of different design, different modes of operation and technogenic load.

2. Materials and Methods

2.1. The Objects of Research

The studies were carried out in the Alexandrovskoye reservoir and the Tashlyk reservoir. The Tashlyk and Alexandrovskoye reservoirs are part of the infrastructure of the South Ukrainian Power Complex (SUPC), the only company in Ukraine with integrated use of basic nuclear and follow mode hydroaccumulative capacities, as well as water resources of the Southern Bug River. The SUPC includes the South Ukraine NPP (SUNPP), Alexandrovskaya Hydroelectric Power Plant and Tashlyk Pumped-Storage Power Plant. SUNPP is a leading energy company of Ukraine and a separate subdivision of the Energoatom Company of the Ministry of Energy and Coal Industry of Ukraine. The South Ukraine NPP is located in the northern part of the Mykolaiiv region of Ukraine, in the steppe area, on the left bank of the Southern Bug River, 2 km (to the east) of Yuzhnoukraiinsk. The plant is located on the left bank of the Tashlyk reservoir formed on the inflow of the Southern Bug River [15].
Field studies of the Tashlyk and Alexandrovskoye reservoirs were carried out in 18–24 July 2018 at a number of stations (Figure 1).
The Tashlyk reservoir, which is a cooling pond for the nuclear power plant, has an area of 8.6 km2 and a volume of 86 million m3. At this stage, there are 3 nuclear power units in operation with a total installed capacity of 3000 MW of the South Ukraine NPP, 2 hydraulic units with a total capacity of 9.8 MW of the Alexandrovskoye Hydro Power Plant (HPP) and 2 hydraulic units with a total operating capacity in generator mode of 320 MW of the Tashlyk Pumped-Storage Power Plant (PSP). The Tashlyk reservoir receives additional water from the Southern Bug River and discharges a small amount of water into the Alexandrovskoye reservoir. During the operation of the 3 power units, the reservoir receives more than 10 million m3 of heated water per day.
Alexandrovskoye reservoir, located in the canyon of the Southern Bug River, provides electricity generation at the Alexandrovskaya hydroelectric power plant and serves as a lower reservoir for the Tashlyk Pumped-Storage Plant. Hydrocomplex HPP-PSP is used as a water battery to reduce water deficit in the lower reaches of the Southern Bug during the summer low-water period. The area of the reservoir is 11 km2, the volume is 72.1 million m3 and the useful volume is 20.9 m3.

2.2. Methods of Hydrological Investigation and Plankton Sampling

The data concerning environmental variables were taken with standard methods [16]. A mercury hydrological thermometer measured the temperature with an accuracy of 0.1 °C, water transparency was measured with using a Secchi disk of 30 cm diameter.
Samples of phytoplankton with a volume of 0.5 dm3 were taken in the pelagic part of the reservoirs using a Patalas’ bathometer in 4–10 July 2018 during hot dry weather. In the Tashlyk reservoir, eight phytoplankton samples were taken from the surface horizon (0.3–0.5 m) and three samples from depths of 10, 20 and 30 m. In the Alexandrovskoye reservoir, eight samples were collected from the surface horizon and one sample from the horizon 6.5 m. The total species composition of phytoplankton is given for all samples combined. To describe the composition and distribution of species indicators, only samples from the surface horizon were used. Samples were fixed in 4% of neutral formaldehyde [16].
Samples were transported in closed boxes. In order to avoid deformation of the algae cells, the samples fixed with formaldehyde were processed in the office for 1–1.5 months. The fixed material was quantitatively recorded by direct counting in a Nageott chamber (0.02 cm3) using an MBI-3 (LOMO, Russia) microscope under magnification ×400 and ×800. The diatom species were studied under ×1000 with Zeiss Axio Imager A1 (ZEISS Research Microscopy Solutions, Jena, Germany) light microscope.

2.3. Determination of Algae

The calculation of the algae cell number (million cells dm−3) in each sample was carried out according to Equation (1) [17]:
N = k n ( A a ) v ( 1000 V )
  • N—Algal number in dm3 of water sample;
  • k—Coefficient indicating how many times the volume of the chamber is less than 1 cm3;
  • n—The number of algae cells in the tracks of the counting chamber;
  • A—Number of tracks of counting chamber;
  • a—Number of tracks on which cell counts were made;
  • v—Volume of concentrated sample;
  • V—Sample volume.
Average cell volumes and the stereometric method were used for calculating the phytoplankton biomass [18,19].
The term “the lowest identified taxon” (LIT), which denotes taxa of both species and higher rank defined in accordance with the identification capabilities, was used after A.I. Bakanov [20] to describe the taxonomic richness and diversity of algae. Vidal et al. [21] used a similar approach when a special term was used to describe the taxonomic composition of algae. In this article, the term OTU (operational taxonomic unit) denotes organisms identified to the lowest taxonomic level possible. In our work, we consider that the term LIT more accurately describes the phytoplankton composition, which includes taxa of different ranks. The valid names and systematic affiliation of phytoplankton taxa are cited according to [22] (accessed on 19 September 2021). Most of the phytoplankton (94%) LITs were identified to species rank.

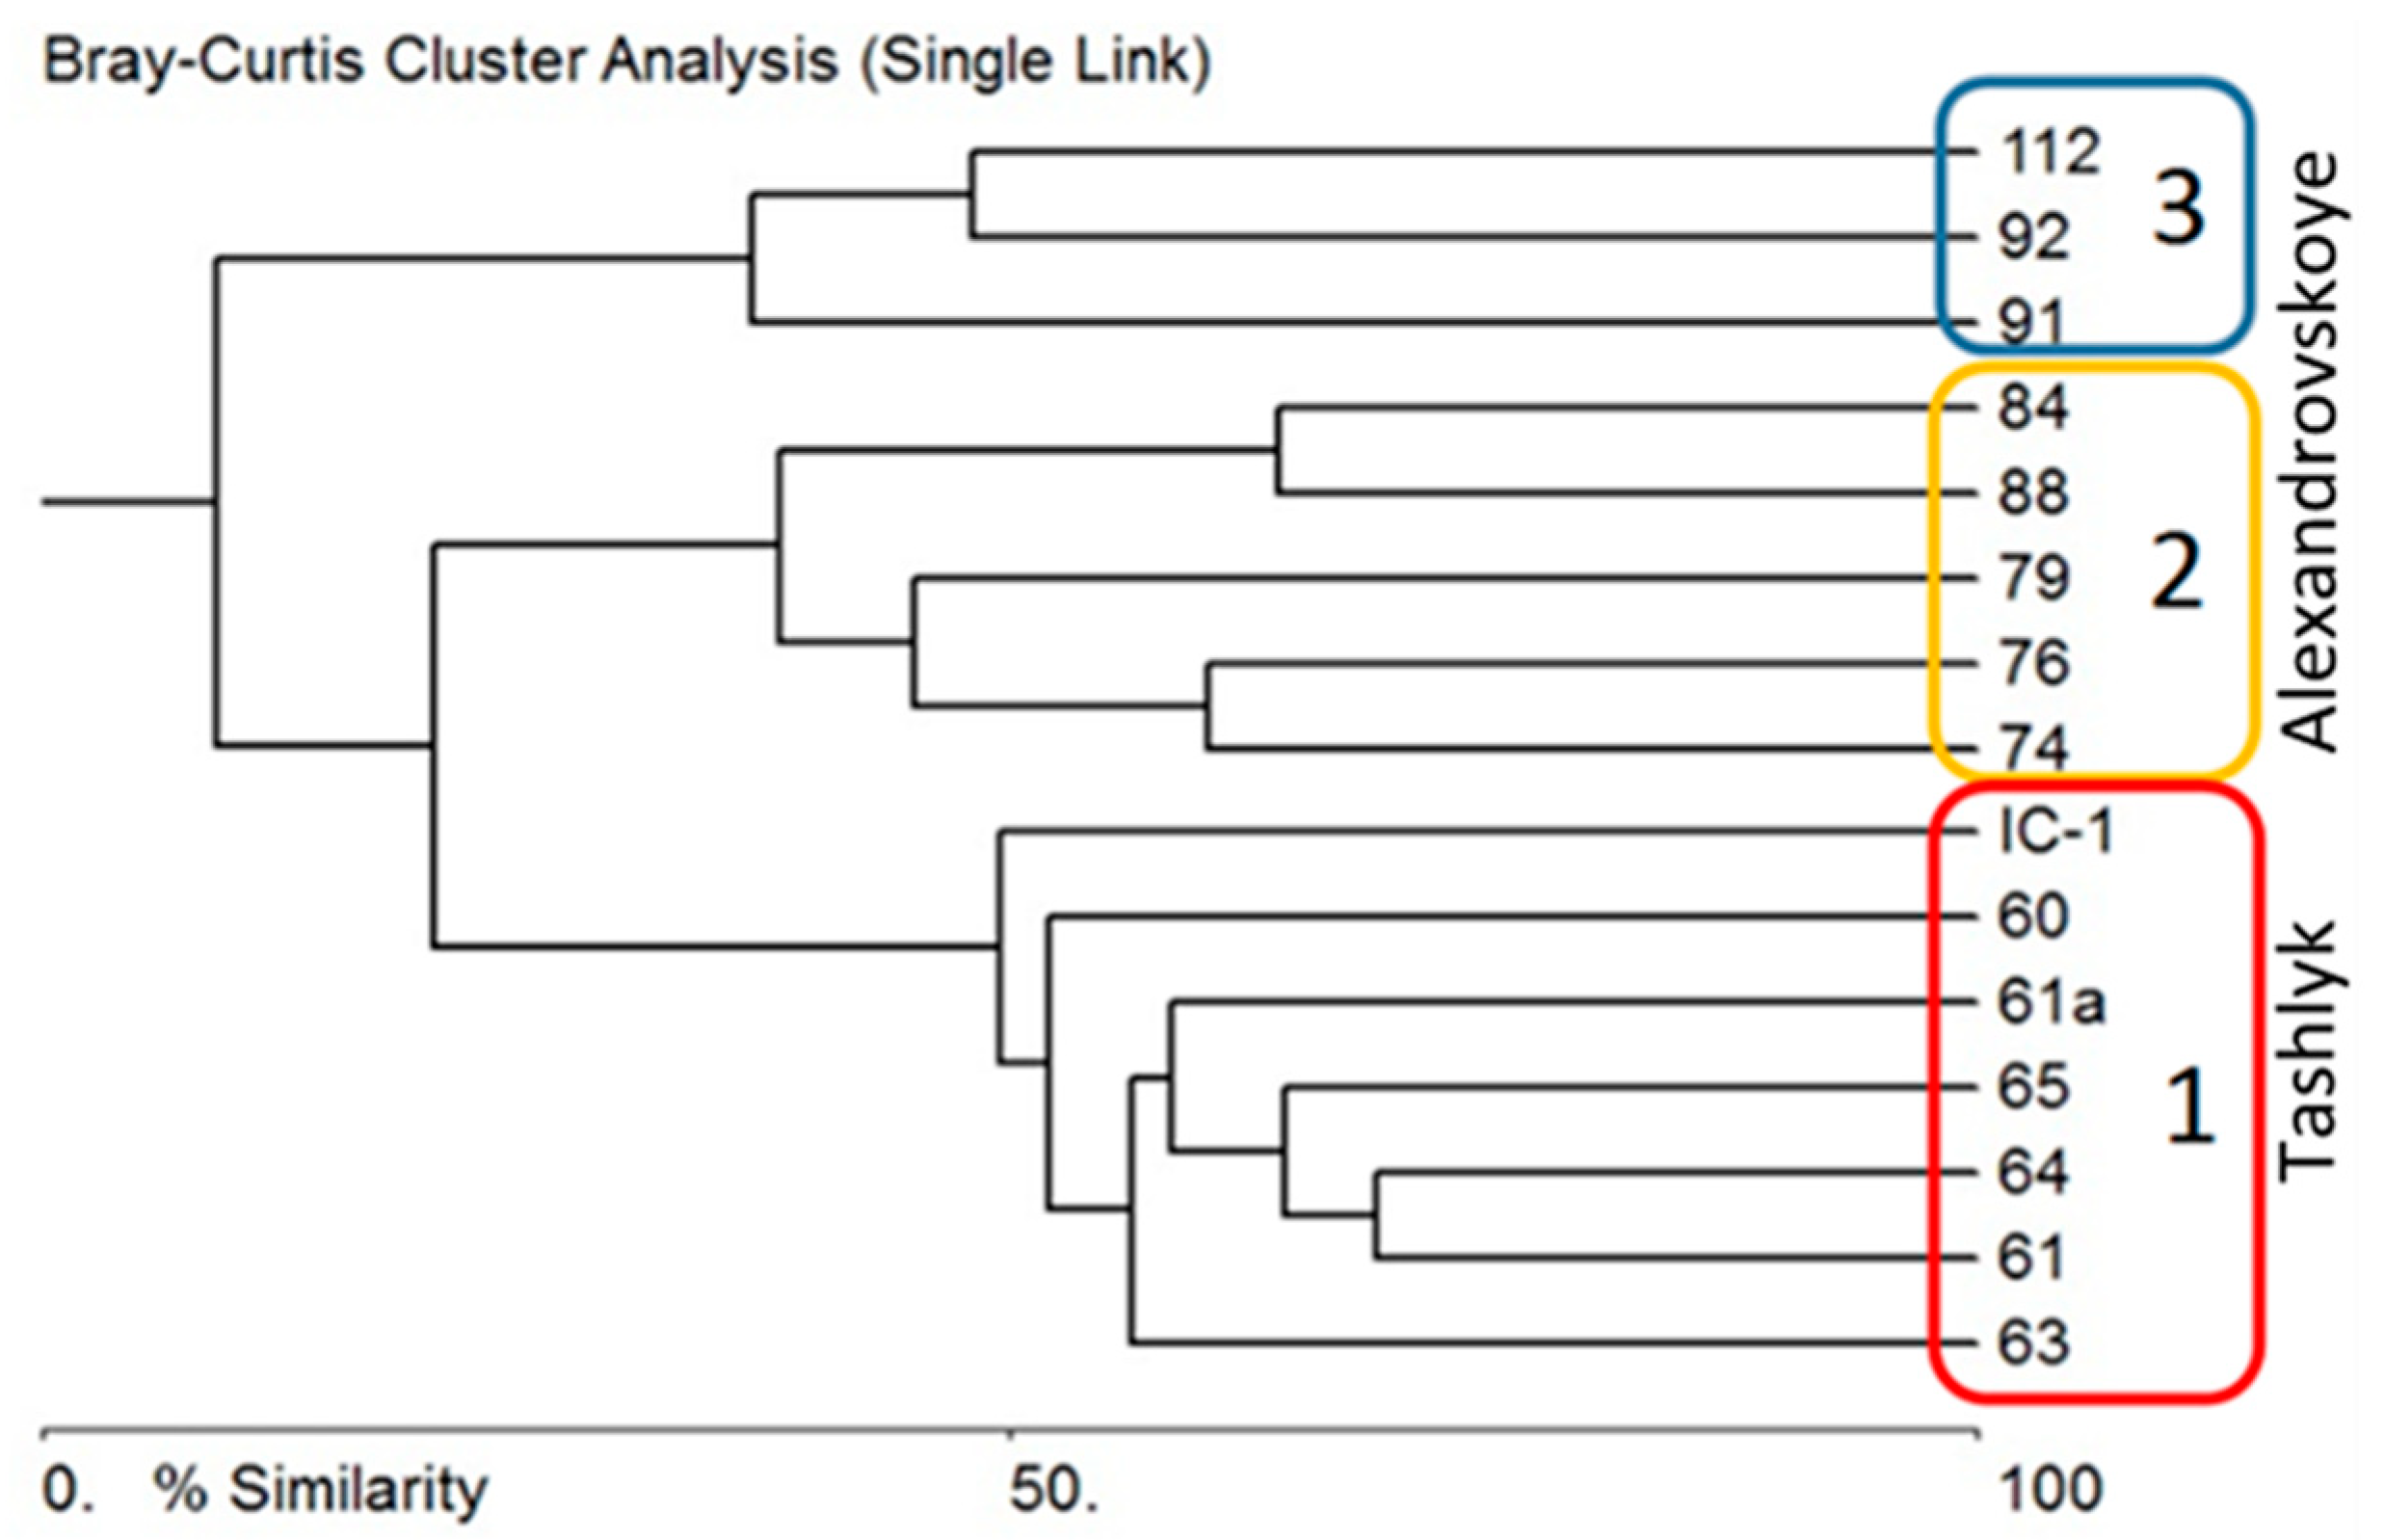
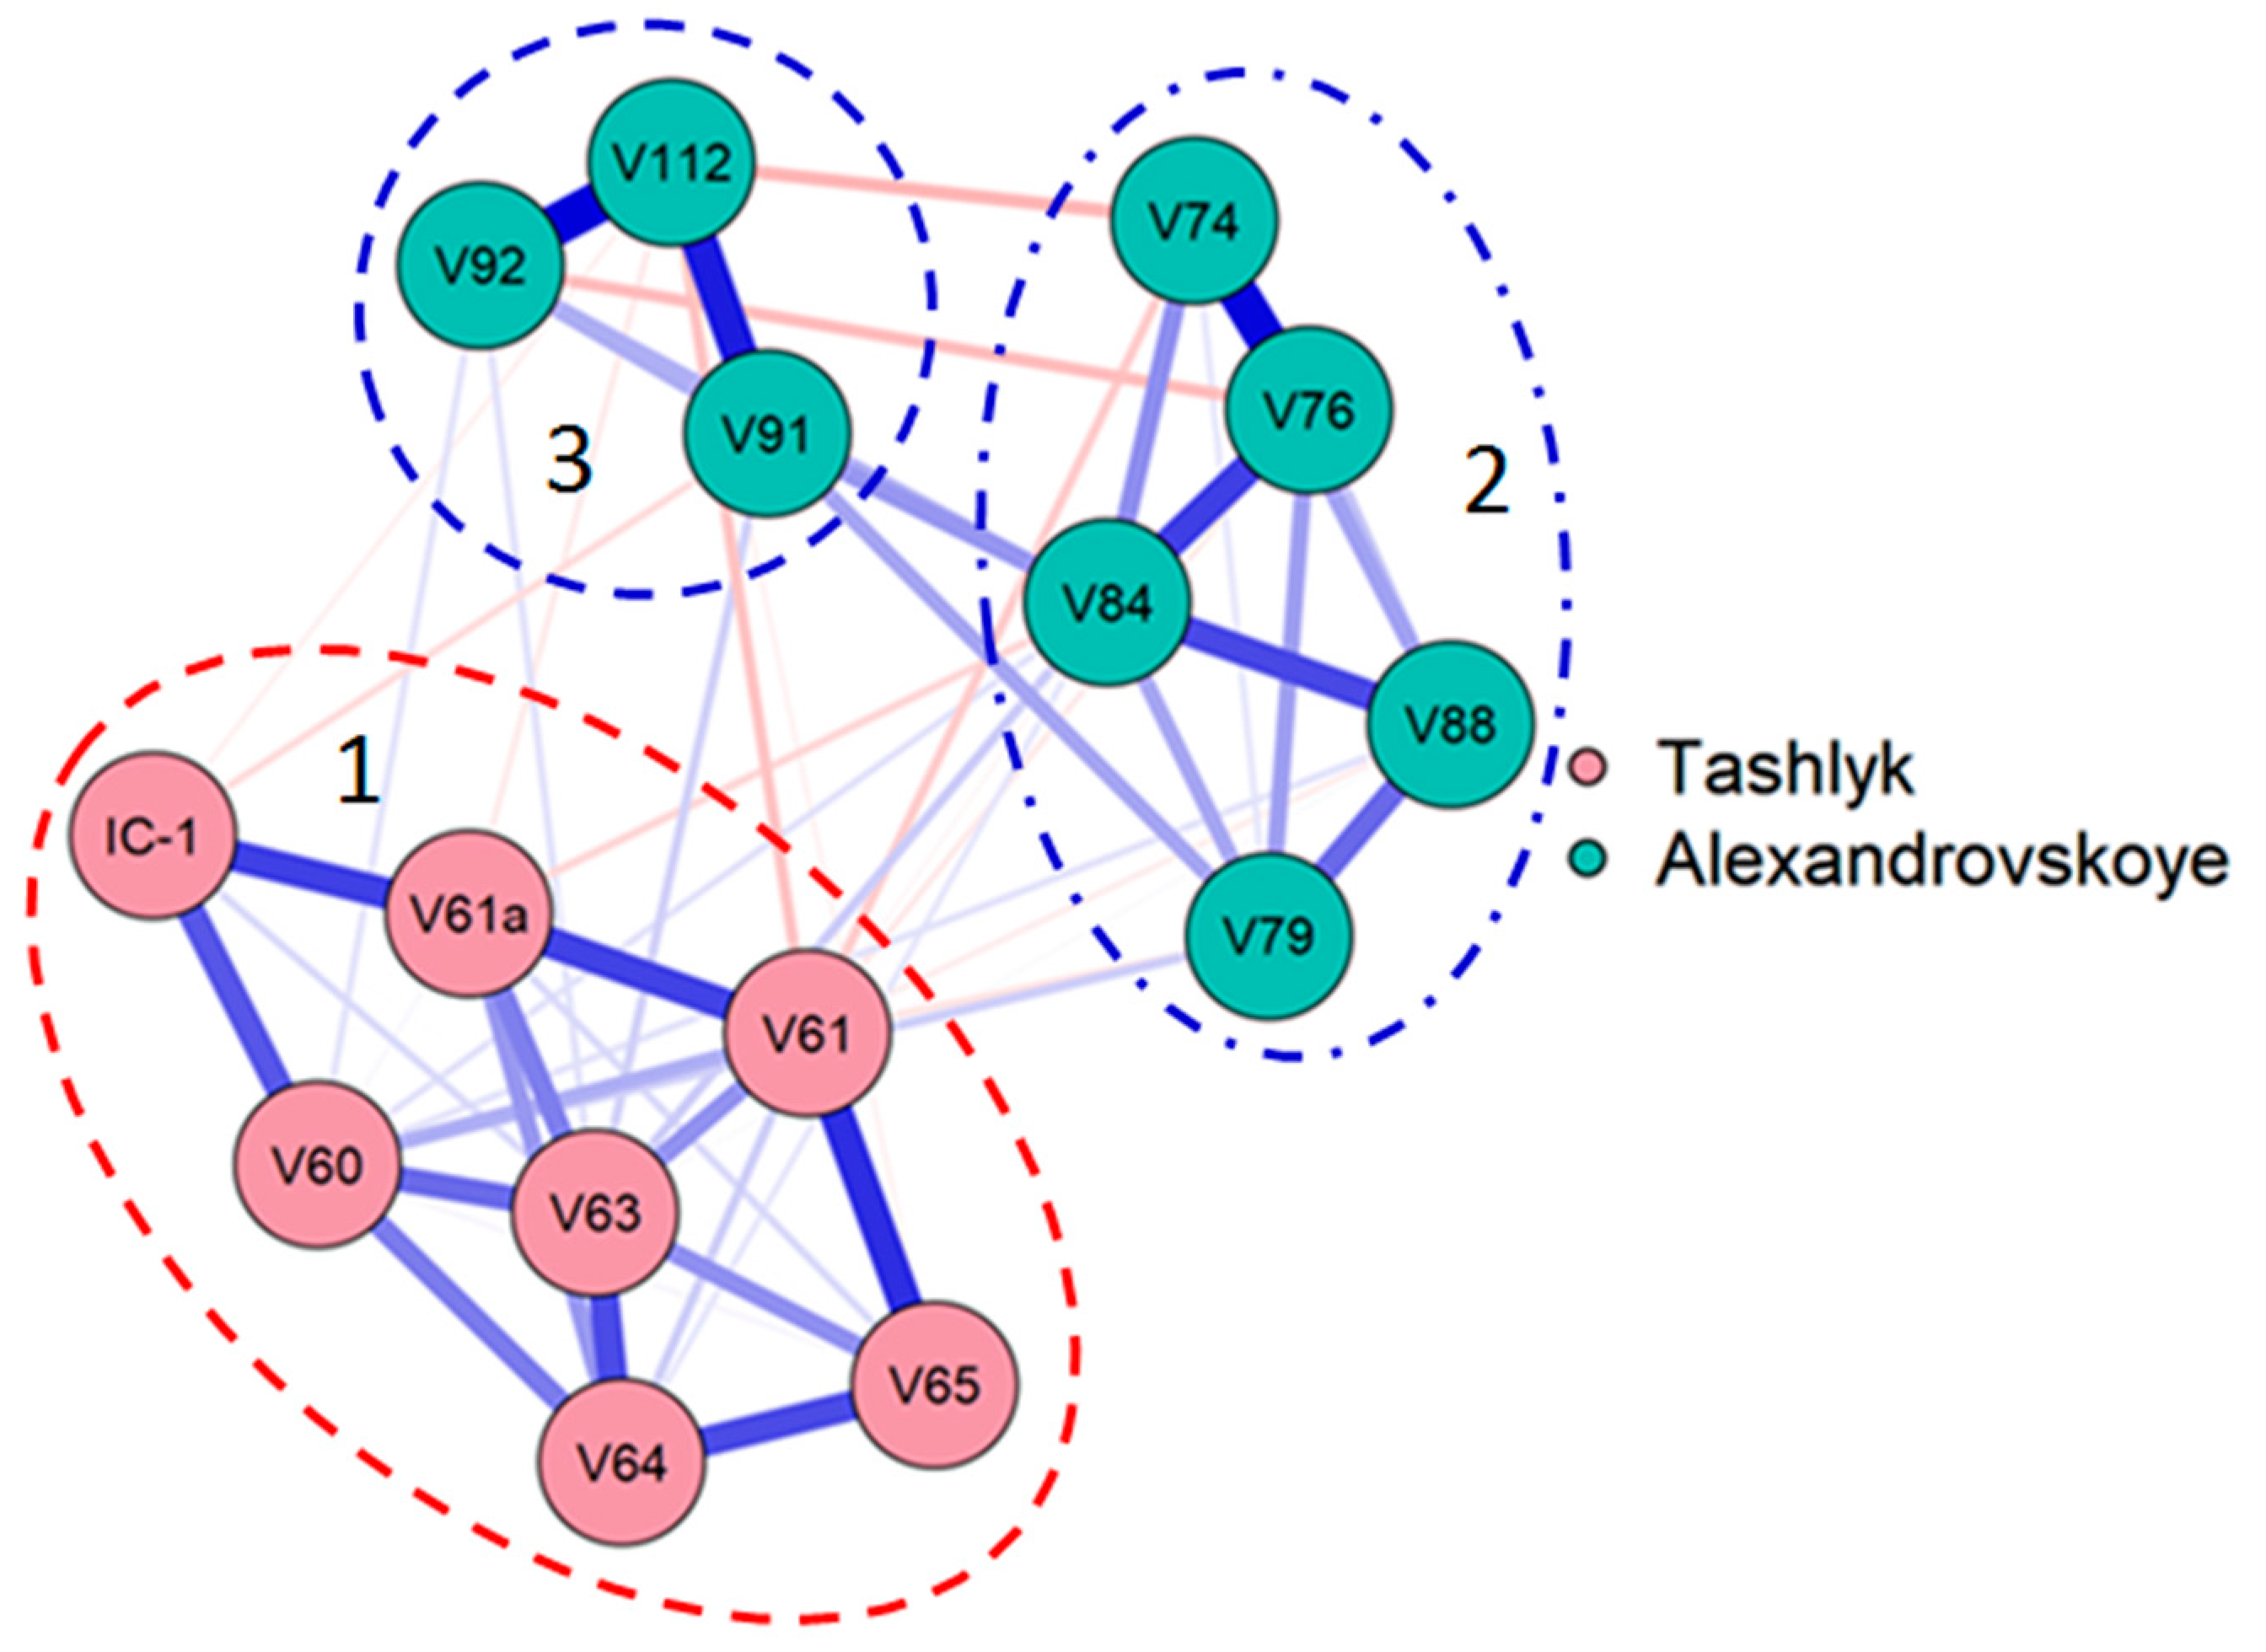
2.4. Statistical Analysis

Mathematical processing of the primary material was performed using the Waco application software package developed at the Institute of Hydrobiology of the National Academy of Sciences of Ukraine [23].
Diversity was evaluated using the Shannon index [24]. Determination of the similarity of phytoplankton lists at stations was carried out using the Sørensen coefficient and the Smirnov’s taxonomic analysis method [24,25]. E.S. Smirnov’s method, developed for taxonomic studies was applied to ecological and faunistic ones [24,25,26,27].
Smirnov’s method also takes into account the frequency of occurrence of a trait, in this case, the frequency of occurrence of a particular species, because similarity in the presence of rare species has more weight than similarity in the presence of commonplace ones. The same applies to similarity in absence. Pairwise comparison of the list of species in the common matrix allows you to quantify the similarity (txy). The calculation of the frequencies of each species makes it possible to assess the originality (txx) of each list of species, phytoplankton composition, in this case, at each research station. The rarer the species in this list and the fewer common ones, the higher the txy originality value. The threshold value is txx = 100.
The calculation of the values of txy (between two LIT lists x and y) and txx (originality of each list) is carried out according to Equation (2):
txx = M/S ((Σp (1/Mi)) + (Σe 1/(M − Mi)) − 1
where M—is the number of compared LIT; Mi—the number of lists containing i-type; S—is the number of all matches of the presence and absence of LIT; Σp—shows that the reciprocal frequencies for the LIT that are present in the two compared two lists are being summed; and Σe—shows the inverse frequencies for the LITs that are absent in the two compared lists, but are present in some other lists from the set M.
Similarity calculation was performed using the BioDiversity Pro 2.0 program [28] and correlation network analyses in JASP on the botnet package in R Statistica package of [29]. Statistical maps were constructed in Statistica 12.0 program on the base of parameter value and GIS coordinates of sampling stations [30]. The statistical mapping method was applied to visualize the distribution of the variables. Statistical maps can be constructed for all available chemical, biological indicators and calculated diversity indices for each reservoir. Maps are drawn for the reservoir surface and outlined by its contour, allowing us to draw into the analysis landscape features and the location of both points and diffuse influencing factors of the catchment basin.
Bioindicator analysis was carried out with the help of species-specific ecological preferences of revealed algae and Cyanobacteria [31,32].

2.5. Saprobity Determination

Saprobity indices [33] were obtained for each algal community as a function of the number of saprobic species and their relative abundances (Equation (3)):
S = i = 1 n ( s i a i ) / i = 1 n ( a i )
where S is index of saprobity for algal community (unitless); si is species-specific saprobity index; and ai is the cell density of each species. The ecosystem state index WESI was calculated for each phytoplankton community based on the classification ranks of the nitrate nitrogen content (if any) and the index of saprobity S of the same station community [34].
Hydrochemistry data are provided by the South Ukraine NPP Ecological and Hydrochemical Laboratory that define them according to [16] at the stations of hydrobiological sampling (Tables S1 and S2).

3. Results

3.1. Characteristics of the Habitat Conditions of Aquatic Organisms

Table 1 presents data on temperature, water transparency, oxygen concentration, pH and depth of the station at which samples were taken. It can be seen that the conditions in the two reservoirs were significantly different, especially the thermal regime. In general, the Tashlyk water was more saturated with calcium, chloride and sodium ions than the Alexandrovskoe water (Tables S1 and S2). The concentration of nitrate nitrogen was the same in both reservoirs, but there were more phosphates and ammonium in Aleksandrovskoye.
Table 1. Data on temperature, transparency, depth of the reservoir at the stations with coordinates, oxygen content and pH at stations taking hydrobiological samples (see Figure 1 and Figure 2). “nd” is not determined.
StationNorthEastTemperature in Surface Horizon, °CTransparency, mOxygen in Surface Horizon, mg O2/dm3Depth at the Station, mpH
Tashlyk Reservoir
6047°48′15.6″31°12′10.9″32.71.57.2830.08.63
61 47°49′12.4″31°12′59.5″34.30.7nd 8.60
61a 47°49′08.87″31°12′59.51″41.2ndnd8.08.64
6347°48′47.6″31°12′30.9″34.50.9nd5.9nd
6447°52′09.2″31°12′49.7″34.11.1nd7.08.77
6547°50′27.6″31°13′26.6″35.40.7nd8.08.67
68a47°49′52.25″31°12′01.55″34.50.85nd1.15nd
Alexandrovskoye Reservoir
7447°48′15.0″31°10′22.9″26.92.38.027.58.35
7647°47′17.1″31°10′43.6″26.32.08.168.08.40
7947°45′45.6″31°11′00.0″26.12.058.328.08.20
8447°44′20.4″31°11′15.8″26.11.658.248.08.25
8847°44′29.2″31°11′40.2″26.11.67.924.58.33
9147°42′44.1″31°11′13.7″27.91.17.686.08.37
9247°42′07.8″31°12′53.7″26.70.77.926.08.35
11247°42′21.0″31°14′44.4″26.70.858.005.48.38

3.2. Study of the Plankton of Reservoirs and the Indicators

In 2018, 73 LIT of microalgae and Cyanobacteria from 7 phyla were found in the phytoplankton of two reservoirs (Table S3). In the Tashlyk reservoir, there were 52 LITs, of which 30 belonged to the Chlorophyta phylum, 15 to Bacillariophyta, 3 to Cyanobacteria and 2 of each to Cryptophyta and Charophyta. In Alexandrovskoye, there are 47 LITs (31—Chlorophyta; 8—Bacillariophyta; 4—Cyanobacteria; 2—Cryptophyta; and 1 Miozoa and 1 Ochrophyta). Common to both reservoirs were 26 LITs (35.6% of the total phytoplankton richness). Of these, 17 are green, 5 are diatoms, 2 are cryptophytic and 2 are Cyanobacteria. Representatives of other phyla were only found in one of the reservoirs. Thus, based on the analysis of the common lists, the composition of phytoplankton was different, since only one third of the encountered taxa were common.
Analysis of the lists of species, taking into account their occurrence according to the Smirnov method [24,25], generally confirmed this conclusion. As a result of the carried-out determinations of the similarity of LITs by lists for individual stations (txy, the maximum values of similarity were taken for each station), it was quite clearly shown that there are positive relationships between the phytoplankton composition at different stations within each reservoir, and an absence of positive relationships between the phytoplankton composition of different reservoirs.
At the same time, certain patterns of similarity of individual stations were established both in the Tashlyk and in the Alexandrovskoye reservoir. In Tashlyk, there was a high positive connection (txy = 34) between stations IC-1 and 61a. Those with the passage of water from the inlet channel through the station aggregates and the outlet channel, the phytoplankton composition changed a little. However, it should be noted that the water intake for cooling is carried out at a depth of about 12 m, while most of the samples were taken in the surface water layer. Assessment of the similarity of phytoplankton at depths from 0 to 30 m at st. 60, 61a and IC-1 showed a rather significant difference in compositions. Small positive relationships were noted between station 61a and IC-1, as well as depths of 20 and 30 m on st. 60. At the same time, a small negative relationship txy = −5 was noted between station IC-1 and 10 m depth. Analysis of Sørensen similarity at depths from 0 to 30 m at st. 60, 61a and IC-1 revealed the presence of maximum relationships between the phytoplankton composition at station 61a and IC-1 and at a depth of 10 m (station 60). This confirms the hypothesis about the similarity of phytoplankton at stations IC-1 and 61a.
The phytoplankton of the rest of the water area in the Tashlyk reservoir was quite similar (txy max values ranged from 22 to 36).
For the Alexandrovskoye reservoir, two groups of stations were distinguished by the similarity of phytoplankton composition: from the upper part (st. 74) downstream to st. 84. The txy values here were from 26 to 49. The second group was also differentiated: from st. 91 to st. 112 in the lower part of the reservoir. The similarity of txy between stations 74–84 was from 21 to 31.
The calculation of the similarity by the Sørensen coefficient between the phytoplankton lists of the two reservoirs showed the absence of significant relationships (less than 0.5). At the same time, comparison between individual stations in each water body revealed a continuum of relationships between phytoplankton communities in Tashlyk. In the Alexandrovskoye reservoir, there are also two groups of phytoplankton that are similar in territorial relation: (1) upper part + middle part and the (2) lower part.
Smirnov’s method makes it possible to assess the originality of the phytoplankton composition at each station (txx). It turned out that the txx value was more than 100 (significant value) in Tashlyk at two out of eight stations, and in Alexandrovskoye at six out of eight stations, which indicates a greater heterogeneity of phytoplankton in the Alexandrovskoye reservoir. The most original were stations 61 in Tashlyk and 88 in Alexandrovskoye where the txx values were 150 and 140, respectively (Figure 3).
A feature of Smirnov’s taxonomic analysis method is that the assessment of the similarity between two stations takes into account the frequency of occurrence of individual LITs, which are considered as signs of stations, similar to those of taxa [24]. The similarity in commonplace species is less significant than the similarity in the presence of rare ones, as is the similarity in the absence of commonplace ones. In this regard, it is advisable to consider the frequency of occurrence of individual LITs.
An analysis of the frequency of occurrence of phytoplankton LITs according to the lists for two water bodies made it possible to assess the banality and/or originality of individual LITs in these water bodies (Table 2).
As can be seen from Table S3, in the general list of algae, as well as in the individual lists for each of the reservoirs, in the surface horizon, LITs prevailed with a frequency of occurrence of up to 25% (Table 2). However, in Tashlyk, the share of commonplace LITs (76–100% of occurrence) was significantly higher. Indirectly, this can be evidenced by the average value of the occurrence: 50.0% in Tashlyk and 31.7% in the Alexandrovskoye reservoir. The frequency of occurrence was associated with originality by a negative correlation (r = −0.69) and, accordingly, was lower on average at the stations with maximum originality. The phytoplankton of the stations with the maximum originality (stations 61 and 88) were characterized by the presence of the most original LITs recorded only at these stations. The LIT composition was as follows: at station 61—Sellaphora mutata, Chlorolobion braunii and Treubaria planctonica; and at station 88—Scenedesmus ellipticus and Tetrachlorella alternans. The phytoplankton of the stations with minimal originality (stations 84 and 68a) did not contain the most original species. At the same time, the most common species, such as Kirchneriella lunaris, Rhodomonas pusilla and Ankistrodesmus arcuatus were recorded at all of the above stations.
Bray–Curtis Cluster Analysis was carried out to compare the distribution of plankton algae at the stations of both reservoirs. At the first stage, we calculated the levels of similarity for the abundance of the entire species composition for all stations. Figure 4 shows that the similarity of communities across the stations of the Tashlyk reservoir is presented in one cluster (1) and separates from the others at the level of 50%. Clusters 2 and 3 unite the communities of the Alexandrovskoye reservoir stations. Moreover, it can be seen that these are two different clusters, which successively combine the stations of the upper (2) and lower (3) sections of the reservoir, that is, they correspond to two different water bodies of the reservoir.
To clarify the revealed difference in the composition and abundance of phytoplankton communities, a correlation analysis was carried out in the Program JASP. Figure 5 shows a network diagram of correlations and it can be seen that the communities of the Tashlyk reservoir have separated from the communities with cluster 1 of the Alexandrovskoye reservoir quite clearly and form their own clusters 2 and 3. At the same time, the communities of the Alexandrovskoye reservoir formed two partially separated clusters corresponding to two different water bodies along the reservoir axis, located from north to south (stations 74–88) as cluster 2, and from west to east (stations 91, 92 and 112) as cluster 3.

3.3. Indicators of Habitat Conditions for Aquatic Organisms

We carried out a bioindicative analysis of phytoplankton lists in relation to the listed factors. The results are presented in Table S3 and summarized in Table 3. The general appearance of the composition of indicator species was highly similar for both reservoirs (R2 = 0.9993; p < 0.00003). However, among the complex of environmental properties indicated by planktonic algae, most similarities were found between the two reservoirs indicators values in temperature, rheophility, salinity and nutrient content (Table 3). Therefore, we conducted a differentiated comparison by groups of indicators for each factor separately.
Figure 6, Figure 7 and Figure 8 show comparative histograms of bioindication results by the number of taxa and nine environmental variables in two reservoirs.
Comparison of the LIT composition of phytoplankton in two reservoirs by phyla shows that, with a certain similarity, the number of diatom LIT was higher in Tashlyk, and charophytic ones were represented, while in Alexandrovskoye, green algae were more developed and Miozoa were represented (Figure 6). The confinement to the type of habitat in the communities of both reservoirs was similar. Water pH indicators in Alexandrovskoye show slightly more alkaline conditions compared to Tashlyk, although in both reservoirs the waters were neutral to slightly alkaline.
Algae indicators of temperature were the smallest group of indicators in both reservoirs and accounted for 17.3% of the richness of the LIT in Tashlyk and 10.6% in the Alexandrovskoye reservoir. The list of indicators was entirely formed by diatoms. In the Tashlyk, and the Alexandrovskoye reservoirs, indicators of the temperature regime were represented mostly by algae preferring moderate temperatures (temp) (Figure 6). Punctastriata lancettula (Schumann) P.B. Hamilton and Siver 2008, a cold-loving species (cool), was recorded at two stations in Tashlyk. All temperature indicators had a frequency of occurrence below 50%.
The most numerous were indicators of hydrodynamic conditions. In Tashlyk, they accounted for 63.5%, and in the Alexandrovskoye reservoir—59.6%. The list of indicators was formed by LITs of four phyla, among which green contain 28 LIT, diatoms 11, Cyanobacteria 2, and ochrophytic 1. The most represented were indicators of slowly moving medium-oxygenated waters (st-str) (55 LIT). There were five indicators of stagnant water, with a weak oxygen saturation (st), aerophiles (aer)—1 (Figure 7). Indicators of stagnant-flowing waters had the maximum range of occurrence (6.25–93.75%), and at each station in both reservoirs, some indicators of low-streaming waters were noted. Indicators st were recorded in both reservoirs, but these were mainly rare species (frequency of occurrence, 6.2–31.2%). Aerophile Merismopedia minima G. Beck 1897 was recorded only in Tashlyk, and at all stations.
Indicators of salinity in the majority of LIT in Tashlyk amounted to 61.5%, in the Alexandrovskoye reservoir—59.6%. Greens prevailed (20 LITs), diatoms accounted for 16 LIT, Cyanobacteria—4 LIT. The most represented were indifferent species (i) (47 LIT), further in the ranking were salt-loving species (hl) (10 LIT), euryhaline (eh) (2 LIT) and mesohalobe (mh) (1 LIT) (Figure 7). Indifferent species were recorded in the composition of phytoplankton at all studied stations in both reservoirs (the frequency of occurrence was in a wide range of 6.25–93.75%), halophiles at all stations in Tashlyk and at seven out of eight stations of the Alexandrovskoey reservoir with a frequency of occurrence of 6.25–62.5%. The euryhaline species Cylindrotheca closterium (Ehrenberg) Reimann & J.C. Lewin 1964 was recorded at several stations (frequency of occurrence of 25%), the mesohalobe Nitzschia reversa W. Smith 1853 was small in number, only recorded at the station in Tashlyk.
The distribution of indicators showed the average level of organic pollution across Watanabe in both reservoirs, but saproxenes were also found in Tashlyk, living in clear waters, while in Alexandrovskoye this group was not represented at all. The water quality classes in terms of saprobity indices and Sládeček self-purification groups showed medium organic pollution, quality Class 3 in both reservoirs based on the significant predominance of indicators of this class (Figure 8).
Algae indicators of trophic state accounted for 61.5% of the phytoplankton richness in Tashlyk and 57.4% in the Alexandrovskoye reservoir. The list of indicators was dominated by greens—23 LITs, diatoms contained by 12 LITs, Cyanobacteria—5 LITs, and Ochrophytes—1. A maximum amount of LITs were indicators of eutrophic waters (e)—31; meso-eutrophic (me)—3; oligotrophic (ot), and oligo-mesotrophic (om) 2 of each; mesotrophic (m), oligo-eutrophic (o-e) and hypertrophic (he) 1 LIT of each (Figure 8). Indicators of eutrophic waters were widespread at all studied stations with a frequency of occurrence of 6.25–93.75%. Representatives of meso-eutrophic waters—at all stations in Tashlyk and at two in the Alexandrovskoye reservoir (occurrence 12.5–56.25%); oligotrophic—at all stations in Tashlyk and in the upper and middle parts of the Alexandrovskoye reservoir (18.75–50%). Indicators of oligo-mesotrophic waters (o-m) were rare species found only at two stations in Tashlyk (6.25–12.5%). Aphanizomenon flosaquae Ralfs ex Bornet and Flahault 1886 (indicator m) was only recorded in the lower reaches of the Alexandrovskoye reservoir (18.75%). Indicators (o-e) Navicula cryptocephala Kützing 1844 and (he) Stephanodiscus subtilis (Goor) A. Cleve 1951 were rare species (occurrence 6.25%).
It should be noted that the relative richness of all indicators in all cases was higher in Tashlyk than in the Alexandrovskoye reservoir. Within each of the ecological groups of indicators, the distribution of LITs was uneven: a subgroup was clearly distinguished, which dominated in both reservoirs, in particular, in the group of temperature indicators—a subgroup of moderate temperatures; indicators of hydrodynamic conditions—a subgroup of indicators of lentic conditions; indicators of salinity—a subgroup of indifferents; and trophic state—subgroup of indicators of eutrophic waters. Indicators of dominant subgroups were noted at all studied stations. The only exception is the smallest group of temperature indicators, but even its representatives are noted at most stations in each of the reservoirs.
Based on the species-specific saprobity indices (Table S3) and the abundance of each indicator species (Table S4), the saprobity indices were calculated for each station of both reservoirs. The average results are presented in Table 4 and Table 5 and show slightly higher organic pollution with a saprobity index of 2.13 in Tashlyk than in Alexandrovskoye, where the index was 2.09. At the same time, both average values corresponded to the Class 3 of water quality. The calculation of the saprobity indices for the stations of each reservoir showed differences in the distribution of organic pollution. Additionally, on this basis and taking into account the data on the amount of nitrate nitrogen (Table S1 and S2), indices of the state of the WESI ecosystem were calculated.
The relationship between the dynamics of the main biological and chemical indicators is shown in Figure 9. Comparison of the species richness and abundance dynamics shows different patterns in each studied reservoir. Figure 9a revealed the impact of the water temperature jump after IC-1 on the abundance of phytoplankton in Tashlyk with a sharp increase in cell numbers. Then, on the lower station 60 this fluctuation is compensated by the water reservoir mass and abundance trend line demonstrated the same tendency as in the species richness. The species richness dynamic in the Alexandrovskoye reservoir has a maximum in the middle part of the reservoir whereas phytoplankton abundance was increased in value towards the lower part of the reservoir (Figure 9b). The saprobity indices in Tashlyk decrease towards the lower part of the reservoir, while in Alexandrovskoye they increase (Figure 9c,d). The trends in the dynamics of nitrates and the WESI index are also opposite, which in both reservoirs shows a high self-purification capacity of phytoplankton, that because WESI having values higher than or equal to one (Figure 9c,d). The temperature jump after the release of warm waters in Tashlyk is shown in Figure 9f and it can be seen that after that the water temperature significantly decreases to values below the higher stations in the upper reaches of the reservoir. However, after the temperature jump in the Alexandrovskoye reservoir, the water temperature turns out to be higher than at the stations preceding the release of warm waters (Figure 9e,f). The Shannon index, which shows the complexity of the community structure, in Tashlyk tends to increase along the reservoir axis, despite the temperature jump, while in Alexandrovskoye it clearly decreases (Figure 9e,f). In both reservoirs, the dynamics of the Shannon indices is opposite to the dynamics of water temperature. This allows us to consider water temperature as one of the main factors affecting phytoplankton in both reservoirs. It is interesting that the complication of the structure of phytoplankton communities is similar to the dynamics of nitrate nitrogen in both reservoirs and is opposite to the indices of saprobity S, that is, organic pollution (Figure 9c,d). In this case, it can be assumed that nitrate nitrogen, as the main component of the trophic base of phytoplankton, probably leads to degradation and simplification of the community structure. The statistical correlation revealed the decrease in the Shannon indices in the gradient of nitrate nitrogen (R2 = 0.63 for Tashlyk and R2 = 0.85 for Alexandrovskoye), which is a negative feature of the ecosystems of both reservoirs.

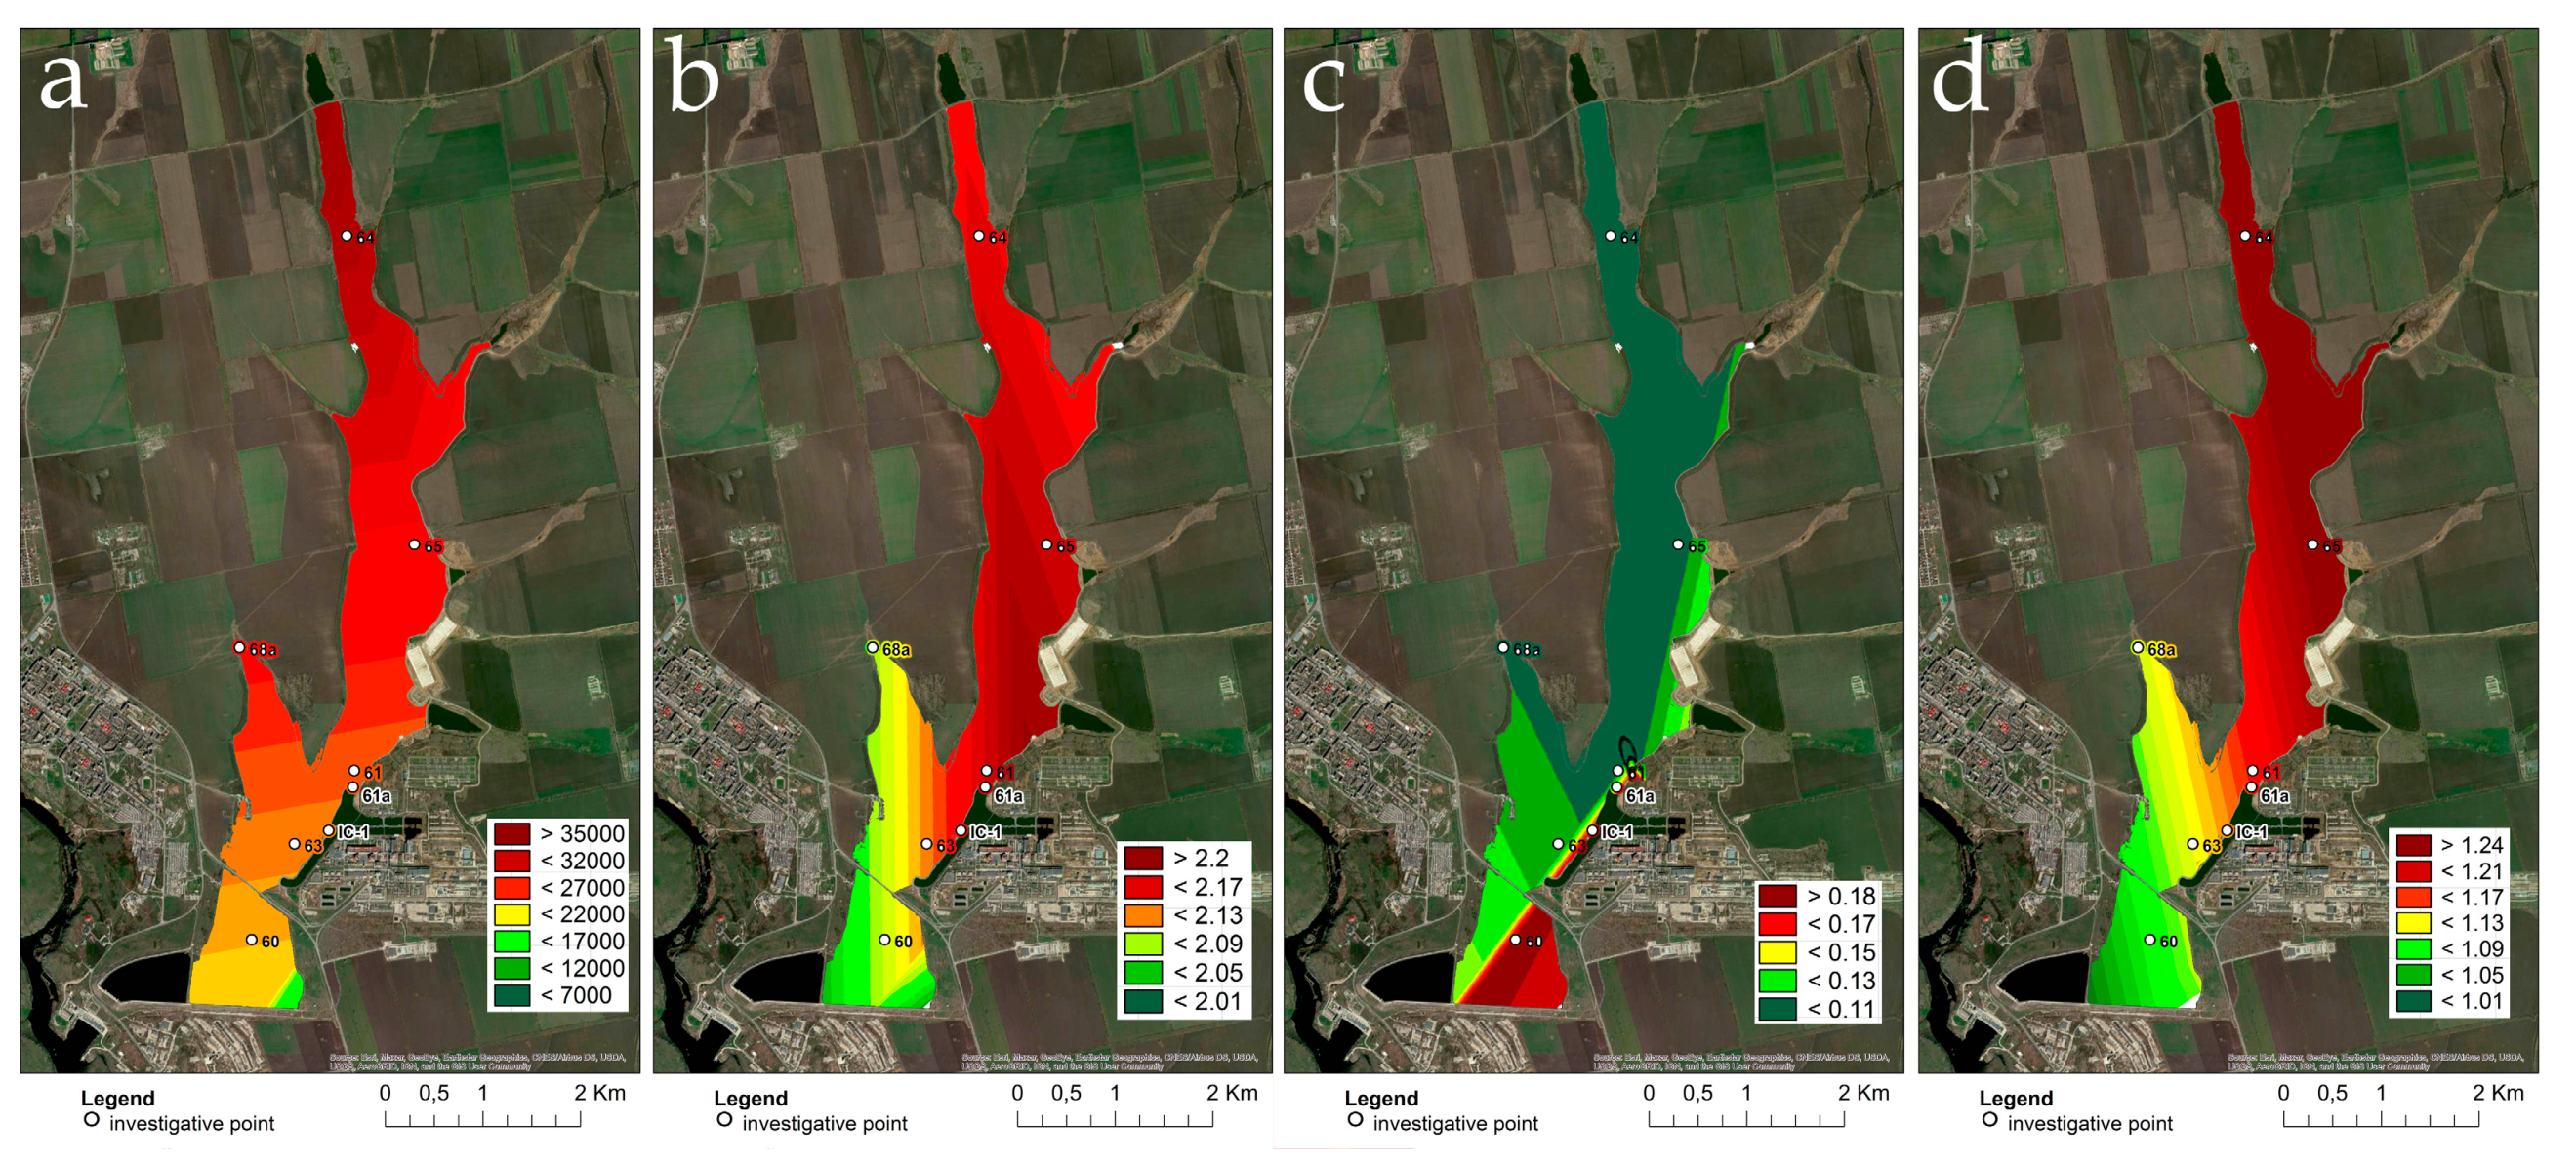
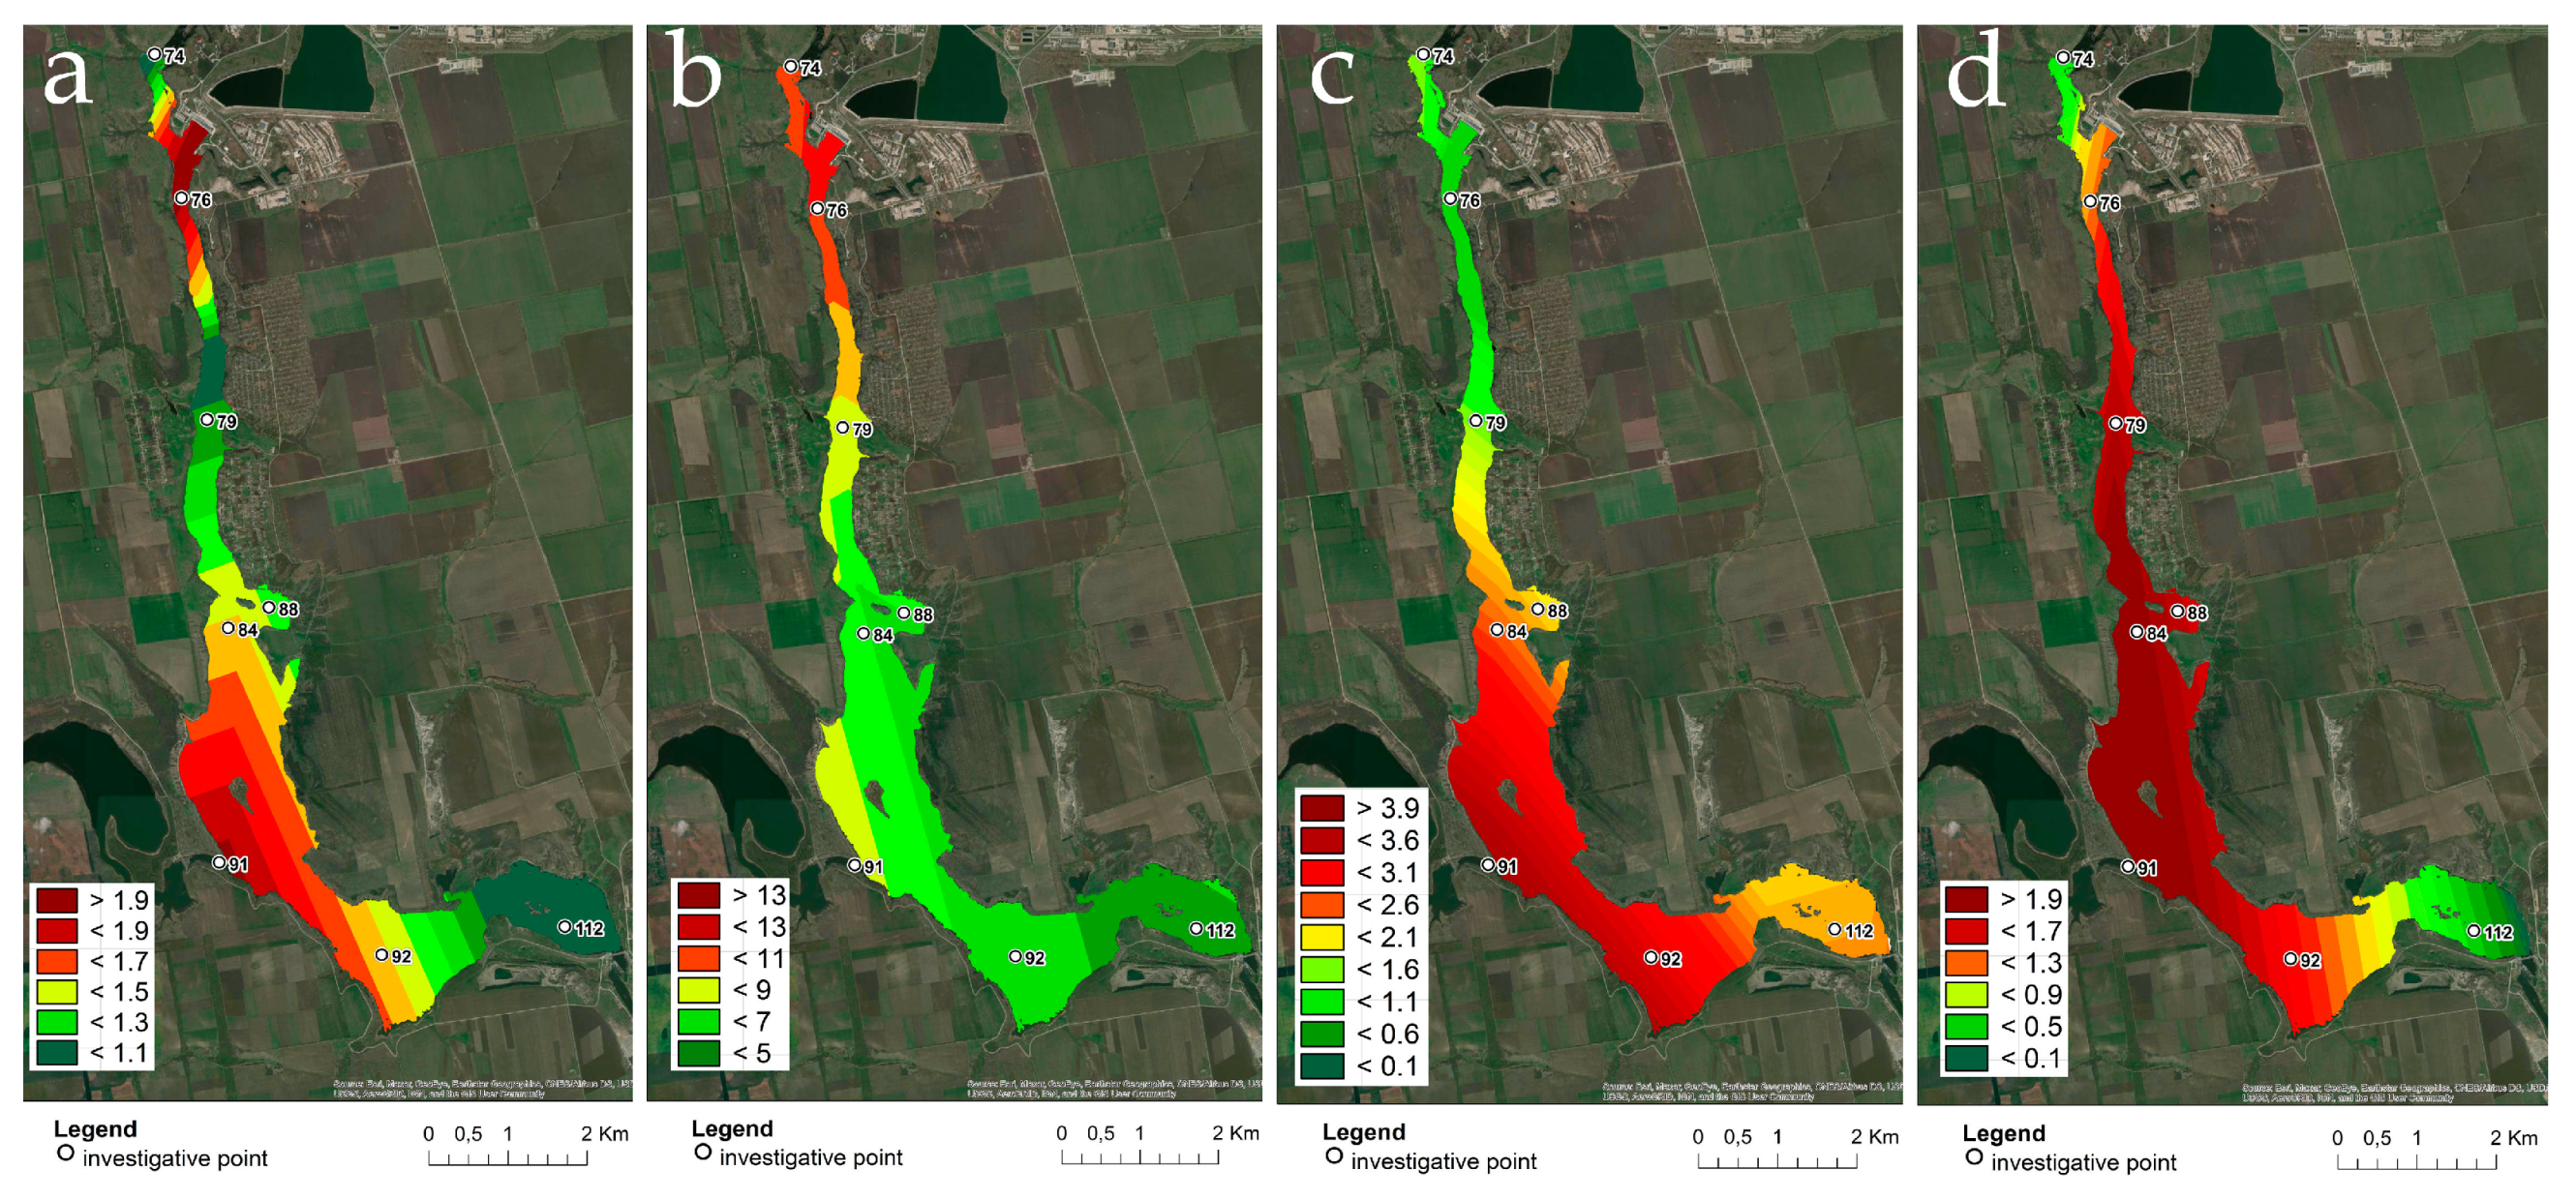
3.4. Statistical Mapping of Major Variables

Visualization of the identified trends can help to identify other implicit relationships in a complex system of mutual influence of indicators in both the reservoirs. For this, the method of statistical mapping was applied. For the current analysis, several maps were selected showing the distribution of the most critical indicators. In addition, maps were drawn for the reservoir surface and outlined by its contour, allowing us to assess both points and diffuse influencing factors of each reservoir catchment basin.
As can be seen on the maps when comparing Figure 10 and Figure 11, the phytoplankton abundance and saprobity index S were higher in the upper reaches and in the middle area opposite the outlet of warm waters in Tashlyk. In Alexandrovskoye, on the contrary, both variables increased in the lower part of the reservoir, which indicates that organic pollution enters from the top of the catchment and spreads to the lower part of the reservoir. A special place is occupied by the distribution of ammonium. In Tashlyk, one can see its outlet immediately after the discharge of warm waters in the dam part (station 60) and in the supply channel (Table S1). Perhaps this is also the cumulative effect of filtration from the Bakshalinskoye reservoir located on the right bank, since it is located upstream, the contact with it is station 91, which is reflected in the maps. At the same time, in Alexandrovskoye, ammonium enriches the waters of the reservoir in the catchment basin opposite station 92 at the lower part of the reservoir, where there is a diffuse runoff from the fields on the right riverbed. The WESI index is also lowered where there is an inflow of pollution from the catchment basin, but its values greater than or equal to one indicate that both ecosystems are successfully coping with the incoming organic pollution.
Due to the heterogeneity of the incoming pollution in both reservoirs, the analysis of the distribution of the species composition in the main phyla over the area of each reservoir was carried out. Comparison of Figure 12 and Figure 13 helps to identify additional sources of impact on lake ecosystems. Therefore, diatoms, among which all were algae indicators (Figure 12a and Figure 13a), indicate the right bank of Tashlyk as a zone of pollution: there is a runoff from treatment facilities, as well as a source of diffuse runoff of organic pollution from fields. Additionally, associated with the position of villages in the upper reaches and a powerful diffuse runoff in the middle right bank of the Alexandrovskoye reservoir, which leads to an active vegetation of diatoms. Green algae, which make up the majority of species in both reservoirs, are stimulated by organic pollution, nutrient runoff entering Tashlyk from its right bank, and in the Alexandrovskoye in its upper part (Figure 12b and Figure 13b). It can be seen that both sources represent a diffuse runoff from the fields or, for Tashlyk, filtration from the Bakshalinskoye reservoir. Cyanobacteria, which are the causative agents of water “blooming” in both reservoirs, increase their species richness immediately after the injection of warm waters and their development continues in the lower part of the reservoirs (Figure 12c and Figure 13c). The distribution of cryptophyte algae, although they were poorly represented in the communities of both reservoirs, is of great importance, since they develop when there is toxic pollution or impact conditions, because they are mixotrophs. Comparison of the distribution of cryptophytes shows (Figure 12d and Figure 13d) that in Tashlyk, the impact is associated with a temperature jump and in Alexandrovskoye it is associated with the impact of runoff from the catchment basin, starting from the village in its upper part.

4. Discussion

The study of plankton microalgae in various technical water bodies was intensively carried out in various climatic zones of Ukraine. Thus, taxonomically rich phytoplankton (386 taxa from 8 phyla) were registered in the Chornobyl cooling pond in the pre-accident period of research. Abundance and biomass fluctuated in the range of 4.4–160.6 million cells/dm3 and 1.1–18.3 mg/dm3 in 1980–1984 [6]. Long-term studies of the Khmelnitsky NPP cooling pool (1998–2019) showed that the total level of phytoplankton species richness over the entire period of research was high (383 taxa from 8 phyla), but it fluctuated significantly over time. These changes and changes in abundance and biomass (0.022–192.8 million cells/dm3 and 0.009–1134.5 mg/dm3) were associated with an increase in the power plant’s capacity and development of a filter-feeding mollusk Dreissena polymorpha. Invasion of it in the reservoir can have a more significant impact on the reservoir ecosystem than even technogenic factors [5,6,7,35,36,37]. Altogether 259 taxa from 7 phyla were recorded in phytoplankton during 1974–1976 with an abundance of 0.5–41.3 million cells/dm3 and biomass 0.08–39.4 mg/dm3 in the Ladyzhinsky reservoir. It is located, similar to Aleksandrovskoye, on the Southern Bug River and used in a complex: as a cooler for a thermal power plant and as a reservoir for a hydroelectric power plant. [6,7,38]. Green and diatom algae mainly formed the composition of the phytoplankton of the listed reservoirs.
As for reservoirs with a natural temperature regime, the phytoplankton of the Dnieper and its reservoirs have long research history in Ukraine. According to [39], during the studies in 1917–1987, different authors studying the phytoplankton of the Dnieper and its water bodies found 1488 LIT of algae from 10 phyla. In some reservoirs, the phytoplankton LIT richness varied from 190 to 782 taxa.
In general, the flora of algae in Ukraine has 6583 taxa from 15 phyla and is one of the richest in Europe [32]. However, the distribution of species richness according to the algofloristic provinces is uneven. The most affluent composition of algoflora (2776 taxa) in Ukraine is characterized by the Middle Dnieper algofloristic subprovince, which includes the Dnieper basin [40]. The Dnieper–Black Sea subprovince, on the territory of which Tashlyk and Aleksandrovskoe reservoirs are located, has 2183 taxa of algae. It should be noted that in the phytoplankton of Tashlyk and Aleksandrovskoye reservoirs as in the phytoplankton composition of the Dnieper reservoirs and the algoflora of Ukraine as a whole, green and diatom algae are dominant in the floristic spectrum. However, in the phytoplankton of the Tashlyk and Aleksandrovskoye reservoirs, the role of green algae in the general list is almost three times higher than in the list of algae in Ukraine and one and a half times higher than in the phytoplankton of the Dnieper reservoirs.
In Ukraine, studies using the bioindication properties of phytoplankton have been carried out since the 1920s. They mainly focused on using the saprobic values of algae and calculating the saprobic index of the community. Currently, bioindication is also used for other environmental indicators and for assessing the state of aquatic ecosystems [32].
The use of bioindication by phytoplankton in studies of such specific water bodies as cooling water bodies developed in the same direction as hydrobiological research in Ukraine as a whole. The phytoplankton of heated water bodies has its own characteristics. Its richness and composition in cooling ponds does not differ significantly from the algal flora of the region; however, a lower taxonomic diversity is noted than in unheated reservoirs [41], where the distribution of species by phyla is more even [7]. In the seasonal aspect, there is a significant increase in the growing season, while the usual seasonal cyclical development of phytoplankton remains. The influence of various technogenic factors on phytoplankton is not always unambiguous. There is evidence of a significant suppression of the development of phytoplankton and its individual components in cooling ponds, but also a stimulating effect [7,42,43,44,45].
It should be noted that there is also Ladyzhinskoe reservoir on the Southern Bug River, 200 km upstream from Alexandrovskoye. Quite similar to the Alexandrovskoye (area is 20.8 km2, length 17 km), Ladyzhinskoe was also initially created as a reservoir for a hydroelectric power plant [6]. However, a large thermal power plant is located on the shore of this reservoir; therefore, the Ladyzhinskoye reservoir also performs the functions of a cooling reservoir (as if it were possible to combine the Tashlyk and Alexandrovskoye reservoirs). As a result of the heated discharges of the thermal power plant, the water temperature can increase in calm weather by 2 °C in the water area of 14 km2 (67% of the area). A very thorough study of the ecosystem of the Ladyzhinskoye reservoir, in particular phytoplankton [38], showed that its composition is rich (259 species of algae), while in the zone of influence of the heated wastewaters there is a greater richness than in the zone with natural temperature (240 species versus 195). The phytoplankton biomass in the area of the heated water discharge in spring was higher than that in the unheated zone: 10.6 mg/dm3 versus 5.8 mg/dm3.
Taking into account the results we obtained in this study, as well as the data of other studies, we can pose the following question, which seems essential to us: are there opportunities, and what, with the help of technical means, to mitigate the negative consequences of climate change? It can be hypothesized that technogenic hydrodynamic factors in a certain way neutralize the adverse effects of an increase in temperature, of course, if the chemical pollution of water bodies does not increase.
Previously studied phytoplankton in the Southern Bug River itself demonstrated rather a fluctuation in the ecosystem response to the organically polluted diffuse and direct inflow from the catchment basin over the all-river canal [46,47,48]. Thus, the properties of the drainage basin play an important role in the formation of the diversity of aquatic ecosystems of the receiving water bodies in Ukraine [49,50]. However, the methods for assessing this impact are still at an early stage [30]. Previously, it was possible to reveal the sources and strength of the influence of various parts of the basin using statistical mapping, even with a high levelling of reservoir indicators [51], in particular, the water temperature impact [52]. Thus, statistical ecological mapping has already become one of the innovative methods of ecosystem services [53].
The two investigated reservoirs have, in accordance with the nature of their operation, different designs and different conditions for the habitation of aquatic organisms, in particular plankton microalgae. It should be noted that with a significantly greater technogenic impact, primarily in terms of thermal regime, the total phytoplankton richness did not differ significantly. The temperature of the water plays a major role in the diversity of aquatic inhabitants [54] as was revealed for the Southern Bug River phytoplankton [55]. Temperature impact to cooling pool community can affect different levels of diversity and radically change the community structure [56,57]. As evidenced by the data obtained and the results of the analysis, even at such high values of water temperature in the Tashlyk reservoir, phytoplankton continues to remain sufficiently rich in composition. However, it should be taken into account that technogenic circulation creates constant mixing, including sufficiently deep layers of water (the NPP has a deep water intake and surface discharge), which leads to the enrichment of deep water layers with oxygen and prevents the development of hypoxia. In the case that, due to climatic changes, the water temperature in the South Bug River and the Alexandrovskoye reservoir will increase, a significant deterioration in the oxygen regime is possible. This can lead to such a phenomenon such as the redesorption of biogenic substances from bottom sediments, which, with a slower flow of water from the catchment basin, will lead to an increase in the “blooming” of water, a general deterioration in the ecological state of the reservoir and a decrease in water quality.
The use of the bioindication methodology made it possible to establish important regularities, on the basis of which two water bodies were compared, which significantly differed in design and operation. The absence of thermophilic algae in the cooling pond turned out to be quite unexpected. In both reservoirs, mainly indicators of moderate temperatures (tolerant to a wide range of temperatures) were observed. The spatial distribution of plankton microalgae in the Alexandrovskoye reservoir was quite predictable, since the elements of the river regime were still preserved in its upper part, and the lower part is the lenticular part. In accordance with this, the greatest amount of algae “blooming” was noted precisely in the lower dam part of the reservoir. However, the distribution of microalgae in the Tashlyk reservoir was difficult to predict, as it has complex hydrodynamics. Previously, the long-term dynamics of diversity and phytoplankton in natural protected lakes was traced, and it turned out that the impact of organic pollution from the catchment basin can compete with climate change and the impact of temperature on aquatic ecosystems [42,58,59]. However, in both reservoirs, the role of organic pollution runoff from the catchment basin in the formation of phytoplankton communities was revealed, which should be taken into account when making decisions regarding the intensity of the operating regime [60,61] because the aquatic diversity can be impacted [62,63]. It should be emphasized that it was precisely the study of the composition and similarity of phytoplankton that made it possible to establish quite definitely that the deep layers of water in this reservoir interact quite well with the surface ones. Moreover, this vertical component of the internal water exchange maintains a relatively satisfactory ecological state of the reservoir under a significant anthropogenic load.

5. Conclusions

The two investigated reservoirs have, in accordance with the nature of their operation, different designs and different conditions for the habitation of aquatic organisms, in particular plankton microalgae. It should be noted that with a significantly greater technogenic impact, primarily in terms of thermal regime, the total phytoplankton richness did not differ significantly. The Alexandrovskoye reservoir has a “classical” design: closer to the dam, the flow rate decreases, the depth increases, whereas the upper part has the character of a river channel. While in Tashlyk, there is no constant discharge of water through the dam, there is an intensive internal water exchange due to the flow of water for cooling the nuclear power plant and the discharge of heated water. This discharge creates a high temperature zone in the middle part of the reservoir. These features of the conditions determine the nature of the development of plankton algae in water bodies. Using algae as indicators of conditions, it was possible to identify the features of the ecosystems to establish the degree of anthropogenic influence. The results obtained also allow us to make some comments on the possible impact of the current changes in climatic conditions. It should be taken into account that technogenic circulation creates constant mixing, including sufficiently deep layers of water (the NPP has a deep water intake and surface discharge), which leads to the enrichment of deep water layers with oxygen and prevents the development of hypoxia. If, due to climatic changes, the water temperature in the reservoirs increases, a significant deterioration of the oxygen regime will be possible. It can lead to the redesorption of nutrients from bottom sediments, which, with a slow runoff, will lead to an increase in the “blooming” of water and a general deterioration of the ecological state of the reservoir.

Supplementary Materials

The following supporting information can be downloaded at: https://0-www-mdpi-com.brum.beds.ac.uk/article/10.3390/ecologies3020009/s1, Table S1: Hydrochemical variables at the research stations of the Tashlyk reservoir. Table S2: Hydrochemical variables at the research stations of the Alexandrovskoye reservoir. Table S3: Table of microalgae taxa with average abundance in the Tashlyk and Alexandrovskoye reservoirs with species-specific ecological preferences. Table S4: Distribution of microalgae species abundance (thousand cells in dm3) in phytoplankton over sampling stations in the Tashlyk and Alexandrovskoye reservoirs.

Author Contributions

Conceptualization, A.P. and S.B.; methodology, A.P. and S.B.; software, S.B.; validation, A.P., T.N. and S.B.; formal analysis, T.N. and S.B.; investigation, T.N. and A.P.; resources, A.P.; data curation, A.P.; writing—original draft preparation, A.P., T.N. and S.B.; writing—review and editing, A.P., T.N. and S.B.; visualization, S.B.; supervision, A.P.; project administration, A.P. All authors have read and agreed to the published version of the manuscript.

Funding

This research received no external funding.

Institutional Review Board Statement

Not applicable.

Informed Consent Statement

Not applicable.

Data Availability Statement

Not applicable.

Acknowledgments

The authors are grateful to the management of the Yuzhno-Ukrainian NPP for their assistance in organizing research on the reservoirs of the power complex. This work was partly support by the Israeli Ministry of Aliyah and Integration.

Conflicts of Interest

The authors declare no conflict of interest.

References

  1. Protasov, A.A. Several Aspects of Application and Optimization of EU Water Framework Directive Approaches in View of Assessment of Ecological State of Technoecosystem. Hydrobiol. J. 2018, 54, 55–68. [Google Scholar] [CrossRef]
  2. Uzunov, Y.I.; Protasov, A.A. Concept of Ecosystem Services as Applied to Water Technoecosystems. Hydrobiol. J. 2019, 55, 3–17. [Google Scholar] [CrossRef]
  3. Protasov, A.A. Paradigm shift in technical hydrobiology: From local impact, to a new water techno-ecosystem concept for thermal and nuclear power plants. Ecosyst. Transform. 2021, 4, 3–9. [Google Scholar] [CrossRef]
  4. Hydropower and the Environment; Landau, Y.; Sirenko, L. (Eds.) Libra: Kiev, Ukraine, 2004; 484p. [Google Scholar]
  5. Protasov, A.A.; Semenchenko, V.P.; Silaeva, A.A.; Timchenko, V.M.; Buzevich, I.Y.; Guleikova, L.V.; Dyachenko, T.N.; Morozova, A.A.; Yurishinets, V.I.; Yarmoshenko, L.P.; et al. NPP Technoecosystem. Hydrobiology, Abiotic Factors, Environmental Assessments; Institute of Hydrobiology NAS of Ukraine: Kyiv, Ukraine, 2011; p. 234. (In Russian) [Google Scholar]
  6. Protasov, A.A.; Sergeeva, O.A.; Kosheleva, S.I.; Kaftannikova, O.G.; Lenchina, L.G.; Kalinichenko, R.A.; Vinogradskaya, T.A.; Novikov, B.I.; Afanasyev, S.A.; Sinitsyna, O.O. Hydrobiology of Cooling Ponds of Thermal and Nuclear Power Plants in Ukraine; Naukova Dumka: Kyiv, Ukraine, 1991; 192p. (In Russian) [Google Scholar]
  7. Novoselova, T.N.; Protasov, A.A. Phytoplankton of cooling ponds of techno-ecosystems of nuclear and thermal power stations (a review). Hydrobiol. J. 2015, 51, 37–52. [Google Scholar] [CrossRef]
  8. Karataev, A.Y. The Effect of Heating on Freshwater Ecosystems; Dep at VINITI No. 2440—B90; Bulletin of the Belarusian University: Minsk, Republic of Belarus, 1990; 133p. (In Russian) [Google Scholar]
  9. Mordukhai-Boltovskoy, F.D. The problem of the influence of thermal and nuclear power plants on the hydrobiological regime of water bodies (review). Tr. Inst. Biologii Vnutr. Vod AN SSSR 1975, 27, 7–69. [Google Scholar]
  10. Protasov, A.A. Concept of Techno-Ecosystem in Technical Hydrobiology. Hydrobiol. J. 2014, 50, 3–15. [Google Scholar] [CrossRef]
  11. Elliot, J.M. Some aspects of thermal stress on freshwater teleosts. In Stress in Fish; Academic Press: London, UK, 1981; pp. 209–241. [Google Scholar]
  12. Novoselova, T.N.; Sylaieva, A.A.; Gromova, Y.F.; Menshova, T.I.; Morozovskaya, I.A.; Protasov, A.A. Technoecosystem of the cooling pond of the South Ukrainian Nuclear Power Plant: Group dynamics and transformation. Ecosyst. Transform. 2020, 3, 40–54. Available online: https://cyberleninka.ru/article/n/technoecosystem-of-the-cooling-pond-of-the-south-ukrainian-nuclear-power-plant-group-dynamics-and-transformation (accessed on 1 May 2022). [CrossRef]
  13. Sergeeva, O.A.; Kalinichenko, R.A.; Kosheleva, S.I.; Lenchina, L.G. Chemical composition of water and plankton of the cooling pond of the South Ukrainian NPP. Hydrobiol. J. 1988, 24, 8–14. (In Russian) [Google Scholar]
  14. Lisichenko, G.; Shteinberg, M.; Chumak, D.; Prokip, A.; Shutyak, S.; Maskalevich, I.; Vasilkivskiy, B. The Ukrainian Nuclear Industry: Expert Review; Bellona: Oslo, Norway, 2017; p. 115. [Google Scholar]
  15. Aleksienko, V.R.; Boychenko, S.G.; Bougera, M.A.; Buynovskaya, N.A.; Bulgakov, V.P.; Varlamov, E.M.; Verhovtsev, V.G.; Virich, P.M.; Dudar, T.V.; Zholudenko, O.O.; et al. Comprehensive Geo-Ecological Monitoring of the Impact Zone of the Tashlyk Hydroaccumulation Power Plant and the Oleksandrovsk Reservoir: 1998–2016; Naukova Dumka: Kyiv, Ukraine, 2017; 360p. (In Ukrainian) [Google Scholar]
  16. Arsan, O.M.; Davydov, O.A.; Dyachenko, T.M.; Yevtushenko, M.Y.; Zhukinsky, V.M.; Kirpenko, N.I.; Kipnis, L.S.; Klenus, V.G.; Konovets, M.I.; Linnik, P.M.; et al. Methods of Hydrobiological Studies of Surface Waters; Logos: Kyiv, Ukraine, 2006; 408p. (In Ukrainian) [Google Scholar]
  17. Topachevsky, A.V.; Masyuk, N.P. Freshwater Algae of the Ukrainian SSR; High school: Kyiv, Ukraine, 1984; p. 336. (In Russian) [Google Scholar]
  18. Kumsare, A.Y. Calculation of biomass of phytoplankton in the total volume of cells. In Fishery in the Latvian SSR; Zinatne: Riga, Latvia, 1963; Volume 7, pp. 67–73. (In Russian) [Google Scholar]
  19. Kuzmin, G.V. Phytoplankton. In Methodology for Studying Biogeocenoses of Inland Water Bodies; Nauka: Moscow, Russia, 1975; pp. 73–78. (In Russian) [Google Scholar]
  20. Bakanov, A.I. Using the characteristics of zoobenthos diversity for monitoring of the state of freshwater ecosystems. In Monitoring of Biodiversity; Borok: Moscow, Russia, 1997; pp. 278–282. (In Russian) [Google Scholar]
  21. Vidal, T.; Calado, A.J.; Moita, M.T.; Cunha, M.R. Phytoplankton dynamics in relation to seasonal variability and upwelling and relaxation patterns at the mouth of Ria de Aveiro (West Iberian Margin) over a four-year period. PLoS ONE 2017, 12, e0177237. [Google Scholar] [CrossRef]
  22. Guiry, M.D.; Guiry, G.M.; AlgaeBase. World-Wide Electronic Publication, National University of Ireland, Galway. Available online: http://www.algaebase.org (accessed on 19 September 2021).
  23. Protasov, A.A.; Sinitsina, O.O.; Kolomiets, A.V. Use of the WaCo (Water Communities) package to process the hidrobiological samples and create the databases on zoology and algology (FoxPro). Trudy Zool. Inst. RAN 1999, 278, 132. [Google Scholar]
  24. Pesenko, Y.A. Principles and Methods of Quantitative Analysis in Faunal Studies. Nauka: Moscow, Russia, 1982; 287p. (In Russian) [Google Scholar]
  25. Smirnov, E.S. Taxonomic analysis of a genus. Zhurnal Obs. Biol. 1960, 21, 89–103. (In Russian) [Google Scholar]
  26. Rasnitsyn, S.P. Application of taxonomic analysis to compare biotopes by their fauna and population. Zhurnal Obs. Biol. 1966, 26, 335–340. (In Russian) [Google Scholar]
  27. Huhta, V. Evaluation of different similarity indeces as measures of succession in arthropod communities. Oecologia 1979, 41, 11–23. [Google Scholar] [CrossRef] [PubMed]
  28. Mc Aleece, N.; Lambsshead, P.; Paterson, G.; Gage, J. Biodiversity Professional V2.0; The Natural History Museum and the Scottish Association for Marine Science: Oban, UK, 1997. [Google Scholar]
  29. Love, J.; Selker, R.; Marsman, M.; Jamil, T.; Dropmann, D.; Verhagen, A.J.; Ly, A.; Gronau, Q.F.; Smira, M.; Epskamp, S.; et al. JASP: Graphical statistical software for common statistical designs. J. Stat. Softw. 2019, 88, 1–17. [Google Scholar] [CrossRef] [Green Version]
  30. Barinova, S. Ecological Mapping in Application to Aquatic Ecosystems BioIndication: Problems and Methods. Int. J. Environ. Sci. Nat. Resour. 2017, 3, 36–42. [Google Scholar] [CrossRef] [Green Version]
  31. Barinova, S. Essential and practical bioindication methods and systems for the water quality assessment. Int. J. Environ. Sci. Nat. Resour. 2017, 2, 90–93. [Google Scholar] [CrossRef]
  32. Barinova, S.S.; Bilous, O.P.; Tsarenko, P.M. Algal Indication of Water Bodies in Ukraine: Methods and Perspectives; University of Haifa Publisher: Kiev, Ukraine; Haifa, Izrael, 2019; 367p. [Google Scholar]
  33. Sládeček, V. Diatoms as indicators of organic pollution. Acta Hydroch. Hydrobiol. 1986, 14, 555–566. [Google Scholar] [CrossRef]
  34. Barinova, S. On the Classification of Water Quality from an Ecological Point of View. Int. J. Environ. Sci. Nat. Res. 2017, 2, 555581. [Google Scholar] [CrossRef]
  35. Karatayev, A.; Burlakova, L.; Padilla, D. Impacts of Zebra mussels on aquatic communities and their role as ecosystem engineers. In Invasive Aquatic Species of Europe. Distribution, Impacts and Management; Kluwer Academic Publishers: Dordtrecht, The Netherlands; Boston, MA, USA; London, UK, 2002; pp. 433–446. [Google Scholar]
  36. Mellina, E.; Rasmussen, J.B.; Mills, E.L. Impacts of Zebra mussels (Dreissena polymorpha) on phosphorus cycling and chlorophyll in lakes. Can. Fish. Aquat. Sci. 1995, 52, 2553–2573. [Google Scholar] [CrossRef]
  37. Turner, C.B. Influence of zebra (Dreissena polymorpha) and quagga (Dreissena rostriformis) mussel invasions on benthic nutrient and oxygen dynamics. Can. Fish. Aquat. Sci. 2010, 67, 1899–1908. [Google Scholar] [CrossRef]
  38. Pikush, N.V.; Kosheleva, S.I.; Lenchina, L.G.; Vinogradskaya, T.A.; Grin, V.G.; Polivannaya, M.F.; Sergeeva, O.A.; Kaftannikova, O.G.; Kititsyna, L.A. Cooling Pond of Ladyzhinskaya TPP; Naukova Dumka: Kyiv, Ukraine, 1978; p. 132. (In Russian) [Google Scholar]
  39. Sirenko, L.A.; Korelyakova, I.L.; Mikhailenko, L.E.; Kostikova, L.E.; Litvinova, M.A.; Myslovich, V.O.; Skorik, L.V.; Khoroshikh, L.A.; Shcherbak, V.I.; Yakubovsky, A.B.; et al. Vegetation and Bacterial Population of the Dnieper and Its Reservoirs; Naukova Dumka: Kyiv, Ukraine, 1989; p. 232. [Google Scholar]
  40. Palamar-Mordvintseva, G.M.; Tsarenko, P.M. Algofloristic zoning of Ukraine. Int. J. Algae 2015, 17, 303–338. [Google Scholar] [CrossRef]
  41. Klochenko, P.; Shevchenko, T.; Barinova, S.; Tarashchuk, O. Assessment of the ecological state of the Kiev Reservoir by the bioindication method. Oceanol. Hydrobiol. Stud. 2014, 43, 228–236. [Google Scholar] [CrossRef]
  42. Sosnowska, J. Wpływ zrzutu wód podgrzanych na fitoplankton niektórych jezior koło Konina [Effect of heated effluents on the phytoplankton in some lakes near Konin]. Roczn. Nauk Roln H 1988, 101, 9–130. (In Polish) [Google Scholar]
  43. Socha, D. Zmiany Jakości Wody I Trofii Podgrzanych Jezior Konińskich; Konin: Warszawa, Poland, 1997; p. 72 S. [Google Scholar]
  44. Brungs, W.A. Effects of heated water from nuclear plants on aquatic life. In Nuclear Power and the Public; Foreman, H., Ed.; University of Minnesota Press: Minneapolis, MN, USA, 1970; pp. 52–59. [Google Scholar]
  45. Berry, P.S. Power system facilities: Their impact upon ecology. In Proceedings of the Power Plant Siting: Its Impact on System Planning and the Environment: Presented at the Summer Meeting, Portland, OR, USA, 22 July 1971; pp. 13–16. [Google Scholar]
  46. Bilous, O.; Barinova, S.; Klochenko, P. Phytoplankton communities in ecological assessment of the Southern Bug River upper reaches (Ukraine). Ecohydrol. Hydrobiol. 2012, 12, 211–230. [Google Scholar] [CrossRef]
  47. Bilous, O.; Barinova, S.; Klochenko, P. The role of phytoplankton in the ecological assessment of the Southern Bug River middle reaches (Ukraine). Fundam. Appl. Limnol. 2014, 184, 277–295. [Google Scholar] [CrossRef]
  48. Belous, Y.P.; Barinova, S.S.; Klochenko, P.D.; Zhezherya, V.A.; Zhezherya, T.P.; Nesbritskaya, I.N. Phytoplankton of the Lower Section of the Southern Bug River as the Index of Its Ecological State. Hydrobiol. J. 2016, 52, 19–31. [Google Scholar] [CrossRef]
  49. Bilous, O.P.; Wojtal, A.Z.; Ivanova, N.O.; Tsarenko, P.M.; Burova, O.V.; Barinova, S. Benthic Diatom Composition in Coastal Zone of Black Sea, Sasyk Reservoir (Ukraine). Diversity 2020, 12, 458. [Google Scholar] [CrossRef]
  50. Tsarenko, P.M.; Bilous, O.P.; Kryvosheia-Zakharova, O.M.; Lilitska, H.H.; Barinova, S. Diversity of Algae and Cyanobacteria and Bioindication Characteristics of the Alpine Lake Nesamovyte (Eastern Carpathians, Ukraine) from 100 years Ago to the Present. Diversity 2021, 13, 256. [Google Scholar] [CrossRef]
  51. Barinova, S.; Bilous, O.; Ivanova, N. New Statistical Approach to Spatial Analysis of Ecosystem of the Sasyk Reservoir, Ukraine. Int. J. Ecotoxicol. Ecobiol. 2016, 1, 118–126. [Google Scholar] [CrossRef]
  52. Barinova, S.S.; Protasov, A.A.; Novoselova, T.N. Spatial Analysis of Environmental and Biological Variables in the Techno-Ecosystem of the Khmelnitsky Nuclear Power Plant with New Statistical Approach. MOJ Ecol. Environ. Sci. 2017, 2, 1–7. [Google Scholar] [CrossRef] [Green Version]
  53. Dedić, A.; Gerhardt, A.; Kelly, M.G.; Stanić-Koštroman, S.; Šiljeg, M.; Kalamujić Stroil, B.; Kamberović, J.; Mateljak, Z.; Pešić, V.; Vučković, I.; et al. Innovative methods and approaches for WFD: Ideas to fill knowledge gaps in science and policy. Water Solut. 2020, 3, 30–42. [Google Scholar]
  54. Barinova, S.; Gabyshev, V.; Boboev, M.; Kukhaleishvili, L.; Bilous, O. Algal Indication of Climatic Gradients, American Journal of Environmental Protection. Spec. Issue Appl. Ecol. Probl. Innov. 2015, 4, 72–77. [Google Scholar] [CrossRef]
  55. Bilous, O.; Barinova, S.; Klochenko, P. Climatic influence on the phytoplankton communities of the upper reaches of the Southern Bug River (Ukraine). Transylv. Rev. Syst. Ecol. Research. Wetl. Divers. 2013, 15, 61–86. [Google Scholar] [CrossRef] [Green Version]
  56. Protasov, A.; Novoselova, T.; Uzunov, Y.; Barinova, S.; Sylaieva, A. Changes in the Planktonic System of the Nuclear Power Plant Cooling Pond Related to the Invasion of Dreissenidae (Mollusca: Bivalvia). Acta Zool. Bulg. 2021, 73, 275–288. [Google Scholar]
  57. Protasov, A.; Barinova, S.; Novoselova, T.; Sylaieva, A. The Aquatic Organisms Diversity, Community Structure, and Environmental Conditions. Diversity 2019, 11, 190. [Google Scholar] [CrossRef] [Green Version]
  58. Barinova, S.; Alster, A. Algae and Cyanobacteria Diversity and Bioindication of Long-Term Changes in the Hula Nature Reserve, Israel. Diversity 2021, 13, 583. [Google Scholar] [CrossRef]
  59. Novoselova, T.; Barinova, S.; Protasov, A. Long-term dynamics of trophic state indicators in phytoplankton of the cooling reservoir of a nuclear power plant. Transylv. Rev. Syst. Ecol. Research. Wetl. Divers. 2021, 23, 1–14. [Google Scholar] [CrossRef]
  60. Curtean-Bănăduc, A.; Bănăduc, D.; Bucṣa, C. Watersheds Management (Transylvania/Romania): Implications, risks, solutions, Strategies to enhance environmental Security in transition countries. In NATO Science for Peace and Security Series C-Environmental Security; Springer: Berlin/Heidelberg, Germany, 2007; pp. 225–238. [Google Scholar] [CrossRef]
  61. Bănăduc, D.; Sas, A.; Cianfaglione, K.; Barinova, S.; Curtean-Bănăduc, A. The Role of Aquatic Refuge Habitats for Fish, and Threats in the Context of Climate Change and Human Impact, during Seasonal Hydrological Drought in the Saxon Villages Area (Transylvania, Romania). Atmosphere 2021, 12, 1209. [Google Scholar] [CrossRef]
  62. Popa, G.-O.; Curtean-Banaduc, A.; Banaduc, D.; Florescu, I.E.; Burcea, A.; Dudu, A.; Georgescu, S.E.; Costache, M. Molecular Markers Reveal Reduced Genetic Diversity in Romanian Populations of Brown Trout, Salmo trutta L., 1758 (Salmonidae). Acta Zool. Bulg. 2016, 68, 399–406. [Google Scholar]
  63. Barinova, S.S.; Krupa, E.G.; Protasov, A.A.; Novoselova, T.N. Benthification in the inland water ecosystems of Eurasia, some ecological aspects. MOJ Ecol. Environ. Sci. 2017, 2, 00048. [Google Scholar] [CrossRef] [Green Version]
Figure 1. Location of research stations in the water area of the Tashlyk (a) and Alexandrovskoye (b) reservoirs on a fragment of the satellite image Sentinel-2 (for 30 August 2020).
Ecologies 03 00009 g001
Figure 2. General view of water bodies: (a)—general view of the Tashlyk reservoir from the dam; (b)—training curtain, on the right heated water discharge area, st. 61a; (c)—the lower part of the Tashlyk reservoir, st. 60; (d)—Alexandrovskoe reservoir, upper part; (e)—Alexandrovskoye reservoir, lower part; (f)—Alexandrovskoe reservoir, near dam part.
Ecologies 03 00009 g002
Figure 3. Originality of phytoplankton composition at stations: from all lists of LIT (a); Tashlyk reservoir (b); Alexandrovskoye reservoir (c). The red line separates stations where txx originality values are greater than and less than 100.
Ecologies 03 00009 g003
Figure 4. Tree of similarity of the communities of the Tashlyk and Alexandrovskoye reservoirs based on the abundance of phytoplankton LIT by stations. The clusters are outlined with colored outlines.
Ecologies 03 00009 g004
Figure 5. JASP correlation network plot for the communities of the Tashlyk and Alexandrovskoye reservoirs based on the abundance of phytoplankton by station. The corners of the grid are colored according to the relationship to each of the reservoirs. The strongest links are shown by the thickest lines. Positive correlations are shown in blue lines, negative ones in red.
Ecologies 03 00009 g005
Figure 6. Distribution of taxonomic content (LIT) and indicators of habitat, water temperature and pH for phytoplankton communities in two reservoirs of the Southern Bug River, Tashlyk and Alexandrovskoye reservoirs. Ecological groups on the x-axis are placed in order of increasing indicator variable value. Abbreviations of ecological groups are given in Table 3.
Ecologies 03 00009 g006
Figure 7. Distribution of indicators of oxygen saturation and water salinity for phytoplankton communities in two reservoirs of Southern Bug River, Tashlyk and Alexandrovskoye. Ecological groups on the x-axis are placed in order of increasing indicator variable value. Abbreviations of ecological groups are given in Table 3.
Ecologies 03 00009 g007
Figure 8. Distribution of indicators of organic pollution according to Watanabe, class of water quality, trophic state and nutrition type for phytoplankton communities in the Tashlyk and Alexandrovskoye reservoirs. Ecological groups on the x-axis are placed in order of increasing indicator variable value. Classes of water quality colored in EU color code. Abbreviations of ecological groups are given in Table 3.
Ecologies 03 00009 g008
Figure 9. Dynamics of the main biological and chemical variables at the stations of the Tashlyk (a,c,e) and Alexandrovskoye (b,d,f) reservoirs. Stations are placed in order to the reservoir axis from upstream to downstream.
Ecologies 03 00009 g009
Figure 10. Combined statistical and landscape maps for the Tashlyk reservoir. Abundance (a); Index saprobity S (b); Ammonia (c); Index WESI (d). Colors are given for the value amplitude of each mapped variable from green (lower boxes in the legend key) to red (upper boxes in the legend key).
Ecologies 03 00009 g010
Figure 11. Combined statistical and landscape maps for the Alexandrovskoye reservoir. Abundance (a); Index saprobity S (b); Ammonia (c); Index WESI (d). Colors are given for the value amplitude of each mapped variable from green (lower boxes in the legend key) to red (upper boxes in the legend key).
Ecologies 03 00009 g011
Figure 12. Combined statistical and landscape maps for species number in phytoplankton of the Tashlyk reservoir. Bacillariophyta (a); Chlorophyta (b); Cyanobacteria (c); Cryptophyta (d). Colors are given for the value amplitude of each mapped variable from green (lower boxes in the legend key) to red (upper boxes in the legend key).
Ecologies 03 00009 g012
Figure 13. Combined statistical and landscape maps for species number in phytoplankton of the Alexandrovskoye reservoir. Bacillariophyta (a); Chlorophyta (b); Cyanobacteria (c); Cryptophyta (d). Colors are given for the value amplitude of each mapped variable from green (lower boxes in the legend key) to red (upper boxes in the legend key).
Ecologies 03 00009 g013
Table 2. Number of LIT distributions in phytoplankton of the surface horizon of the Tashlyk and Alexandrovskoye reservoirs with a given frequency of occurrence in percentage interval.
List1–25%26–50%51–75%76–100%
General list for two reservoirs421953
List for Tashlyk reservoir207813
List for Alexandrovskoye reservoir251361
Table 3. Distribution of LITs in taxonomic phyla, average abundance of phytoplankton, indices of saprobity and the indicator species in the Tashlyk and Aleksandrovskoe reservoirs. Abbreviations of ecological groups are given at the end of Table 3 and in Table S3.
VariableTashlykAlexandrovskoye
Bacillariophyta148
Charophyta20
Chlorophyta2829
Cryptophyta22
Cyanobacteria33
Miozoa01
Ochrophyta01
Index S2.132.09
Abundance average20,561.2166,782.3
Class of Water Quality
Class 243
Class 33334
Class 452
Class 500
Habitat
P, planktonic88
P-B, planktonic-benthic2827
B, benthic63
S, soil12
Ep, epiphyte11
Temperature
temp, temperate temperature75
cool, cool-loving10
Oxygen
aer, aerophiles10
st-str, low streaming waters2626
st, standing waters32
Watanabe
sx, saproxenes10
es, eurysaprobes95
sp, saprophiles11
Salinity
i, indifferent2322
hl, halophiles55
mh, mesohalobes10
eh, euhalobes11
pH
acf, acodophiles12
ind, pH-indifferent97
alf, alkaliphiles87
alb, alkalibiontes12
Autotrophy–Heterotrophy
ate, autotrophes63
hne, mixotrophes survived in high nitrogen content53
hce, mixotrophes preferred high nitrogen content21
Trophy
ot, oligotraphentes11
om, oligo-mesotraphentes20
m, mesotraphentes01
me, meso-eutraphentes32
e, eutraphentes2222
o-e, oligo- to eutraphentes10
he, hypertraphentes01
Saprobity
b, beta-mesosaprobes2425
o, oligosaprobes12
a, alpha-mesosaprobes11
a-o, alpha-oligosaprobes41
o-a, oligo-alpha-mesosaprobes66
o-b, oligo-beta-mesosaprobes21
b-o, beta-oligosaprobes33
b-a, beta-alpha-mesosaprobes10
Note: Abbreviation of the ecological groups. Habitat: P—planktonic; P–B—plankto-benthic; B—benthic; S—soil; Ep—epiphyte. Temperature: cool—cool water; temp—temperate temperature; eterm—eurythermic. Oxygenation and water moving (Oxygen): st—standing water; st-str—low streaming water; aer—aerophiles. Halobity degree (Salinity): i—oligohalobes–indifferent; hl—halophiles; mh—masohalobes; eh—euhalobe. Acidity (pH): alf—alkaliphiles; ind—indifferent; acf—acidophiles; alb—alkalibiontes. Organic pollution indicators according to Watanabe (Watanabe): sx—saproxenes; es—eurysaprobes; sp—saprophiles. Saprobity: o—oligosaprob; o–b—oligo–beta–msosaprob; b–o—beta–oligosaprob; o–a—oligo–alpha–mesosaprob; b—beta–mesosaprob; b–a—beta–alpha–mesosaprob; a-o—alpha-oligosaprob; a—alpha-mesosaprob. Nitrogen uptake metabolism (Autotrophy–Heterotrophy): ate—nitrogen–autotrophic taxa; tolerating elevated concentrations of organically bound nitrogen; hne—facultatively nitrogen–heterotrophic taxa, needing periodically elevated concentrations of organically bound nitrogen; hce—facultatively nitrogen–heterotrophic taxa, needing elevated concentrations of organically bound nitrogen. Trophic state (Trophy): ot—oligotraphentic; om—oligo–mesotraphentic; m—mesotraphentic; me—meso–eutraphentic; e—eutraphentic; o–e—oligo–eutraphentic; he—hypereutraphentic.
Table 4. Saprobity, Shannon, WESI indices, LIT richness, abundance and main environmental variables’ value at the stations of the Tashlyk reservoir. The stations are located in the direction of the reservoir axis from the upper to the lower.
Station64656161aIC-16360
Abundance (thousand cells/dm3)36,28825,64026,14515,760641545,60020,020
No of LIT31283128232327
Index S2.152.142.212.172.072.182.00
N-NO3- (mgN/dm3)0.540.520.620.620.77nd0.66
WESI1.251.251.251.251.25nd1
Shannon H’ Log Base 10 0.9530.8150.9321.0760.9750.6281.051
Temperature (°C)34.0034.1034.3037.4031.4032.7032.70
Table 5. Indices of saprobity, Shannon, WESI, LIT richness, abundance, and main indicators of the environment at the stations of the Alexandrovskoye reservoir. The stations are located in the direction of the reservoir axis from the upper to the lower.
Station74767988849192112
Abundance (thousand cells/dm3)3183409532918512483086,480365,338873,475
No of LIT111514201119168
Index S2.001.981.932.002.052.102.112.09
N-NO3- (mgN/dm3)0.6640.5780.7700.8290.7610.5190.4850.449
WESI1.001.001.001.001.251.251.671.67
Shannon H’ Log Base 10 (decit)0.9361.0060.9940.8120.6150.1580.3360.118
Temperature (°C)26.926.826.126.126.127.926.726.7
Publisher’s Note: MDPI stays neutral with regard to jurisdictional claims in published maps and institutional affiliations.

