
Combined Cooling and Power Management Strategy for a Standalone House Using Hydrogen and Solar Energy


Abstract
:1. Introduction
- A combined cooling and electrical power management algorithm with a thermal model for a standalone application;
- The integration of an ACS for cooling storage with fuel cell and electrolyzer systems considering existing equipment; and
- An evaluation of the impact of the ACS on performances and sizing.
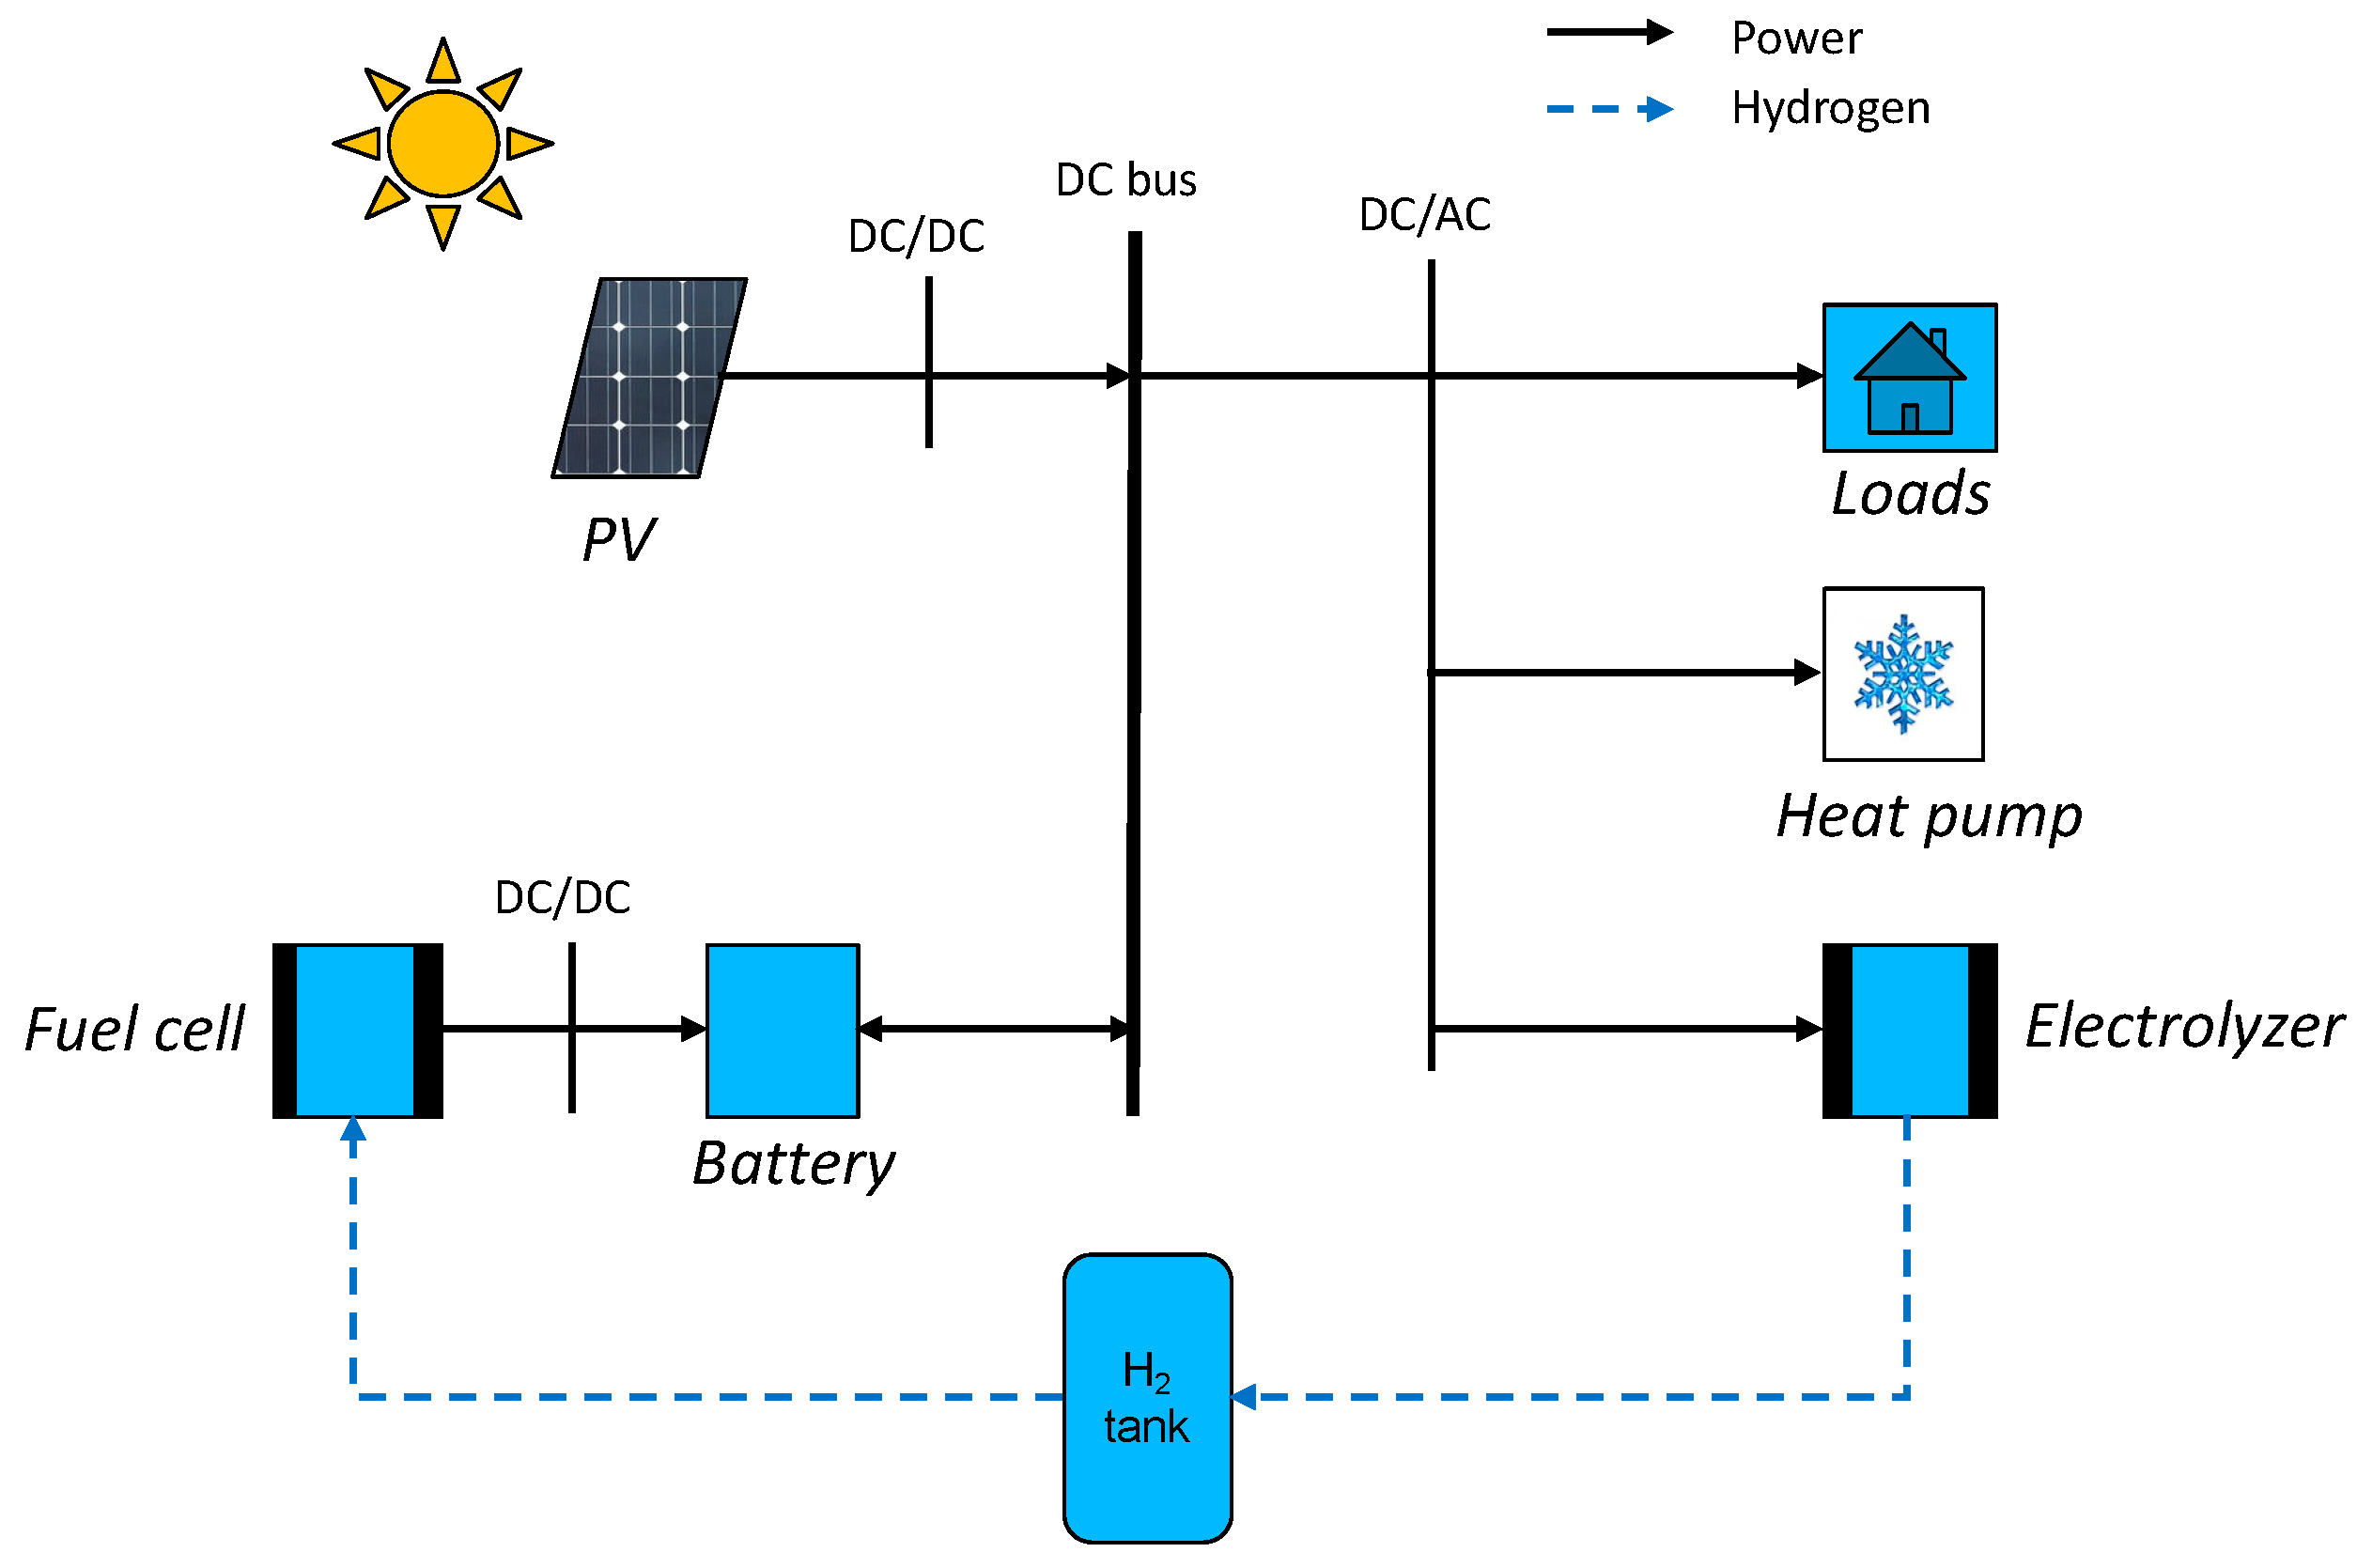
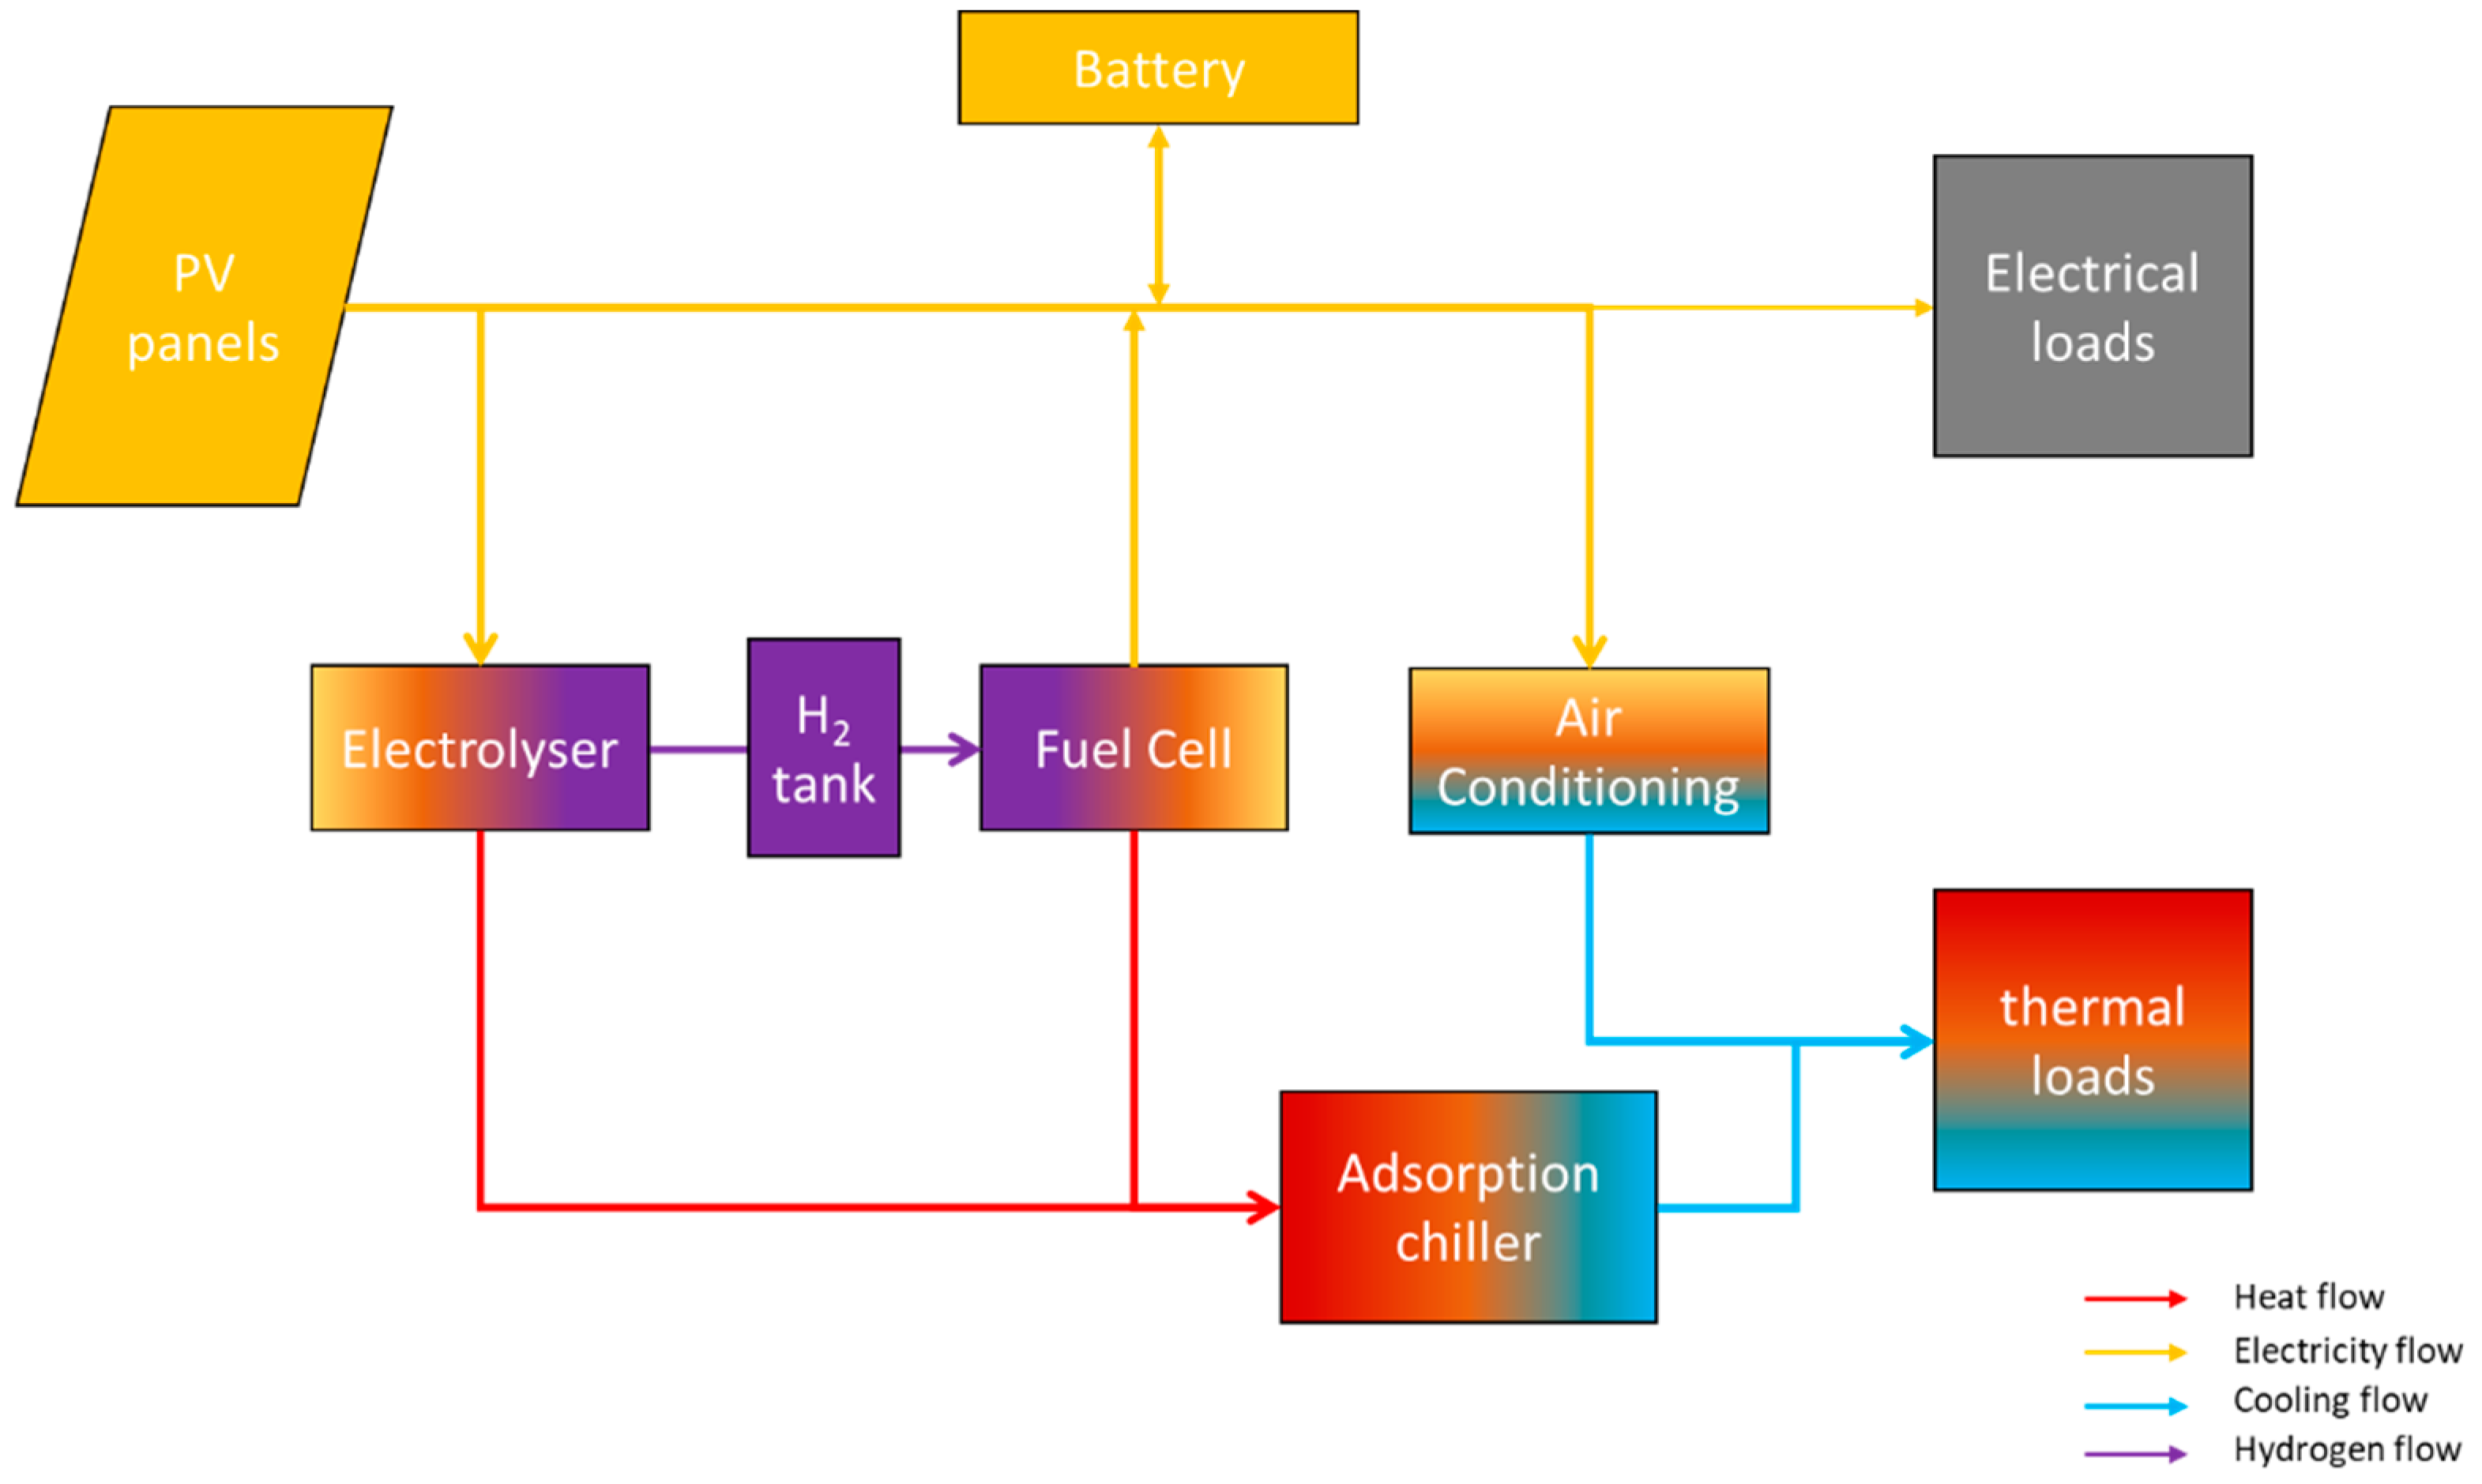
2. System Overview
3. Energetic Modeling
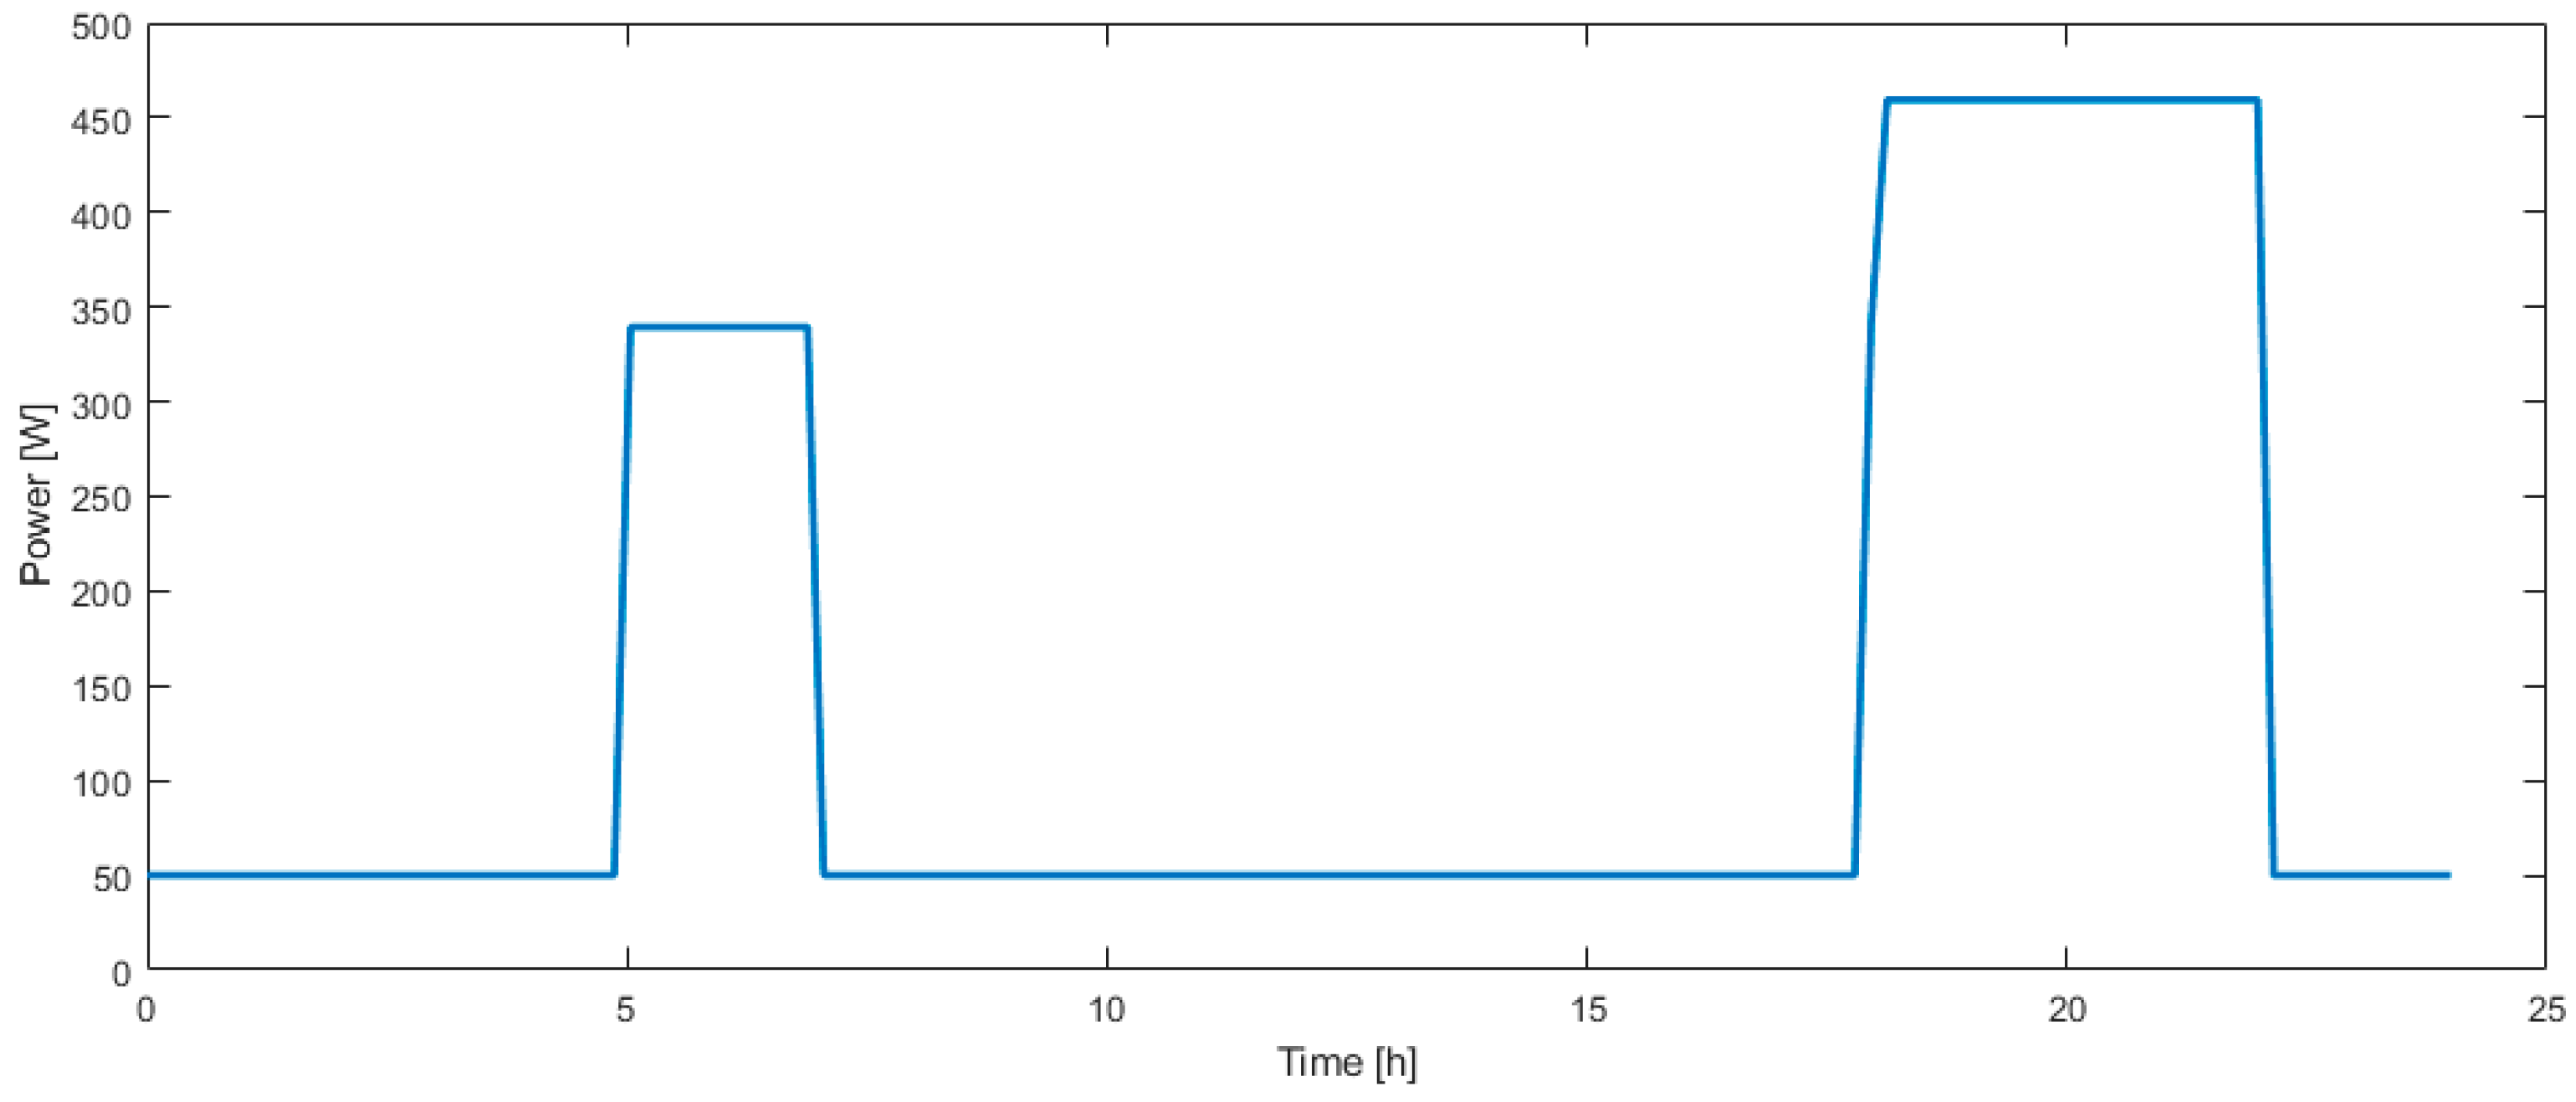
3.1. Electrical Modeling
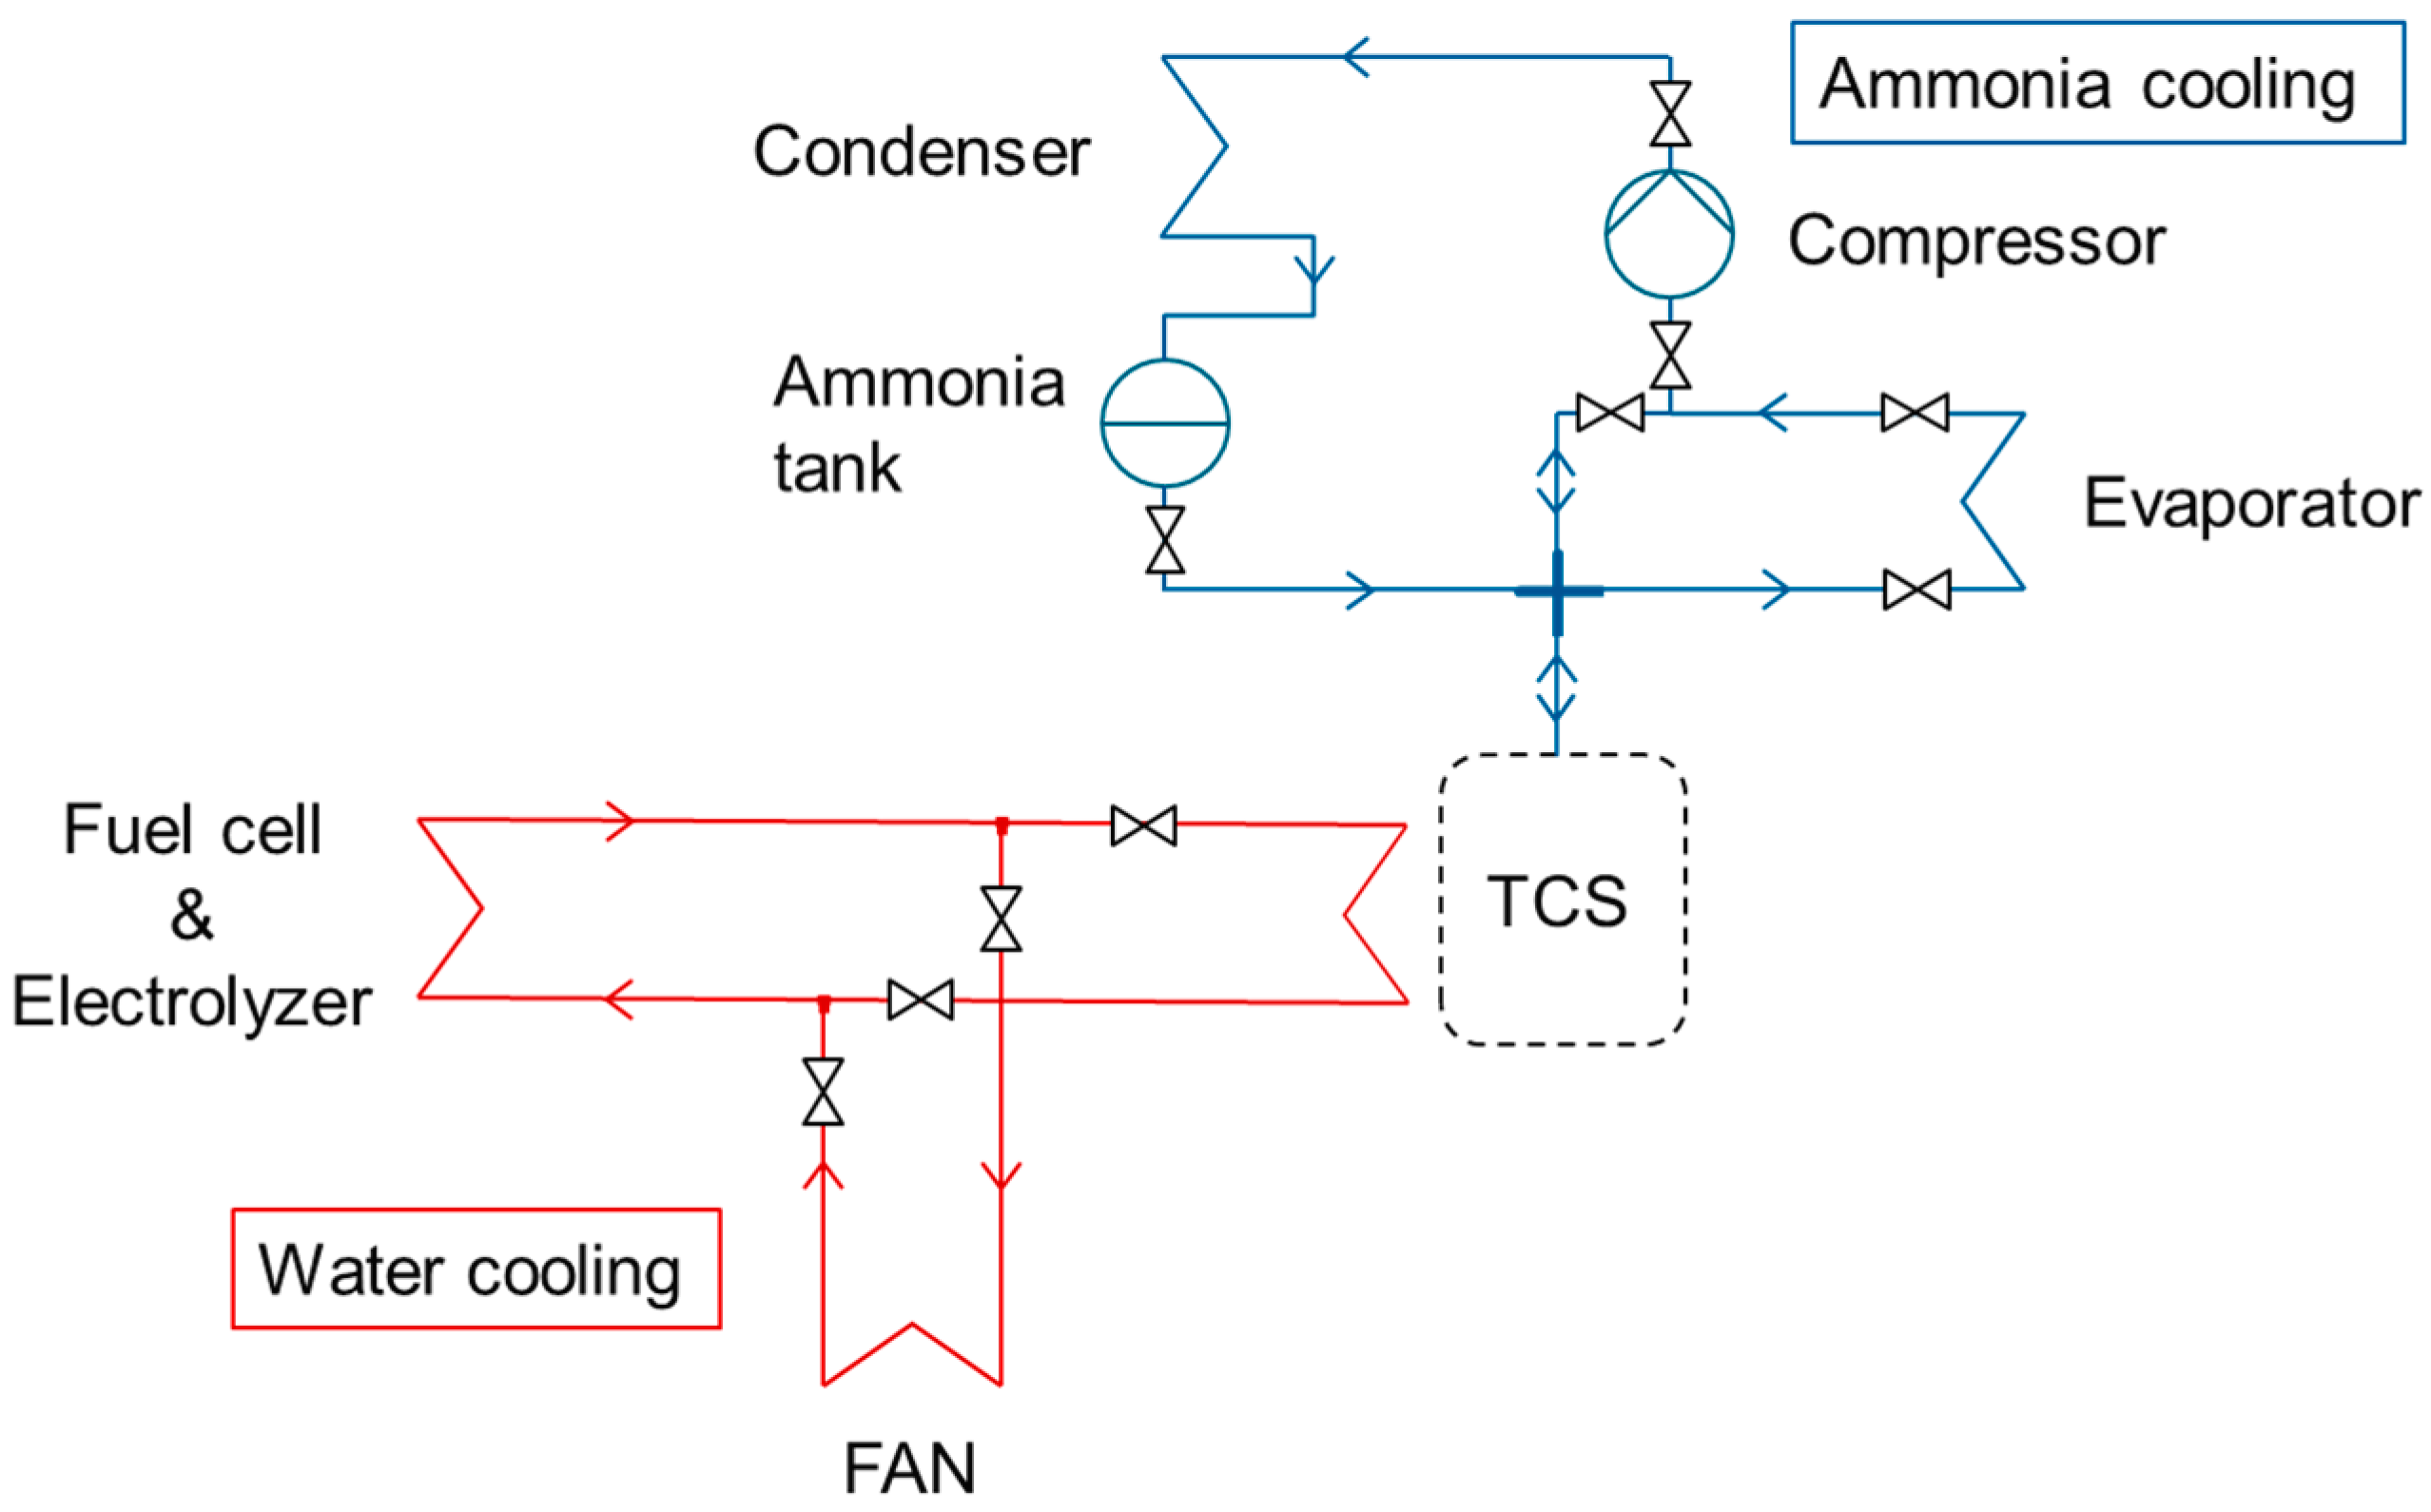
3.2. Thermal Modeling
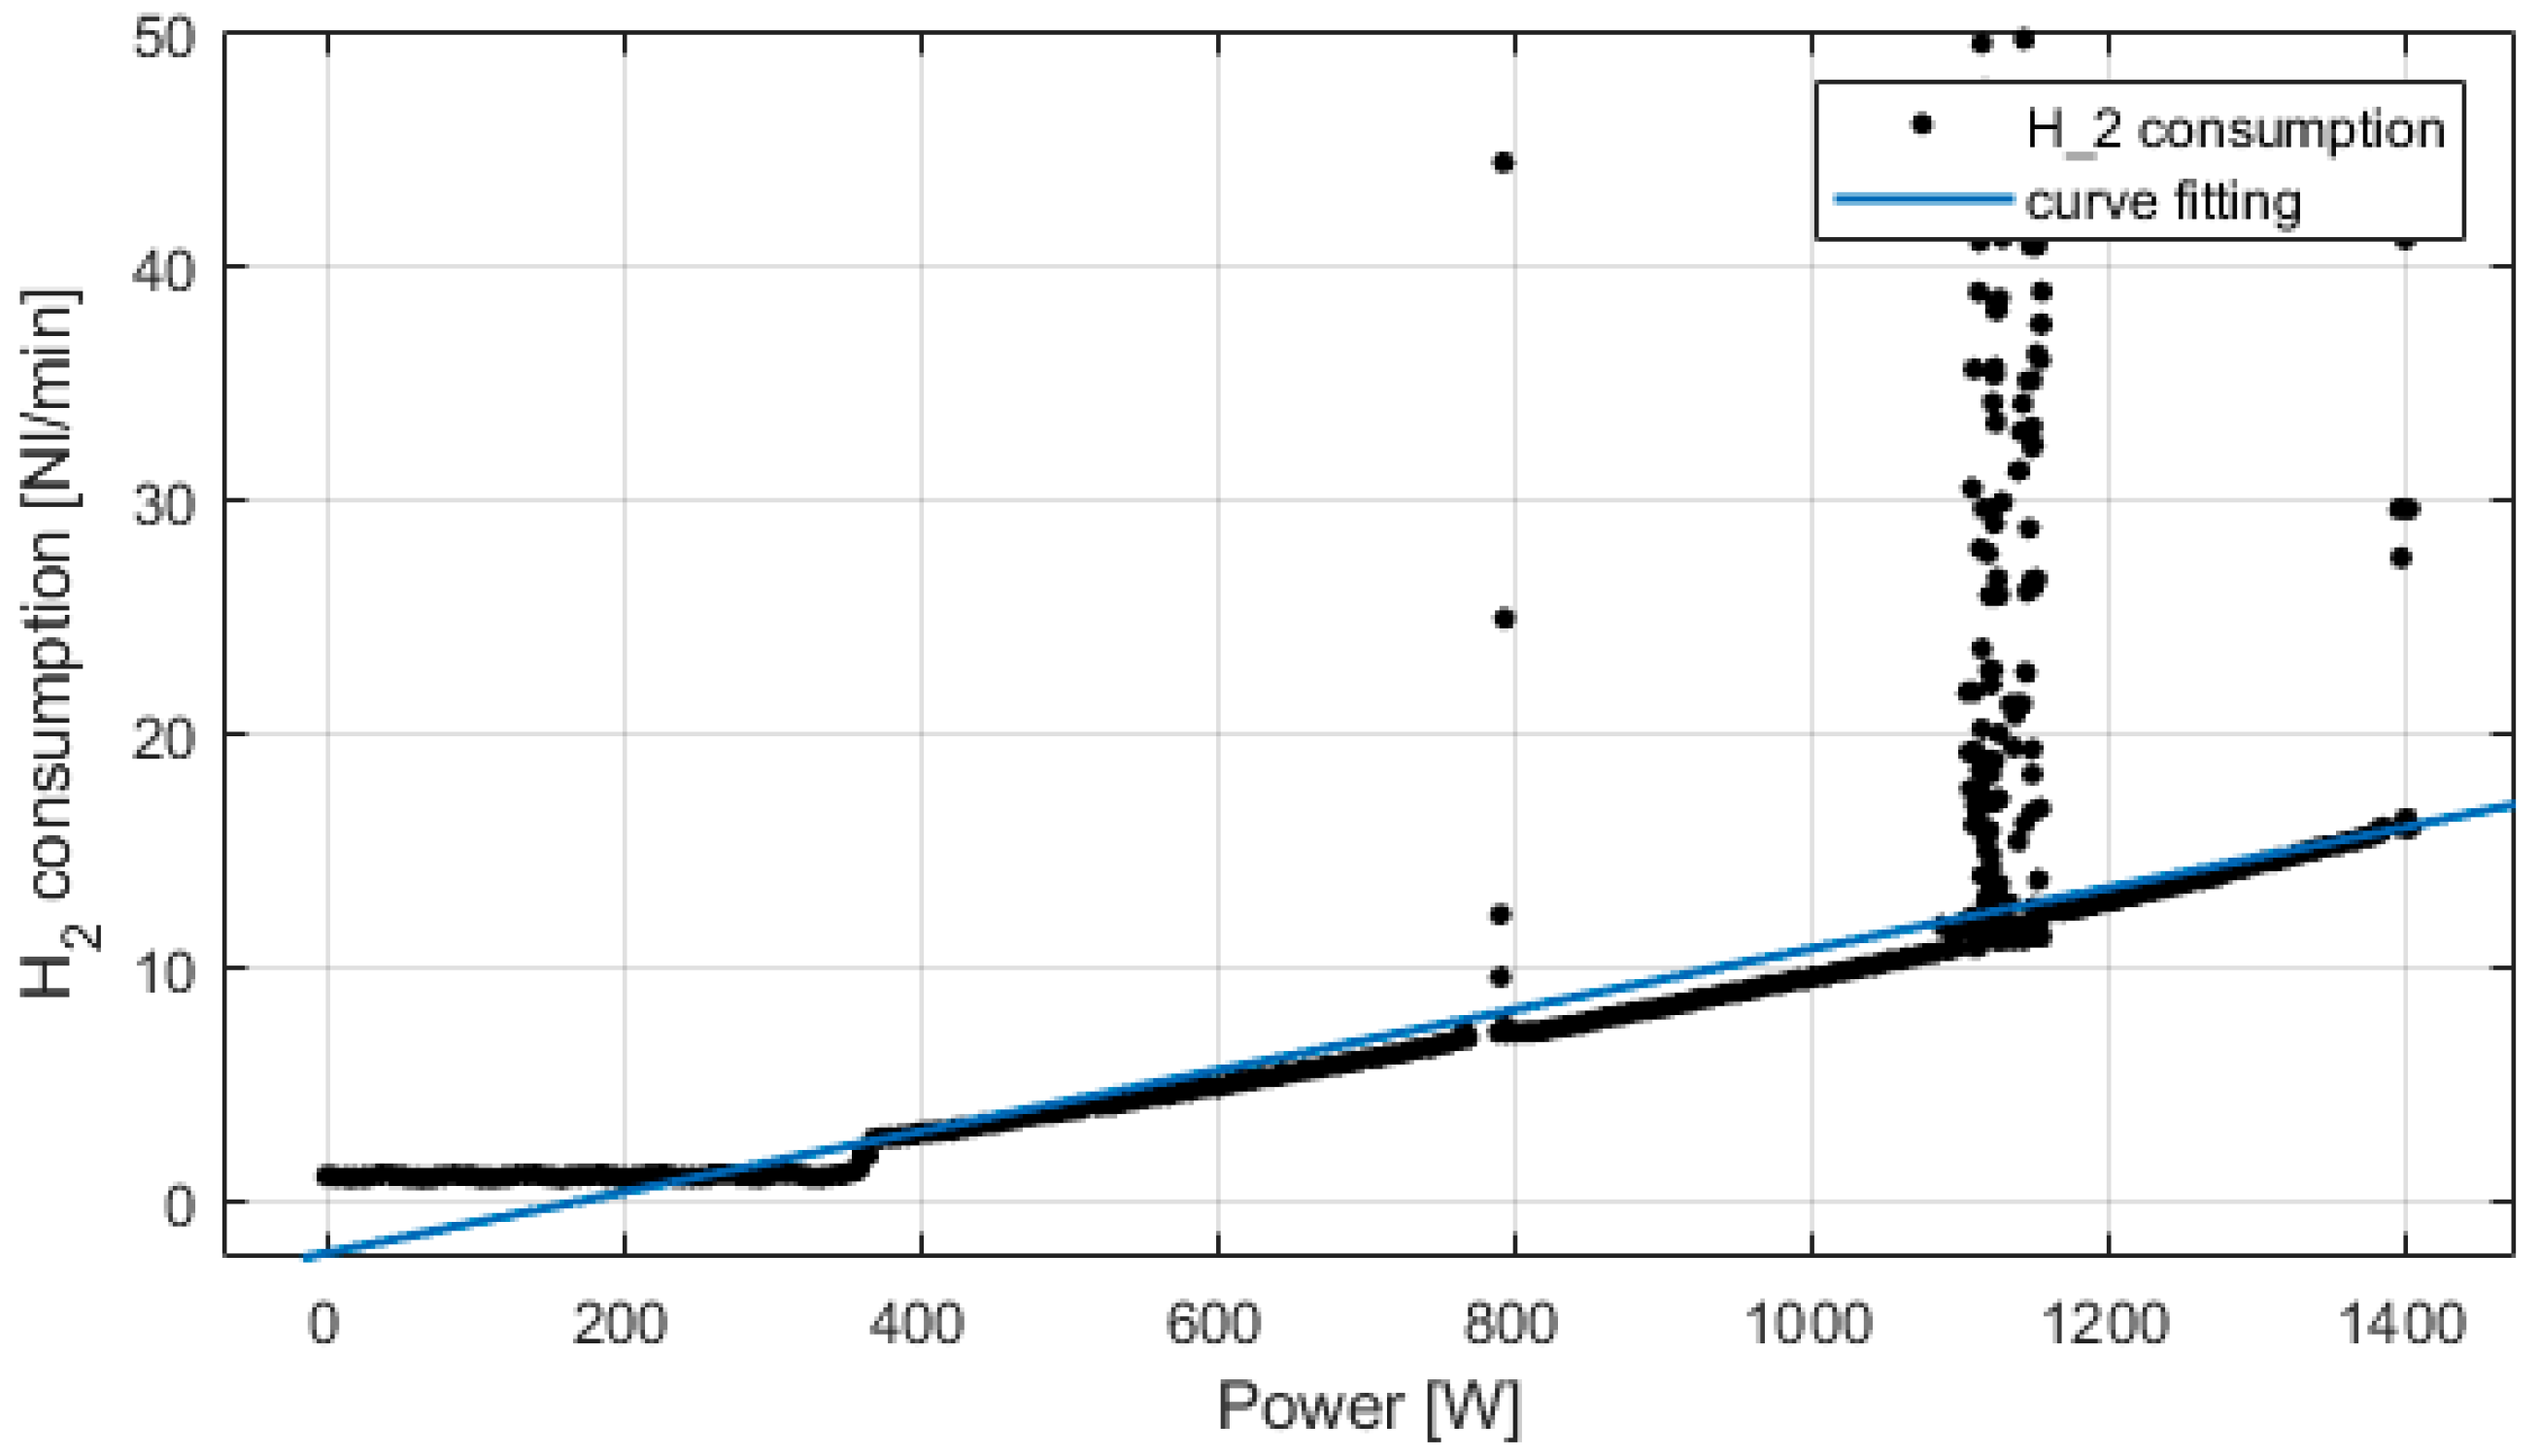
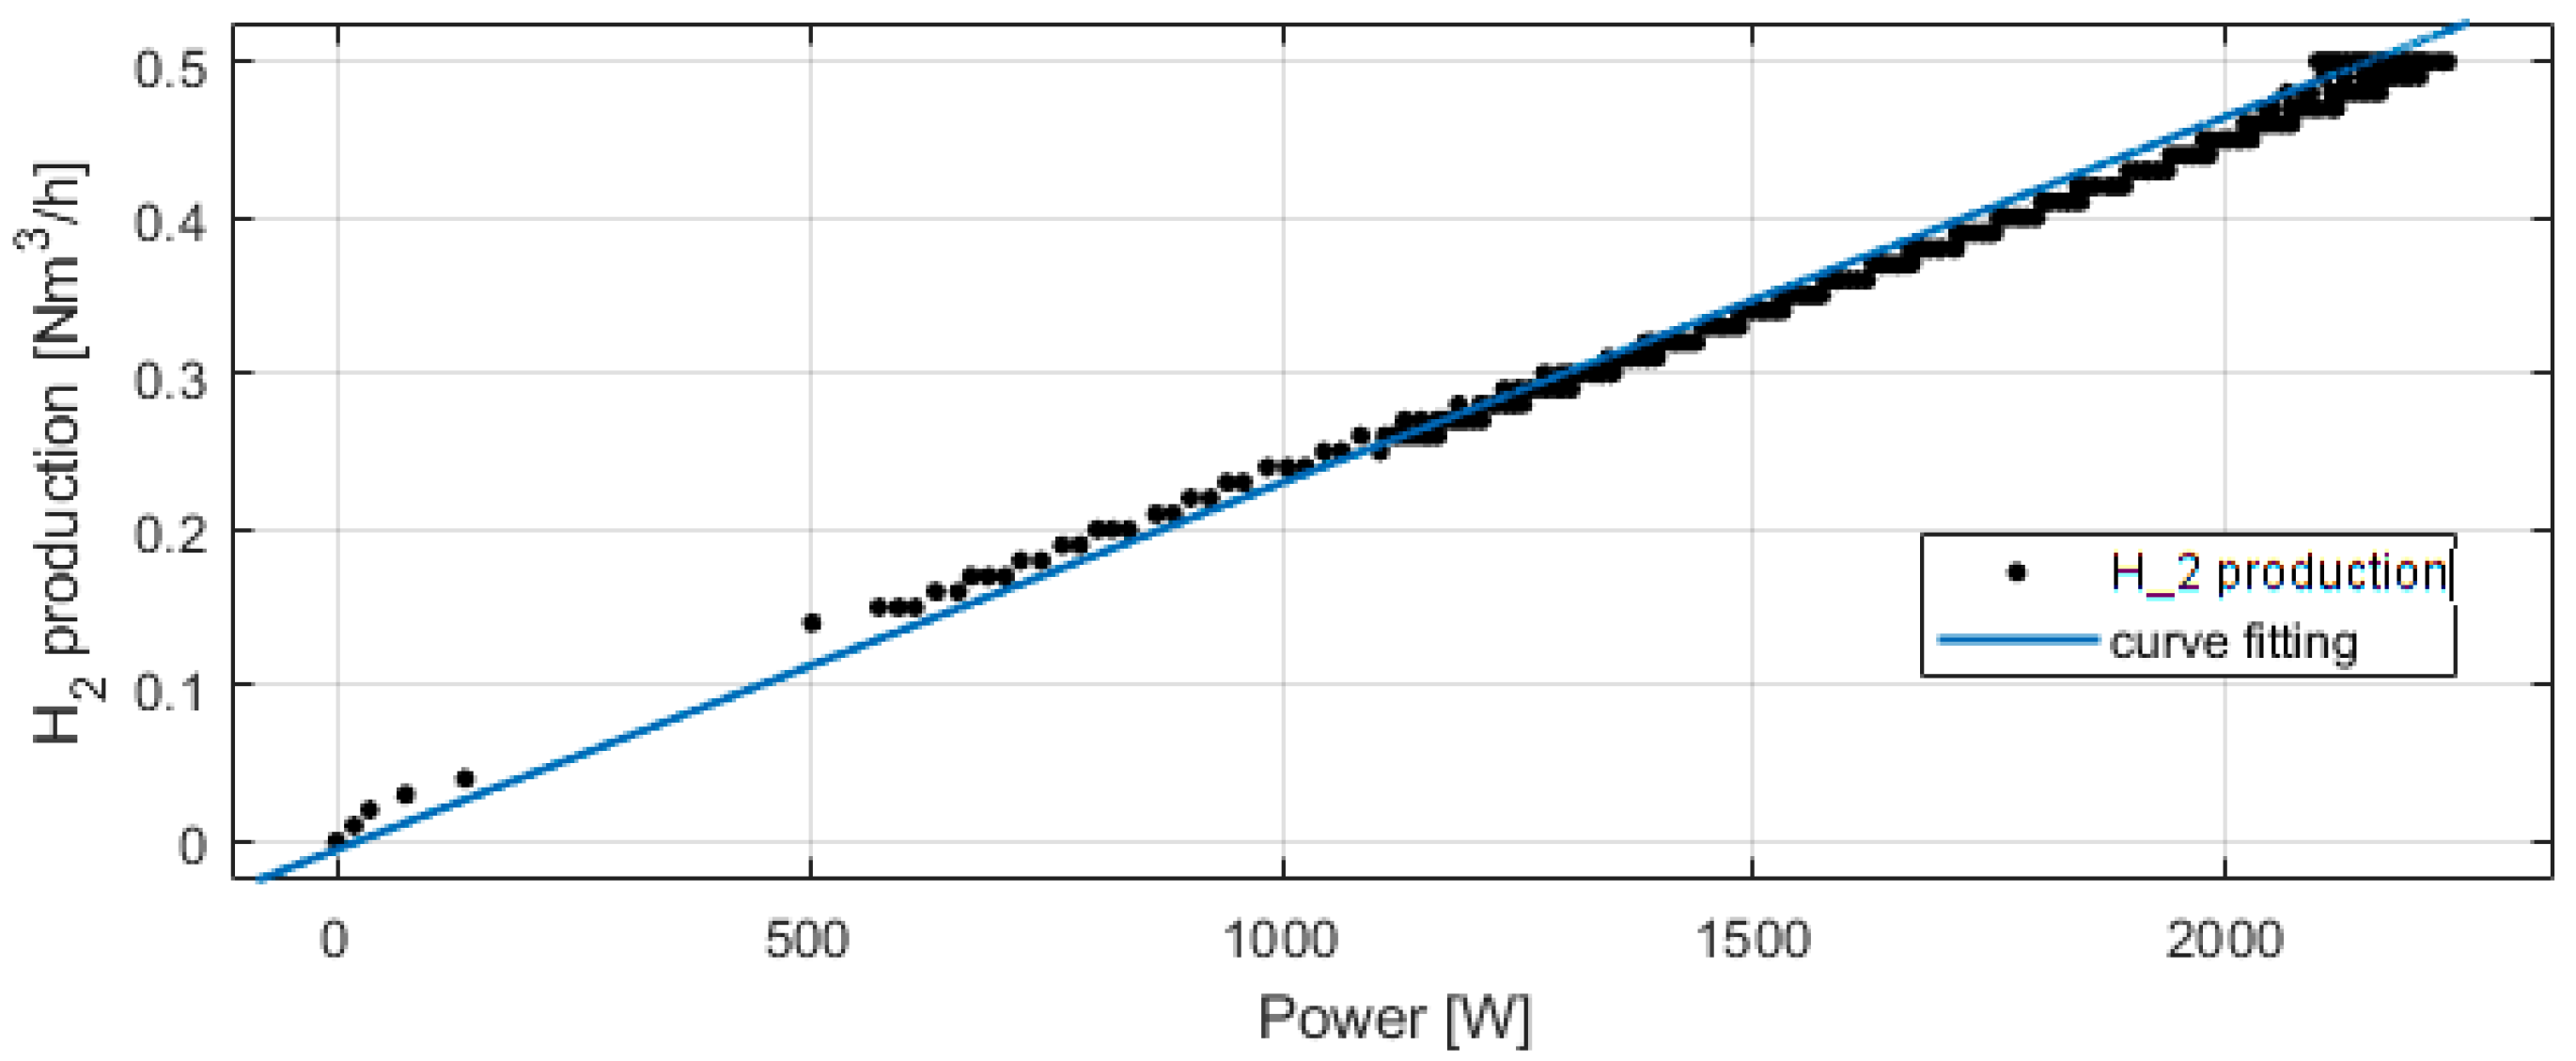
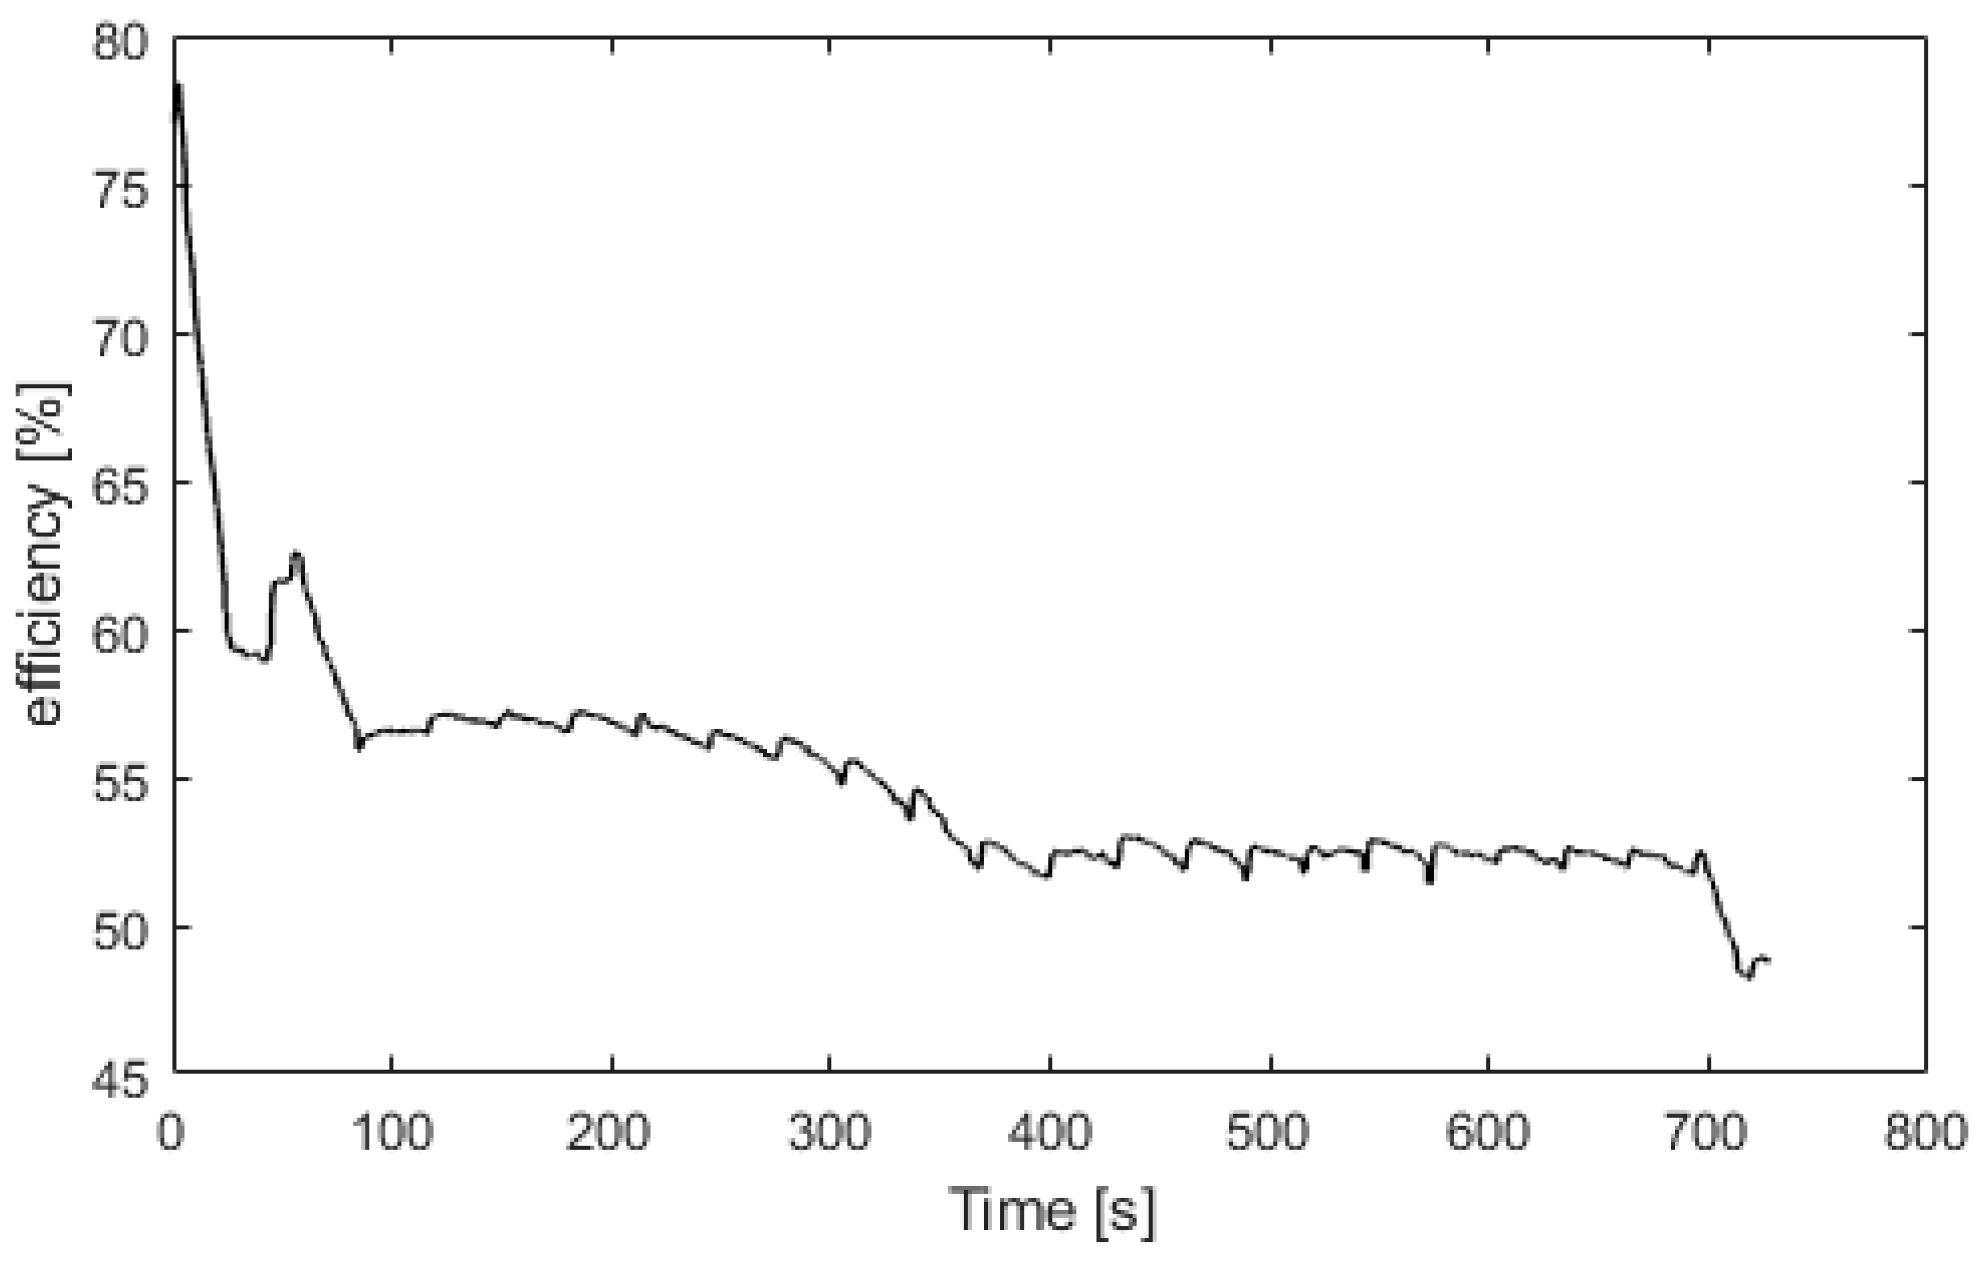
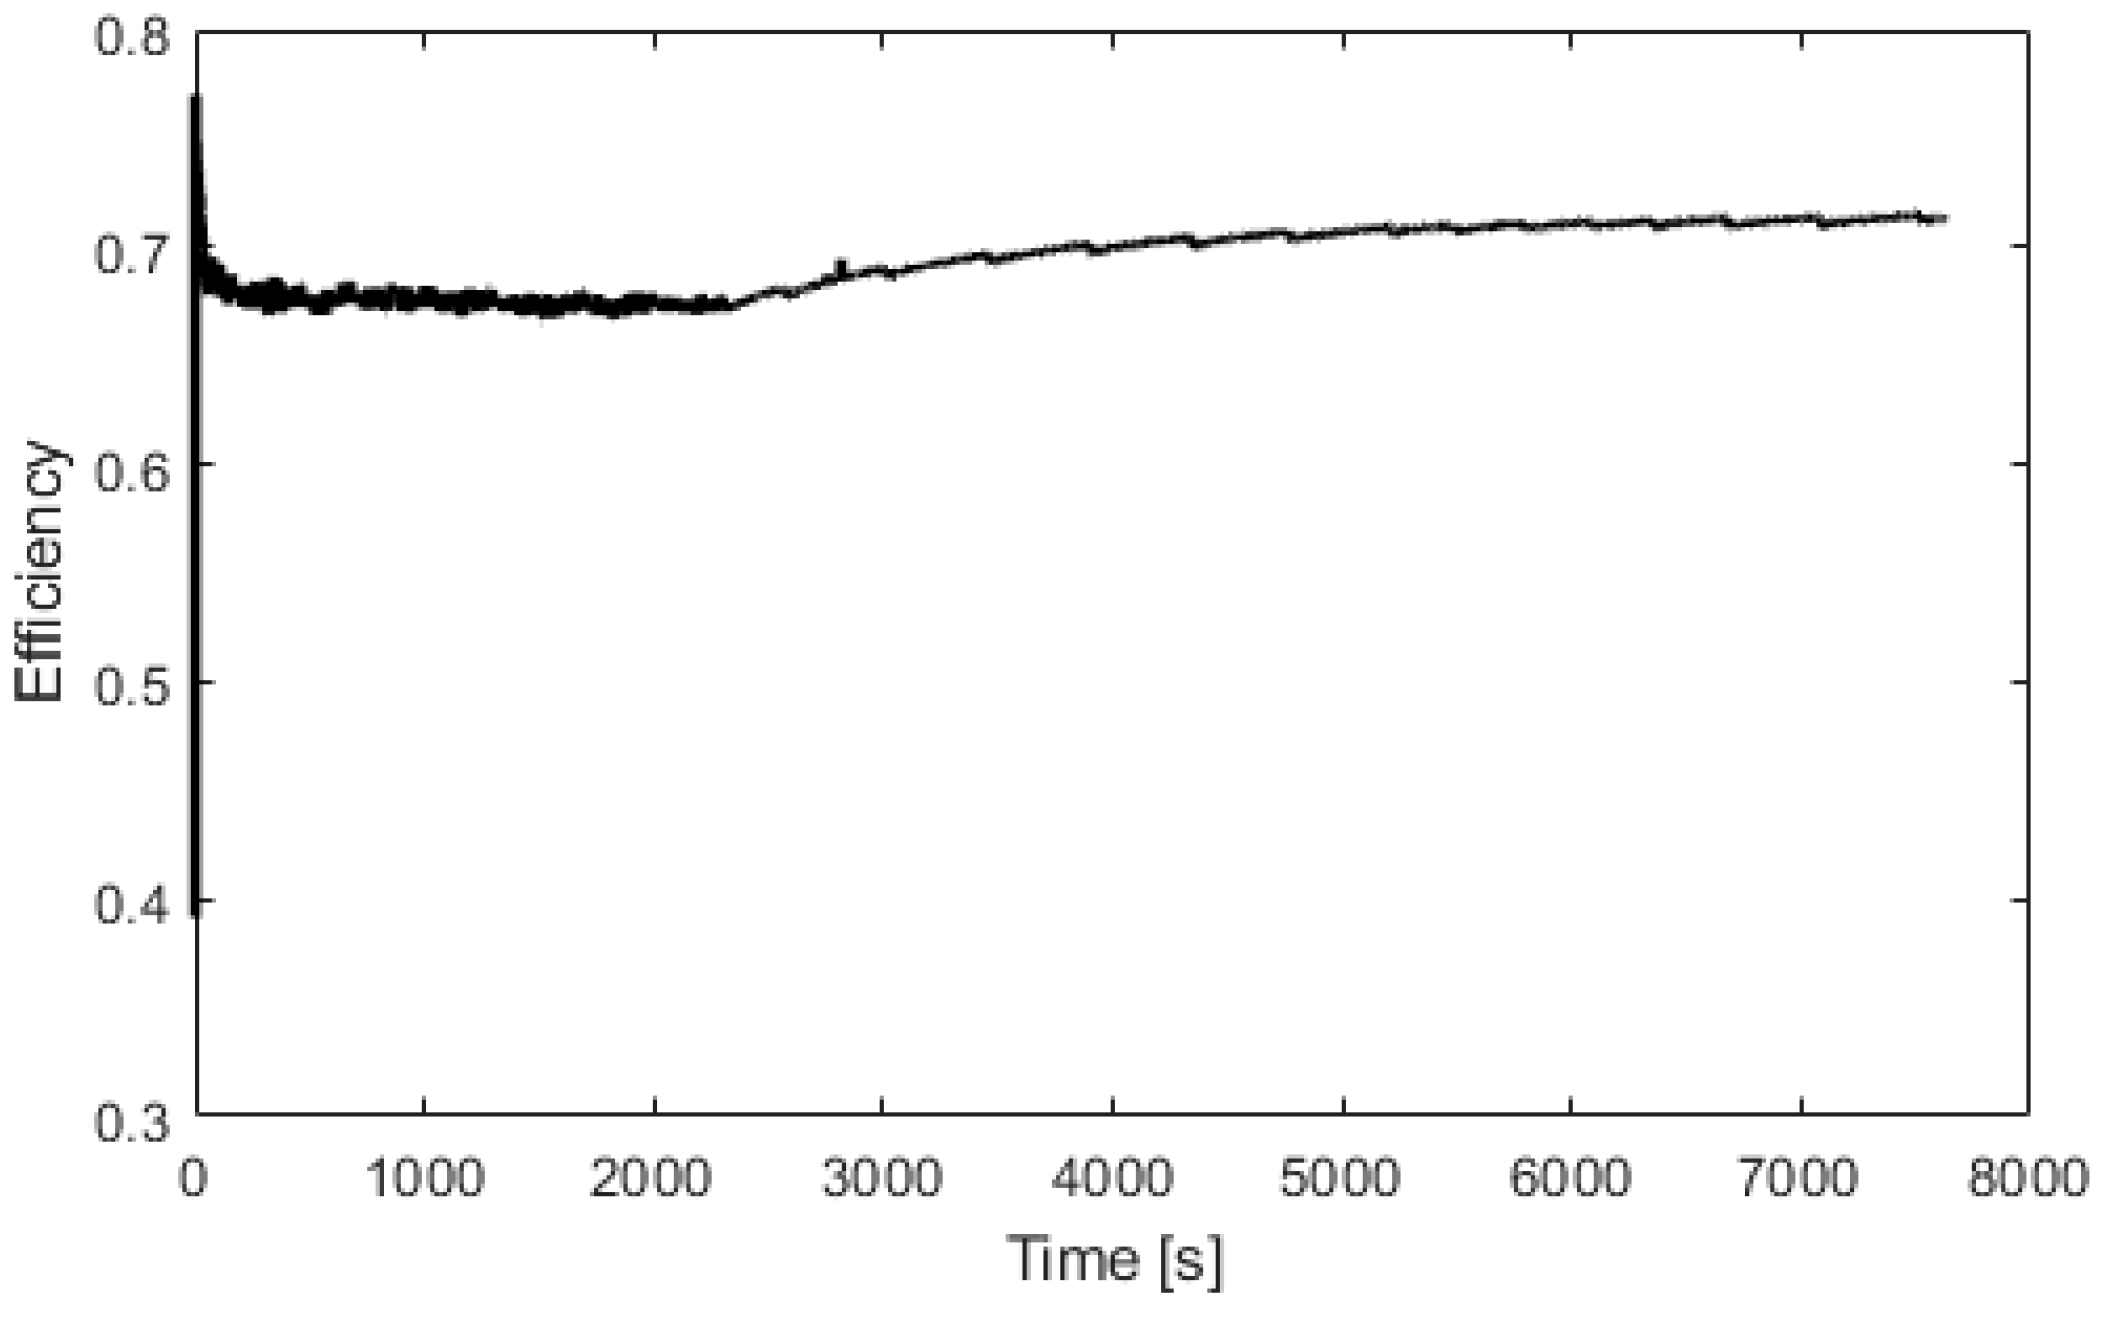
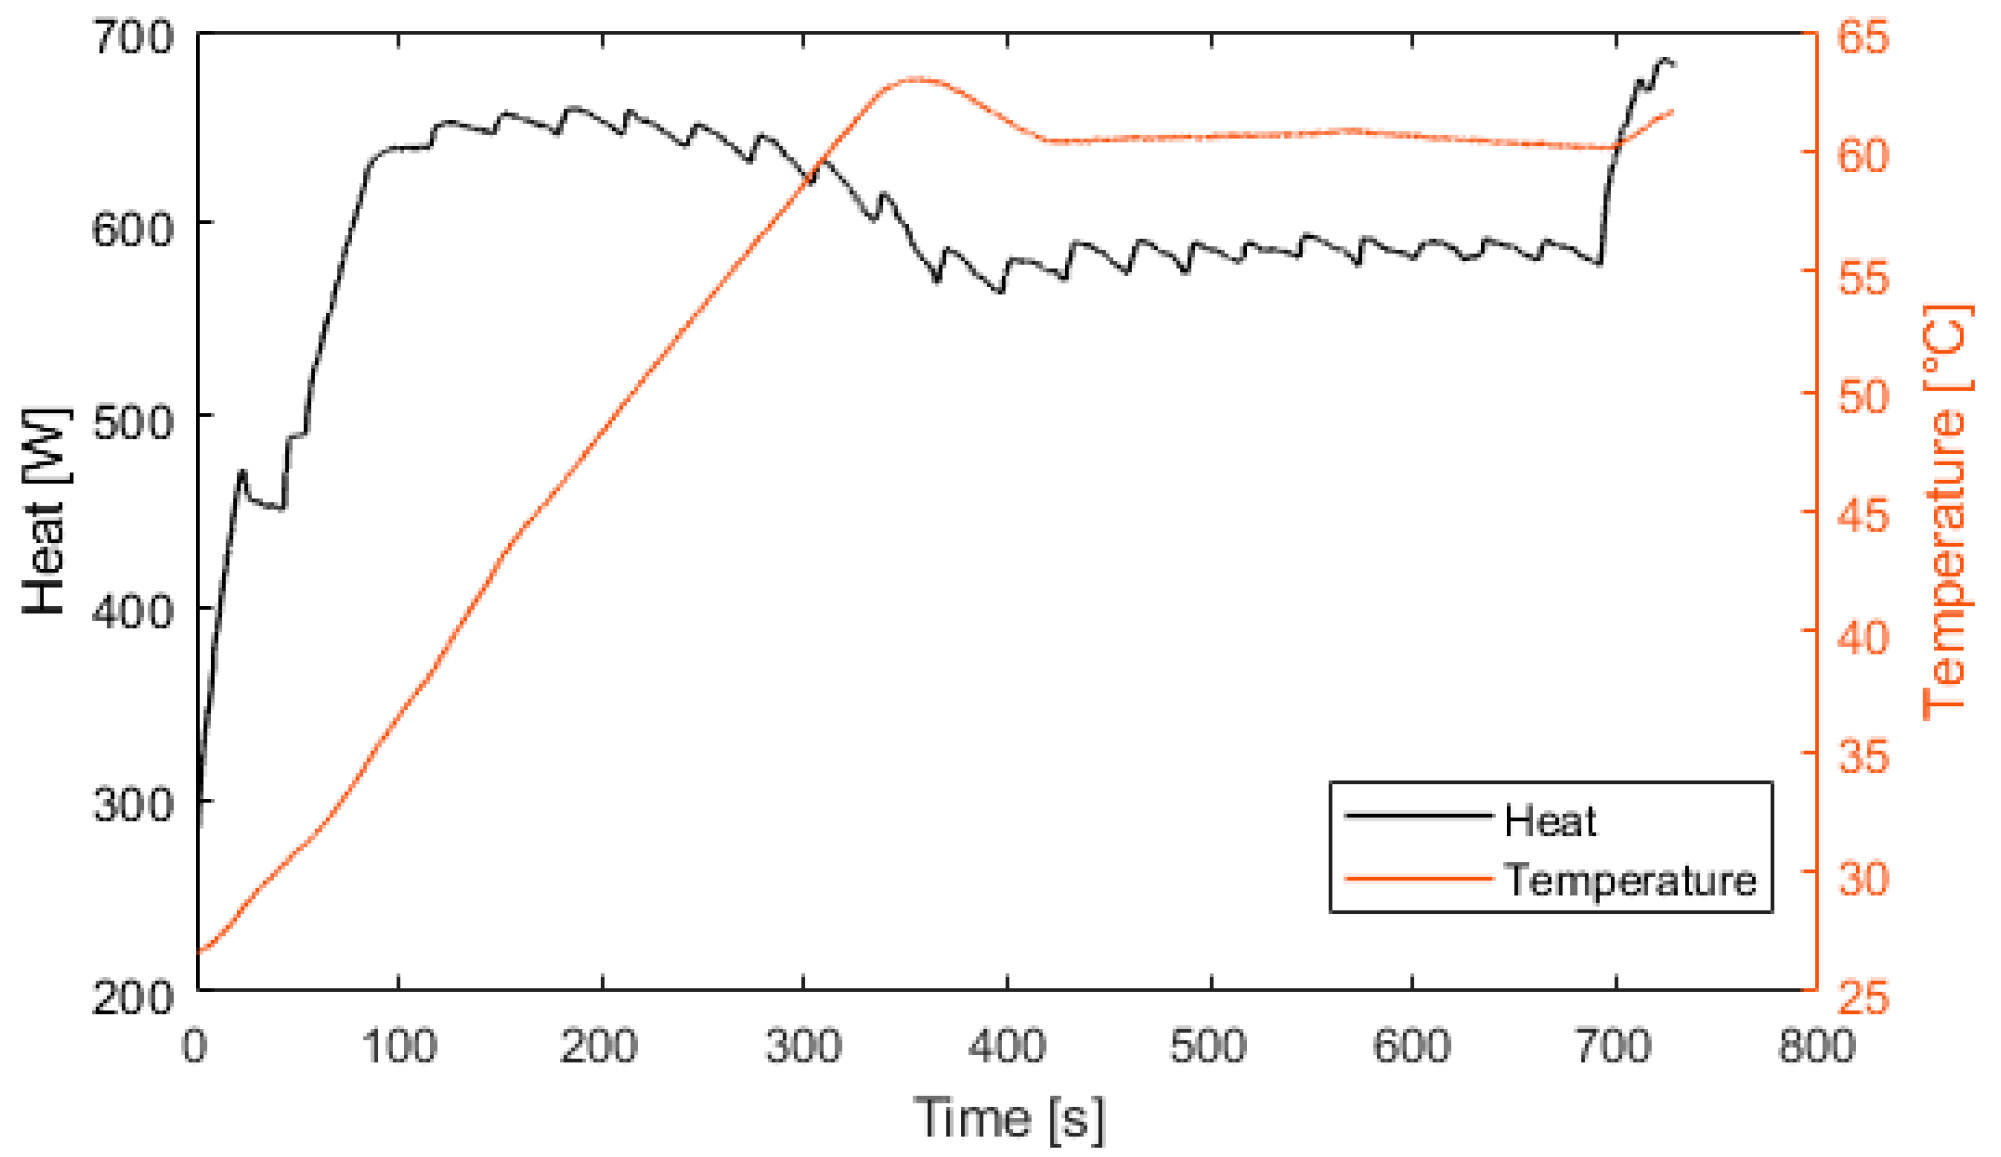
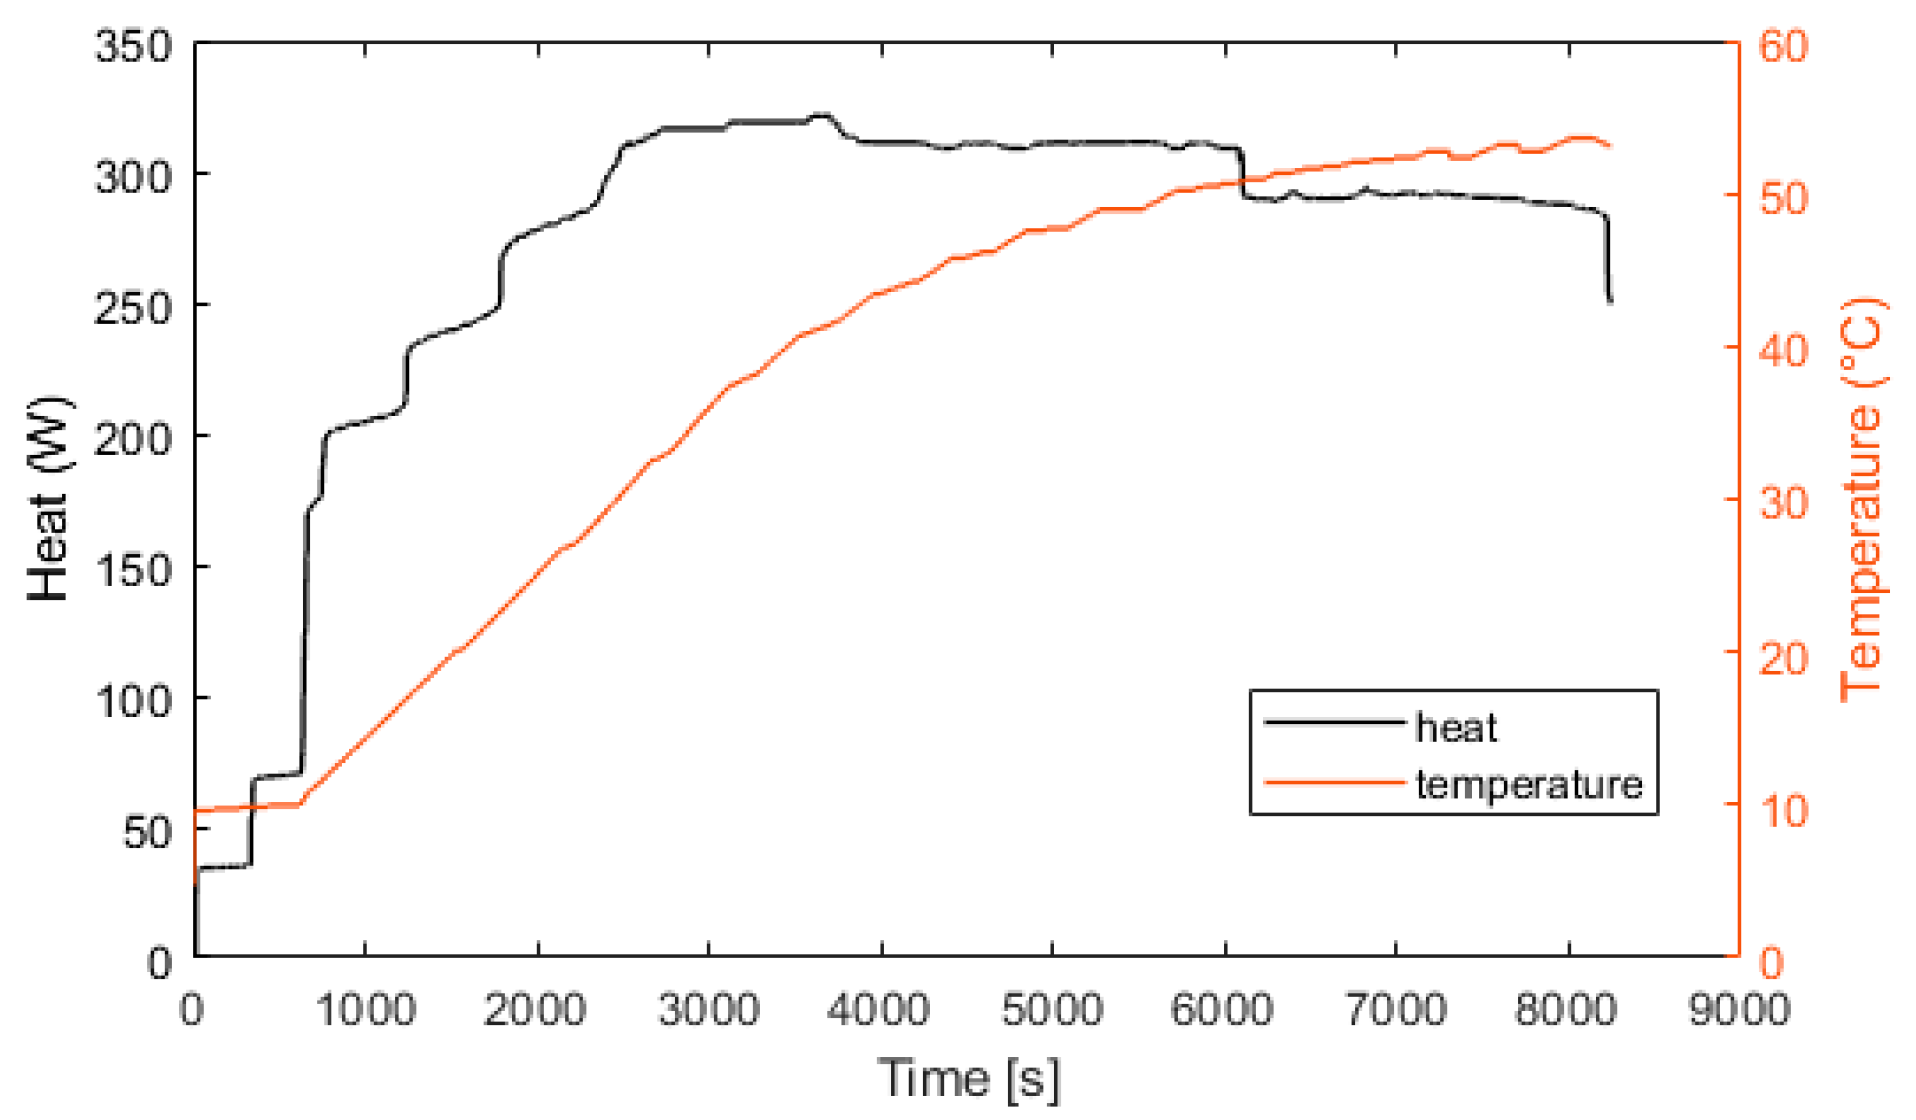
3.3. Fuel Cell and Electrolyzer Test Results
4. Electrical and Thermal Management
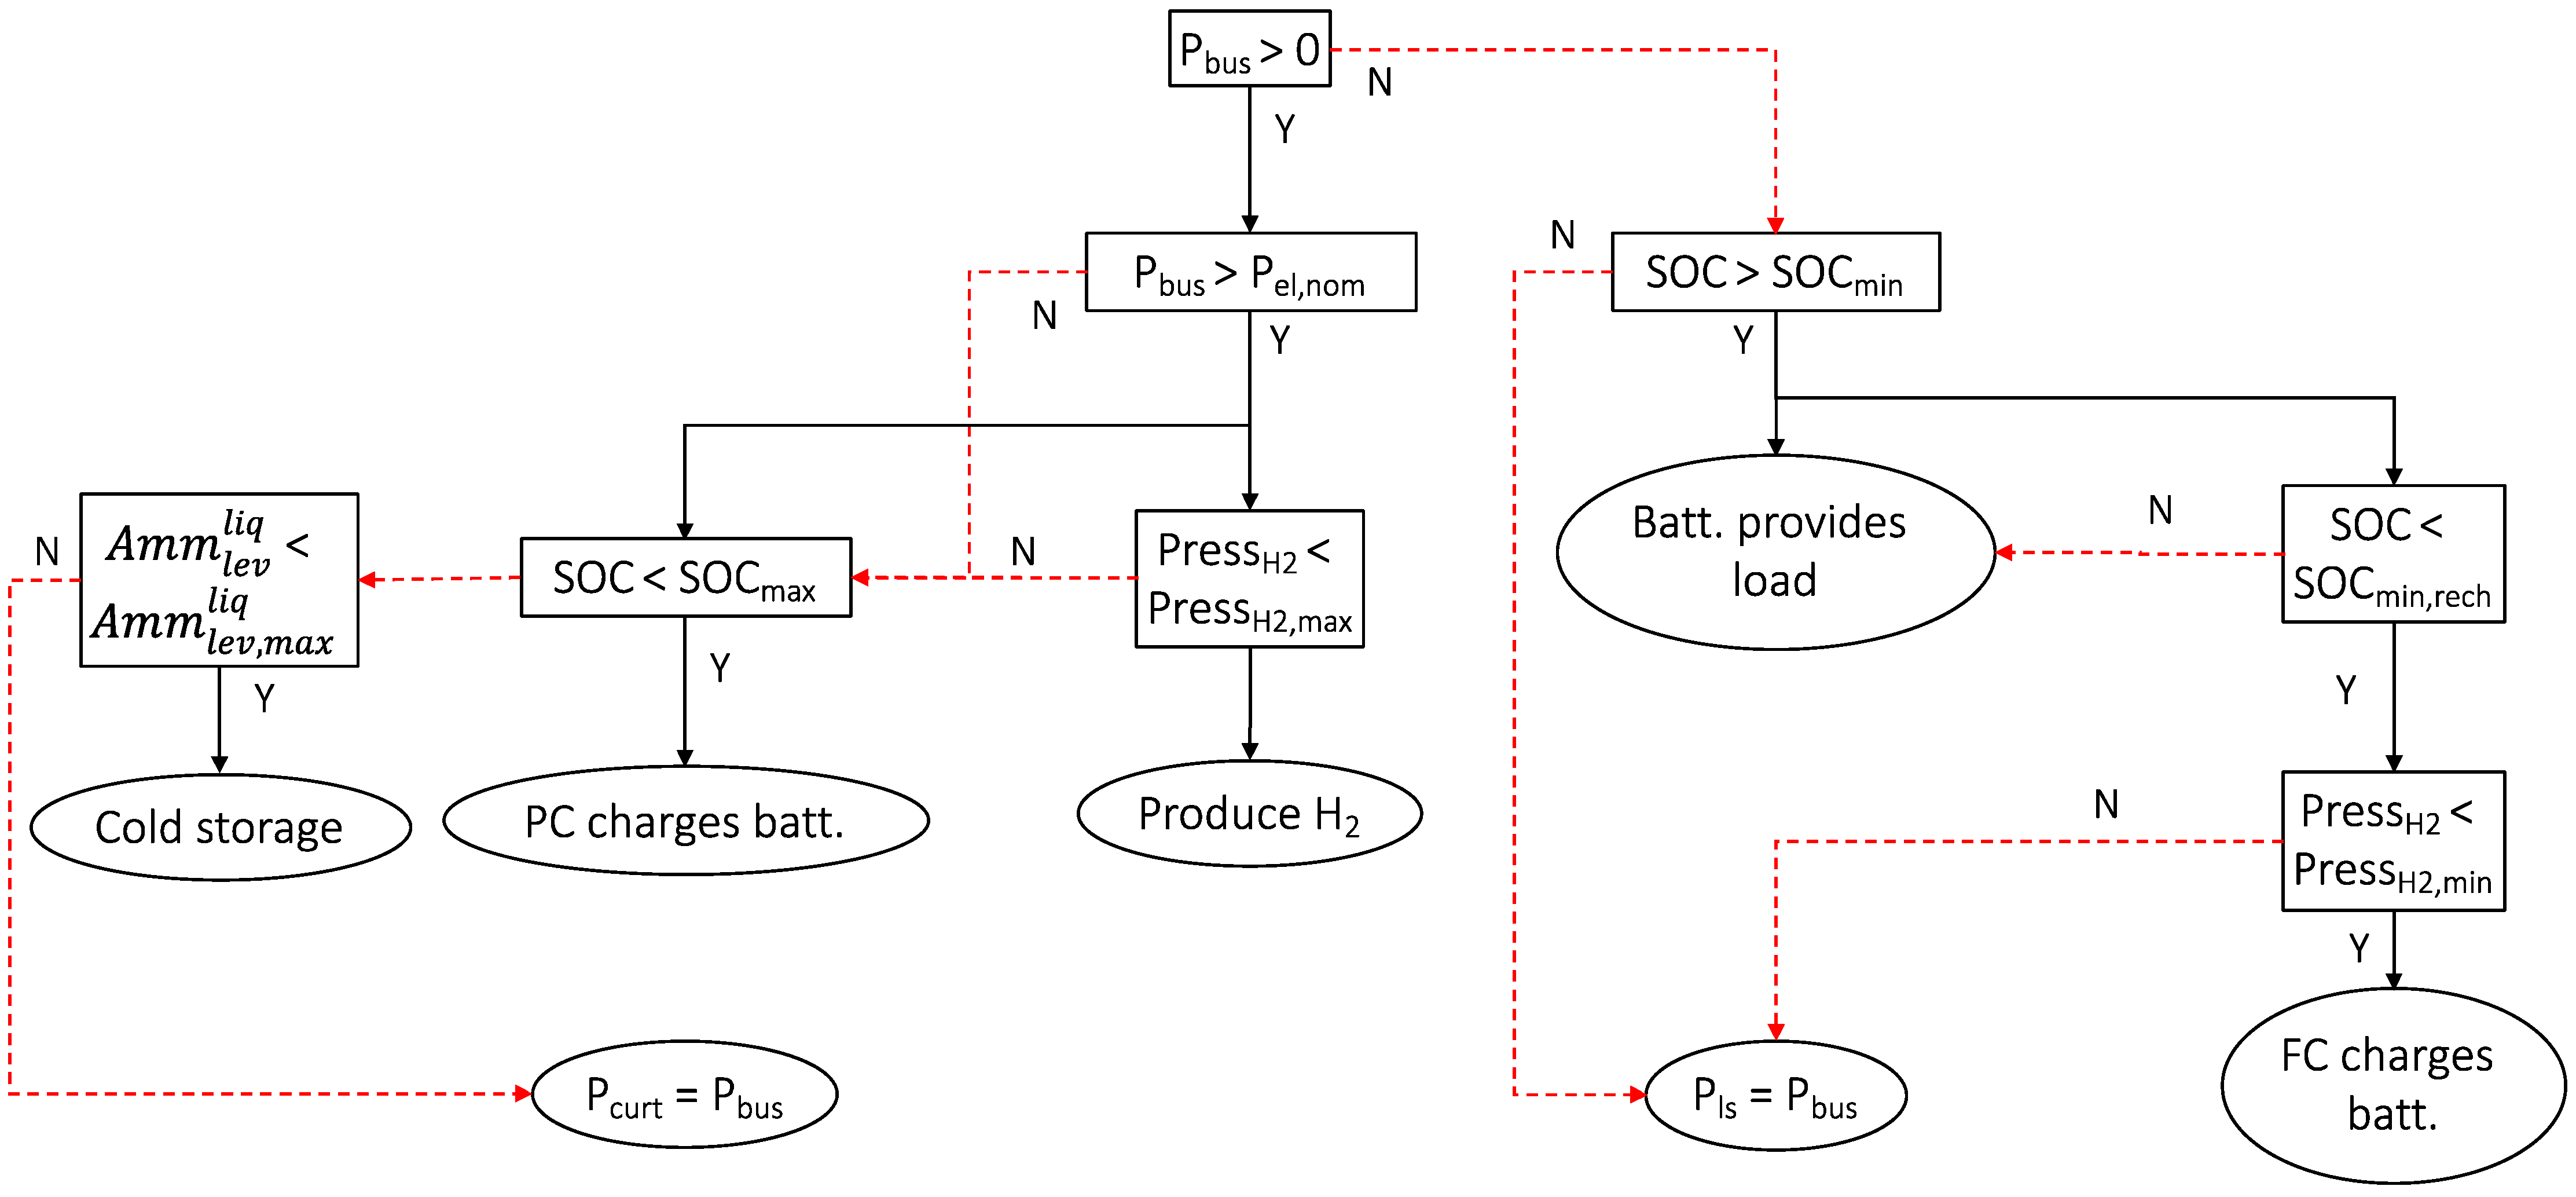
4.1. Electrical Power Management
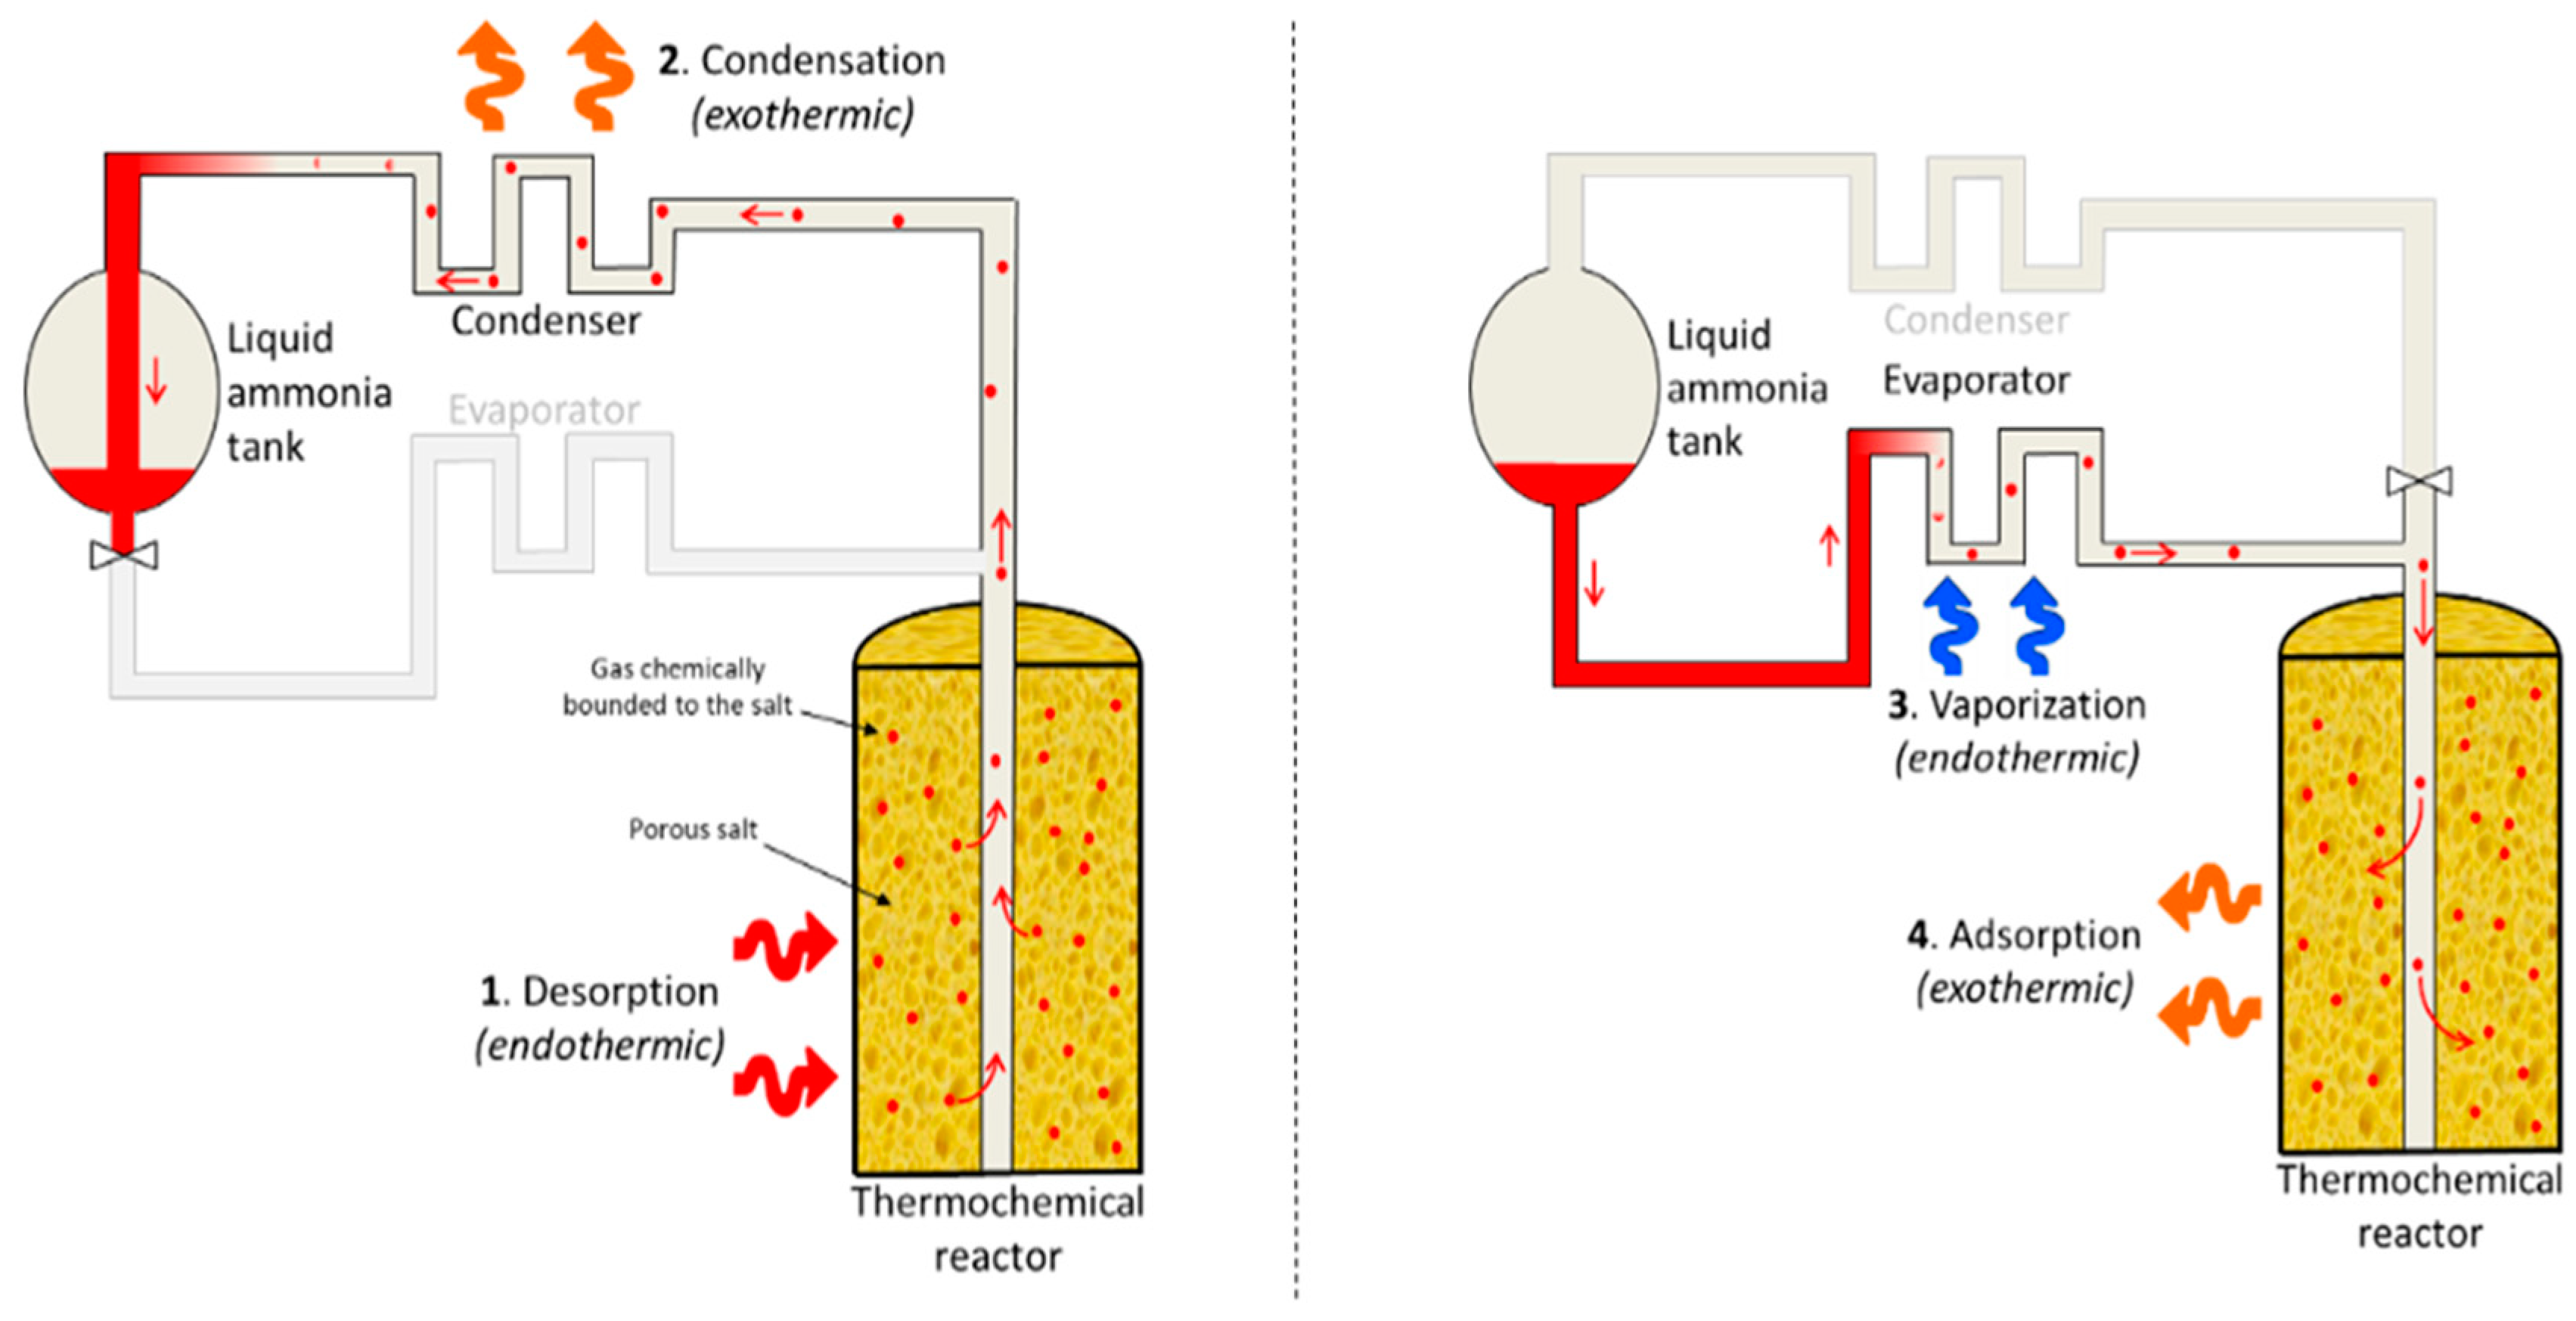
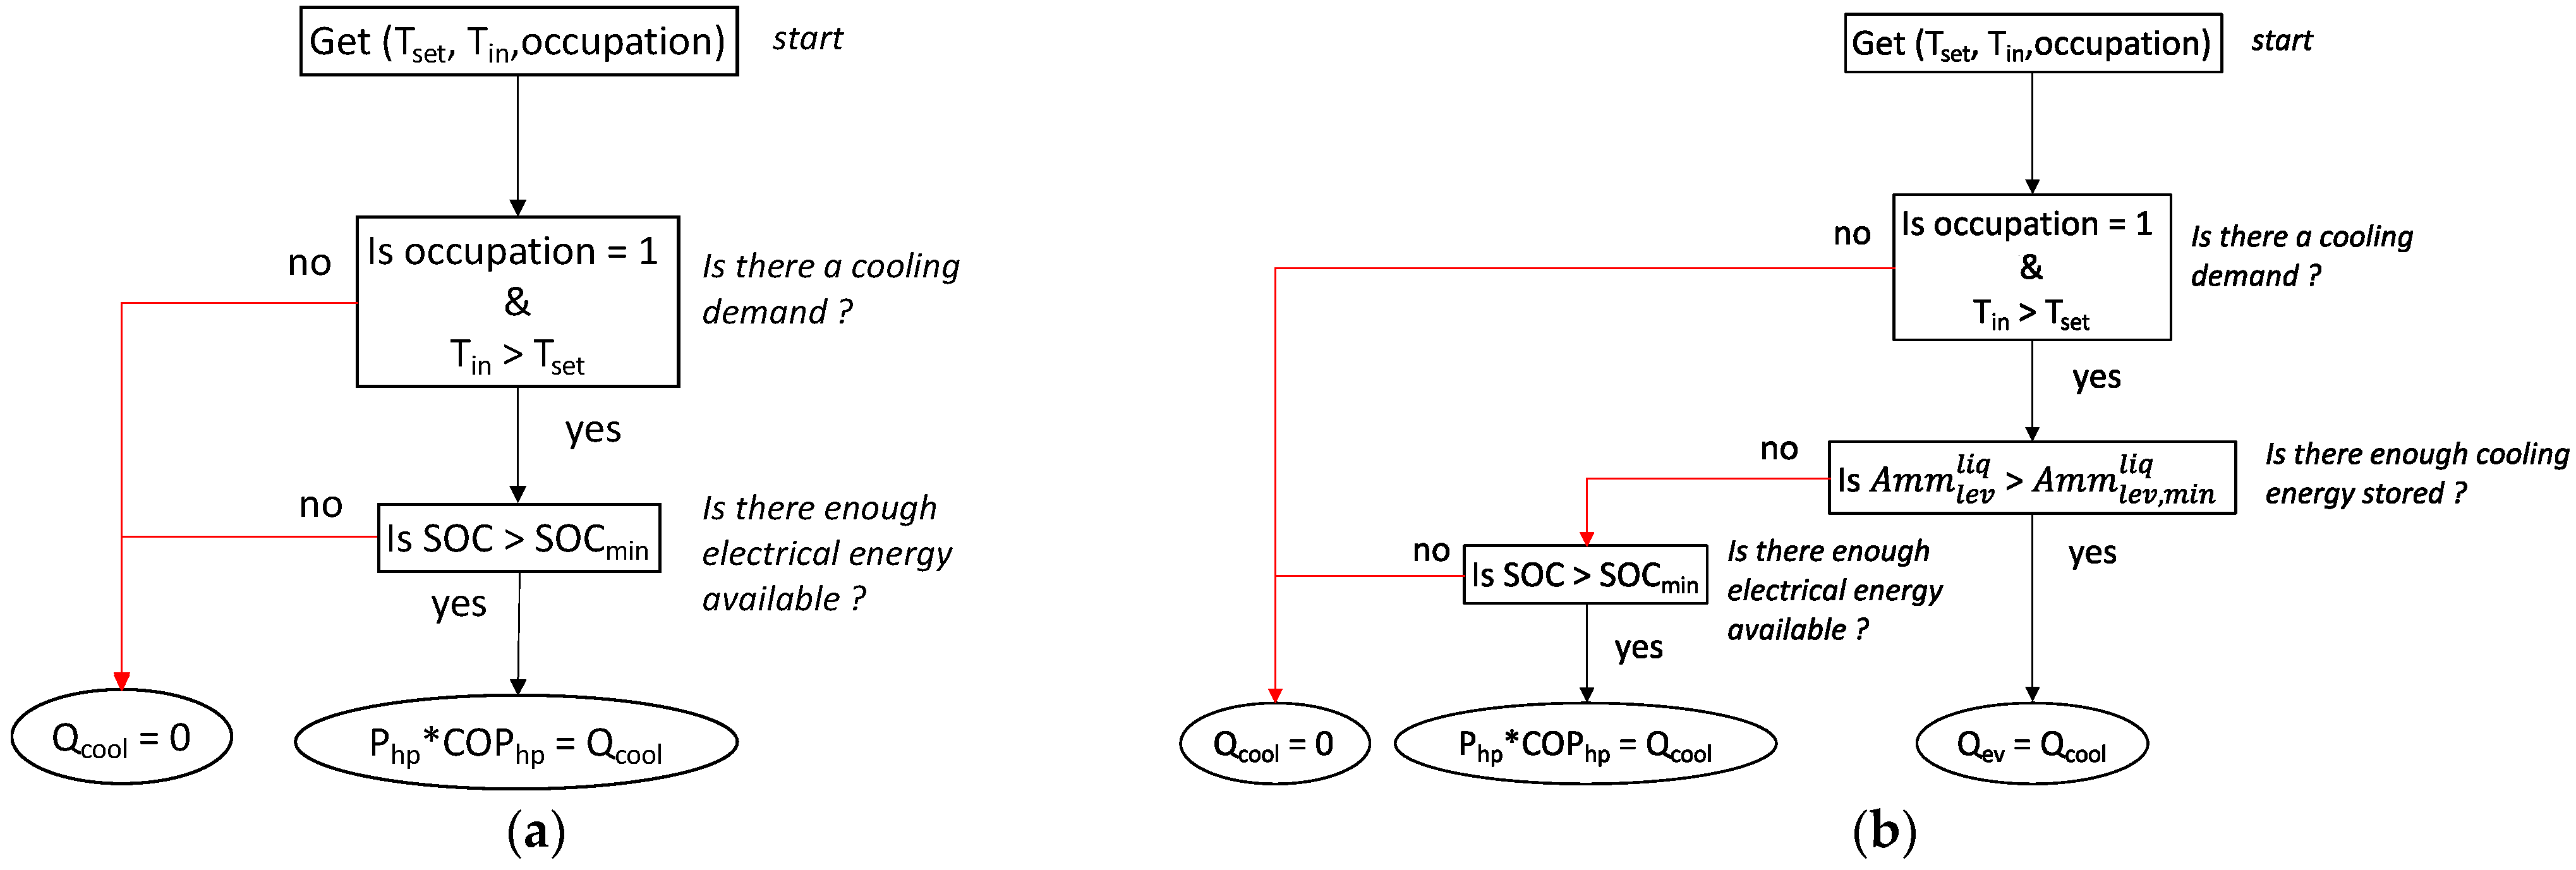
4.2. Thermal Management
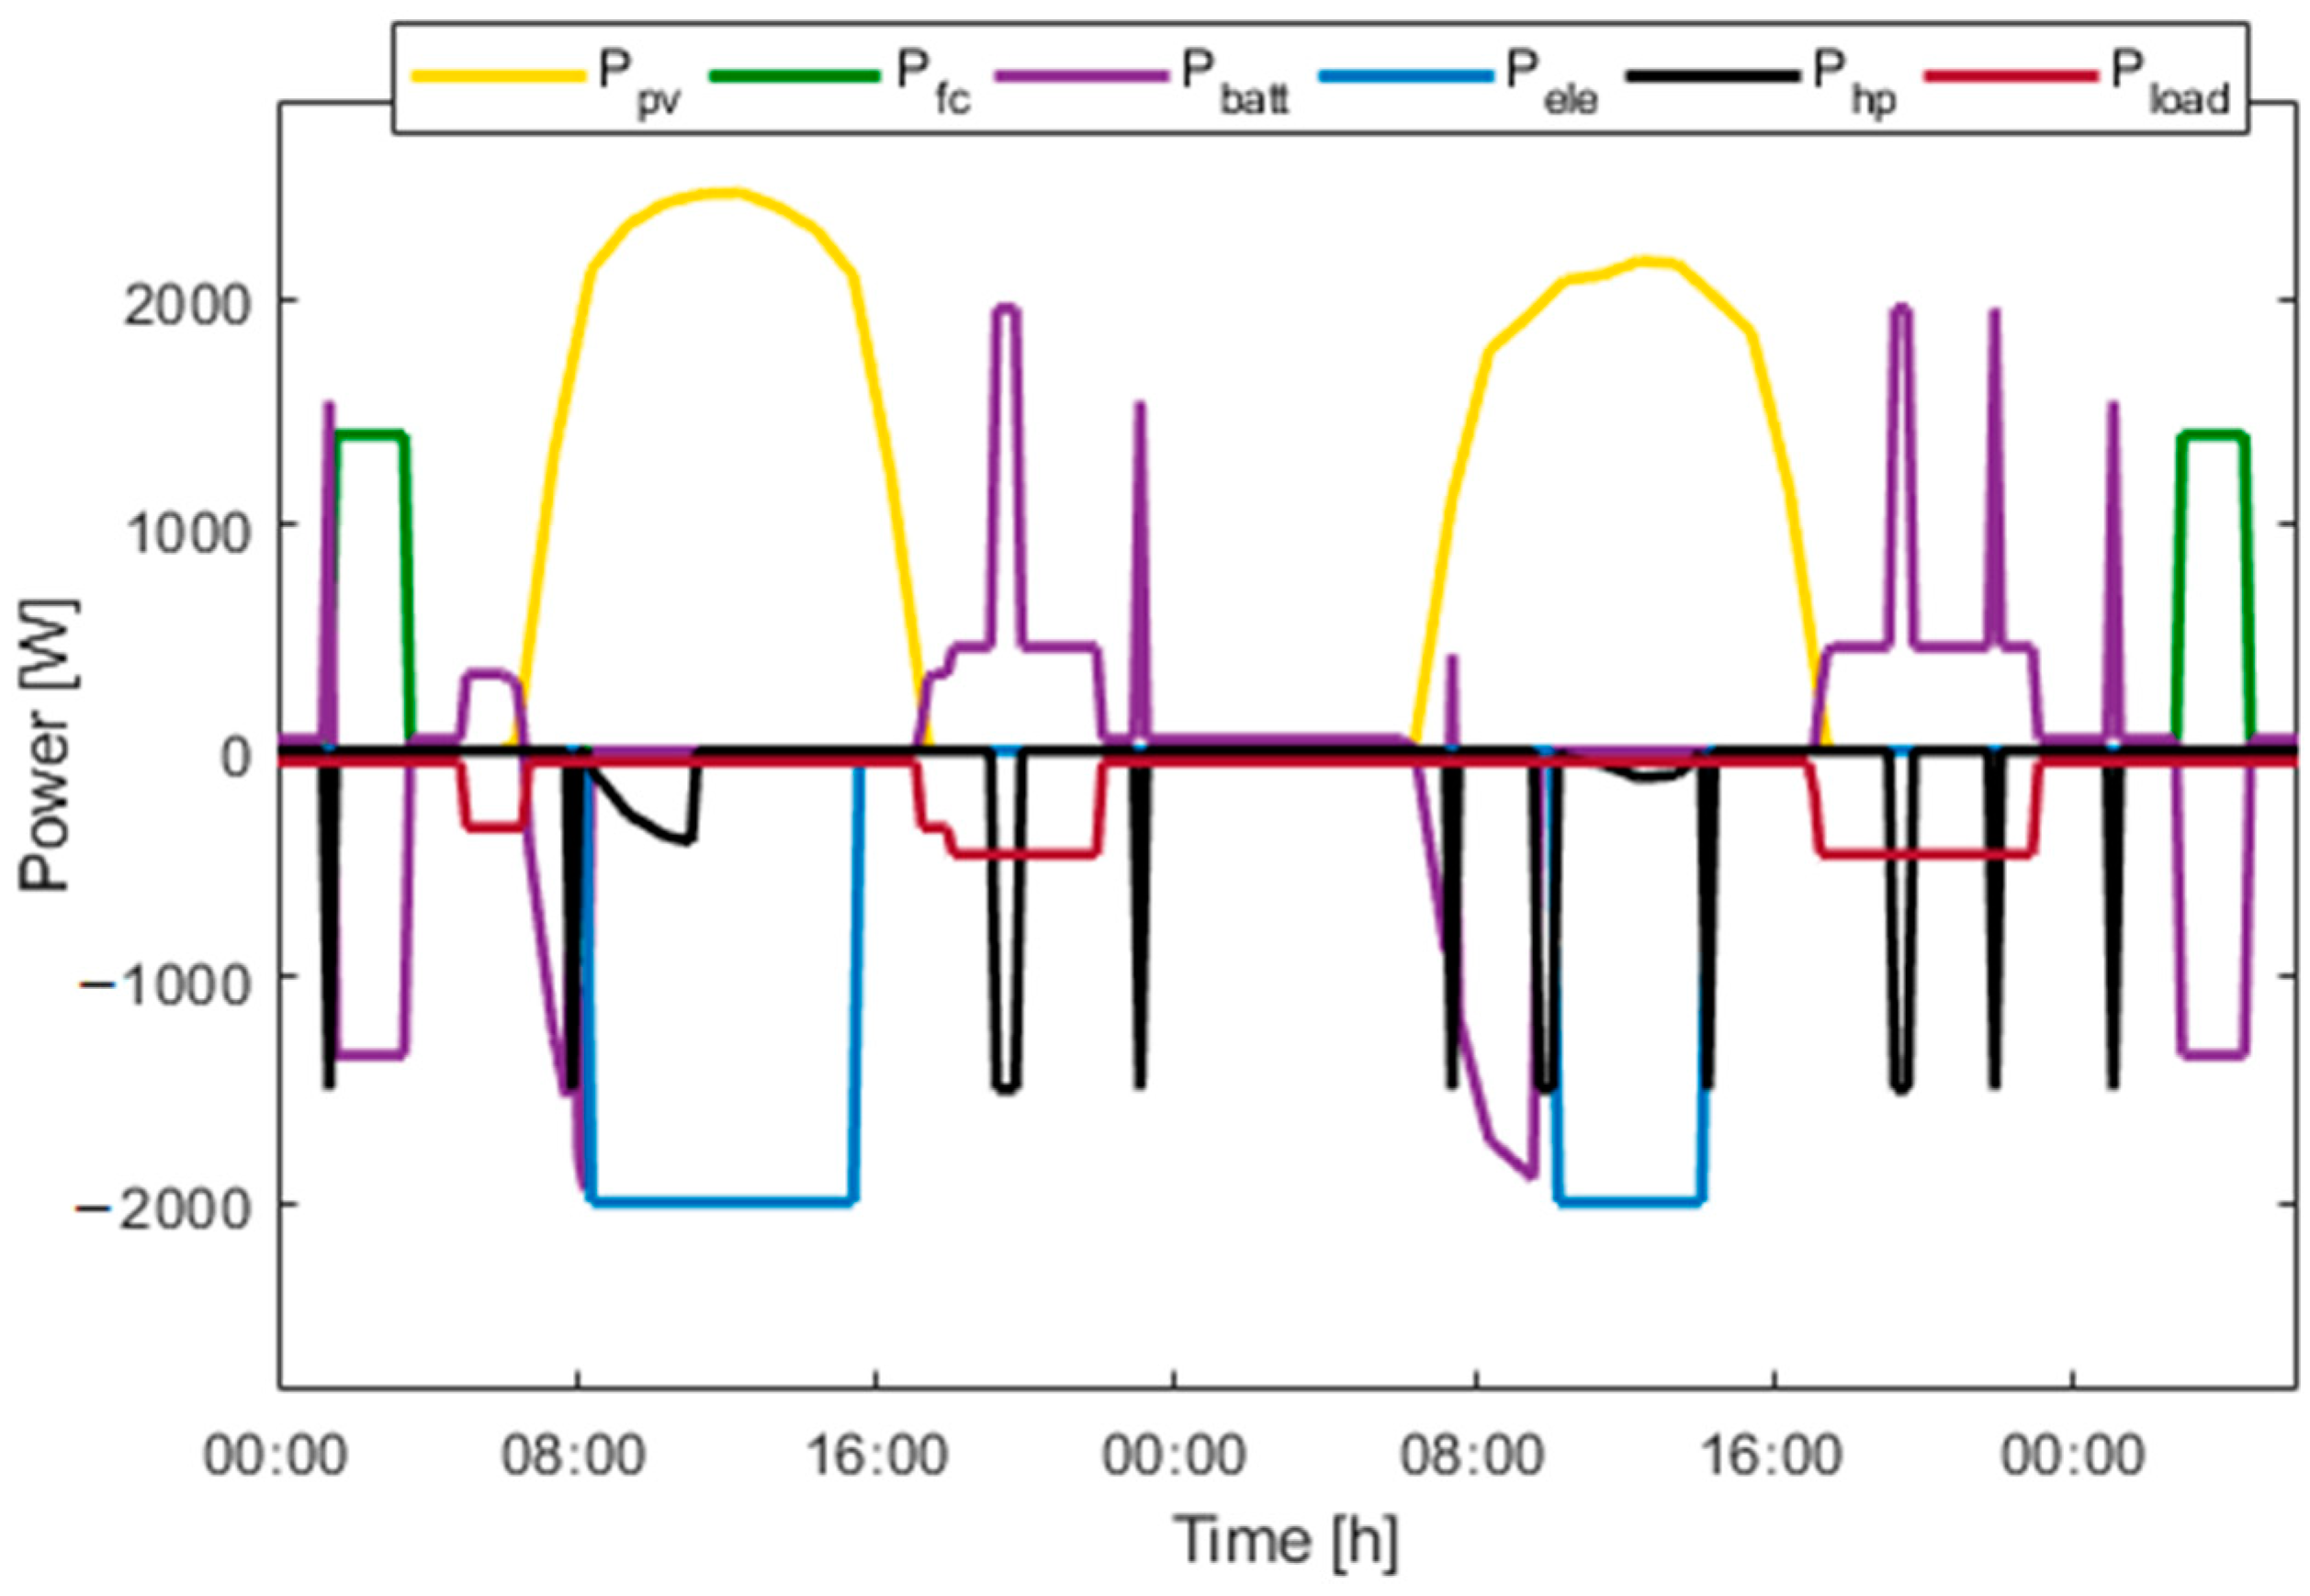
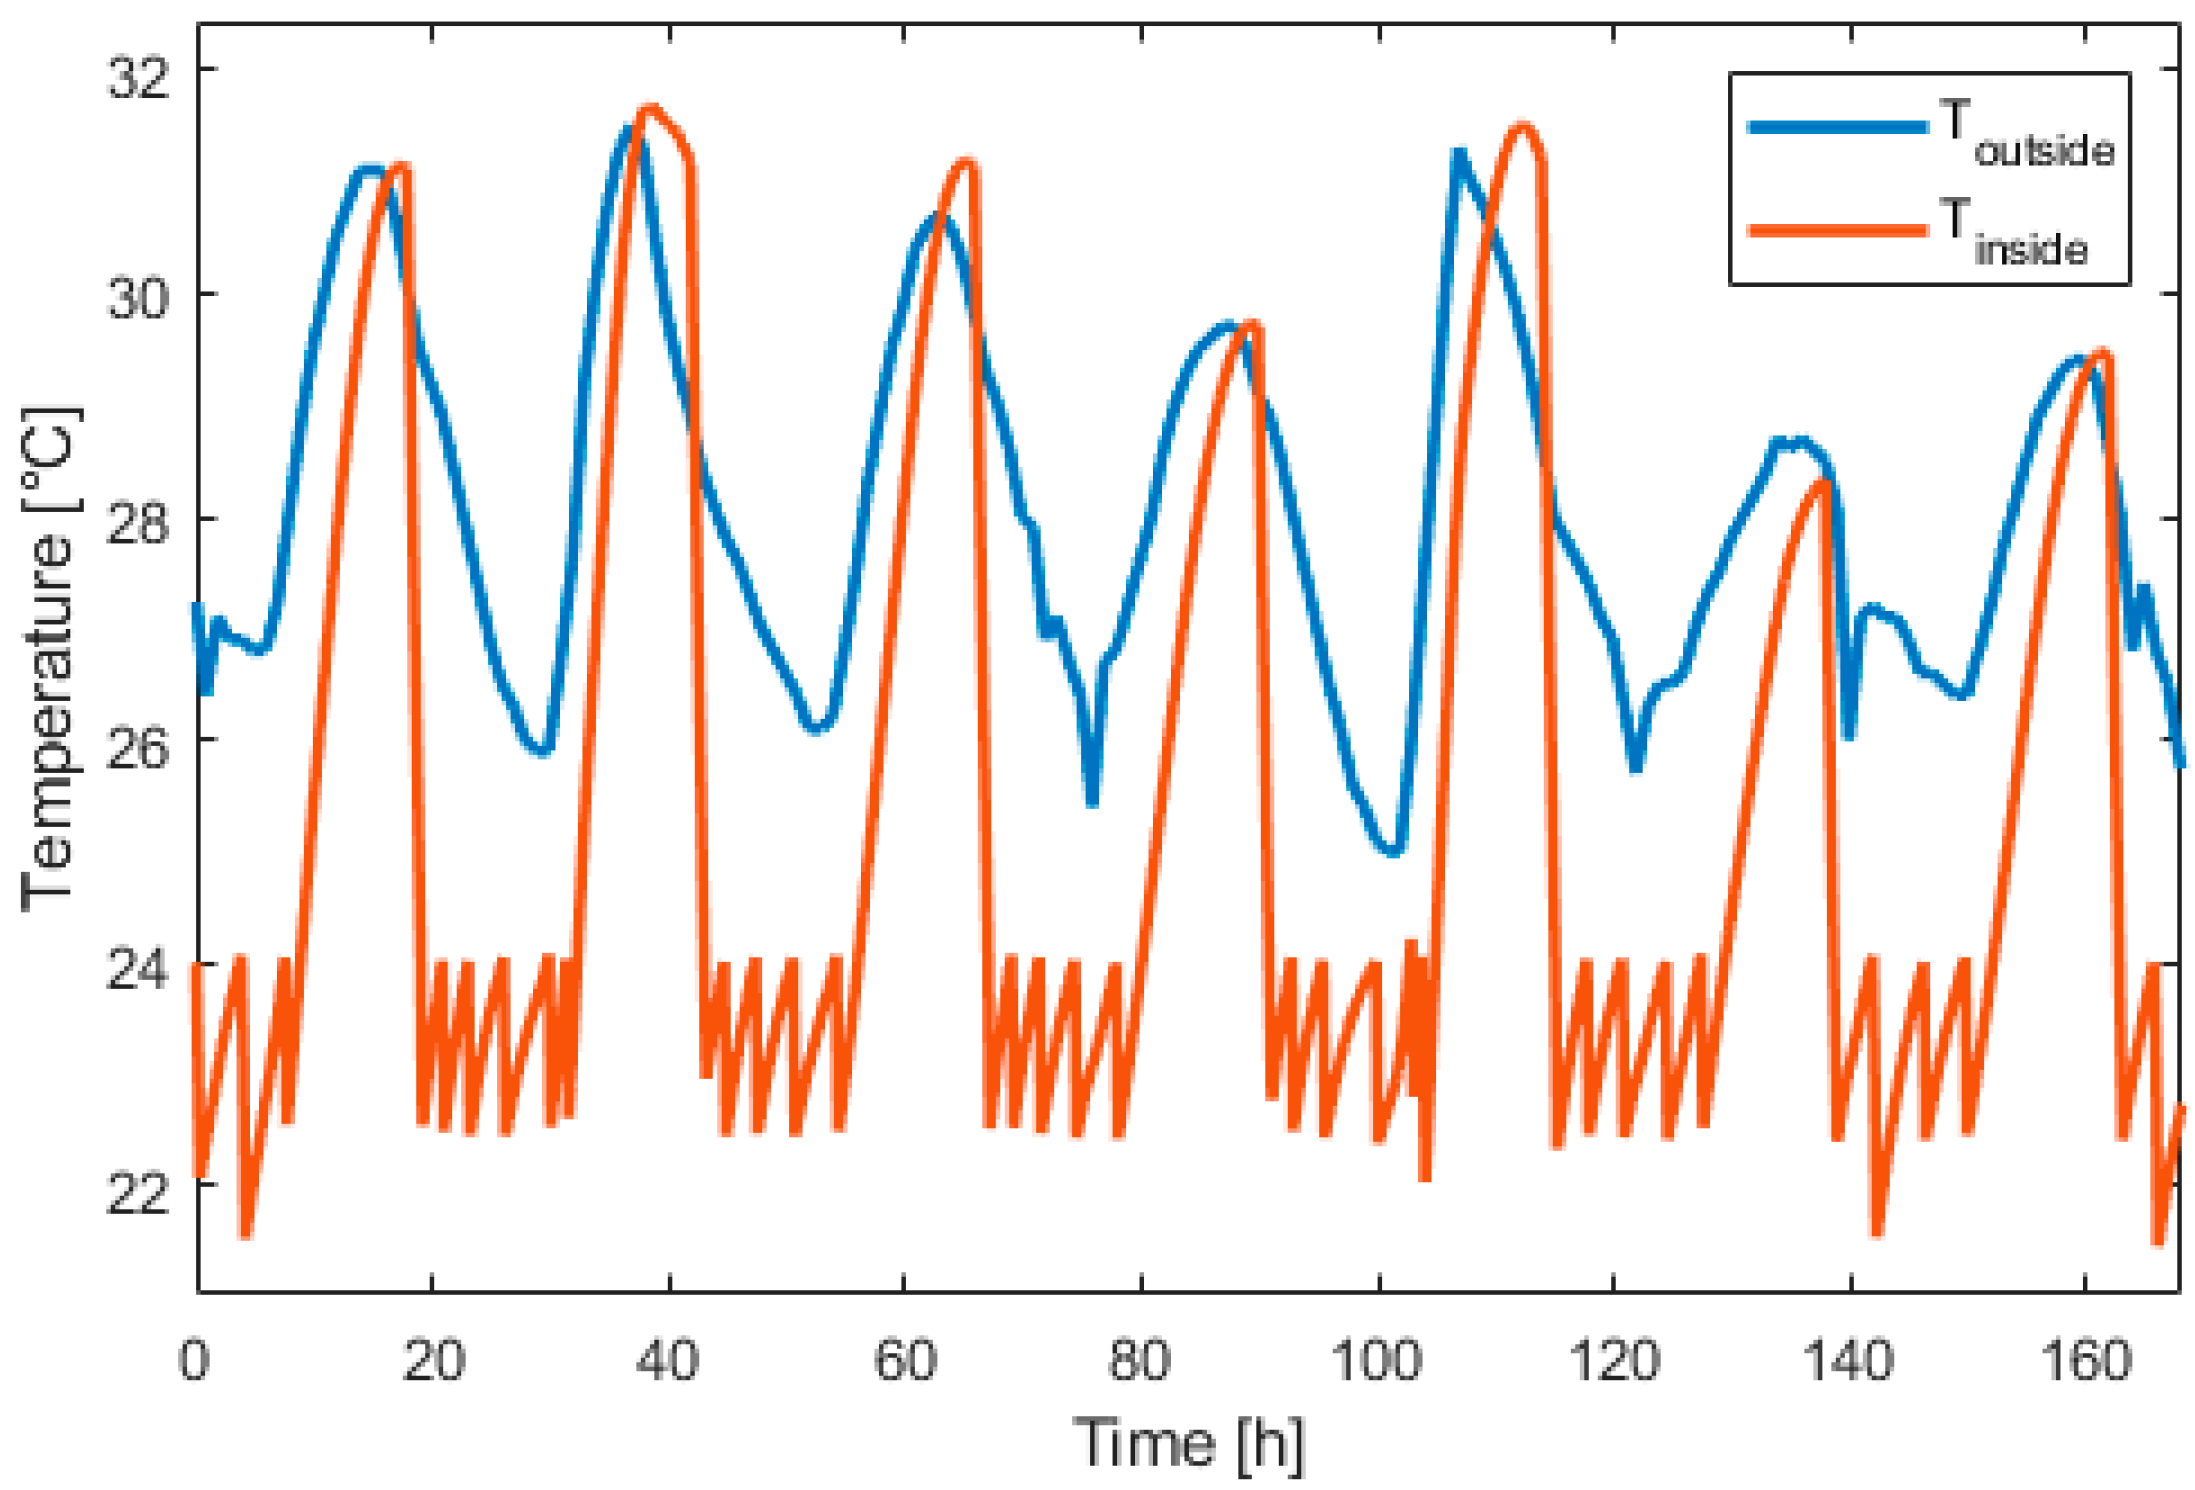
5. Results
6. Conclusions and Perspectives
Author Contributions
Funding
Data Availability Statement
Acknowledgments
Conflicts of Interest
References
- Transition énergétique. Available online: https://www.edt.pf/transition-energetique-innovation (accessed on 26 November 2020).
- Hopuare, M.; Lucas-Svay, L.; Ortega, P.; Lucas, F.; Laurent, V. Assessing Solar resource and photovoltaic production in tahiti from ground-based measurements. E3S Web Conf. 2019, 107, 01003. [Google Scholar] [CrossRef]
- Elmer, T.; Worall, M.; Wu, S.; Riffat, S.B. Fuel cell technology for domestic built environment applications: State of-the-art review. Renew. Sustain. Energy Rev. 2015, 42, 913–931. [Google Scholar] [CrossRef]
- Di Marcoberardino, G.; Manzolini, G.; Guignard, C.; Magaud, V. Optimization of a micro-CHP system based on polymer electrolyte membrane fuel cell and membrane reactor from economic and life cycle assessment point of view. Chem. Eng. Process. Process Intensif. 2018, 131, 70–83. [Google Scholar] [CrossRef]
- Briguglio, N.; Ferraro, M.; Brunaccini, G.; Antonucci, V. Evaluation of a Low Temperature Fuel Cell System for Residential CHP. Int. J. Hydrogen Energy 2011, 36, 8023–8029. [Google Scholar] [CrossRef]
- Pahon, E.; Morando, S.; Petrone, R.; Péra, M.-C.; Hissel, D.; Yousfi-Steiner, N.; Jemei, S.; Gouriveau, R.; Chamagne, D.; Moçotéguy, P.; et al. Long-term tests duration reduction for PEMFC μ-CHP application. Int. J. Hydrogen Energy 2017, 42, 1527–1533. [Google Scholar] [CrossRef]
- Assaf, J.; Shabani, B. Economic analysis and assessment of a standalone solar-hydrogen combined heat and power system integrated with solar-thermal collectors. Int. J. Hydrogen Energy 2016, 41, 18389–18404. [Google Scholar] [CrossRef]
- Lacko, R.; Drobnič, B.; Mori, M.; Sekavčnik, M.; Vidmar, M. Stand-alone renewable combined heat and power system with hydrogen technologies for household application. Energy 2014, 77, 164–170. [Google Scholar] [CrossRef]
- Lambert, H.; Roche, R.; Jemeï, S.; Ortega, P.; Hissel, D. Cogénération, Trigénération et Gestion de l’énergie Des Systèmes Stationnaires à Base de Piles à Combustible. Etat de l’art 2020. [Google Scholar] [CrossRef]
- Bortolini, M.; Gamberi, M.; Graziani, A. Technical and economic design of photovoltaic and battery energy storage system. Energy Convers. Manag. 2014, 86, 81–92. [Google Scholar] [CrossRef]
- Sloop, S.E.; Kerr, J.B.; Kinoshita, K. The Role of Li-Ion Battery Electrolyte Reactivity in Performance Decline and Self-Discharge. J. Power Sources 2003, 119–121, 330–337. [Google Scholar] [CrossRef]
- Züttel, A.; Remhof, A.; Borgschulte, A.; Friedrichs, O. Hydrogen: The future energy carrier. Philos. Trans. R. Soc. Math. Phys. Eng. Sci. 2010, 368, 3329–3342. [Google Scholar] [CrossRef]
- Zhang, Y.; Campana, P.E.; Lundblad, A.; Yan, J. Comparative study of hydrogen storage and battery storage in grid connected photovoltaic system: Storage sizing and rule-based operation. Appl. Energy 2017, 201, 397–411. [Google Scholar] [CrossRef]
- Avril, S.; Arnaud, G.; Florentin, A.; Vinard, M. Multi-objective optimization of batteries and hydrogen storage technologies for remote photovoltaic systems. Energy 2010, 35, 5300–5308. [Google Scholar] [CrossRef]
- Gray, E.M.A.; Webb, C.J.; Andrews, J.; Shabani, B.; Tsai, P.J.; Chan, S.L.I. Hydrogen Storage for off-grid power supply. Int. J. Hydrogen Energy 2011, 36, 654–663. [Google Scholar] [CrossRef]
- Nguyen, H.Q.; Shabani, B. Proton exchange membrane fuel cells heat recovery opportunities for combined heating/cooling and power applications. Energy Convers. Manag. 2019, 204, 112328. [Google Scholar] [CrossRef]
- Oro, M.V.; de Oliveira, R.G.; Bazzo, E. An Integrated solution for waste heat recovery from fuel cells applied to adsorption systems. Appl. Therm. Eng. 2018, 136, 747–754. [Google Scholar] [CrossRef]
- Palomba, V.; Ferraro, M.; Frazzica, A.; Vasta, S.; Sergi, F.; Antonucci, V. Dynamic simulation of a multi-generation system, for electric and cooling energy provision, employing a SOFC cogenerator and an adsorption chiller. Energy Procedia 2017, 143, 416–423. [Google Scholar] [CrossRef]
- Mehrpooya, M.; Sadeghzadeh, M.; Rahimi, A.; Pouriman, M. Technical performance analysis of a combined cooling heating and power (CCHP) system based on solid oxide fuel cell (SOFC) technology—A building application. Energy Convers. Manag. 2019, 198, 111767. [Google Scholar] [CrossRef]
- Weber, C.; Maréchal, F.; Favrat, D.; Kraines, S. Optimization of an SOFC-based decentralized polygeneration system for providing energy services in an office-building in Tōkyō. Appl. Therm. Eng. 2006, 26, 1409–1419. [Google Scholar] [CrossRef] [Green Version]
- Tse, L.K.C.; Wilkins, S.; McGlashan, N.; Urban, B.; Martinez-Botas, R. Solid oxide fuel cell/gas turbine trigeneration system for marine applications. J. Power Sources 2011, 196, 3149–3162. [Google Scholar] [CrossRef]
- Li, B.; Roche, R.; Paire, D.; Miraoui, A. Sizing of a stand-alone microgrid considering electric power, cooling/heating, hydrogen loads and hydrogen storage degradation. Appl. Energy 2017, 205, 1244–1259. [Google Scholar] [CrossRef] [Green Version]
- García, P.; Torreglosa, J.P.; Fernández, L.M.; Jurado, F. Optimal energy management system for stand-alone wind turbine/photovoltaic/hydrogen/battery hybrid system with supervisory control based on fuzzy logic. Int. J. Hydrogen Energy 2013, 38, 14146–14158. [Google Scholar] [CrossRef]
- Marino, C.; Nucara, A.; Panzera, M.F.; Pietrafesa, M.; Varano, V. Energetic and economic analysis of a stand alone photovoltaic system with hydrogen storage. Renew. Energy 2019, 142, 316–329. [Google Scholar] [CrossRef]
- Ferrucci, F.; Stitou, D.; Ortega, P.; Lucas, F. Mechanical compressor-driven thermochemical storage for cooling applications in tropical insular regions. Energy Procedia 2017, 142, 3415–3420. [Google Scholar] [CrossRef]
- Perrigot, A.; Perier-Muzet, M.; Ortega, P.; Stitou, D. Technical economic analysis of pv-driven electricity and cold cogeneration systems using particle swarm optimization algorithm. Energy 2020, 211, 119009. [Google Scholar] [CrossRef]
- Attemene, N.S.; Agbli, K.S.; Fofana, S.; Hissel, D. Optimal sizing of a wind, fuel cell, electrolyzer, battery and supercapacitor system for off-grid applications. Int. J. Hydrogen Energy 2020, 45, 5512–5525. [Google Scholar] [CrossRef]
- Ferrucci, F.; Stitou, D.; Ortega, P.; Lucas, F. Mechanical compressor-driven thermochemical storage for cooling applications in tropical insular regions. Concept and efficiency analysis. Appl. Energy 2018, 219, 240–255. [Google Scholar] [CrossRef]
- Projet RECIF – Site Web Du Projet RECIF. Available online: https://projetrecif.promes.cnrs.fr/ (accessed on 27 November 2020).
- Ferrucci, F. PV-Driven Vapor Compression Cycle Integrating Asolid-Gas Thermochemical Storage for Cooling Applications; Université de Polynésie Française: Faaa, French Polynesia, 2020. [Google Scholar]
- Oliveira, R.G.; Wang, R.Z.; Kiplagat, J.K.; Wang, C.Y. Novel composite sorbent for resorption systems and for chemisorption air conditioners driven by low generation temperature. Renew. Energy 2009, 34, 2757–2764. [Google Scholar] [CrossRef]


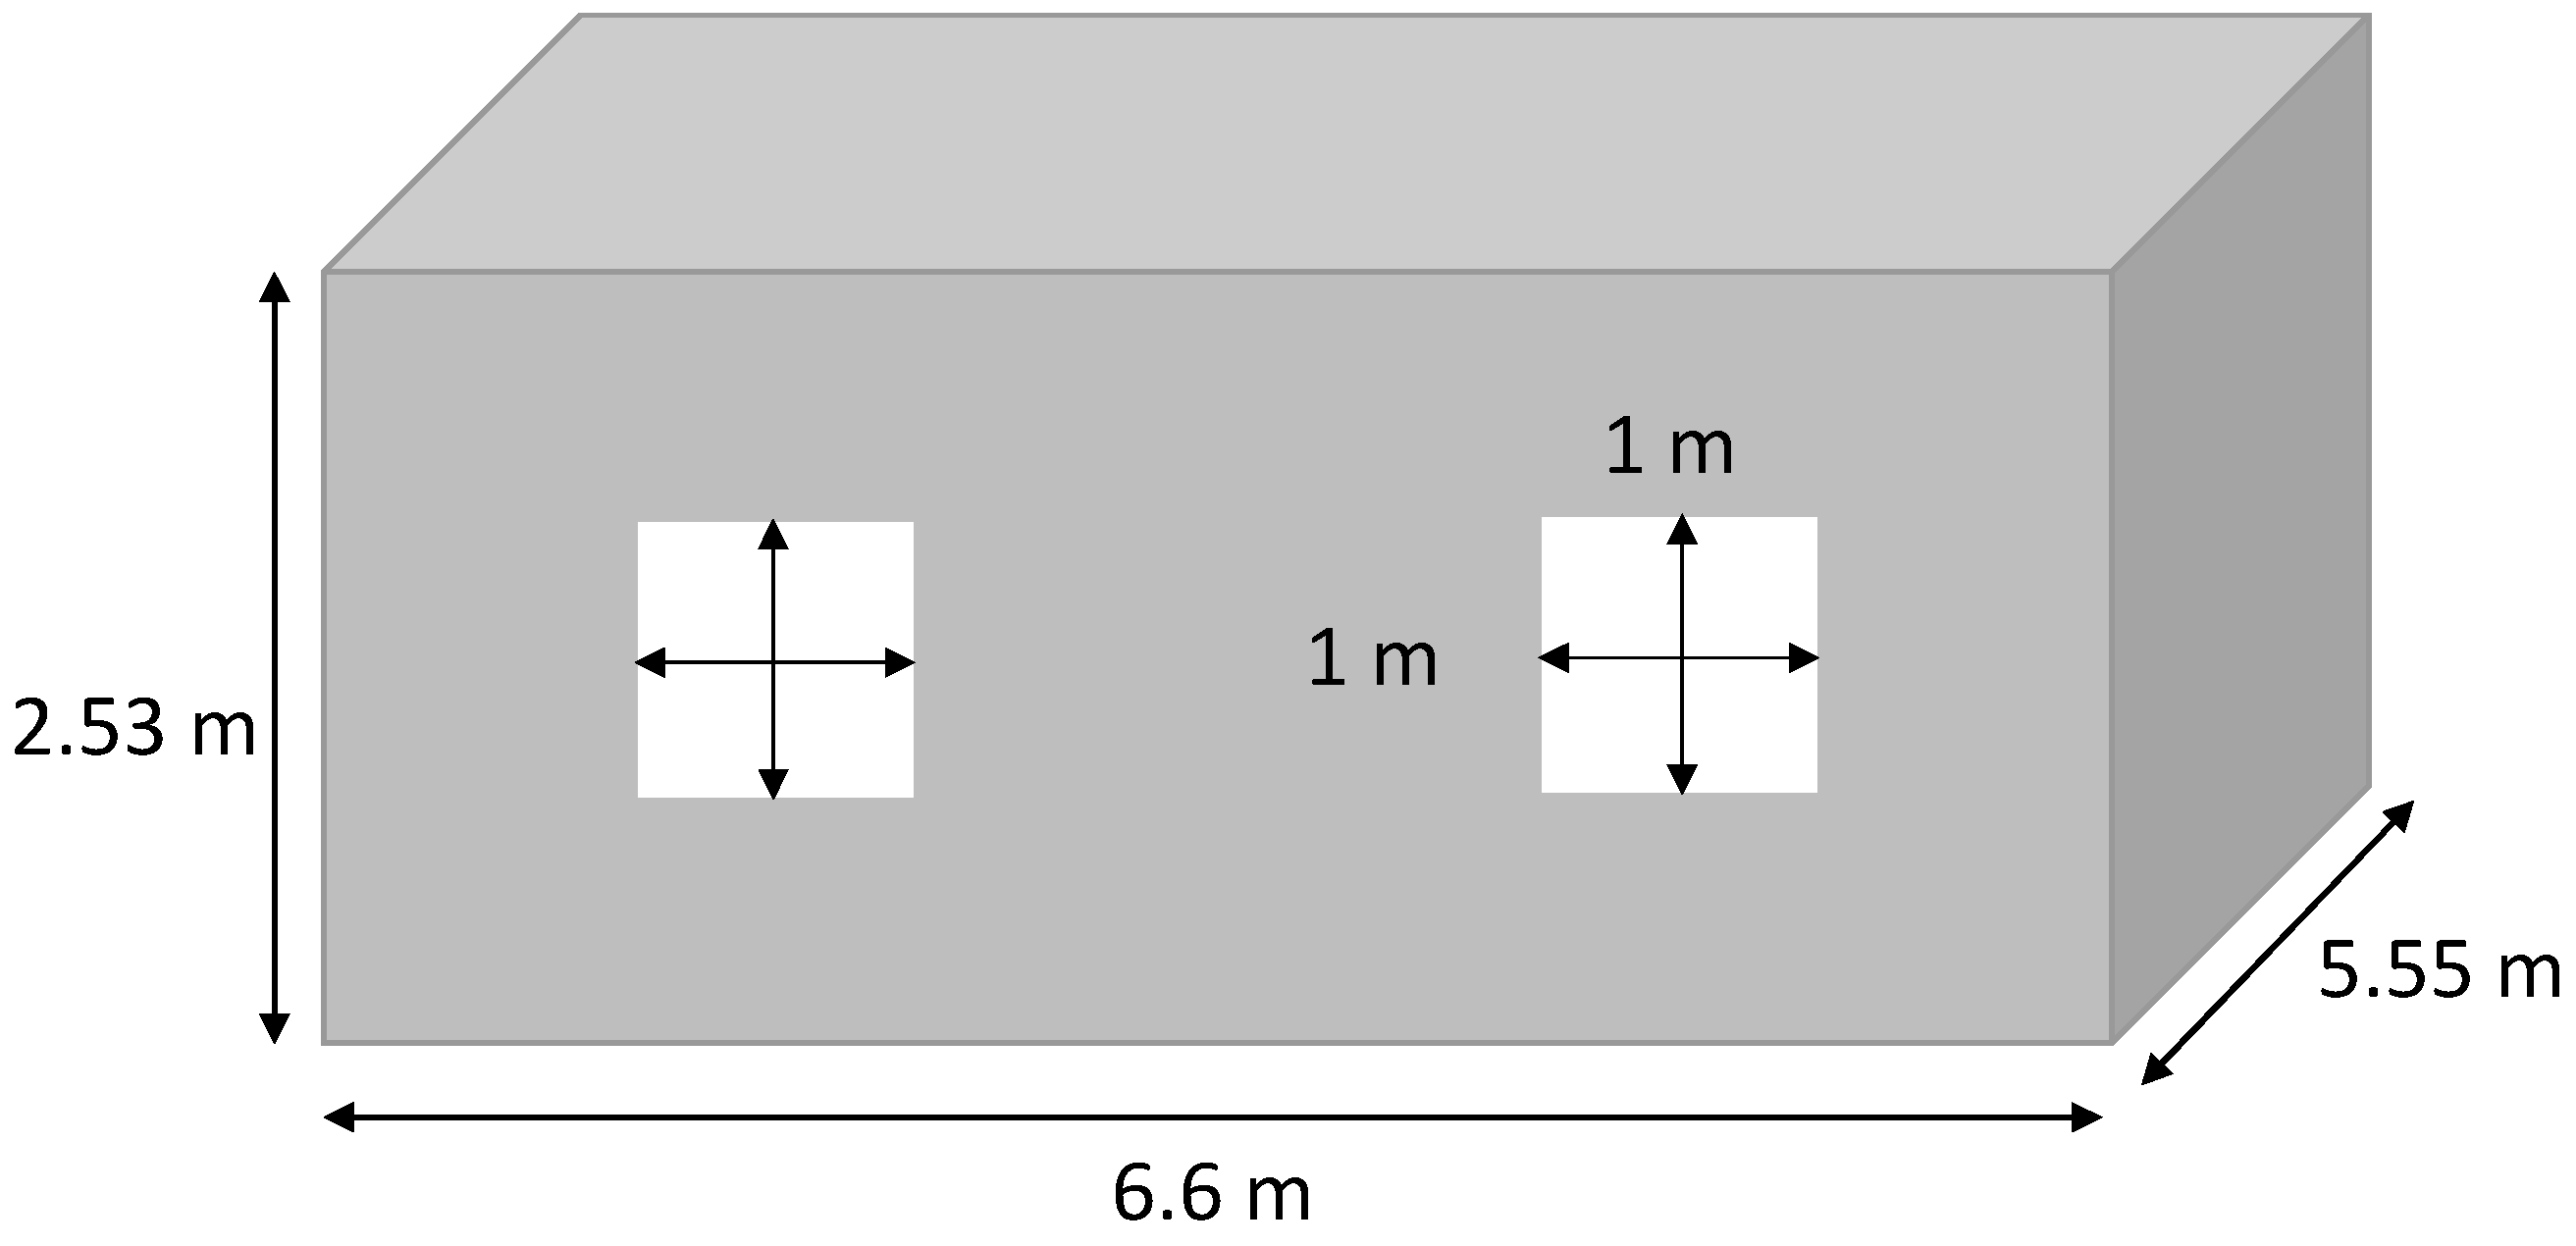
| Materials | Width (mm) | Surface (m2) | Thermal Conductivity (W/m/°C) | Overall Building Equivalent Resistance Req (°Cm2/W) | Total Air Mass (kg) | |
|---|---|---|---|---|---|---|
| Walls | Steel/Polystyrene/Steel | 0.5/50/0.5 | 127.5 | 0.038 | 0.0104 (U-value = 96.36 W/m2/°C) | 110 |
| Ceiling | PVC | 8 | 36.63 | 0.14 | ||
| Windows | Glass/air/glass | 3/13/3 | 4 | 0.78 |
| PV panels efficiency: | 0.2 |
| Fuel cell power/consumption: | 1.4 kW |
| Fuel cell consumption: | 0.96 Nm3/h |
| Fuel cell efficiency: | 0.54 |
| Electrolyzer production/consumption: | 0.5 Nm3/h |
| Electrolyzer consumption: | 2.1 kW |
| Electrolyzer efficiency: | 0.7 |
| Battery capacity: | 5.2 kWh |
| SOCmax | 1 |
| SOCmin | 0 |
| AC power consumption: Php | 1500 W |
| Electric loads: | Max 450 W |
| Hydrogen tank volume: V | 850 L |
| Hydrogen tank maximum pressure: PressH2,max | 60 bars |
| Hydrogen tank minimum pressure: PressH2,min | 0 |
| Ammonia maximum capacity: | 5 kWh |
| Ammonia minimum capacity: | 0 |
| Desorption by compressor at Tamb | COP1 | 2.25 [30] |
| Desorption by compressor assisted by a heat source at 50 °C | COP2 | 4.8 [28] |
| Thermal desorption without compressor work | COP3 | 0.46 [31] |
| MVC mode | COPhp | 4.2 [28] |
| Absence of Thermal Load | Tset = 26 °C | Tset = 24 °C | |
|---|---|---|---|
| Spv minimum (m2) | 10 | 10 | 12 |
| Tfc (h) | 23 | 86 | 306 |
| Number of starts, FC | 6 | 27 | 93 |
| Tele (h) | 40 | 81 | 242 |
| Number of starts, electrolyzer | 23 | 38 | 92 |
| Battery number of cycles | 215 | 241 | 273 |
| Cooling ratio (%) | NA | 71 | 53 |
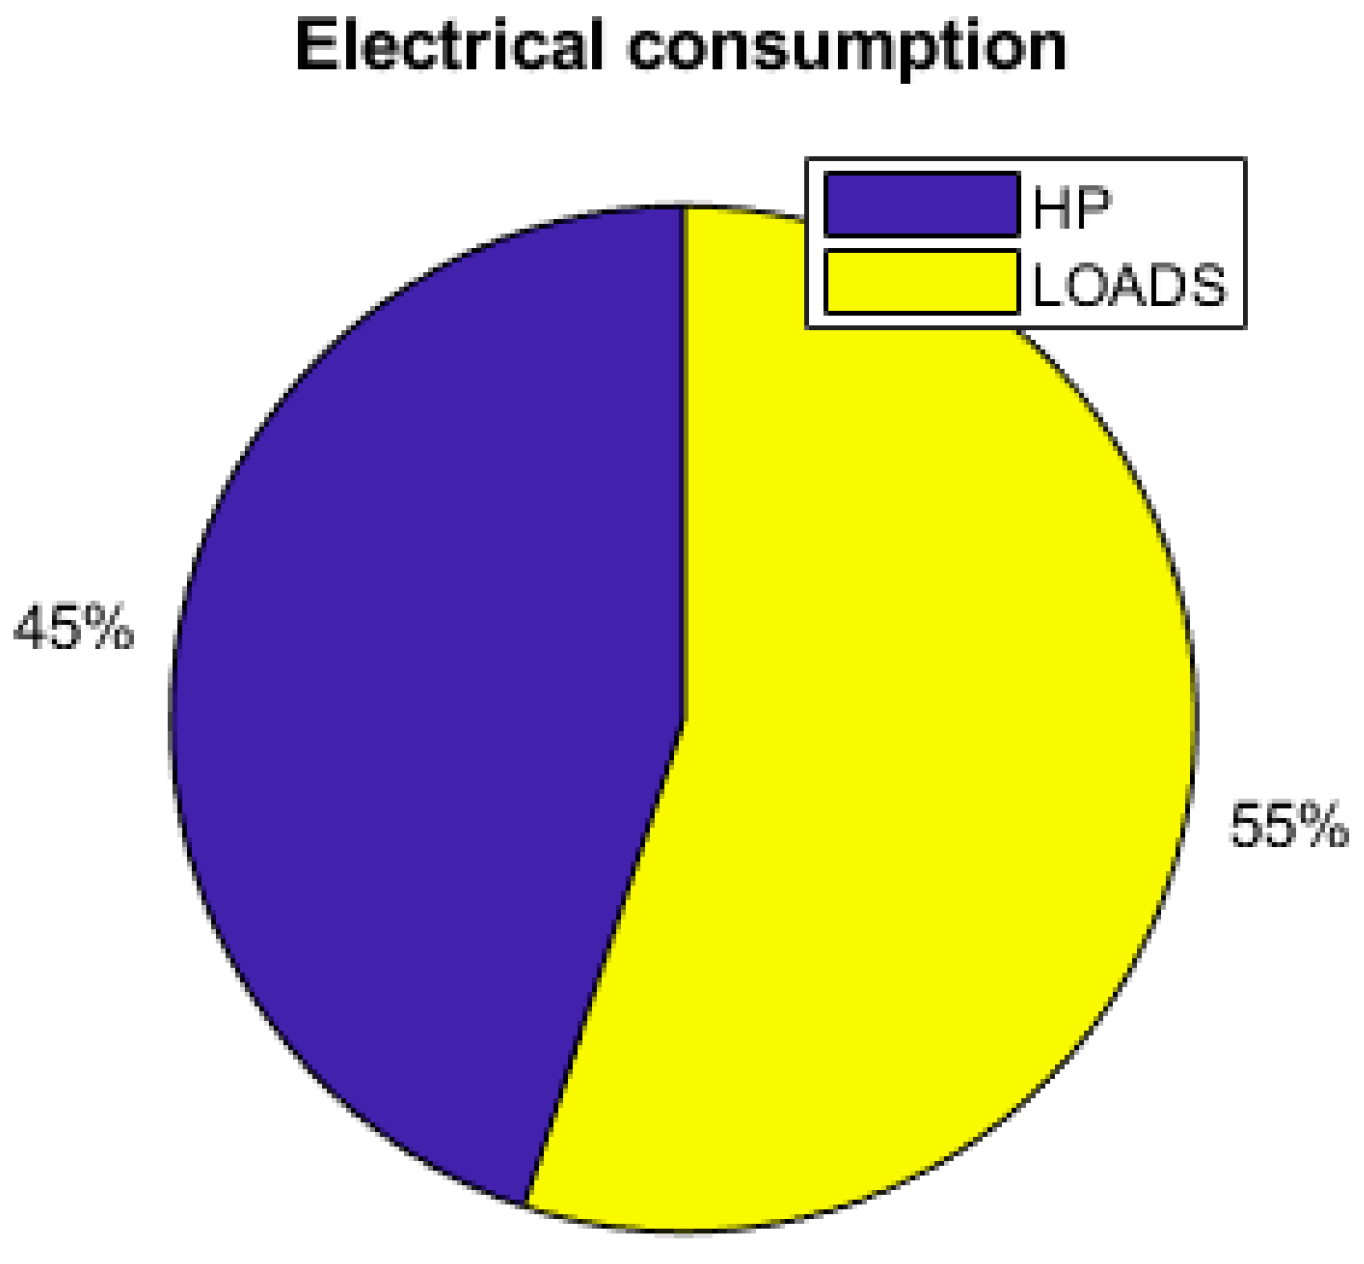
| Ehp/Etot (%) | NA | 45 | 45 |
| Epvloss (%) | 70.5 | 52 | 52 |
| Thot (h) | NA | 292 | 377 |
| With TCS | Without TCS | TCS Effects | |
|---|---|---|---|
| Spv minimum (m2) | 12 | 14 | −14% |
| Tfc (h) | 306 | 758 | −60% |
| Number of starts, FC | 93 | 217 | −57% |
| Tele (h) | 242 | 629 | −62% |
| Number of starts, electrolyzer | 92 | 201 | −54% |
| Battery number of cycles | 273 | 307 | −11% |
| Ehp/Etot (%) | 45 | 29 | +16% |
| Epvloss (%) | 52 | 59 | −7% |
| Thot (h) | 377 | 254 | +48% |
| 5 kWh TCS | 10 kWh TCS | 15 kWh TCS | |
|---|---|---|---|
| Spv minimum (m2) | 12 | 12 | 10 |
| Cooling ratio (%) | 53 | 85 | 96 |
| Epvloss (%) | 52 | 50 | 40 |
| Thot (h) | 377 | 388 | 390 |
Publisher’s Note: MDPI stays neutral with regard to jurisdictional claims in published maps and institutional affiliations. |
© 2021 by the authors. Licensee MDPI, Basel, Switzerland. This article is an open access article distributed under the terms and conditions of the Creative Commons Attribution (CC BY) license (https://creativecommons.org/licenses/by/4.0/).
Share and Cite
Lambert, H.; Roche, R.; Jemeï, S.; Ortega, P.; Hissel, D. Combined Cooling and Power Management Strategy for a Standalone House Using Hydrogen and Solar Energy. Hydrogen 2021, 2, 207-224. https://0-doi-org.brum.beds.ac.uk/10.3390/hydrogen2020011
Lambert H, Roche R, Jemeï S, Ortega P, Hissel D. Combined Cooling and Power Management Strategy for a Standalone House Using Hydrogen and Solar Energy. Hydrogen. 2021; 2(2):207-224. https://0-doi-org.brum.beds.ac.uk/10.3390/hydrogen2020011
Chicago/Turabian StyleLambert, Hugo, Robin Roche, Samir Jemeï, Pascal Ortega, and Daniel Hissel. 2021. "Combined Cooling and Power Management Strategy for a Standalone House Using Hydrogen and Solar Energy" Hydrogen 2, no. 2: 207-224. https://0-doi-org.brum.beds.ac.uk/10.3390/hydrogen2020011