Article

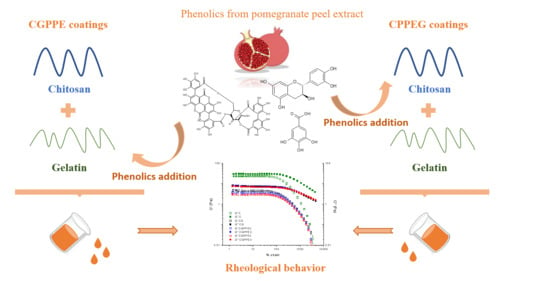
Rheological Characterization of the Influence of Pomegranate Peel Extract Addition and Concentration in Chitosan and Gelatin Coatings

by
Mirella Romanelli Vicente Bertolo
,
Rafael Leme
,
Virginia da Conceição Amaro Martins
,
Ana Maria de Guzzi Plepis
and
Stanislau Bogusz Junior
*
Sao Carlos Institute of Chemistry (IQSC), University of Sao Paulo (USP), Avenida do Trabalhador Sao Carlense, 400-Parque Arnold Schimidt, Sao Carlos 13566-590, SP, Brazil
*
Author to whom correspondence should be addressed.
Submission received: 1 July 2021 / Revised: 29 July 2021 / Accepted: 2 August 2021 / Published: 7 August 2021

Abstract

:
In this study, the effects of an agro-industrial residue with active properties, pomegranate peel extract (PPE), were evaluated on the rheological properties of potential coatings based on chitosan (C) and gelatin (G). For this, rheological properties of the polymeric solutions were investigated in relation to PPE concentration (2 or 4 mg PPE g−1 solution), and to its incorporation order into the system (in C or in CG mixture). All solutions were more viscous than elastic (G″ > G′), and the change in PPE concentration had a greater influence accentuating the viscous character of the samples in which PPE was added to the CG mixture (CGPPE2 and CGPPE4). PPE addition to the CG mixture increased the angular frequency at the moduli crossover, indicating the formation of a more resistant polymeric network. This tendency was also observed in flow results, in which PPE addition decreased the pseudoplastic behavior of the solutions, due to a greater cross-linking between the polymers and the phenolic compounds. In general, all the studied solutions showed viscosities suitable for the proposed application, and it was possible to state the importance of standardizing the addition order of the components during the preparation of a coating.

Graphical Abstract

1. Introduction

The search for edible food coatings that are biodegradable, non-toxic, and that have active properties has been increasing in recent years, aiming to extend the shelf life of foods while preserving their sensory characteristics and improving consumer safety [1,2]. In the literature, there is an increasing number of studies that evaluate the most diverse polymers, natural or synthetic, and their physical-chemical, structural, and active properties in foods. In these studies, polysaccharides stand out as one of the groups of polymers that are most applied for coating purposes, due to their attractive properties of brightness, transparency, flexibility, barrier to the passage of water and gases, antimicrobial activity, among others [3].
Chitosan is a polysaccharide derived from the partial deacetylation of the chitin found in the exoskeleton of crustaceans and insects, as well as in the structure of mollusks and fungi [4]. Its cationicity, biodegradability, non-toxicity, and its filmogenic and antimicrobial properties make chitosan one of the most studied polysaccharides for the development of edible coatings [5,6]. To improve the mechanical and barrier properties of chitosan-based coatings, the association of this polysaccharide with other natural polymers, such as gelatin, is commonly evaluated [7]. Obtained by the partial hydrolysis of collagen, this protein is well-used in the food industry as a thickening and emulsifying agent, and several studies already successfully applied a combination of chitosan and gelatin for edible coating development [8,9,10,11].
Furthermore, studies on food coatings aim to develop materials with active properties, which can also protect the food to be coated from oxidation by light, or which improve/provide antimicrobial activity of coatings. In this context, polyphenols, such as vegetable extracts (grape seed extract, jaboticaba peel extract, etc.), catechins and epicatechins, gallic acid, spent coffee grounds, among others, have been extensively used as active compounds [1,2,10,12]. Pomegranate peel extract (PPE), in addition to being a compound rich in polyphenols, is also considered an agro-industrial residue, and its application in edible coatings can add value to this waste from the food and cosmetics industry [9].
One of the areas of study in the development of coatings that has been explored more recently is rheology; the rheological behavior of the candidate solutions for food coatings can affect several properties that will be vital for the desired application, such as the uniformity of the solution, its thickness, the mechanical properties of the films formed by it, among others [2,3]. Understanding the behavior of polymeric chains in the developed coating, their degree of entanglement, their flow and viscoelastic properties, and how they are affected by the addition and concentration of the active agents mentioned above, is a necessary step in the study of coatings. Regarding chitosan, gelatin, and pomegranate peel extract materials, Bertolo et al. (2020) [9] carried out a rheological study of how the concentration of the extract can interfere in the rheological properties of a solution similar to this study. They utilized a chitosan of different molar mass and degree of acetylation, solubilized in acetic acid, and mixed with gelatin in another proportion (2:1); however, in order to scale-up the coating process, a deeper study of the rheological properties of this system is necessary, to ensure that all the needs of processes involving the flow of a fluid (extraction, spray, filtration, purification, immersion) are met by the developed material.
Thus, the aim of this study is to complete a complete rheological assessment of viscoelastic and flow parameters of materials, based on chitosan, gelatin, and pomegranate peel extract. For this, we sought to evaluate how the order of addition of the extract to the polymeric system could affect its rheological properties, an important advance in process design, in order to standardize the steps in the coating production [13,14]. Furthermore, it was evaluated how the extract concentration can differently affect the rheological properties of the materials, depending on whether it was initially added to chitosan, or whether it was added to the mixture of chitosan and gelatin already formed. The results showed that PPE phenolics act by decreasing the pseudoplastic behavior of the coatings, since they mediate stronger interactions between chitosan and gelatin, making them more resistant to the applied shear. It was also analyzed that the order of addition of the extract has an influence on the coatings’ rheological properties, leading to a possible saturation of the active polymeric sites when first added to chitosan.

2. Experimental

2.1. Materials

All solvents and reagents used were PA grade and used as such. Chitosan was obtained from the partial deacetylation of β-chitin, found in the squid pens of Doryteuthis spp., obtained from Miami Comércio e Exportação de Pescados Ltd.a in Cananéia city–Sao Paulo State, Brazil. Gelatin was commercial (Sigma-Aldrich®, St. Louis, MO, USA), type A, swine, with approximately 300 bloom. The red pomegranates (Punica granatum L.) used (Peruvian variety) were purchased at the Supply Centers of Campinas-S.A (CEASA, Campinas city-SP, Brazil) in February, 2019. Before extraction, the fruits were peeled, and their peels were sanitized with 2% (v/v) sodium hypochlorite, dried at room temperature under air flow for 2 h, frozen in the freezer and lyophilized for 16 h (Edwards equipment, model Freeze Dryer Modulyo, Burgess Hill, West Sussex, United Kingdom). Finally, they were crushed to obtain a thin powder, which was stored in polypropylene flasks under refrigeration and protected from light until use. The time between extraction and experiments was not longer than one month.

2.2. Methods

2.2.1. Chitosan Obtention and Characterization

Chitosan was obtained by the partial deacetylation process, to which the β-chitin extracted from squid pens was submitted, a procedure described by Horn et al. (2009), which involves the conversion of the acetoamide groups from the (1,4)-N-acetyl-d-glucos-2-amine chains of β-chitin to amino groups, in a basic medium (40% NaOH (v/v), constant stirring for 3 h at 80 °C, under N2 flow) [15]. The obtained powder was characterized by its viscosimetric molar mass, being classified as chitosan of high molar mass (300 kDa); its degree of acetylation of 11.1% was determined by nuclear magnetic resonance spectroscopy (1H NMR) [16,17].

2.2.2. Pomegranate Peel Extraction and Characterization

The pomegranate peel extract (PPE) was obtained according to the procedure described by Bertolo et al. (2020) [9]. The powder obtained after crushing the dried peels was added to a 60% (v/v) hydroethanolic solution, in the proportion of 1 g of pomegranate peel powder to 30 g of hydroethanolic solution. The extraction took place at 50 °C, for 1 h, under slow and constant stirring. Then, the solution was filtered through a filter paper (Whatman, n. 1), and the ethanol was removed slowly by evaporation. Finally, the extract was lyophilized to obtain a dry powder.
PPE was characterized in terms of its total phenolic content. For this, the Folin–Ciocalteu colorimetric method was adopted, with a procedure adapted for a 96-well microplate [18]. Gallic acid (Sigma-Aldrich®, St. Louis, MO, USA) was used as the standard molecule for the construction of the method’s calibration curve, from eight aqueous solutions with concentrations of 4, 8, 12, 16, 20, 24, 28, and 32 µg mL−1. In the microplate wells, 50 µL of PPE solution (0.1 mg mL−1) and 50 µL of Folin’s reagent were placed. After stirring and 5 min of reaction, 200 µL of a 20% sodium carbonate solution (w/w) was added to each well, followed by further stirring. All samples were taken in triplicate. After 15 min, the absorbance of the samples was read at 725 nm on a Thermo Scientific ™ UV-Vis spectrophotometer VL0L00D0 (Waltham, MA, USA). The 60% (v/v) hydroethanolic solution was used as the blank extract.

2.2.3. Coating Preparation

The 1% (w/w) initial solutions of chitosan (C) and gelatin (G) were prepared as follows: chitosan was dissolved in a 1% lactic acid solution (w/w), by slow and constant stirring for 24 h; gelatin was dissolved in water at 60 °C for 30 min, and its gelation was carried out under refrigeration for 2 h. The CG control sample (that is, without PPE) was prepared by mixing the polymers in the proportion of 1:1 at 45 °C for 2 h, with the addition of 1 mL of a 50% hydroethanolic solution (v/v), in order to maintain the concentration in relation to the other samples to be prepared.
Then, the incorporation of PPE into chitosan/gelatin solutions took place. For this, 2 different concentrations of a hydroethanolic solution (50%, v/v) of extract, 100 and 200 mg mL−1, were prepared. To incorporate these solutions, two additional orders were tested:
(1) Addition of 1 mL of PPE to C, followed by the mixture of G (CPPE2G and CPPE4G samples);
(2) Mixture of C and G, followed by the addition of 1 mL of PPE (CGPPE2 and CGPPE4 samples).
The PPE addition order to the polymeric system was changed to evaluate how the phenolic hydroxyls of the PPE components would interact with the protonated amino groups (NH3+) of chitosan, in the presence (CG mixture) or in the absence (C solution) of gelatin. This protein has carboxylic groups of its amino acids responsible for the formation of the polymeric network by electrostatic interaction with chitosan (please see the GA of our previous work [7]). Thus, different orders of PPE addition to the system can lead to different rheological responses, due to the greater or lesser degree of interaction between the polymers, as well as between the polymers and the extract. Regardless of the PPE order of addition, the proportion adopted was that of 1 mL of extract for each 50 g of mixture of chitosan and gelatin. Thus, the final concentrations of PPE in the polymeric mixture were 2 mg PPE g−1 mixture (for CPPE2G and CGPPE2 samples) and 4 mg PPE g−1 mixture (for CPPE4G and CGPPE4 samples).
All the prepared solutions (the controls C, G, and CG, as well as those containing pomegranate peel extract, PPE) presented a homogeneous aspect, without the presence of precipitates, and with varied yellow coloration, according to the extract concentration and its order of addition to the system.

2.2.4. Rheological Measurements

The rheological study was carried out with the samples CPPE2G, CPPE4G, CGPPE2, CGPPE4, CG, and with the 1% chitosan solution (C). An AR-1000 N controlled stress rheometer (TA Instruments, New Castle, DE, USA) was used, with a cone/plate geometry of stainless-steel of 20 mm in diameter, at 2° angle, and a fixed gap of 69 μm. The temperature was controlled with a Peltier system, and all the measurements described below were performed in triplicate. For all measurements (strain, frequency, temperature sweep, and steady shear), the prepared solutions (in the final state of a gel) were stored under refrigeration in the dark until analysis. After stabilizing the temperature of the solutions to room temperature, they were placed on the Peltier plate of the rheometer, and their excess was removed after setting the zero gap of the equipment.

2.2.5. Strain Sweep Measurements

Fixed values of temperature (25 °C) and frequency (1.0 Hz) were adopted in an amplitude range of 0.05 to 500 Pa, to determine the linear viscoelastic region (LVR) of the coating solutions, that is, the strain range in which their elastic (G′) and viscous (G″) moduli do not change. The software Rheology Advantage Data Analysis, version V5.7.0 (TA Instruments Ltd., New Castle, DE, USA) was employed to analyze the parameters obtained from strain sweep measurements, which were: G′LVR, the elastic modulus at the end of LVR; γL, the maximum strain value to which the solution can be submitted before their moduli start to decrease; tanδ, the ratio between G″ and G′; and G″-G′, the difference between the moduli at 10% of strain.

2.2.6. Frequency Sweep Measurements

For frequency sweep measurements, a frequency range from 0.1 to 100 rad s−1 was adopted, at fixed values of temperature (25 °C) and strain (10% in the LVR). The behavior of G′ and G″, according to the increase in frequency, was analyzed in terms of G′crossover and ωcrossover, that is, G′ and frequency values where G′ = G″.

2.2.7. Temperature Sweep Measurements

G′ and G″ behavior was also evaluated, according to temperature sweep tests, performed from 25 to 75 °C, at 5 °C min 1, 1.0 Hz of frequency, and 10% of strain.

2.2.8. Steady Shear Measurements

Finally, flow measurements were conducted at 25 °C, with a range and shear rate of 0.1 to 1000 s−1. The viscosity behavior of the solutions was characterized as Newtonian or pseudoplastic, according to PPE addition concentration. The experimental curves of viscosity were fitted according to the Cross model (Equation (1).
η η η 0 η = 1 ( 1 + ( k γ ) n )
In Equation (1), η0 is the zero-shear viscosity (Pa s), η is the viscosity limit at infinite shear (Pa s), γ is the shear rate (s−1), k is the so-called consistency index (s), and n the rate index (dimensionless).

3. Statistical Analysis

The Software Action (Estatcamp Team, 2014,São Carlos–SP, Brazil) was used for the statistical analysis of the data. The Shapiro–Wilk test was applied to verify data distribution. Parametric rheological results were examined using analysis of variance (ANOVA), followed by Tukey’s test. Non-parametric rheological results were examined using Kruskal–Wallis test. Significance level was set at equal or higher than 5% in all cases.

4. Results and Discussion

4.1. Pomegranate Peel Extraction and Characterization

After the extraction process to which the pomegranate peels were subjected, and the lyophilization of the extract, a thin, dry, and yellowish powder was obtained, with a yield of 54.5%. Its total phenolic content (TPC), determined by the Folin–Ciocalteu method, was 213 ± 6 mg gallic acid equivalent (GAE) g−1 extract. This result is consistent with that found by Derakshan et al. (2018), who analyzed the TPC of extracts from the peel and the seed of three different types of pomegranates, finding a range of 276–413 mg EAG g−1 for the peel extracts [19]. Bertolo et al. (2020), in a previous study, determined 492 ± 82 mg GAE g−1 extract, using a yellow pomegranate of Brazilian variety [9]. It is worth mentioning that the variations observed in the TPC of different phenolic extracts are related to the most diverse factors: from intrinsic ones, such as the origin of the fruit and its harvest time, to extrinsic factors, such as the method of extraction adopted, the time of extraction, and the solvents used.

4.2. Rheological Measurements

Strain Sweep Measurements

Initially, the sweep tests of the elastic (G′) and viscous (G″) moduli of the material were performed as a function of the percentage of deformation, essential for determining the linear viscoelastic region of the solutions (LVR) where loss and storage moduli (G″ and G′, respectively) are practically constant, regardless of the applied deformation. [14] The extent of the LVR can be directly related to the structural strength of the material: solutions that are more resistant to the applied deformation tend to have a more extensive LVR, requiring greater values of deformation for the moduli to cease stability and start to decrease [7,14].
As can be seen in the graphs of Figure 1, divided into A and B according to the order of addition of PPE in the polymeric solutions, all samples showed G″ > G′, which indicates that their viscous behavior exceeded the elastic behavior, regardless of the addition of the extract or its concentration, a typical liquid-like behavior [7,9,10,20]. From the curves in Figure 1, it was possible to determine the parameters presented in Table 1: the first, γL, represents the highest strain value to which the solution could be subjected, before leaving the LVR; the higher this value, the greater the resistance offered by the sample to the applied deformation. It can be said that the addition of gelatin to sample C led to a significant decrease in γL, from 48.87 ± 3.24% in C to 40.78 ± 0.32% in CG, an indication that the incorporation of gelatin and its interaction with the polymer chains of chitosan can make the polymeric system less resistant to the applied deformation.
However, the addition of PPE in CGPPE2 and CGPPE4 solutions led to an increase in their critical deformation, to values significantly equal to the original chitosan solution, not influenced by the concentration of the extract. Similar results were found by Bertolo et al. (2020) when analyzing chitosan and gelatin systems incorporated with grape seed extracts. The addition of gelatin led to a decay of the critical deformation of chitosan, and the concentration of the added phenolics changed this parameter significantly. Lower concentrations promoted greater stability for the solutions [7]. Finally, for the samples in which PPE was initially added to C, the incorporation of the extract did not significantly alter γL, and the subsequent addition of gelatin did not promote the effect observed in the other samples, by decreasing the critical strain.
Even though γL did not undergo significant changes with the incorporation of PPE into the system, the second parameter in Table 1, G′LVR, showed more pronounced variations: the value of the elastic modulus of the solutions at the limit of LVR suffered an abrupt decrease from 22.80 ± 1.49 Pa to 4.27 ± 0.45 Pa from C to CG. The decay trend continued with the incorporation of PPE into the system, regardless of its concentration or order of addition. The third parameter in Table 1, tanδ, is the ratio between the viscous and elastic moduli at the LVR limit, and allows particularly important rheological classifications of the material: if tanδ > 1, G″ > G′ and the samples are classified as viscous; the opposite is also valid, and if tanδ < 1, the elastic character predominates. However, if tanδ > 0.1, the behavior of the samples is situated between that of a highly concentrated polymeric solution and that of a real gel [20]. In the samples of this study, tanδ varied between 1.32 ± 0.02 (C) and 2.33 ± 0.06 (CGPPE4), which classifies them as being highly concentrated polymeric solutions, with a predominant viscous character, as had already been observed in the curves of Figure 1.
The incorporation of gelatin in CG increased tanδ value from 1.32 ± 0.02 to 1.68 ± 0.06, reflecting the decrease observed in G′LVR for that same sample; the incorporation of PPE into CG mixture led to values greater than two for tanδ, indicating that the incorporation of the extract accentuated the viscous character of the solutions; when doubling the PPE concentration from CGPPE2 to CGPPE4, tanδ increased significantly from 2.05 ± 0.11 to 2.33 ± 0.06. The same effect of the incorporation of PPE is valid for the samples CPPE2G and CPPE4G, with tanδ values also greater than two, but without significant changes observed when the concentration of the extract was doubled. Despite the proportion between the polymers prepared by Bertolo et al. (2020) being different (2:1), they obtained similar tanδ results for their solutions, ranging from 1.25 ± 0.16 for the sample without PPE, to 2.59 ± 0.12 for the sample with one of the highest concentrations of PPE [9]. Their results agree with the results of this study, reinforcing the tendency of phenolic compounds to increase the viscous character of the solutions.
Finally, to confirm the effects of the incorporation and concentration of PPE in the polymeric system, the difference between G″ and G′ at 10% of deformation was calculated (G″–G′ parameter from Table 1); this difference indicates whether the moduli are approaching or moving away, according to the incorporation of the phenolics, and is a new indication of which character is more pronounced. The incorporation of PPE into the CG mixture led to a significant increase in G″–G′ difference from 2.94 ± 0.06 Pa to 3.74 ± 0.07 Pa in CGPPE2, and doubling the concentration in CGPPE4, the difference between the moduli increased to 4.04 ± 0.14 Pa; this result reinforces the effect that had already been observed, that is, that the PPE addition accentuates the viscous character of the solutions, making its difference with the elastic modulus even greater. However, when the order of PPE addition was reversed, this tendency to increase the G″–G′ difference with twice the extract concentration was no longer observed. This result also meets the other parameters analyzed for CPPE2G and CPPE4G samples, by not showing significant differences between them, and by not following the trends observed for CGPPE2 and CGPPE4. Furthermore, these samples indicate that the addition of the extract in high concentrations to chitosan, for later mixing with gelatin, may be saturating the binding sites and making the formation of the polymeric network more difficult. Thus, even if the PPE concentration in the system is doubled, the changes observed are not as significant as those obtained in the other order of addition (Table 1).

4.3. Frequency Sweep Measurements

The behavior of G′ and G″ moduli was also evaluated in relation to the angular frequency (Figure 2A,B). In all cases, G″ was predominant over G′ during a wide sweeping range, occurring in the crossing of the moduli and their inversion in variable angular frequency values, according to the PPE concentration and addition. This fact reinforces the classification of the samples of this study as being concentrated polymeric solutions/weak gels, since G″ > G′ at the beginning and the crossover occurred within the frequency range adopted; real gels or diluted polymeric solutions would not have the same profile [12,14]. The values of G′crossover and ωcrossover, that is, the elastic modulus and the angular frequency at G″ = G′, are reported in Table 2.
Chitosan solution (C) was the sample with the lowest ωcrossover value (9.99 ± 0.01 rad s−1), and the addition of gelatin promoted an increase in that value to 19.98 ± 0.01 rad s−1 in CG, reflecting the effect of gelatin in delaying the inversion between moduli, probably due to the higher number of interactions formed between the polymers in the mixture. The addition of PPE in the CG mixture further increased ωcrossover values, reaching 37.04 ± 4.64 rad s−1 in CGPPE4. It is worth mentioning that half of the PPE concentration, in the inverse order of addition (CPPE2G), presented the same crossing frequency value as CGPPE4. Again, the trend observed for CPPE2G and CPPE4G was different from the other samples: in these two cases, twice the extract concentration caused a decline in the angular frequency value to 31.69 ± 0.01 rad s−1 in CPPE4G, which can be another indication that the addition of PPE to chitosan for subsequent mixing of gelatin may make the polymeric network more susceptible to changes.
In relation to the G′crossover values, there was a sharp decrease from 41.54 ± 2.97 Pa from C to 14.65 ± 0.78 Pa in CG; the concentration of PPE did not promote significant changes in this parameter, but the samples in which the extract was added to the CG mixture showed, in general, G′crossover values slightly higher than the others. Regarding these frequency results, Sun et al. (2020) also evaluated the behavior of G′ and G″ as a function of angular frequency for solutions based on glucomannan/carboxymethyl chitosan incorporated with epigallocatechin gallate (EGCG), one of the major phenolic compounds in tea leaves. They concluded that the addition of EGCG in high concentrations increased the values of the G″ and G′ moduli at high frequencies, implying the formation of a close non-covalent entangled network between the polymers and the phenolic [2].
Hosseini et al. (2021) reached similar findings when analyzing the dynamic behavior of film forming solutions (FFSs) based on chitosan, polyvinyl alcohol, and fish gelatin, incorporated with cinnamaldehyde. While the FFSs without the phenolic compound showed a liquid-like behavior (G″ > G′) at low angular frequencies, the elastic behavior (solid-like) was predominant at higher frequency values; however, once cinnamaldehyde was added to the system, the high number of interactions between the oil droplets and the polymers led to an elastic behavior that was 100%prevalent throughout the entire frequency range adopted, given the formation of an elastic solid-state [3].

4.4. Temperature Sweep Measurements

In rheological studies involving materials with possible applications such as food coatings, temperature is one of the main factors influencing the viscoelastic behavior that should be studied. In general, it is necessary to predict the behavior of the material (whether it will be more viscous or more elastic, and in what proportion, for example) over a wide range of temperatures, which simulate possible situations of transport, storage, and even cooking of the food to be coated. The graphs in Figure 3A,B represent the variation of G′ and G″ moduli for the samples of this study.
As observed in the previous tests, G″ > G′, confirming once again the predominant viscous character of the samples. With the increase in temperature, both moduli of all samples started to decrease, a typical polymeric behavior. For the chitosan solution (C), it was observed that G″ modulus decreased in a greater proportion than G′, going from 26.58 Pa at 25 °C to 5.93 Pa at 75 °C (more than 20 Pa of difference); for G′, this difference between the final and the initial modulus values was not greater than 17 Pa (values obtained from the curves in Figure 3).
With the addition of gelatin in CG, although the initial values of both moduli were significantly lower compared to C, the observed trend did not change; the viscous modulus continued to decrease with greater intensity as the temperature rose, reaching values lower than 1 Pa at the end of the test for almost all samples, except for CGPPE4. In this case, from 65 °C onwards, a slight increase was observed for both moduli, indicating a tendency to cross at temperatures higher than 75 °C.
This tendency was not observed for any other sample, regardless of the order of addition or concentration of PPE. This may be related to a greater ease of inversion for elastic behavior at high temperatures, due to the elimination of energized water molecules and the consequent association between polymeric molecules [7,13]. Apparently, the addition of PPE in high concentrations to the polymeric network already formed in CGPPE4 may have facilitated the elimination of water molecules at high temperatures, leading to a rearrangement of chains with a greater increasing tendency of the moduli, which could result in an inversion between them at even higher temperatures. Luciano et al. (2021) analyzed the behavior of the viscous and elastic moduli of polymeric solutions based on gelatin with different concentrations of nisin, an antibacterial peptide, as a function of temperature. Their film-forming solutions showed G′ > G″, and the addition of nisin was able to increase the sol-gel and gel-sol transition temperatures by 4 °C, which occurred around 14–18 °C and 25–29 °C, respectively [21]. In our study, similar transitions were not observed for the solutions containing gelatin, probably due to the high concentration of chitosan and the formation of an intricate polymeric network between the polymers.
In general, we can conclude the discussion of oscillatory rheology results by saying that both factors of concentration and order of addition of PPE contributed to the differences observed in the results of deformation, frequency, and temperature. The viscous and elastic moduli of the samples can be influenced to a greater or lesser extent, according to the highest or lowest concentration of extract, as well as if it was added to the polymeric network already formed or to the chitosan solution first. For CGPPE4 sample, the effects of the highest concentration of PPE were noticeably clear, leading to a sample with a higher viscous character, with inversion between the moduli in higher angular frequency values, and with a possible crossing between them in temperature values lower than the others.

4.5. Steady Shear Measurements

Figure 4A,B shows the viscosity curves of the samples as a function of the shear rate; in all cases, a decrease in viscosity was observed according to the increase in shear rate, a typical polymeric behavior known as shear-thinning or pseudoplastic. This behavior is associated with the fact that the polymeric chains orient themselves towards the applied stress, increasing their ordering and, consequently, decreasing viscosity [22].
Knowing the viscosity of the polymeric solution that will act as a coating is extremely important to predict its behavior. In general, we look for samples with intermediate viscosities, which escape from the extremes of high viscosity (which would be an obstacle to coat food by immersion or spray, for example) and low viscosity (which would make it difficult to spread the solution over the food surface, due to its dripping effect). The literature points to viscosities in the range of 1–10 Pa s as being suitable for experimental coating processing conditions [23].
As can be seen in Table 3, the adjustment of the viscosity data with the Cross model allowed for the identification of some important parameters. The first one is ƞ0, the initial viscosity of the solutions at zero shear rate, when the polymeric molecules are still randomly oriented, except for sample C, which had the highest initial viscosity value (ƞ0 = 14.90 ± 1.27 Pa·s). All samples containing gelatin and/or PPE showed viscosities between 1.92 and 2.85 Pa s, an indication that all of them are suitable for the proposed application. Although no significant differences were observed (p < 0.05), according to the addition of PPE or its concentration, some trends can be elucidated. The addition of PPE to the polymeric network already formed in CG tended to decrease its viscosity, probably due to the interaction of the extract in the active sites that had not yet been occupied by the polymers. The increase in its concentration in CGPPE4 followed the same decreasing tendency, with a viscosity of 2.05 ± 0.18 Pa s. In the samples in which PPE was initially added to chitosan, ƞ0 values were slightly lower than 2 Pa s, and CPPE4G showed the lowest viscosity value among all samples, of 1.92 ± 0.14 Pa s.
The second parameter presented in Table 3 is k, the so-called consistency index: the lower k, the greater the Newtonian plateau of the sample before its pseudoplastic behavior begins, that is, the greater the value of the critical shear rate necessary for the sample viscosity starts to decrease [14]. Sample C was the one with the highest k value (0.212 ± 0.020 s), and the addition of gelatin in CG decreased this value to 0.119 ± 0.004 s. This indicated that the formation of the polymeric network tended to better stabilize the polymeric chains, making them most resistant to applied shear and slowing the decline in viscosity. The k index continued to decrease with the addition of PPE and the increase in its concentration, with CGPPE4 sample having the lowest k (0.056 ± 0.001 s) and, therefore, being the most resistant to shear. For CPPE2G and CPPE4G samples, twice the PPE concentration did not significantly change k, and the values remained between 0.066 and 0.069 s.
Finally, the last parameter, n, the rate index, represents the dependence of viscosity in relation to the shear rate: samples with values of n between zero and one are considered pseudoplastic, while values of n greater than one characterize Newtonian samples [24]. For the samples in this study, n varied from 0.744 (CGPPE2 and CPPE2G) to 0.800 (C), which reinforces the pseudoplastic behavior of all of them, and indicates that the addition of PPE promotes a slight decline in it. The results found here for k and n parameters agree with that observed by Tudorache & Tordenave (2019). They analyzed the pseudoplastic behavior of different polysaccharides (β-glucan, xanthan gum, and guar gum) complexed with phenolic compounds (vanillin, ferulic acid, acid caffeine, among others); in all cases, the addition of phenolics also caused a decline in the pseudoplastic behavior of the samples. At a molecular level, these results can be interpreted in view of the weak associations existing between the polymeric chains, which flow easily upon shearing, presenting pseudoplastic behavior. Once the phenolic compounds are added, they mediate a stronger cross-linking between the polymeric molecules, making them more resistant to the applied shear, which explains the accentuation of the Newtonian behavior for samples containing PPE [25]. Rodrigues et al. (2020) also evaluated the rate index of solutions based on chitosan and gelatin incorporated with extracts of grape seed and jaboticaba peel; in their case, it was possible to observe a decline in the values of n (and a consequent decrease in the pseudoplastic behavior) only for the highest concentrations of extract (5 mg g−1 mixture) when added to the mixture of chitosan and gelatin already formed. In this sense, PPE was able to promote more marked changes in the behavior of the polymeric system, even in lower concentrations [10].
Thus, it can be said that the rheological results of flow agree with the oscillatory results previously discussed for the samples of chitosan and gelatin with pomegranate peel extract. It was observed that the order of addition of PPE to the polymeric matrix is a parameter to be standardized during the formulation of new coatings, since it is able to change their rheological characteristics. The concentration of PPE was again a factor of great influence, especially for the samples in which the extract was added to the polymeric network already formed by CG.

5. Conclusions

PPE incorporation into chitosan and gelatin coatings affected both oscillatory and flow properties. The effects of PPE concentration were more accentuated when it was added to the CG mixture, indicating that the other addition order evaluated may have led to a possible saturation of chitosan binding sites, making it difficult for this polysaccharide to form a polymeric network with the subsequent incorporation of gelatin. The viscous character of the solutions was accentuated with higher concentrations of PPE. CGPPE4 solution showed the highest tanδ value, as well as higher angular frequency and G′ values at the moduli crossover, indicating the formation of a more intricate polymeric network. Temperature also affected the viscoelastic behavior of the samples, with CGPPE4 being the only solution with a different profile of increasing the moduli at temperatures above 65 °C. Finally, the flow tests evidenced the influence of PPE in decreasing the pseudoplastic behavior of the polymeric solutions, making them more resistant to the applied shear. The results of this study contribute to the in-depth understanding of the molecular relationships between a polysaccharide, a protein, and phenolic compounds in the prepared coating solutions, and how these relationships can be related to the intended application for the materials.

Author Contributions

M.R.V.B.: conceptualization, methodology, data curation, writing (origi-nal draft manuscript). R.L.: methodology, data curation. V.d.C.A.M.: conceptualization, writing (review and editing), supervision. A.M.d.G.P.: writing (review and editing), supervision, project administration. S.B.J.: writing (review and editing), supervision, project administration. All authors have read and agreed to the published version of the manuscript.

Funding

This work was supported by the São Paulo Research Foundation (FAPESP) (grant number 2019/18748-8 for MRVB).

Institutional Review Board Statement

Not applicable.

Informed Consent Statement

Not applicable.

Data Availability Statement

Data sharing not applicable.

Acknowledgments

The authors would like to thank Júlio César Borges for the use of the Ther-mo Scientific ™ UV-Vis Spectrophotometer VL0L00D0, belonging to the Protein Biochemistry and Biophysics Group at IQSC/USP, under his responsibility.

Conflicts of Interest

The authors declare they have no competing interests.

References

  1. Lei, Y.; Wu, H.; Jiao, C.; Jiang, Y.; Liu, R.; Xiao, D.; Lu, J.; Zhang, Z.; Shen, G.; Li, S. Investigation of the Structural and Physical Properties, Antioxidant and Antimicrobial Activity of Pectin-Konjac Glucomannan Composite Edible Films Incorporated With Tea Polyphenol. Food Hydrocoll. 2019, 94, 128–135. [Google Scholar] [CrossRef]
  2. Sun, J.; Jiang, H.; Li, M.; Lu, Y.; Du, Y.; Tong, C.; Pang, J.; Wu, C. Preparation and Characterization of Multifunctional Konjac Glucoman-nan/Carboxymethyl Chitosan Biocomposite Films Incorporated With Epigallocatechin Gallate. Food Hydrocoll. 2020, 105, 105756. [Google Scholar] [CrossRef]
  3. Hosseini, S.F.; Ghaderi, J.; Gómez-Guillén, M.C. Trans-Cinnamaldehyde-Doped Quadripartite Biopolymeric Films: Rheological Behavior of Film-Forming Solutions and Biofunctional Performance of Films. Food Hydrocoll. 2021, 112, 106339. [Google Scholar] [CrossRef]
  4. Nair, M.S.; Saxena, A.; Kaur, C. Effect of Chitosan and Alginate Based Coatings Enriched With Pomegranate Peel Extract to Extend the Postharvest Quality of Guava (Psidium Guajava L.). Food Chem. 2018, 240, 245–252. [Google Scholar] [CrossRef]
  5. Ngo, D.-H.; Vo, T.-S.; Kang, K.-H.; Je, J.-Y.; Pham, H.N.-D.; Byun, H.-G.; Kim, S.-K. Biological Effects of Chitosan and Its Derivatives. Food Hydrocoll. 2015, 51, 200–216. [Google Scholar] [CrossRef]
  6. Bonilla, J.; Sobral, P.J. Investigation of the Physicochemical, Antimicrobial and Antioxidant Properties of Gelatin-Chitosan Edible Film Mixed With Plant Ethanolic Extracts. Food Biosci. 2016, 16, 17–25. [Google Scholar] [CrossRef]
  7. Bertolo, M.R.V.; Martins, V.D.C.A.; Plepis, A.M.D.G.; Junior, S.B. Rheological Study of the Incorporation of Grape Seed Extract in Chitosan and Gelatin Coatings. J. Appl. Polym. Sci. 2021, 138, 50052. [Google Scholar] [CrossRef]
  8. Nowzari, F.; Shábanpour, B.; Ojagh, S.M. Comparison of chitosan–gelatin Composite and Bilayer Coating and Film Effect on the Quality of Refrigerated Rainbow Trout. Food Chem. 2013, 141, 1667–1672. [Google Scholar] [CrossRef] [PubMed]
  9. Bertolo, M.R.; Martins, V.; Horn, M.M.; Brenelli, L.B.; Plepis, A. Rheological and Antioxidant Properties of chitosan/Gelatin-Based Materials Functionalized by Pomegranate Peel Extract. Carbohydr. Polym. 2020, 228, 115386. [Google Scholar] [CrossRef]
  10. Rodrigues, M.; Álison, V.; Bertolo, M.R.V.; Marangon, C.; Martins, V.; Plepis, A.M.D.G. Chitosan and Gelatin Materials Incorporated With Phenolic Extracts of Grape Seed and Jabuticaba Peel: Rheological, Physicochemical, Antioxidant, Antimicrobial and Barrier Properties. Int. J. Biol. Macromol. 2020, 160, 769–779. [Google Scholar] [CrossRef] [PubMed]
  11. Cardoso, G.P.; Dutra, M.P.; Fontes, P.R.; Ramos, A.D.L.S.; Gomide, L.A.D.M.; Ramos, E.M. Selection of a Chitosan Gelatin-Based Edible Coating for Color Preservation of Beef in Retail Display. Meat Sci. 2016, 114, 85–94. [Google Scholar] [CrossRef] [PubMed]
  12. Wu, C.H.; Li, Y.Z.; Yu, D.; Lin, W.; Cailing, T.; Hu, Y.; Pang, J.; Yan, Z. Preparation and Characterization of Konjac Glucomannan-Based Bionanocompo-Site Film for Active Food Packaging. Food Hydrocoll. 2019, 89, 682–690. [Google Scholar] [CrossRef]
  13. Silva-Weiss, A.; Bifani, V.; Ihl, M.; Sobral, P.; Gómez-Guillén, M.C. Structural Properties of Films and Rheology of Film-Forming Solutions Based on Chitosan and Chitosan-Starch Blend Enriched With Murta Leaf Extract. Food Hydrocoll. 2013, 31, 458–466. [Google Scholar] [CrossRef] [Green Version]
  14. Steffe, J.F. Rheological Methods in Food Process Engineering; Freeman Press: East Lansing, MI, USA, 1996. [Google Scholar]
  15. Horn, M.M.; Martins, V.; Plepis, A.M.D.G. Interaction of Anionic Collagen With Chitosan: Effect on Thermal and Morphological Characteristics. Carbohydr. Polym. 2009, 77, 239–243. [Google Scholar] [CrossRef]
  16. Rinaudo, M. Chitin and Chitosan: Properties and Applications. Prog. Polym. Sci. 2006, 31, 603–632. [Google Scholar] [CrossRef]
  17. Lavertu, M.; Xia, Z.; Serreqi, A.; Berrada, M.; Rodrigues, A.G.; Wang, D.; Buschmann, M.; Gupta, A. A Validated 1H NMR Method for the Determination of the Degree of Deacetylation of Chitosan. J. Pharm. Biomed. Anal. 2003, 32, 1149–1158. [Google Scholar] [CrossRef]
  18. Singleton, V.L.; Orthofer, R.; Lamuela-Raventos, R.M. [14] Analysis of Total Phenols and Other Oxidation Substrates and Antioxidants by Means of Folin-Ciocalteu Reagent. Methods Enzymol. 1999, 299, 152–178. [Google Scholar] [CrossRef]
  19. Derakhshan, Z.; Ferrante, M.; Tadi, M.; Ansari, F.; Heydari, A.; Hosseini, M.S.; Conti, G.O.; Sadrabad, E.K. Antioxidant Activity and Total Phenolic Content of Ethanolic Extract of Pomegranate Peels, Juice and Seeds. Food Chem. Toxicol. 2018, 114, 108–111. [Google Scholar] [CrossRef]
  20. Razmkhah, S.; Mohammad, S.; Razavi, A. Dilute Solution, Flow Behavior, Thixotropy and Viscoelastic Characterization of Cress Seed (Lepidium Sativum) Gum Fractions. Food Hydrocoll. 2017, 63, 404–413. [Google Scholar] [CrossRef]
  21. Luciano, C.G.; Tessaro, L.; Lourenço, R.V.; Barbosa Bittante, A.M.Q.; Fernandes, A.M.; Freitas Moraes, I.C.; do Amaral Sobral, P.J. Effects of Nisin Concentration on Properties of Gelatin Film Forming so-Lutions and Their Films. Int. J. Food Sci. Technol. 2021, 56, 587–599. [Google Scholar] [CrossRef]
  22. Mandala, I.; Savvas, T.; Kostaropoulos, A. Xanthan and Locust Bean Gum Influence on the Rheology and Structure of a White Model-Sauce. J. Food Eng. 2004, 64, 335–342. [Google Scholar] [CrossRef]
  23. Nair, S.B.; Jyothi, A.N.; Sajeev, M.S.; Misra, R. Rheological, Mechanical and Moisture Sorption Charac-Teristics of Cassava starch-konjac Glucomannan Blend Films. Starch 2011, 63, 728. [Google Scholar] [CrossRef]
  24. Tudorache, M.; Bordenave, N. Phenolic Compounds Mediate Aggregation of Water-Soluble Polysaccha-Rides and Change Their Rheological Properties: Effect of Different Phenolic Compounds. Food Hydrocoll. 2019, 97, 105193. [Google Scholar] [CrossRef]
  25. Phillips, G.O.; Williams, P.A. Handbook of Hydrocolloids; Elsevier: Amsterdam, The Netherlands, 2009. [Google Scholar] [CrossRef]
Figure 1. G″ and G′ moduli as a function of % strain, at 1 Hz frequency and 25 °C, for: (A) C, CG, CGPPE2, and CGPPE4; and (B) C, CG, CPPE2G, and CPPE4G.
Polysaccharides 02 00039 g001
Figure 2. Frequency dependency of G′ and G″ moduli at 10% of strain and 25 °C for: (A) C, CG, CGPPE2, and CGPPE4; and (B) C, CG, CPPE2G, and CPPE4G.
Polysaccharides 02 00039 g002
Figure 3. G′ and G″ moduli as a function of temperature (from 25 to 75 °C) for: (A) C, CG, CGPPE2, and CGPPE4; and (B) C, CG, CPPE2G, and CPPE4G.
Polysaccharides 02 00039 g003
Figure 4. Viscosity curves as a function of the shear rate (0.1 to 1000 s−1) at 25 °C for: (A) C, CG, CGPPE2, and CGPPE4; and (B) C, CG, CPPE2G, and CPPE4G.
Polysaccharides 02 00039 g004
Table 1. Parameters determined by strain sweep measurements: critical strain (γL), G′ at the LVR limit (G′LVR), loss tangent value (tanδ) and G″–G′ moduli at 10% strain. Measurements were performed at 1 Hz and 25 °C.
SampleγL (%)G′LVR (Pa)tanδG″–G′ (Pa)
C48.87 ± 3.24 a22.80 ± 1.49 a1.32 ± 0.02 e6.51 ± 0.27 a
CG40.78 ± 0.32 b4.27 ± 0.45 b1.68 ± 0.06 d2.94 ± 0.06 d
CGPPE248.93 ± 0.30 a3.56 ± 0.28 b2.05 ± 0.11 c3.74 ± 0.07 b, c
CGPPE448.26 ± 0.40 a2.92 ± 0.16 b2.33 ± 0.06 a4.04 ± 0.14 b
CPPE2 G49.01 ± 0.47 a2.97 ± 0.12 b2.23 ± 0.01 a, b3.77 ± 0.18 b, c
CPPE4 G49.76 ± 0.33 a3.04 ± 0.11 b2.12 ± 0.02 b, c3.57 ± 0.10 c
Different lowercase letters on the same column indicate significant differences by the ANOVA and Tukey test with p ≤ 0.05.
Table 2. Parameters determined by frequency sweep measurements: angular frequency at the crossover point (ωcrossover) and G′ modulus at the crossover point (G′crossover). Measurements performed at γ = 10% and 25 °C.
Solutionωcrossover (rad s−1)G′crossover (Pa)
C9.99 ± 0.01 d41.54 ± 2.97 a
CG19.98 ± 0.01 c, d14.65 ± 0.78 d
CGPPE225.13 ± 0.01 b, c18.81 ± 1.33 c
CGPPE437.04 ± 4.64 a22.01 ± 1.51 a, b
CPPE2 G37.04 ± 4.64 a19.63 ± 0.75 b, c
CPPE4G31.69 ± 0.01 a, b17.85 ± 0.26 c, d
Different lowercase letters in the same column indicate significant differences by the ANOVA and Tukey test with p ≤ 0.05.
Table 3. Parameters obtained by modeling the viscosity curves as a function of the shear rate by the Cross model: zero-shear viscosity (η0), consistency index (k), and rate index (n). Measurements performed from 0.1 to 1000 s−1 at 25 °C.
Solutionη0 (Pa s)k (s)n
C14.90 ± 1.27 a0.212 ± 0.020 a0.800 ± 0.002 a
CG2.85 ± 0.14 b0.119 ± 0.004 b0.720 ± 0.006 c
CGPPE22.37 ± 0.01 b0.086 ± 0.004 c0.744 ± 0.011 b, c
CGPPE42.05 ± 0.18 b0.056 ± 0.001 d0.771 ± 0.031 a, b
CPPE2G1.97 ± 0.11 b0.066 ± 0.002 c, d0.744 ± 0.006 b, c
CPPE4G1.92 ± 0.14 b0.069 ± 0.003 c, d0.759 ± 0.009 b, c
Different lowercase letters in the same column indicate significant differences by the ANOVA and Tukey test with p ≤ 0.05.
Publisher’s Note: MDPI stays neutral with regard to jurisdictional claims in published maps and institutional affiliations.

