
Optimal Sizing and Placement of Capacitor Banks in Distribution Networks Using a Genetic Algorithm


RESPECT Srl, 09127 Cagliari, Italy
Electricity 2021, 2(2), 187-204; https://0-doi-org.brum.beds.ac.uk/10.3390/electricity2020012
Submission received: 26 March 2021
/
Revised: 15 April 2021
/
Accepted: 30 April 2021
/
Published: 17 May 2021
Abstract
:Nowadays, response to electricity consumption growth is mainly supported by efficiency; therefore, this is the new main goal in the development of electric distribution networks, which must fully comply with the system’s constraints. In recent decades, the issue of independent reactive power services, including the optimal placement of capacitors in the grid due to the restructuring of the electricity industry and the creation of a competitive electricity market, has received attention from related companies. In this context, a genetic algorithm is proposed for optimal planning of capacitor banks. A case study derived from a real network, considering the application of suitable daily profiles for loads and generators, to obtain a better representation of the electrical conditions, is discussed in the present paper. The results confirmed that some placement solutions can be obtained with a good compromise between costs and benefits; the adopted benefits are energy losses and power factor infringements, taking into account the network technical limits. The feasibility and effectiveness of the proposed algorithm for optimal placement and sizing of capacitor banks in distribution systems, with the definition of a suitable control pattern, have been proved.
1. Introduction
In recent years, regulators have wanted to reduce energy costs and raise energy efficiency by curtailing energy losses and/or improving the power factor, particularly in distribution networks.
According to the most recent regulations, efficiency is the main goal in distribution network planning, which must fully comply with the system’s constraints. The increasing economic risk due to investment needs, especially in restructured networks, encouraged planners to adopt proper design approaches. Consequently, optimal placement problems of electrical devices in power systems have attracted greater attention from researchers in the literature. Therefore, in the last decades, a wide range of solutions and methodologies have been developed for optimally allocated shunt capacitors, generation sources, switches, transformers, and many other electrical devices in transmission and distribution networks [1]. The use of capacitors in distribution networks permits the obtainment of several potential benefits [2].
- Loss reductions;
- Voltage profile improvement;
- Loading improvement in existing branches.
Energy losses occur naturally and consist mainly of power dissipation in electricity system components, such as lines and transformers. These losses, which are caused by the flow of current through different items of equipment on the network, are proportional to the component’s resistance and the square of the current flowing through it. The current magnitude is determined by its active and reactive components; decreasing the current reactive component while maintaining the other one (active component) is an effective way to reduce losses [3]. Besides, it is important to remark that low power factor value causes a reduction of system capacity, higher losses eventually decreasing voltage, and higher operating costs.
Capacitors’ placement at optimal locations in the distribution network and their sizing can reduce losses. This also increases feeders’ ampacity and improves the voltage profile, which leads to reduced network investments [4,5]. The extent of benefits depends on the location, size, and type of the capacitors.
Researchers are continuously working to solve the problem of optimal capacitor placement in the distribution network. Optimal capacitor placement is a complicated combinatorial optimization problem. Many optimization techniques and algorithms have been proposed so far for the optimal placement of the capacitor.
The possibly first technique for optimal capacitor placement was the 2/3 rule, which had been utilized for capacitor placement assuming a uniformly distributed load on the distribution feeder [5]; the major drawbacks of this method are it does not produce the optimal solution, is very time-consuming, and is unrealistic for large networks.
In [4], the optimal capacitor placement problem is presented using a genetic algorithm (GA) using ETAP software. The paper in [5] presents a GA to obtain the optimal locations of the capacitors in radial distribution feeders. The objective functions adopted, tested on an IEEE 33-bus distribution test feeder, are loss reduction and voltage profile improvement, while in [4], an objective function based on a reliability index is adopted. The approaches proposed in [4,5] uses a basic GA to solve the siting problem for capacitor location. A similar approach and similar objectives are followed in [6,7,8,9], with a multiobjective approach adopted in [8]. The paper [9] is devoted to presenting capacitor placement in unbalanced distribution networks.
A tabu search-based algorithm for optimal capacitor placement in a radial distribution system is proposed in [10]; the objective function adopted is similar to the [5] case.
In [11], a loss sensitivity approach is used for the optimal locations of capacitors in radial distribution networks; the proposed algorithm, which includes the effect of load growth, is tested on the 38-bus UK distribution corporation system.
In [12], the authors present a practical technique to solve capacitor placement problem based on a graph search algorithm; the cited approach minimizes the operating cost with some constraints about the technical limits.
The GA-based approach for power quality improvement along with the optimal capacitor placement and sizing of fixed-shunt capacitor banks in radial distribution networks in the presence of voltage and current harmonics is presented in [13]. A fuzzy-based approach for optimal placement of fixed capacitors and their sizing in a radial distribution network is adopted in [14], while in [15], the presence of voltage and current harmonics is reported. In [16], the GA is employed for the optimal capacitor allocation. Then the transformer tap changing is used to regulate the voltage profile in the buses, taking into account the harmonics.
Optimal capacitor placement in distribution systems using a hybrid technique utilizing fuzzy and GA is suggested in [17] to minimize the operating cost and the deviation of bus voltage and maximize the margin loading of feeders.
Optimal capacitor placement and sizing of the shunt capacitor in a distribution system distorted to some extent using an algorithm utilizing particle swarm optimization are reported in [18,19,20], with the specification that the last paper regards the placement capacitor in a single building.
The paper [21] studies an assessment of power systems voltage stability with and without a shunt reactive power compensation device, such as a capacitor bank; to allocate the shunt capacitor, a voltage stability index is adopted to select the highly sensitive bus for allocating the capacitors.
The paper in [22] presents a method to optimally site and size capacitors on a radial distribution system. The approach’s effectiveness is demonstrated on a standard IEEE 33-bus in Nigeria.
A new approach for solving the radial distribution systems’ optimal shunt capacitors’ placement and sizing problem is proposed in [23], the approach modifies and partially uses conventional loss sensitivity factors to reduce the search space of optimal buses that require shunt capacitor placement. The work in [24] presents an improved method for loss reduction in medium voltage distribution networks, using an optimal placement of capacitor banks, with a recently proposed metaheuristic, the sperm whale algorithm. In [25], the placement is performed through a hybrid flower pollination algorithm approach; the pollination process itself determines the sets of buses for placement, while sizes and the final fitness values of each pollen are selected after a full search is conducted in the sizing space.
Finally, [26] uses an ordinal optimization-based approach containing upper and lower levels developed to solve the placement capacitor problem efficiently; in the upper level, an ordinal search algorithm is utilized to select excellent designs from a candidate design set according to the system’s structural information exploited from the simulations executed in the lower level.
As just discussed, the [13,15,16,18] approaches, using different methods (GA, fuzzy, particle swarm optimization), have in common the idea of taking into account the harmonics caused by the capacitor placement. Anyway, it is important to remark that the cited approaches probably neglect other objectives (e.g., losses, voltage profile) that are fundamental in the network operation. On the contrary, the other techniques reported in the reference assume sinusoidal operating conditions, as the approach proposed in the present paper. Considering all the cited references, different objectives are considered, which include: minimization of loss, improvement of voltage profile, system stability, power factor, loading reduction of existing lines, and installation costs. For all the references proposed, the loads and generators are represented with a single value (average value and/or peak value, without any daily profile useful to better represent the electrical conditions of the network). Consequently, the capacitors are fixed, without any definition of a suitable pattern control to optimally manage the unit, due to the lack of daily profiles in the network model. The most common algorithms presented in the references do not apply to the interconnected power systems but only to radial power systems.
In this paper, a placement model based on a GA, implementing capacitor bank units, is proposed to make the optimal technical and economical choice. The aim of the proposed approach consists in minimizing the total planning cost, including investment and variable cost. This optimization integrates optimal capacitor bank units, sizing and sitting, including a daily program to obtain a better configuration for each time interval, limiting the eventual overcompensation conditions. The proposed cost minimization includes:
- Capital costs of capacitor banks (investment);
- Energy losses cost (variable cost);
- Penalty cost for the power factor infringements (variable cost).
The model also guarantees an acceptable voltage profile and keeps feeders’ capacity in their safety margins.
The GA technique is selected since it is more accurate to solve the capacitor placement problem in the power network. The advantages of the GA are versatile when traversing the search space for an optimal solution (i.e., if a solution to an engineering objective function is optimal locally, the GA will adapt the search in pursuit of a globally optimum solution subject to predefined search constraints).
The main novelties of the paper in comparison with the state of the art are:
- Definition at the same time of the optimal location (node) and the most suitable size for each capacitor unit. Additionally, in the algorithm it is possible to specify in an easy way a bus list where it is not desirable to place capacitors. Not all the approaches available in the literature solve the two different problems (siting and sizing of capacitor units) simultaneously.
- Adoption of suitable daily profiles for loads and generators to obtain a better representation of the electrical conditions in all time intervals of the day/year. In particular, different typical days for the different year quarters are adopted. This particular approach to represent the electrical model (the accuracy in the objective function calculation increase), involving the optimization method, is not adopted in the most common methodologies.
- Definition of a daily program to manage the capacitors appropriately to obtain the best benefits for each time interval without overcompensation situations. The definition of the optimal control pattern is obtained, including a suitable constraint referred to the switches aging in the capacitors. As discussed regarding the previous novelty, the definition of an optimal pattern control for capacitor units is not adopted in the most common methodologies.
- The proposed approach can be used also in a meshed network, while many methods discussed are limited to the radial network only.
The remainder of this paper is organized as follows: In Section 2 the theoretical concepts for the genetic algorithm are presented. Section 3 is devoted to the proposed methodology for the optimal sizing and placement of capacitor banks in distribution networks. Section 4 presents the case study adopted, while Section 5 provides the numerical results and discussion. Finally, Section 6 summarizes the main contributions and conclusions of the present work.
2. Genetic Algorithm
The objective of this chapter is the presentation of theoretical concepts for the genetic algorithm (GA).
The foundations of genetic algorithms were first introduced by John Holland [27]. The GA is a global search technique that has arisen with inspiration from Darwin’s natural principle and the principles of genetics but can be utilized to solve optimization problems. This is based on the theory of natural selection and the biological evolution process.
The most important terms referred to the GA are:
- Individual. The point for which an objective function (OF) is implemented can be treated as an individual. This is a set of values of variables for which function is to be optimized. The OF value for an individual is called its score. The vector entries related to the genes of a genome are considered individuals.
- Population. The population is an array of individuals. From a mathematical point of view, if N is the size of the population and NV the number of variables in the OF, the population can be represented by a matrix of the size N × NV in which each row corresponds to an individual.
- Generation. At each iteration, the genetic operators (described in the next sections) are used to perform a series of computations on the current population to produce a new population. The successive populations produced are known as the new generation.
- Parents and children. To create the next generation, the GA selects a number of individuals in the existing population, called parents. This generation is used to create individuals in the next generation, known as children.
2.1. General Framework
Fundamentally, the GA creates a population that develops through time using the reproduction and mutation method.
The GA general framework can be declared with the following steps:
- Definition of the OF, according to the specific optimization;
- Definition of GA representation, by a suitable coding, which consists normally in the characterization of a string useful to operate with the genetic operators;
- Definition of GA operators;
- Production of the initial population: the creation of a suitable initial population is important to have a good evolution of population during the different generation steps;
- By applying genetic operators (described in the next section) on selected people, the children population is produced.
2.2. Genetic Operators
Starting from the terminologies defined above, the following genetic operators are normally applied to parents to form children for the next generation:
- Selection. This selects the fittest individuals in the current population to be used in generating the next population. People with higher fitness should have greater opportunities to produce children. For selection by the roulette wheel, race or elitism methods can be used in the production of children. Generally, the OF value is considered a fitness number anywhere.
- Crossover. This operator causes pairs of individuals to exchange genetic information with each other. These children are known as crossover children. Two random chromosomes in the middle generation are selected. Then a random number (n) between 1 and the length of a chromosome is selected, and pairs of selected chromosomes from the n-th gene to later are swapped with each other to produce new chromosomes.
- Mutation. The mutation causes individual genetic representations required to be changed following a set of some probabilistic rules. To test each element for fitness and to avoid algorithm stopping at a local optimum, some solutions are also randomly modified. Therefore, a chromosome is selected randomly. Then some of its genes are replaced with another random number. Random variation of a gene in each category is called mutation.
2.3. GA Schematic Representation
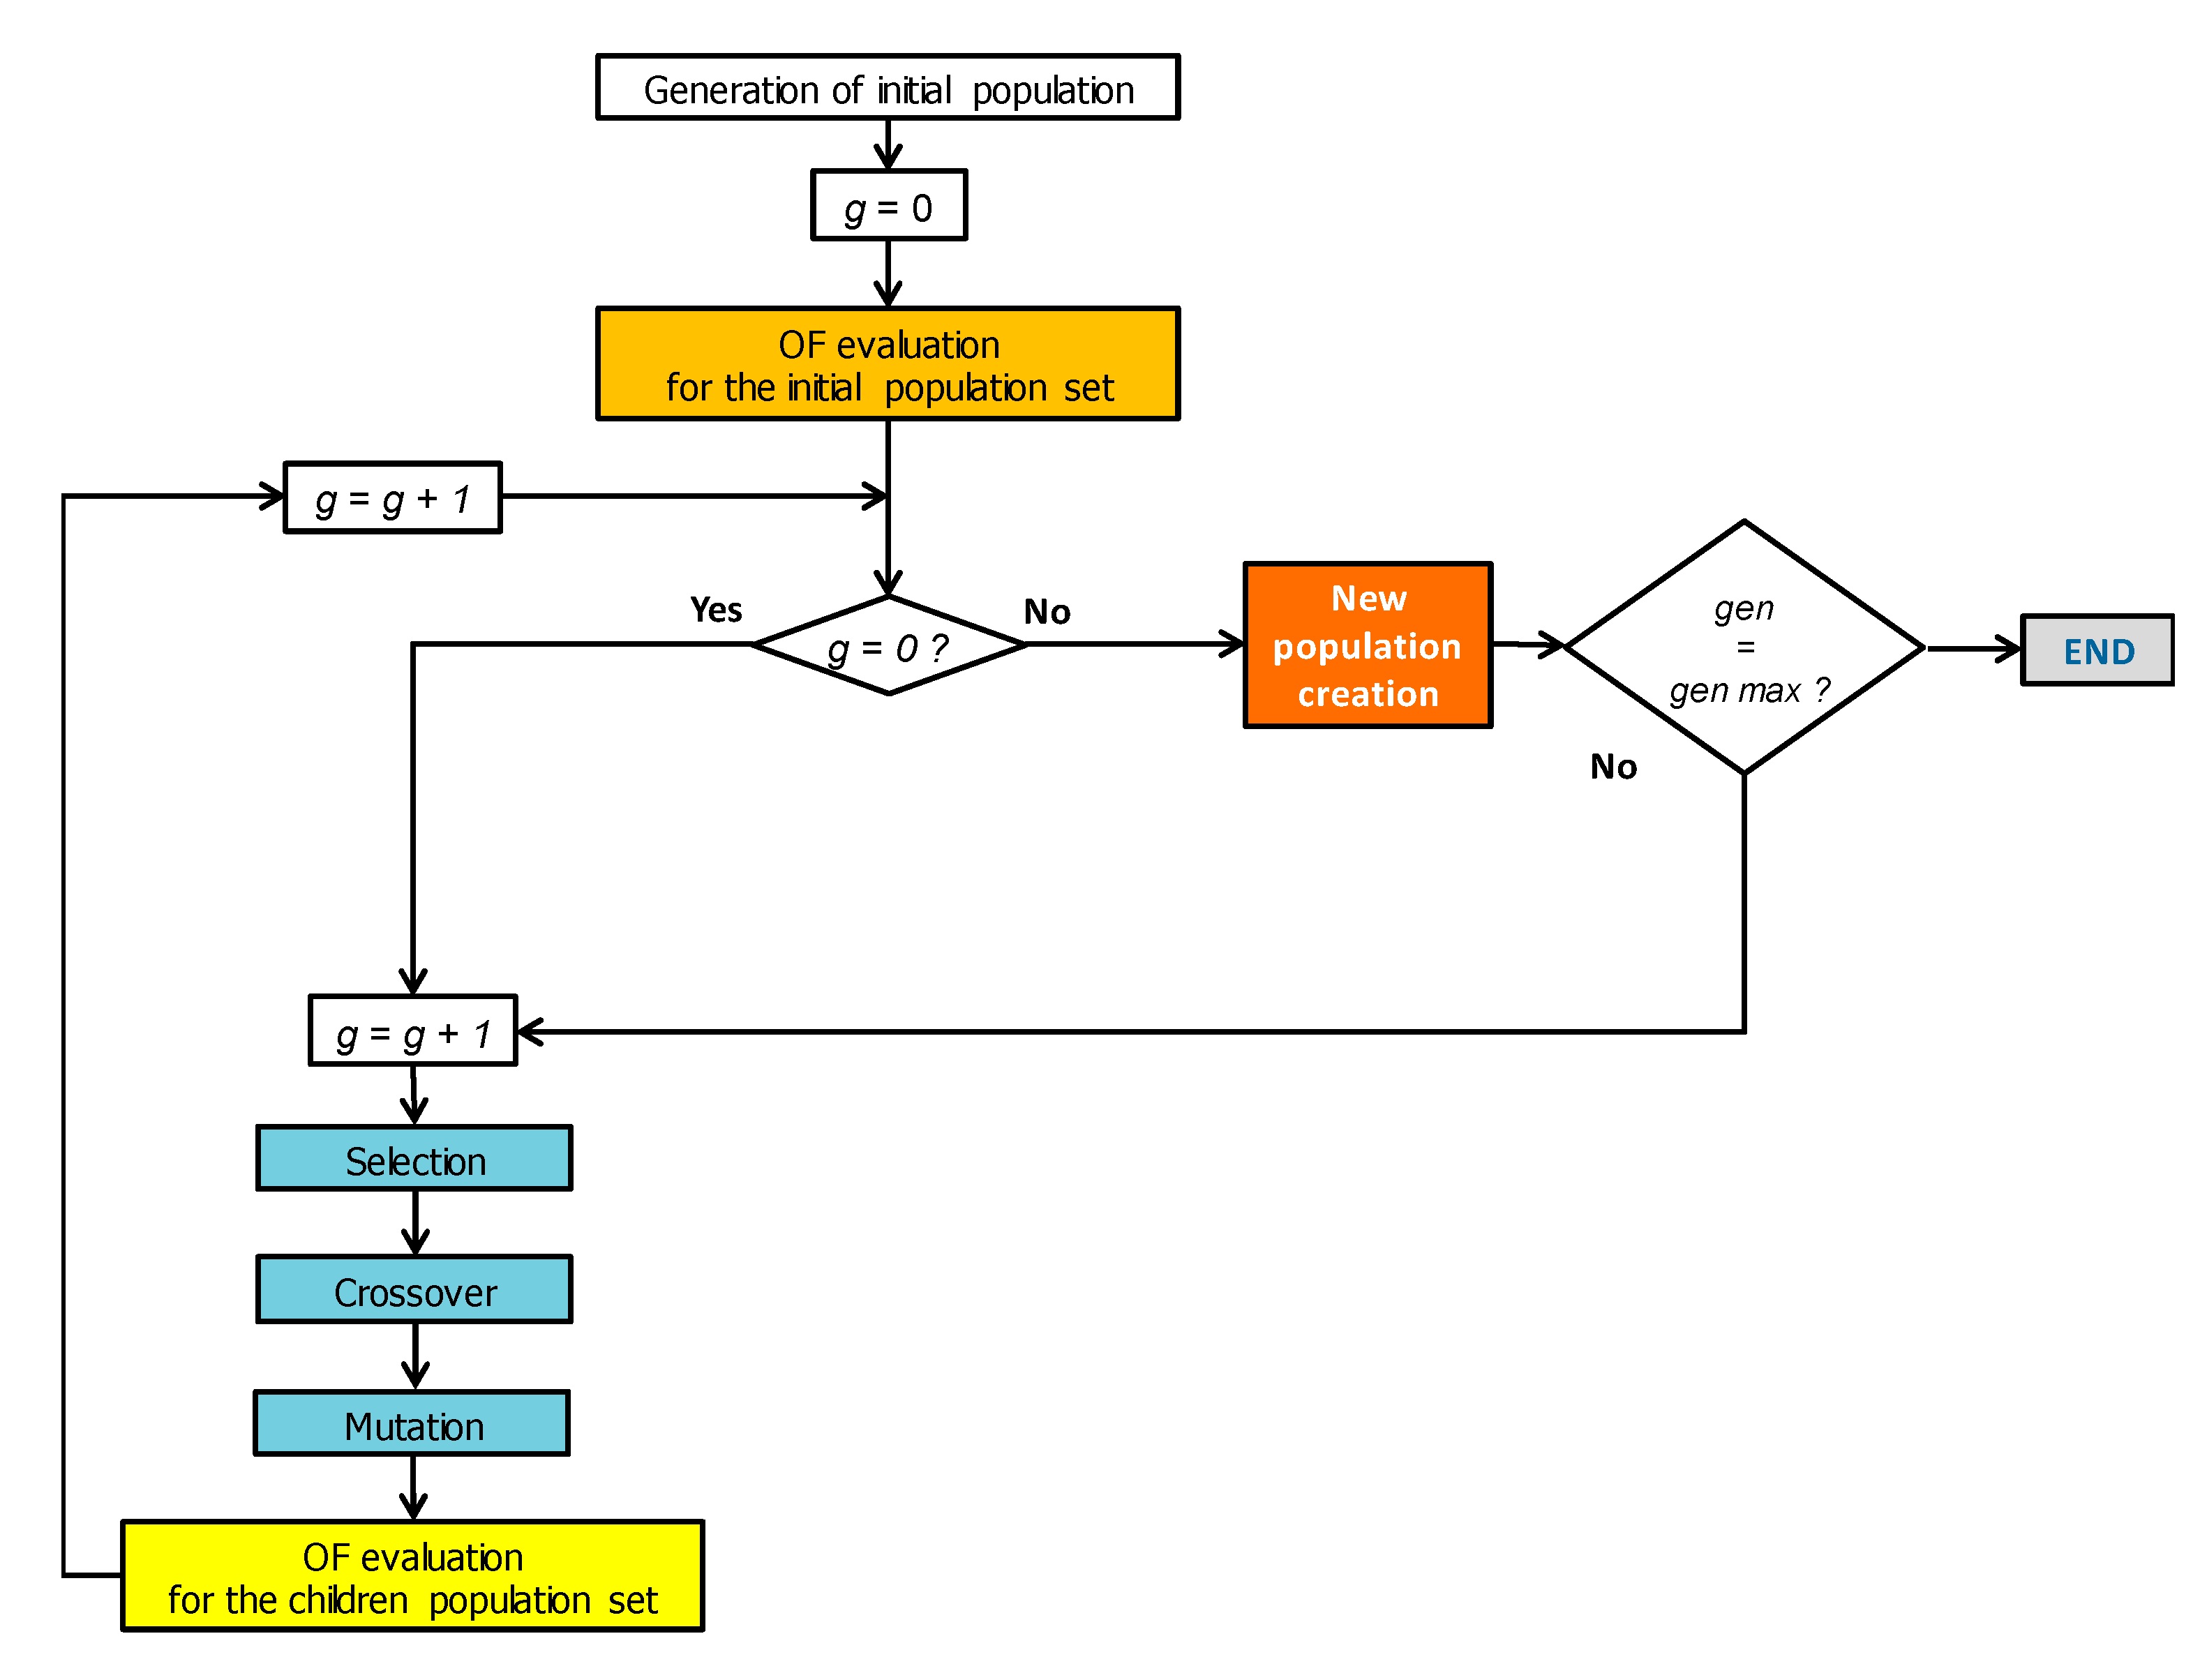
The GA idea is based on the choice of a string random and the application of genetic operators over successive generations, which achieves adaptive strings. The GA flow diagram is shown in Figure 1.
The evolution starts from a random population. Only individuals with the best OF/fitness value are selected, using a random procedure, to form a mating pool set, that each chromosome has a different probability to survive, correlated with the OF/fitness value. The crossover operator is applied to a subset of the mating pool by taking a pair of chromosomes (parents that will yield a pair of offspring chromosomes). This operation is performed by choosing a random position in the string and then swapping either the left or right substrings of this position (one-point crossover) with its chromosome mate. After the crossover, the mutation operator can be applied. For the chromosome to be mutated, the values of a few positions in the string are randomly modified. A very low mutation probability is assumed to avoid complete loss of the genetic information carried through the selection and crossover methods. The new population is then used in the next GA iteration. The procedure ends when a maximum number of generations is reached.
Each individual in the population is evaluated by the fitness function, linked to the problem OF.
3. The Proposed Methodology for the Optimal Sizing and Placement of Capacitor Banks
In this paper, the author presents a novel algorithm to solve the capacitor bank unit’s placement in distribution networks, based on the GA. The GA is adopted to overcome the problems of classical optimization methods, such as nonlinear programming, that have limitations in searching for absolutely optimal solutions and are sometimes trapped in local minimums. However, the proposed method has the innovative feature of finding, at the same time, the optimum sizing, pattern control, and their allocation in the network, which cannot be achieved by the presently available methods in the literature.
3.1. Solution Coding
The first important aspect of a correct GA implementation is the encoding of the potential solution.
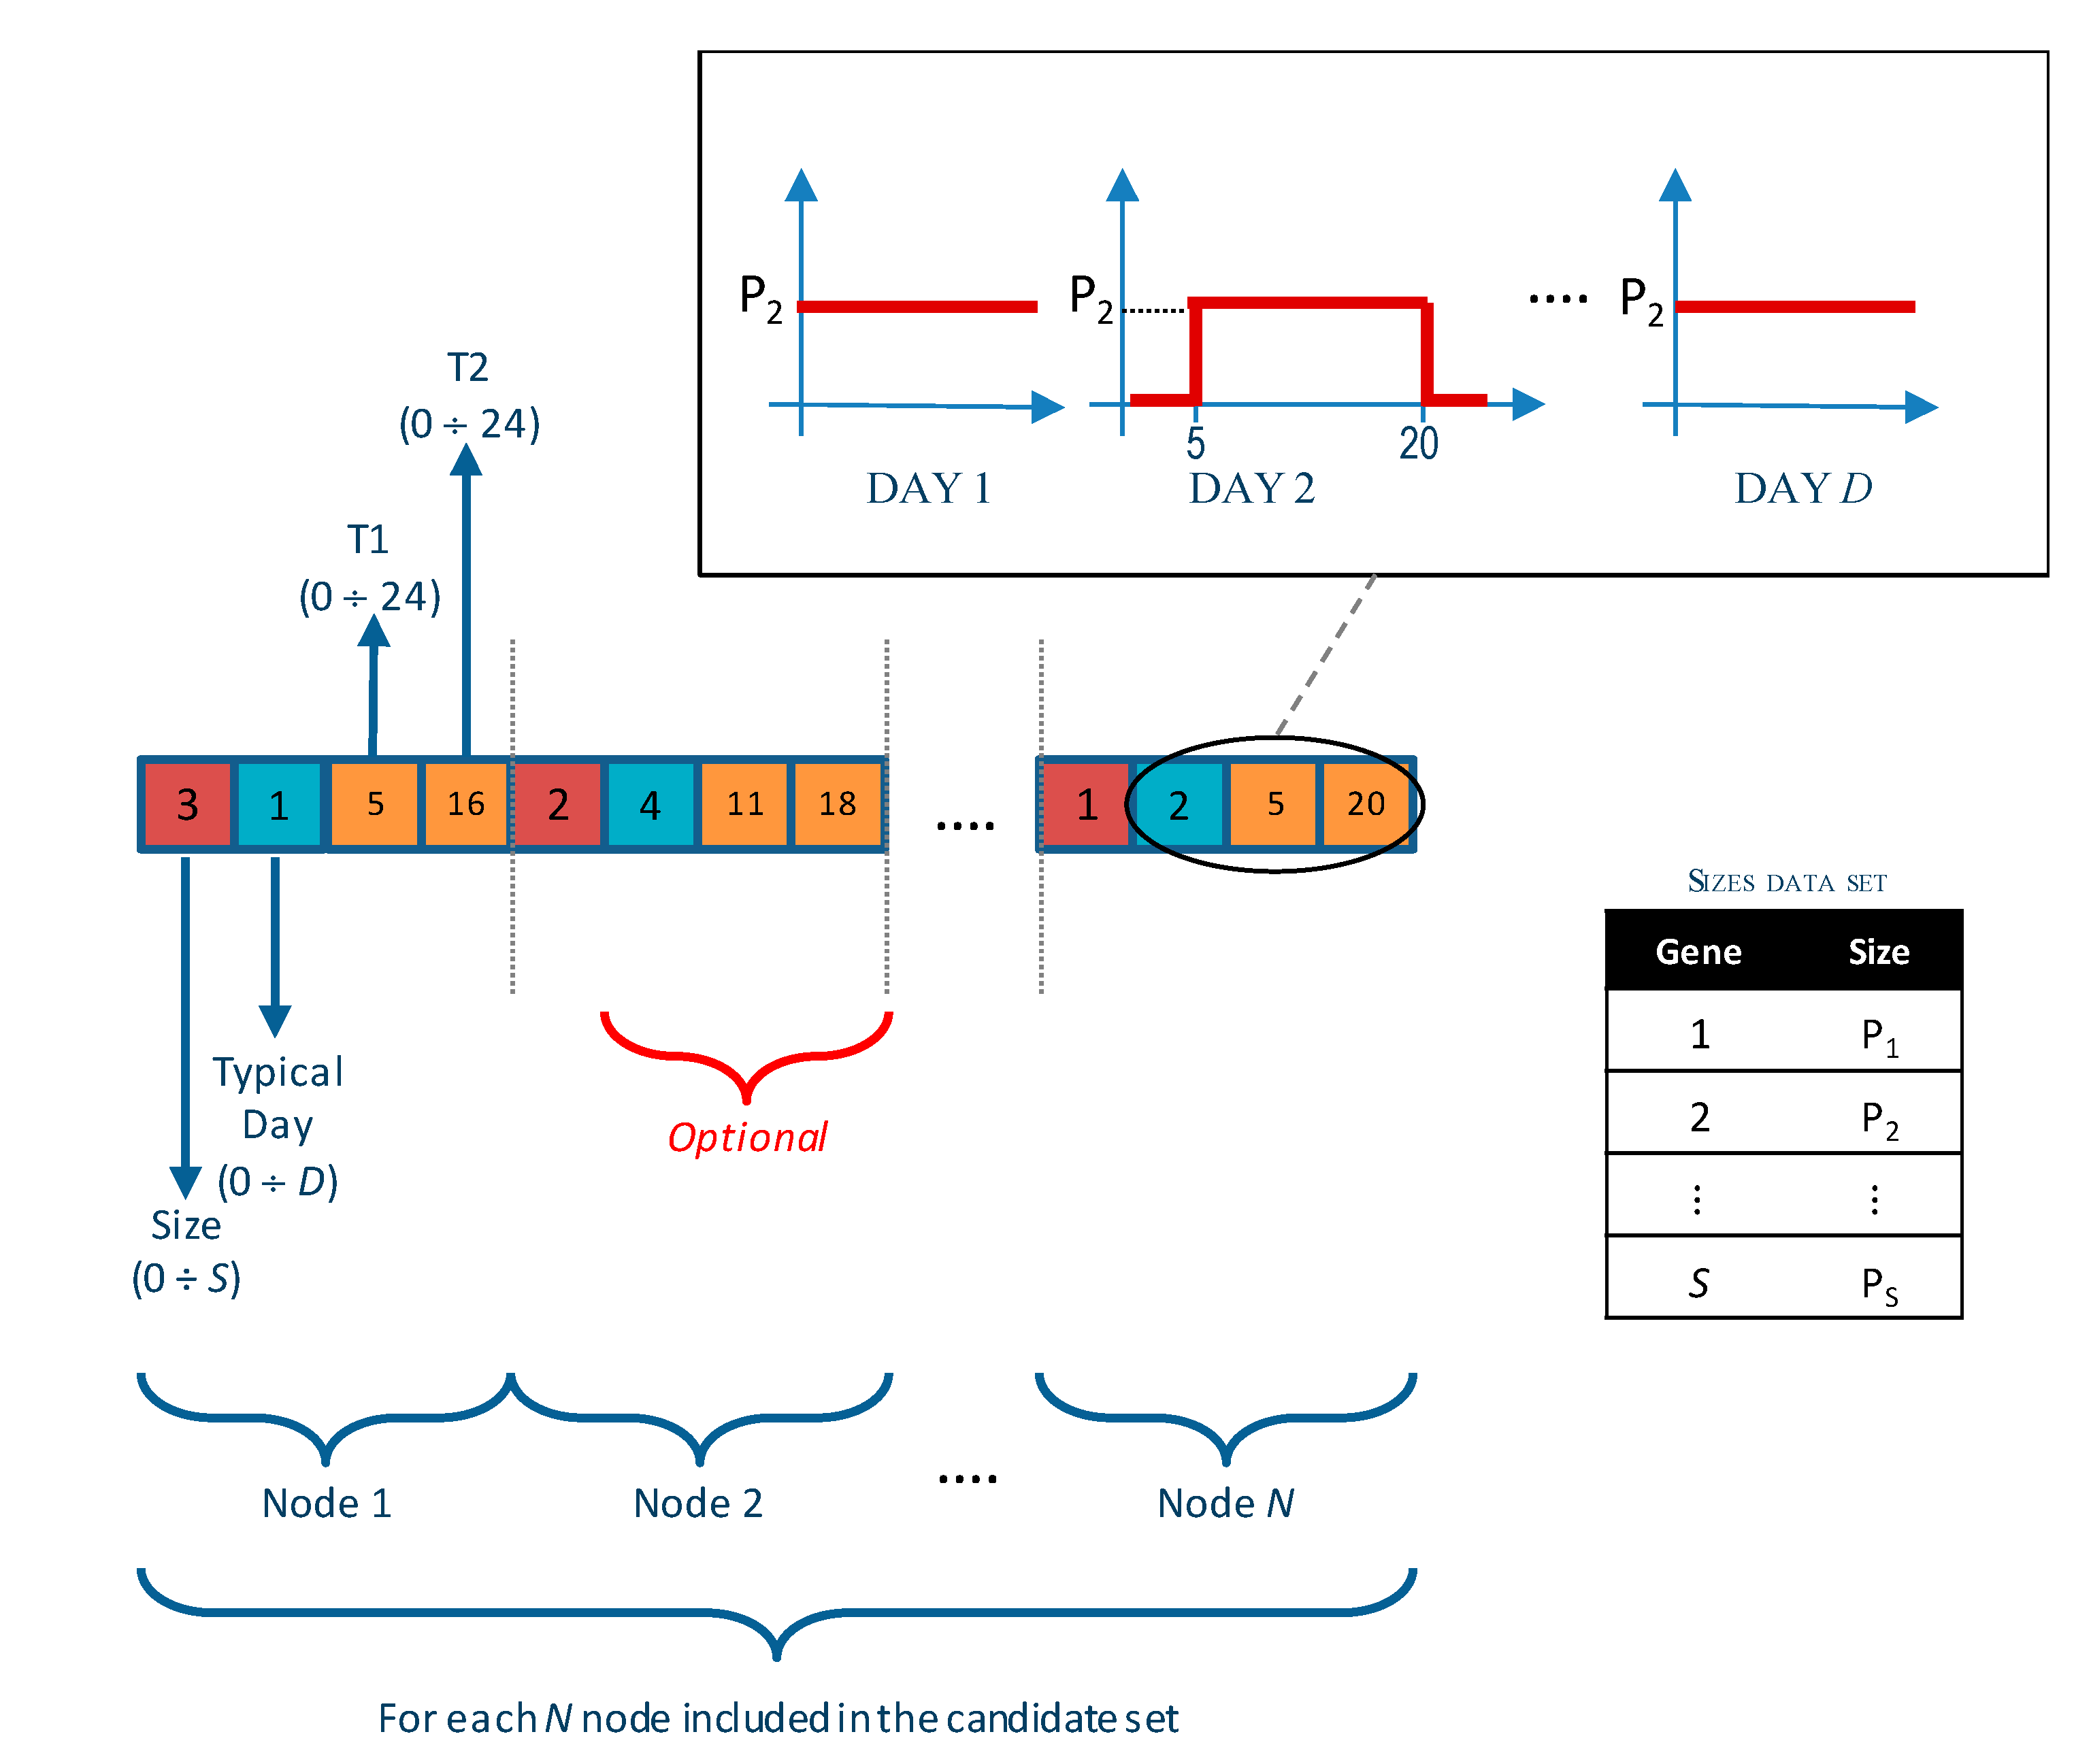
The decision variables in the GA are usually encoded into a binary string as a set of genes corresponding to chromosomes in biological systems. A group of chromosomes is called “population.” If the network structure is fixed, all the branches between nodes are known, and the evaluation of the OF depends only on the location and parameters of capacitor bank units. For simplicity, the capacitor bank units allocated by the algorithm are supposed in the candidate nodes set. In this condition, each solution (referred to as a single capacitor bank allocation) can be coded by using a vector V, in which the first element contains the information on the presence of a capacitor bank. A binary coding would be sufficient to solve the allocation problem of the capacitor bank (1 for the presence and 0 for the absence of a capacitor bank), but not to define the size and/or the control pattern in the different typical days adopted. Therefore, it is necessary to define an integer alphabet instead of a binary variable, with a subvector that contains all the parameters necessary to completely define the pieces of information of a single capacitor, including the size and the control pattern information.
To completely define the characteristic of a capacitor bank unit eventually allocated, shown in Figure 2, the gene is characterized by different subarrays.
For each candidate node i in the candidate nodes set can be defined a single subvector where:
- The first element, with an integer number (between 0 and S), identifies the eventual capacitor unit allocated in node i (Figure 2). This gene detects no capacitor in the node with the null value, while a positive number indicates a size code between the S sizes set included in the optimization (Figure 2).
- A subarray identifies the optional definition of a daily profile for the capacitor bank unit if the performed analysis includes the pattern control optimization. In particular, only in the typical day d fixed in the first array element (day 2 in the example of Figure 2), the other two genes are the day time when the unit is turned on and turned off, respectively (Figure 2). The fundamental assumption of this representation confines the switch operation of the capacitor bank unit in a unique representative day of the total D days. Anyway, this assumption is not a limit of the proposed approach but denotes an important real operating condition that avoids a frequently switching use, preserving its lifetime and consequently obtaining a maintenance cost reduction. The occurrence of the single representative day returns the yearly occurrence for the switching operations performed for the capacitor bank unit.
The overall solution is constituted by many subvectors equal to the number of candidate nodes for the capacitor placement, N.
3.2. Genetic Operators
The selection method adopted is the roulette wheel selection. In the roulette wheel selection, the probability of choosing an individual for breeding of the next generation is proportional to its fitness; the better the fitness is, the higher is chance for that individual to be chosen. In particular, the ratio between the OF/FF and its average value returns the expected number of sure reproductions; the integer part is the number of sure reproductions of the individual, while the residual to the near integer is equal to the probability of another reproduction of the same individual. With the aim of guaranteeing elitism, a small portion of the best individuals (10%) from the last generation is carried over (without any changes) to the next one.
The crossover operator adopted is the uniform crossover.
3.3. Objective Function
The aim of the proposed approach consists in minimizing the total planning cost, including investment and variable cost. The proposed OF includes various terms that can be referring to the following aspects:
- Costs of capacitor banks;
- Energy losses;
- Power factor infringements, with a reference to a prefixed threshold based on the voltage level.
The OF evaluation is performed for every single solution obtained by genetic operators. First of all, by the encoding method defined in a previous section, it is possible to define the number of capacitor bank units included in the generic solution under investigation.
The Matpower package [28] is used for performing the load plow (LF) analysis needed for the OF calculation. In particular, the LF calculations are performed for each time interval of the D representative days included in the optimization. As a result of LF calculation, for each generic time interval h in the representative day d, the following quantities are obtained:
- Voltage nodes Vi,h,d, for each node i of the network and time interval h of the representative day d;
- Current branches Ib,h,d, for each branch b (lines or transformers) of the network and time interval h of the representative day d;
- Power factor PFb,h,d, for each branch b (lines or transformers), calculated at the first node, in the time interval h of the representative day d;
- Energy losses for the whole network eh,d, in the time interval h of the representative day d. This quantity is calculated taking into account the joule losses in the electrical lines and transformers according to their specific resistance values.
As mentioned above, the OF is constituted by three different terms, described with more details below.
The total cost of capacitor bank units, , is calculated by a specific unit cost according to the building and management costs in the lifespan assumed. The total cost is subdivided for each year of the lifespan adopted to obtain a cost comparable to the others that are intrinsically based on a single year (amortization criteria). Therefore, the capacitor bank units are calculated as in Equation (1), where is the cost (in $) for the capacitor bank with nominal power equal to (in MVar) and placed in a node with nominal voltage (in kV), while is a lifespan for the same unit (in years); the cost is calculated for all N candidate nodes (if ).
The energy losses cost, , is calculated for the solution under investigation starting from the LF results and the unitary joule losses cost, , in €/MWh. As described in Equation (2), summing the network energy losses eh,d for all the time intervals of the D representative days, the losses OF terms are obtained; in Equation (2), , in hours, is the discretization interval adopted for the LF calculations, while reports the number of occurrences in the year of the representative day d to obtain an energy losses cost in $/year.
The power factor infringements cost, , is calculated one more time starting from the LF results. For this cost type, a particular regulatory framework, derived from many approaches applied in some countries, is assumed. First of all, a power factor threshold, , is fixed for each voltage level; this threshold must be compared with the power factor calculated at the different nint interface points that must be included, by law, in the power factor infringement analysis. For instance, the interface between the distribution and transmission network and/or between two distribution network companies can be included in the power factor evaluation. The “interface power factor” (in the branches assumed as interface), PFint,h,d, is calculated for different time intervals in the representative days. Therefore, the fixed limit (that identifies admissible range values in the inductive and capacitive mode), generally speaking, can be violated only in some periods of the year. For this reason, a compact index to summarize this behavior, , is defined as the total hours of the year (percentage value) where the power factor in the interface int does not satisfy the fixed limits. The same quantity, , can be used to define a “magnitude factor,” , variable between 0 and 1, for the power factor violation. Finally, the power factor infringement cost is calculated as a fraction of the turnover distribution company, (in €), that can be referred to the interface int; then, the is calculated as in Equation (3).
Lastly, the OF for each solution, can be computed with Equation (4).
3.4. Constraints
In the proposed approach for the capacitor bank placement, different types of constraints, which include power-flow equality, nodal voltage, thermal limits, and switching operation limits, are considered in the optimization model.
The constraint of power-flow equations (equality constraints) can be expressed as in Equation (5), where and are active and reactive capacitor outputs (real capacitors need small active power), and and are the active and reactive net loads at node i, respectively.
and
are the real and imaginary parts of the nodal admittance matrix, respectively.
The inequality constraints regarding the node voltage constraints and the branch thermal limits. In Equation (6), the maximum and minimum voltages admitted for node i are defined.
In Equation (7), the branch thermal limits are reported, where is the apparent power thermal limit of the circuit between nodes i and j.
Finally, a constraint to switching operation is added to the optimization model. As discussed in the section devoted to the solution coding, the main assumption in the pattern optimization limits the switch operation of the bank unit in a unique representative day of the total D days. Therefore, for each solution and capacitor bank unit b, a vector of length D can be defined: if the k-th element of this vector is 1, the switching operation will be performed in the day k (only one vector element can be greater than zero). With this statement, the yearly switching operation for the bank b can be formulated as in (8), where is the limits adopted to limit the switches aging in the b-th capacitor bank unit and
is the number of occurrences in the year of the day d.
4. Case Study
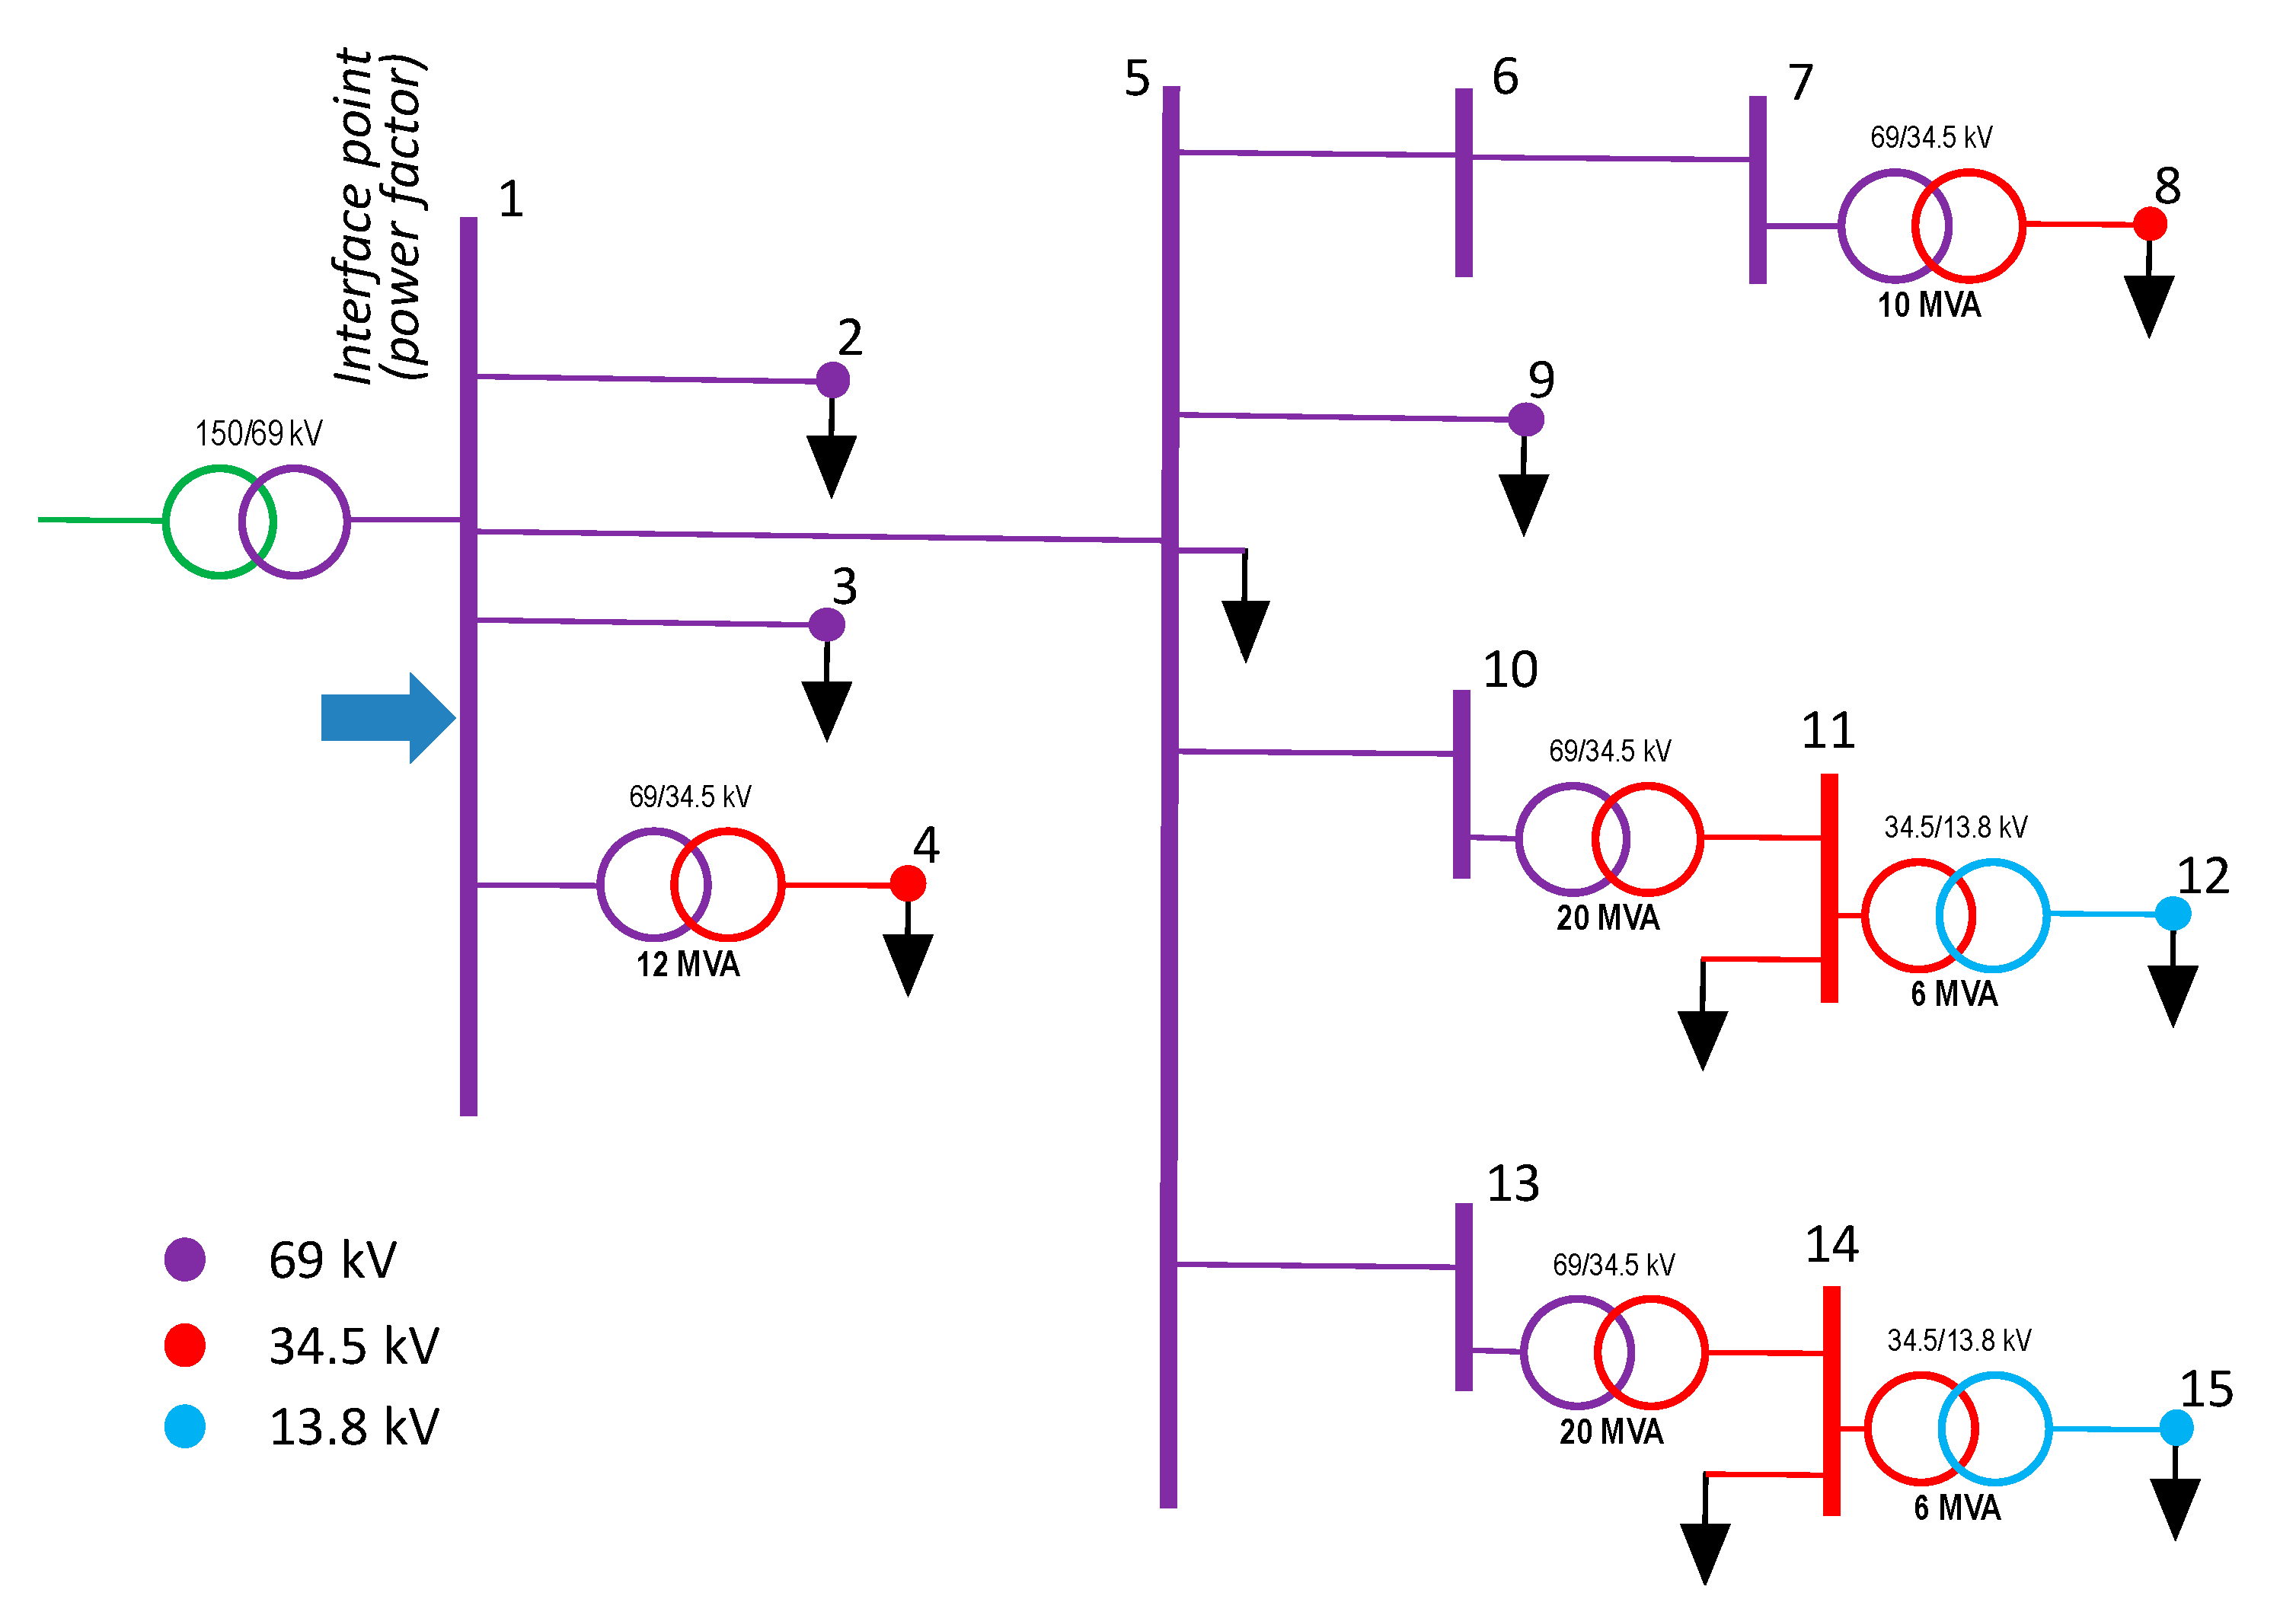
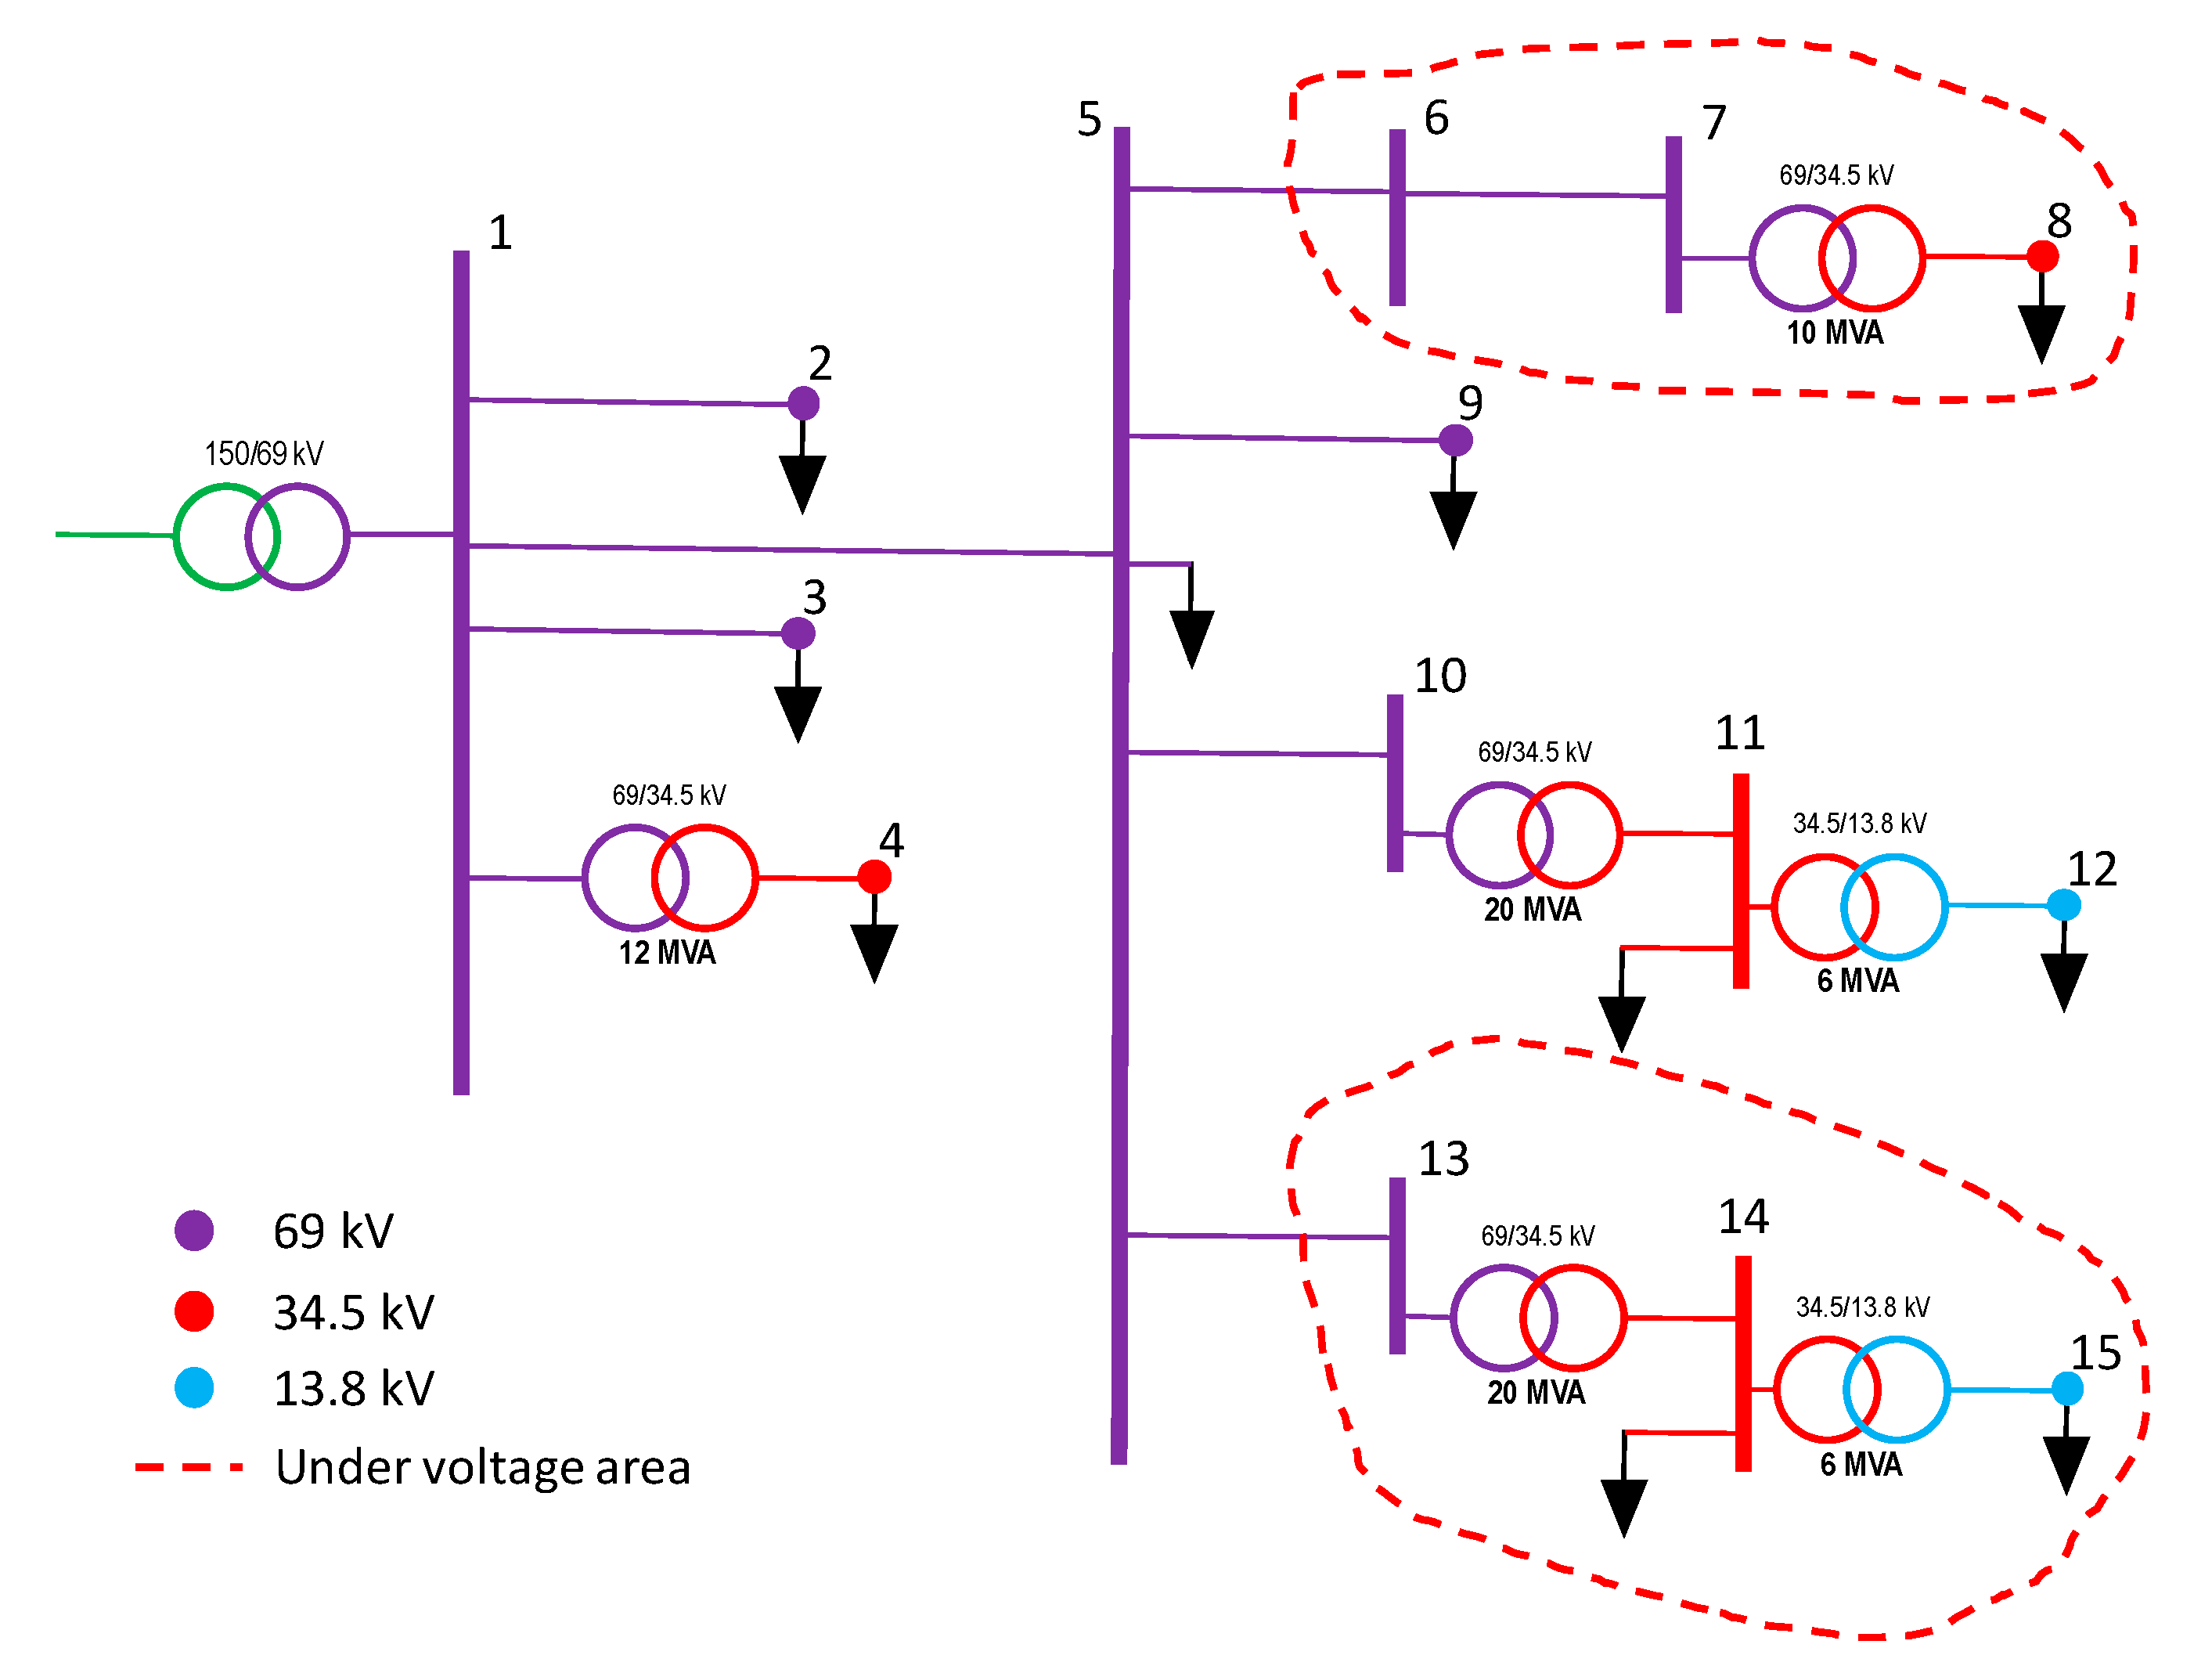
The proposed case study describes an application of the approach for finding optimal capacitor bank unit installation projects in a small distribution network derived from a real case (Figure 3). The network, constituted by 15 nodes (9 at 69 kV, 4 at 34.5 kV, and 2 at 13.8 kV) and 6 transformers, supplies energy to end-users (maximum power of 65 MW); no generators are included in the presented network. The limited number of nodes and the absence of generation can be referred to as the specific case study adopted (cluster version of a real case) without loss of generality respect to the proposed approach validity.
In Table 1, the main parameters of the test network shown in Figure 3 are provided. Table 1 reports the main information of the lines (starting node and finish node) and the resistance/reactance/thermal limit values; in the same table, the data about loads (maximum active and reactive power) in the finish node are indicated.
The LF calculations are performed with a Matpower package [28] with a discretization time equal to 1 h (). The admissible voltage range for all nodes of the network is 0.93 ÷ 1.05 pu. The representative days adopted are two (working day and weekend) for each year quarter that is adopted, with D = 8 (Table 2); in the same table, the number of occurrences in the year of the representative day d, is shown.
With reference to the power factor infringement penalty, the power factor threshold values, , for each voltage level are shown in Table 3; looking at the values, it can be shown that for Vnom ≥ 69 kV, the capacitive mode is not admitted.
Table 4 reports the values adopted for the magnitude factor, , according to the yearly percentage violation, . The part of the turnover distribution company, , that can be referred to as the interface of interest is assumed to be equal to 2.7 M$. The single interface point (69 kV) adopted in the case study is in node 1 (blue arrow in Figure 3), which is the network border with the transmission network.
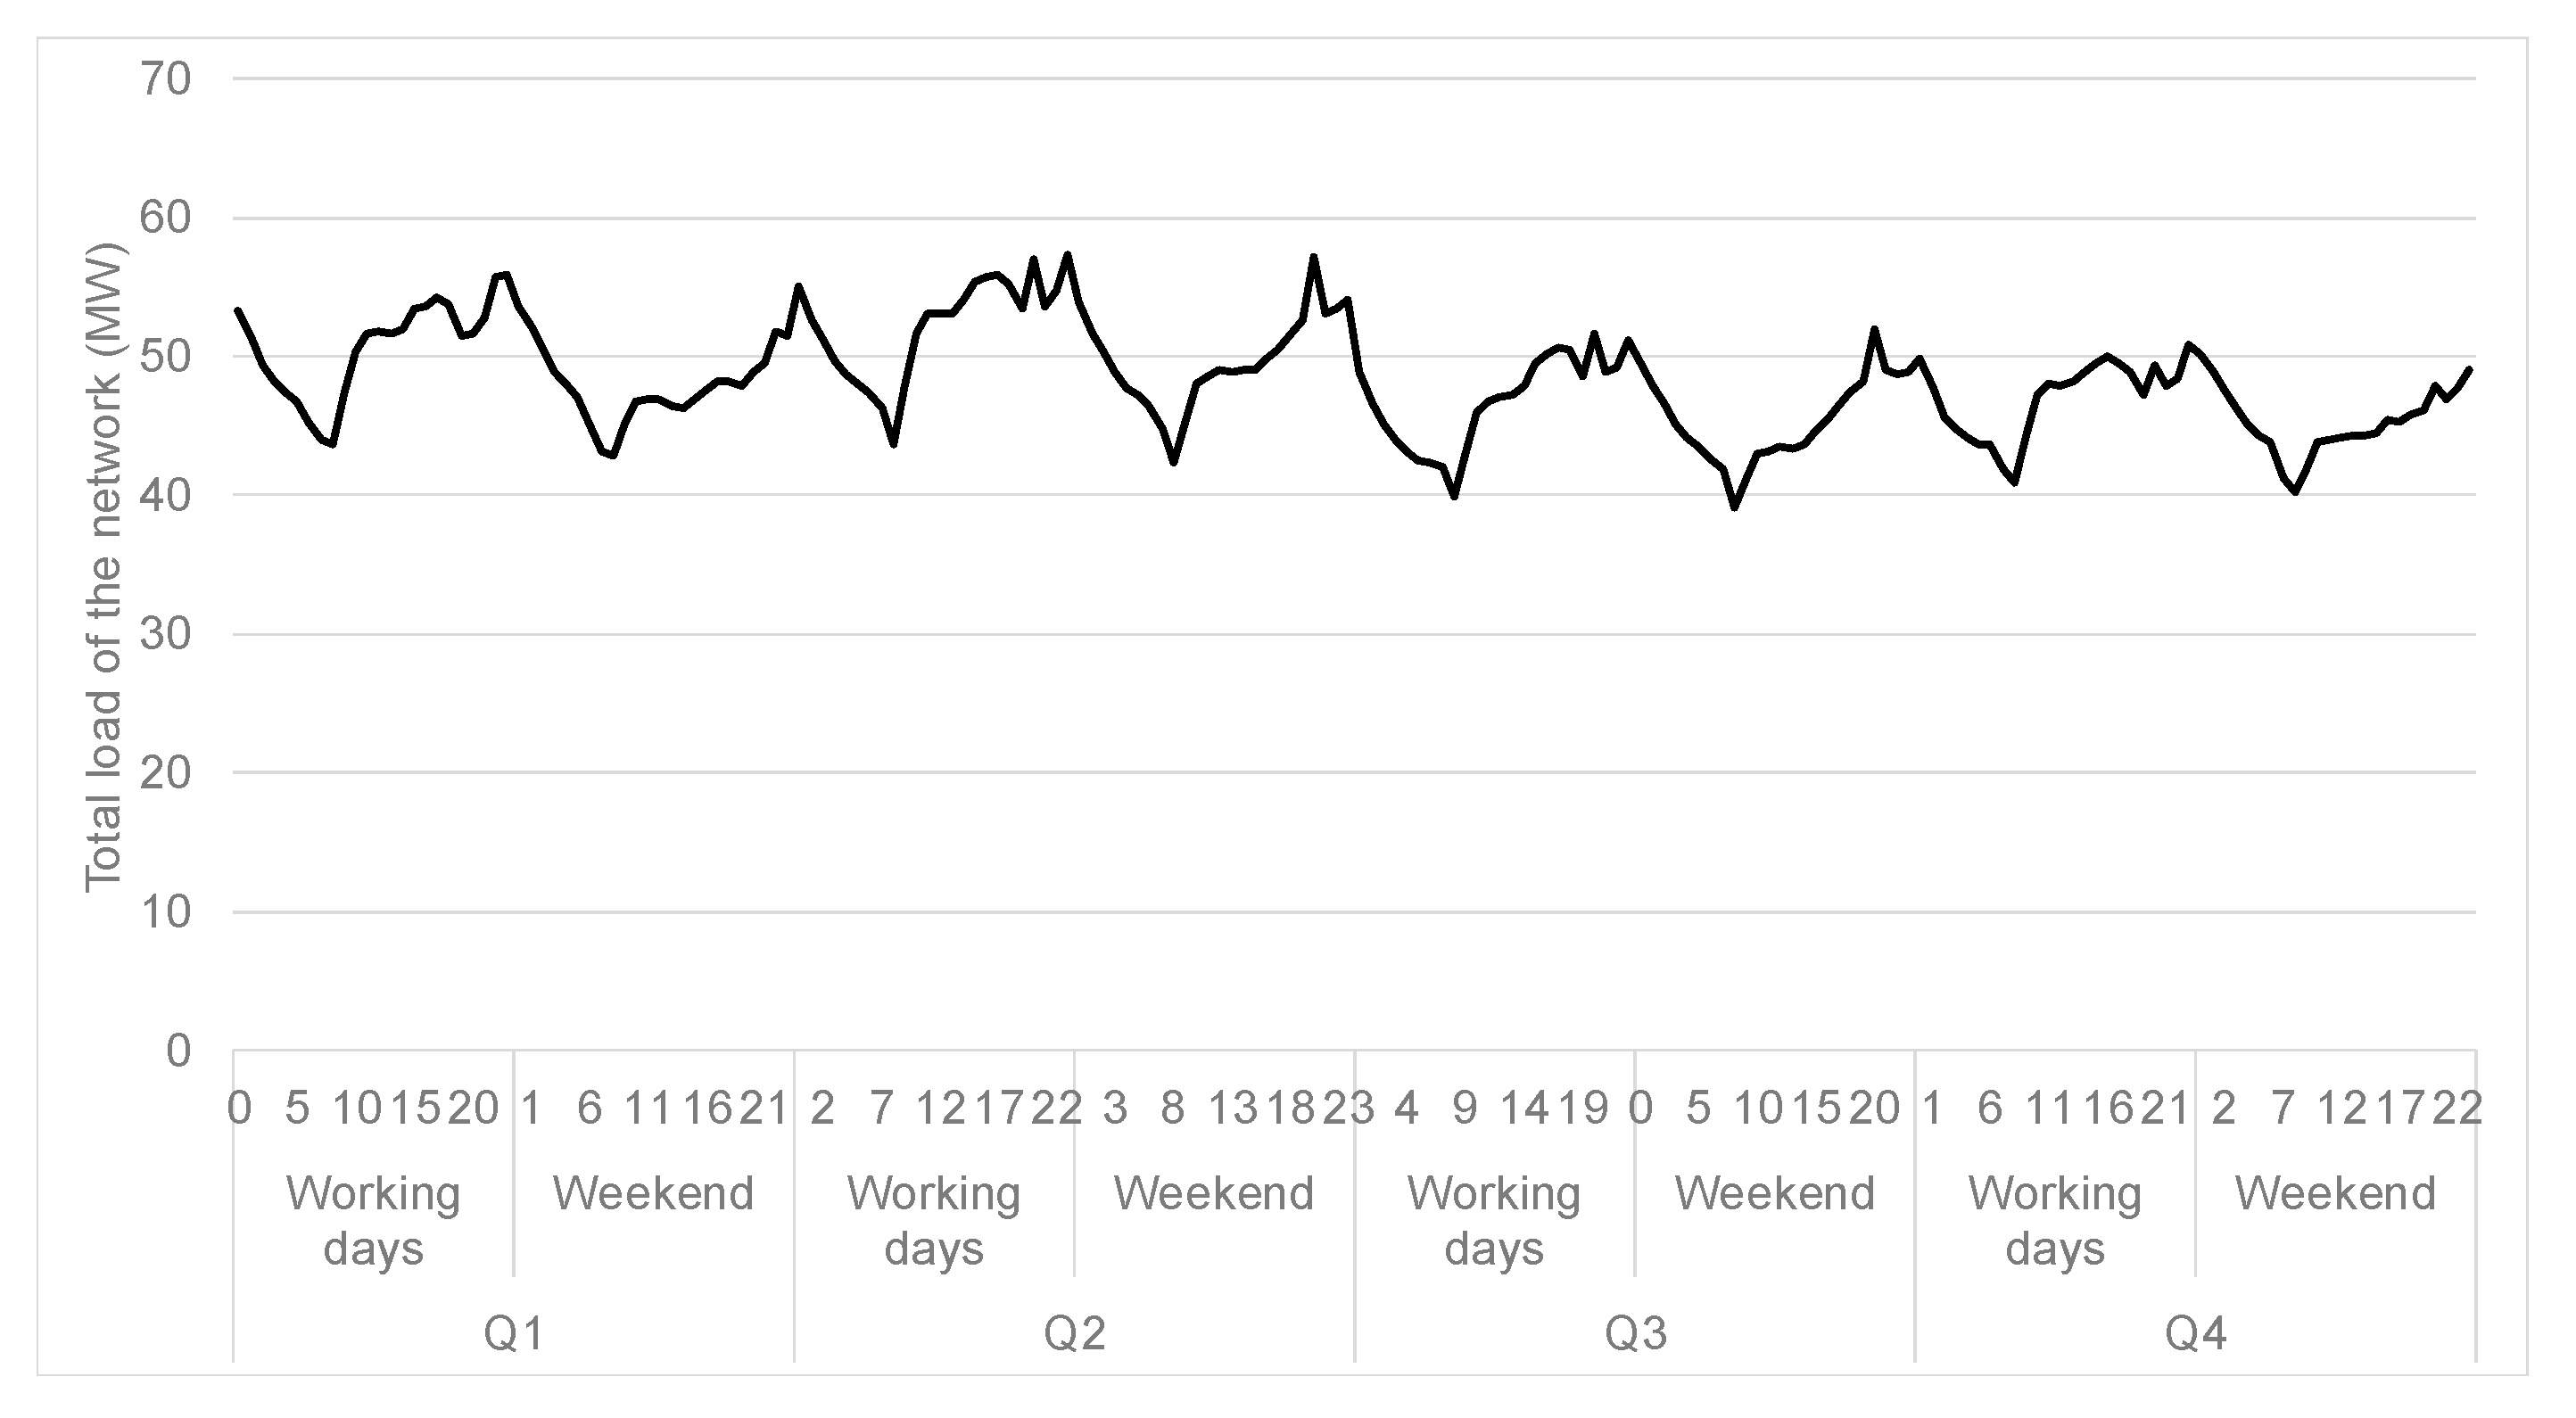
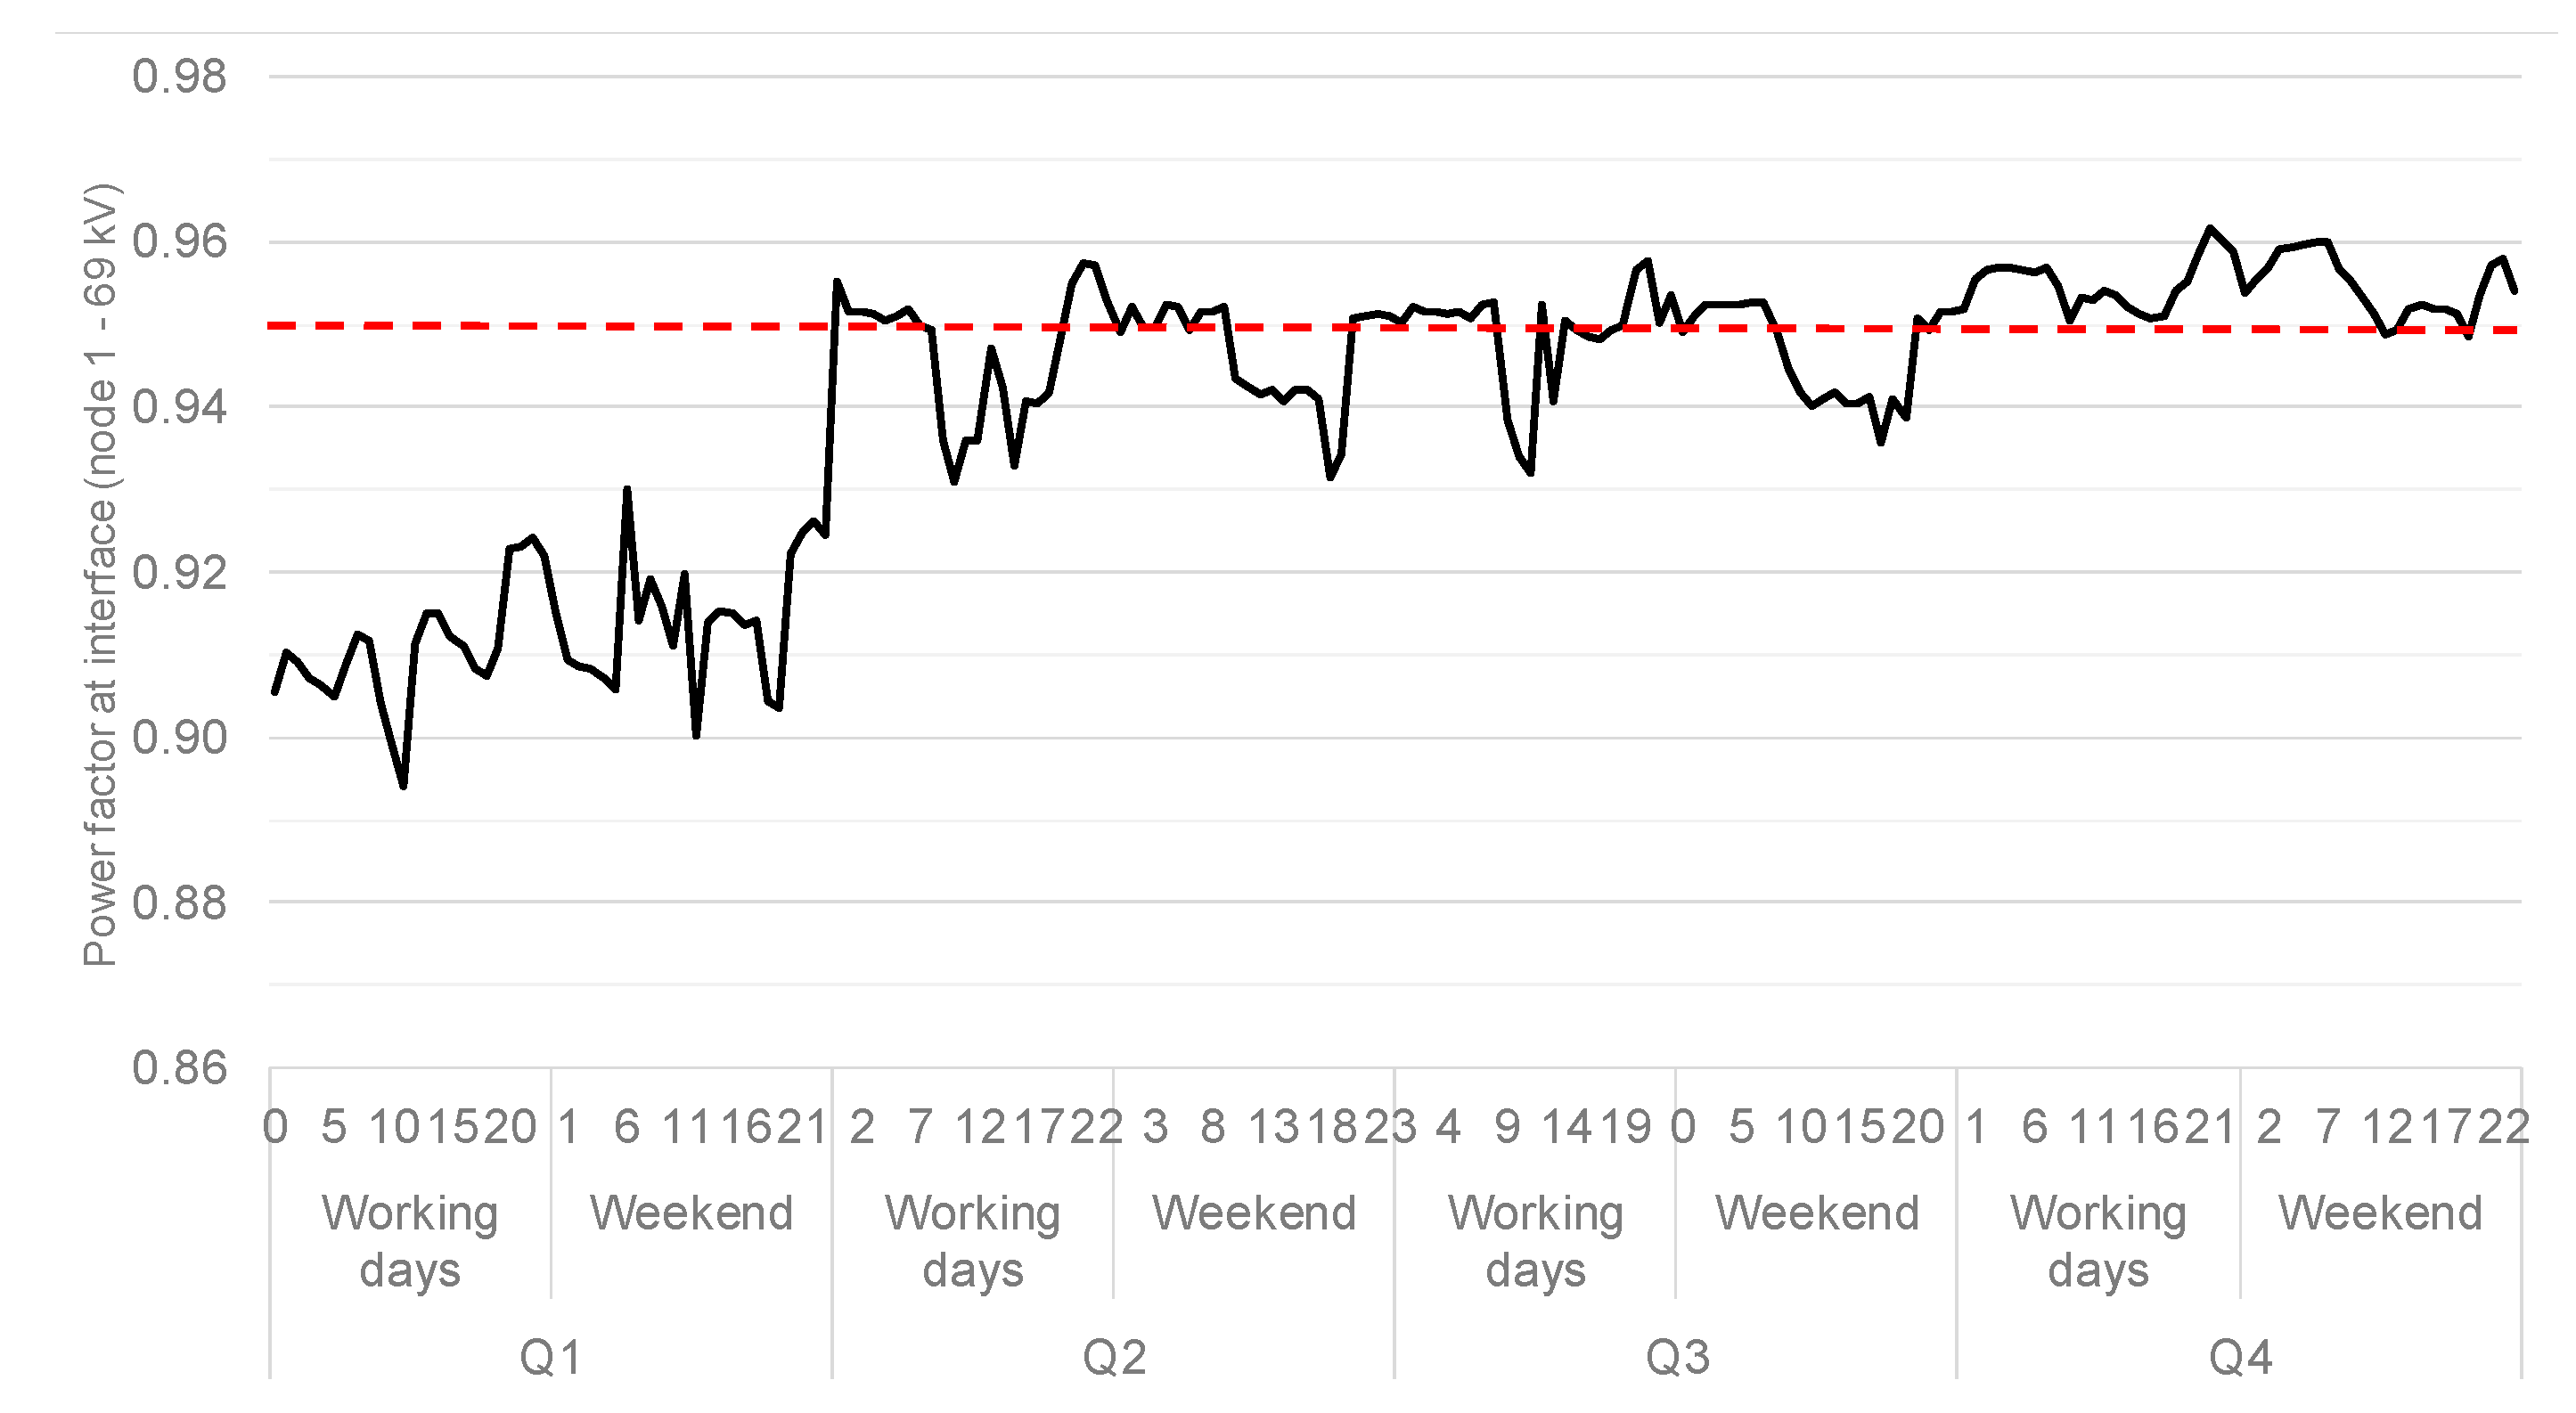
Loads are modeled with typical daily curves derived from real measurements for all representative days adopted. The load value reported in Table 1 can represent the load in any year of a generic planning period (taking into account the load growth). The load is independent of the voltage node (constant power mode). Figure 4 shows the load profile for the whole network, while in Figure 5 the global power factor (at node 1, existing case) is reported: it can be noticed that in many periods, especially in Q1, the power factor did not satisfy the limits in 50% of the time during the year.
The unitary joule losses cost, , is assumed to be equal to 190 $/MWh.
Table 5 reports the main data about the capacitor bank data adopted in the optimization; the cost unit is different with a reference to the connection voltage level for the capacitor banks. The capacitor model adopted in the LF is not ideal: to take into account the internal losses, an active power for the capacitor bank is considered equal to 0.5% of the reactive power. All nodes are eligible for capacitor placement ().
Regarding the main parameters of the optimization algorithm, a general rule often adopted for the GA is that population size and the number of generations have to increase with the dimension of the optimization problem (DOP, number of variables to be optimized simultaneously). Considering that the solution coding adopted uses 4 genes for each capacitor bank (Figure 2) and that the optimization includes 15 nodes, then DOP = 60. From the sensitivity analyses performed on the specific case study, population size and number of generations are chosen equal to 300 individuals and 120 iterations, respectively, representing a good compromise between quality of the results and calculation time. Indeed, it is observed that the population size should be 5 ÷ 6 times DOP to achieve high accuracy of the optimal solution. Instead, the final solution does not improve significantly with the growth of generations after a minimum number of iterations (2⋅DOP). Regarding the genetic operators, the crossover and mutation probability are assumed to be equal to 0.95 and 0.01, respectively.
5. Results and Discussion
For validating the effectiveness of the procedure, a comparison between the optimal solutions and the existing case, without any capacitor bank in the network (Figure 3), is considered.
In the existing case, as shown in Figure 5, the interface power factor does not satisfy the limits in many periods of the year (); the power factor infringement penalty, , considering Equation (3) and the constant values in Table 4, is then equal to 310 k$/year. Additionally, the network suffers some undervoltage conditions in the areas reported in Figure 6 with an annual duration that can be quantified 30% of the time in the year. The energy losses are equal to the 8.5% calculated referring to the input energy in the network; consequently, the losses energy cost, , is equal to 10.51 M$/year.
By applying the proposed optimization, the OF is calculated for each examined configuration. Two types of optimization are performed on the case study:
- (a)
- Optimal capacitor bank placement without pattern control optimization: in this analysis, the banks are always connected to their nominal value without any control in the daily pattern. In this case, the solution coding is limited, for each candidate node to placement, to the first gene in Figure 2.
- (b)
- Optimal capacitor bank placement with pattern control optimization, where the daily schedule for the capacitors can be controlled to improve the OF, as discussed in the paragraph dedicated to the solution coding.
In Table 6, the OF values for the two optimizations, in comparison with the existing case, are reported. In both optimizations, the undervoltage conditions in the existing case are eliminated thanks to the constraints on the voltage node limits.
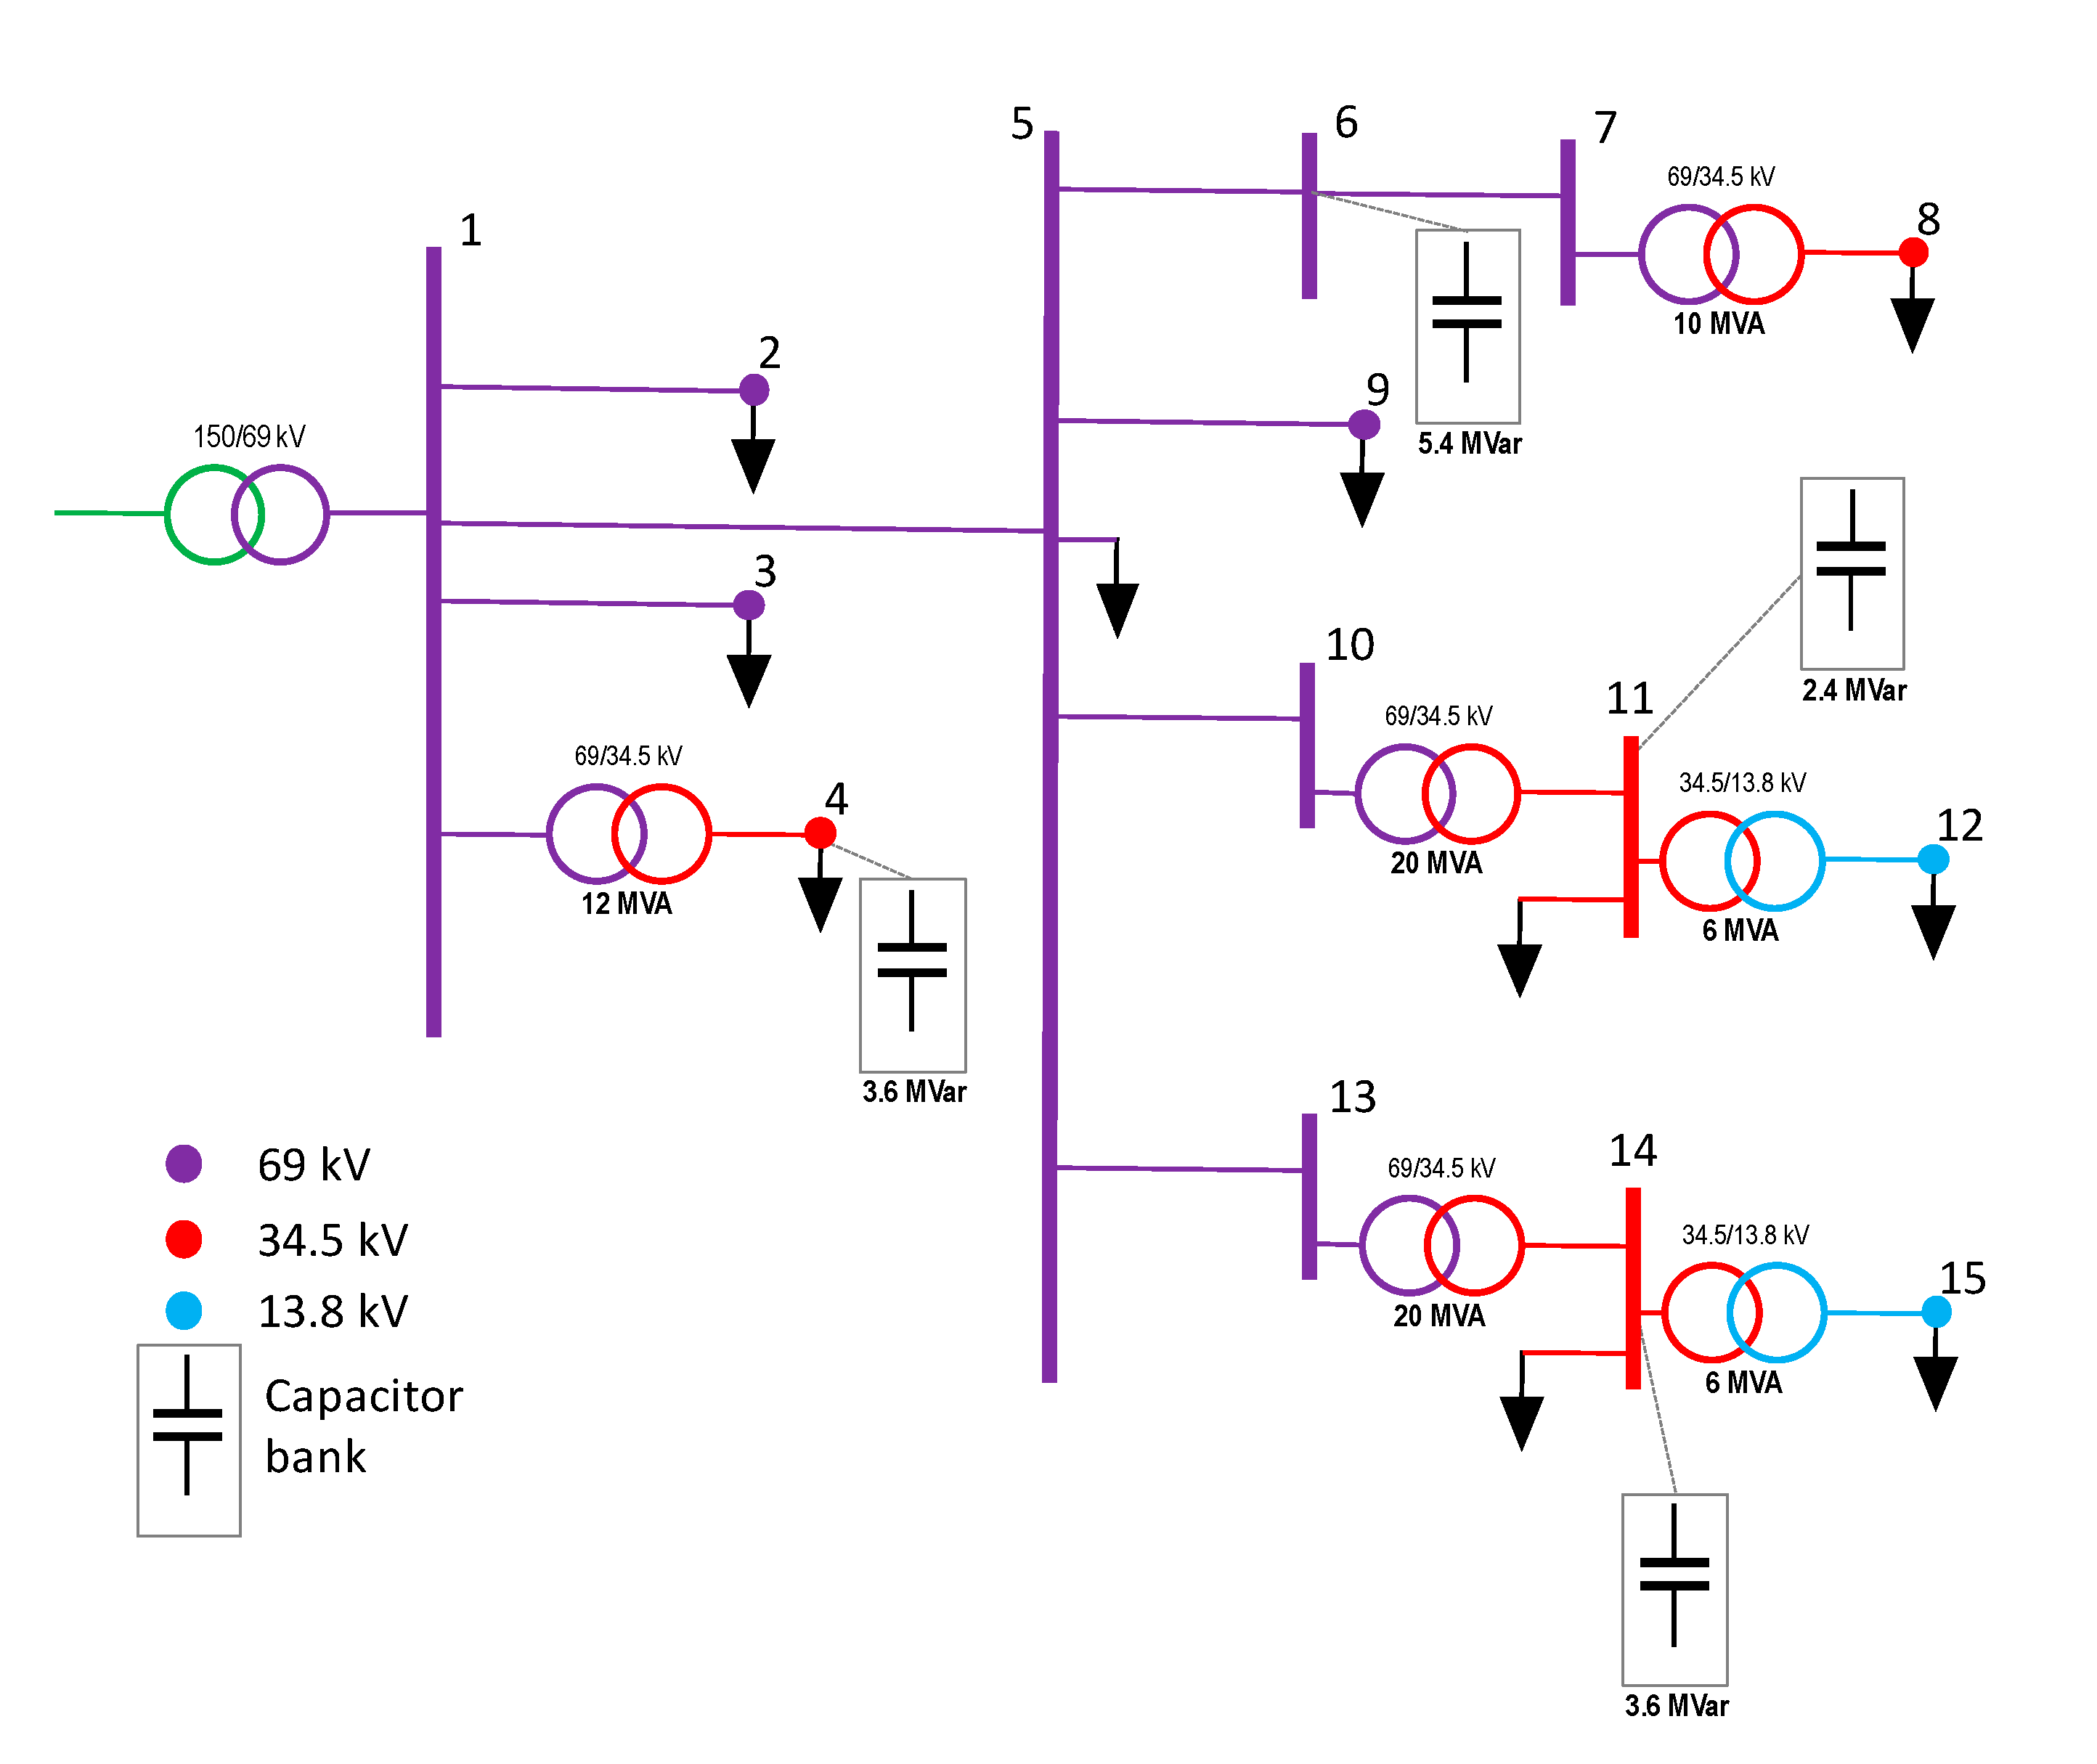
The capacitor configuration for case (a) (without pattern control optimization) is shown in Figure 7. The total power installed is equal to 10.2 MVar, but the power reactive is distributed along the network to locally compensate the reactive power and, consequently, decrease the energy losses. In fact, from the point of view, the capacitors can be installed in any node of the network that the power factor is evaluated in node 1 (top of the whole network). Therefore, the optimization finds a minimum power to install with a good location along with the network to minimize the losses (7.6% vs. 8.5%); the OF reduction is about 11% (Table 6). The power factor profile at the interface is reported in Figure 8. It can be noticed that for case (a), the power factor is abundantly inside the limits.
The optimization for case (b) (with pattern control optimization) establishes a placement in the same nodes of case (b) (Figure 9), but with a bigger power installed (15 MVar vs. 10.2 MVar). In case (b), the increase in the power installed reports a better power factor profile (green points in Figure 8), very close to the unit value, but in some intervals (not reported in the profile), the overcompensation shifts to “capacitive mode,” which is inadmissible for the power factor infringements (Table 3). Without a pattern control, the configuration described in Figure 9 returns a high level of power factor violation () and a high total OF value (9.74 M$/year). For these reasons, in case b, it is fundamental to control the daily schedule to limit the overcompensation cases; in particular, this control switches off the units in nodes 4 and 14 in the last representative day (Q4, weekend) to reduce the power factor violation at . The good level of power factor, despite the switching operation for some capacitor units, allows a further reduction in minimizing the losses (7.3% vs. 7.6%, case a).
The comparison between case a and case b demonstrates that the use of a pattern control for the capacitor units allows a better OF result (−12.3% vs. 10.3% for the OF reduction, Table 6). The capacitor banks are fixed in case a, while regulated, following the optimal pattern, in case b.
6. Conclusions
Optimal capacitor placement is one of the common issues in power system studies. In this paper, a novel optimization algorithm is used. In this regard, the genetic algorithm is introduced and modeled. The main novelty proposed is the inclusion of the daily scheduling into the solution coding, together with siting and sizing of the capacitor units, to simultaneously optimize all the main features that should be considered in a capacitor implementation project. The proposed approach is applied to a specific case study derived from a real distribution network, and the results demonstrate the efficiency of the proposed method to resolve the capacitor placement issue in the distribution network. According to the discussed results, the main advantage of the proposed method is the minimum total cost. Further works will be devoted to the investigation of placement techniques for some power electronics able to compensate some capacitive cluster loads, which in some distribution network can happen. Besides, some multiobjective approaches can be adopted in order to obtain the best compromise solution without the need to monetize each selected point of view and/or add other objectives as the harmonic issues during the capacitor placement.
Funding
This research received no external funding.
Institutional Review Board Statement
Not applicable.
Informed Consent Statement
Not applicable.
Conflicts of Interest
The author declares no conflict of interest.
References
- Saad, O.; Abdeljebbar, C. Historical Literature Review of Optimal Placement of Electrical Devices in Power Systems: Critical Analysis of Renewable Distributed Generation Efforts. IEEE Syst. J. 2020. [Google Scholar] [CrossRef]
- Elsheikh, A.; Helmy, Y.; Abouelseoud, Y.; Elsherif, A. Optimal capacitor placement and sizing in radial electric power systems. Alex. Eng. J. 2014, 53, 809–816. [Google Scholar] [CrossRef] [Green Version]
- Yang, F.; Li, Z. Improve Distribution System Energy Efficiency with Coordinated Reactive Power Control. IEEE Trans. Power Syst. 2015, 31, 2518–2525. [Google Scholar] [CrossRef]
- Pranitha, M.P.; KRM Vijaya, C. Optimal capacitor placement based improved reliability assessment of a distribution system. In Proceedings of the 2017 International Conference on Intelligent Computing and Control (I2C2), Coimbatore, India, 23–24 June 2017. [Google Scholar]
- Lohia, S.; Om Prakash, M.; Sheesh, R.O. Optimal capacitor placement in distribution system using genetic algorithm. In Proceedings of the 2016 IEEE 7th Power India International Conference (PIICON), Bikaner, India, 25–27 November 2016. [Google Scholar]
- Bharti, D. Multi-point Optimal Placement of Shunt Capacitor in Radial Distribution Network: A Comparison. In Proceedings of the 2020 International Conference on Emerging Frontiers in Electrical and Electronic Technologies (ICEFEET), Patna, India, 10–11 July 2020; pp. 1–6. [Google Scholar]
- Hartono, H.; Azis, M.; Muharni, Y. Optimal Capacitor Placement for IEEE 118 Bus System by Using Genetic Algorithm. In Proceedings of the 2019 2nd International Conference on High Voltage Engineering and Power Systems (ICHVEPS), Denpasar, Indonesia, 1–4 October 2019; pp. 1–5. [Google Scholar]
- Šarić, M.; Hivziefendić, J. Optimal Capacitor Placement in Distribution Network for Loss Reduction and Voltage Profile Improvement. In Proceedings of the 2019 18th International Symposium INFOTEH-JAHORINA (INFOTEH), East Sarajevo, Bosnia and Herzegovina, 20–22 March 2019; pp. 1–4. [Google Scholar]
- De Araujo, L.R.; Penido, D.R.R.; Carneiro, S.; Pereira, J.L.R. Optimal unbalanced capacitor placement in distribution systems for voltage control and energy losses minimization. Electr. Power Syst. Res. 2018, 154, 110–121. [Google Scholar] [CrossRef]
- Yann-Chang, H.; Hong-Tzer, Y.; Ching-Lien, H. Solving the capacitor placement in a radial distribution system using Tabu Search approach. IEEE Trans. Power Syst. 1996, 11, 1868–1873. [Google Scholar] [CrossRef]
- Murty, V.V.S.N.; Ashwani, K. Capacitor allocation in radial distribution system with time varying ZIP load model and energy savings. Procedia Comput. Sci. 2015, 70, 377–383. [Google Scholar] [CrossRef] [Green Version]
- Carlisle, J.C.; El-Keib, A.A. A graph search algorithm for optimal placement of fixed and switched capacitors on radial distribution systems. IEEE Trans. Power Deliv. 2000, 15, 423–428. [Google Scholar] [CrossRef]
- Masoum, M.A.S.; Ladjevardi, M.; Jafarian, A.; Fuchs, E.F. Optimal Placement, Replacement and Sizing of Capacitor Banks in Distorted Distribution Networks by Genetic Algorithms. IEEE Trans. Power Deliv. 2004, 19, 1794–1801. [Google Scholar] [CrossRef]
- Parashar, S.M.; Leena, G.; Pande, M.; Singh, J. Dynamic Capacitor Placement To Mitigate Disaster In Distribution System: A Fuzzy Approach. In Proceedings of the 2019 International Conference on Power Electronics, Control and Automation (ICPECA), New Delhi, India, 16–17 November 2019. [Google Scholar]
- Masoum, M.A.; Jafarian, A.; Ladjevardi, M.; Fuchs, E.F.; Grady, W.M. Fuzzy approach for optimal placement and sizing of capacitor banks in the presence of harmonics. IEEE Trans. Power Deliv. 2004, 19, 822–829. [Google Scholar] [CrossRef]
- Nasiri, M.; Faridpak, B.; Farrokhifar, M.; Alahyari, A. Optimal Capacitor Allocation in Sub-Transmission Networks to Mitigate Overloading Considering Harmonic Resonance. In Proceedings of the 2020 International Youth Conference on Radio Electronics, Electrical and Power Engineering (REEPE), Moscow, Russia, 12–14 March 2020; pp. 1–4. [Google Scholar]
- Ying-Tung, H.; China-Hong, C.; Cheng-Chih, C. Optimal capacitor placement in distribution systems using a combination of fuzzy-GA method. Electr. Power Energy Syst. 2004, 26, 501–508. [Google Scholar]
- Eajal, A.A.; El-Hawary, M.E. Optimal capacitor placement and sizing in unbalanced distribution systems with harmonics consideration using particle swarm optimization. IEEE Trans. Power Deliv. 2010, 25, 1734–1741. [Google Scholar] [CrossRef]
- Kamel, S.; Amin, A.; Selim, A.; Ahmed, M.H. Optimal Placement of DG and Capacitor in Radial Distribution Systems Considering Load Variation. In Proceedings of the 2019 International Conference on Computer, Control, Electrical, and Electronics Engineering (ICCCEEE), Khartoum, Sudan, 21–23 September 2019; pp. 1–6. [Google Scholar]
- Abdul Razak, M.A.; Othman, M.M.; Musirin, I.; Yahya, M.A.; Zakaria, Z. Significant Implication of Optimal Capacitor Placement and Sizing for a Sustainable Electrical Operation in a Building. Sustainability 2020, 12, 5399. [Google Scholar] [CrossRef]
- Kamel, S.; Mohamed, M.; Selim, A.; Nasrat, L.S.; Jurado, F. Power System Voltage Stability Based on Optimal Size and Location of Shunt Capacitor Using Analytical Technique. In Proceedings of the 2019 10th International Renewable Energy Congress (IREC), Sousse, Tunisia, 26–28 March 2019; pp. 1–5. [Google Scholar]
- Sani, S.A.; Bakare, G.A.; Ya’u, S.H.; Isa, A.I.; Musa, U. Optimal Capacitor Placement in Distribution Systems using Improved Bacterial Foraging Algorithm. In Proceedings of the 2019 IEEE PES/IAS PowerAfrica, Abuja, Nigeria, 20–23 August 2019; pp. 233–237. [Google Scholar]
- Mtonga, T.P.; Kaberere, K.K.; Irungu, G.K. Optimal Shunt Capacitors’ Placement and Sizing in Radial Distribution Systems Using Multiverse Optimizer. IEEE Can. J. Electr. Comput. Eng. 2021, 44, 10–21. [Google Scholar] [CrossRef]
- Ivanov, O.; Neagu, B.C.; Grigoras, G.; Gavrilas, M. Capacitor Banks Placement Optimization Improvement Using the Sperm Whale Algorithm. In Proceedings of the 2019 11th International Conference on Electronics, Computers and Artificial Intelligence (ECAI), Pitesti, Romania, 27–29 June 2019; pp. 1–4. [Google Scholar]
- José da Silva, D.; Antonio Belati, E.; Werley Silva dos Angelos, E. FPAES: A Hybrid Approach for the Optimal Placement and Sizing of Reactive Compensation in Distribution Grids. Energies 2020, 13, 6409. [Google Scholar] [CrossRef]
- Lee, W.-T.; Horng, S.-C.; Lin, C.-F. Application of Ordinal Optimization to Reactive Volt-Ampere Sources Planning Problems. Energies 2019, 12, 2746. [Google Scholar] [CrossRef] [Green Version]
- Goldberg, D.E. Genetic Algorithm in Search Optimization and Machine Learning; Addison-Wesley: Boston, MA, USA, 1989. [Google Scholar]
- Zimmerman, R.D.; Murillo-Sanchez, C.E.; Thomas, R.J. Matpower: Steady-State Operations, Planning and Analysis Tools for Power Systems Research and Education, Power Systems. IEEE Trans. Power Syst. 2011, 26, 12–19. [Google Scholar] [CrossRef] [Green Version]
Figure 1.
Genetic algorithm flow diagram.

Figure 2.
Optimal placement of capacitor banks based on GA: solution coding.

Figure 3.
Case study.

Figure 4.
Case study: total load profiles in the different representative days.

Figure 5.
Case study: global power factor profiles in the different representative days.

Figure 6.
Case study: undervoltage areas.

Figure 7.
Case study without pattern control optimization (case a): capacitor configuration.

Figure 8.
Case study: power factor interface profiles for the different simulations.

Figure 9.
Case study, with pattern control optimization (case b): capacitor configuration.


Table 1.
Case study: electrical branch parameters (lines and transformers) and data nodes.
| Node i | Node j | Branch Type | Rij (Ω) | Xi,j (Ω) | Smax (MVA) | Pj (MW) | Qj (MVar) |
|---|---|---|---|---|---|---|---|
| 1 | 2 | 69 kV line | 3.361 | 9.808 | 103 | 8.123 | 3.714 |
| 1 | 3 | 69 kV line | 9.094 | 17.282 | 40 | 6.275 | 2.658 |
| 1 | 4 | 69/34.5 kV transformer | 0.595 | 15.859 | 12 | 8.016 | 4.039 |
| 1 | 5 | 69 kV line | 0.480 | 14.616 | 92 | --- | --- |
| 5 | 6 | 69 kV line | 15.654 | 30.261 | 40 | 6.632 | 2.554 |
| 6 | 7 | 69 kV line | 0.338 | 0.652 | 40 | --- | --- |
| 7 | 8 | 69/34.5 kV transformer | 0.714 | 19.031 | 10 | 6.528 | 1.579 |
| 5 | 9 | 69 kV line | 0.162 | 0.439 | 46 | 14.192 | 4.719 |
| 5 | 10 | 69 kV line | 16.449 | 31.794 | 40 | --- | --- |
| 10 | 11 | 69/34.5 kV transformer | 0.298 | 5.917 | 20 | 5.296 | 1.003 |
| 11 | 12 | 34.5/13.8 kV transformer | 0.435 | 7.923 | 6 | 1.638 | 1.011 |
| 5 | 13 | 69 kV line | 21.715 | 21.696 | 24 | --- | --- |
| 13 | 14 | 69/34.5 kV transformer | 0.298 | 5.917 | 20 | 7.059 | 1.146 |
| 14 | 15 | 34.5/13.8 kV transformer | 0.435 | 7.923 | 6 | 1.468 | 0.706 |
Table 2.
Representative days adopted in the case study.
| Type of Day | Quarters | |
|---|---|---|
| Working day | Q1 (January ÷ March) | 64 |
| Weekend | 26 | |
| Working day | Q2 (April ÷ June) | 65 |
| Weekend | 26 | |
| Working day | Q3 (July ÷ September) | 66 |
| Weekend | 26 | |
| Working day | Q4 (October ÷ December) | 66 |
| Weekend | 26 |
Table 3.
Case study: power factor admissible range values.
| Voltage Level | Inductive Mode | (Capacitive Mode) |
|---|---|---|
| Vnom < 69 kV | 0.92 ÷ 1.00 | 0.92 ÷ 1.00 |
| Vnom ≥ 69 kV | 0.95 ÷ 1.00 | --- |
Table 4.
Case study: magnitude factor for the power factor infringement penalty.
| Yearly Power Factor Violations | |
|---|---|
| < 10% | 0.100 |
| 10% ≥ > 20% | 0.125 |
| 20% ≥ > 40% | 0.175 |
| 40% ≥ > 60% | 0.225 |
| 60% ≥ > 80% | 0.350 |
| ≥ 80% | 0.600 |
Table 5.
Capacitor bank unit data adopted in the case study.
| Size Code | Size (MVar) | Lifespan | Switching Limits | Unit Cost | |
|---|---|---|---|---|---|
| (Vnom < 69 kV) | (Vnom ≥ 69 kV) | ||||
| 0 | No capacitor bank unit in the node () | ||||
| 1 | 1.2 MVar | 5 years | 30 op/year | 100 k$ | 200 k$ |
| 2 | 2.4 MVar | 5 years | 30 op/year | 200 k$ | 440 k$ |
| 3 | 3.6 MVar | 5 years | 30 op/year | 300 k$ | 690 k$ |
| 4 | 5.4 MVar | 5 years | 30 op/year | 400 k$ | 1000 k$ |
Table 6.
OF values for the optimal placement capacitor bank unit performed for the case study.
(M$/Year) | (M$/Year) | (M$/Year) | (M$/Year) | |
|---|---|---|---|---|
| Existing case | --- | 10.51 | 0.31 | 10.81 |
| (a) Without pattern control optimization | 0.28 | 9.40 | 0.00 | 9.68 (−10.5%) |
| (b) With pattern control optimization | 0.36 | 9.03 | 0.10 | 9.49 (−12.3%) |
Publisher’s Note: MDPI stays neutral with regard to jurisdictional claims in published maps and institutional affiliations. |
© 2021 by the author. Licensee MDPI, Basel, Switzerland. This article is an open access article distributed under the terms and conditions of the Creative Commons Attribution (CC BY) license (https://creativecommons.org/licenses/by/4.0/).
Share and Cite
MDPI and ACS Style
Soma, G.G. Optimal Sizing and Placement of Capacitor Banks in Distribution Networks Using a Genetic Algorithm. Electricity 2021, 2, 187-204. https://0-doi-org.brum.beds.ac.uk/10.3390/electricity2020012
AMA Style
Soma GG. Optimal Sizing and Placement of Capacitor Banks in Distribution Networks Using a Genetic Algorithm. Electricity. 2021; 2(2):187-204. https://0-doi-org.brum.beds.ac.uk/10.3390/electricity2020012
Chicago/Turabian StyleSoma, Gian Giuseppe. 2021. "Optimal Sizing and Placement of Capacitor Banks in Distribution Networks Using a Genetic Algorithm" Electricity 2, no. 2: 187-204. https://0-doi-org.brum.beds.ac.uk/10.3390/electricity2020012