
Soil Sensitivity to Wind and Water Erosion as Affected by Land Use in Southern Iran

1
Department of Soil Science, School of Agriculture, Shiraz University, Shiraz 7144113131, Iran
2
Chair of Soil Science, Research Department of Ecology and Ecosystem Management, TUM School of Life Sciences Weihenstephan, Technical University of Munich, 85354 Freising, Germany
*
Author to whom correspondence should be addressed.
Earth 2021, 2(2), 287-302; https://0-doi-org.brum.beds.ac.uk/10.3390/earth2020017
Submission received: 11 May 2021
/
Revised: 31 May 2021
/
Accepted: 3 June 2021
/
Published: 6 June 2021
Abstract
:Land degradation by soil erosion is one of the most severe environmental issues that is greatly dependent on land use management. In this study, the effects of long-term land use management (including annual cultivated field (ACF), fallow field (FF), rangeland (R), and orchard field (OF)), soil depth (0–10 and 10–20 cm), and soil organic matter content (SOM) on wind- and water-erosion indices were investigated in calcareous soils of southern Iran. Soil samples were collected from four above-mentioned land-use types, and some soil properties and erosion indices were measured. Results showed that the most of soil aggregates stability indices in the surface layer (0–10 cm) of OF were higher than those in ACF, FF, and R, respectively, by nearly 39%, 32%, and 47% for dry mean weight diameter of aggregates (MWDdry); 10%, 10%, and 48% for dry geometric mean weight diameter of aggregates (GMDdry); 21%, 17%, and 15% for water-stable aggregates (WSA); and 11%, 16%, and 31% for aggregate stability index (ASI). Moreover, the mean of the soil wind erosion indicators in OF (0–10 cm) were lower than those in ACF, FF, and R, respectively, by nearly 18%, 24%, and 26%, for wind-erodible fraction (EF); 43%, 38%, and 49% for soil erodibility to wind erosion (K); and 36%, 32%, and 41% for wind erosion rate (ER). In ACF, despite the high clay content, some aggregate stability indices such as MWøDdry and WSA were the lowest among studied land-use types which showed the negative effects of conventional tillage practices. Depth factor had only a significant effect on dust emission potential (DEP) in ACF, FF, and OF. In addition, there were significant and strong correlations between SOM and MWDdry (r = 0.79), WSA (r = 0.77), EF (r = −0.85), K (r = 0.74), and ER (r = 0.74) in all datasets.
1. Introduction
Land degradation has been widely recognized as a global problem associated with desertification, low agricultural productivity, and rapid changes in ecosystems around the world, especially in arid and semi-arid regions like Iran [1,2]. Land degradation by soil erosion is one of the most severe environmental issues that affects many aspects of human life. Wind and water erosion, due to their detachment forces can transport soil components and are considered as the most important types of land degradation. In Iran, which is located in semi-arid areas with a mean annual precipitation between 200 and 400 mm, wind erosion is more important than water erosion. In these regions, soils are relatively dry for a long time during the year; consequently, the adhesion power between water and soil particles decreases and soil becomes more sensitive for transporting to off-site areas. One of the most important indices of soil erosion is soil sensitivity to erosion, the so-called soil erodibility factor, which is commonly known as the K-factor. The K-factor is related to the integrated effects of rainfall, runoff, infiltration, and wind power on soil loss [3,4]. There are several techniques to measure the K-factor including using soil physiochemical properties, rainfall simulations, wind tunnel experiments, and erosion plot experiments [5]. Since the direct measurement of the K-factor is costly, time-consuming, invasive, and method-dependent, soil erosion evaluation indices such as soil aggregate stability indices (SASIs) have been commonly used to show soil resistance against wind and water forces. SASIs are very important in soil quality assessment [6] and are used to classify soil structure [7]. These indices commonly classified in two groups: (1) wind-erosion evaluation indices such as the dry mean weight diameter of aggregates (MWDdry), dry geometric mean weight diameter of aggregates (GMDdry), dry-stable aggregates (DSA), and wind-erodible fraction (EF), and (2) water-erosion evaluation indices such as the wet mean weight diameter of aggregates (MWDwet), geometric mean weight diameter of aggregates (GMDwet), water-stable aggregates (WSA), and aggregate stability index (ASI).
Land degradation is greatly dependent on land use management [8]. Land use management for agricultural activities such as crop rotation, fertilization, drainage, and irrigation are the most important and influential support activities that affect soil structure and, consequently, aggregate stability [9,10]. There is a relationship between the stability of soil aggregates and soil erosion; the higher the stability of soil aggregates, the greater resistance to soil compaction and erosion [11]. According to previous studies, soil compaction occurs and soil porosity decreases when forest land is changed to rangeland [12], but when rangeland is converted to forest land, infiltration increases and soil erosion decreases [13]. In addition, conservation and no-tillage systems compared to conventional tillage can conserve soil organic matter, decrease soil erosion, increase soil infiltration, aggregate stability, and microbial biomass [14,15]. Some studies showed that soil aggregate stability decreased under annual crop cultivation [16], continuous tillage, and arable crop production [6,17,18]. Therefore, soil aggregates can be considered to be dynamic soil properties that tend to rapidly respond to environmental changes [19]. Recently, more attention has been paid to investigating the effects of land use changes on soil properties. Anderson et al. [20] reported that the MWDwet and WSA in coniferous forests and grasslands were significantly higher than those in croplands, including conventional-tillage and no-tillage agricultures. Furthermore, in Calcisol Leptosols, China, Tang et al. [21] reported the values of MWDdry, GMDdry, and WSA in the different land types in the following order: wood land > grassland > shrub land > bare land. Furthermore, according to Nath and Lal [22], values of WSA and MWDwet in no-tillage agricultural land were greater than those of the conventional-tillage of corn cultivation land use in the North Appalachian Region, USA.
According to abovementioned descriptions, the novel and necessary reasons for doing the present study are summarized through three important questions: (1) How can the wind- and water-erosion evaluation indices be affected by long-term management practices and land-use types (including annual cultivated field (ACF), fallow field (FF), rangeland ®, and orchard field (OF)) in calcareous soils? (2) How does soil depth treatment (0–10 and 10–20 cm) affect wind- and water-erosion evaluation indices? and (3) How can SOM content effect the wind- and water-erosion evaluation indices in calcareous soils?
Although the direct measurement of the erodibility factor (K-factor) is very useful for the prevention of soil erosion, due to the difficulties and costs of direct measurements, many researchers have employed soil erosion indices for estimating the soil resistance against water and wind forces. Hence, the present study aimed to investigate the effects of land use and soil depth on some wind- and water-erosion evaluation indices in the calcareous soils of a semiarid region in southern Iran.
2. Materials and Methods
2.1. Study Area
The study site is located in the Bajgah region (the north of the Shiraz city), Fars province, Iran. The location has a mean altitude of 1810 m above sea level and is situated at the geographic coordinates 29°44′7″ to 29°45′18″ N, and 52°32′53″ to 52°35′55″ E (Figure 1). The mean annual precipitation and evaporation potential of the study area are about 400 and 2000 mm, respectively. Soils of the study area were placed in two separate series—gravelly soil of the Kooye Asatied series (loamy-skeletal, carbonatic, mesic, and Fluventic Xerorthents) and non-gravelly soil of the Daneshkadeh series (Fine, carbonatic, mesic, and Typic Calcixerepts) [23]—and had been developed on a relatively similar calcareous (with a 38% mean value of calcium carbonate equivalent) alluvium parent materials and geological formations of Asmari, Jahrom, and Sachoon [24].
2.2. Soil Sampling and Analysis
In this study, four different long-term land-use types were selected: (1) ACF with about 20 years rotation of wheat (Triticum aestivum L.), barley (Hordeum vulgare L.), corn (Zea mays L.), and canola (Brassica napus L.); (2) FF with>10 years of no cultivation; (3) R with permanent range shrubs; and (4) OF with about 25 years planted by pear (Pirus communis L.). The mentioned land-use types are research farms and have been monitored and controlled by the Agriculture School of Shiraz University. For each land-use type, three experimental plots (with dimensions of 2 × 2 m) were randomly considered. At each plot, three points were selected and composite samples of about 2 kg were taken from two depths of 0–10 and 10–20 cm. The samples were air dried, ground, passed through 2 and 4 mm sieves, and transferred to the laboratory for further analysis. The soil particle size distribution (sand, silt, and clay contents based on USDA classification) were measured by a sedimentation method using a hydrometer [25], soluble sodium (Na+) was measured in a saturated extract using the flame photometry method [26], soluble calcium (Ca2+) and magnesium (Mg2+) were measured in a saturated extract using titration with EDTA [27], the sodium adsorption ratio (SAR) was determined by using Equation (1), and the soil organic matter (SOM) content was obtained with the loss on ignition method [28], all of which are summarized in Table 1 and Table 2.
where SAR, Na+, Ca+, and Mg+ are the sodium adsorption ratio ((meq L−1)0.5) and the soluble sodium, calcium, and magnesium (meq L−1), respectively.
2.3. Determination of Soil Erosion Indices
The soil aggregate stability and erodibility factor are two physical indicators of soil erosion [29]. Therefore, in order to understand the soil erosion condition of each land-use type, some soil erodibility and aggregate stability indicators were calculated for each. These indicators were divided into two groups: (1) soil erodibility indicators related to water erosion and (2) soil erodibility indicators related to wind erosion.
First, aggregate size distribution was determined with the dry-sieving method [30]. Using dry sieving data, the MWDdry and the GMDdry of aggregates were determined according to the following equations:
where is the mean diameter of any particular size range of particles (mm) and Wi is the weight of particles in that size range as a percentage of the total sample.
The K and wind erosion rate (ER) were calculated using MWDdry data [31] and the dominant wind velocity of the study area, which is about 9 m s−1.
where K is soil erodibility to wind erosion, ER is the wind erosion rate (g m−2 min−1), and MWDdry is the dry mean weight diameter of aggregates (mm).
Chepil [32] and Chepil and Woodruff [33] showed that aggregates larger than 0.84 mm in diameter are resistant to wind erosion. As a result, wind EF became a commonly accepted measure of soil erodibility by wind:
where EF is the wind-erodible fraction (%), W<0.84 is the weight of aggregates that are smaller than 0.84 mm in diameter (g), and Wtotal is the total weight of the soil sample (g).
The dust emission potential (DEP) of soil is considered to be the abundance of aggregates that are smaller than 0.063 mm in diameter; see Equation (7). These very fine particles can remain in suspension due to the low settling velocity of the fine particles [34].
where W<0.063 is the weight of particles that are smaller than 0.063 mm in diameter (g) and Wtotal is the total weight of the soil sample (g).
The percentage of WSA and DSA retained on sieves greater than 0.25 mm diameter were expressed as WSA > 0.25 mm and DSA > 0.25 mm indicators, respectively, as follows [35,36]:
where W>0.25mm is the weight of aggregates that are greater than 0.25 mm (g) and Wtotal is the total weight of the soil sample (g).
The ASI was determined with a wet sieving apparatus. The apparatus is designed to determine aggregate stability by comparing aggregate distribution before and after disruption. It is based on the principle that unstable aggregates will break down easier when immersed into water. Prepared and weighted air-dried samples (<2 mm sieve) were used to determine the weights of the unstable part (which collapsed in distilled water in the first run) and the stable part (which collapsed in the last run due to the dispersing of the solution). After the run, the parts were dried at 105 °C for 24 h. Then, the aggregate stability index was calculated by using the following equation:
where ASI is the aggregate stability index, Wds is the weight of aggregates dispersed in dispersing solution (g), and Wdw is the weight of aggregates dispersed in distilled water (g).
2.4. Statistical Analysis
At first, all soil properties and erodibility indicators were subjected to ANOVA tests to assess the differences between the treatments. Then, the mean values of the differences of soil properties and erodibility indicators between different land-use types and depths were compared by using one-way ANOVA followed by the least significant difference (LSD) post-hoc test (p < 0.05). In this study, the ACF was the comparison basis of different soil properties and indicators between different land-use types. Relationships and correlations between soil erodibility indicators and SOM were analyzed by a simple linear regression and correlation coefficient (r), respectively. All statistical analyses were performed in the STATISTICA software package at a 95% probability level, and the curve plotting and establishment of regression equations were done with the EXCEL and SPSS (version 23) software packages.
3. Results and Discussion
3.1. Physical and Chemical Properties of Soils under Different Land-Use Types
Table 1 gives the average of some soil physico-chemical properties for different land-use types. The mean content of particle size distribution in the ACF, FF, R, and OF land-use types were 3.9%, 8.5%, 23.3%, and 19.6% for sand; 54.6%, 57.3%, 58.1%, and 54.6% for silt; and 41.5%, 34.2%, 18.6%, and 25.8% for clay, respectively. The highest and lowest contents of clay were found in the ACF (41.5%) and R (18.6%) land-use types, respectively. In contrast to clay, the highest and lowest contents of sand were found in R (23.3%) and ACF (3.9%), respectively. There was no significant difference in silt content between all studied land-use types. The soil texture classes (based on USDA classification) in ACF, FF, R, and OF were silty clay, silty clay loam, silt loam, and silt loam, respectively (Table 1).
The mean of the soluble elements in the ACF, FF, R, and OF land-use types were 13.4, 10.5, 23.7, and 27.8 mg L−1 for sodium; 51.8, 55.5, 124, and 82.2 mg L−1 for calcium; and 50.2, 40.5, 16.8, and 51.5 mg L−1 for magnesium, respectively. Furthermore, the mean of the SAR was 0.32, 0.26, 0.53 and 0.59 (meq L−1)0.5 in the ACF, FF, R, and OF land-use types, respectively. In OF, the amount of soluble sodium was higher than for the other land-use types, which may have been due to the excessive use of manure fertilizers (especially cow manure) in the mentioned land use.
The results also revealed that the highest and lowest contents of SOM were attributed to OF at 0–10 cm of depth (5.03%) and FF at 10–20 cm of depth (2.25%), respectively. In addition, the results revealed that there were no significant differences in the mean of SOM at two studied depths of all studied land-use types. In general, SOM was high in OF due to the falling down of leaves in fall and the addition of the manure fertilizers. Additionally, SOM was relatively high in R, which has old shrubs with highly dense of roots up to a depth of 50 cm. The measured SOM ranked in descending order of OF > R > ACF > FF, which indicated that vegetation restoration was an effective factor for increasing SOM and consequently improving soil structure [37]. For OF and R, the increases in SOM were attributed to the increases of organic matter net production since the accumulation rate of sticks, leaves, and roots was significantly greater than the decomposition rate after vegetation restoration in this region [38]. Similarly, Tang et al. [21] reported that soil organic carbon content (SOC) increased after vegetation restoration, and the SOC average of the woodland was significantly greater than that in the bare land, grassland, and shrubland. As reported by Zhu et al. [39], after~15 years of restoration from abandoned cropland, a natural restoration grassland had a higher SOC than a Chinese red pine forest. Nath and Lal [22] showed that the SOC among different sites followed the trend of native forest > pastureland > no-tillage corn > conventional tillage corn.
3.2. Soil Aggregate Stability Indices under Different Land-Use Types (MWDdry, GMDdry, DSA, WSA, and ASI)
The results of the comparison of different soil aggregate stability indices between different studied land-use types and depths are shown in Figure 2. The highest mean of MWDdry (0.75 mm) was observed in OF (0–10 cm), which was significantly different from the other land use types. There was no significant difference in the mean of MWDdry in ACF, FF, and R at 0–10 cm of depth. The mean of the mentioned property was ranked in descending order as OF > FF > ACF > R at 0–10 cm. Furthermore, the results showed that the mean of MWDdry in FF and R were 16.9% and 6.9% lower than ACF at 10–20 cm of depth, respectively (though this change between ACF and R was insignificant). The land use change from ACF to OF caused a 13.9% increase of the mentioned property’s mean at 10–20 cm of depth (OF > ACF > R > FF). There was no significant difference in the MWDdry between two studied soil depths in all studied land-use types (Figure 2a). According to Lal classification [40], there is severe limitation in aggregate stability in all studied land-use types. Lal [40] stated that soils with an MWDdry between 0.5–1 and 1–2 mm have severe and moderate limitations, respectively. Despite high content of clay in ACF and FF, their low aggregate stability was probably due to the lower content of soil organic matter and high traffic of heavy agricultural implements, especially at inappropriate moisture. In R, we could declare that the low content of clay and the high livestock traffic may have been a possible reason for its low MWDdry values. Additionally, the excessive use of manure fertilizers (especially cow manure) may be a possible reason for the low aggregate stability in OF due to increasing sodium values (the mean of the SAR was equal to 0.59 (meq L−1)0.5 in OF) because sodium disperses soil particles and can destroy soil structure [41]. However, despite these reasons, a high content of SOM and a low traffic of heavy agricultural implements made OF have more stable aggregates compared to the other studied land-use types. Aggregate stability is a very important factor in soil structure and erosion intensity.
Figure 2b shows that there was no significant difference in mean GMDdry between ACF, FF, and OF at 0–10 cm of depth, but the land-use change from ACF to R resulted in a significant decrease of 35% in mean GMDdry. The mean of the mentioned property at 0–10 cm of depth was ranked as OF > FF ≈ ACF > R. Furthermore, at 10–20 cm of depth, there was no significant difference in mean GMDdry between ACF, FF, and OF, while the mean of this property in R showed a significant decrease of 33.6% from ACF at 10–20 cm of depth (ACF > OF > FF > R). The high values of the mean GMDdry in ACF at 10–20 cm of depth could have been because of tillage practices that have compacted the underneath soils. Like MWDdry, there was no significant difference in mean GMDdry between 0–10 and 10–20 cm of depth in all studied land-use types. Each index had a different evaluation purpose. These results may have been due to the presence of a lower content of SOC as a result a limited microbial activity and lower root biomass in ACF, FF, and R, which may play a major role in the formation of soil aggregates [42]. The MWDdry increases as the percentage of large aggregates retained in the sieve increases and, the GMDdry is an estimate of the size of the most frequent aggregate size classes [30]. Those indices vary according to the management practices established in soil and show whether physical conditions have been improved. Animal grazing and the removal of plant residues from the soil surface layer are the main causes of the disturbance of soil aggregates [43,44]. The protection of the land from disturbance is not only essential for soil aggregates but also important for the management of the soil ecosystem, which ultimately influences the agricultural yield [45,46,47]. The results of this study are in line with the findings of other researchers in this regard.
Soil aggregation can be increased with cropland conversion to no-tillage due to the rapid turnover of soil organic carbon in the soil layers [8]. Soil aggregate stability was supported here by constantly increasing soil organic matter up to the 10 cm of the soil layer (Table 2).
Regarding the mean DSA (>0.25 mm), there was no significant difference between ACF and the other studied land-use types at both depths (Figure 2c). Moreover, there was no significant difference in the mean DSA between two depths of any land-use types, which was in line with the results of Mahmoodabadi and Ahmadbeigi [48], who reported that the influence of soil depth on DSA > 0.25 mm was insignificant for all cultivation systems including wheat, barley, corn, alfalfa, fallow, and plowed. Extensive root systems, root exudates, and microbial activity (particularly of fungi) improve soil aggregation [8].
The results also revealed that OF (0–10 cm) exhibited the highest mean WSA (>0.25 mm), while in most cases, the differences were insignificant. In addition, similar to DSA (>0.25 mm), soil depth had no significant effect on WSA (>0.25 mm) in all studied land-use types (Figure 2d). On average, the DSA > 0.25 mm was much higher than the WSA > 0.25 mm in each land-use type and depths, which was due to the differences in disruptive forces in the dry or wet sieving procedures. In the dry sieving procedure, the mechanical force of shaking is the only dominant agent of aggregate breakdown, while, in the presence of water (wet sieving), slaking occurs due to water stress aggregates [49,50].
The results of a mean comparison between different land-use types for ASI showed a similar trend to that of WSA > 0.25 mm (Figure 2e). This was because the basis processes and disruptive forces for both indicators, including wet sieving, were similar.
Recent studies have shown that some soil quality and aggregate stability indices are changing with management and land-use types. Anderson et al. [20] reported that means of MWDwet and WSA in coniferous forests and grasslands were significantly greater than the means of those properties in croplands, including conventional-tillage and no-tillage agriculture in the lower Mississippi river valley area. Tang et al. [21] showed the importance of MWDdry, MWDwet, GMDdry, GMDwet, and WSA in the different types of land in the following order: woodland > grassland > shrub land > bare land. Delelegn et al. [51] revealed that changing the area of enclosure and eucalyptus plantation significantly improved soil organic matter and soil aggregate stability (SAS) compared with cropland in the highlands of northern Ethiopia. Similarly, Nath and Lal [22] showed that WSA and MWDwet in the no-tillage corn land-use type were greater than those in the conventional tillage corn land-use type in the North Appalachian Region, USA. According to the results of the present and other studies, land-use change has a major and important effect on soil aggregate stability, structure, and consequently on wind and water erosion.
3.3. Wind Erosion Indicators under Different Land-Use Types (EF, DEP, K, and ER)
Figure 3 shows the mean comparison between different land-use types and soil depths for different wind erosion indicators. There were no significant differences for EF values between the two soil depths of any land-use types. However, there was a significant difference in the mean EF for different land-use types at 0–10 cm of depth. EF was the highest (80.8%) in R at 0–10 cm of depth and the lowest (59.8%) in OF at 0–10 cm of depth. The mean EF in FF and R at 0–10 cm of depth were 7.9 and 10.7% higher than ACF, respectively. The EF in OF was 22.1% lower than ACF. The means of EF at 0–10 cm of depth were ranked in descending order as R > FF > ACF > OF. There was no significant difference in EF between ACF, FF, and R at 10–20 cm of depth, while EF showed a significant decrease of 23.4% in OF compared to ACF at 10–20 cm of depth. Wind EF is the percentage of aggregates that are smaller than 0.84 mm in diameter [32]. All soil samples had an EF content greater than 40%, a threshold EF value above which wind erosion reaches values above the tolerable level [52,53]. This shows that all study areas are susceptible to wind erosion and cannot generate enough wind erosion-resistant structures [54]. EF was higher than 70% in ACF, FF, and R, while it was between 50–60% in OF. This means that OF is more resistant to wind erosion, which could be due to its high content of organic matter that had improved soil structure and aggregation. In comparison with plowing, no-till management systems have more stable aggregates and soil organic carbon [55]. Angers et al. [16] showed that soil aggregate stability decreased in agricultural fields under annual crops. In this study, the mean EF in ACF was significantly lower than that of FF and R at 0–10 cm of depth. This could be attributed to three reasons: (1) more clay content in ACF than other land-use types, which ensured better structure formation; (2) the detachment and transport of fine soil particles by seasonal winds in ACF due to more numerous and continuous tillage practices and crop operations at the surface layer; and (3) in fine textured soils, large and resistant clods and aggregates are formed through the tillage of cultivated soils [53]. As tillage practices and other crop operations in OF are low, soil structure and aggregate production can be enhanced there.
The highest and lowest values of DEP were found in R at 10–20 cm of depth (14.8%) and FF and ACF at 0–10 cm of depth (4%), respectively. There was a significant difference in DEP between different land-use types at 0–10 cm of depth. The DEP in R and OF (0–10 cm) was 3.6 and 2.4 times higher than ACF, respectively. The mean values of DEP in the different types of land use were ranked as R > OF > FF ≈ ACF at 0–10 cm of depth and R > OF > FF > ACF at 10–20 cm of depth. Generally, DEP was found to be higher in the soil depth of 10–20 cm than in the surface soil. Soil depth increased the DEP in ACF, FF, R, and OF by 35%, 64.3%, 2.1%, and 41%, respectively. However, this increment was not significant in R. This could be explained by the transport of fine particles through wind erosion. Wind erosion is a very material-sorting and -removing process [56,57]. These results can explain the occurrence of wind erosion in the study area that transported the finer airborne particles of <0.063 mm to off-site area. In present study, R is located close to a hill; consequently, the height of the hill caused seasonal winds to not have contact with fine particles of surface soils to transport them to off-site areas. The results of this research also showed that rangelands in the studied area are very much prone to wind erosion due to the high amount of erodible fine particles. In a semiarid region of Argentina, Colazo and Buschiazzo [53] showed that cultivation increased EF in medium textured soils (silt and clay between 215 and 500 g kg−1) but not in sandy (silt and clay < 215 g kg−1) of fine textured soils (silt and clay > 500 g kg−1), which was in line with our findings. The studied soil samples had a fine texture, and our results are completely in line with the results of Colazo and Buschiazzo [53].
According to Equations (3) and (4), both K and soil ER were calculated from MWDdry, and their trends were found to be similar to those of MWDdry (Figure 4). There were no significant differences in K and ER at the two studied depths in any of studied land-use types. The results showed that the highest and lowest values of both K and ER were found in FF (10–20 cm) and OF (0–10 cm), respectively. There were no significant differences in K and ER between ACF, FF, and R at 0–10 cm of depth. Furthermore, those properties at 10–20 cm of depth did not show significant differences between ACF and R, while the land-use change from ACF to FF and OF at 10–20 cm of depth caused significant increments and decrements, respectively, of 31% and 26.3% for K and 23.7 and 20.5% for ER at 10–20 cm of depth. The soil erodibility factor is a quantitative description of the inherent erodibility of a particular soil. K, which is related to many soil properties, is one of the most important indicators of soil sustainability. Macroaggregates at the soil surface are resistant to wind movement [58,59]. In fact, soils containing smaller aggregates were found to be more sensitive to wind speed. Because of that, the erodibility and wind erosion rate values in OF were lower than in the other land-use types (greater aggregates in OF). Different soils have varying erodibility levels due to differences in their mechanical structure and physical and chemical properties. Wind erosion depends on soil erodibility, which is defined as the susceptibility of the soil to wind velocity and is reflected in deflation and abrasion [60]. Therefore, any agent reducing soil cohesion increases its erodibility [61]. Soil erodibility has been attributed to different parameters such as soil texture, surface roughness, and organic matter content [61,62,63].
3.4. Relationship among Soil Organic Matter, Aggregate Stability, and Erosion Indices
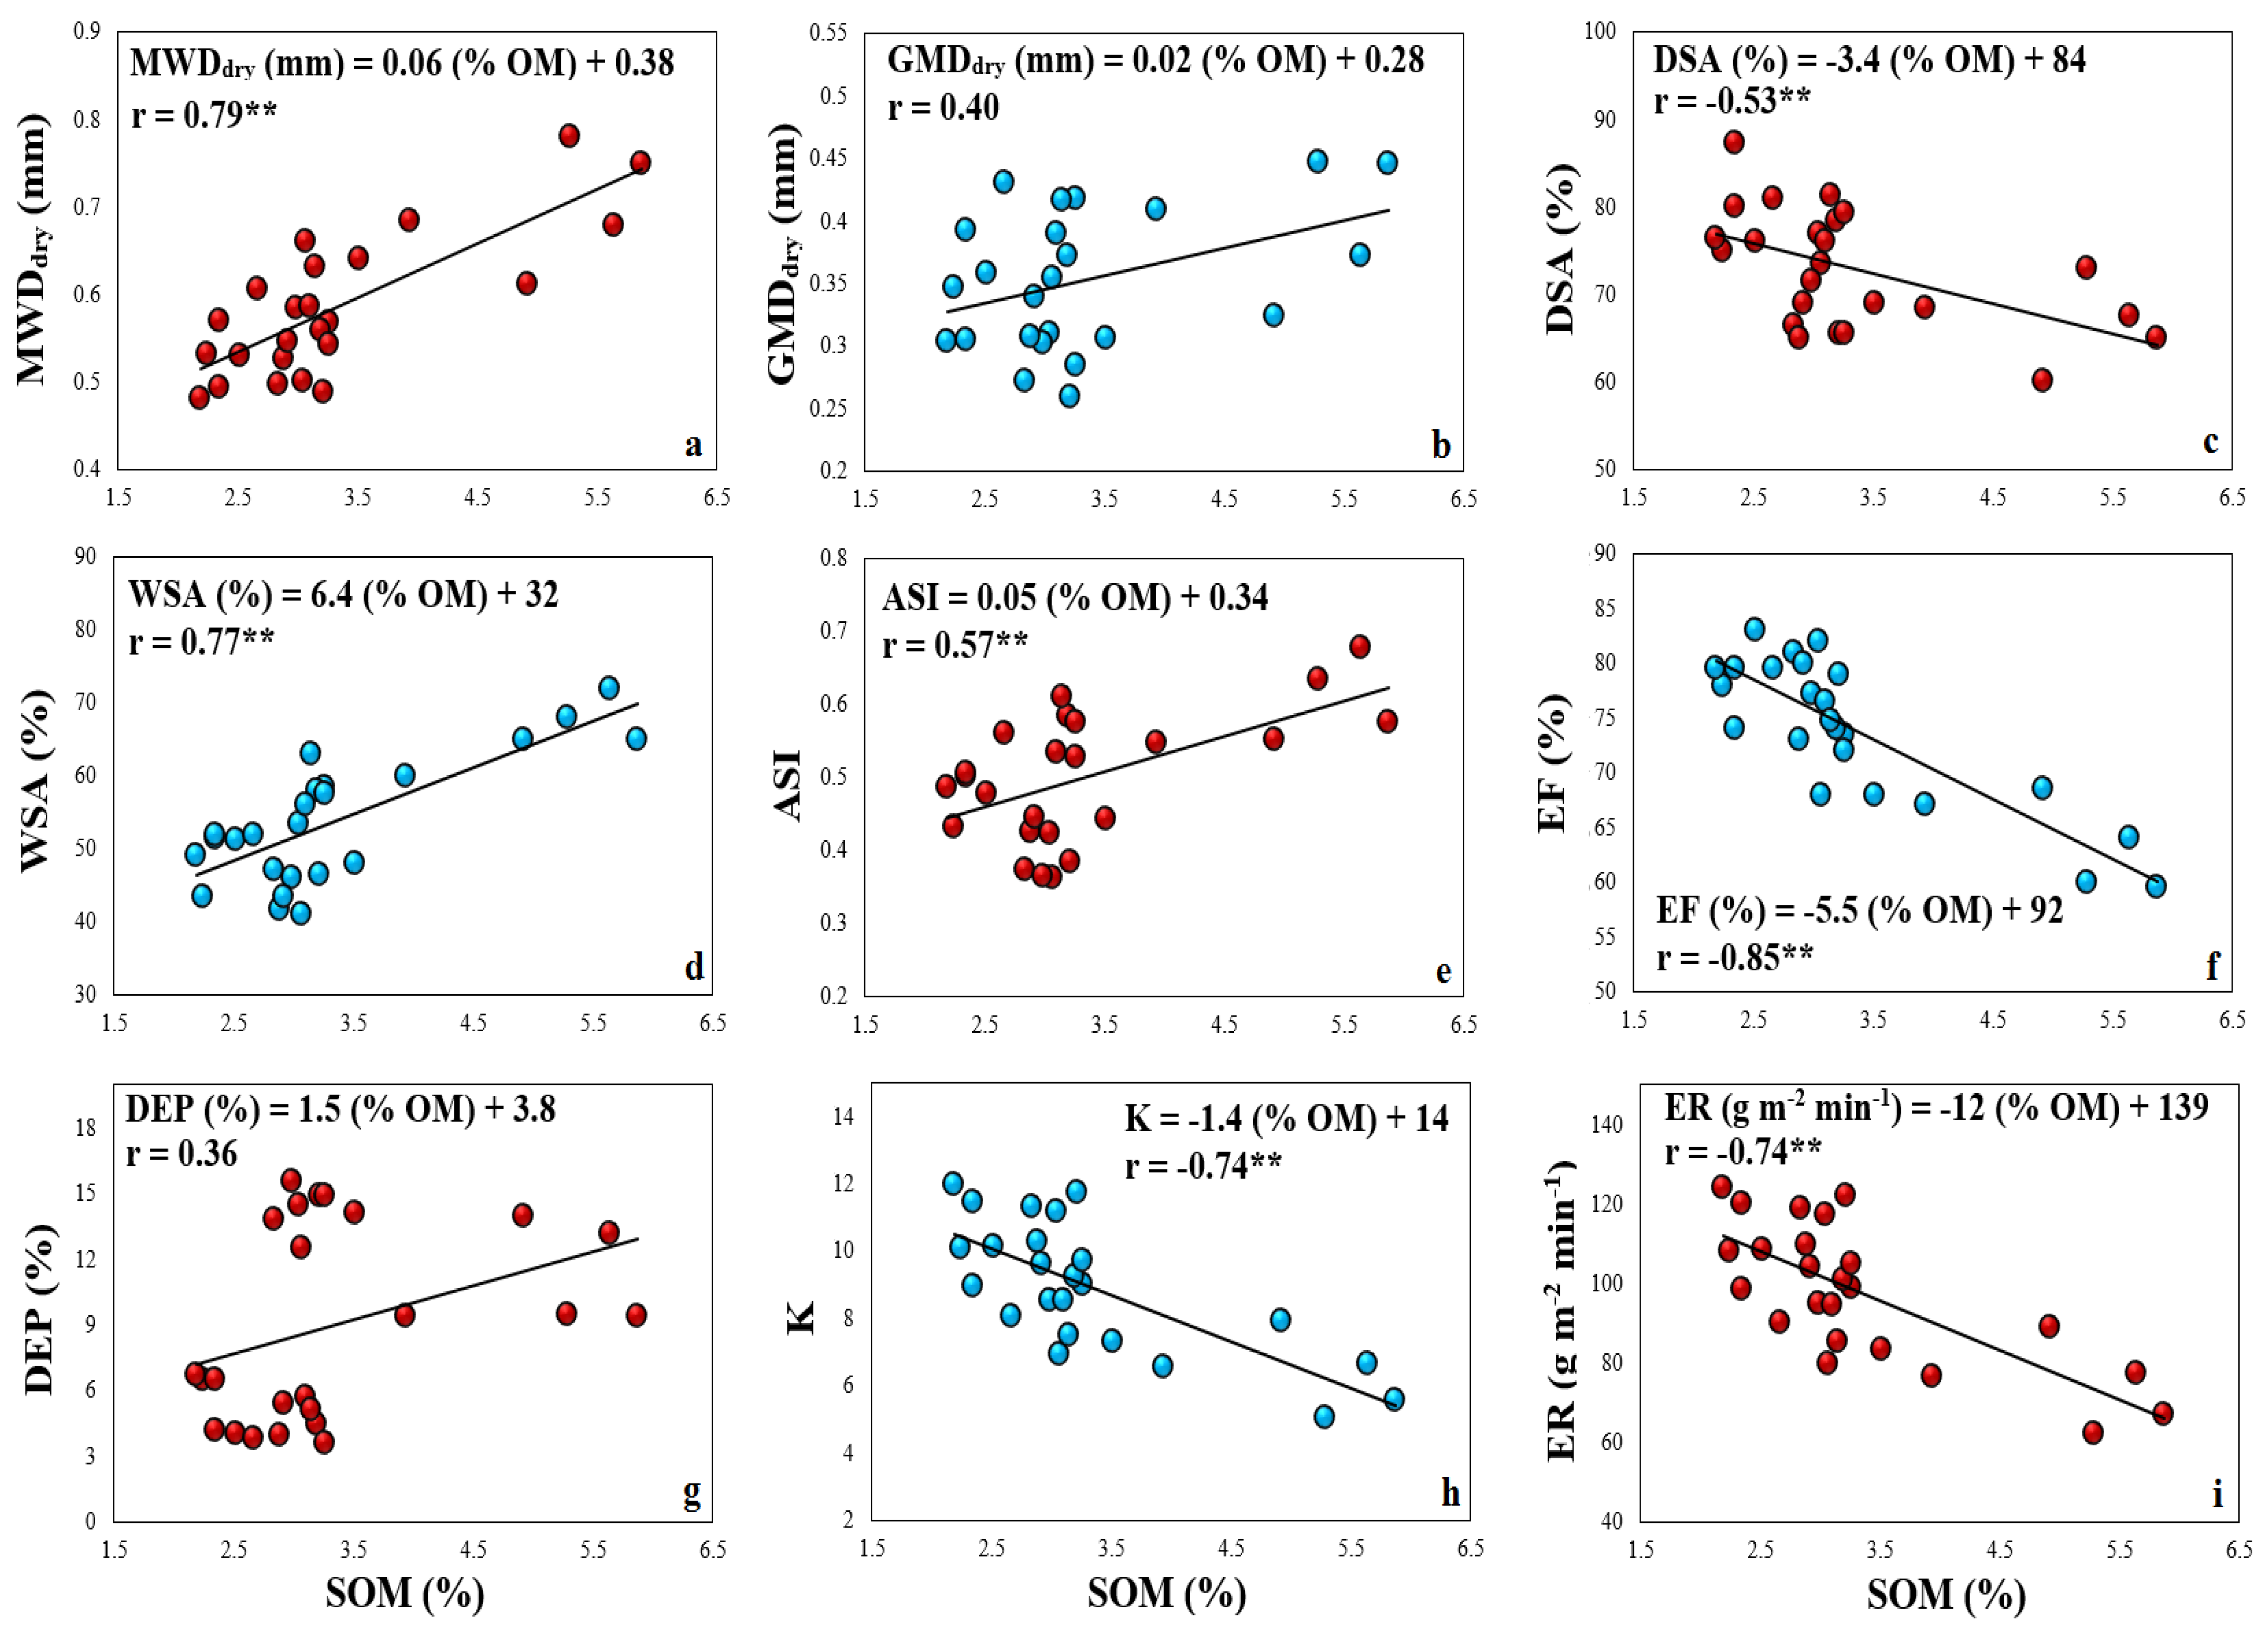
Table 3 shows the correlation coefficient (r) among the SOM, soil erosion, and aggregate stability indices. Furthermore, Figure 5 shows a linear regression between the SOM and soil erosion and aggregate stability indices in all soil samples. Correlations were determined to identify how the SOM and different indices related to each other. According to Table 3, the K and ER indices strongly correlated with SOM, MWDdry, GMDdry, WSA, and ASI (negative correlation), as well as EF (positive correlation). The MWDdry, GMDdry, WSA, and ASI represent the aggregate stability and size indices. Therefore, more coarse and stable aggregates were able to decrease wind erosion and lead to low values of K and ER. Based on the work of Chepil [32] and Chepil and Woodruff [33], high values of <0.84 mm particles resulted in more values of soil erodibility to wind erosion and wind erosion rate. Xiao et al. [64] reported that an aggregate stability index calculated based on MWD, fast wetting, slow wetting, and mechanical breakdown could replace the erodibility factor of interrill and rill erosion in the Water Erosion Prediction Project (WEPP) model. Furthermore, Yan et al. [65] revealed the WEPP model overestimated the interrill erosion rate, as well as interrill soil loss and runoff rate are strongly related to the stability index (which was concluded from MWD values) of Ultisols. In wind erosion, the process is much simpler than water erosion due to the kind of erosivity force. In addition to the energy needed from water to transport soils, water molecules caused the disintegration of the soil structure. In wind erosion, aggregates with higher stability are able to better resist the erosivity force of wind. Therefore, with increases in aggregate stability indices, the erodibility of soil decreases.
According to Figure 5, there were positive linear relationships between SOM and some indices including MWDdry, GMDdry, DEP, WSA, and ASI, with correlation coefficients (r) of 0.79, 0.4, 0.36, 0.77, and 0.57, respectively (however, the relationships between SOM and GMDdry and DEP were not statistically significant). Highly significant positive linear relationships between SOM and MWDdry, WSA, and ASI showed that organic matter content may have an important role in protecting soil against wind and water in the calcareous soils of southern Iran (Figure 5). Similarly, in a typical karst Gorge region, Tang et al. [21] reported that MWDdry–wet, GMDdry–wet, and WSA had positive relationships with the contents of SOC. Wang et al. [66] revealed that MWDwet was significantly correlated with SOC (r = 0.83). Kalhoro et al. [67] reported that SOC had negative correlations with MWDdry, GMDdry, and WSA, which was not in line with our results. In addition, our results revealed that the correlation coefficients (r) between SOM and K, ER, EF, and DSA were −0.75, −0.74, −0.85, and −0.53, respectively (Figure 5). Strong correlations between SOM and K, ER, and EF proved that with increasing organic matter soil erodibility, the wind erosion rate and wind erodible fraction decreased due to SOM helping to make larger-sized aggregates (Figure 5). The presented results were consistent with those of Colazo and Buschiazzo [53] in soils of in a semiarid environment of Argentina and of Guo et al. [68] in north China, which showed a negative relationship between SOC and EF. Liu et al. [63] showed that with increasing SOM, the values of K decreased in soils of southwest China.
In general, both the formation of macroaggregates and the accumulation of SOC appears to increase soil aggregation faster than it increases soil carbon [69,70]. This indicates the significant impact of land management on soil aggregation, including impacts of organic matter turnover and the destruction of aggregates by tillage practices.
4. Conclusions
Land degradation is greatly dependent on land use management. Since the direct measurement of the K-factor is costly, time-consuming, invasive, and method-dependent, erosion evaluation indices such as SASIs have been commonly used to show soil resistance against wind and water forces. Furthermore, there is a lack of information in the literature about the effects of long-term land use and land management (including ACF, FF, R, and OF), soil depth treatment (0–10 and 10–20 cm), and SOM on wind- and water-erosion indices, especially in calcareous soils. Therefore, the objective of present paper was to investigate the effects of land-use and depth changes on some wind- and water-erosion evaluation indices in the calcareous soils of a semiarid region in southern Iran. The results revealed that the most of the mean soil aggregate stability indicators in the surface layer treatment (0–10 cm) in OF were higher than those in ACF, FF, and R by nearly 39%, 32%, and 47% for MWDdry; 10%, 10%, and 48% for GMDdry; 21%, 17%, and 15% for WSA; and 11%, 16%, and 31% for ASI, respectively. Furthermore, the mean soil wind-erosion indicators in OF (0–10 cm) were lower than ACF, FF, and R by nearly 18%, 24%, and 26% for EF; 43%, 38%, and 49% for K; and 36%, 32%, and 41% for ER, respectively. In general, a high content of SOM and low machinery/livestock traffic in OF caused aggregates to be larger and more stable than in the other studied land-use types. In ACF, despite the high clay content, some aggregate stability indicators such as MWDdry and WSA were the lowest among the studied land-use types that showed the negative effects of conventional tillage practices. Depth factor only had a significant effect on DEP in ACF, FF, and OF. This property was the highest in R at 10–20 cm of depth due to its location (R is close to an elevated hill). Furthermore, the results revealed that there were positive correlations between SOM and some indices including MWDdry, GMDdry, DEP, WSA, and ASI, with correlation coefficients (r) equal to 0.79, 0.4, 0.36, 0.77, and 0.57, respectively, and negative correlations with K, ER, EF, and DSA, with r equal to −0.75, −0.74, −0.85, and −0.53, respectively. Strong correlations between SOM and values of MWDdry, K, ER, EF, WSA, and ASI proved that with the increasing content of soil organic matter, the size of the aggregates became greater. Some recommendations for farmers to prevent their field to be eroded by wind and water erosion include (1) to substitute conventional tillage systems with no-tillage and minimum tillage practices, (2) to preserve soil organic matter on the soil surface layer, and (3) to decrease the machinery/livestock traffic as much as possible.
Author Contributions
Conceptualization, H.M., Y.O., and M.R.; methodology, H.M., and Y.O.; software, H.M. and Y.O.; formal analysis, H.M.; investigation, H.M., and Y.O.; resources, H.M.; data curation, H.M.; writing—original draft preparation, H.M.; writing—review and editing, H.M., M.R., and Y.O.; supervision, M.R., and Y.O.; project administration, H.M. All authors have read and agreed to the published version of the manuscript.
Funding
This research was funded by Dr. Mahrooz Rezaei from Shiraz University, Iran.
Institutional Review Board Statement
Not applicable.
Informed Consent Statement
Not applicable.
Data Availability Statement
Not applicable.
Acknowledgments
We would like to thank the reviewers for their constructive comments and suggestions.
Conflicts of Interest
The authors declare no conflict of interest.
References
- Doran, J.W.; Sarrantonio, M.; Liebig, M.A. Soil health and sustainability. Adv. Agron. 1996, 56, 1–54. [Google Scholar]
- Ostovari, Y.; Ghorbani-Dashtaki, S.; Bahrami, H.A.; Naderi, M.; Dematte, A.M.; Kerry, R. Modification of the USLE K factor for soil erodibility assessment on calcareous soils in Iran. Geomorphology 2016, 273, 385–395. [Google Scholar] [CrossRef]
- Auerswald, K.; Fiener, P.; Martin, W.; Elhaus, D. Use and misuse of the K-factor equation in soil erosion modeling: An alternative equation for determining USLE nomograph soil erodibility values. Catena 2014, 118, 220–225. [Google Scholar] [CrossRef]
- Ostovari, Y.; Ghorbani-Dashtaki, S.; Bahrami, H.A.; Abbasi, M.; Dematte, A.M.; Arthurd, E.; Panagos, P. Towards prediction of soil erodibility, SOM and CaCO3 using laboratory Vis-NIR spectra: A case study in a semi-arid region of Iran. Geoderma 2018, 314, 102–112. [Google Scholar] [CrossRef]
- Shabani, F.; Kumar, L.; Esmaeili, A. Improvement to the prediction of the USLE Kfactor. Geomorphology 2014, 204, 229–234. [Google Scholar] [CrossRef]
- Kavdir, V.; Ozcan, H.; Yigini, Y. The influence of clay content, organic carbon and land use types on soil aggregates stability and tensile strength. Turk. J. Agric. For. 2004, 28, 155–162. [Google Scholar]
- Six, J.; Elliott, E.T.; Paustian, K. Soil structure and soil organic matter II. A normalized stability index and the effect of mineralogy. Soil Sci. Soc. Am. J. 2000, 64, 1042–1049. [Google Scholar] [CrossRef]
- Bronick, C.J.; Lal, R. Soil structure and management: A review. Geoderma 2005, 124, 3–22. [Google Scholar] [CrossRef]
- Ashagrie, Y.; Zech, W.; Guggenberger, G.; Mamo, T. Soil aggregation, and total and particulate organic matter following conversion of native forests to continuous cultivation in Ethiopia. Soil Till. Res. 2007, 94, 101–108. [Google Scholar] [CrossRef]
- Lehrsch, G.A.; Sojka, R.E.; Koehn, A.C. Surfactant effects on soil aggregate tensile strength. Geoderma 2012, 189–190, 199–206. [Google Scholar] [CrossRef] [Green Version]
- Beare, M.H.; Bruce, R.R. A comparison of methods for measuring water-stable aggregates: Implications for determining environmental effects on soil structure. Geoderma 1993, 56, 87–104. [Google Scholar] [CrossRef]
- Deuchare, S.A.; Towend, J.; Aitkenhead, M.J.; Fitzpatric, F.A. Changes in soil structure and hydraulic properties in regenerating rainforest. Soil Use Manag. 1999, 15, 183–187. [Google Scholar] [CrossRef]
- Carter, M.R.; Gregorich, F.G.; Angers, D.A. Organic carbon and nitrogen storage and organic carbon fraction, in adjacent cultivated and forested soils of eastern Canada. Soil Till. Res. 1998, 47, 253–261. [Google Scholar] [CrossRef]
- Reeves, D.W. The role of organic matter in maintaining soil quality in continuous cropping systems. Soil Till. Res. 1997, 43, 121–167. [Google Scholar] [CrossRef]
- Archad, M.A.; Franzluebbers, A.J.; Azooz, R.H. Components of surface soil structure under conventional and non-tillage in northwestern Canada. Soil Till. Res. 1999, 53, 41–47. [Google Scholar]
- Angers, D.A.; Edward, L.M.; Sanderson, J.B.; Bissonnette, N. Soil organic matter quality and aggregate stability under eight potato cropping sequences in a fine sandy loam of Prince Edward Island. Can. J. Soil Sci. 1999, 79, 411–417. [Google Scholar] [CrossRef]
- Mbagwu, J.S.C.; Piccolo, A.; Mbila, M.O. Water stability of aggregates of some tropical soils treated with humic substances. Pedologei 1993, 2, 269–284. [Google Scholar]
- Eynard, A.; Schumacher, T.E.; Lindstorm, M.J.; Malo, D.D. Aggregates size and stability in cultivated south Dakorta prairie Ustolls and Usterts. Soil Sci. Soc. Am. J. 2004, 68, 1360–1365. [Google Scholar] [CrossRef]
- Coote, D.R.; Malcolm-Mcgovern, C.A.; Wall, G.J.; Dickinson, W.T.; Rudra, R.P. Seasonal variation of erodibility indices based on shear strength and aggregate stability in some Ontario soils. Can. J. Soil Sci. 1988, 68, 405–416. [Google Scholar] [CrossRef]
- Anderson, R.; Brye, K.R.; Wood, L.S. Soil aggregate stability as affected by landuse and soil properties in the lower mississippi river valley. Soil Sci. Soc. Am. J. 2019, 83, 1512–1513. [Google Scholar] [CrossRef]
- Tang, F.K.; Cui, M.; Lu, Q.; Liu, Y.G.; Guo, H.Y.; Zhou, J.X. Effects of vegetation restoration on the aggregate stability and distribution of aggregate-associated organic carbon in a typical karst gorge region. Solid Earth 2016, 7, 141–151. [Google Scholar] [CrossRef] [Green Version]
- Nath, A.J.; Lal, R. Effects of tillage practices and land use management on soil aggregates and soil organic carbon in the North Appalachian Region, USA. Pedosphere 2017, 27, 172–176. [Google Scholar] [CrossRef]
- Moosavi, A.A.; Sepaskhah, A.R. Sorptive number prediction of highly calcareous soils at different applied tensions using regression models. Plant Know. J. 2013, 2, 62–68. [Google Scholar]
- Soil Survey Staff. Keys to Soil Taxonomy, 12th ed.; USDA-Natural Resources Conservation Service: Washington, DC, USA, 2014. [Google Scholar]
- Gee, G.W.; Bauder, J.W. Particle size analysis, hydrometer methods. In Methods of Soil Analysis: Part 1, Physical and Mineralogical Methods; Klute, A., Ed.; American Society of Agronomy and Soil Science Society of America: Madison, WI, USA, 1986; pp. 383–411. [Google Scholar]
- Helmke, P.; Sparks, D.L. Lithium, sodium, potassium, rubidium, and cesium. In Methods of Soil Analysis: Part 3, 3rd ed, ChemicalMethods; Sparks, D.L., Page, A.L., Helmke, P.A., Loeppert, R.H., Soltanpour, P.N., Tabatabai, M.A., Johnston, C.T., Sumner, M.E., Eds.; American Society of Agronomy and Soil Science Society of America: Madison, WI, USA, 1996; pp. 551–574. [Google Scholar]
- Richards, L.A. Diagnosis and Improvement of Saline and Alkali Soils. In U.S. Salinity Labroratory Staff, USDA Hand Book NO. 60; Richards, L.A., Ed.; U.S. Government Printing Office: Washangton, DC, USA, 1954; p. 160. [Google Scholar]
- Salehi, M.H.; Hashemi Beni, O.; Beigi Harchegani, H.; Esfandiarpour Borujeni, I.; Motaghian, H.R. Refining soil organic matter determination by loss-on-ignition. Pedosphere 2011, 21, 473–482. [Google Scholar] [CrossRef]
- Nciizah, A.D.; Wakindiki, I.C.I. Rainfall pattern effects on crusting, infiltration and erodibility in some South African soils with various texture and mineralogy. Water SA 2014, 40, 57–63. [Google Scholar] [CrossRef] [Green Version]
- Kemper, W.D.; Rosenau, R.C. Aggregate stability and size distribution. In Methods of Soil Analysis: Part 1, Physical and Mineralogical Methods; Klute, A., Ed.; American Society of Agronomy and Soil Science Society of America: Madison, WI, USA, 1986; pp. 425–442. [Google Scholar]
- Zamani, S.; Mahmoodabadi, M. Effect of particle-size distribution on wind erosion rate and soil erodibility. Arch. Agron. Soil Sci. 2013, 59, 1743–1753. [Google Scholar] [CrossRef]
- Chepil, W.S. Properties of soil which influence wind erosion: II dry aggregate structure as an index of erodibility. Soil Sci. 1950, 69, 403–414. [Google Scholar] [CrossRef]
- Chepil, W.S.; Woodruff, N.P. Estimations of wind erodibility of field surfaces. J. Soil Water Conserv. 1954, 9, 257–265. [Google Scholar]
- Swet, N.; Katra, I. Reduction in soil aggregation in response to dust emission processes. Geomorphology 2016, 268, 177–183. [Google Scholar] [CrossRef]
- Puget, P.; Chenu, C.; Balesdent, J. Dynamics of soil organic matter associated with particle-size fractions of water-stable aggregates. Eur. J. Soil Sci. 2000, 51, 595–605. [Google Scholar] [CrossRef]
- Six, J.; Guggenberger, G.; Paustian, K.; Haumaier, L.; Elliott, E.T.; Zech, W. Sources and composition of soil organic matter fractions between and within soil aggregates. Eur. J. Soil Sci. 2001, 52, 607–618. [Google Scholar] [CrossRef]
- Li, Y.Y.; Shao, M.A. Change of soil physical properties under long-term natural vegetation restoration in the Loess Plateau of China. J. Arid Environ. 2006, 64, 77–96. [Google Scholar] [CrossRef]
- Sun, L.; Zhang, G.H.; Luan, L.L.; Liu, F. Temporal variation in soil resistance to flowing water erosion for soil incorporated with plant litters in the Loess Plateau of China. Catena 2016, 145, 239–245. [Google Scholar] [CrossRef]
- Zhu, G.; Shangguana, Z.; Deng, L. Soil aggregate stability and aggregate-associated carbon and nitrogen in natural restoration grassland and Chinese red pine plantation on the Loess Plateau. Catena 2017, 149, 253–260. [Google Scholar] [CrossRef]
- Lal, R. Methods and Guidelines for Assessing Sustainable Use of Soil and Water Resources in the Tropics: SCS Technical Monograph. No. 21; Soil Management Support Services: Washington, DC, USA, 1994; p. 78. [Google Scholar]
- Tajik, F.; Rahimi, H.; Pazira, E. Effects of electrical conductivity and sodium adsorption ratio of water on aggregate stability in soils with different organic matter content. J. Agric. Sci. Technol. 2003, 5, 67–75. [Google Scholar]
- Emadi, M.; Baghernejad, M.; Memarian, H.R. Effect of land-use change on soil fertility characteristics within water-stable aggregates of twocultivated soils in northern Iran. Land Use Policy 2009, 26, 452–457. [Google Scholar] [CrossRef]
- Chirinda, N.; Olesen, J.E.; Porter, J.R.; Schjønning, P. Soil properties, crop production and greenhouse gas emissions from organic and inorganic fertilizer-based arable cropping systems. Agric. Ecosyst. Environ. 2010, 139, 584–594. [Google Scholar] [CrossRef]
- Mukherjee, A.; Lal, R. Tillage effects on quality of organic and mineral soils under on-farm conditions in Ohio. Environ. Earth Sci. 2015, 74, 1815–1822. [Google Scholar] [CrossRef]
- Reynolds, W.D.; Drury, C.F.; Tan, C.S.; Fox, C.A.; Yang, X.M. Use of indicators and pore volume-function characteristics to quantify soil physical quality. Geoderma 2009, 152, 252–263. [Google Scholar] [CrossRef]
- Le, G.C.; Angers, D.A.; Maron, P.A.; Leterme, P.; Menasseriaubry, S. Linking microbial community to soil water-stable aggregation during crop residue decomposition. Soil Biol. Biochem. 2012, 50, 126–133. [Google Scholar]
- Zhang, P.; Wei, T.; Jia, Z.; Han, Q.; Ren, X. Soil aggregate and crop yield changes with different rates of straw incorporation in semiarid areas of northwest China. Geoderma 2014, 230–231, 41–49. [Google Scholar] [CrossRef]
- Mahmoodabadi, M.; Ahmadbeigi, B. Dry and water-stable aggregates in different cultivation systems of arid region soils. Arab. J. Geosci. 2013, 6, 2997–3002. [Google Scholar] [CrossRef]
- Kavdir, Y.; Killi, D. Influence of olive oil solid waste application on soil pH, electrical conductivity, soil nitrogen transformations, carbon content and aggregate stability. Bioresour. Technol. 2008, 99, 2326–2332. [Google Scholar] [CrossRef] [PubMed]
- Opara, C.C. Soil microaggregates stability under different land use types in southeastern Nigeria. Catena 2009, 79, 103–112. [Google Scholar] [CrossRef]
- Delelegn, Y.T.; Purahong, W.; Blazevic, A.; Yitaferu, B.; Wubet, T.; Göransson, H.; Godbold, D.L. Changes in land use alter soil quality and aggregate stability in the highlands of northern Ethiopia. Sci. Rep. 2017, 7, 13602. [Google Scholar] [CrossRef] [PubMed] [Green Version]
- Woodruff, N.P.; Siddoway, F.H. A wind erosion equation. Soil Sci. Soc. Am. J. 1965, 29, 602–608. [Google Scholar] [CrossRef]
- Colazo, J.C.; Buschiazzo, D.E. Soil dry aggregate stability and wind erodible fraction in a semiarid environment of Argentina. Geoderma 2010, 159, 228–236. [Google Scholar] [CrossRef]
- Tatarko, J. Soil aggregation and wind erosion: Processes and measurements. Ann. Arid Zone 2001, 40, 251–263. [Google Scholar]
- Karunatilake, U.P.; Van Es, H.M. Rainfall and tillage effects on soil structure after alfalfa conversion to corn on a clay loam soil in New York. Soil Till. Res. 2002, 67, 135–146. [Google Scholar] [CrossRef]
- Nerger, R.; Funk, R.; Cordsen, E.; Fohrer, N. Application of a modeling approach to designate soil and soil organic carbon loss to wind erosion on long-term monitoring sites (BDF) in Northern Germany. Aeolian Res. 2017, 25, 135–147. [Google Scholar] [CrossRef] [Green Version]
- Rezaei, M.; Riksen, M.J.P.M.; Sirjani, E.; Sameni, A.; Geissen, V. Wind erosion as a driver for transport of light density microplastics. Sci. Total Environ. 2019, 669, 273–281. [Google Scholar] [CrossRef]
- Mackinnon, D.J.; Clow, G.D.; Tigges, R.K.; Reynolds, R.L.; Chavez, P.S. Comparison of aerodynamically and model derived roughness lengths (Z0) over diverse surfaces, central Mojave Desert, California, USA. Geomorphology 2004, 63, 103–113. [Google Scholar] [CrossRef]
- Zhang, C.; Zou, X.; Gong, J.; Liu, L.; Liu, Y. Aerodynamic roughness of cultivated soil and its influences on soil erosion by wind in a wind tunnel. Soil Till. Res. 2004, 75, 53–59. [Google Scholar] [CrossRef]
- Liu, L.Y.; Li, X.Y.; Shi, P.J.; Gao, S.Y.; Wang, J.H.; Ta, W.Q.; Song, Y.; Liu, M.X.; Wang, Z.; Xia, B.L. Wind erodibility of major soils in the farming-pastoral ecotone of China. J. Arid Environ. 2007, 68, 611–623. [Google Scholar] [CrossRef]
- Presley, D.; Tatarko, J. Principles of Wind Erosion and Its Control; Kansas State University: Manhattan, KS, USA, 2009; Available online: http://www.weru.ksu.edu (accessed on 18 August 2011).
- Visser, S.M.; Strek, G.; Ribolzi, O. Techniques for simultaneous quantification of wind and water erosion in semi-arid regions. J. Arid Environ. 2004, 59, 699–717. [Google Scholar] [CrossRef]
- Liu, M.; Han, G.; Zhang, Q. Effects of soil aggregate stability on soil organic carbon and nitrogen under land use change in an erodible region in southwest China. Int. J. Environ. Res. Pub. Health 2019, 16, 3809. [Google Scholar] [CrossRef] [Green Version]
- Xiao, H.; Liu, G.; Liu, P.; Zheng, F.; Zhang, J.; Hu, F. Developing equations to explore relationships between aggregate stability and erodibility in Ultisols of subtropical China. Catena 2017, 157, 279–285. [Google Scholar] [CrossRef]
- Yan, F.L.; Shi, Z.H.; Li, Z.X.; Cai, C.F. Estimating interrill soil erosion from aggregate stability of Ultisols in subtropical China. Soil Till. Res. 2008, 100, 34–41. [Google Scholar] [CrossRef]
- Wang, H.; Zhang, G.; Li, N.; Zhang, B.; Yang, H. Variation in soil erodibility under five typical land uses in a small watershed on the Loess Plateau, China. Catena 2019, 174, 24–35. [Google Scholar] [CrossRef]
- Kalhoro, S.A.; Xu, X.; Chen, W.; Hua, R.; Raza, S.; Ding, K. Effects of different land-use systems on soil aggregates: A case study of the Loess Plateau (Northern China). Sustainability 2017, 9, 1349. [Google Scholar] [CrossRef] [Green Version]
- Guo, Z.; Chang, C.; Wang, R.; Li, J. Comparison of different methods to determine wind-erodible fraction of soil with rock fragments under different tillage/management. Soil Till. Res. 2017, 168, 42–49. [Google Scholar] [CrossRef]
- Hontoria, C.; Gomez-Paccard, C.; Mariscal-Sancho, I.; Benito, M.; Perez, J.; Espejo, R. Aggregate size distribution and associated organic C and N under different tillage systems and Ca-amendment in a degraded Ultisol. Soil Till. Res. 2016, 160, 42–52. [Google Scholar] [CrossRef]
- Morvan, X.; Verbeke, L.; Laratte, S.; Schneider, A.R. Impact of recent conversion to organic farming on physical properties and their consequences on runoff, erosion and crusting in a silty soil. Catena 2018, 165, 398–407. [Google Scholar] [CrossRef]
Figure 1.
Geographical map of study area and sampling sites.

Figure 2.
Mean comparison of MWDdry (a), GMDdry (b), DSA (c), WSA (d), and ASI (e) indices in studied land-use types and soil depths. Vertical bars represent standard deviations of the means. Values followed by different letters are significantly different (p < 0.05).
Figure 2.
Mean comparison of MWDdry (a), GMDdry (b), DSA (c), WSA (d), and ASI (e) indices in studied land-use types and soil depths. Vertical bars represent standard deviations of the means. Values followed by different letters are significantly different (p < 0.05).

Figure 3.
Mean comparison of (EF) (a) and (DEP) (b) indices in each land-use type and soil depth. Vertical bars represent standard deviations of the means. Values followed by different letters are significantly different (p < 0.05).
Figure 3.
Mean comparison of (EF) (a) and (DEP) (b) indices in each land-use type and soil depth. Vertical bars represent standard deviations of the means. Values followed by different letters are significantly different (p < 0.05).

Figure 4.
Mean comparison of K (a) and ER (b) indices in each land use and soil depth. Vertical bars represent standard deviations of the means. Values followed by different letters are significantly different (p < 0.05).
Figure 4.
Mean comparison of K (a) and ER (b) indices in each land use and soil depth. Vertical bars represent standard deviations of the means. Values followed by different letters are significantly different (p < 0.05).

Figure 5.
Relationship and correlation between SOM and MWDdry (a), GMDdry (b), DSA (c), WSA (d), ASI (e), EF (f), DEP (g), K (h), and ER (i). r shows correlation coefficient. * and ** are significant p < 0.05 and p < 0.01 correlations between variables, respectively.
Figure 5.
Relationship and correlation between SOM and MWDdry (a), GMDdry (b), DSA (c), WSA (d), ASI (e), EF (f), DEP (g), K (h), and ER (i). r shows correlation coefficient. * and ** are significant p < 0.05 and p < 0.01 correlations between variables, respectively.


Table 1.
Mean of some soil physico-chemical properties in different studied land-use types.
| Property † | Annual Cultivated Field (ACF) | Fallow Field (FF) | Rangeland (R) | Orchard Field(OF) |
|---|---|---|---|---|
| Sand (%) | 3.9 | 8.5 | 23.3 | 19.6 |
| Silt (%) | 54.6 | 57.3 | 58.1 | 54.6 |
| Clay (%) | 41.5 | 34.2 | 18.6 | 25.8 |
| Texture class | Silty clay | Silty clay loam | Silt loam | Silt loam |
| Na+ (mg L−1) | 13.4 | 10.5 | 23.7 | 27.8 |
| Ca2+ (mg L−1) | 51.8 | 55.5 | 124 | 82.2 |
| Mg2+ (mg L−1) | 50.2 | 40.5 | 16.8 | 51.5 |
| SAR ((meq L−1)0.5) | 0.32 | 0.26 | 0.53 | 0.59 |
| CCE(%) | 32.7 | 37.6 | 40.7 | 43.6 |
†: Sand: sand content; Silt: silt content; Clay: clay content; Texture class: soil texture class based on USDA classification; Na+: soluble sodium; Ca2+: soluble calcium; Mg2+: soluble magnesium; SAR: sodium adsorption ratio; CCE: calcium carbonate equivalent.
Table 2.
Soil organic matter, aggregate stability, and erosion indices of different land-use types at two depths.
Table 2.
Soil organic matter, aggregate stability, and erosion indices of different land-use types at two depths.
| Property †/Index | Land Use | |||||||
|---|---|---|---|---|---|---|---|---|
| Annual Cultivated Field (ACF) | Fallow Field (FF) | Rangeland (R) | Orchard Field (OF) | |||||
| 0–10 cm | 10–20 cm | 0–10 cm | 10–20 cm | 0–10 cm | 10–20 cm | 0–10 cm | 10–20 cm | |
| SOM (%) | 3.11 bc †† | 3.05 bc | 2.51 c | 2.25 c | 3.72 ab | 3.02 bc | 5.03 a | 4.07 ab |
| MWDdry (mm) | 0.54 bc | 0.59 b | 0.57 bc | 0.50 c | 0.51 c | 0.55 bc | 0.75 a | 0.67 ab |
| GMDdry (mm) | 0.39 a | 0.38 a | 0.39 a | 0.32 ab | 0.29 b | 0.29 b | 0.43 a | 0.34 ab |
| DSA (%) | 74.3 ab | 75.4 ab | 81.4 a | 77.2 ab | 67.5 b | 67.8 b | 74.2 ab | 70.0 ab |
| WSA (%) | 52.4 a | 54.2 a | 53.9 a | 48.2 a | 55.0 a | 50.5 a | 63.3 a | 53.7 a |
| ASI | 0.53 a | 0.53 a | 0.51 a | 0.48 a | 0.45 a | 0.42 a | 0.59 a | 0.49 a |
| EF (%) | 73.0 b | 77.1 ab | 78.8 a | 79.0 a | 80.8 a | 77.3 ab | 59.8 c | 62.5 c |
| DEP (%) | 4.00 f | 5.40 e | 4.00 f | 6.57 d | 14.5 a | 14.8 a | 9.43 c | 13.3 b |
| K | 9.75 ab | 8.55 b | 9.06 ab | 11.2 a | 10.9 a | 9.64 ab | 5.60 c | 6.77 bc |
| ER (g m−2 min−1) | 105 ab | 94.6 b | 99.1 ab | 117 a | 115 a | 104 ab | 67.4 c | 78.5 bc |
†: SOM: soil organic matter; MWDdry: dry mean weight diameter of aggregates; GMDdry: dry geometric mean weight diameter of aggregates; K: soil erodibility to wind erosion; ER: wind erosion rate; EF: wind-erodible fraction; DEP: dust emission potential; DSA: dry-stable aggregates; WSA: water-stable aggregates; ASI: aggregate stability index. ††: Values followed by different letters are significantly different (p < 0.05).
Table 3.
Correlation coefficient (r) among studied soil organic matter, aggregate stability, and erosion indices (n = 24).
Table 3.
Correlation coefficient (r) among studied soil organic matter, aggregate stability, and erosion indices (n = 24).
| SOM | MWDdry | GMDdry | DSA | WSA | ASI | EF | DEP | K | ER | |
|---|---|---|---|---|---|---|---|---|---|---|
| SOM † | 1.00 | |||||||||
| MWDdry | 0.79 ** | 1.00 | ||||||||
| GMDdry | 0.40 | 0.68 ** | 1.00 | |||||||
| DSA | −0.53 ** | −0.19 | 0.38 | 1.00 | ||||||
| WSA | 0.77 ** | 0.60 ** | 0.55 ** | −0.08 | 1.00 | |||||
| ASI | 0.57 ** | 0.54 ** | 0.70 ** | 0.16 | 0.89 ** | 1.00 | ||||
| EF | −0.85 ** | −0.88 ** | −0.51 * | 0.35 | −0.60 ** | −0.52 ** | 1.00 | |||
| DEP | 0.36 | 0.14 | −0.52 ** | −0.61 ** | 0.07 | −0.32 | −0.20 | 1.00 | ||
| K | −0.74 ** | −0.98 ** | −0.69 ** | 0.16 | −0.58 ** | −0.53 ** | 0.85 ** | −0.11 | 1.00 | |
| ER | −0.74 ** | −0.98 ** | −0.69 ** | 0.17 | −0.58 ** | −0.54 ** | 0.86 ** | −0.11 | 1.00 ** | 1.00 |
†: SOM: soil organic matter (%); MWDdry: dry mean weight diameter of aggregates (mm); GMDdry: dry geometric mean weight diameter of aggregates (mm); K: soil erodibility to wind erosion; ER: wind erosion rate (g m−2 min−1); EF: wind-erodible fraction (%); DEP: dust emission potential (%); DSA: dry-stable aggregates (%); WSA: water-stable aggregates (%); ASI: aggregate stability index. Superscripts * and ** represent significantly in p < 0.05 and p < 0.01 levels, respectively.
Publisher’s Note: MDPI stays neutral with regard to jurisdictional claims in published maps and institutional affiliations. |
© 2021 by the authors. Licensee MDPI, Basel, Switzerland. This article is an open access article distributed under the terms and conditions of the Creative Commons Attribution (CC BY) license (https://creativecommons.org/licenses/by/4.0/).
Share and Cite
MDPI and ACS Style
Mozaffari, H.; Rezaei, M.; Ostovari, Y. Soil Sensitivity to Wind and Water Erosion as Affected by Land Use in Southern Iran. Earth 2021, 2, 287-302. https://0-doi-org.brum.beds.ac.uk/10.3390/earth2020017
AMA Style
Mozaffari H, Rezaei M, Ostovari Y. Soil Sensitivity to Wind and Water Erosion as Affected by Land Use in Southern Iran. Earth. 2021; 2(2):287-302. https://0-doi-org.brum.beds.ac.uk/10.3390/earth2020017
Chicago/Turabian StyleMozaffari, Hasan, Mahrooz Rezaei, and Yaser Ostovari. 2021. "Soil Sensitivity to Wind and Water Erosion as Affected by Land Use in Southern Iran" Earth 2, no. 2: 287-302. https://0-doi-org.brum.beds.ac.uk/10.3390/earth2020017