
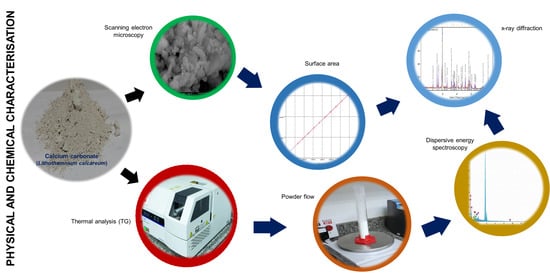
Characterisation and Traceability of Calcium Carbonate from the Seaweed Lithothamnium calcareum

 ,
,  , and
, and
Abstract
:
1. Introduction
2. Results and Discussion
3. Materials and Methods
3.1. Samples
3.2. Assessment of Powder Flow
- dap = apparent density (g/cm3);
- Mi = initial mass (g);
- Vi = initial volume (cm3);
- dcp = compacted density (g/cm3);
- Vf = final volume (cm3).
- CI = Carr index;
- HR = Hausner ratio;
- dcp = compacted density;
- dap = apparent density.
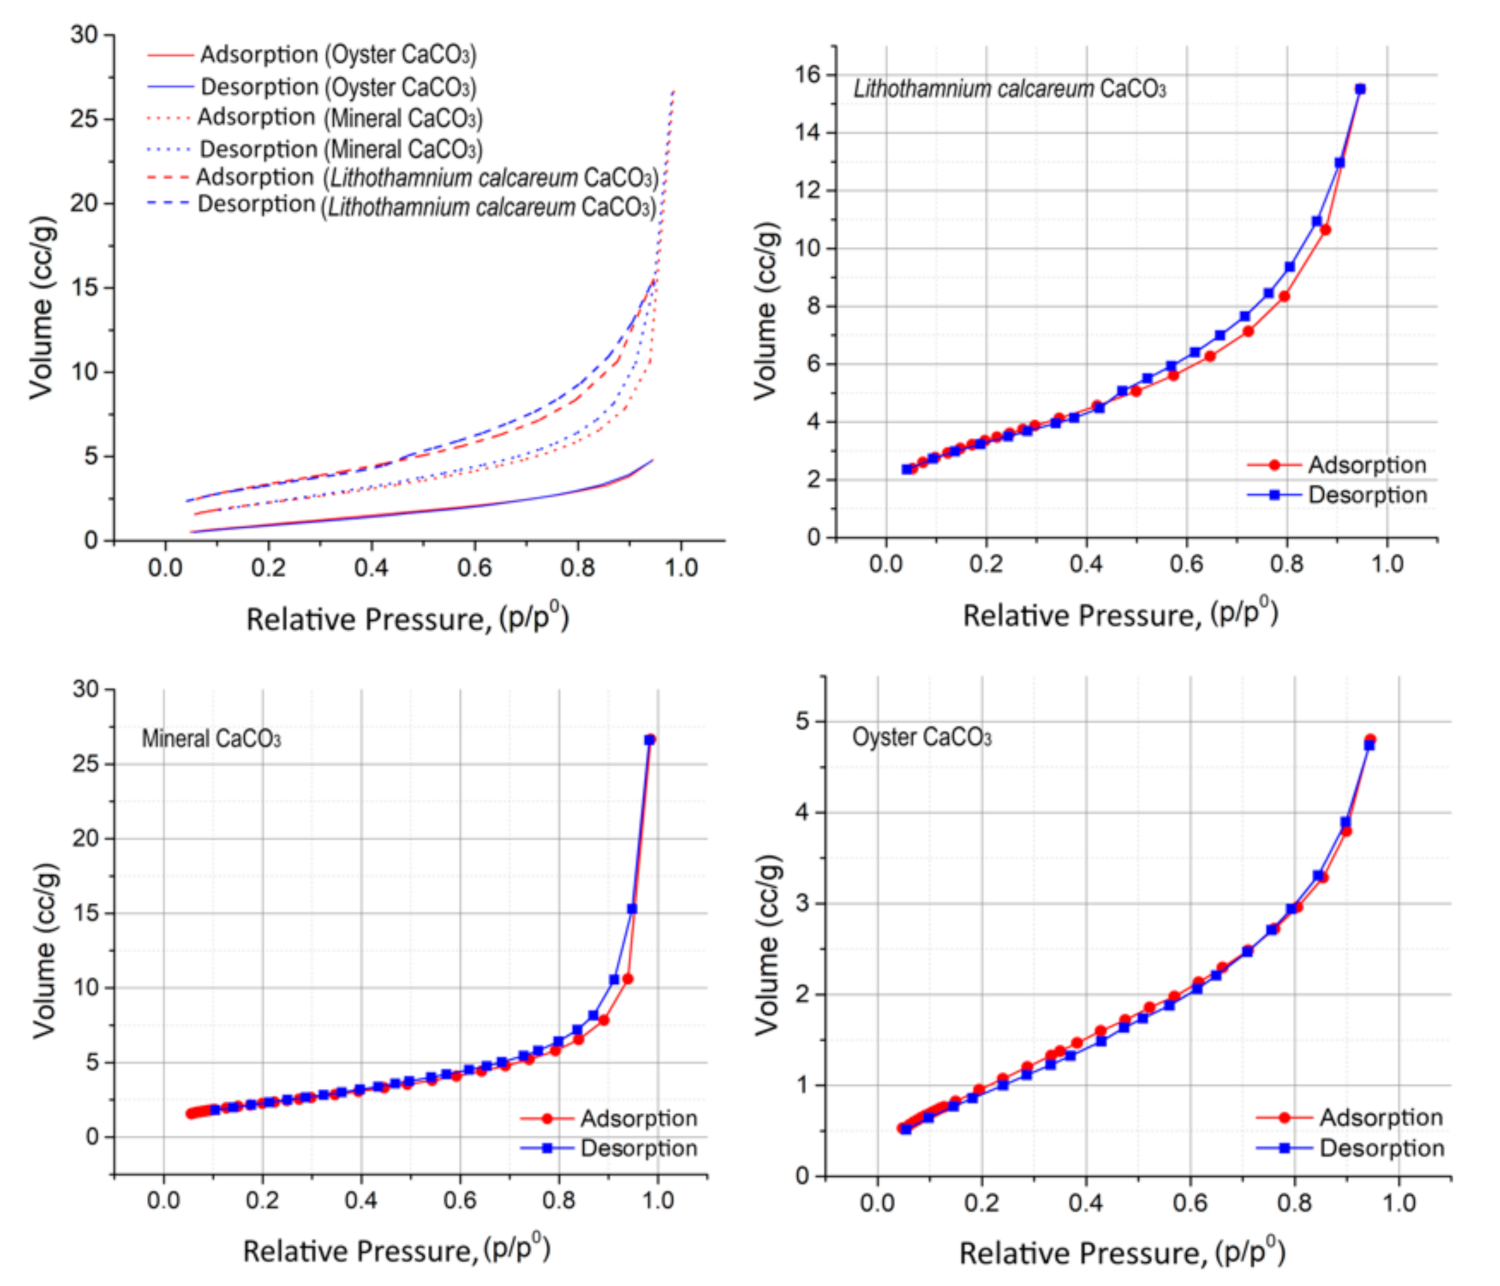
3.3. Surface Area and Porosity
- n = amount adsorbed at relative pressure;
- nm = specific monolayer capacity;
- C = constant relative to the adsorption of the first monolayer;
- p/p0 = relative pressure.
- A(BET) = BET area;
- L = Avogadro constant.
- r = surface tension of the liquid;
- ∇ = molar volume of the condensed liquid contained in a narrow pore of radius r;
- R = gas constant;
- T = temperature.
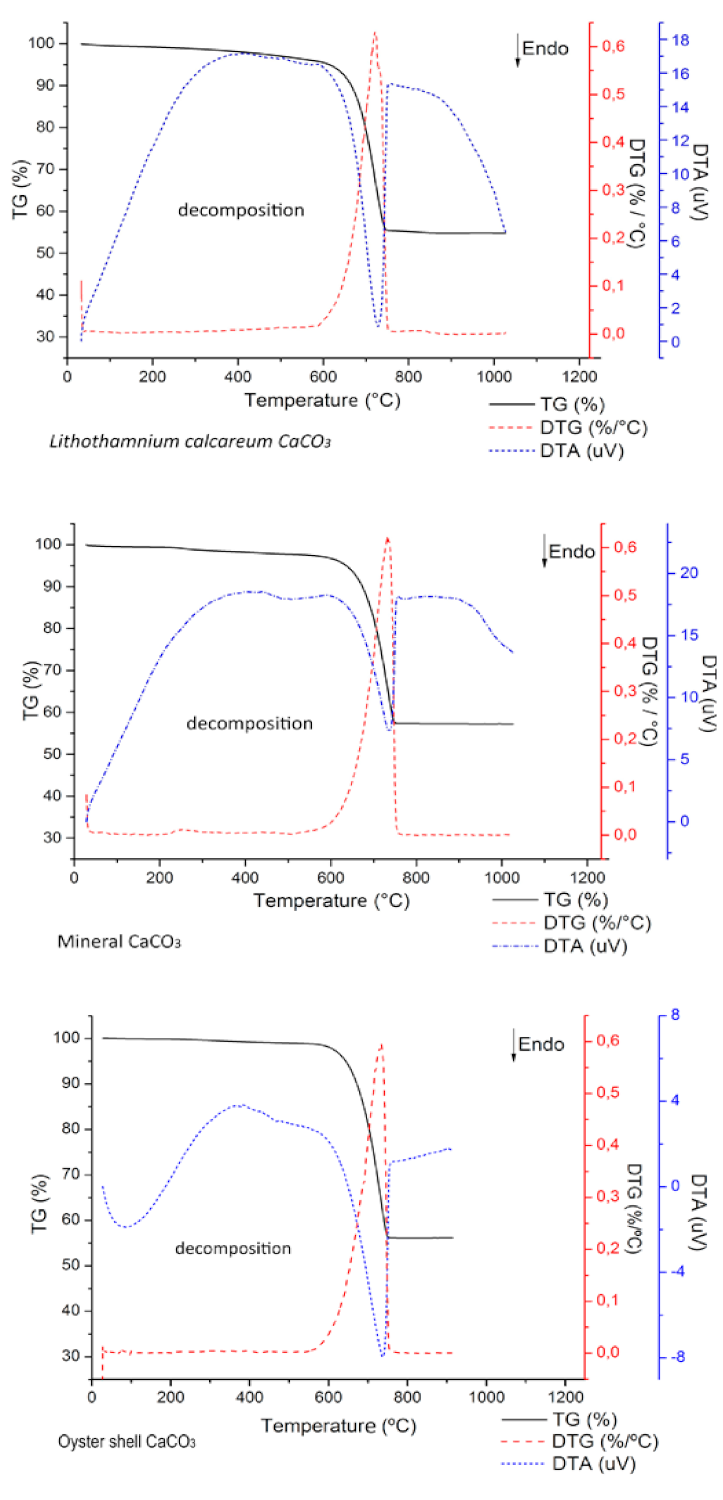
3.4. Thermal Analysis
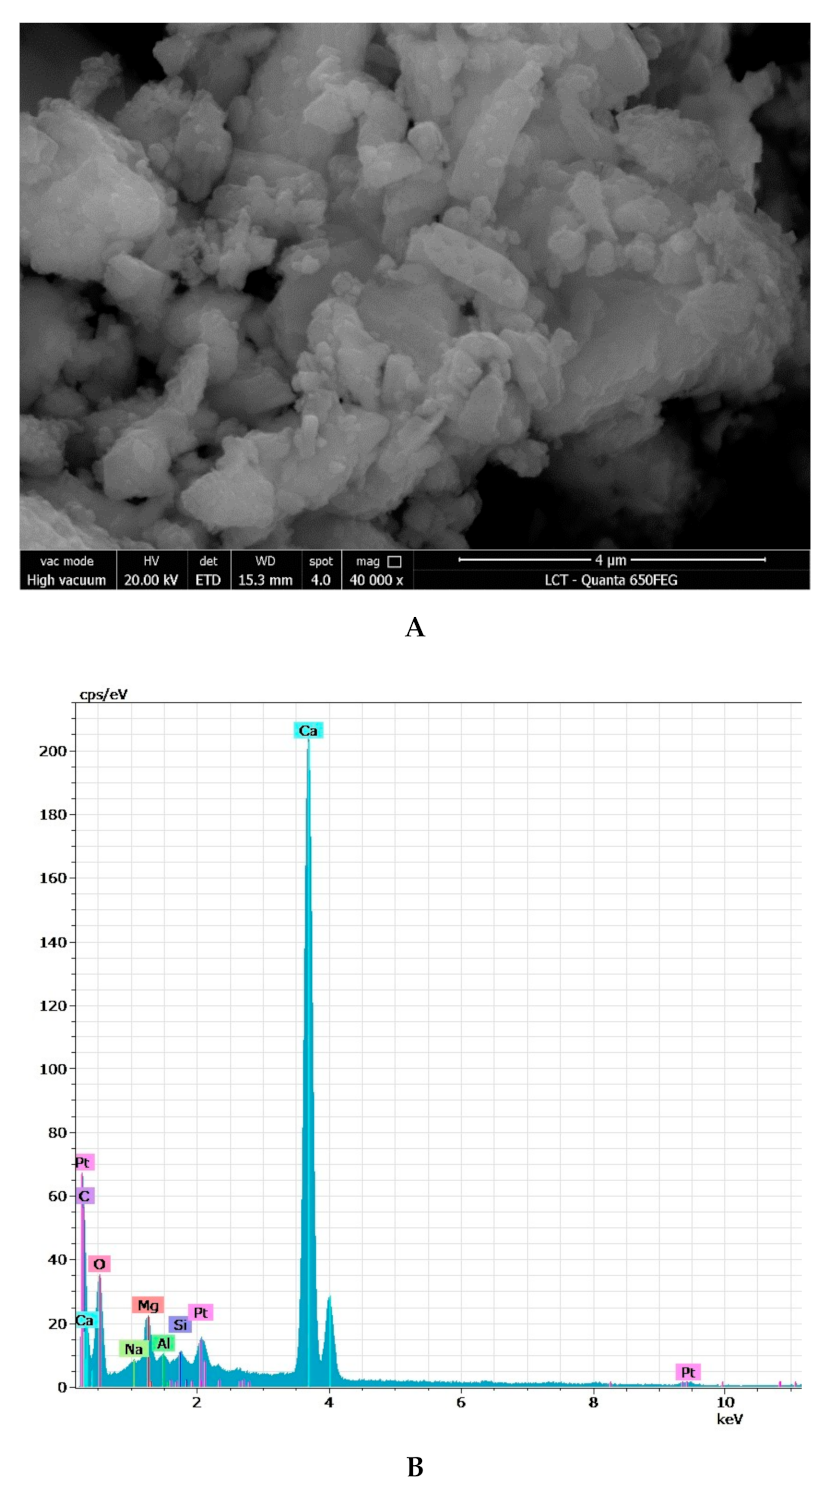
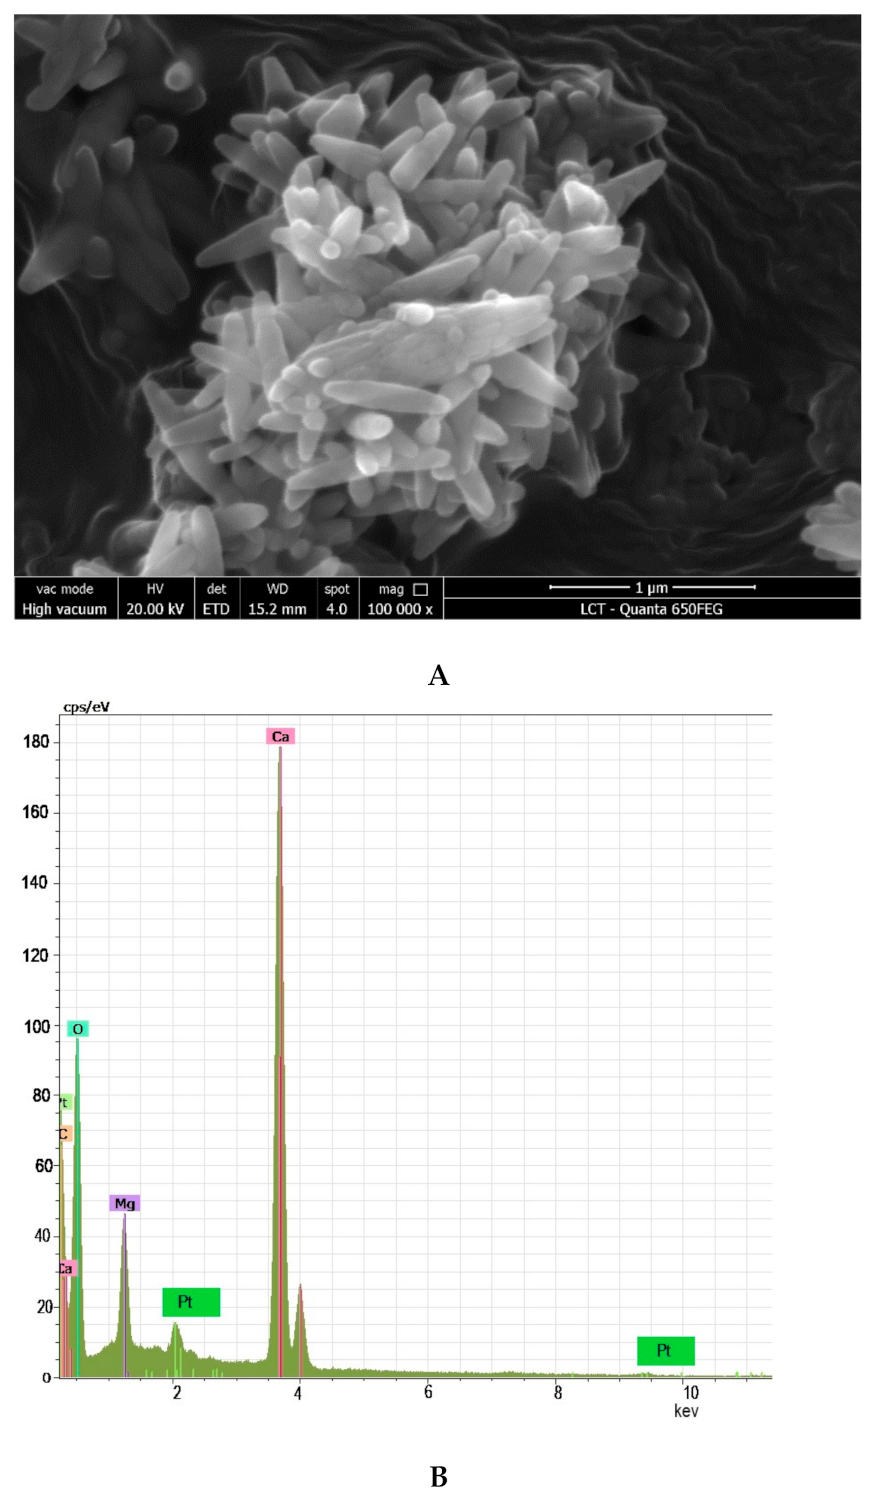
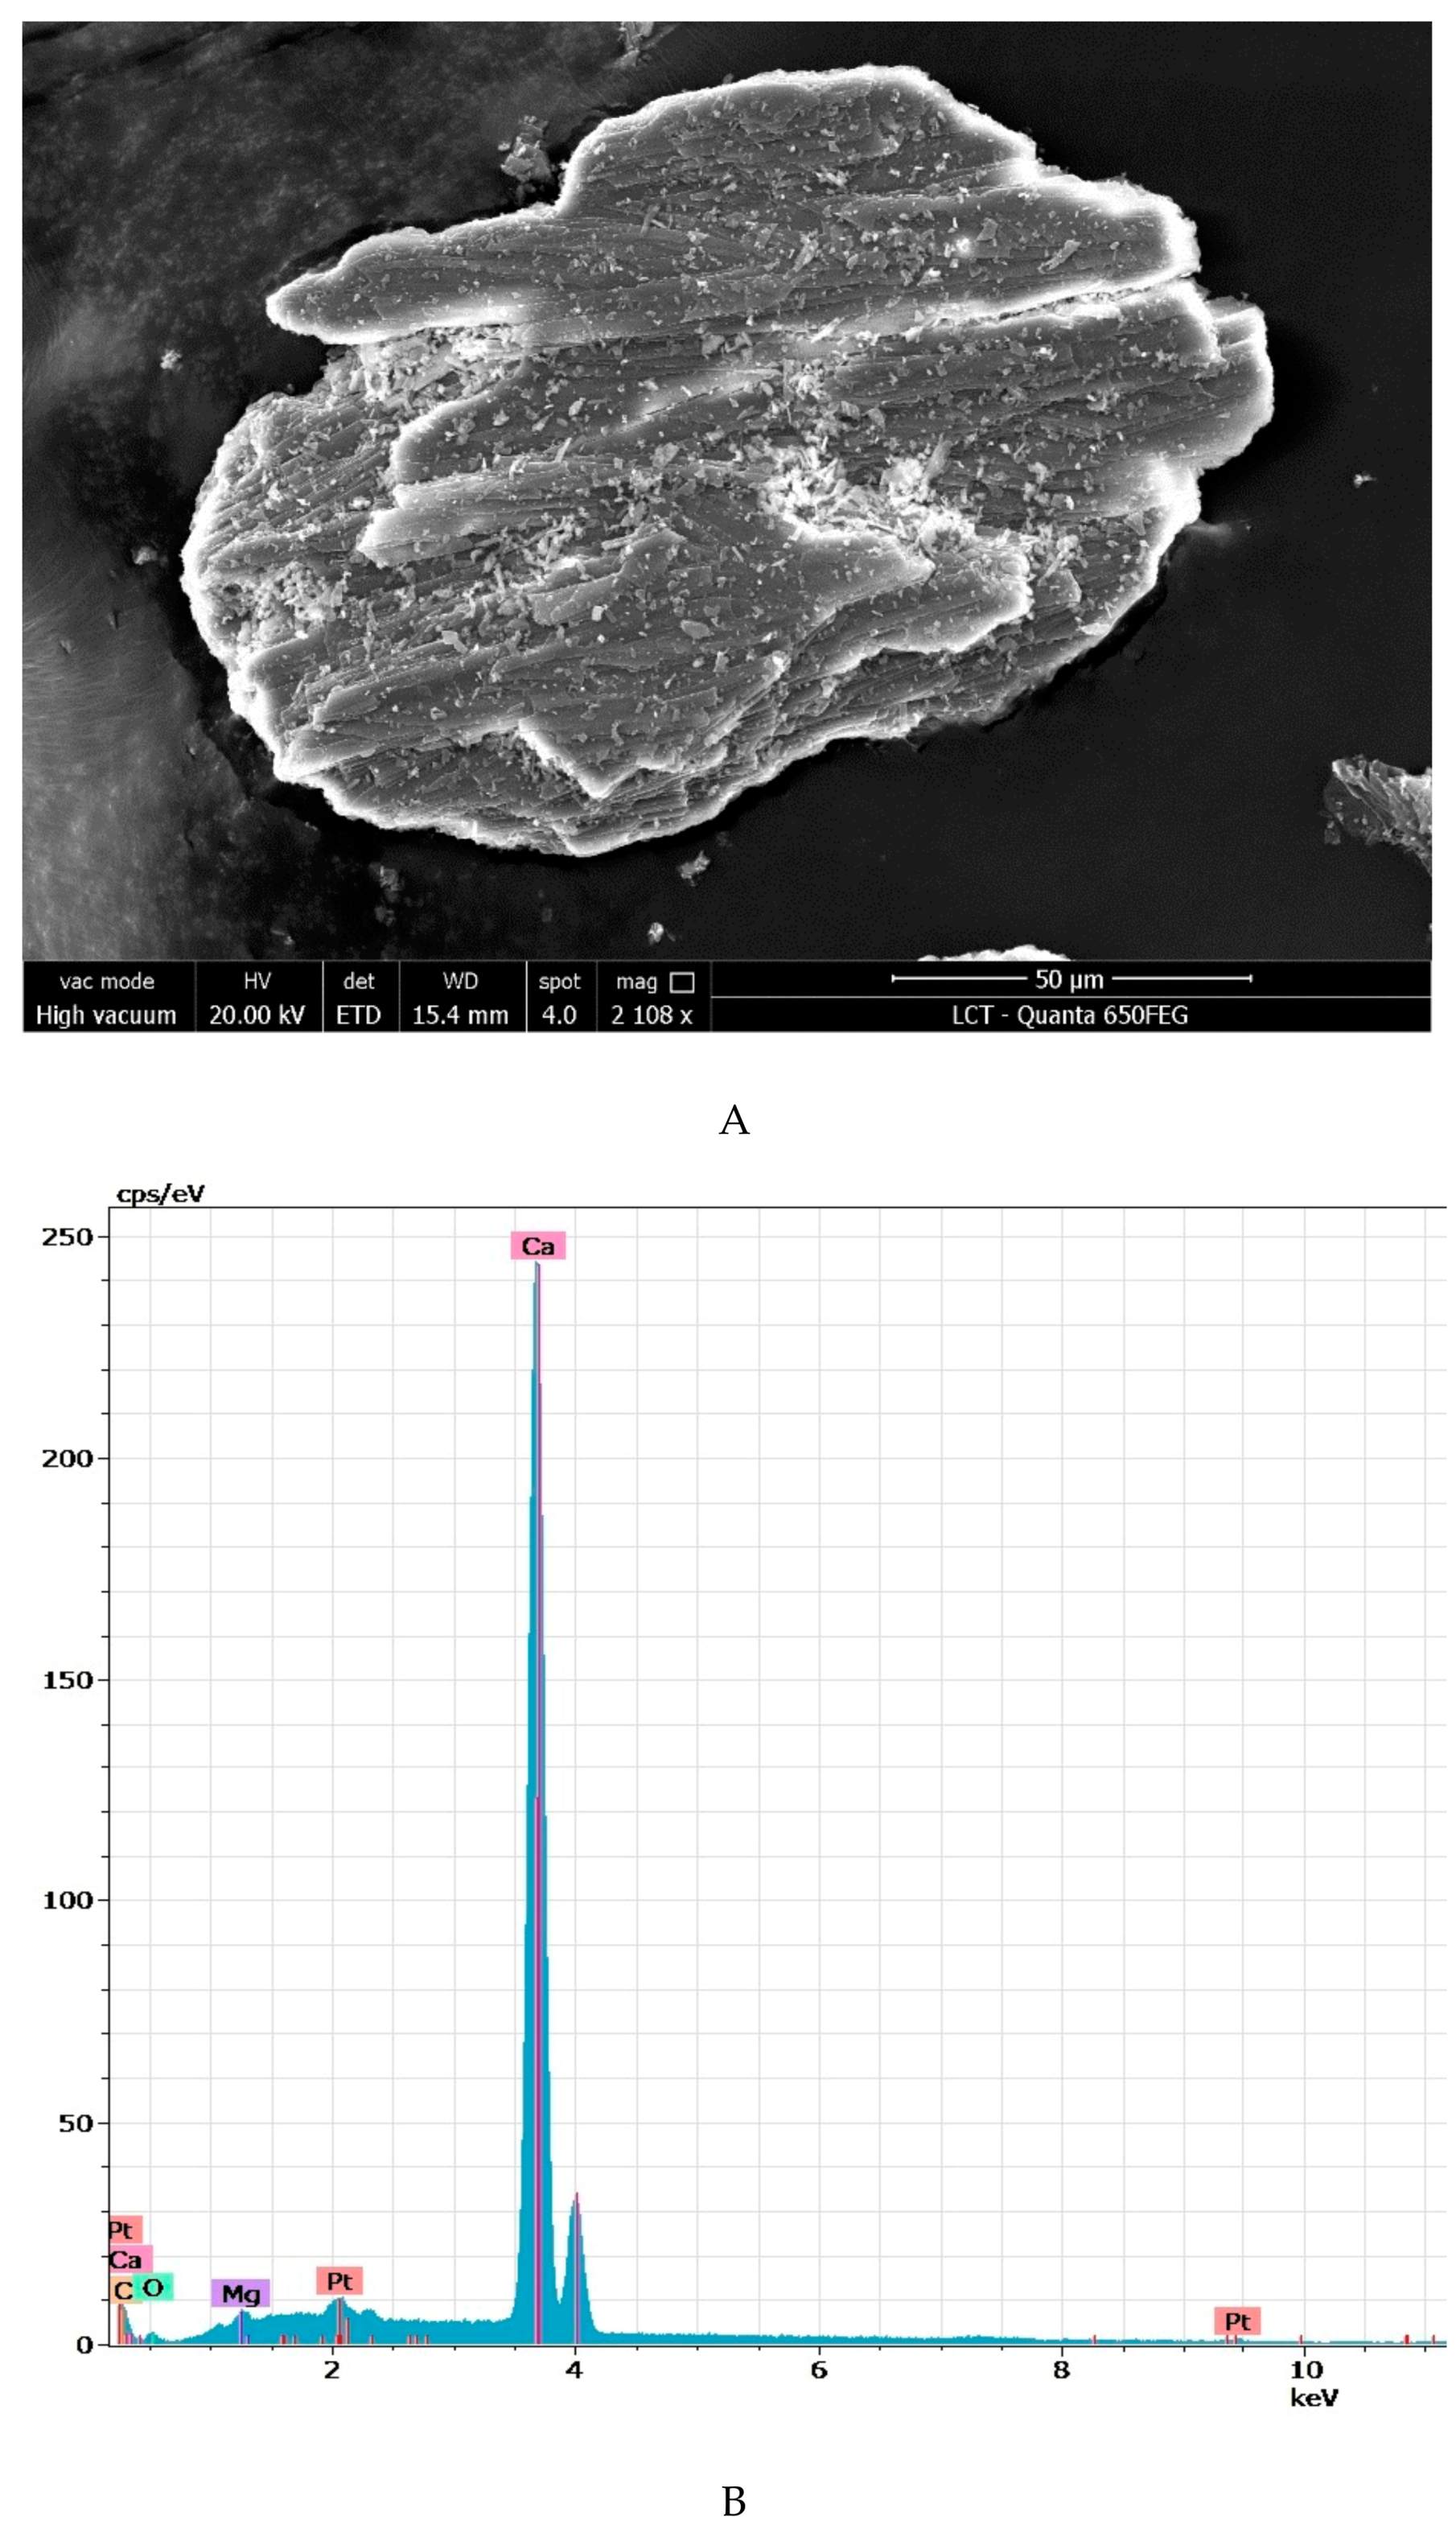
3.5. Scanning Electron Microscopy (SEM) and Energy-Dispersive Spectroscopy (EDS)
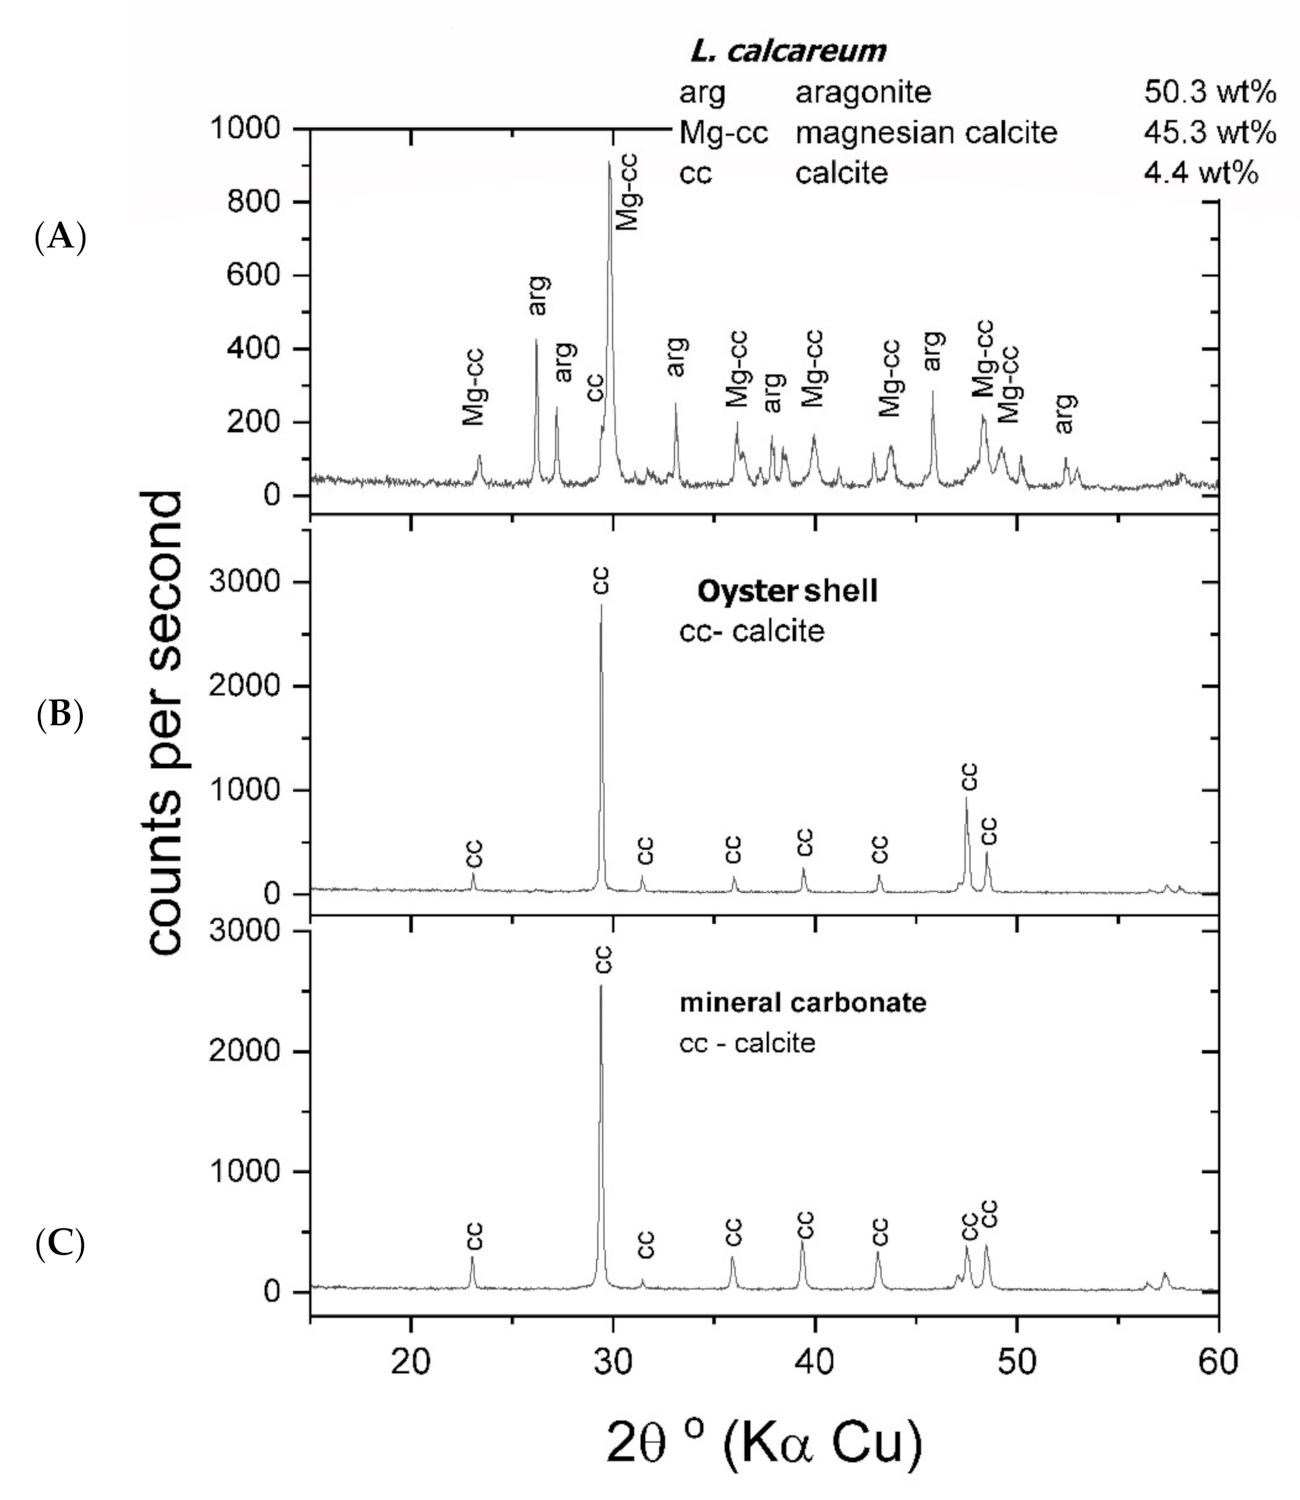
3.6. X-ray Diffraction
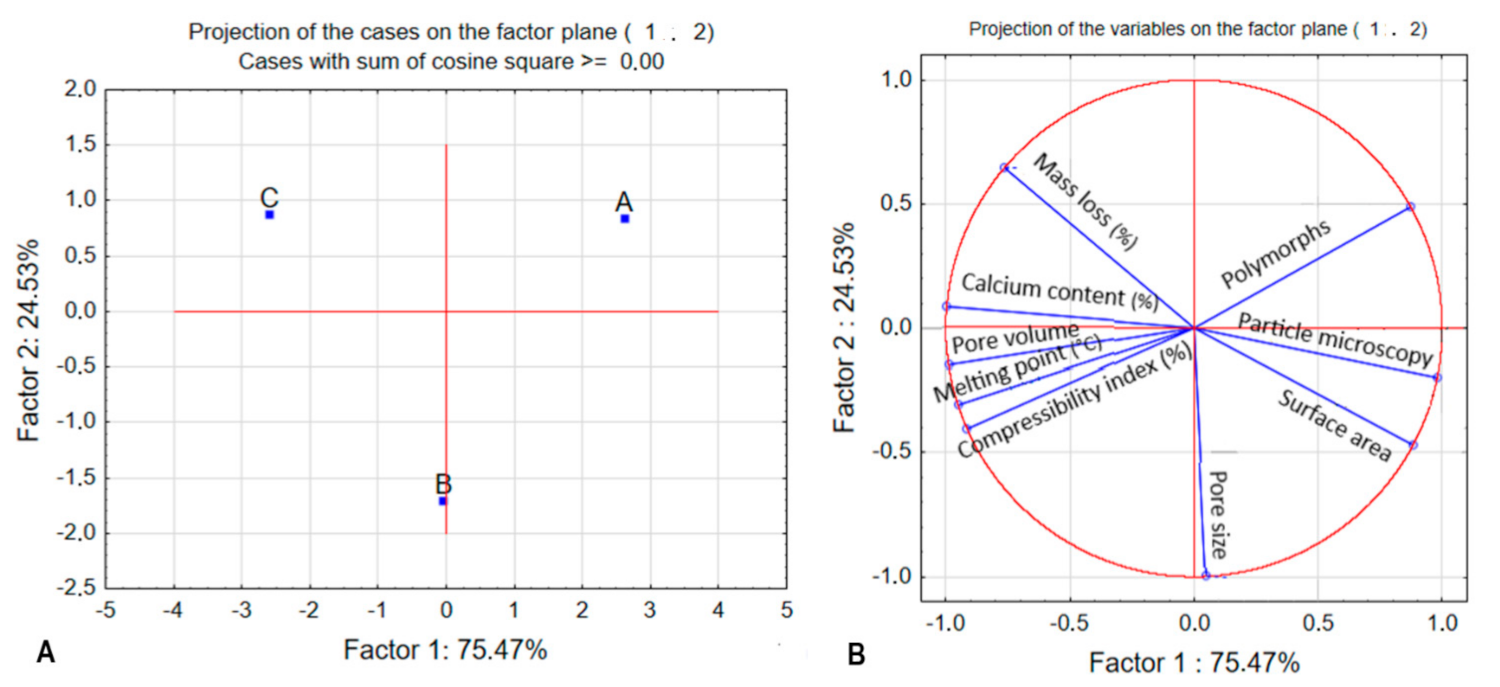
3.7. Principal Component Analysis
3.8. Chemical Analysis
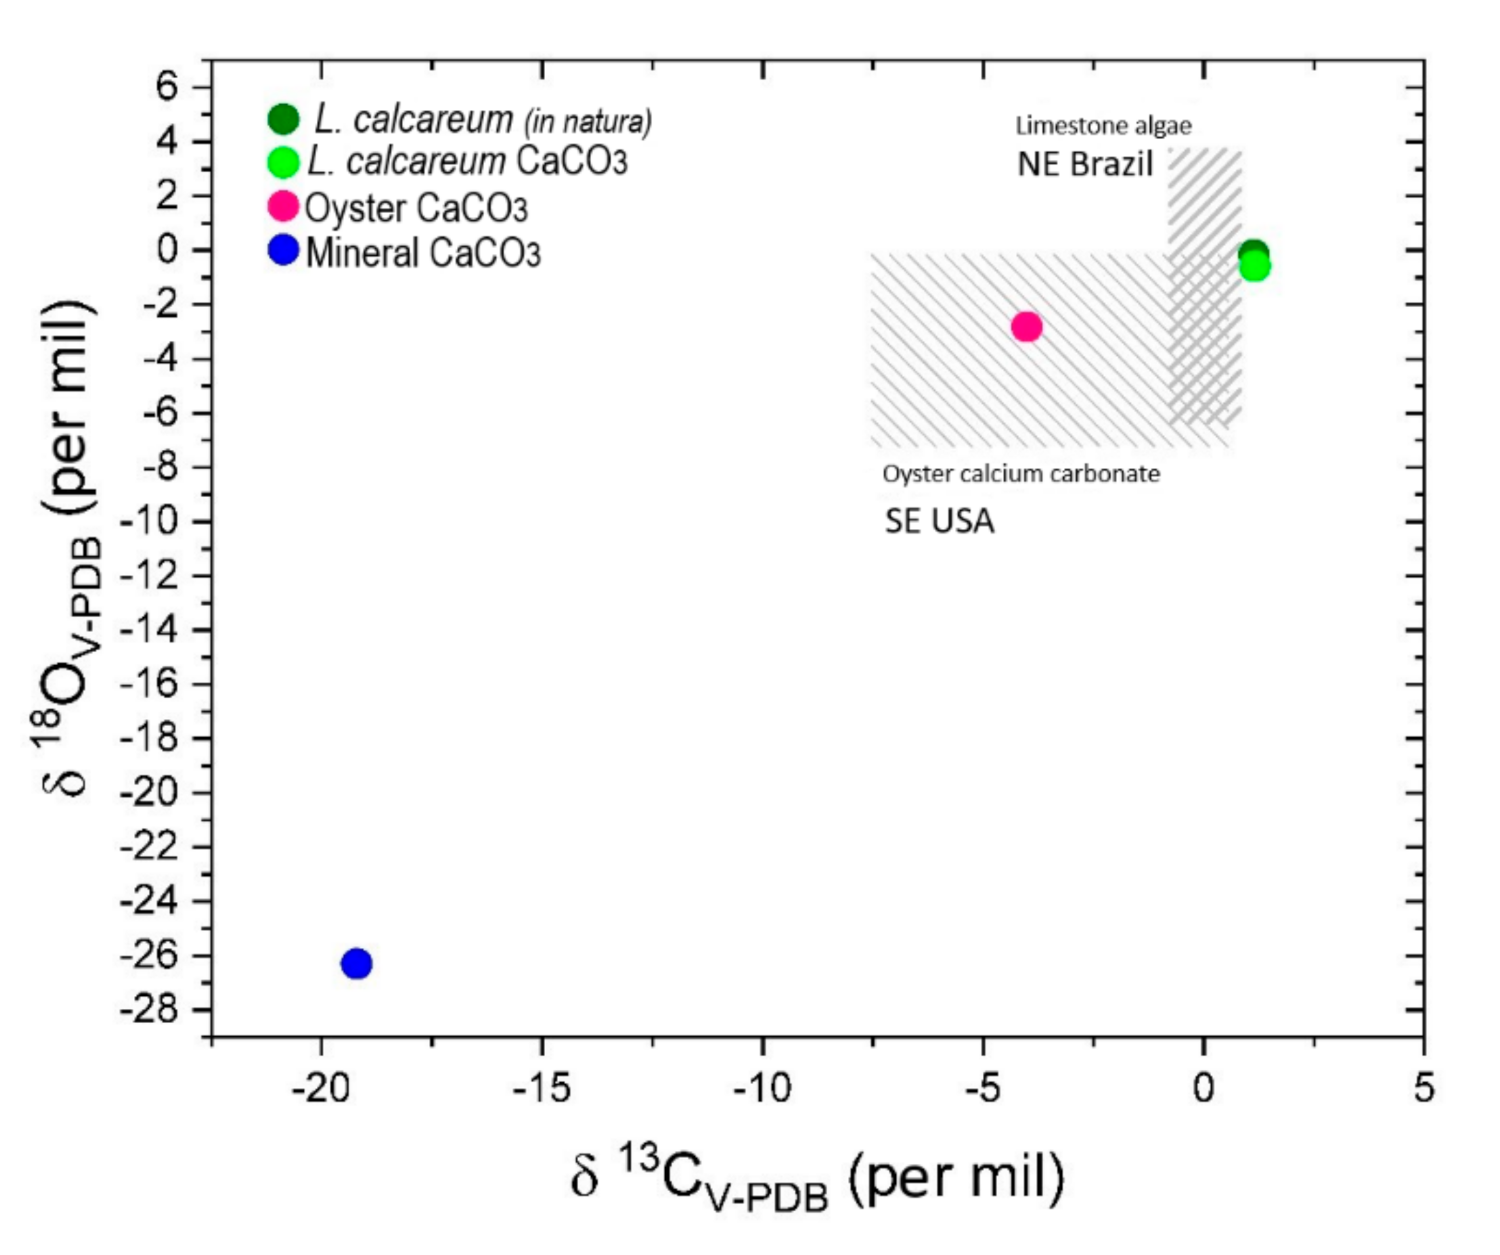
3.9. Analysis of Stable Isotopes
- 18O/16Osample and 13C/12Csample = isotopic ratios of the samples;
- 18O/16°v–PDB and 13C/12CV–PDB = isotopic standards of the Vienna Pee Dee Belemnite international standard.
4. Conclusions
Supplementary Materials
Author Contributions
Funding
Institutional Review Board Statement
Informed Consent Statement
Data Availability Statement
Acknowledgments
Conflicts of Interest
References
- Cabioch, J. Contribution a L’étude Morphologique, Anatomique et Systématique de deux Mélobésiécs: Lithothamnium calcarenm (Pallas) Areschoug et Lithothamnium corallioides Crouan. Bot. Mar. 1969, 9, 33–53. [Google Scholar] [CrossRef]
- Pouget, E.; Bomans, P.; Goos, J.; Frederik, P.; De With, G.; Sommerdijk, N. The Initial Stages of Template-Controlled CaCO3 Formation Revealed by Cryo-TEM. Science 2009, 323, 1455–1458. [Google Scholar] [CrossRef] [PubMed] [Green Version]
- Wysokowski, M.; Machałowski, T.; Petrenko, I.; Schimpf, C.; Rafaja, D.; Galli, R.; Ziętek, J.; Pantović, S.; Voronkina, A.; Kovalchuk, V.; et al. 3D Chitin Scaffolds of Marine Demosponge Origin for Biomimetic Mollusk Hemolymph-Associated Biomineralization Ex-Vivo. Mar. Drugs 2020, 18, 123. [Google Scholar] [CrossRef] [PubMed] [Green Version]
- Ehrlich, H.; Martinović, R.; Joksimović, D.; Petrenko, I.; Schiaparelli, S.; Wysokowski, M.; Tsurkan, D.; Stelling, A.L.; Springer, A.; Gelinsky, M.; et al. Conchixes: Organic scaffolds which resemble the size and shapes of mollusks shells, their isolation and potential multifunctional applications. Appl. Phys. A 2020, 126, 562. [Google Scholar] [CrossRef]
- MacKenzie, F.T.; Morse, J.W. Sedimentary carbonates through Phanerozoic time. Geochim.Cosmochim. Acta 1992, 56, 3281–3295. [Google Scholar] [CrossRef]
- Durand, N.; Monger, H.C.; Canti, M.G. Calcium Carbonate Features. In Interpretation of Micromorphological Features of Soils and Regoliths; Elsevier: Amsterdam, The Netherlands, 2010; pp. 149–194. [Google Scholar]
- Nielsen, P.; Baciocchi, R.; Costa, G.; Quaghebeur, M.; Snellings, R. Carbonate-bonded construction materials from alkaline residues. RILEM Tech. Lett. 2017, 2, 53–58. [Google Scholar] [CrossRef] [Green Version]
- Morse, J.W.; Arvidson, A.R.S.; Lüttge, A. Calcium Carbonate Formation and Dissolution. Chem. Rev. 2007, 107, 342–381. [Google Scholar] [CrossRef]
- Al Omari, M.; Rashid, I.; Qinna, N.; Jaber, A.; Badwan, A. Calcium Carbonate. Profiles Drug Subst. Excip. Relat. Methodol. 2016, 41, 31–132. [Google Scholar] [CrossRef]
- Dizaj, S.M.; Barzegar-Jalali, M.; Zarrintan, M.H.; Adibkia, K.; Lotfipour, F. Calcium carbonate nanoparticles as cancer drug delivery system. Expert Opin. Drug Deliv. 2015, 12, 1649–1660. [Google Scholar] [CrossRef]
- Jimoh, O.A.; Ariffin, K.S.; Bin Hussin, H.; Temitope, A.E. Synthesis of precipitated calcium carbonate: A review. Carbonates Evaporites 2018, 33, 331–346. [Google Scholar] [CrossRef]
- Borrego-Sánchez, A.; Sánchez-Espejo, R.; Albertini, B.; Passerini, N.; Cerezo, P.; Viseras, C.; Sainz-Díaz, C.I. Ground Calcium Carbonate as a Low Cost and Biosafety Excipient for Solubility and Dissolution Improvement of Praziquantel. Pharmaceutics 2019, 11, 533. [Google Scholar] [CrossRef] [Green Version]
- Golob, A.L.; Laya, M.B. Osteoporosis Screening, Prevention and Management. Med. Clin. N. Am. 2015, 99, 587–606. [Google Scholar] [CrossRef]
- Nakamura, Y.; Suzuki, T.; Kamimura, M.; Murakami, K.; Ikegami, S.; Uchiyama, S.; Kato, H. Vitamin D and calcium are required at the time of denosumab administration during osteoporosis treatment. Bone Res. 2017, 5, 17021. [Google Scholar] [CrossRef] [Green Version]
- Langdahl, B.L. New treatments of osteoporosis. Osteoporos. Sarcopenia 2015, 1, 4–21. [Google Scholar] [CrossRef] [Green Version]
- Costa, A.L.D.; Da Silva, M.A.C.N.; Nascimento, A.C.B.; Barbosa, M.D.C.L.; Batista, J.E.; Bezerra, G.F.D.B.; Brito, L.M.O.; Viana, G.M.D.C.; Filho, W.E.M.; Vidal, F.C.B.; et al. Osteoporose na atenção primária: Uma oportunidade para abordar os fatores de risco. Rev. Bras.Reum. 2016, 56, 111–116. [Google Scholar] [CrossRef] [Green Version]
- Markl, D.; Wang, P.; Ridgway, C.; Karttunen, A.-P.; Chakraborty, M.; Bawuah, P.; Pääkkönen, P.; Gane, P.; Ketolainen, J.; Peiponen, K.-E.; et al. Characterization of the Pore Structure of Functionalized Calcium Carbonate Tablets by Terahertz Time-Domain Spectroscopy and X-Ray Computed Microtomography. J. Pharm. Sci. 2017, 106, 1586–1595. [Google Scholar] [CrossRef] [Green Version]
- Nguyen, M.H.T.; Jung, W.-K.; Kim, S.-K. Marine Algae Possess Therapeutic Potential for Ca-Mineralization via Osteoblastic Differentiation. Adv. Food Nutr. Res. 2011, 64, 429–441. [Google Scholar] [CrossRef]
- Brennan, O.; Stenson, B.; Widaa, A. Incorporation of the natural marine multi-mineral dietary supplement Aquamin enhances osteogenesis and improves the mechanical properties of a collagen-based bone graft substitute. J. Mech. Behav. Biomed. Mater. 2015, 47, 114–123. [Google Scholar] [CrossRef]
- Bailey, J.C. Molecular Systematics of Red Algae. Ph.D. Thesis, Louisiana State University and Agricultural & Mechanical College, Baton Rouge, LA, USA, 1996; pp. 40–44. Available online: https://digitalcommons.lsu.edu/gradschool_disstheses/6316 (accessed on 20 May 2019).
- Almeida, F.; Schiavo, L.; Vieira, A.; Araújo, G.; Queiroz-Junior, C.; Teixeira, M.; Cassali, G.; Tagliati, C. Gastroprotective and toxicological evaluation of the Lithothamnion calcareum algae. Food Chem. Toxicol. 2012, 50, 1399–1404. [Google Scholar] [CrossRef]
- Desideri, D.; Cantaluppi, C.; Ceccotto, F.; Meli, M.A.; Roselli, C.; Feduzi, L. Essential and toxic elements in seaweeds for human consumption. J. Toxicol. Environ. Health Part A 2016, 79, 112–122. [Google Scholar] [CrossRef]
- Assoumani, M.B. AquaMin, a natural calcium supplement derived from seaweed. Agro Food Ind. Hi-Tech 1997, 8, 45–47. [Google Scholar]
- Aslam, M.N.; Kreider, J.M.; Paruchuri, T.; Bhagavathula, N.; DaSilva, M.; Zernicke, R.F.; Goldstein, S.A.; Varani, J. A Mineral-Rich Extract from the Red Marine Algae Lithothamnion calcareum Preserves Bone Structure and Function in Female Mice on a Western-Style Diet. Calcif. Tissue Int. 2010, 86, 313–324. [Google Scholar] [CrossRef] [Green Version]
- Uenishi, K.; Tokiwa, M.; Kato, S.; Shiraki, M. Stimulation of intestinal calcium absorption by orally administrated vitamin D3 compounds: A prospective open-label randomized trial in osteoporosis. Osteoporos. Int. 2018, 29, 723–732. [Google Scholar] [CrossRef] [Green Version]
- López-Benito, M. Estudio de la composición química del Lithothamnium calcareum (Aresch) y su aplicación como corrector de terrenos de cultivo. Inv. Pesq. 1963, 23, 53–70. [Google Scholar]
- Déléris, P.; Nazih, H.; Bard, J.-M. Seaweeds in Human Health. In Seaweed in Health and Disease Prevention; Elsevier BV: Amsterdam, The Netherlands, 2016; pp. 319–367. [Google Scholar]
- Bang, J.-H.; Jang, Y.N.; Kim, W.; Song, K.S.; Jeon, C.W.; Chae, S.C.; Lee, S.-W.; Park, S.-J.; Lee, M.G. Specific surface area and particle size of calcium carbonate precipitated by carbon dioxide microbubbles. Chem. Eng. J. 2012, 198–199, 254–260. [Google Scholar] [CrossRef]
- Glibert, P.M.; Middelburg, J.J.; McClelland, J.W.; Zanden, M.J.V. Stable isotope tracers: Enriching our perspectives and questions on sources, fates, rates, and pathways of major elements in aquatic systems. Limnol. Oceanogr. 2019, 64, 950–981. [Google Scholar] [CrossRef] [Green Version]
- Jasper, J.P. The increasing use of stable isotopes in the pharmaceutical industry. Pharm. Technol. 1999, 23, 106–114. [Google Scholar]
- Cristea, G.; Magdas, D.A.; Voica, C.; Feher, I. Stable Isotope Fingerprinting for Pharmaceutical Authentication. Anal. Lett. 2017, 50, 2691–2698. [Google Scholar] [CrossRef]
- Hadjittofis, E.; Das, S.; Zhang, G.; Heng, J. Interfacial Phenomena. In Developing Solid Oral Dosage Forms: Pharmaceutical Theory and Practice, 2nd ed.; Academic press: Cambridge, MA, USA, 2017; pp. 225–252. [Google Scholar] [CrossRef]
- Cabiscol, R.; Finke, J.H.; Zetzener, H.; Kwade, A. Characterization of Mechanical Property Distributions on Tablet Surfaces. Pharmaceutics 2018, 10, 184. [Google Scholar] [CrossRef] [PubMed] [Green Version]
- Sherrington, L.A.; Sherrington, A. Guaifenesin. Anal. Profiles Drug Subst. 1998, 25, 121–164. [Google Scholar]
- Kaerger, J.; Edge, S.; Price, R. Influence of particle size and shape on flowability and compactibility of binary mixtures of paracetamol and microcrystalline cellulose. Eur. J. Pharm. Sci. 2004, 22, 173–179. [Google Scholar] [CrossRef]
- Huang, Z.; Scicolone, J.V.; Han, X.; Davé, R.N. Improved blend and tablet properties of fine pharmaceutical powders via dry particle coating. Int. J. Pharm. 2015, 478, 447–455. [Google Scholar] [CrossRef]
- Sun, C.C. Quantifying effects of moisture content on flow properties of microcrystalline cellulose using a ring shear tester. Powder Technol. 2016, 289, 104–108. [Google Scholar] [CrossRef]
- Anovitz, L.M.; Cole, D.R. Characterization and Analysis of Porosity and Pore Structures. Rev. Miner. Geochem. 2015, 80, 61–164. [Google Scholar] [CrossRef] [Green Version]
- Kurig, H.; Russina, M.; Tallo, I.; Siebenbürger, M.; Romann, T.; Lust, E. The suitability of infinite slit-shaped pore model to describe the pores in highly porous carbon materials. Carbon 2016, 100, 617–624. [Google Scholar] [CrossRef]
- Ahuja, G.; Pathak, K. Porous carriers for controlled/modulated drug delivery. Indian J. Pharm. Sci. 2009, 71, 599–607. [Google Scholar] [CrossRef] [Green Version]
- Schüth, F.; Sing, K.S.W.; Weitkamp, J. Handbook of Porous Solids; Wiley: Weinheim, Germany, 2002; p. 3207. [Google Scholar] [CrossRef]
- Thommes, M.; Kaneko, K.; Neimark, A.V.; Olivier, J.P.; Rodriguez-Reinoso, F.; Rouquerol, J.; Sing, K.S. Physisorption of gases, with special reference to the evaluation of surface area and pore size distribution (IUPAC Technical Report). Pure Appl. Chem. 2015, 87, 1051–1069. [Google Scholar] [CrossRef] [Green Version]
- Lowell, S.; Shields, J.E.; Thomas, M.A.; Thommes, M. Characterization of Porous Solids and Powders: Surface Area, Pore Size and Density; Springer: Berlin/Heidelberg, Germany, 2004. [Google Scholar]
- Xia, X.; Chen, J.; Shen, J.; Huang, D.; Duan, P.; Zou, G. Synthesis of hollow structural hydroxyapatite with different morphologies using calcium carbonate as hard template. Adv. Powder Technol. 2018, 29, 1562–1570. [Google Scholar] [CrossRef]
- D’Elia, A.; Pinto, D.; Eramo, G.; Giannossa, L.; Ventruti, G.; Laviano, R. Effects of processing on the mineralogy and solubility of carbonate-rich clays for alkaline activation purpose: Mechanical, thermal activation in red/ox atmosphere and their combination. Appl. Clay Sci. 2018, 152, 9–21. [Google Scholar] [CrossRef]
- Li, X.-G.; Lv, Y.; Ma, B.-G.; Wang, W.-Q.; Jian, S.-W. Decomposition kinetic characteristics of calcium carbonate containing organic acids by TGA. Arab. J. Chem. 2017, 10, S2534–S2538. [Google Scholar] [CrossRef] [Green Version]
- Thriveni, T.; Um, N.; Nam, S.-Y.; Ahn, Y.J.; Han, C.; Ahn, J.W. Factors Affecting the Crystal Growth of Scalenohedral Calcite by a Carbonation Process. J. Korean Ceram. Soc. 2014, 51, 107–114. [Google Scholar] [CrossRef]
- Ukrainczyk, M.; Gredičak, M.; Jerić, I.; Kralj, D. Interactions of Scalenohedral Calcite Crystals with Acidic Amino Acid Derivatives of Salicylic Acid. Cryst. Growth Des. 2014, 14, 4335–4346. [Google Scholar] [CrossRef]
- Long, X.; Ma, Y.; Qi, L. Biogenic and synthetic high magnesium calcite—A review. J. Struct. Biol. 2014, 185, 1–14. [Google Scholar] [CrossRef] [PubMed]
- Rattanachaiwong, S.; Singer, P. Diets and Diet Therapy: Trace Elements. Encycl. Food Secur. Sustain. 2019, 2, 143–160. [Google Scholar] [CrossRef]
- Cannas, D.; Loi, E.; Serra, M.; Firinu, D.; Valera, P.; Zavattari, P. Relevance of Essential Trace Elements in Nutrition and Drinking Water for Human Health and Autoimmune Disease Risk. Nutrients 2020, 12, 2074. [Google Scholar] [CrossRef]
- Mehri, A. Trace Elements in Human Nutrition (II)—An Update. Int. J. Prev. Med. 2020, 11, 2. [Google Scholar] [CrossRef]
- World Health Organization. Trace Elements in Human Nutrition and Health. World Health Organization: Geneva, Switzerland, 1996; p. 360. Available online: https://www.who.int/nutrition/publications/micronutrients/9241561734/en/ (accessed on 4 August 2020).
- EFSA (European Food Safety Authority) Panel on Dietetic Products Nutrition & Allergies. Dietary Reference Values for Nutrients. Summ. Rep. EFSA Support. Publ. 2017, 14, e15121. [Google Scholar] [CrossRef] [Green Version]
- Veizer, J. Chapter 8. Trace Elements and Isotopes in Sedimentary Carbonates. Rev. Mineral. Geochem. 1983, 11, 265–300. [Google Scholar] [CrossRef]
- Taylor, S.R.; Mclennan, S.M. The Continental Crust: Its Composition and Evolution; Blackwell: Oxford, UK, 1985; p. 298. [Google Scholar]
- Zhu, Y. Determination of rare earth elements in seawater samples by inductively coupled plasma tandem quadrupole mass spectrometry after coprecipitation with magnesium hydroxide. Talanta 2020, 209, 120536. [Google Scholar] [CrossRef]
- Fu, F.F.; Akagi, T.; Yabuki, S.; Iwaki, M.; Ogura, N. Distribution of rare earth elements in seaweed: Implication of two different sources of rare earth elements and silicon in seaweed. J. Phycol. 2000, 36, 62–70. [Google Scholar] [CrossRef]
- Sharp, Z. Principles of Stable Isotope Geochemistry; Prentice Hall: Hoboken, NJ, USA, 2006; p. 344. [Google Scholar]
- Rocha, C.M.S. Estudo Químico de Lithothamnion sp. e Halimeda sp. no Nordeste Brasileiro. Tese (Doutorado em Geologia—Hidrogeologia e Recursos Minerais). Universidade Federal do Ceará: Fortaleza, Brazil, 2013. Available online: http://www.repositorio.ufc.br/bitstream/riufc/15684/1/2013_tese_cmsrocha.pdf (accessed on 14 May 2020).
- Grimm, B.L.; Spero, H.J.; Harding, J.M.; Guilderson, T.P. Seasonal radiocarbon reservoir ages for the 17th century James River, Virginia estuary. Quat. Geochronol. 2017, 41, 119–133. [Google Scholar] [CrossRef]
- Vilain, J. Improvements Relating to Seaweed-Derived Preparations. Depositante: Keith W.. Nash & CO. WO1992011020A1. Depósito: 17 dez. 1991. Concessão: 9 Jul. 1992. Available online: https://patents.google.com/patent/WO1992011020A1/en (accessed on 5 December 2020).
- Mendes, C.M. Process for Producing a Marine Mineral Concentrate Made from Lithothamnium Seaweed, and the Marine Mineral Concentrate Obtained Therefrom. Depositante: PHOSTHER ALGAMAR Ltd.a. US20130266655A1. Depósito: 9 abr. 2012. Available online: https://patents.google.com/patent/US20130266655A1/en (accessed on 28 November 2020).
- United States Pharmacopeia National Formulary, 42nd ed.; United States Pharmacopeial Convention: Rockville, ML, USA, 2019.
- Klobes, P.; Meyer, K.; Munro, G. Porosity and Specific Surface Area Measurements for Solid Materials; National Institute of Standards and Technology: Gaithersburg, ML, USA, 2006; p. 89. [Google Scholar]
- COD. Crystallography Open Database. Available online: http://www.crystallography.net/cod/ (accessed on 28 August 2020).
- Rietveld, H.M. A profile refinement method for nuclear and magnetic structures. J. Appl. Crystallogr. 1969, 2, 65–71. [Google Scholar] [CrossRef]
- Navarro, M.S.; Andrade, S.; Ulbrich, H.H.G.J.; Gomes, C.D.B.; Girardi, V.A.V. The Direct Determination of Rare Earth Elements in Basaltic and Related Rocks using ICP-MS: Testing the Efficiency of Microwave Oven Sample Decomposition Procedures. Geostand. Geoanal. Res. 2008, 32, 167–180. [Google Scholar] [CrossRef]


| Samples | Apparent Density (g/mL) | Compacted Density (g/mL) | Carr Index (%) | Hausner Ratio |
|---|---|---|---|---|
| L. calcareum CaCO3 | 0.49 ± 0.01 | 0.80 ± 0.01 | 38.75 ± 0.01 | 1.63 ± 0.01 |
| Inorganic mineral CaCO3 | 0.30 ± 0.01 | 0.53 ± 0.02 | 43.40 ± 0.02 | 1.77 ± 0.02 |
| Oyster shell CaCO3 | 0.74 ± 0.03 | 1.32 ± 0.02 | 43.94 ± 0.02 | 1.78 ± 0.02 |
| Sample | A(BET) (m2.g−1) | Vp (×10−3 cm3.g−1) | Pore Size (Å) |
|---|---|---|---|
| L. calcareum CaCO3 | 8.118 | 1.585 | 3.906 |
| Inorganic mineral CaCO3 | 7.857 | 3.829 | 9.746 |
| Oyster shell CaCO3 | 2.935 | 5.081 | 3.463 |
| Samples | Event | Tpico peak DTG (°C) | Tinitial (°C) | Tonset (°C) | Tfinal (°C) | Weight Loss (%) | Tpeak DTA (°C) |
|---|---|---|---|---|---|---|---|
| L. calcareum CaCO3 | Decomposition | 720.3 | 587.0 | 670.9 | 757.1 | 40.4 | 727.3 |
| Inorganic mineral CaCO3 | Decomposition | 731.9 | 572.0 | 668.9 | 760.3 | 39.9 | 736.8 |
| Oyster shell CaCO3 | Decomposition | 734.9 | 693.1 | 675.1 | 751.0 | 42.7 | 737.5 |
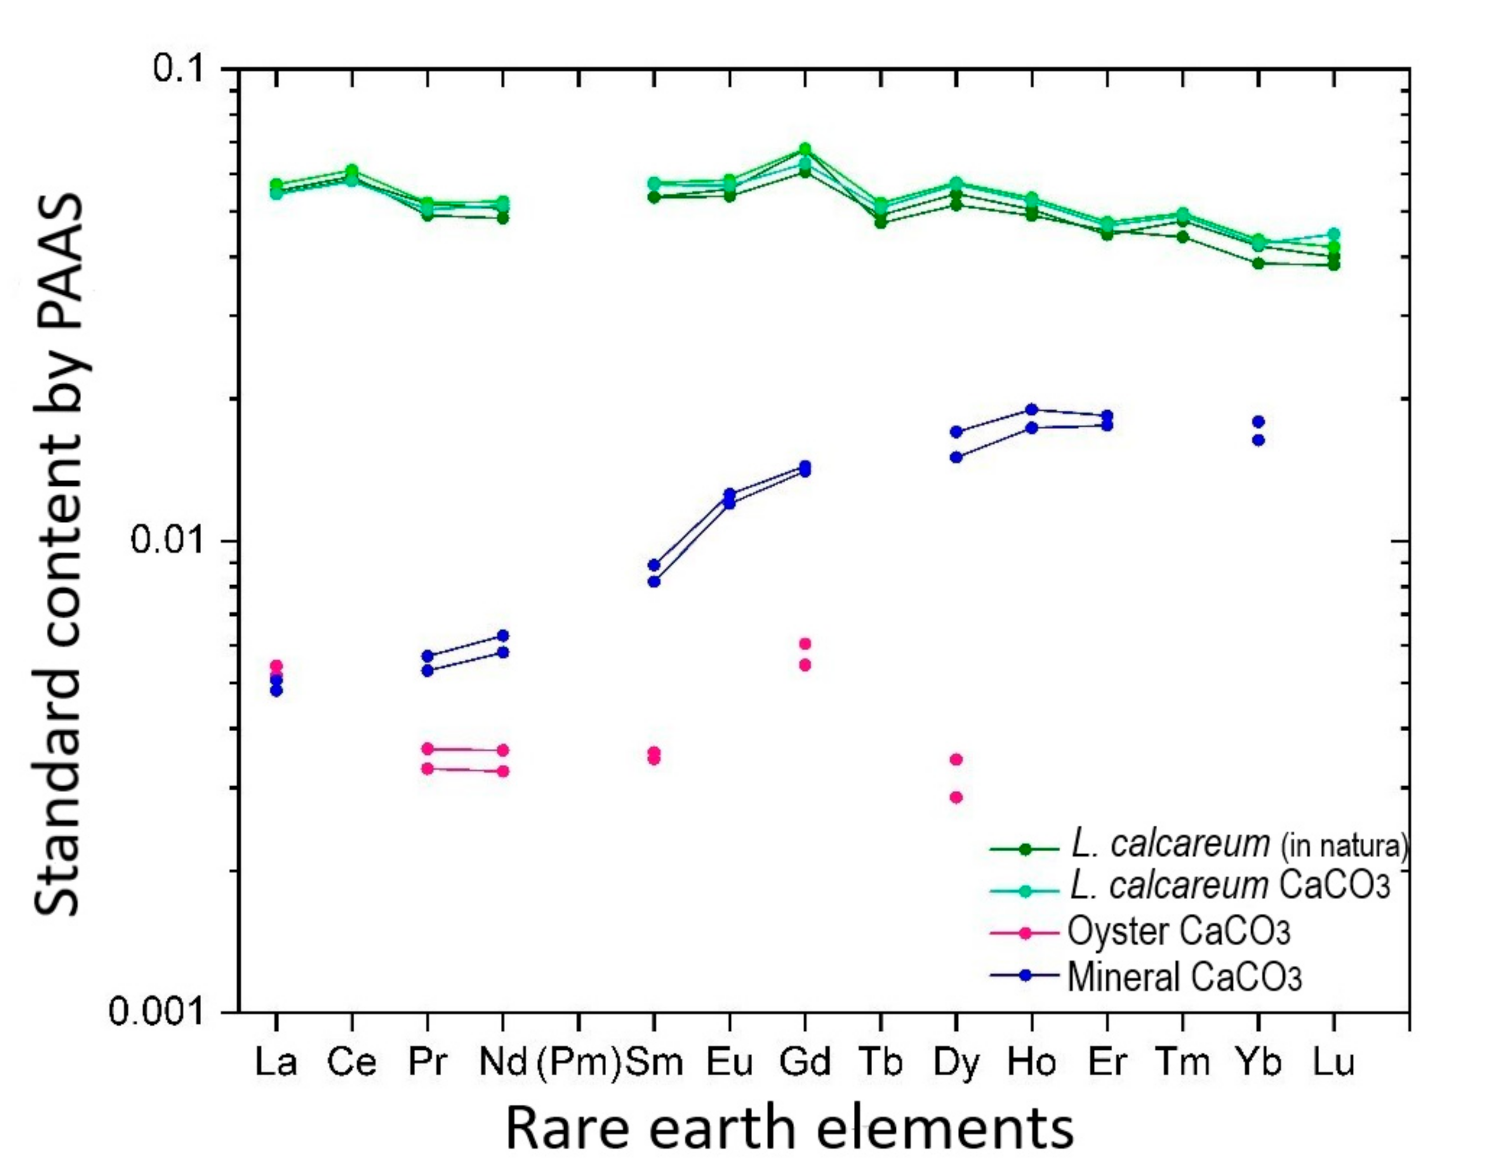
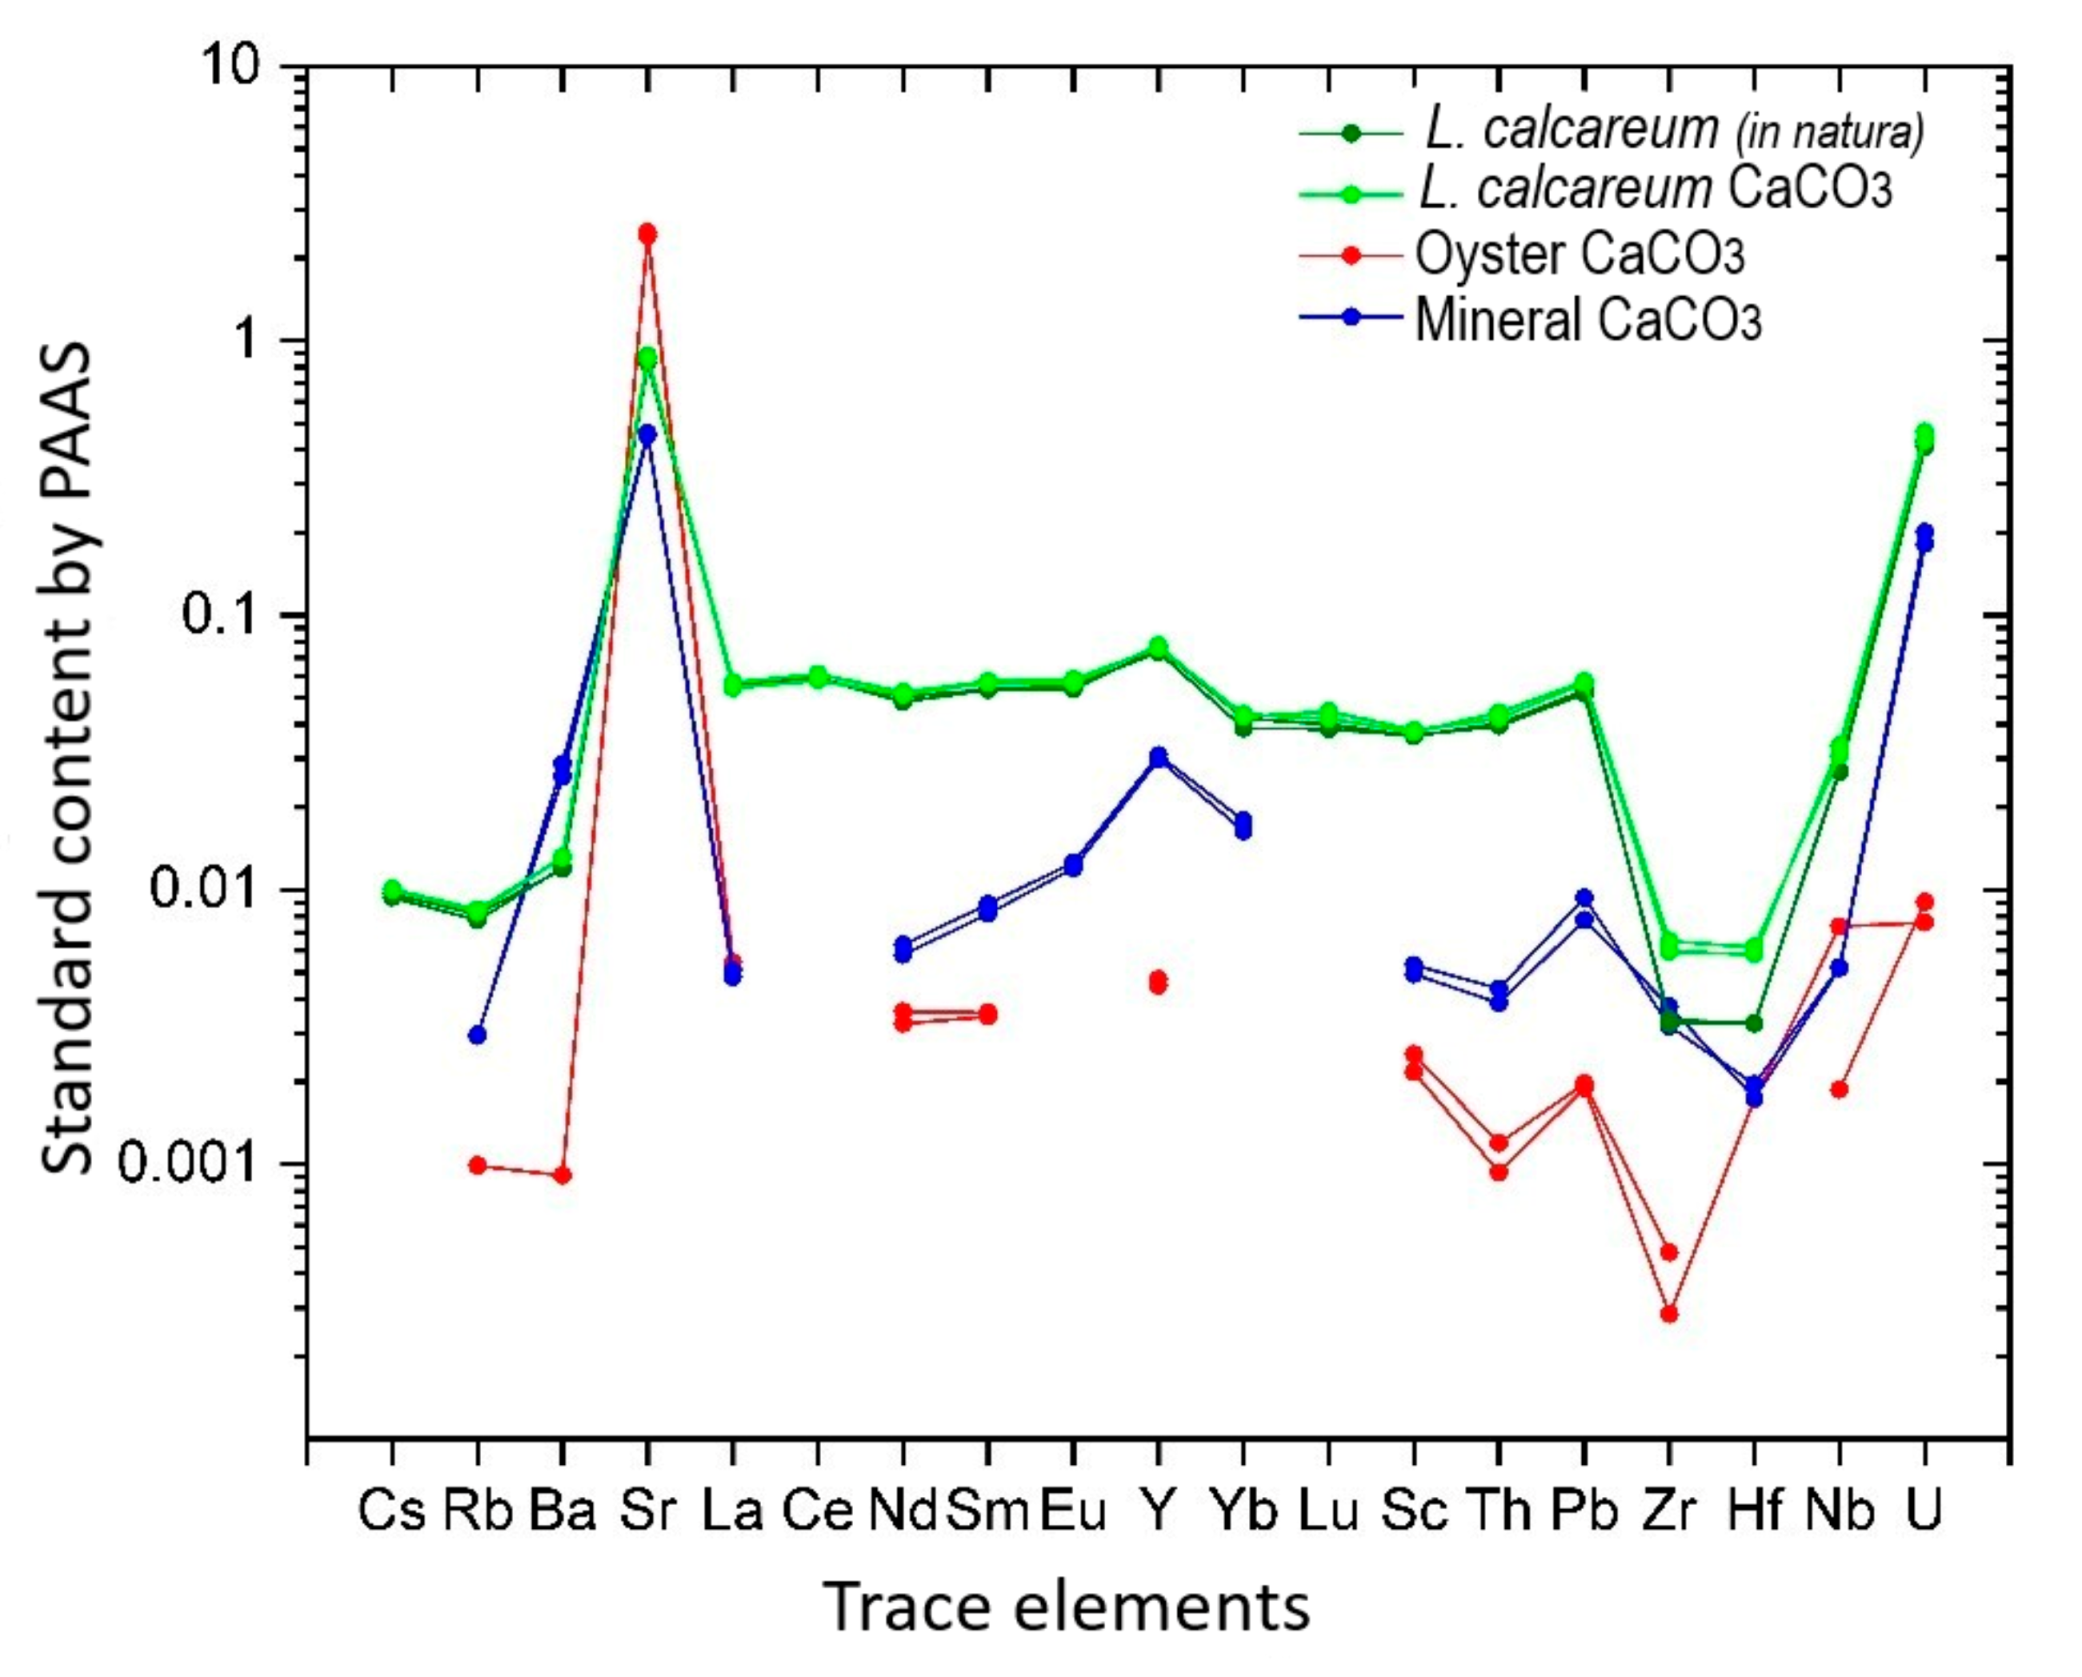
| Chemical Elements | L. calcareum | Mineral CaCO3 | Oyster CaCO3 | |||
|---|---|---|---|---|---|---|
| Sc | 0.50 | 0.49 | 0.07 | 0.07 | 0.03 | 0.03 |
| Rb | 0.87 | 0.91 | 0.33 | 0.33 | 0.11 | 0.11 |
| Sr | 291.0 | 307.8 | 158 | 161 | 868 | 842 |
| Y | 1.61 | 1.67 | 0.66 | 0.68 | 0.10 | 0.10 |
| Zr | 0.64 | 0.62 | 0.71 | 0.60 | 0.09 | 0.05 |
| Nb | 0.32 | 0.33 | 0.06 | 0.06 | 0.02 | 0.09 |
| Cs | 0.04 | 0.04 | < 0.01 | < 0.01 | < 0.01 | < 0.01 |
| Ba | 6.63 | 6.54 | 14.2 | 15.80 | < 0.50 | 0.50 |
| La | 1.65 | 1.63 | 0.14 | 0.15 | 0.16 | 0.16 |
| Ce | 3.79 | 3.73 | < 0.01 | < 0.01 | < 0.01 | < 0.01 |
| Pr | 0.35 | 0.37 | 0.04 | 0.04 | 0.03 | 0.02 |
| Nd | 1.26 | 1.32 | 0.15 | 0.16 | 0.09 | 0.08 |
| Sm | 0.24 | 0.24 | 0.04 | 0.04 | 0.02 | 0.02 |
| Eu | 0.05 | 0.05 | 0.01 | 0.01 | < 0.01 | < 0.01 |
| Gd | 0.26 | 0.23 | 0.05 | 0.05 | 0.02 | 0.02 |
| Tb | 0.03 | 0.03 | < 0.01 | < 0.01 | < 0.01 | < 0.01 |
| Dy | 0.18 | 0.19 | 0.05 | 0.06 | 0.01 | 0.01 |
| Ho | 0.04 | 0.04 | 0.01 | 0.02 | < 0.01 | < 0.01 |
| Er | 0.10 | 0.10 | 0.04 | 0.04 | < 0.01 | < 0.01 |
| Tm | 0.01 | 0.02 | < 0.01 | < 0.01 | < 0.01 | < 0.01 |
| Yb | 0.09 | 0.09 | 0.04 | 0.04 | < 0.01 | < 0.01 |
| Lu | 0.01 | 0.01 | < 0.01 | < 0.01 | < 0.01 | < 0.01 |
| Hf | 0.02 | 0.02 | 0.01 | 0.01 | < 0.01 | 0.01 |
| Pb | 0.88 | 0.90 | 0.13 | 0.16 | 0.03 | 0.03 |
| Th | 0.42 | 0.43 | 0.04 | 0.05 | 0.01 | 0.01 |
| U | 1.15 | 1.19 | 0.51 | 0.56 | 0.03 | 0.02 |
Publisher’s Note: MDPI stays neutral with regard to jurisdictional claims in published maps and institutional affiliations. |
© 2021 by the authors. Licensee MDPI, Basel, Switzerland. This article is an open access article distributed under the terms and conditions of the Creative Commons Attribution (CC BY) license (https://creativecommons.org/licenses/by/4.0/).
Share and Cite
da Silva, R.P.; Kawai, G.S.D.; Andrade, F.R.D.d.; Bezzon, V.D.N.; Ferraz, H.G. Characterisation and Traceability of Calcium Carbonate from the Seaweed Lithothamnium calcareum. Solids 2021, 2, 192-211. https://0-doi-org.brum.beds.ac.uk/10.3390/solids2020013
da Silva RP, Kawai GSD, Andrade FRDd, Bezzon VDN, Ferraz HG. Characterisation and Traceability of Calcium Carbonate from the Seaweed Lithothamnium calcareum. Solids. 2021; 2(2):192-211. https://0-doi-org.brum.beds.ac.uk/10.3390/solids2020013
Chicago/Turabian Styleda Silva, Rosana Pereira, Giovanna Sayuri Domingues Kawai, Fabio Ramos Dias de Andrade, Vinicius Danilo Nonato Bezzon, and Humberto Gomes Ferraz. 2021. "Characterisation and Traceability of Calcium Carbonate from the Seaweed Lithothamnium calcareum" Solids 2, no. 2: 192-211. https://0-doi-org.brum.beds.ac.uk/10.3390/solids2020013