Article

Composites of (C4F)n and (CF)n Synthesized by Uncatalyzed Fluorination of Graphite

1
Department of Organic Materials Science, Sandia National Laboratories, Albuquerque, NM 87185, USA
2
Power Sources Research and Development, Sandia National Laboratories, Albuquerque, NM 87185, USA
3
Nanoscale Sciences Department, Sandia National Laboratories, Albuquerque, NM 87185, USA
4
ACC Consulting New Mexico, Cedar Crest, NM 87008, USA
5
Department of Photovoltaics and Materials Technology, Sandia National Laboratories, Albuquerque, NM 87185, USA
*
Author to whom correspondence should be addressed.
Submission received: 11 March 2022 / Revised: 22 April 2022 / Accepted: 23 April 2022 / Published: 29 April 2022

Abstract

:
A new solid-state 19 F magic-angle spinning NMR signal at an isotropic 19 F chemical shift of −53 ppm is measured from graphite fluoride synthesized by reaction of graphite with F 2 at temperatures above 750 K with no catalyst. Two-dimensional NMR suggests the −53 ppm 19 F NMR signal originates from covalent fluoromethanetriyl groups belonging to ordered (C y F) n bulk domains composited with the major (CF) n domains. Quantitative 19 F and 13 C NMR find y = 4.32 ± 0.64 . DFT calculations of NMR chemical shifts for unsaturated fluorographene models show that a (C 4 F) n phase with fluorine bound covalently to a single side of the carbon layer best explains the observed NMR chemical shifts. We assign the new phase to this (C 4 F) n structure, which constitutes up to 15% of the carbon in our graphite fluoride composites. The (C 4 F) n content of the composite affects bulk electrochemical properties in a manner similar to graphite fluorides produced by conventional, catalyzed fluorination processes.

1. Introduction

Carbon fluorides, often labeled CF x , are a class of materials in which fluorine is bound to carbon frameworks in a composition with average F:C atomic ratio x. The earliest known and most important subclass of CF x are the graphite fluorides (GFs), where graphite is the carbon source. Covalent and lamellar intercalation of fluorine into graphite can be achieved. Covalent GFs are synthesized in F 2 atmosphere by holding graphite at temperatures between roughly 650 K and 900 K [1,2,3]. This produces poly(dicarbon monofluoride), (C 2 F) n , and poly(carbon monofluoride), (CF) n , with higher temperatures favoring the latter [3,4]. Lamellar graphite fluorides, often called fluorine graphite intercalation compounds (F-GICs), are based upon the intercalation of ionic F with limited covalent C–F bond formation and are synthesized in F 2 atmosphere at temperatures usually less than 400 K in the presence of a fluorine-containing Lewis acid catalyst [5,6,7,8]. Well-defined F-GIC compositions ranging from stage-1 C 1.1 F to stage-4 C 16 F and higher have been reported [7,8,9], with variables such as graphite morphology (natural, HOPG, etc.) and catalyst formulation influencing F-GIC composition and structure. The versatility of F-GIC chemistry was expanded further with the emergence of “post-fluorination” strategies, permitting partial or full conversion of an F-GIC into a covalent GF [10,11].
Canonical GF structural models were introduced in 1947 by Rüdorff and Rüdorff, using (CF) n and poly(tetracarbon monofluoride), (C 4 F) n , as archetypes for the covalent [12] and lamellar F-GICs [5], respectively. (CF) n was described as an infinite network of fused cyclohexane chairs with fluorine atoms occupying axial positions yielding a hexagonal crystal structure involving sp 3 hybridized carbon. (C 4 F) n was described as stage-1 intercalation compound with interleaved hexagonal arrays of fluoride each bound to single carbon atoms across planar, sp 2 hybridized graphene layers. Such C(sp 2 )–F bonds were later referred to as “semi-ionic” [13,14]. The Rüdorff (C 4 F) n model of F-GIC structure was refined to account for the intercalation of truly ionic F and the wide range of observed intercalant staging [15,16,17], but the semi-ionic bond concept was eventually recognized as deficient when evidence accumulated revealing that C–F bonds in many stage-1 and stage-2 F-GICs possessed essentially sp 3 carbon hybridization [18,19,20,21,22,23]. Hyperconjugation with nearest neighbor sp 2 hybridized carbon nonetheless fundamentally modifies the covalent C(sp 3 )–F bond character, which is elongated and weakened in F-GICs compared to fully covalent GFs [22,23]. Complicating structural interpretation further is the nontrivial role played by intercalated catalyst species with regard to promoting a particular balance of ionic and covalent bonding motifs [24].
Compared to F-GICs, the structure of covalent GFs is considered well-understood. By 1980, the year Watanabe introduced the presently accepted diamane model of covalent (C 2 F) n [25], debate over framework polymorphism in (CF) n was settling in favor of the hexagonal Rüdorff structure [3]. Even recent work from our laboratories describing how (CF) n polymorphism manifests as disorder of the carbon framework in real carbon fluoride samples does not invalidate the hexagonal Rüdorff structure as the quintessential (CF) n polymorph [26].
This brings us to our present discovery. Our laboratories have developed an interest in mechanisms controlling the discharge of lithium electrochemical cells using CF x as the active cathode material [27,28]. When evaluating (CF) n formation in covalent GFs by high-resolution solid-state 19 F magic-angle spinning (MAS) NMR during the course of this work, we observed a minor but significant new 19 F NMR signal with an isotropic chemical shift of −53 ppm. What follows are results from a multidimensional 19 F and 13 C solid-state NMR investigation into the structural origin of this new 19 F GF NMR signal at −53 ppm, bolstered by density functional theory (DFT) calculations of NMR chemical shifts. From experimental NMR we infer that the new GF signal originates from fluorine-deficient GF domains with a C:F ratio roughly between 3:1 and 6:1. The C–F bonding character within these domains is unmistakably covalent. NMR chemical shifts calculated for a (C 4 F) n structure where all fluorine is covalently bound to a single side of the graphene layer are in good agreement experimentally measured 19 F and 13 C chemical shifts, leading us to propose that our GFs are composites of (CF) n layers interspersed with (C 4 F) n layers expressing single-sided fluorination. Although we refer to these (C 4 F) n domains as covalent, C–F bonds are significantly elongated by hyperconjugation to nearest neighbor sp 2 carbon, just as with non-ionic F in F-GICs. After briefly examining the bulk electrochemical properties of these covalent GF composites, we close by discussing the significance of the single-sided attachment of fluorine in the new covalent (C 4 F) n phase we identify.

2. Results

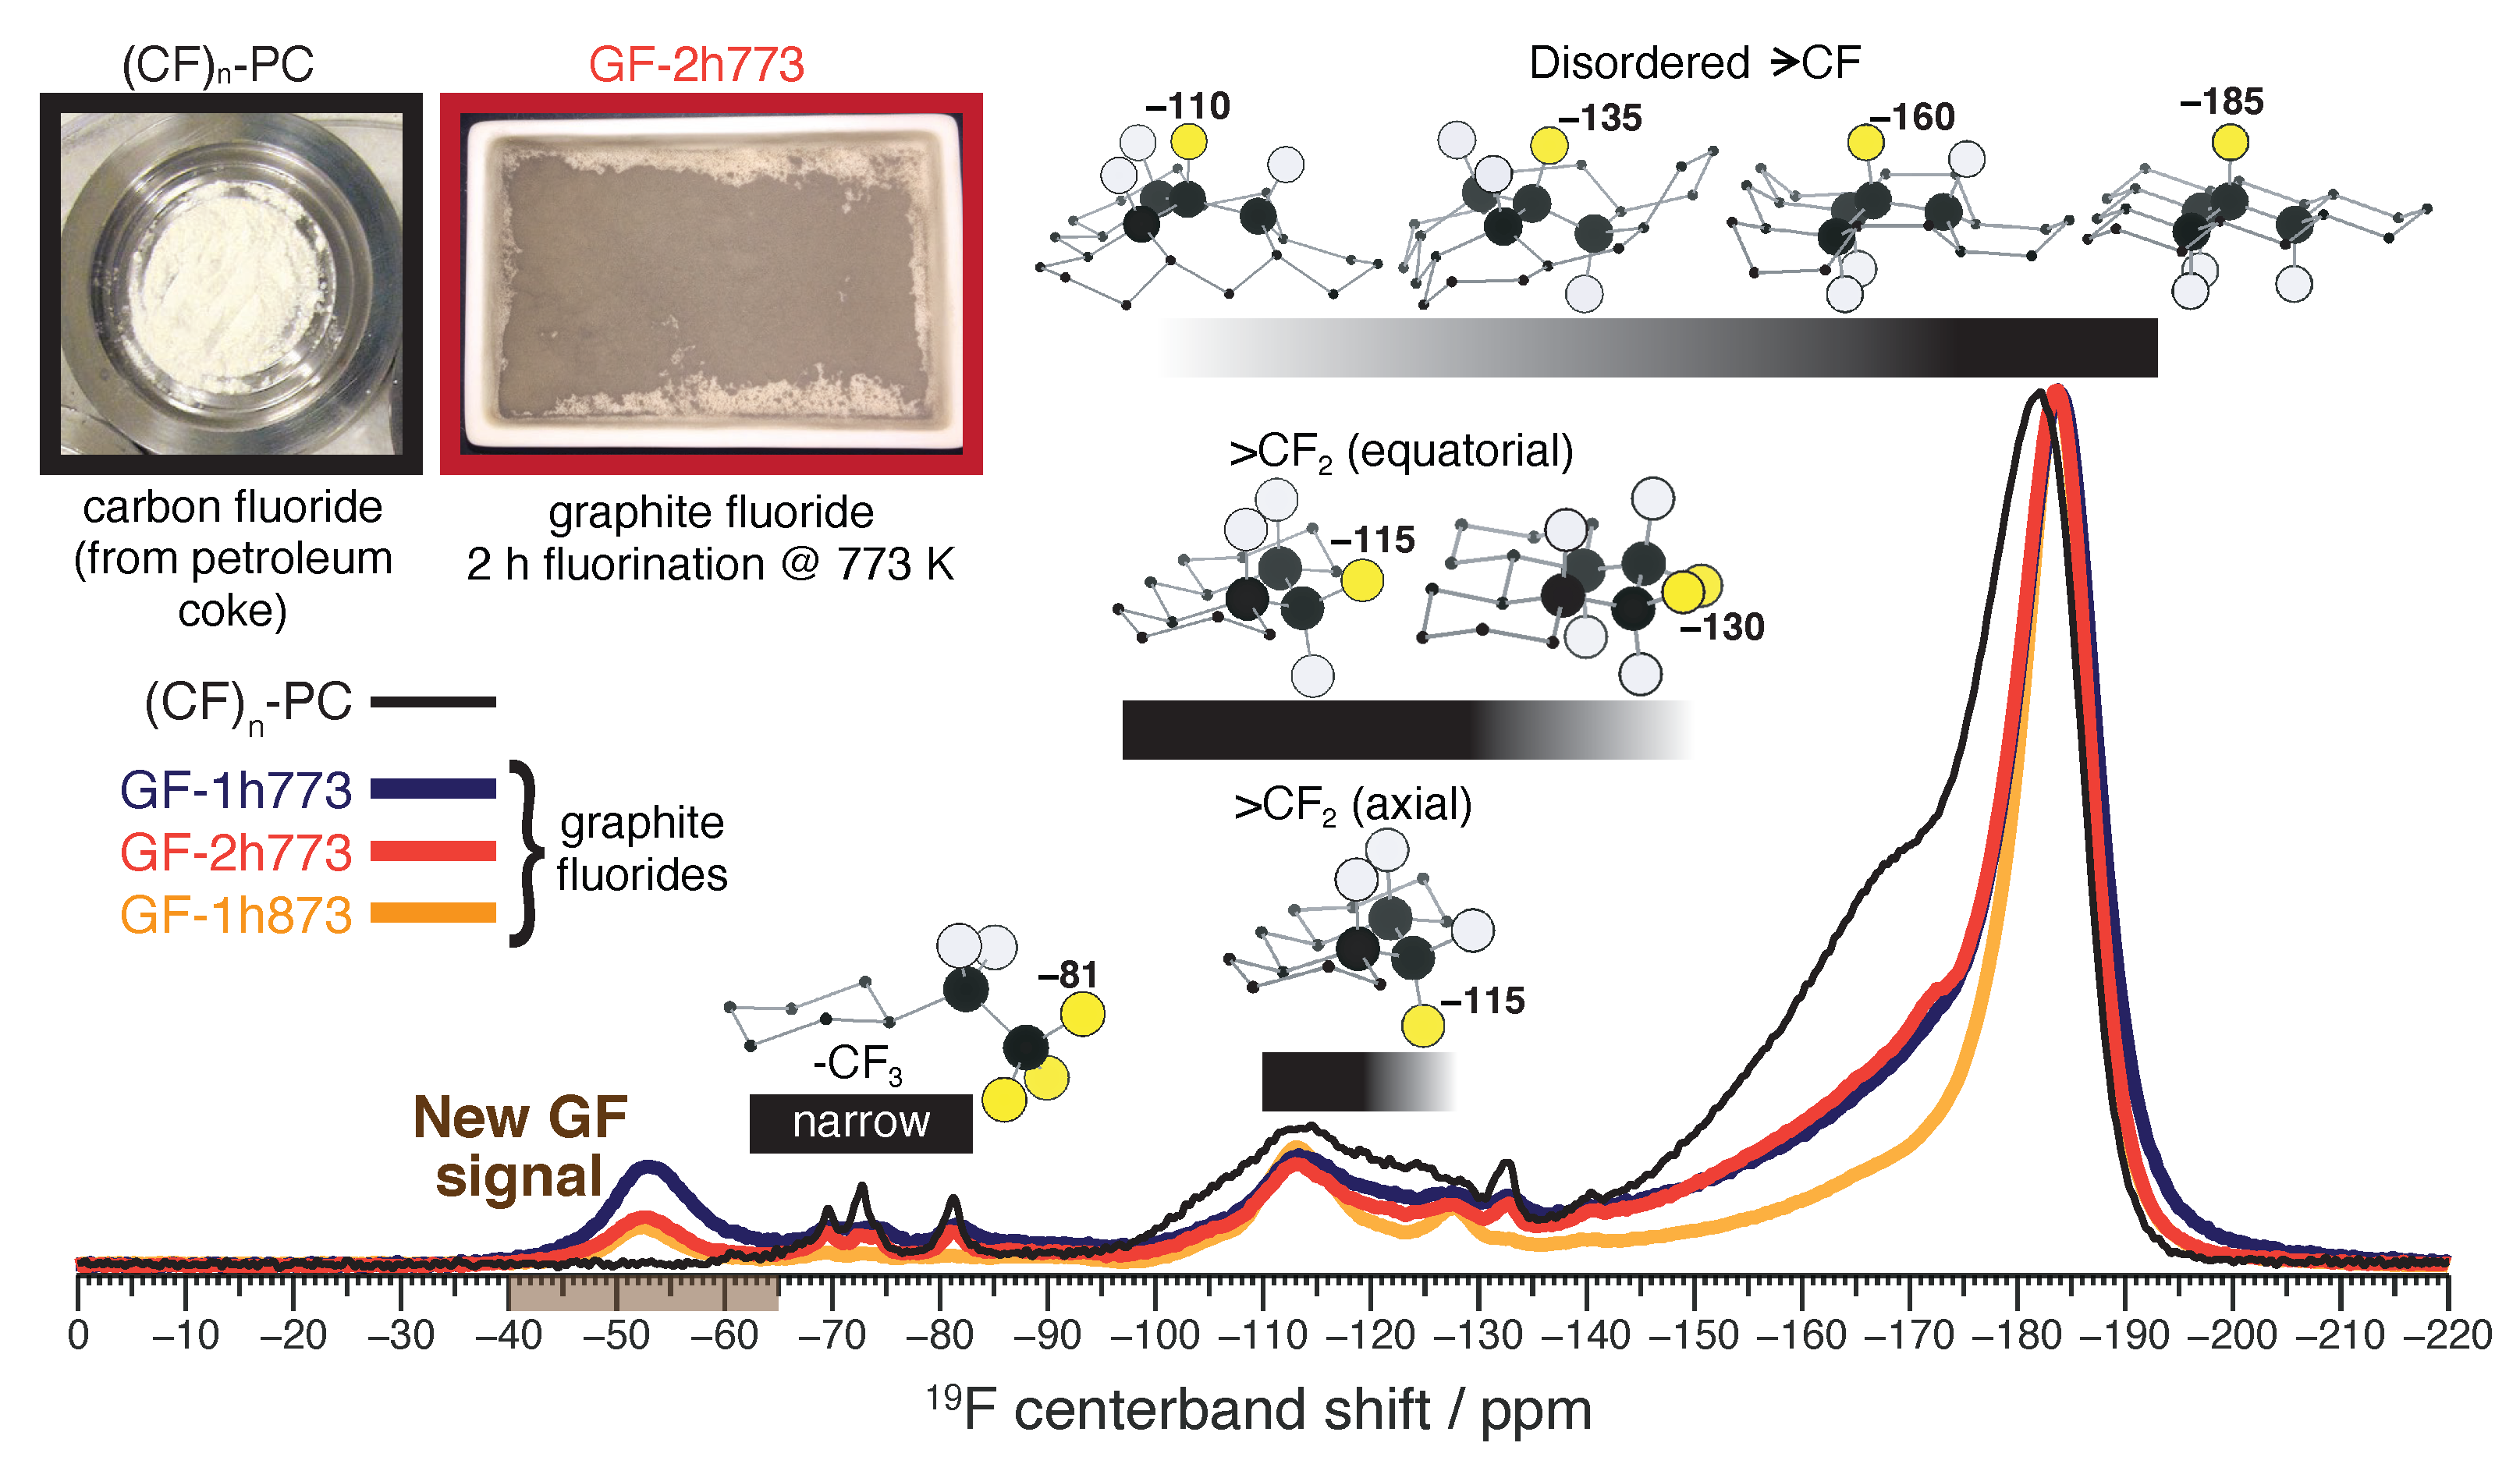
2.1. Fluorine-19 MAS NMR: A New Spectral Signature from Graphite Fluorides

Figure 1 shows solid-state 19 F centerband MAS NMR spectra for four carbon fluoride samples. Three of the spectra are from graphite fluorides (GFs) synthesized in a fluorination furnace at high temperature from high purity crystalline graphite. GF-1h773 (purple) was fluorinated at 773 K (500 °C) for one hour; GF-2h773 (red), at 773 K for two hours; GF-1h873 (orange), at 873 K (600 °C) for one hour. The spectrum of commercial poly(carbon monofluoride) made using petroleum coke as a carbon source, labeled here as (CF) n -PC, is shown as a reference. An ordered, crystalline sample of hexagonal (CF) n should give a single peak at a 19 F chemical shift near −187 ppm originating from chemically equivalent fluoromethanetriyl ( CF ) functional groups [29]. Such a 19 F NMR signal is the dominant feature in all carbon fluoride spectra shown in Figure 1, but a prominent wing extending up to roughly −130 ppm protrudes from this dominant peak. While carbon fluoride 19 F NMR signals in this region are usually assigned to CF deshielded by adjacent sp 2 hybridized (bare) carbon atoms [30,31], we recently reported that this batch of (CF) n -PC material contains no bare carbon. With the support of multidimensional NMR and DFT calculations, we assigned this wing to framework disorder in the vicinity of CF groups [26]. The 19 F deshielding effect due to framework disorder broadly correlates with the number of neighboring CF that are mutually aligned with the central CF group (crudely, +25 ppm/aligned C–F bond), as illustrated by the models of disordered CF shown in Figure 1. The wing is about twice as intense for (CF) n -PC compared to the GF samples, suggesting that the crystallinity of the graphite source (see XRD, Figure S1) leads to a greater degree of framework order in the GFs. The degree of disorder in GF-1h873, synthesized at the highest temperature, is especially low. These results regarding disorder are consistent with the findings of previous studies [3,32]. We also observe 19 F NMR signals from difluoromethylene (>CF 2 ) functional groups, appearing in the region between −150 ppm and −95 ppm, indicating that the fluorinated edges of carbon layers are saturated [29]. About 10% of the 19 F NMR signal originates from >CF 2 for all GF samples, indicating that, just as for (CF) n -PC, the characteristic size of a fluorinated carbon layer in our GF samples is just a few nanometers across [33]. A small cluster of narrow peaks between 8 5 ppm and −65 ppm show that a small number of trifluoromethyl (-CF 3 ) groups are present in all samples.
The broad similarities between the 19 F NMR spectra of (CF) n -PC and our GF samples confirms that poly(carbon monofluoride) is the primary constituent of each material, with (CF) n in the GF samples being rather more crystalline than (CF) n in the sample derived from petroleum coke. Nevertheless, we also observe a significant 19 F NMR signal, near −53 ppm, that is entirely unique to the GFs. The intensity of this new GF NMR signal follows the trend GF-1h773 > GF-2h773 > GF-1h873. To the best of our knowledge, this is the first observation of a chemically distinct signal near −53 ppm in the high-resolution 19 F MAS NMR spectrum of any carbon fluoride.
Our goal is to determine the structural origin of this new 19 F GF NMR signal at −53 ppm.

2.2. Carbon-13 CP MAS NMR: Evidence for a Fluorine-Deficient Graphite Fluoride Composition

Figure 2 shows { 19 F } 13 C cross-polarization (CP) CPMG MAS NMR spectra of (CF) n -PC and our GF samples. CP both selects for and enhances the sensitivity of 13 C nuclei in the vicinity of 19 F nuclei, yielding high-resolution 13 C MAS NMR signals from fluorinated phases. Since both samples are mainly (CF) n , the CF peak at +90 ppm dominates [29]. The framework disorder responsible for the CF wing in the 19 F spectra causes a similar downfield extension of the CF 13 C NMR signal from (CF) n -PC as compared to the CF peak from the relatively crystalline GF-1h773 [26]. Carbon-13 NMR signals from >CF 2 groups, near +115 ppm, are also observed from both samples. Discernible contributions from -CF 3 groups, near +123 ppm, are lacking. Importantly, the 13 C CP NMR spectra of the GF samples exhibit signals near +141 ppm and +50 ppm, both of which are lacking from the 13 C CP NMR spectrum of (CF) n -PC. The very weak signals near +50 ppm indicates quaternary, diamond-like sp 3 hybridized carbon that occur in association with covalent C–C bonds that bridge adjacent carbon sheets [34]. The resulting fluorodiamane cages yield the archetypical poly(dicarbon monofluoride) structure, (C 2 F) n , which is ordinarily produced from crystalline graphite at temperatures around 650 K [3,25].
The 13 C CP NMR signal near +141 ppm indicates sp 2 hybridized bare carbon species within fluorinated domains. Such 13 C species have been observed by { 19 F } 13 C CP NMR near +141 ppm in partially unfluorinated covalent GFs synthesized from post-fluorinated F-GICs or graphitized carbon nanofibers [35,36]. Close inspection also shows a small 13 C CP NMR signal at +79 ppm in the GFs, appearing near the base of the dominant covalent CF peak at +90 ppm. The intensity of the +79 ppm and +141 ppm features follow the trend GF-1h773 > GF-2h773 > GF-1h873, the same intensity trend observed for the −53 ppm GF 19 F NMR signal, suggesting meaningful associations between them.

2.3. Two-Dimensional {19F}13C CP HETCOR CPMG NMR: Indication of Covalent C–F Bonds

A firmer insight into the relationship between carbon and the new −53 ppm GF 19 F NMR signal is obtained using 2D { 19 F} 13 C cross-polarization heteronuclear correlation (CP HETCOR) NMR [37]. CP HETCOR produces NMR signals that correlate the NMR frequencies of spatially proximate 19 F and 13 C nuclei in rigid solids. Figure 3 shows a 2D { 19 F } 13 C CP HETCOR NMR spectrum of GF-1h773, acquired at a CP contact time of 1250 μ s. The dominant NMR signal in this CP HETCOR experiment occurs at a ( 13 C, 19 F) shift of (+90,−184) ppm, corresponding to a one-bond chemical shift correlation within the CF groups of crystalline (CF) n . Significant correlation between the 19 F spectral wing from −170 ppm to −140 ppm and 13 C shifts near +91 ppm suggests disordered CF in (CF) n . The 2D CP HETCOR of (CF) n -PC was reported in previous work; here, the 19 F spectral wing correlated to 13 C shifts near +93.5 ppm [26], again consistent with the greater degree of framework disorder in (CF) n -PC relative to our GF samples. One- and two-bond correlations of 19 F in rigid >CF 2 groups appear near ( 13 C, 19 F) shifts of (+113,−115) ppm and (+88,−115) ppm ( 13 C of an adjacent CF group), respectively. CP HETCOR signals from flexible >CF 2 segments, consisting of chains of consecutive >CF 2 at convex sheet edges, are suppressed on account of additional motional degrees of freedom available to these chains [26].
The −53 ppm 19 F GF NMR signal yields two significant correlations to 13 C, one near a ( 13 C, 19 F) shift of (+141,−52) ppm and the other near (+78,−51) ppm, confirming an association between these fluorine and carbon species on a molecular level. From experimental studies of covalent C–F bonds in F-GICs, it is known that hyperconjugation with neighboring sp 2 hybridized carbon atoms isotropically shields the 13 C nucleus of the detected CF group, in addition to the aforementioned isotropic 19 F deshielding effect. For such F-GICs, 13 C shifts as low as +82 ppm are reported, along with 19 F shifts near −145 ppm [38,39,40,41]. Considering the corresponding shifts of ordinary covalent CF groups in the (CF) n phase, these 13 C shielding/ 19 F deshielding trends are of the right sign to assign the ( 13 C, 19 F) HETCOR NMR signal at (+78,−51) ppm to elongated C–F bonds from CF groups, which is supported by the strong correlation between −53 ppm fluorine to bare carbon. The anomalous magnitude of 13 C shielding (12 ppm, relative to ordinary covalent CF ) and 19 F deshielding (133 ppm) we observe here, when compared to 4–8 ppm ( 13 C shielding) and 30–60 ppm ( 19 F deshielding) for typical cases of C–F hyperconjugation [31], suggests that the degree of hyperconjugation experienced by these CF groups is extreme.
This assignment to extremely hyperconjugated, covalent CF is validated by a second CP CPMG HETCOR experiment using a shorter CP contact time of 125 μ s (contour plot shown in Figure S2), which enhances the contrast of one-bond 13 C and 19 F correlations. The comparison between the short and long contact times for 13 C correlations to the −53 ppm 19 F GF NMR signal is shown in Figure 3 in the right-hand column along the 1D profile ‘a’. Whereas the correlation to the 13 C NMR signal at +141 ppm is stronger than the correlation to +78 ppm at 1250 μ s (red), the opposite is observed in the experiment using the 125 μ s contact time (blue). We infer that the 2D HETCOR NMR signal at a ( 13 C, 19 F) shift of (+78,−51) ppm encodes a one-bond C/F correlation, whereas the signal at (+141,−52) ppm encodes (2+)-bond C/F correlations. This strengthens our confidence in the assignment to covalent CF , in spite of the extreme shielding values.
It is worth remarking upon other structural details that can be discerned by the comparison between the short and long contact time CP HETCOR experiments. Profile ‘b’ affirms the one- and two-bond associations previously mentioned for rigid >CF 2 groups. Profile ‘c’ reveals that a weak correlation builds in at the longer contact time between 19 F NMR signals near -170 ppm and interlayer bridging 13 C NMR signals at +49 ppm, close to recently reported 19 F shifts of -176 ppm for axial F on diamane cages in (C 2 F) n [42]. Profile ‘d’ shows a very weak correlation between bare carbon and CF in (CF) n at a ( 13 C, 19 F) shift of (+141,−184) ppm that is only visible at the longer CP contact time. The scantness of this correlation is remarkable considering that the vast majority of the GF sample is composed of CF groups within the (CF) n phase. Finally, profile ‘e’ shows correlations to 19 F at chemical shifts near −200 ppm. Here we see not only correlations to 13 C shifts near +90 ppm but also a form of disordered carbon producing 13 C chemical shifts upfield to +65 ppm. The latter correlation corresponds to a ridge that emerges from the primary CF peak in the 2D spectrum (dashed line segment, Figure 3). The vertical CF edge groups of diamane sheets in (C 2 F) n are known to produce 19 F NMR signals below −200 ppm in carbon fluorides, which are expected to correlate to 13 C shifts around +90 ppm (Figure S3). This matches the narrow feature shown in profile ‘e’ but not the broader upfield feature. At present, we cannot explain the structural origin of the latter correlation.

2.4. Additional 19F NMR Characterization: Evidence for Distinct yet Well-Mixed Graphite Fluoride Phases

The absence of a significant ( 13 C, 19 F) correlation signal near (+90,−53) ppm in the 2D CP HETCOR experiment along with the nearly exclusive association of bare carbon to the CF site associated with the −53 ppm 19 F GF NMR signal suggests that these hyperconjugated CF groups are part of a distinct, generally fluorine deficient GF phase. To support this assessment, we analyzed 19 F longitudinal ( T 1 ) relaxation. Because 19 F is an abundant nucleus with a relatively high magnetic dipole moment, 19 F nuclei comprising the same material domain form a coupled network within which efficient spin diffusion occurs. This leads to approximately exponential longitudinal 19 F relaxation with recovery parameters that in many circumstances are the same for each 19 F site within the domain. Fluorine-19 nuclei that exist within another distinct and separate domain, however, commonly exhibit different relaxation properties compared to 19 F within the first domain [43]. Consistent with this description, Figure 4A shows the recovery of 19 F NMR signal after elimination of 19 F Zeeman order by a saturation pulse train for different parts of the 19 F NMR line shape. For the chemically distinct sites associated with the primary (CF) n phase (circles), the signal recovery trajectories cluster together well. The extremely hyperconjugated CF site (squares), however, traces a distinctly different trajectory during the initial stages of relaxation when τ rd < 1 s, supporting its assignment to a distinct material phase.
There is evidence that this new phase is not wholly magnetically isolated from the (CF) n component of the GF, however. In addition to the (very weak) ( 13 C, 19 F) correlation near (+141,−184) ppm shown in the 2D CP HETCOR of Figure 3 at long CP contact time, there are cross peaks corresponding to the exchange of magnetization between 19 F possessing chemical shifts of −53 ppm and −184 ppm that can be observed by 2D { 19 F} 19 F exchange NMR spectroscopy (EXSY), as indicated by the boxed regions of Figure 4B. Broadening of the main diagonal peak at (−53,−53) ppm is also observed in this 2D EXSY spectrum, consistent with the expected exchange of magnetization between hyperconjugated CF groups having slightly different 19 F chemical shifts within the new GF phase. Altogether, our data suggest that the GF phase hosting the new type of hyperconjugated CF comprises distinct domains, but that these domains are in contact with the primary (CF) n component.

2.5. Stoichiometric Analysis of the New Graphite Fluoride Domain by Quantitative NMR

Having identified that the −53 ppm 19 F NMR and +141 ppm 13 C NMR signals originate from a distinct GF phase, we use the intrinsically quantitative capabilities of NMR to determine the stoichiometric composition of this phase. Quantitative data from both 19 F NMR and 13 C NMR are required for this. The centerband 19 F NMR spectra shown in Figure 1 qualify on one end. Conventional { 19 F} 13 C CP NMR spectra do not qualify, so for 13 C NMR, we use our recently published quantitative method using direct 13 C excitation and FID acquisition under high power 19 F decoupling, followed by a long CPMG acquisition without 19 F decoupling [44]. The FID contains a conventional, high-resolution quantitative 13 C MAS NMR spectrum, whereas the CPMG train yields sensitivity enhanced 13 C NMR signal from unfluorinated carbon domains. The sensitivity enhancement can be estimated, allowing the extent of unfluorinated carbon to be quantified with a high degree of accuracy. Unfortunately, the 19 F nuclei of the hyperconjugated CF groups prevent the 13 C MAS NMR signals from the new GF phase from being enhanced by the CPMG train.
We assume the new GF phase is a carbon fluoride polymer of bulk composition (C y F) n , with the C:F atomic ratio y to be determined by our quantitative analysis. Our fit of the quantitative 19 F centerband NMR spectra is expressed in terms of the relative proportions of C y F, CF 3 , CF 2 , and CF units, as shown in Figure 5A for sample GF-1h773. We label these mole fractions f, f 3 , f 2 , and f 1 , respectively. Likewise, we fit the quantitative 13 C NMR spectra in terms of the relative proportions of bare C (sp 2 ), CF 2 , CF, bridging C (sp 3 ) units, and wholly unfluorinated domains, which are respectively labeled g, g 2 , g 1 , g 0 , and g u . The fit is shown in Figure 5B for all three GF samples. The poor S/N ratios of the quantitative 13 C MAS NMR spectra are obvious, with only the CF peak ( g 1 ) presenting prominently above noise. For this reason, the Gaussian functions used to fit the spectrum for the minor peaks g, g 2 , and g 0 were constrained by fixed shift and width parameters, using information derived from 13 C CP MAS NMR. Importantly, the integrated deviations from baseline are positive where these peaks are expected to emerge (except for g 0 from GF-1h873, so is omitted), and g (C y F) is statistically different from zero for both GF-1h773 and GF-2h773. To provide the utmost justification for fitting the quantitative 13 C spectra in spite of low S/N ratios, we subject the spectral region in the vicinity of the crucial C y F signal to the Anderson–Darling normality test [45]. The null hypothesis being tested is that quantitative 13 C NMR spectral intensity near +141 ppm in each of the three GF spectra is generated by white spectral (Gaussian) noise. At an 85% level of confidence, we find for each of the GF samples that this null hypothesis is rejected; for GF-1h773, the significance level exceeds 99.99% [46]. An adjacent signal-free region was also analyzed by the Anderson–Darling test as a control for each quantitative 13 C NMR spectrum; the null hypothesis cannot be rejected for these noise regions at the 85% level of confidence. A detailed overview of the Anderson–Darling test results are described in Figure S4 and its caption.
Precise mole fractions from the spectral fitting for each sample are given in Table 1 for quantitative 19 F NMR (f fractions) and Table 2 for quantitative 13 C NMR (g fractions). To solve for y, we note that f fractions sum to unity, as do the g fractions. Since the atomic ratio of C:F for each f site is given, we renormalize the f fraction sum with respect to the carbon mole fraction,
D = f 1 + 1 2 f 2 + y f ,
where D is the mol F → mol C renormalization constant. We omit the tiny contribution of ( 1 / 3 ) f 3 for model consistency as we cannot ascertain a contribution from -CF 3 in the 13 C NMR spectra in Figure 5B. The intensity fraction f can be related to g, keeping in mind that while the (C y F) n phase is the sole contributor to the −53 ppm 19 F GF NMR signal (peak f), it contributes 1 / y units of spectral intensity to g 1 and ( y 1 ) / y units of intensity to g per C y F formula unit. Since the contribution from (C y F) n to the well-resolved peak g is exclusive, we equate the renormalized f intensity fraction to ( y 1 ) / y units from g to find
y 1 D f = 1 1 g u g .
The ( 1 g u ) 1 factor is included because regardless of quantity, unfluorinated carbon domains make no intensity contribution whatsoever to the 19 F NMR spectrum, forcing renormalization of the g factors with the contribution from g u omitted. Defining g = g / ( 1 g u ) and s = f 1 + f 2 / 2 for convenience, we solve for y in Equation (2) with the result:
y = f + g s f ( 1 g ) .
Values of y determined for each GF sample by this analysis are displayed in the table contained within Figure 5A. Scatter in y is large, with nearest integer y values of 5, 6, and 2 found for GF-1h773, GF-2h773, and GF-1h873, respectively. The relatively large error reported on y, about ± 2 at a 95% confidence level, is inherited mostly from the large error on g, itself due to the very low S/N ratio of the 13 C NMR signal at +141 ppm. Given the consistent manifestation of the NMR signals we attribute to (C y F) n across the three samples, is reasonable to treat the analyses as three independent, unbiased determinations of the same fixed quantity. Thus, we present the average the three y values for each sample as the final result of our quantitative NMR analysis, giving (C 4.32 ± 0.64 F) n as the bulk composition of the new GF phase.
We acknowledge several sources of small systematic errors in this quantitative analysis. First, thermal equilibrium of the 19 F nuclei was not attained as the interscan delay τ rd in these 19 F experiments was just 2 s. Figure 4A shows equilibrium is established for τ rd 10 s and suggests the intensity of f is biased a few percent too low for τ rd = 2 s. Post hoc adjustment of f by +5% lowers y by a similar amount, to 4.86, 5.47, and 2.17 for GF-1h773, GF-2h773, and GF-1h873, respectively. Second, small contributions from 19 F spinning sidebands are dropped, but this affects different sites to similar degrees, affecting results to only about the 1% level. Third, we note a broad shelf of 19 F spectral intensity between −100 ppm and −60 ppm, unique to our GF samples. We speculate this shelf results from sp 2 hybridized >CF edge groups and assign this intensity to f 1 (F:C = 1), but this could be misattributed. Its contribution to the total 19 F signal never exceeds 7%, with a contribution to error y of the same order. If this shelf is due to >CF 2 groups, the true value of y becomes higher than our determined values. Finally, we recognize that our model of peak g 1 has negligible intensity at +78 ppm, where hyperconjugated CF contributes. The actual 13 C NMR spectral intensity at +78 ppm is barely perceptible even in the high S/N CP spectra shown in Figure 2; including this contribution would raise g 1 by a few percent at most, consequently lowering g and y on the order of 1%.
All known contributions from systematic error are smaller than that contributed by random error on g, and do not necessarily have the same sign. Therefore, our determination of y is accurate, if imprecise.

2.6. Calculation of NMR Chemical Shifts: Support for Layers with Single-Sided Fluorination

Our determination of a (C 4.32 ± 0.64 F) n bulk composition for the new GF phase is most consistent with a stoichiometric covalent graphite fluoride phase poly(tetracarbon monofluoride), (C 4 F) n , but other stoichiometric phases such as (C 3 F) n cannot be excluded given the size of the error on the C:F ratio determined by our quantitative analysis. To screen other candidate compositions, we created molecular models of unsaturated fluorographene (Figure S5) whose central cores possess atomic arrangements of F that, upon tessellation of the specified core pattern, yields the extended 2D structure of a well-ordered, fluorine-deficient covalent GF polymorph. For each model, 19 F and 13 C NMR chemical shift values were calculated by density functional theory (DFT), which are compared with the experimental NMR chemical shifts we have assigned to the new GF phase: −53 ppm ( 19 F, CF ), +79 ppm ( 13 C, CF ), and +141 ppm ( 13 C, C(sp 2 )). It must be noted that such gas phase molecular models cannot capture the effects of layer stacking. While stacking has only a small effect (a few ppm) on calculated chemical shifts relative to gas phase calculations [47], it plays an important role in stabilizing a planar carbon framework [48]. Consistent with this, we found that the gas phase models shown in Figure S5 buckled or curled to varying degrees during unconstrained DFT geometry optimization. This problem was overcome by multiple stages of constrained optimization, as described in the Methods section.
Dozens of patterns of covalently bound C–F among bare carbon have been proposed as structural models for various carbon fluorides, but we can exclude most of them immediately by imposing two rules upon the candidates:
  • The structure contains only “isolated” CF groups, i.e., CF whose three framework bonds are all to bare, sp 2 hybridized framework carbon.
  • All valence electrons are paired.
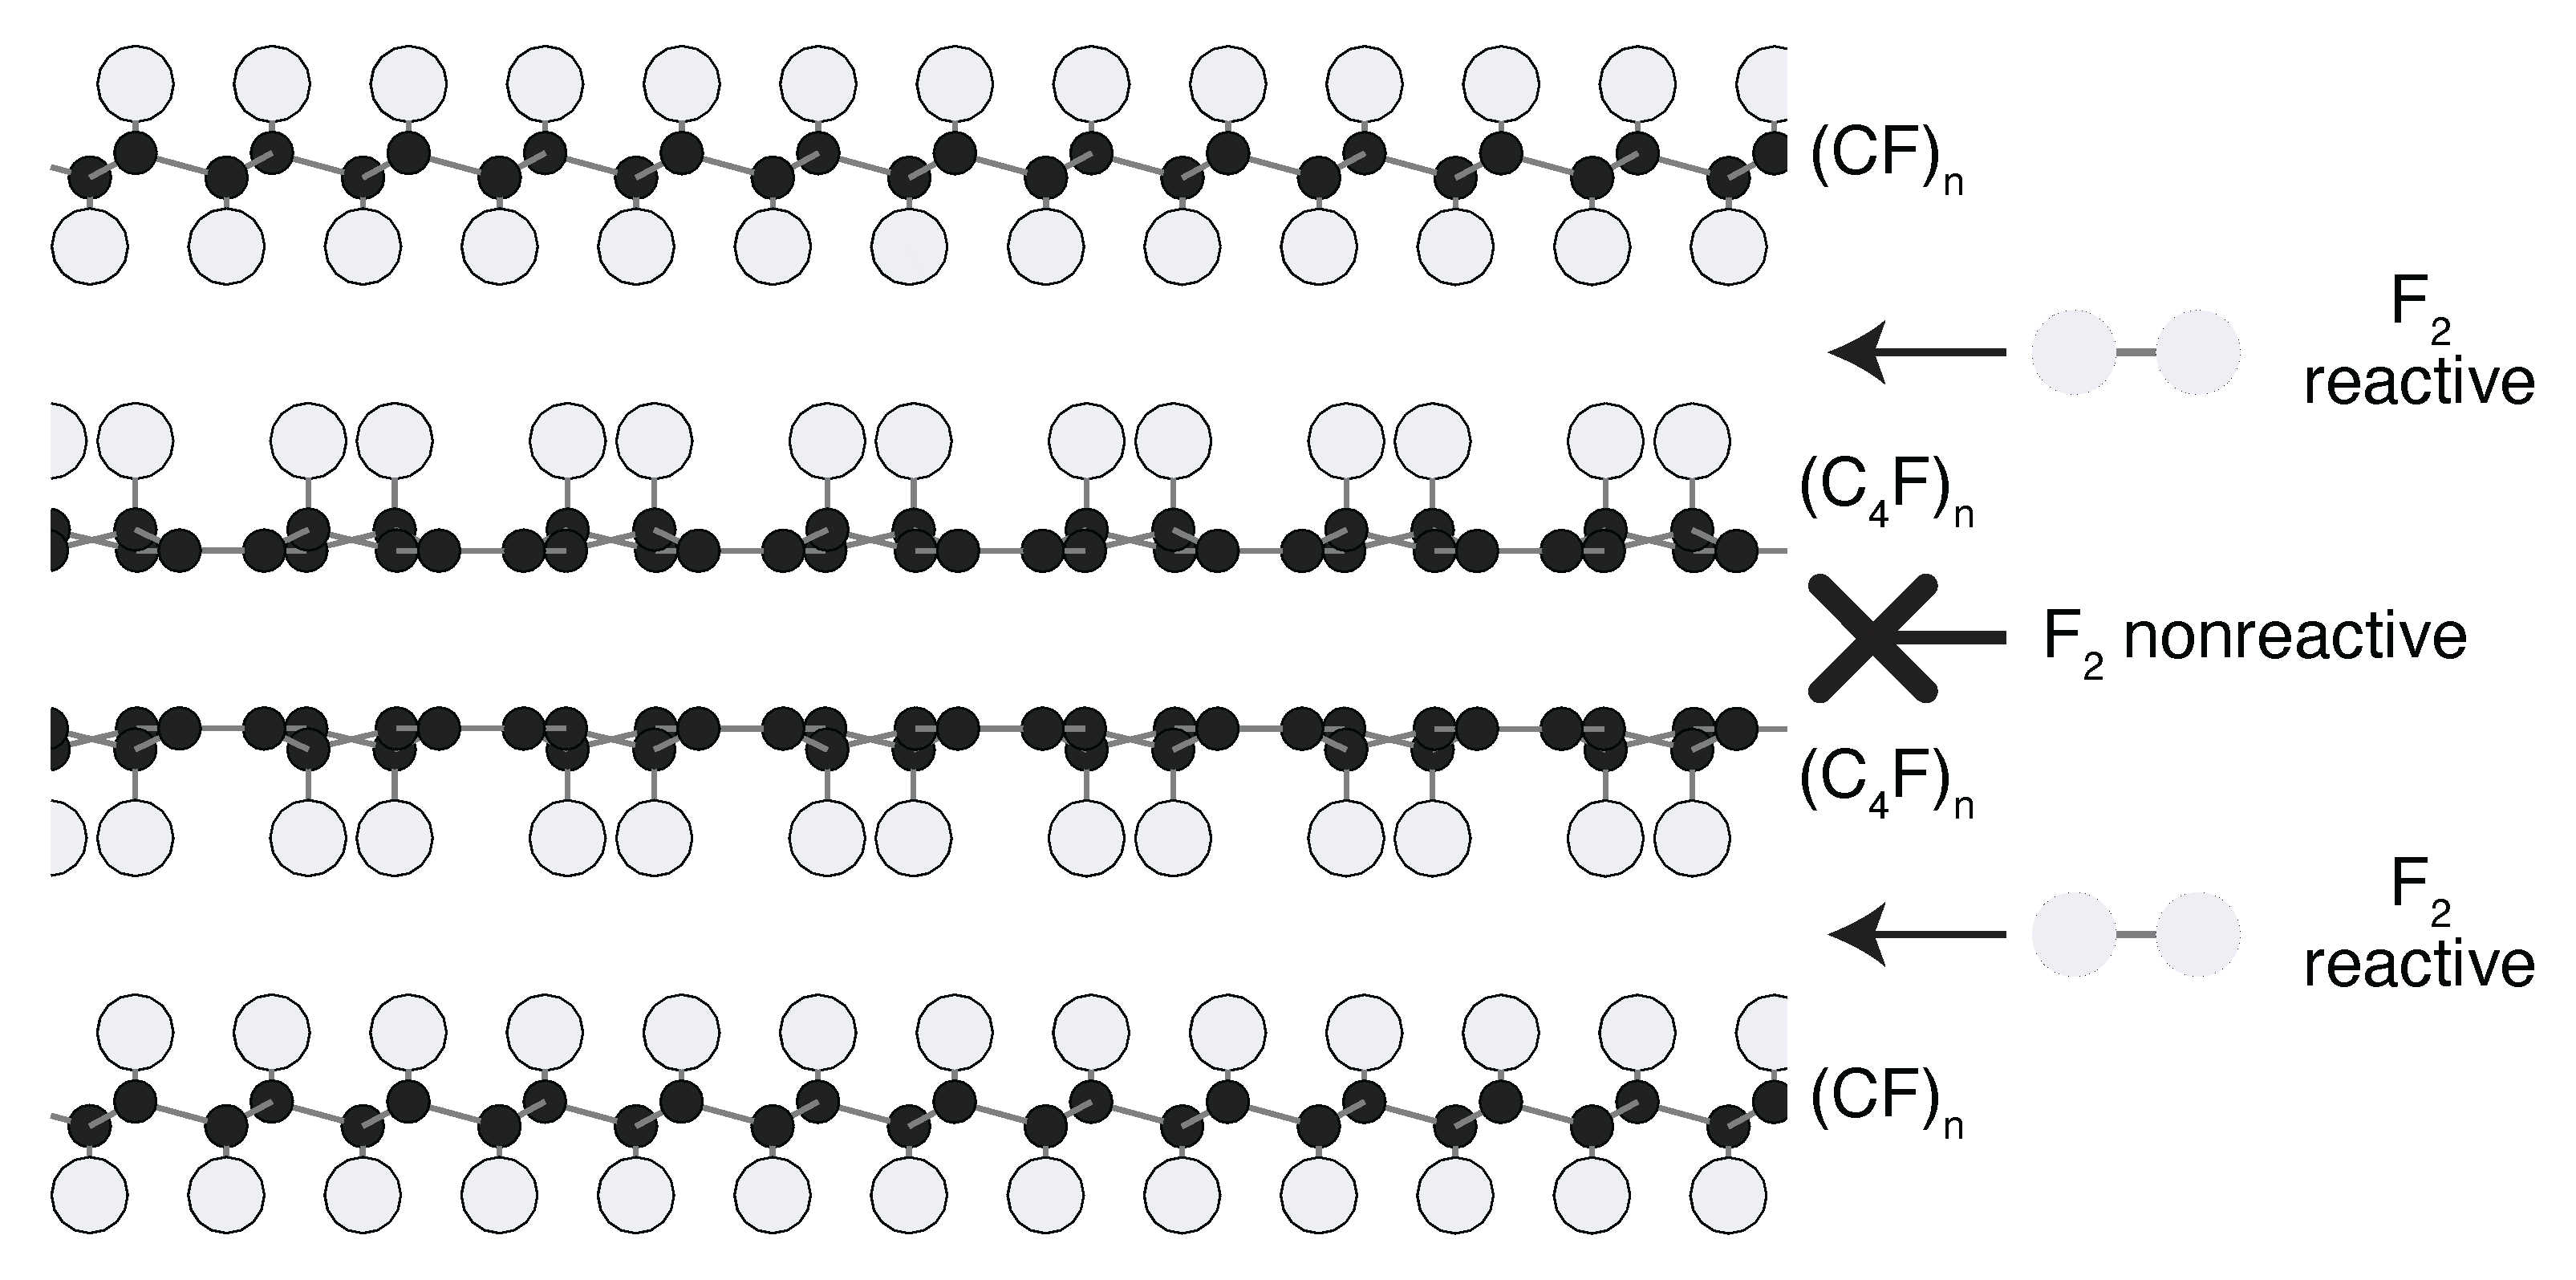
The first rule is derived from the results of the joint DFT and NMR study of C–F bonding in F-GICs by Vyalikh et al. [40], who considered multiple categories of fluorine patterns as forms of disorder in (C y F) n , 2 y 4 . They calculated that 19 F deshielding is greatest for isolated CF groups and suggested that the 19 F chemical shifts of such groups could reach −56 ppm. All other configurations they considered, involving CF groups bonded to one or more other CF groups, had calculated 19 F chemical shifts that did not exceed −73 ppm. We also do not observe significant correlation between such 19 F species and bare carbon in our CP HETCOR spectra, further justifying that adjacent CF groups do not need to be included in our models of the new GF phase.
The first rule eliminates all known ordered (C 2 F) n and (C 2.5 F) n compositions, as well a proposed ortho-(C 3 F) n composition [3,14,36,49]. The second rule eliminates the densest possible packing of isolated CF , which is achieved in the hypothetical (C 2 F) n structure generated by eliminating all mutually aligned F from one side of hexagonal (CF) n [50]; in this configuration, every bare carbon hosts an unpaired valence electron. (Adjacent radical-dense (C 2 F) n sheets are a logical precursor to the diamane model of (C 2 F) n and the experimentally observed (if limited) bridging C–C bond formation in our GF samples). The second rule also eliminates a proposed meta-(C 3 F) n composition [23], which features four-center diradical framework units that are isoelectronic with trimethylenemethane.
Imposition of the two rules leads us to consider the eight fluorine patterns shown in Figure 6A. The three (C 3 F) n models presented in Figure 6A are new and represent the densest possible packing of isolated CF in manner that satisfies the valence requirement stated in Rule 2 for every bare carbon atom. The polymorph (C 3 F) n -t was constructed by defluorinating hexagonal (CF) n pairwise over framework bonds. We also consider the polymorph (C 3 F) n -d, in which one CF group within each triangular element is aligned opposite to the other two; and (C 3 F) n -s, where the fluorination is single-sided over the entire layer. Four models of (C 4 F) n polymorphs are considered. The alternating double-sided hexagonal configuration (C 4 F) n -d resembles the structure originally proposed by the Rüdorffs except with covalent bonding, a structural refinement originally introduced by Mitkin [21]. (C 4 F) n -s, the single-sided analog of (C 4 F) n -d, resembles structures proposed by Nakajima and coworkers [15,16] except with covalent bonding, as first introduced by Ewels et al. in work on nanotube fluorination [51]. Other, closely related hexagonal patterns of double-sided coverage were not considered [48]. There are also two polymorphs with rectangular repeat units: (C 4 F) n -m, the model favored by Mitkin [21]; and (C 4 F) n -n, its single-sided analogue. We also include a model of (C 8 F) n , a member of the class of F-GICs where covalent C–F bonding becomes less favorable than ionic bonding [52].
The double-sided patterns we consider attempt to maximize the number of alternating nearest-neighbor C–F orientations, whereas single-sided attachment represents the other extreme: zero alternating nearest-neighbor C–F orientations. This is expected to capture the largest degree of chemical shift variation due to conformational subpatterns. Other polymorphs in compliance with our two rules can be constructed by applying some pattern of C–F bond inversion to the patterns in Figure 6A, with randomized inversion patterns and point vacancies representing forms of chemical disorder. Such patterns are intermediate to the conformational extremes we consider here and need not be considered for this work.
Figure 6B shows the calculated 19 F chemical shifts for isolated CF groups from the cores of the fluorographene models corresponding to the patterns in Figure 6A. Consistent with the findings of Vyalikh et al. [40], the isolated CF groups experience large 19 F deshielding relative to CF in hexagonal (CF) n —greater than 100 ppm in all cases. Unexpectedly, there is a very large dispersion of calculated 19 F chemical shifts for isolated CF groups among our fluorographene models. The 19 F chemical shifts for the single-sided fluorinated patterns (C 3 F) n -s and (C 4 F) n -s cluster between −46 ppm and −62 ppm, while those of the centermost three CF of the (C 8 F) n -s model appear at +41 ppm. This range of 103 ppm greatly exceeds the 23 ppm range for isolated CF groups reported by Vyalikh and coworkers. Except for (C 8 F) n -s, we observe a general tendency for the single-sided polymorphs (C 3 F) n -s, (C 4 F) n -s, and (C 4 F) n -n to yield 19 F chemical shifts that cluster near -50 ppm, around the experimentally observed new 19 F GF NMR signal. Additional downfield shifts for double-sided arrangements (C 3 F) n -t, (C 3 F) n -d, (C 4 F) n -m, and (C 4 F) n -d are substantial, with every 19 F shift calculated for the lattermost structure landing near +13 ppm, 66 ppm downfield from the new GF NMR signal—and totaling a remarkable 200 ppm downfield from ordinary covalent CF in (CF) n .
Relative to 19 F, there is much less dispersion in the calculated 13 C chemical shifts, shown in Figure 6C. Carbon-13 chemical shifts of isolated CF groups land in the range ( + 80 ± 3 ) ppm for every model we calculate. Given the likelihood of a few ppm of systematic error, we infer that these shifts only distinguish between ordinary and isolated CF and not between different types of isolated CF . Calculated 13 C chemical shifts for bare C are found to be more discriminating. Now (C 3 F) n -s and (C 4 F) n -s give the most downfield shifts, +136 ppm or higher, with (C 3 F) n -t, (C 3 F) n -d, and (C 4 F) n -d generally within a few ppm of +133 ppm. The (C 4 F) n -m, (C 4 F) n -n, and (C 8 F) n -s models possess many chemically inequivalent bare C leading to a large distribution of 13 C shifts, especially for (C 8 F) n -s, which ranges over 40 ppm. Even our (C 3 F) n unit cells have two types of bare C, aromatic and olefinic, present in a 1:1 ratio. Consequently, our (C 3 F) n -s model is calculated to yield two peaks, with 13 C chemical shifts of +137 ppm (aromatic) and +142 ppm (olefinic). In contrast, (C 4 F) n -s only contains equivalent aromatic bare C, calculated to yield one peak at +138 ppm. We do not observe any well-defined multiple peak structure in the bare C region of our 13 C CP NMR spectra. On this basis, we prefer (C 4 F) n -s as a model of our fluorine-deficient GF phase over every other model we have considered.

2.7. Structural Model: (C 4 F) n /(CF) n Graphite Fluoride Composites

Taking the results of the quantitative NMR analysis finding (C 4.32 ± 0.64 F) n with the DFT calculations of chemical shifts suggesting single-sided fluorination of carbon layers, we hypothesize that the new graphite fluoride NMR signals originate from layers of poly(tetracarbon monofluoride), represented by the configuration (C 4 F) n -s shown in Figure 6A. A single-sided poly(tricarbon monofluoride) phase cannot be ruled out with certainty, however, nor do we completely rule out admixtures of well-ordered single-sided patterns (e.g., local (C 4 F) n -n configurations within (C 4 F) n -s domains) as a minor form of configurational disorder present in the real samples.
As Figure 4B reveals, the (C 4 F) n component of our samples is not isolated from the (CF) n component. A structural model for graphite fluorides as a (C 4 F) n /(CF) n composite is presented in Figure 7. This model is conceived as a consequence of kinetic limitations which prevent F 2 molecules from fluorinating specific layers of the graphite source material during the high temperature fluorination reaction. The resultant covalent intercalation is intermediate between stage-1 and stage-2. This may occur when structural factors such as covalent C–C bridging between layers restricts penetration of F 2 into the graphite galleries, or when specific galleries are free of sites promoting the dissociation of F 2 into neutral atomic F, the species reportedly involved in activated complex formation with graphite during the direct fluorination process [53].

2.8. Electrochemical Properties of Cathodes Made from (C4F) n /(CF) n Graphite Fluoride Composites

Quantitative 19 F NMR results from Table 1 indicate the bulk (C 4 F) n contents of GF-1h773, GF-2h773, and GF-1h873 are ( 15.3 ± 0.3 ) %, ( 8.3 ± 0.4 ) %, and ( 8.0 ± 0.4 ) % by mol C, respectively, assuming y = 4 . This minor yet significant fraction should have a perceptible effect on bulk properties. Indeed, the (C 4 F) n fraction may be responsible for the orange hue of our GF samples (Figure S6), compared to disordered (CF) n samples containing residual graphite, which are colorless. We now briefly consider electrochemical properties of lithium primary cells made using these GF samples as the active cathode material. This analysis is qualitative as only single trials were carried out, and we acknowledge that the differences we observe between cells may be in part due to cell-to-cell variability.
By analogy to cathodes produced from carbon fluorides where the dominant mode of C–F bonding is elongated covalent (due to hyperconjugation), the (C 4 F) n phase should proportionally raise the maximum discharge voltage V max , due to weakened binding of F and improved cathode depolarization, but lower the specific capacity Q, due to lower overall fluorination [54,55,56]. Our GF samples are faithful to these trends at the quasi-equilibrium (slow) discharge rate of C/80, shown in the galvanostatic discharge curves at left in Figure 8. The GF-1h773 cell possesses both the highest maximum discharge voltage and lowest specific capacity, whereas the GF-1h873 cell possesses the opposite. In fact, the GF-1h873 cell exceeds the capacity of a reference cell made from fully fluorinated, disordered “battery-grade” (CF) n -PC (0% (C 4 F) n ), although the gravimetric energy density of the former is slightly inferior (integrated curve; 1999 vs. 2052 W·h/kg, respectively). The disordered (CF) n domains may be raising the maximum discharge voltage of (CF) n -PC compared to what would be expected of purely hexagonal (CF) n material, as framework disorder weakens C–F bonds even in the absence of sp 2 hybridized C [26].
When the cells are discharged sixteen times faster, at C/5 (Figure 8, right), the GF materials become preferable to (CF) n -PC in most respects. The (CF) n -PC reference cell suffers by far the greatest voltage and capacity retention penalties upon going from C/80 to C/5 ( Δ V max = 0.34 V, Δ Q = 293 mA·h/g), indicating that the GF cells are relatively resilient at faster discharge rates. This resilience may be attributed to lower electrical resistivity of (C 4 F) n and its unsaturated carbon framework compared to (CF) n [54]; this is exemplified best by the GF-2h773 cell, whose gravimetric energy density at C/5 was 1796 W·h/kg, 56% greater than that of the cell made from the “battery-grade” (CF) n -PC reference material at C/5, just 1150 W·h/kg.

3. Discussion

We have shown that fluorine-deficient, covalent GF layers with a well-defined (C 4 F) n composition can form during high temperature, uncatalyzed fluorination of graphite. It is curious that such a structurally distinct component of graphite fluorides has escaped notice until now. Vyalikh et al. identified a weak 19 F NMR signal near −53 ppm and assigned it to isolated CF , but compared to our new 19 F NMR signal at −53 ppm, their −53 ppm signal is an order of magnitude broader, very poorly resolved, and was not identified as belonging to an ordered (C 4 F) n composition. We offer four reasons for why the (C 4 F) n component in covalent GFs has eluded previous characterization work.
First, the concentration of the (C 4 F) n component is unlikely to approach that of the majority (CF) n component. We justify this statement by noting that (CF) n layers featuring double-sided fluorination (chair conformation) are more stable per C–F bond than (C 4 F) n layers, with a previous DFT study reporting formation energies of 2.04 eV/atom F and 1.44 eV/atom F for fluorographene structures analogous to (CF) n and (C 4 F) n -s, respectively [57]. Thus, (CF) n is the global minimum of the graphite fluorination reaction coordinate, and (C 4 F) n can be thought of as a stable yet transient intermediate phase that forms due to kinetic limitations of the fluorination reaction, similar to how the existence of (C 2 F) n phases have been justified in covalent GFs [58].
The second reason is an extension of the first: the formation of (C 4 F) n is sensitive to reaction conditions. Such sensitivity is demonstrated by our GF samples; compared to 1 h fluorination at 773 K (15.3% (C 4 F) n )), we see that fluorination at higher temperature (1 h @ 873 K, 8.0% (C 4 F) n ) and longer reaction times (2 h @ 773 K, 8.3% (C 4 F) n ) both favor higher concentrations of the globally stable (CF) n phase. Moreover, high-resolution 19 F centerband NMR spectra of (CF) n from disordered carbon sources show no trace of the −53 ppm (C 4 F) n NMR signal [26], suggesting that crystalline carbon sources are required to allow significant quantities of the transient (C 4 F) n phases to build up. Once again, there is precedent set by the case of covalent (C 2 F) n formation, which is similarly sensitive to reaction temperature and crystallinity of the carbon source [4].
Third, catalyzed fluorination reactions producing F-GICs, which have received the vast majority of GF research in recent decades, seem to bypass covalent (C 4 F) n -s formation. Instead, patterns of covalent bonding consisting of chains and islands of fluoromethanetriyl groups tend to be observed for C y F, y 4 [40,59]. We speculate that this is because the molecular catalysts render atomic F accessible to the entirety of the carbon matrix, favoring double-sided fluorination of all graphite sheets.
The fourth and final reason is simply because it is hard to achieve molecular-level characterization of fluorographite composites. Despite many examples of successful characterization by 19 F MAS NMR in recent decades, sample spinning rates below 25 kHz were common until the early-2010s, obscuring possible isotropic 19 F MAS NMR signal near −53 ppm due to overlap with spinning sidebands from CF and >CF 2 groups. Even at our sample spinning rate of 33 1 3 kHz at a magnetic field of 9.4 T, sideband separation techniques using frequency swept pulses are crucial for obtaining the unambiguous sideband-free 19 F MAS NMR spectra presented in Figure 1 [60,61]. At present, such experiments remain outside the conventional solid-state NMR repertoire.
Our discovery of (C 4 F) n layers has a significant bearing on a mechanistic understanding of graphite fluorination. In an impressive DFT study, Han et al. calculated energies of numerous (C y F) n polymorphs and concluded that the most energetically favorable pathway for the reaction (C) n , ( graphite ) + nF·→ (CF) n involves sequential fluorination of graphene layers [58]. In this mechanism, fluorination of one graphene layer by neutral atomic F proceeds to completion before fluorination of the next layer begins. Han et al. noted that in kinetically limited circumstances, e.g., the reaction of diatomic F 2 , alternative pathways such as those leading to the formation of diamane-like (C 2 F) n are plausible. (C 4 F) n -d layers in graphite were deemed energetically unfavorable in their work, but (C 4 F) n -s layers were overlooked. Implicitly, Han et al. incorporated the assumption that fluorine was capable of accessing all parts of the crystal structure without restriction during fluorination, thus biasing their graphene layers toward double-sided fluorine attachment. To the contrary, we suggest by our model in Figure 7 that unencumbered accessibility of graphite galleries should not be taken as a mechanistic assumption, thus exposing a new path along which our mechanistic understanding of graphite fluorination should be refined.
The key structural feature behind Figure 7 is our finding that the (C 4 F) n layers feature fluorine which is covalently attached to a single side of the underlying graphene framework. That this attachment property of (C 4 F) n best explains our NMR data is likely no accident, as 25% F per C emerges as the coverage limit for narrow single wall carbon nanotubes fluorinated below 500 K [62,63] and for single layer graphene attached to a substrate [64]—situations where fluorine cannot access one side of the carbon framework. Though detailed analysis of electronic structure is beyond the scope of this work, it is worth emphasizing that special stability of the (C 4 F) n -s layer configuration relative to single-sided compositions having other C:F ratios is known [65]. On one hand, DFT calculations have found that the meta configuration of two fluorine on the same side of a six-membered framework ring is about 1 eV less favorable than the ortho or para configurations [51], representing a significant barrier to dense packing of F (which can be overcome by allowing fluorine to attach to both sides of the carbon layer [66]). On the other hand, there is an effective attraction between widely separated isolated CF groups, as fluorine binding energy for same-sided attachment is greatest when para configurations are maximized, i.e., for (C 4 F) n -s [67]. Although double-sided arrangements of the hexagonal (C 4 F) n pattern such as (C 4 F) n -d have been analyzed as globally more stable than (C 4 F) n -s [48], we find that the DFT energy of our (C 4 F) n -s model is about 0.9 eV lower than that of the (C 4 F) n -d model (Table S1), supporting the special stability of same-sided para contacts. In contrast, we find that the molecule bearing a (C 3 F) n -s core, with many same-sided meta F contacts, is the least stable (C 3 F) n analogue. We note that the (C 3 F) n -t core is slightly more stable than the (C 3 F) n -d core, despite many more same-sided meta contacts in the former— evidence that the meta-avoidance rule does not apply when double-sided fluorine coverage is allowed.
Recently, a bulk (C 4 F) n -s structure has emerged in the graphite fluoride literature [68,69,70]. Unlike our proposed intermediate stage composite structure (Figure 7), (C 4 F) n -s was proposed in these works to form the covalent framework of a fully stage-1 F-GIC [68]. Confusingly, this “(C 4 F) n ” F-GIC is synthesized identically to a material originally referred to as (C 2.5 F) n , where it was characterized as a CF 0.39 graphite fluoride in which roughly 80% of the bonds to F are (elongated) covalent ( CF ) and 20% are ionic (F ) [36]. Extensive NMR characterization of (C 2.5 F) n was reported in the original work by Giraudet et al., with the material generating 19 F MAS NMR signals at −147 ppm ( CF ) and a relatively narrow signal at −190 ppm (intercalated F ). The −147 ppm 19 F signal correlated to well-resolved 13 C MAS NMR signals at +82 ppm ( CF ) and +128 ppm (bare C) in CP-WISE experiments, whereas no correlations of the −190 ppm 19 F signal to 13 C could be discerned. Giraudet et al. thus convincingly established the 80/20 breakdown of covalent/ionic bonding of F in CF 0.39 . By these same NMR measurements, however, the assignment to a (C 4 F) n -s covalent framework is shown to be false: no NMR signals with chemical shifts at −53 ppm ( 19 F, CF ), +79 ppm ( 13 C, CF ), or +141 ppm ( 13 C, C(sp 2 )) were recorded from CF 0.39 . The originally proposed (C 2.5 F) n framework, featuring long chains of adjacent CF groups, is more consistent with the -147 ppm CF shift according to the NMR chemical shift analysis of Vyalikh et al. [40], as well as with morphologies inferred from AFM imagery acquired for stage-1 F-GICs that generate the same type of 19 F NMR signal (near −140 ppm) as CF 0.39 [59]. The move to the “(C 4 F) n ” name seems motivated by the stoichiometry when ionic F is excluded, with later assignment to the (C 4 F) n -s structure following from this stoichiometry and not by any particular advance in molecular-level understanding. Thus, as far as we know, the graphite fluorides analyzed here are the first materials where a covalent (C 4 F) n phase has been synthesized by a method that does not guarantee single-sided fluorination.

4. Materials and Methods

4.1. Synthesis

Graphite fluoride composites were synthesized in a tube furnace where a dilute stream of F 2 gas in an argon carrier was passed over battery-grade crystalline graphite (Sigma-Aldrich, St. Louis, MO, USA; SKU 496596, Lot MKCH9213) at temperatures up to 873 K. The average graphite particle size is reportedly 19.89 μ m; carbon-13 is present at natural abundance. For each sample, 0.1 g of graphite was distributed in an alumina boat. The boat was centered inside a long alumina tube featuring flow control values placed at the ends, followed by centered placement of the tube inside a cylindrical heating element. The hot zone created by the heating element spans roughly 25% of the tube length. The graphite was preheated under continuous argon flow at an initial set point for 30 min before ramping up to the final temperature (500 °C/773 K or 600 °C/873 K). Ramp rates were 5 K/min. Once the desired fluorination temperature was reached, the gas stream composition was transitioned from pure argon to a 98:2 v:v Ar:F 2 mixture flowing at 125–150 SCCM. After the chosen run time at the designated reaction temperature, active heating was ceased, the stream flow was switched back to pure argon, and the sample was allowed to cool to ∼350 K before collection.

4.2. Solid-State Nuclear Magnetic Resonance

All NMR experiments were carried out at 9.4 T using a commercial Bruker 2.5 mm wide-bore CP MAS probe on an Avance III HD spectrometer. The MAS rate was 33 1 3 kHz for all experiments, stable to within 10 Hz, except for the quantitative 13 C CPMG NMR experiments, for which the MAS rate was 16 2 3 kHz. Spinning sidebands were eliminated from all 1D 19 F centerband MAS NMR spectra presented here using the TOP-aMAT method [60,61]. All 19 F hard pulses had rf amplitudes near 140 kHz; tanh/tan and ramped contact pulse peak amplitudes were near 105 kHz. For CP, 13 C contact and hard pulse amplitudes were 71 kHz and 114 kHz, respectively, and acquired under well-optimized 143 kHz amplitude SPINAL-64 19 F decoupling. CP contact times were 2.5 ms for CP MAS shown in Figure 2. Carr-Purcell-Meiboom-Gill echo train acquisition (CPMG) during 19 F decoupling was used to collect multiple 13 C echoes in addition to the FID [71,72]. Four echoes were collected in CP MAS and ten echoes were collected for CP HETCOR (limited by duration of high power decoupling and desired 13 C chemical shift resolution) improving the sensitivity of these experiments by factors of roughly two and four, respectively. Even with CPMG enhancement, good S/N of the weak (C 4 F) n 13 C NMR signals from the small amounts of sample in CP HETCOR required long experiments of 1 wk (1250 μ s contact time) or 2 wk (125 μ s contact time). Indirect increments for the 2D experiments were 5 μ s and 15 μ s for CP HETCOR and EXSY, respectively, using States hypercomplex acquisition for phase sensitive indirect detection of 19 F. Both 13 C and 19 F shifts are referenced externally with respect to their standards (tetramethylsilane and CFCl 3 ) using NH 4 CF 3 COO ( 19 F @ −72.0 ppm). The sample temperature was stabilized using 1500 L/h auxiliary gas flow regulated at 300.0 K. The actual sample temperatures are estimated to be near 335 K during MAS NMR experiments.
Raw NMR data for the GF samples discussed in this manuscript are provided in the Supplementary Materials as files adopting the Core Scientific Dataset Format [73]. All data were processed using the macOS application RMN 2.0 [74].

4.3. Calculation of NMR Chemical Shifts

Molecular models of fluorographene were geometry optimized in the gas phase by DFT using the B3LYP functional in Gaussian16 (Gaussian Inc., Wallingford, CT, USA). Except for C 150 F 48 , the (C 8 F) n -s analogue, planar input structures were initially optimized with all dihedral angles frozen, leading to significant relaxation of framework strain while maintaining overall planarity, using basis sets up to and ultimately including 4-31G**. At this stage, the outermost ring of atoms were frozen and the core atoms were optimized freely using the 6-311G** basis set. For C 150 F 48 , the initial structure was optimized through two stages, alternating optimization with frozen edge and core atoms at each stage, with no frozen-dihedral steps. NMR shielding tensors were calculated using the gauge-including atomic orbital method using the 6-311G** basis set. Calculated isotropic chemical shifts δ iso calc were derived from the calculated isotropic NMR shielding values σ iso calc according to linear relations given in our previous work [26]:
δ iso calc ( 13 C ) = 173.1 ppm 0.941 σ iso calc ( 13 C ) ,
δ iso calc ( 19 F ) = 164.462 ppm 0.9516 σ iso calc ( 19 F ) .
Equation (5) differs from the corresponding relation in Ref. [26] slightly, due to a minor error correction (see Table S2 footnote ‘a’ of Ref. [26]).

4.4. Electrochemistry

GFs were mixed with a fixed quantity of carbon black (Asbury Carbons, Asbury, NJ, USA), added to a solution of poly(vinylidene fluoride) (PVDF; Kureha, Louisville, KY, USA) in N-methyl-2-pyrrolidinone (Sigma-Aldrich, St. Louis, MO), and stirred for a minimum of 1 h to produce an 8:1:1 slurry (GF:conductive carbon:PVDF binder, by weight). For the reference cell, the carbon fluoride was commercially acquired “battery-grade” Carbofluor-1000, referred to in this work as (CF) n -PC (Advanced Research Chemicals, Catoosa, OK, USA; lot ARC-5-R-175). Slurries were then doctor bladed on carbon coated aluminum foil and dried at 70 °C. Cathodes were punched from the foil at diameters of 12 or 16 mm and transferred into an argon glovebox (<1 ppm O 2 , H 2 O). Coin cells (CR2032; Hohsen Corporation, Osaka, Japan) were assembled in the glovebox using a wave spring, 0.7 mm stainless steel spacer, 750 μ m Li disk 16 mm in diameter, two pieces of 2400 Celgard polypropylene separator, 80 μ L 1 M LiBF 4 in 1:1 v:v propylene carbonate:dimethyl ether electrolyte, and the punched cathode disk. Galvanostatic discharge was performed at room temperature on a Maccor Series 4000 or VMP-300 Biologic potentiostat at C/80 or C/5 using a 1.5 V cutoff.

Supplementary Materials

The following are available online at https://0-www-mdpi-com.brum.beds.ac.uk/article/10.3390/solids3020017/s1: a .pdf file containing Figures S1–S6, Table S1, and supplementary references; .csdf files containing raw NMR data; .xyz files of unsaturated fluorographene models; .vesta files of chemical shift labeled unsaturated fluorographene models; and gnuplot scripts and associated files for quantitative data analysis.

Author Contributions

All authors contributed substantially to the work. Photograph credit goes to N.B.S. All authors have read and agreed to the published version of the manuscript.

Funding

This work was fully supported by the Laboratory Directed Research and Development (LDRD) program of Sandia National Laboratories, which is a multi-mission laboratory managed and operated by National Technology and Engineering Solutions of Sandia, LLC., a wholly owned subsidiary of Honeywell International, Inc., for the U.S. Department of Energy’s National Nuclear Security Administration under contract DE-NA0003525. This paper describes objective technical results and analysis. Any subjective views or opinions that might be expressed in the paper do not necessarily represent the views of the U.S. Department of Energy or the United States Government.

Institutional Review Board Statement

Not applicable.

Informed Consent Statement

Not applicable.

Data Availability Statement

Raw NMR data relevant to this work can be found in the Supplementary Materials.

Conflicts of Interest

The authors declare no conflict of interest. The funders had no role in the design of the study; in the collection, analyses, or interpretation of data; in the writing of the manuscript, or in the decision to publish the results.

Abbreviations

The following abbreviations are used in this manuscript:
GFgraphite fluoride
F-GICfluorine graphite intercalation compound
HOPGhighly oriented pyrolytic graphite
MASmagic-angle spinning
NMRnuclear magnetic resonance
DFTdensity functional theory
PCpetroleum coke
XRDX-ray diffraction
CPMGCarr-Purcell-Meiboom-Gill
CPcross-polarization
HETCORheteronuclear correlation
EXSYexchange spectroscopy
MREmatched reconstructed echo
FIDfree induction decay
S/Nsignal-to-noise ratio
WISEwideline separation
AFMatomic force microscopy
SCCMstandard cubic centimeters per minute
TOP-aMATtwo-dimensional one-pulse adiabatic magic angle turning
SPINALsmall phase incremental alternation
PVDFpoly(vinylidene fluoride)

References

  1. Ruff, O.; Bretschneider, O. Die Reaktionsprodukte der verschiedenen Kohlenstoffformen mit Fluor II (Kohlenstoff-monofluorid). Z. Anorg. Allg. Chem. 1934, 217, 1–18. [Google Scholar] [CrossRef]
  2. Lagow, R.J.; Badachhape, R.B.; Wood, J.L.; Margrave, J.L. Synthesis of superstoichiometric poly(carbon monofluoride). J. Am. Chem. Soc. 1974, 96, 2628–2629. [Google Scholar] [CrossRef]
  3. Kita, Y.; Watanabe, N.; Fujii, Y. Chemical composition and crystal structure of graphite fluoride. J. Am. Chem. Soc. 1979, 101, 3832–3841. [Google Scholar] [CrossRef]
  4. Touhara, H.; Kadono, K.; Fujii, Y.; Watanabe, N. On the Structure of Graphite Fluoride. Z. Anorg. Allg. Chem. 1987, 544, 7–20. [Google Scholar] [CrossRef]
  5. Rüdorff, W.; Rüdorff, G. Tetrakohlenstoffmonofluorid, eine neue Graphit-Fluor-Verbindung. Chem. Berichte 1947, 80, 417–423. [Google Scholar] [CrossRef]
  6. Nakajima, T.; Kawaguchi, M.; Watanabe, N. Ternary intercalation compound of graphite with aluminum fluoride and fluorine. Chem. Lett. 1981, 10, 1045–1048. [Google Scholar] [CrossRef] [Green Version]
  7. Palchan, I.; Davidov, D.; Selig, H. Preparation and properties of new graphite–fluorine intercalation compounds. J. Chem. Soc. Chem. Commun. 1983, 657–658. [Google Scholar] [CrossRef]
  8. Hamwi, A.; Daoud, M.; Cousseins, J. Graphite Fluorides Prepared at Room-Temperature 1. Synthesis and Characterization. Synth. Met. 1988, 26, 89–98, WOS:A1988Q485700010. [Google Scholar] [CrossRef]
  9. Vaknin, D.; Palchan, I.; Davidov, D.; Selig, H.; Moses, D. Resistivity and E.S.R. studies of graphite HOPG/fluorine intercalation compounds. Synth. Metals 1986, 16, 349–365. [Google Scholar] [CrossRef]
  10. Sato, Y.; Shiraishi, S.; Mazej, Z.; Hagiwara, R.; Ito, Y. Direct conversion mechanism of fluorine–GIC into poly(carbon monofluoride), (CF)n. Carbon 2003, 41, 1971–1977. [Google Scholar] [CrossRef]
  11. Dubois, M.; Guérin, K.; Pinheiro, J.P.; Fawal, Z.; Masin, F.; Hamwi, A. NMR and EPR studies of room temperature highly fluorinated graphite heat-treated under fluorine atmosphere. Carbon 2004, 42, 1931–1940. [Google Scholar] [CrossRef]
  12. Rüdorff, W.; Rüdorff, G. Zur Konstitution des Kohlenstoff-Monofluorids. Z. Anorg. Chem 1947, 253, 281–296. [Google Scholar] [CrossRef]
  13. Mallouk, T.; Bartlett, N. Reversible intercalation of graphite by fluorine: A new bifluoride, C12HF2, and graphite fluorides, CxF (5 > x > 2). J. Chem. Soc. Chem. Commun. 1983, 103–105. [Google Scholar] [CrossRef]
  14. Mallouk, T.; Hawkins, B.L.; Conrad, M.P.; Zilm, K.; Maciel, G.E.; Bartlett, N. Raman, Infrared and n.m.r. Studies of the Graphite Hydrofluorides CxF1-δ(HF)δ (2 ≤ x ≤ 5). Philos. Trans. R. Soc. Lond. Ser. A Math. Phys. Sci. 1985, 314, 179–187. [Google Scholar]
  15. Nakajima, T.; Ino, T.; Watanabe, N.; Takenaka, H. Preparation, structure, and electrical conductivity of fluorine-graphite intercalation compound. Carbon 1988, 26, 397–401. [Google Scholar] [CrossRef]
  16. Nakajima, T.; Molinier, M.; Motoyama, M. Structure of fluorine-graphite intercalation compounds. Carbon 1991, 29, 429–437. [Google Scholar] [CrossRef]
  17. Nakajima, T.; Tamura, T. The c-axis structures of stage 1 and 2 fluorine-graphite intercalation compounds prepared from highly oriented pyrolytic grahite and natural graphite flake. Synth. Met. 1995, 73, 63–67. [Google Scholar] [CrossRef]
  18. Oshida, K.; Endo, M.; Nakajima, T.; Vittorio, S.L.d.; Dresselhaus, M.S.; Dresselhaus, G. Image analysis of TEM pictures of fluorine-intercalated graphite fibers. J. Mater. Res. 1993, 8, 512–522. [Google Scholar] [CrossRef] [Green Version]
  19. Di Vittorio, S.L.; Dresselhaus, M.S.; Dresselhaus, G. A model for disorder in fluorine-intercalated graphite. J. Mater. Res. 1993, 8, 1578–1585. [Google Scholar] [CrossRef] [Green Version]
  20. Panich, A.M. Nuclear magnetic resonance study of fluorine-graphite intercalation compounds and graphite fluorides. Synth. Met. 1999, 100, 169–185, WOS:000080386100001. [Google Scholar] [CrossRef]
  21. Mitkin, V.N. Types of Inorganic Fluorocarbon Polymer Materials and Structure–Property Correlation Problems. J. Struct. Chem. 2003, 44, 82–115. [Google Scholar] [CrossRef]
  22. Sato, Y.; Itoh, K.; Hagiwara, R.; Fukunaga, T.; Ito, Y. On the so-called “semi-ionic” C-F bond character in fluorine-GIC. Carbon 2004, 42, 3243–3249. [Google Scholar] [CrossRef]
  23. Bettinger, H.F.; Kudin, K.N.; Scuseria, G.E. Structural Models of Fluorine-Graphite Intercalation Compounds from Density Functional Theory. J. Phys. Chem. A 2004, 108, 3016–3018. [Google Scholar] [CrossRef]
  24. Hamwi, A. Fluorine reactivity with graphite and fullerenes. fluoride derivatives and some practical electrochemical applications. J. Phys. Chem. Solids 1996, 57, 677–688. [Google Scholar] [CrossRef]
  25. Watanabe, N. Two types of graphite fluorides, (CF)n and (C2F)n, and discharge characteristics and mechanisms of electrodes of (CF)n and (C2F)n in lithium batteries. Solid State Ionics 1980, 1, 87–110. [Google Scholar] [CrossRef]
  26. Walder, B.J.; Alam, T.M. Modes of Disorder in Poly(carbon monofluoride). J. Am. Chem. Soc. 2021, 143, 11714–11733. [Google Scholar] [CrossRef]
  27. Leung, K.; Schorr, N.B.; Mayer, M.; Lambert, T.N.; Meng, Y.S.; Harrison, K.L. Edge-Propagation Discharge Mechanism in CFx Batteries—A First-Principles and Experimental Study. Chem. Mater. 2021, 33, 1760–1770. [Google Scholar] [CrossRef]
  28. Sayahpour, B.; Hirsh, H.; Bai, S.; Schorr, N.B.; Lambert, T.N.; Mayer, M.; Bao, W.; Cheng, D.; Zhang, M.; Leung, K.; et al. Revisiting Discharge Mechanism of CFx as a High Energy Density Cathode Material for Lithium Primary Battery. Adv. Energy Mater. 2022, 12, 2103196. [Google Scholar] [CrossRef]
  29. Krawietz, T.R.; Haw, J.F. Characterization of poly(carbon monofluoride) by 19F and 19F to 13C cross polarization MAS NMR spectroscopy. Chem. Commun. 1998, 2151–2152. [Google Scholar] [CrossRef]
  30. Panich, A.M.; Nakajima, T.; Vieth, H.M.; Privalov, A.F.; Goren, S.D. Nuclear magnetic resonance study of fluorine-graphite intercalation compounds. J. Phys. Condens. Matter 1998, 10, 7633–7642. [Google Scholar] [CrossRef]
  31. Dubois, M.; Guérin, K.; Hamwi, A.; Vinogradov, A. Nature of C–F Bonds in Fluorinated Carbons. In New Fluorinated Carbons: Fundamentals and Applications; Progress in Fluorine Science; Elsevier: Amsterdam, The Netherlands, 2017; Volume 2, Chapter 9; pp. 215–243. [Google Scholar] [CrossRef]
  32. Takashima, M.; Watanabe, N. Formation and Structure of Crystalline Graphite Fluoride. Nippon Kagaku Kaishi 1975, 432–436. [Google Scholar] [CrossRef]
  33. Hagaman, E.W.; Murray, D.K.; Del Cul, G.D. Solid State 13C and 19F NMR Characterization of Fluorinated Charcoal. Energy Fuels 1998, 12, 399–408. [Google Scholar] [CrossRef]
  34. Dubois, M.; Giraudet, J.; Guérin, K.; Hamwi, A.; Fawal, Z.; Pirotte, P.; Masin, F. EPR and Solid-State NMR Studies of Poly(dicarbon monofluoride) (C2F)n. J. Phys. Chem. B 2006, 110, 11800–11808. [Google Scholar] [CrossRef] [PubMed]
  35. Chamssedine, F.; Dubois, M.; Guérin, K.; Giraudet, J.; Masin, F.; Ivanov, D.A.; Vidal, L.; Yazami, R.; Hamwi, A. Reactivity of Carbon Nanofibers with Fluorine Gas. Chem. Mater. 2007, 19, 161–172. [Google Scholar] [CrossRef]
  36. Giraudet, J.; Dubois, M.; Guérin, K.; Delabarre, C.; Hamwi, A.; Masin, F. Solid-State NMR Study of the Post-Fluorination of (C2.5F)n Fluorine–GIC. J. Phys. Chem. B 2007, 111, 14143–14151. [Google Scholar] [CrossRef] [PubMed]
  37. Van Rossum, B.J.; Boender, G.J.; de Groot, H.J.M. High Magnetic Field for Enhanced Proton Resolution in High-Speed CP/MAS Heteronuclear 1H–13C Dipolar-Correlation Spectroscopy. J. Magn. Reson. Ser. A 1996, 120, 274–277. [Google Scholar] [CrossRef]
  38. Giraudet, J.; Dubois, M.; Guérin, K.; Delabarre, C.; Pirotte, P.; Hamwi, A.; Masin, F. Heteronuclear dipolar recoupling using Hartmann–Hahn cross polarization: A probe for 19F–13C distance determination of fluorinated carbon materials. Solid State Nucl. Magn. Reson. 2007, 31, 131–140. [Google Scholar] [CrossRef]
  39. Ahmad, Y.; Dubois, M.; Guérin, K.; Hamwi, A.; Fawal, Z.; Kharitonov, A.P.; Generalov, A.V.; Klyushin, A.Y.; Simonov, K.A.; Vinogradov, N.A.; et al. NMR and NEXAFS Study of Various Graphite Fluorides. J. Phys. Chem. C 2013, 117, 13564–13572. [Google Scholar] [CrossRef]
  40. Vyalikh, A.; Bulusheva, L.G.; Chekhova, G.N.; Pinakov, D.V.; Okotrub, A.V.; Scheler, U. Fluorine Patterning in Room-Temperature Fluorinated Graphite Determined by Solid-State NMR and DFT. J. Phys. Chem. C 2013, 117, 7940–7948. [Google Scholar] [CrossRef]
  41. Murakami, M.; Matsumoto, K.; Hagiwara, R.; Matsuo, Y. 13C/19F high-resolution solid-state NMR studies on layered carbon-fluorine compounds. Carbon 2018, 138, 179–187. [Google Scholar] [CrossRef]
  42. Chen, X.; Dubois, M.; Radescu, S.; Rawal, A.; Zhao, C. Liquid-phase exfoliation of F-diamane-like nanosheets. Carbon 2021, 175, 124–130. [Google Scholar] [CrossRef]
  43. Wardell, G.E.; McBrierty, V.J.; Douglass, D.C. Application of NMR to the study of molecular motion in SBS copolymers. J. Appl. Phys. 1974, 45, 3441–3446. [Google Scholar] [CrossRef]
  44. Walder, B.J.; Alam, T.M. Quantification of Uncoupled Spin Domains in Spin-Abundant Disordered Solids. Int. J. Mol. Sci. 2020, 21, 3938. [Google Scholar] [CrossRef] [PubMed]
  45. Stephens, M.A. EDF Statistics for Goodness of Fit and Some Comparisons. J. Am. Stat. Assoc. 1974, 69, 730–737. [Google Scholar] [CrossRef]
  46. Marsaglia, G.; Marsaglia, J. Evaluating the Anderson-Darling Distribution. J. Stat. Softw. 2004, 9, 1–5. [Google Scholar] [CrossRef] [Green Version]
  47. Rimsza, J.M.; Walder, B.J.; Alam, T.M. Influence of Polymorphs and Local Defect Structures on NMR Parameters of Graphite Fluorides. J. Phys. Chem. C 2021, 125, 2699–2712. [Google Scholar] [CrossRef]
  48. Enyashin, A.N.; Ivanovskii, A.L. Layers and tubes of fluorographene C4F: Stability, structural and electronic properties from DFTB calculations. Chem. Phys. Lett. 2013, 576, 44–48. [Google Scholar] [CrossRef]
  49. Bulusheva, L.G.; Okotrub, A.V.; Yudanov, N.F. Atomic arrangement and electronic structure of graphite fluoride C2F. Phys. Low-Dimens. Struct. 2002, 7–8, 1–14. [Google Scholar]
  50. Pelikán, P.; Noga, J.; Biskupič, S. On the structural and electronic properties of poly(dicarbon monofluoride): Solid-state semi-empirical INDO study. J. Solid State Chem. 2003, 174, 233–240. [Google Scholar] [CrossRef]
  51. Ewels, C.P.; Van Lier, G.; Charlier, J.C.; Heggie, M.I.; Briddon, P.R. Pattern Formation on Carbon Nanotube Surfaces. Phys. Rev. Lett. 2006, 96, 216103. [Google Scholar] [CrossRef] [Green Version]
  52. Ohana, I.; Palchan, I.; Yacoby, Y.; Davidov, D.; Selig, H. Electronic charge transfer in stage-2 fluorine-intercalated graphite compounds. Phys. Rev. B 1988, 38, 12627–12632. [Google Scholar] [CrossRef] [PubMed]
  53. Kuriakose, A.K.; Margrave, J.L. Kinetics of the Reactions of Elemental Fluorine. IV. Fluorination of Graphite. J. Phys. Chem. 1965, 69, 2772–2775. [Google Scholar] [CrossRef]
  54. Lam, P.; Yazami, R. Physical characteristics and rate performance of (CFx)n (0.33 < x < 0.66) in lithium batteries. J. Power Sources 2006, 153, 354–359. [Google Scholar] [CrossRef]
  55. Giraudet, J.; Delabarre, C.; Guérin, K.; Dubois, M.; Masin, F.; Hamwi, A. Comparative performances for primary lithium batteries of some covalent and semi-covalent graphite fluorides. J. Power Sources 2006, 158, 1365–1372. [Google Scholar] [CrossRef]
  56. Yazami, R.; Hamwi, A.; Guérin, K.; Ozawa, Y.; Dubois, M.; Giraudet, J.; Masin, F. Fluorinated carbon nanofibres for high energy and high power densities primary lithium batteries. Electrochem. Commun. 2007, 9, 1850–1855. [Google Scholar] [CrossRef]
  57. Şahin, H.; Topsakal, M.; Ciraci, S. Structures of fluorinated graphene and their signatures. Phys. Rev. B 2011, 83, 115432. [Google Scholar] [CrossRef] [Green Version]
  58. Han, S.S.; Yu, T.H.; Merinov, B.V.; van Duin, A.C.T.; Yazami, R.; Goddard, W.A. Unraveling Structural Models of Graphite Fluorides by Density Functional Theory Calculations. Chem. Mater. 2010, 22, 2142–2154. [Google Scholar] [CrossRef] [Green Version]
  59. Asanov, I.P.; Bulusheva, L.G.; Dubois, M.; Yudanov, N.F.; Alexeev, A.V.; Makarova, T.L.; Okotrub, A.V. Graphene nanochains and nanoislands in the layers of room-temperature fluorinated graphite. Carbon 2013, 59, 518–529. [Google Scholar] [CrossRef]
  60. Clément, R.J.; Pell, A.J.; Middlemiss, D.S.; Strobridge, F.C.; Miller, J.K.; Whittingham, M.S.; Emsley, L.; Grey, C.P.; Pintacuda, G. Spin-Transfer Pathways in Paramagnetic Lithium Transition-Metal Phosphates from Combined Broadband Isotropic Solid-State MAS NMR Spectroscopy and DFT Calculations. J. Am. Chem. Soc. 2012, 134, 17178–17185. [Google Scholar] [CrossRef]
  61. Avalos, C.E.; Walder, B.J.; Viger-Gravel, J.; Magrez, A.; Emsley, L. Chemical exchange at the ferroelectric phase transition of lead germanate revealed by solid state 207Pb nuclear magnetic resonance. Phys. Chem. Chem. Phys. 2019, 21, 1100–1109. [Google Scholar] [CrossRef]
  62. An, K.H.; Heo, J.G.; Jeon, K.G.; Bae, D.J.; Jo, C.; Yang, C.W.; Park, C.Y.; Lee, Y.H.; Lee, Y.S.; Chung, Y.S. X-ray photoemission spectroscopy study of fluorinated single-walled carbon nanotubes. Appl. Phys. Lett. 2002, 80, 4235–4237. [Google Scholar] [CrossRef] [Green Version]
  63. Lee, Y.S.; Cho, T.H.; Lee, B.K.; Rho, J.S.; An, K.H.; Lee, Y.H. Surface properties of fluorinated single-walled carbon nanotubes. J. Fluor. Chem. 2003, 120, 99–104. [Google Scholar] [CrossRef]
  64. Robinson, J.T.; Burgess, J.S.; Junkermeier, C.E.; Badescu, S.C.; Reinecke, T.L.; Perkins, F.K.; Zalalutdniov, M.K.; Baldwin, J.W.; Culbertson, J.C.; Sheehan, P.E.; et al. Properties of Fluorinated Graphene Films. Nano Lett. 2010, 10, 3001–3005. [Google Scholar] [CrossRef]
  65. Bulusheva, L.; Okotrub, A. Electronic Structure of Fluorinated Graphene. In New Fluorinated Carbons: Fundamentals and Applications; Progress in Fluorine Science; Elsevier: Amsterdam, Netherlands, 2017; Volume 2, Chapter 8; pp. 177–213. [Google Scholar] [CrossRef]
  66. Wang, Z.; Qin, S.; Wang, C.; Hui, Q. Fluorine adsorption on the graphene films: From metal to insulator. Comput. Mater. Sci. 2015, 97, 14–19. [Google Scholar] [CrossRef]
  67. Zhou, S.; Sherpa, S.D.; Hess, D.W.; Bongiorno, A. Chemical Bonding of Partially Fluorinated Graphene. J. Phys. Chem. C 2014, 118, 26402–26408. [Google Scholar] [CrossRef]
  68. Pischedda, V.; Radescu, S.; Dubois, M.; Cavallari, C.; Batisse, N.; Balima, F. Fluorine-graphite intercalation compound (C4F)n at high pressure: Experimental and theoretical study. Carbon 2018, 127, 384–391. [Google Scholar] [CrossRef]
  69. Cavallari, C.; Brunelli, M.; Radescu, S.; Dubois, M.; Batisse, N.; Vaughan, G.B.M.; Fischer, H.E.; Pischedda, V. Structural and electronic changes in graphite fluorides as a function of fluorination rate: An XRS, PDF and DFT study. Carbon 2019, 147, 1–8. [Google Scholar] [CrossRef]
  70. Cavallari, C.; Radescu, S.; Dubois, M.; Batisse, N.; Diaf, H.; Pischedda, V. Tuning C–F Bonding of Graphite Fluoride by Applying High Pressure: Experimental and Theoretical Study. J. Phys. Chem. C 2020, 124, 24747–24755. [Google Scholar] [CrossRef]
  71. Meiboom, S.; Gill, D. Modified spin-echo method for measuring nuclear relaxation times. Rev. Sci. Instrum. 1958, 29, 688–691. [Google Scholar] [CrossRef] [Green Version]
  72. Larsen, F.H.; Farnan, I. 29Si and 17O (Q)CPMG-MAS solid-state NMR experiments as an optimum approach for half-integer nuclei having long T1 relaxation times. Chem. Phys. Lett. 2002, 357, 403–408. [Google Scholar] [CrossRef] [Green Version]
  73. Srivastava, D.J.; Vosegaard, T.; Massiot, D.; Grandinetti, P.J. Core Scientific Dataset Model: A lightweight and portable model and file format for multi-dimensional scientific data. PLoS ONE 2020, 15, e0225953. [Google Scholar] [CrossRef] [PubMed]
  74. PhySy Ltd. RMN 2.0.1. 2021. Available online: https://www.physyapps.com/rmn (accessed on 1 March 2022).
Figure 1. Solid-state 19 F centerband MAS NMR spectra of commercial poly(carbon monofluoride) made from petroleum coke ((CF) n -PC) and the three graphite fluorides (GF) synthesized for this work. The new graphite fluoride NMR signal is indicated near −53 ppm by the brown axis shading. Grayscale bars near the molecular models indicate approximate chemical shift ranges for the fluorine atoms depicted in yellow of the associated models; these atoms are also numerically labeled by a representative 19 F chemical shift value. Black atoms, C; bluish-white atoms, other F. Chemical shifts represented by faded parts of the bar are achieved only in cases of extreme chemical disorder.
Solids 03 00017 g001
Figure 2. Reconstructed solid-state { 19 F } 13 C CP CPMG MAS NMR spectra of (CF) n -PC and the three GF samples. Spectra are scaled to the same maximum. Grayscale bars near the molecular models indicate approximate chemical shift ranges for the carbon atoms depicted in yellow of the associated models; these atoms are also numerically labeled by a representative 13 C chemical shift value. Black atoms, other C; bluish-white atoms, F.
Solids 03 00017 g002
Figure 3. Solid-state 2D { 19 F} 13 C CP HETCOR CPMG MAS NMR spectrum of GF-1h773, acquired using a CP contact time of 1250 μ s. Contours drawn from 5.5 σ noise level up to 12.5% of the 2D signal maximum. Signal integrals over the shaded bands ‘a’ through ‘e’ shown on the 2D spectrum lead to the 1D 13 C correlation profiles shown on the right, which include correlation profiles from a second CP HETCOR experiment at a shorter contact time of 125 μ s, scaled to the same maximum intensity as the long contact time profile. “ ( N × )” indicates additional zoom to baseline by factor N. “ssb” = spinning sideband.
Solids 03 00017 g003
Figure 4. (A) Recovery of 19 F NMR signal from GF-1h773 as a function of delay τ rd after saturation of 19 F nuclear magnetization. Data points give the normalized intensity of NMR signal, S , for selected sites across the 19 F centerband line shape (inset spectrum). The sites correspond to ordered CF in (CF) n (red circles), disordered CF in (CF) n (yellow circles), >CF 2 (green circles), the low intensity region near -95 ppm (cyan circles), and hyperconjugated CF (blue squares). Error bars are plotted to the 2 σ level of spectral noise but usually remain smaller than the data markers. Curves are best fits of the data series to the stretched exponential recovery function S ( τ rd ) / S eq = 1 exp ( τ rd / T ) β . The inset table gives parameters and asymptotic standard error from the best fit to S ( τ rd ) for each data series. (B) Two-dimensional { 19 F} 19 F EXSY spectrum from GF-1h773 using a longitudinal storage interval of 40 ms. Contours drawn from 8 σ noise level up to 12.5% of the 2D signal maximum. Diagonal grid lines mark secondary diagonals where spinning sidebands may contribute spectral intensity (“ssb”).
Solids 03 00017 g004
Figure 5. Quantitative analysis of NMR spectra. (A) Fit of 1D 19 F centerband NMR spectrum of GF-1h773 into components assigned to C y F (f), CF 3 ( f 3 ), CF 2 ( f 2 ), and CF ( f 1 ) units. (B) Fit of quantitative 1D 13 C MAS NMR spectra into components assigned to C y F (g), CF 2 ( g 2 ), CF ( g 1 ), bridging C ( g 0 ), and unfluorinated carbon ( g u ). The matched reconstructed CPMG echo (MRE) is analyzed jointly with the free induction decay (FID) NMR signal to determine the g u fraction. The table inset into panel (A) shows the values of y determined by the joint analysis of 19 F and 13 C spectra.
Solids 03 00017 g005
Figure 6. Overview of calculated chemical shifts for fluorographene models of distinct atomic arrangements of isolated CF groups. (A) Eight fluorine patterns consistent with our experimental inferences. (B) Histograms of 19 F chemical shifts calculated for molecular models incorporating the atomic arrangements of panel A overlaid on the experimental 19 F centerband NMR spectrum of GF-1h773. (C) Histograms of calculated 13 C chemical shifts overlaid on the experimental reconstructed 13 C CP CPMG MAS NMR spectrum of GF-1h773. Colored bars match to results corresponding to fluorine patterns in panel (A) as indicated. Black bars plot the calculated chemical shifts of hexagonal (CF) n (pattern not shown). Brown axis shading guides the eye to chemical shifts assigned to the new GF phase.
Solids 03 00017 g006
Figure 7. Proposed model of graphite fluoride structure under conditions where some graphite galleries resist fluorination. Black atoms, C; bluish-white atoms, F.
Solids 03 00017 g007
Figure 8. Galvanostatic discharge curves at C/80 (80 h discharge, left) and C/5 (5 h discharge, right) for Li/GF cells using the (C 4 F) n /(CF) n composite GFs as the active cathode material. Each curve is labeled with the fraction of (C 4 F) n in each sample (per mole C) as derived from our quantitative NMR analysis. “0%” corresponds to a reference Li/(CF) n cell.
Solids 03 00017 g008
Table 1. Quantitative analysis of 19 F MAS centerband NMR spectra.
Samplef/mol% ( C y F ) f 3 /mol% ( CF 3 ) f 2 /mol% ( CF 2 ) f 1 /mol% ( CF )
GF-1h773 4.05 ± 0.11 0.33 ± 0.04 11.74 ± 0.36 83.88 ± 0.38
GF-2h773 2.05 ± 0.10 0.57 ± 0.04 13.02 ± 0.21 84.36 ± 0.24
GF-1h873 1.98 ± 0.12 0.10 ± 0.05 14.38 ± 0.21 83.54 ± 0.24
Table 2. Quantitative analysis of 13 C MAS NMR spectra.
Sampleg/mol% ( C , sp 2 ) g 2 /mol% ( CF 2 ) g 1 /mol% ( CF ) g 0 /mol% ( C , sp 3 ) g u /mol% ( C )
GF-1h773 14.7 ± 3.7 8.5 ± 3.8 70.4 ± 6.6 5.1 ± 3.9 1.31 ± 0.11
GF-2h773 9.4 ± 2.1 7.1 ± 2.1 75.9 ± 3.6 7.4 ± 2.1 0.16 ± 0.01
GF-1h873 2.5 ± 2.0 6.3 ± 1.9 90.7 ± 2.8 0.44 ± 0.06
Publisher’s Note: MDPI stays neutral with regard to jurisdictional claims in published maps and institutional affiliations.

