
Influence of Amitraz-Based Product Characteristics on Varroa Mite Population Control


Abstract
:1. Introduction
2. Materials and Methods
2.1. Mathematical Modeling
2.2. Efficacy Determination
2.2.1. In the Field
2.2.2. With the Model
2.3. Validation of Supatraz® Modeling
2.4. Time to Kill 90% of the Mite Population: L90
2.5. Influence of the Proportion of Resistant Mites on the Treatment Efficacy
3. Results
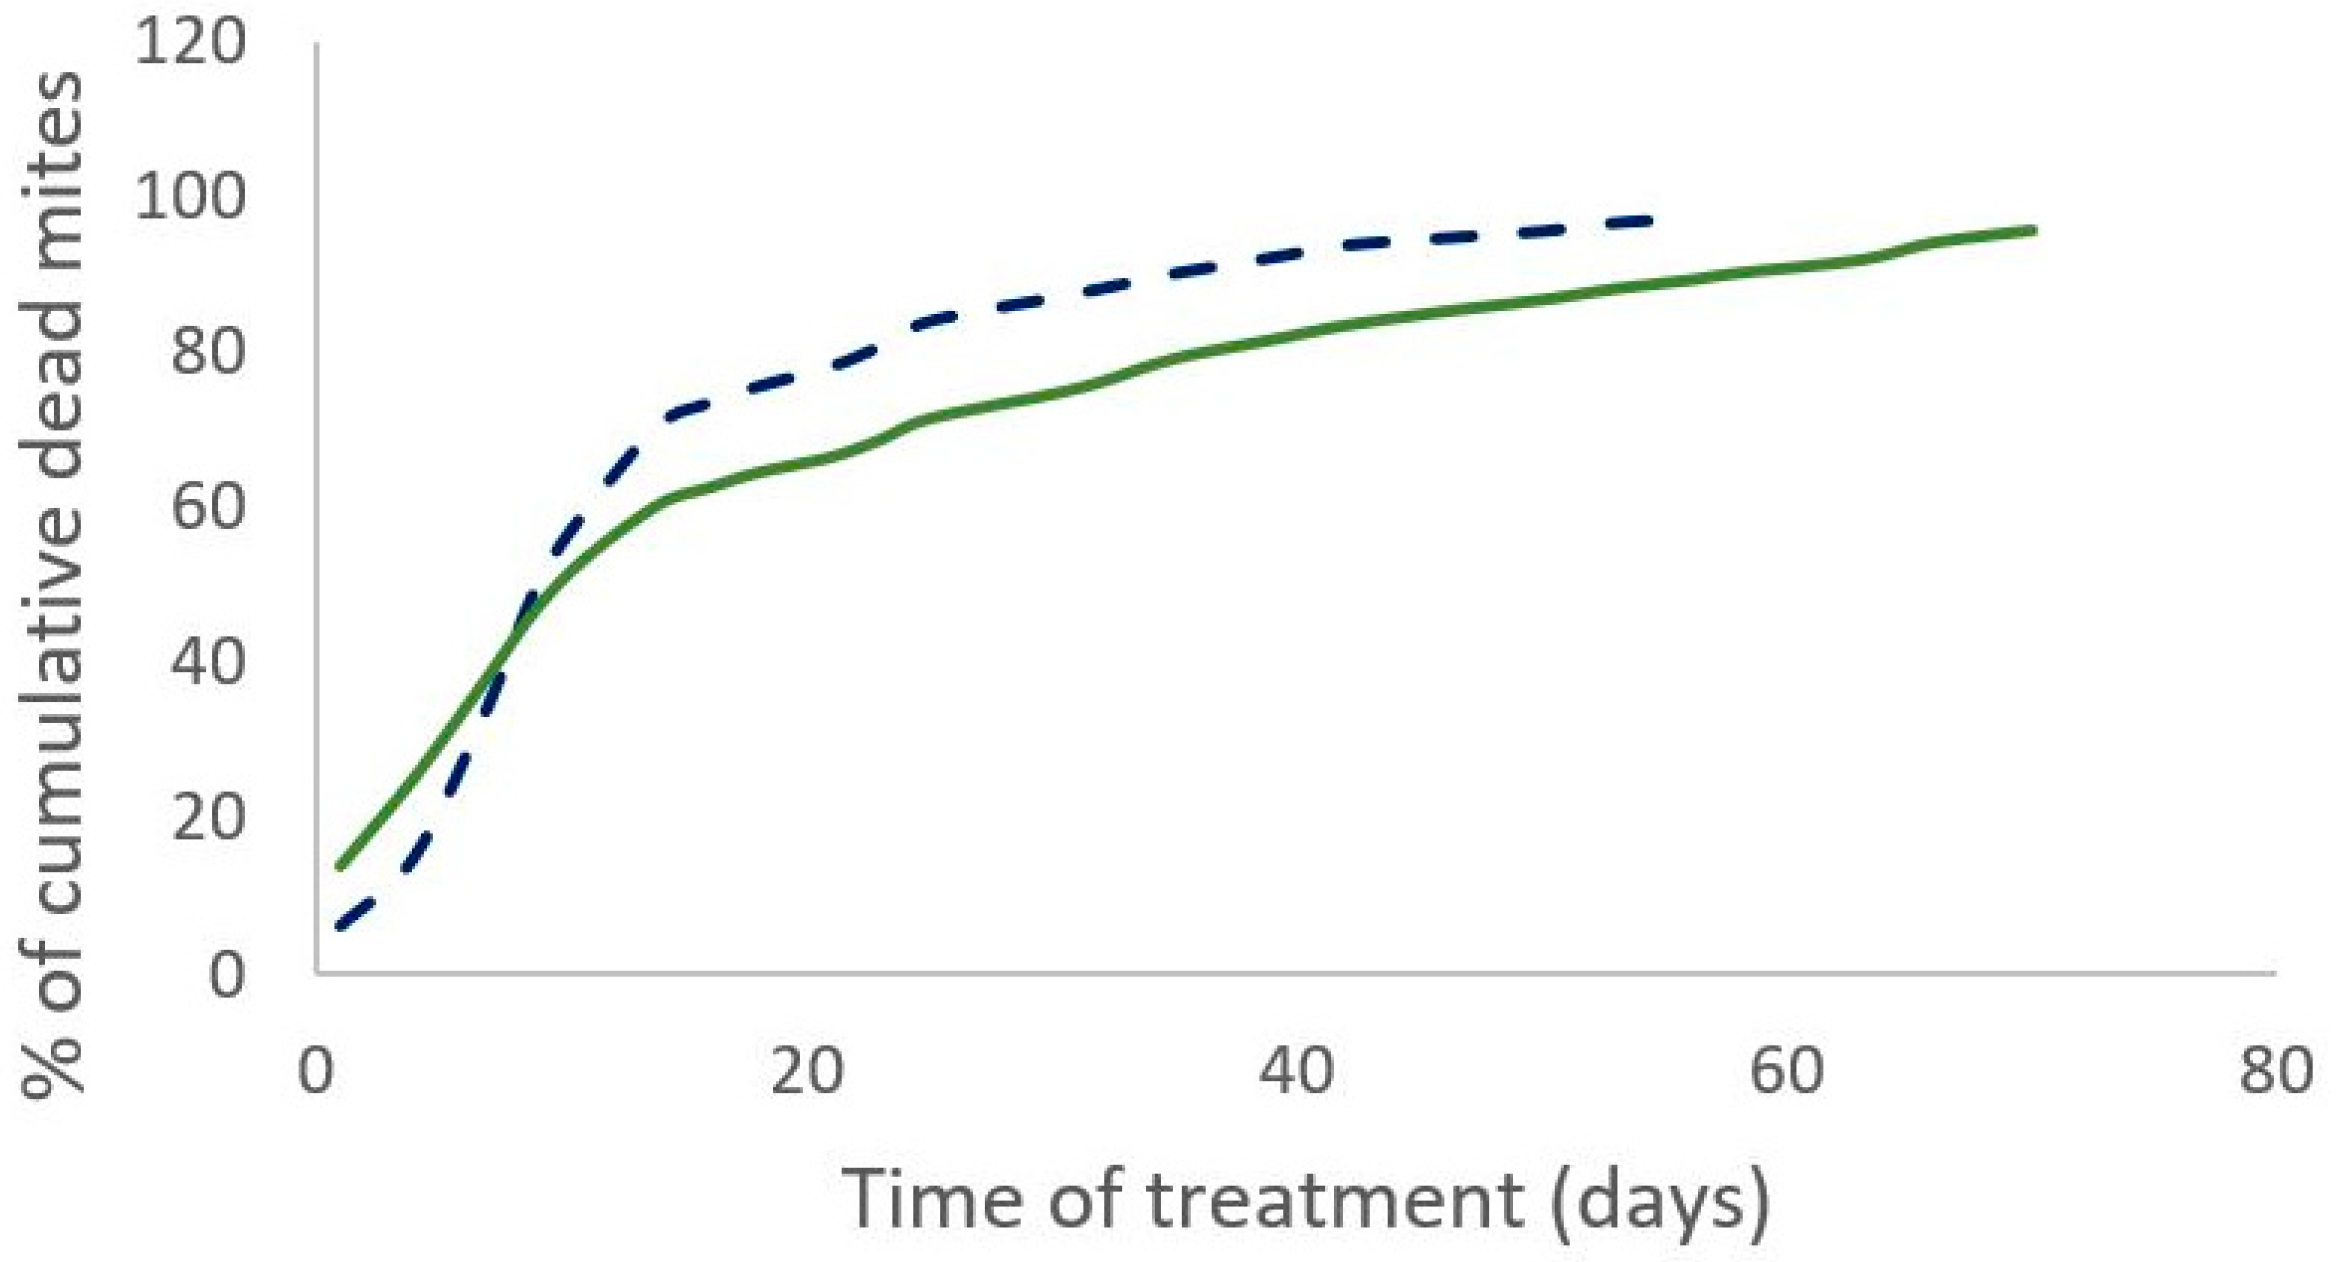
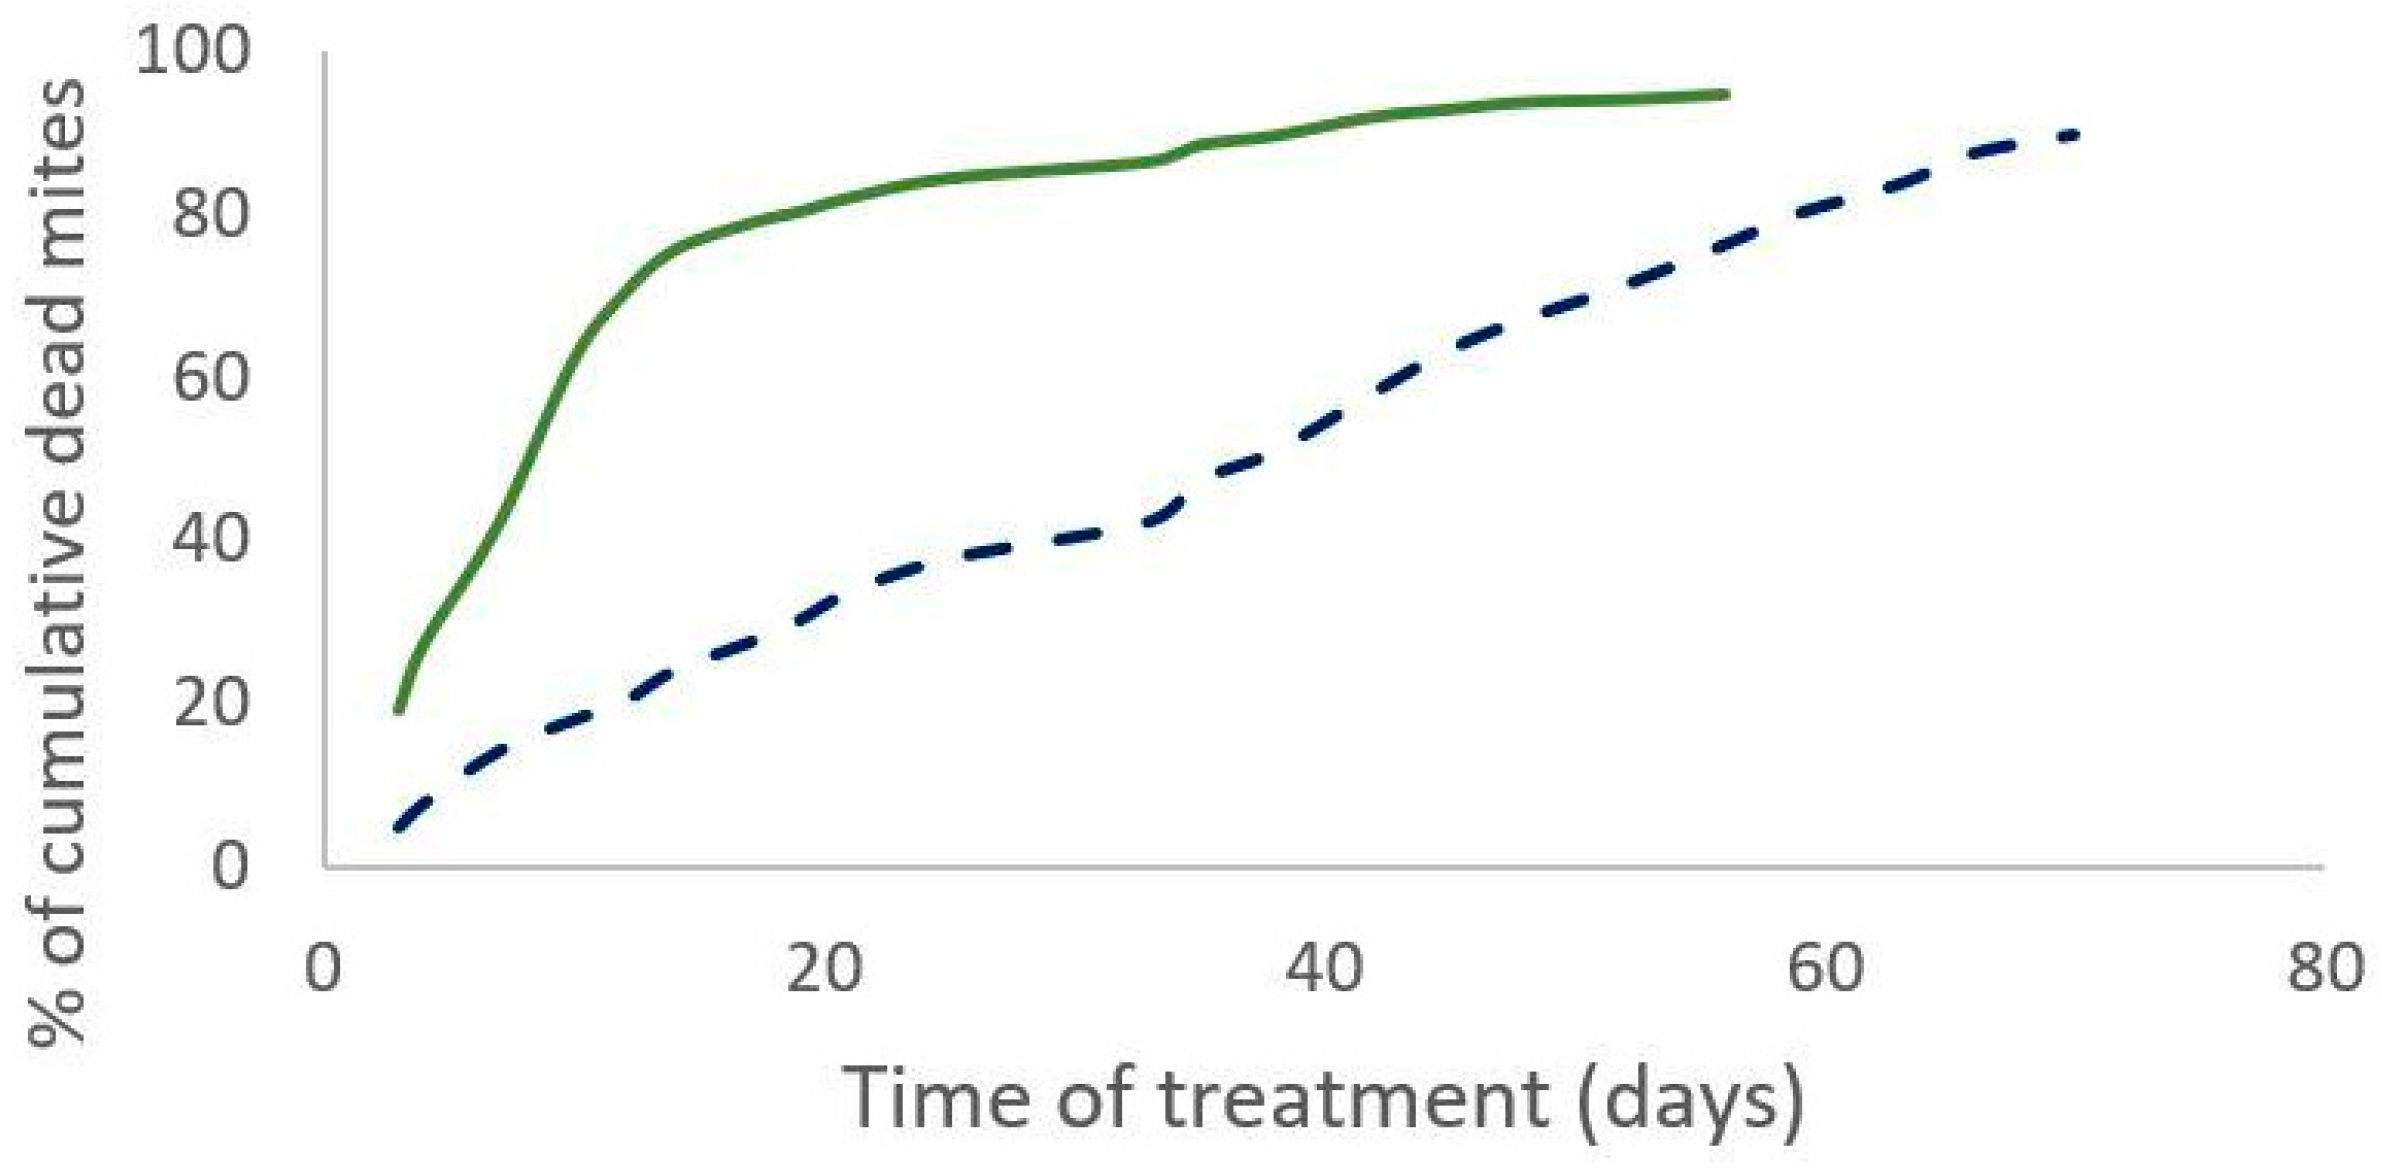
3.1. Field Efficacy
3.2. Modeling Efficacy
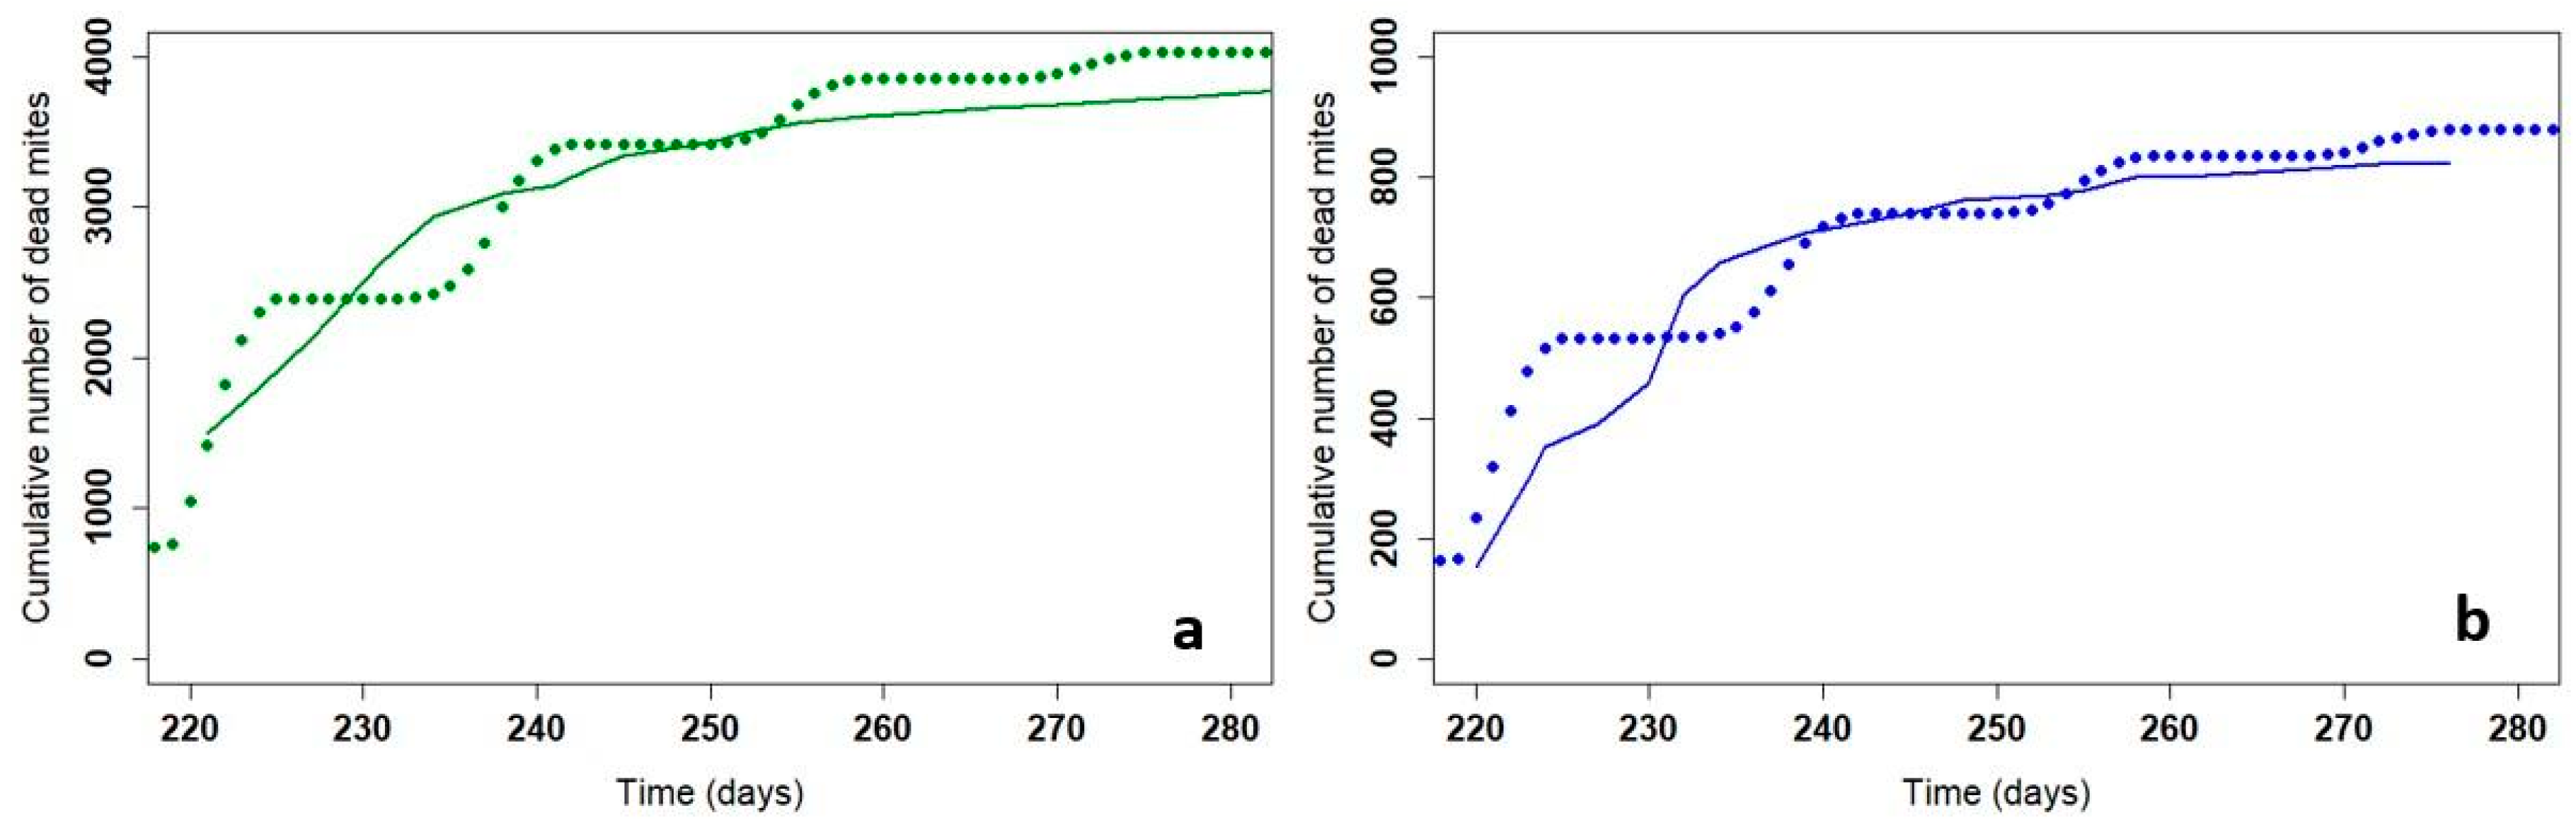
3.2.1. Validation of Apivar® and Supatraz®
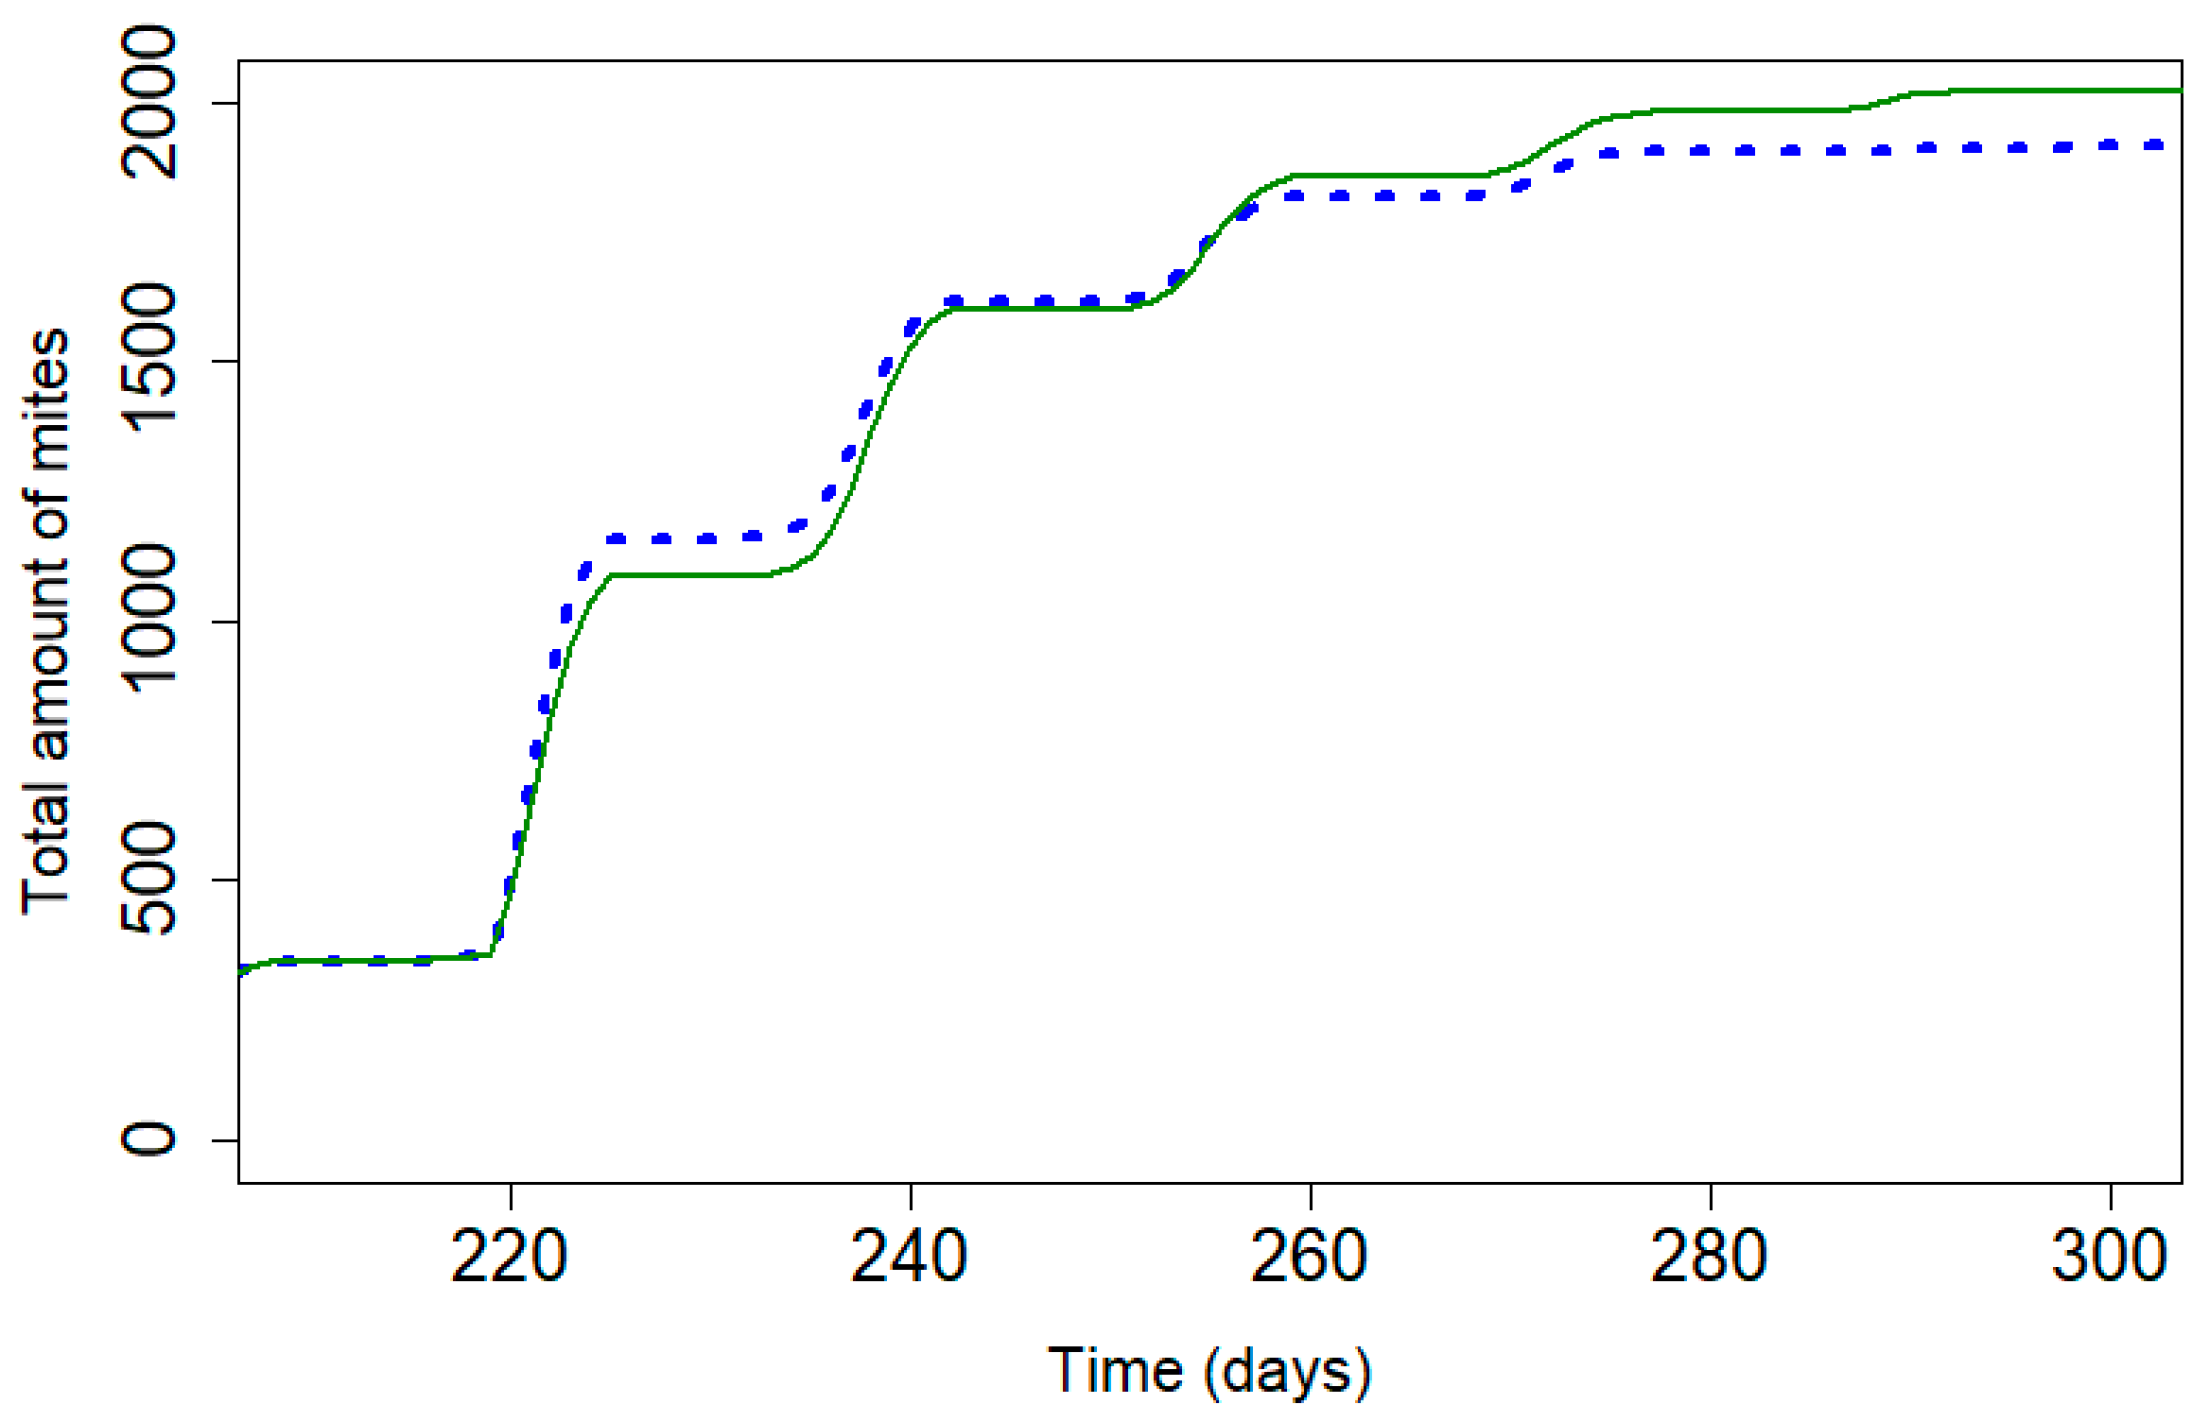
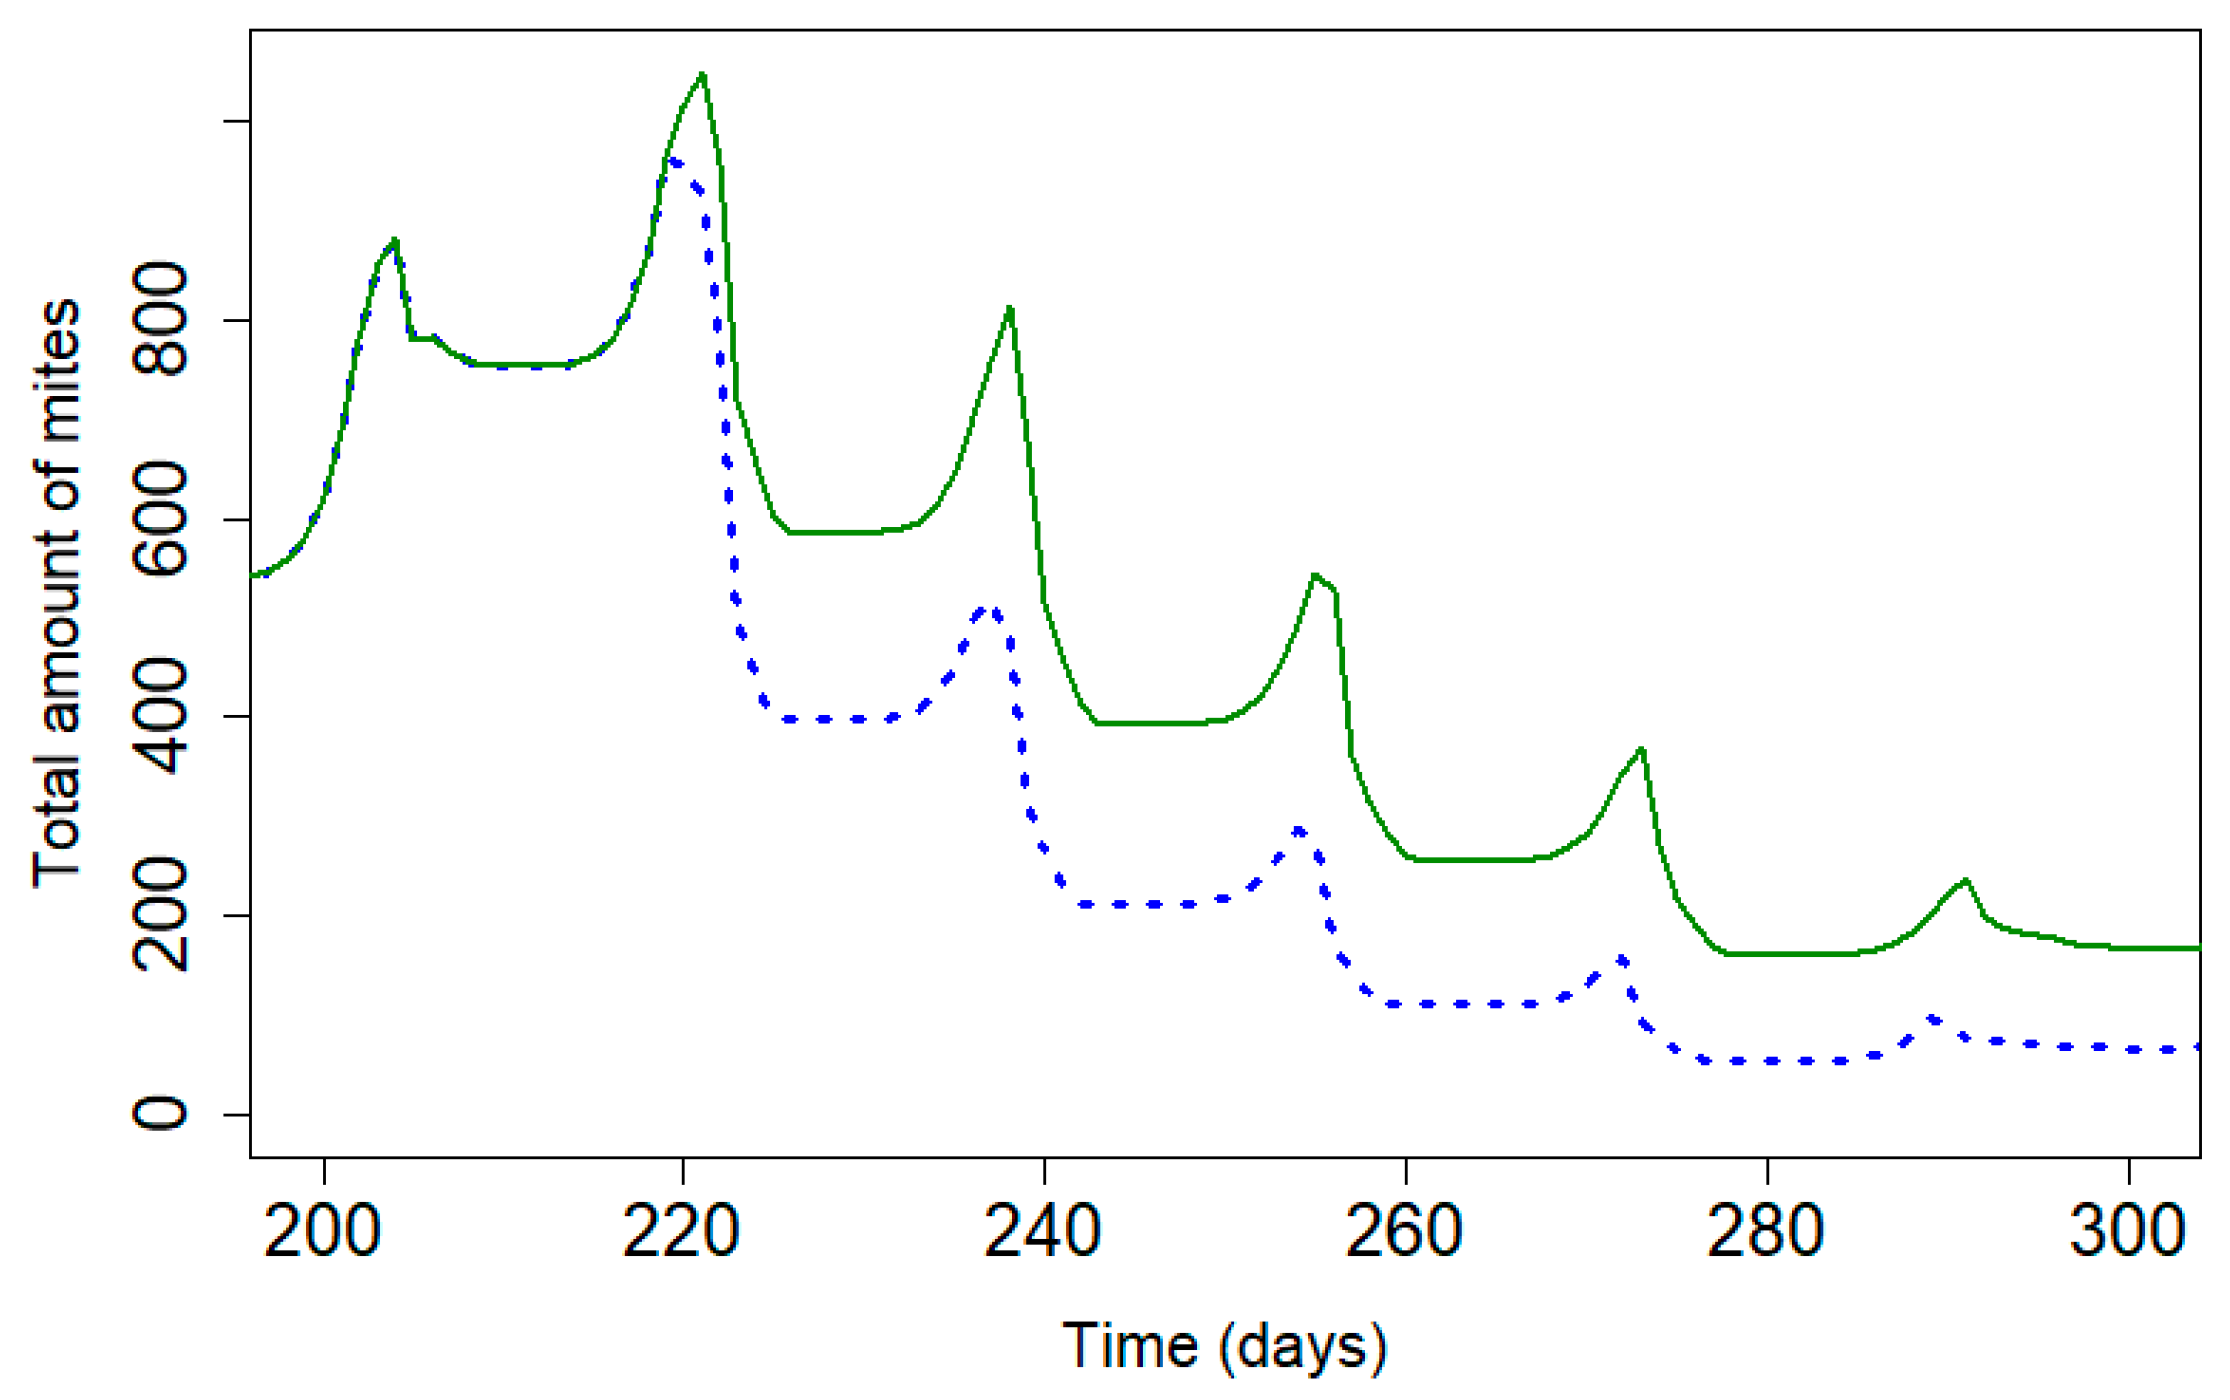
3.2.2. Stabilization of the Mite Population with Supatraz® and Apivar®
3.3. Influence of Decreasing Efficacy on Mite Population
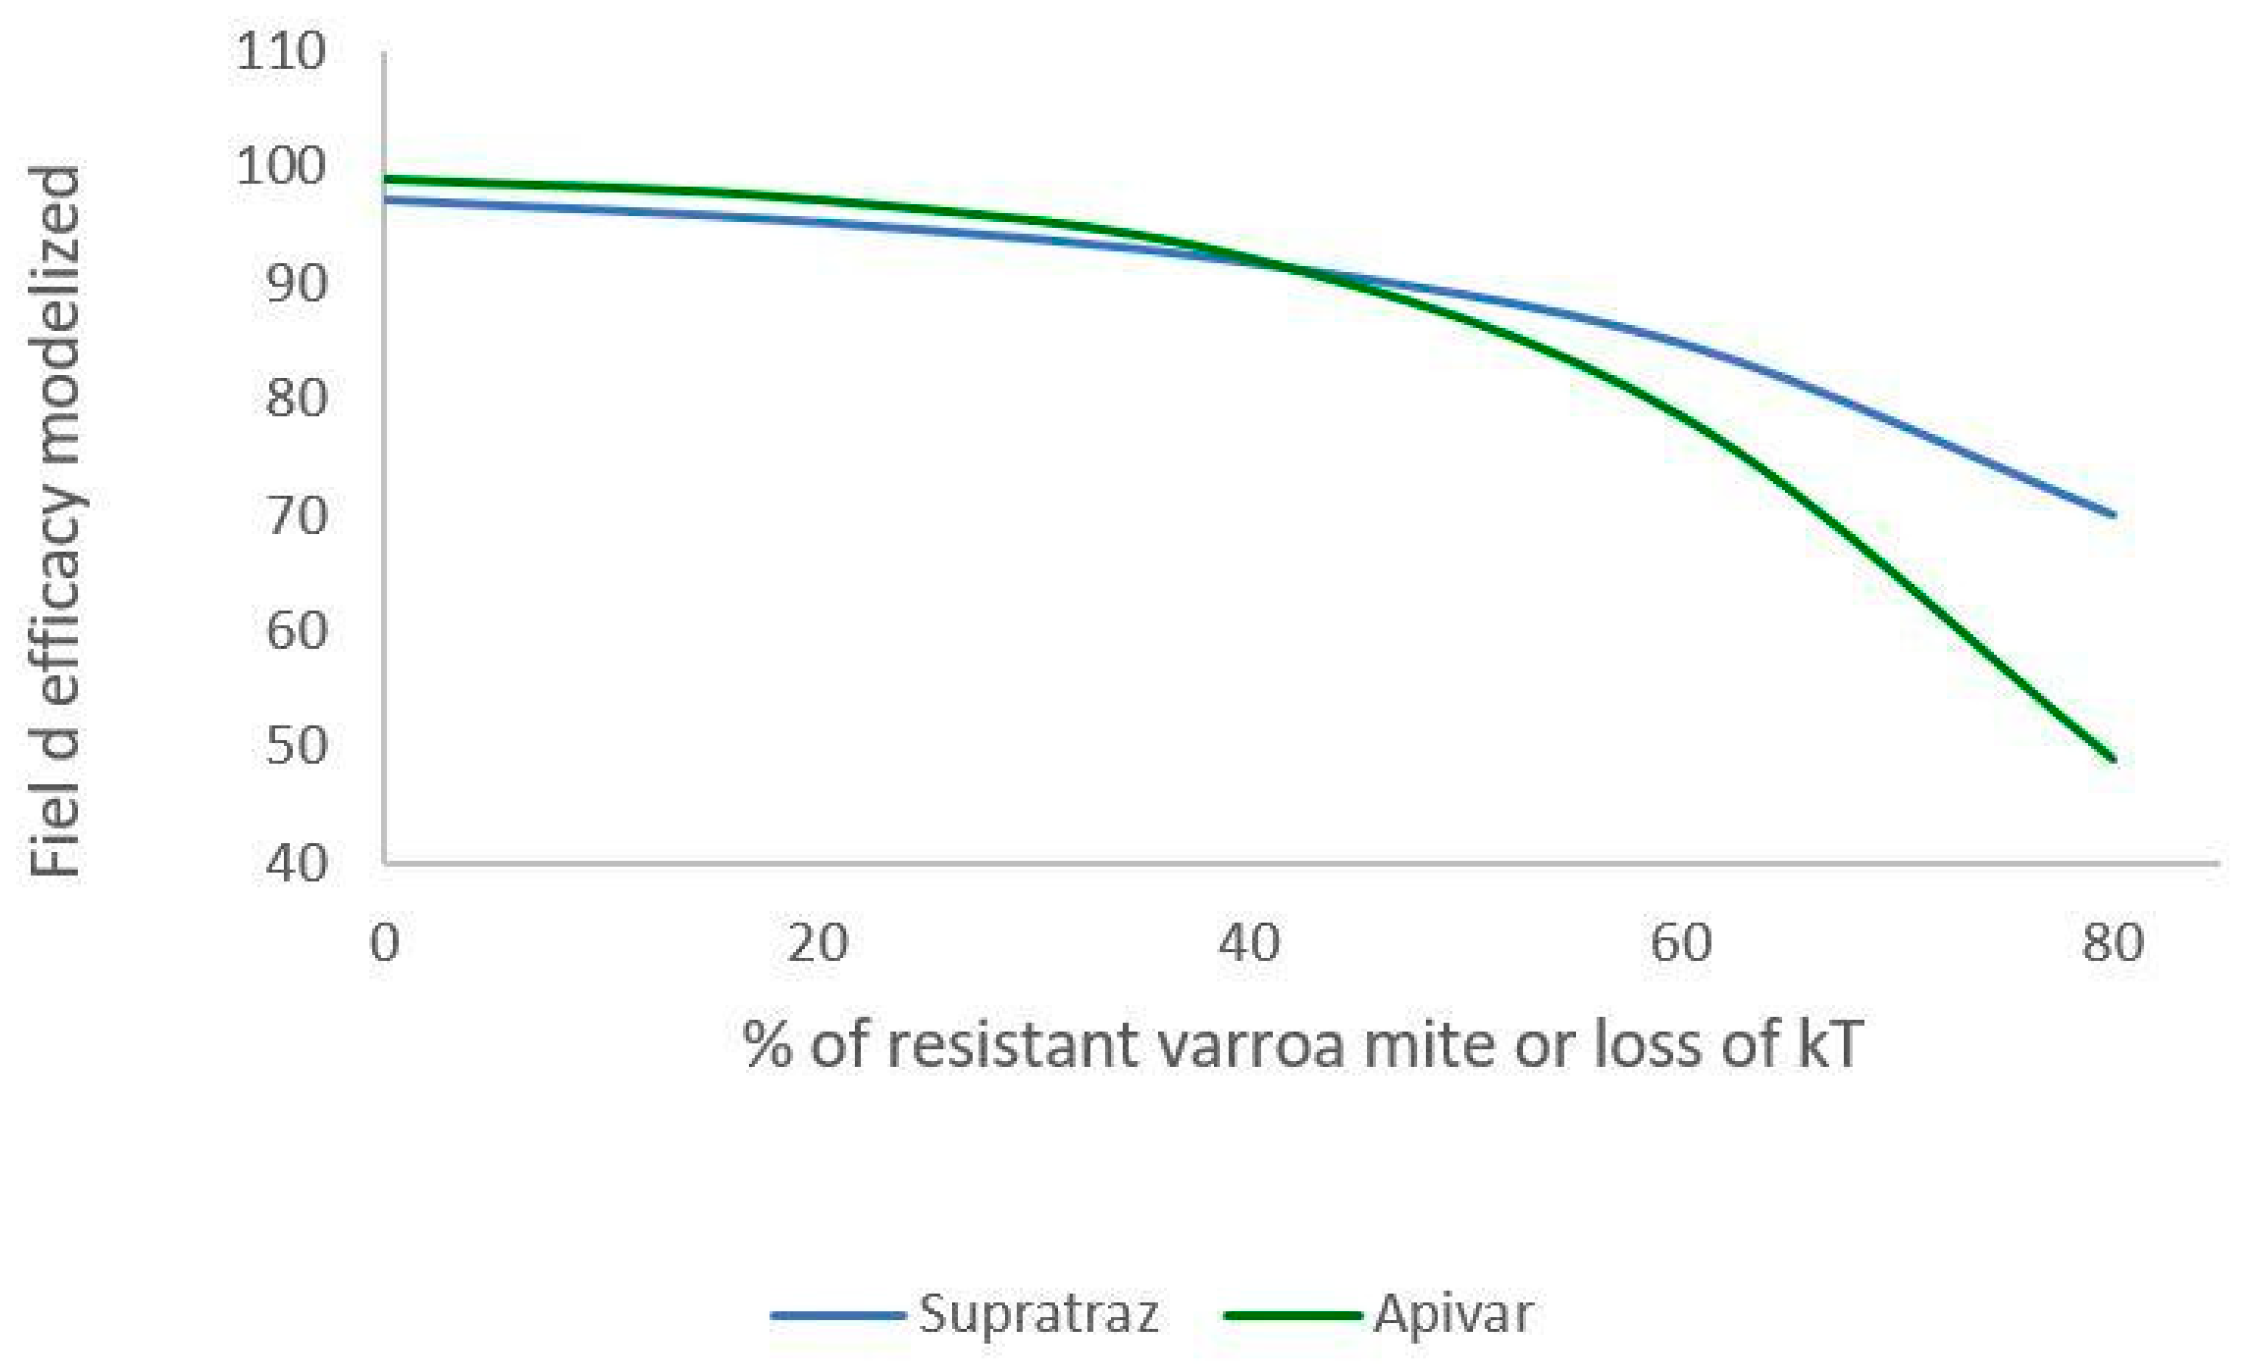
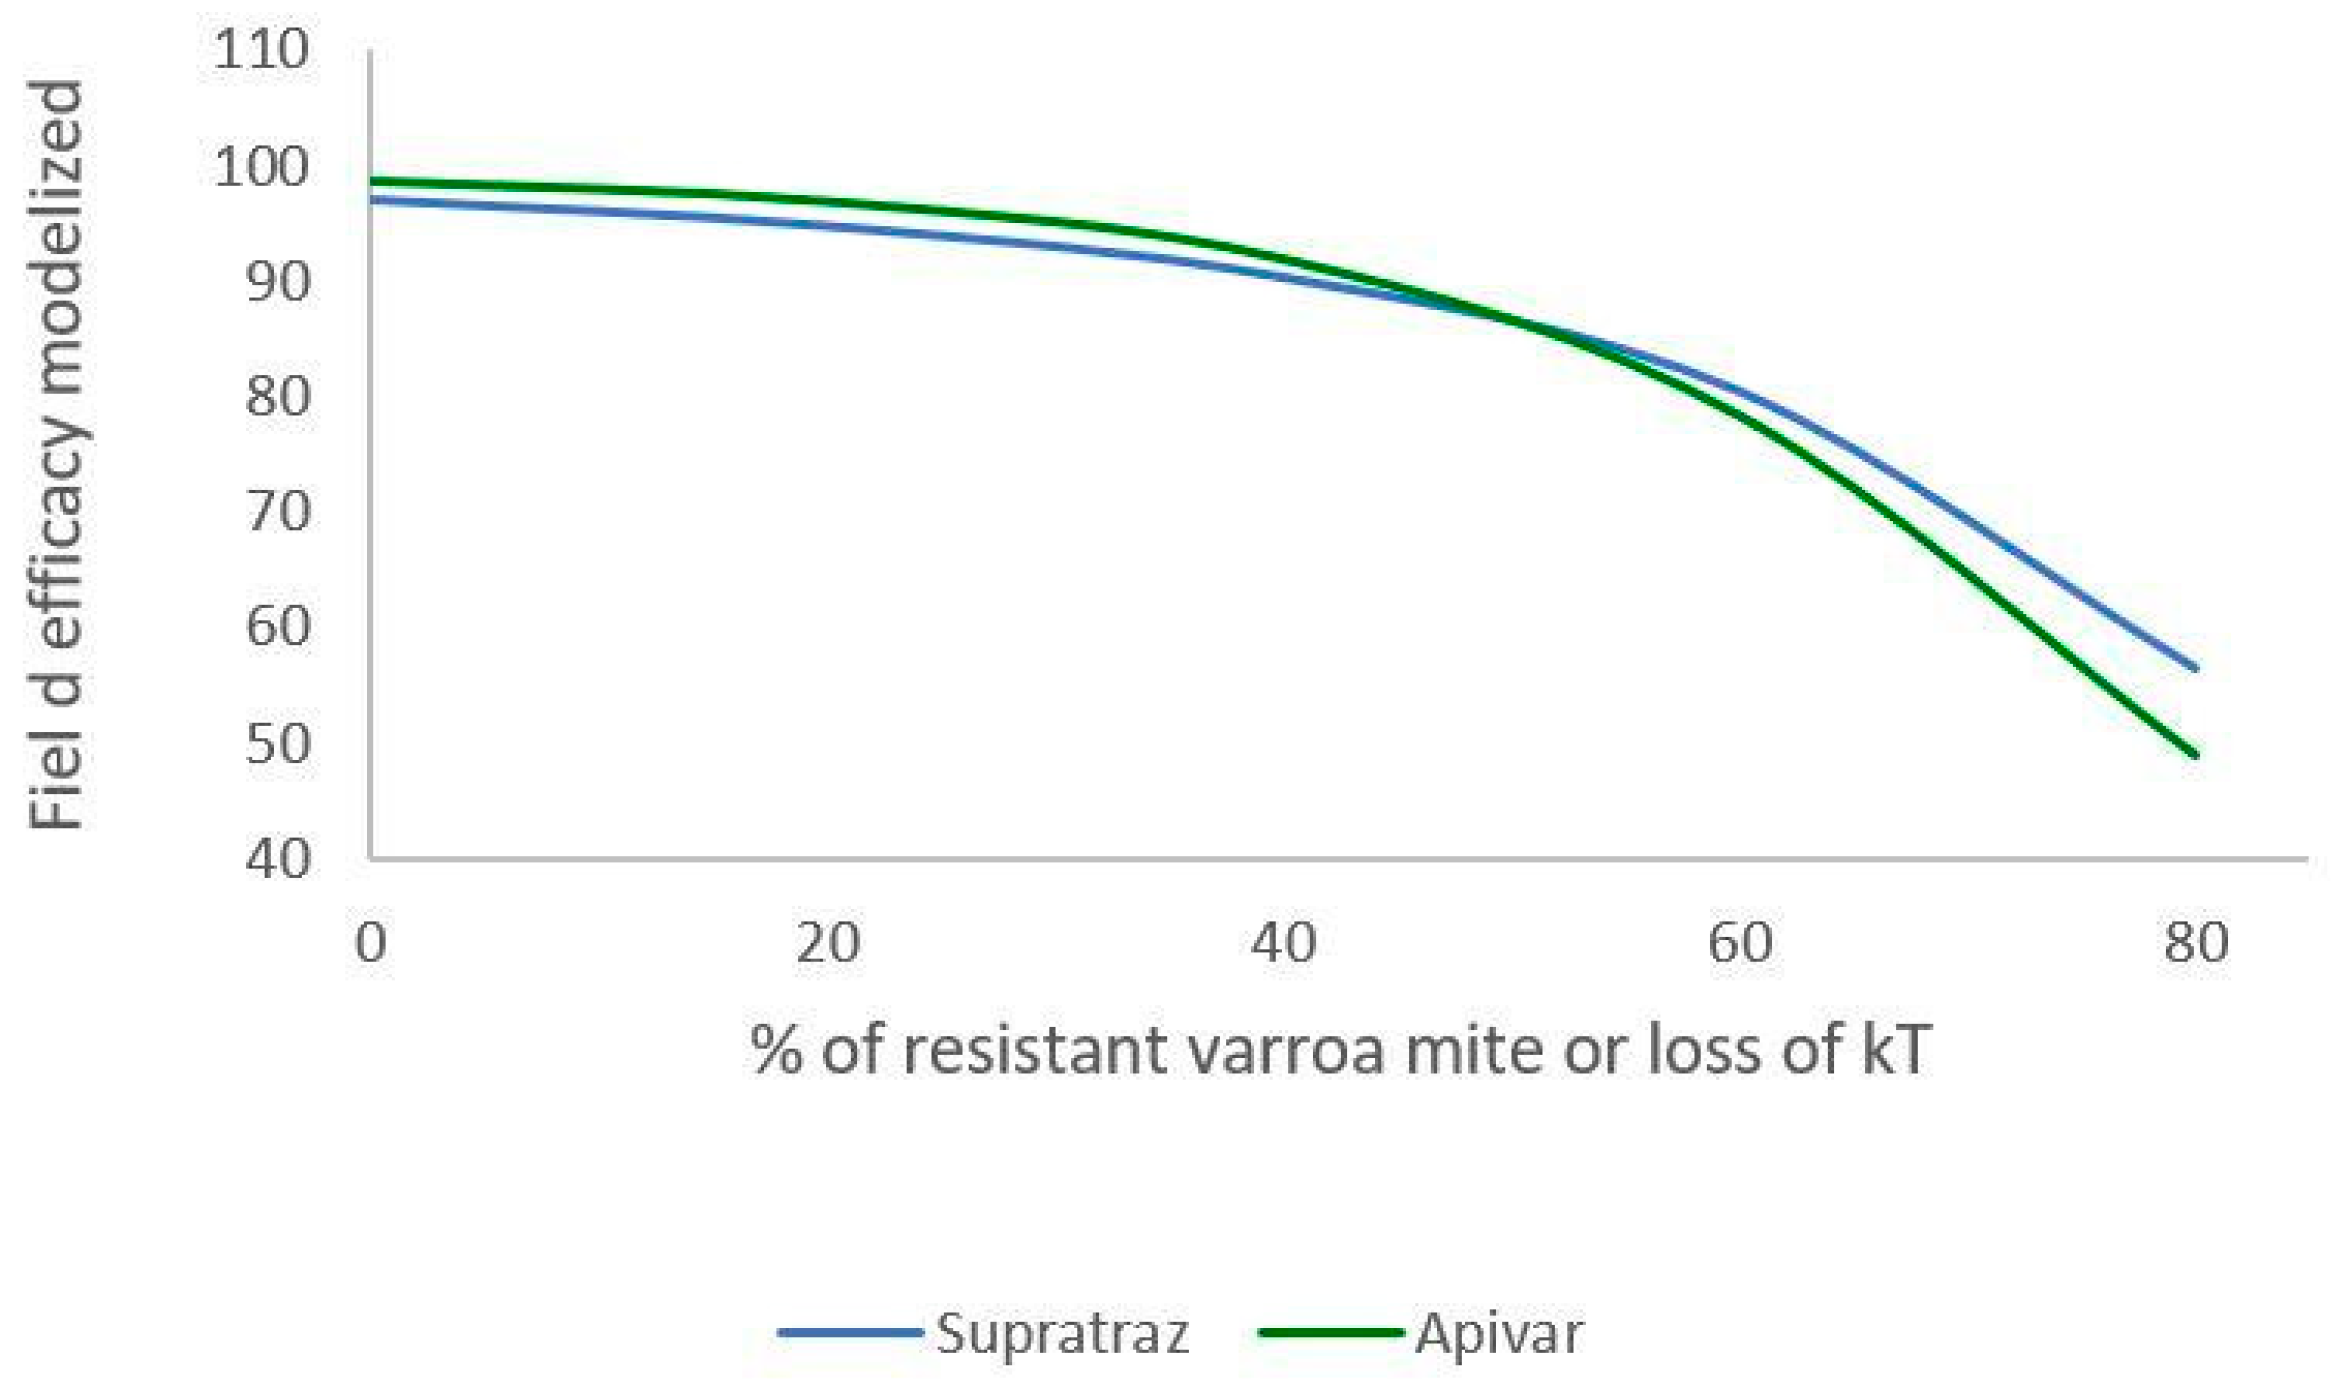
3.4. Influence of Resistant Mites on Treatment Efficacy
4. Discussion
5. Conclusions
Author Contributions
Funding
Institutional Review Board Statement
Informed Consent Statement
Data Availability Statement
Acknowledgments
Conflicts of Interest
References
- Anderson, D.; Trueman, J. Varroa jacobsoni (Acari: Varroidae) is more than one species. Exp. Appl. Acarol. 2000, 24, 165–189. [Google Scholar] [CrossRef]
- Beaurepaire, A.; Piot, N.; Doublet, V.; Antunez, K.; Campbell, E.; Chantawannakul, P.; Chejanovsky, N.; Gajda, A.; Heerman, M.; Panziera, D.; et al. Diversity and Global Distribution of Viruses of the Western Honey Bee, Apis mellifera. Insects 2020, 11, 239. [Google Scholar] [CrossRef] [PubMed]
- Traynor, K.S.; Mondet, F.; de Miranda, J.R.; Techer, M.; Kowallik, V.; Oddie, M.A.; Chantawannakul, P.; McAfee, A. Varroa destructor: A Complex Parasite, Crippling Honey Bees Worldwide. Trends Parasitol. 2020, 36, 592–606. [Google Scholar] [CrossRef] [PubMed]
- Rosenkranz, P.; Aumeier, P.; Ziegelmann, B. Biology and control of Varroa destructor. J. Invertebr. Pathol. 2010, 103, S96–S119. [Google Scholar] [CrossRef] [PubMed]
- Roth, M.A.; Wilson, J.M.; Tignor, K.R.; Gross, A.D. Biology and Management of Varroa destructor (Mesostigmata: Varroidae) in Apis mellifera (Hymenoptera: Apidae) Colonies. J. Integr. Pest Manag. 2020, 11, 1. [Google Scholar] [CrossRef]
- Almecija, G.; Poirot, B.; Cochard, P.; Suppo, C. Inventory of Varroa destructor susceptibility to amitraz and tau-fluvalinate in France. Exp. Appl. Acarol. 2020, 82, 1–16. [Google Scholar] [CrossRef] [PubMed]
- Elzen, P.J.; Baxter, J.R.; Spivak, M.; Wilson, W.T. Control of Varroa jacobsoni Oud. resistant to fluvalinate and amitraz using coumaphos. Apidologie 2000, 31, 437–441. [Google Scholar] [CrossRef]
- Kamler, M.; Nesvorna, M.; Stara, J.; Erban, T.; Hubert, J. Comparison of tau-fluvalinate, acrinathrin, and amitraz effects on susceptible and resistant populations of Varroa destructor in a vial test. Exp. Appl. Acarol. 2016, 69, 1–9. [Google Scholar] [CrossRef] [PubMed]
- Maggi, M.D.; Ruffinengo, S.R.; Gende, L.B.; Eguaras, M.J.; Sardella, N.H. LC50 baseline levels of amitraz, coumaphos, fluvalinate and flumethrin in populations of Varroa destructor from Buenos Aires Province, Argentina. J. Apic. Res. 2008, 47, 292–295. [Google Scholar] [CrossRef]
- Milani, N. The resistance of Varroa jacobsoni Oud to pyrethroids: A laboratory assay. Apidologie 1995, 26, 415–429. [Google Scholar] [CrossRef]
- Trouiller, J. Monitoring Varroa jacobsoni resistance to pyrethroids in western Europe. Apidologie 1998, 29, 537–546. [Google Scholar] [CrossRef]
- Adjlane, N. Evaluation of the resistance of the mite Varroa destructor to the amitraz in colonies of the honey bees (Apis mellifera) in Algeria. Uludağ Arıcılık Derg. 2017, 17, 1–6. [Google Scholar] [CrossRef]
- Rinkevich, F.D. Detection of amitraz resistance and reduced treatment efficacy in the Varroa Mite, Varroa destructor, within commercial beekeeping operations. PLoS ONE 2020, 15, e0227264. [Google Scholar] [CrossRef]
- A Berry, J.; Bartlett, L.J.; Bruckner, S.; Baker, C.; Braman, S.K.; Delaplane, K.S.; Williams, G.R. Assessing Repeated Oxalic Acid Vaporization in Honey Bee (Hymenoptera: Apidae) Colonies for Control of the Ectoparasitic Mite Varroa destructor. J. Insect Sci. 2022, 22, 15. [Google Scholar] [CrossRef] [PubMed]
- Bava, R.; Castagna, F.; Palma, E.; Marrelli, M.; Conforti, F.; Musolino, V.; Carresi, C.; Lupia, C.; Ceniti, C.; Tilocca, B.; et al. Essential Oils for a Sustainable Control of Honeybee Varroosis. Vet. Sci. 2023, 10, 308. [Google Scholar] [CrossRef] [PubMed]
- Hillesheim, E.; Ritter, W.; Bassand, D. First data on resistance mechanisms of Varroa jacobsoni (OUD.) against tau-fluvalinate. Exp. Appl. Acarol. 1996, 20, 283–296. [Google Scholar] [CrossRef]
- González-Cabrera, J.; Rodríguez-Vargas, S.; Davies, T.G.E.; Field, L.M.; Schmehl, D.; Ellis, J.D.; Krieger, K.; Williamson, M.S. Novel Mutations in the Voltage-Gated Sodium Channel of Pyrethroid-Resistant Varroa destructor Populations from the Southeastern USA. PLoS ONE 2016, 11, e0155332. [Google Scholar] [CrossRef] [PubMed]
- Millán-Leiva, A.; Marín, Ó.; De la Rúa, P.; Muñoz, I.; Tsagkarakou, A.; Eversol, H.; Christmon, K.; Vanengelsdorp, D.; González-Cabrera, J. Mutations associated with pyrethroid resistance in the honey bee parasite Varroa destructor evolved as a series of parallel and sequential events. J. Pest Sci. 2021, 94, 1505–1517. [Google Scholar] [CrossRef]
- Hernández-Rodríguez, C.S.; Moreno-Martí, S.; Almecija, G.; Christmon, K.; Johnson, J.D.; Ventelon, M.; Vanengelsdorp, D.; Cook, S.C.; González-Cabrera, J. Resistance to amitraz in the parasitic honey bee mite Varroa destructor is associated with mutations in the β-adrenergic-like octopamine receptor. J. Pest Sci. 2022, 95, 1179–1195. [Google Scholar] [CrossRef]
- Brodschneider, R.; Schlagbauer, J.; Arakelyan, I.; Ballis, A.; Brus, J.; Brusbardis, V.; Cadahía, L.; Charrière, J.-D.; Chlebo, R.; Coffey, M.F.; et al. Spatial clusters of Varroa destructor control strategies in Europe. J. Pest Sci. 2023, 96, 759–783. [Google Scholar] [CrossRef]
- Apivar—Sachet de 10 Lanières—VETO PHARMA|France Véto. Available online: https://france-veto.com/produit/apivar-sachet-de-10-lanieres-veto-pharma/ (accessed on 26 January 2024).
- Code International de Conduite Pour la Distribution et l’utilisation des Pesticides (Version Révisée): (Version Adoptée lors de la Cent Vingt-troisième Session du Conseil de la FAO en Novembre 2002); FAO: Rome, Italy, 2003.
- Almecija, G.; Poirot, B.; Ventelon, M.; Suppo, C. Modelling the impact of Apivar treatment on a Varroa mite population and the influence of resistance. Pest Manag. Sci. 2021, 78, ps.6698. [Google Scholar] [CrossRef] [PubMed]
- Calis, J.N.; Fries, I.; Ryrie, S.C. Population modelling of Varroa jacobsoni Oud. Apidologie 1999, 30, 111–124. [Google Scholar] [CrossRef]
- RCP. Available online: https://www.ircp.anmv.anses.fr/rcp.aspx?NomMedicament=APIVAR+LANIERES+POUR+RUCHES+A+500+MG+D%27AMITRAZ (accessed on 24 January 2024).
- Veterinary Medicinal Products Controlling Varroa Destructor Parasitosis in Bees—Scientific Guideline|European Medicines Agency. [En Ligne]. Available online: https://www.ema.europa.eu/en/veterinary-medicinal-products-controlling-varroa-destructor-parasitosis-bees-scientific-guideline (accessed on 26 January 2024).
- Gracia, M.J.; Moreno, C.; Ferrer, M.; Sanz, A.; Peribáñez, M.; Estrada, R. Field efficacy of acaricides against Varroa destructor. PLoS ONE 2017, 12, e0171633. [Google Scholar] [CrossRef] [PubMed]
- Martin, S.J. The role of Varroa and viral pathogens in the collapse of honeybee colonies: A modelling approach. J. Appl. Ecol. 2001, 38, 1082–1093. [Google Scholar] [CrossRef]
- Bianchi, M.; Barré, N.; Messad, S. Factors related to cattle infestation level and resistance to acaricides in Boophilus microplus tick populations in New Caledonia. Veter-Parasitol. 2003, 112, 75–89. [Google Scholar] [CrossRef]
- Brattsten, L.B.; Holyoke, C.W.; Leeper, J.R.; Raffa, K.F. Insecticide resistance: Challenge to pest management and basic research. Science 1986, 231, 1255–1260. [Google Scholar] [CrossRef]
- Rinkevich, F.D.; Moreno-Martí, S.; Hernández-Rodríguez, C.S.; González-Cabrera, J. Confirmation of the Y215H mutation in the β2-octopamine receptor in Varroa destructor is associated with contemporary cases of amitraz resistance in the United States. Pest Manag. Sci. 2023, 79, 2840–2845. [Google Scholar] [CrossRef]


| Input Variables for Treatment | Description | Variation |
|---|---|---|
| dT | Treatment duration | Variable, from 4 to 12 weeks |
| pT | Treatment period | Variable, from 190 to 250 calendar days |
| kT | Daily mortality P(t) during treatment | Variable, from 0.03 to 1 |
| dT | Treatment duration | Variable, from 4 to 12 weeks |
| Direct Output Variables | ||
| M(t) | Daily number of dead individuals | |
| McumMODEL(t) | Cumulative number of dead individuals |
| Apivar® | Supatraz® | |
|---|---|---|
| Active substance | Amitraz | Amitraz |
| Amitraz quantity per strip (mg) | 500 | 700 |
| Weight per strip (g) | 15 g | 12.52 g |
| Treatment duration | 10 weeks (70 days) | 6 to 8 weeks (42–56 days) |
| 2019 | 2020 | |||
|---|---|---|---|---|
| Apivar® | Supatraz® | Apivar® | Supatraz® | |
| Number of beehives | 8 | 12 | 7 | 5 |
| Efficacy (%) ± SE | 95.44 ± 1.19a | 97.36 ± 0.61a | 91.35 ± 2.83a | 94.62 ± 1.45 |
| Average of drop mites ± SE | 2222 ± 438a | 1636 ± 324a | 4324 ± 1256a | 1759 ± 605b |
| Average of remaining mites ± SE | 91 ± 41a | 40 ± 14b | 203 ± 41a | 57.4 ± 8.71b |
| LT90 (days) ± SE | 50.97 ± 4.69a | 28.49 ± 2.14b | 65.27 ± 4.39a | 37.68 ± 4.1b |
| Apivar® | Supatraz® | |
|---|---|---|
| Treatment duration | 10 | 8 |
| Start of treatment | 220 | 220 |
| Pi | 50 | 50 |
| kTAPIVAR and kTSUPATRAZ | 0.265 | 0.3 |
| Percentage of efficacy (to stabilize the population) | 98.77 | 97.17 |
| Slope of the cumulative mite mortality curve (total treatment) | 43 | 25.76 |
| LT90 | 37 | 34 |
| Number of cumulative dead mites | 1534 | 1397 |
| Varroa mites remaining | 19 | 39 |
| Maximum number of mites in the year | 963 | 963 |
| Efficacy | Apivar® | Supatraz® | ||||
|---|---|---|---|---|---|---|
| Dead Mites | Remaining Mites | LT90 (Days) | Dead Mites | Remaining Mites | LT90 (Days) | |
| 99% | 1505 | 15 | 37 | 1363 | 13 | 33 |
| 95% | 1704 | 88 | 57 | 1529 | 80 | 35 |
| 90% | 1776 | 196 | 70 | 1653 | 183 | 38 |
Disclaimer/Publisher’s Note: The statements, opinions and data contained in all publications are solely those of the individual author(s) and contributor(s) and not of MDPI and/or the editor(s). MDPI and/or the editor(s) disclaim responsibility for any injury to people or property resulting from any ideas, methods, instructions or products referred to in the content. |
© 2024 by the authors. Licensee MDPI, Basel, Switzerland. This article is an open access article distributed under the terms and conditions of the Creative Commons Attribution (CC BY) license (https://creativecommons.org/licenses/by/4.0/).
Share and Cite
Almecija, G.; Poirot, B.; Mielgo, P.; Watkins, M.; Suppo, C. Influence of Amitraz-Based Product Characteristics on Varroa Mite Population Control. Parasitologia 2024, 4, 71-81. https://0-doi-org.brum.beds.ac.uk/10.3390/parasitologia4010006
Almecija G, Poirot B, Mielgo P, Watkins M, Suppo C. Influence of Amitraz-Based Product Characteristics on Varroa Mite Population Control. Parasitologia. 2024; 4(1):71-81. https://0-doi-org.brum.beds.ac.uk/10.3390/parasitologia4010006
Chicago/Turabian StyleAlmecija, Gabrielle, Benjamin Poirot, Paulo Mielgo, Max Watkins, and Christelle Suppo. 2024. "Influence of Amitraz-Based Product Characteristics on Varroa Mite Population Control" Parasitologia 4, no. 1: 71-81. https://0-doi-org.brum.beds.ac.uk/10.3390/parasitologia4010006