
Raman Sensor for the Determination of Gas Solubility


Applied Thermodynamics, Chemnitz University of Technology, 09107 Chemnitz, Saxony, Germany
*
Author to whom correspondence should be addressed.
Physchem 2021, 1(2), 176-188; https://0-doi-org.brum.beds.ac.uk/10.3390/physchem1020012
Submission received: 24 June 2021
/
Revised: 27 July 2021
/
Accepted: 28 July 2021
/
Published: 4 August 2021
(This article belongs to the Special Issue Physical Chemistry Perspectives for the New Decade)
Abstract
:Efficient and environmentally responsible use of resources requires the development and optimization of gas separation processes. A promising approach is the use of liquids that are designed for specific tasks, e.g., the capture of carbon dioxide or other greenhouse gases. This requires an accurate determination of gas solubilities for a broad range of temperatures and pressures. However, state of the art measurement techniques are often very time consuming or exhibit other pitfalls that prevent their use as efficient screening tools. Here, we show that the application of Raman spectroscopy through a compact measuring system can simplify data acquisition for the determination of gas solubilities in liquids. To demonstrate that this approach is expedient, we determined gas solubilities of carbon dioxide in water for three isotherms T = (288.15, 293.15, 298.15) K over a pressure range from p = (0.5–5) MPa and in three imidazolium-based ionic liquids for one isotherm T = 298.15 K at pressures from p = (0.1–5) MPa. When compared to data in the literature, all results are within the reported uncertainties of the measurement techniques involved. The developed analysis method eliminates the need for a lengthy volume or mass calibration of the sample prior to the measurements and, therefore, allows for fast screening of samples, which can help to advance gas separation processes in scientific and industrial applications.
1. Introduction
Numerous fields in science and industry rely on the determination of gas solubility in liquids. It is a very diverse topic that combines application-oriented science with basic research that extends to the fundamental principles of solvation. It is relevant not only for water [1,2,3,4,5,6] but also for other solvents, e.g., aqueous solutions [7,8,9], hydrocarbons [10,11], physiological solutions [12], and ionic liquids (ILs) [13,14,15,16].
An accurate and reliable determination of gas solubility is crucial for many research areas. This includes unprecedented environmental challenges due to an excessive emission of carbon dioxide which leads, for instance, to a decrease in the pH value of seawater, thus affecting the mortality rate of deep-sea organisms [3,17]. Carbon Capture and Storage (CCS) technologies are, therefore, explored thoroughly as one of the many approaches to reduce carbon dioxide emissions [18]. The capture of carbon dioxide from industrial processes is as reliant on solubility measurements as the gas separation processes which are needed for the efficient use of resources and often involve the application of tailor-made liquids for the separation of specific gases [7]. Investigations of oxygen transfer processes in sewage water [19] or hydrothermal fluids [20] also benefit greatly from gas solubility measurements, and since specific chemical reactions, such as hydrogenations, require the presence of dissolved gas, a suitable solvent has to be identified prior to the reactions [21,22,23]. However, even state of the art analytical [24] and synthetic [25] methods to measure solubility often have severe disadvantages, thus requiring the development of new measurement techniques. Some of the existing approaches need large amounts of sample [6], extensive sample preparation [8], suffer from long data acquisition times [9] or require frequent sampling and, therefore, disturb the vapor-liquid equilibrium (VLE) [4,6]. Since the first systematic measurements by Bunsen in 1855 [26,27,28], a large variety of approaches has been proposed to determine gas solubilities in liquids. Gravimetric [15] and volumetric [29] methods are used, as well as measurement of the bubble-point pressure [5], calorimetry [9], and gas chromatography [4,6]. Vibrational spectroscopy methods such as Raman spectroscopy have been used for solubility measurements as well, e.g., see [1,2,3,30,31,32,33]. They offer several advantages over other conventional methods, which include the possibility of in-situ measurements during reactions or processes and an on-line monitoring of the investigated sample. Optical methods can be easily applied even in harsh environmental conditions [3], but often require long calibration procedures prior to the measurements.
Here, we present a new application of Raman spectroscopy for solubility measurements of gases in liquids. Our approach enables a comparatively straightforward utilization of a spectroscopic method without the need of extensive calibration routines. Samples of unknown mass or volume can be easily characterized based on the molecular density of both the solvent and the solute. A calibration of the Raman system prior to the actual measurements, e.g., with samples of known carbon dioxide concentration, is not necessary with our method, since the calibration is done in parallel to the determination of the solubility. We utilize a compact and relatively simple Raman system for measurements of carbon dioxide in water and three imidazolium-based ionic liquids. The first results after commissioning of the apparatus were in good agreement with literature data, and thus we have come to the conclusion that this is a new and promising measurement method.
2. Materials and Methods
2.1. Experimental Setup
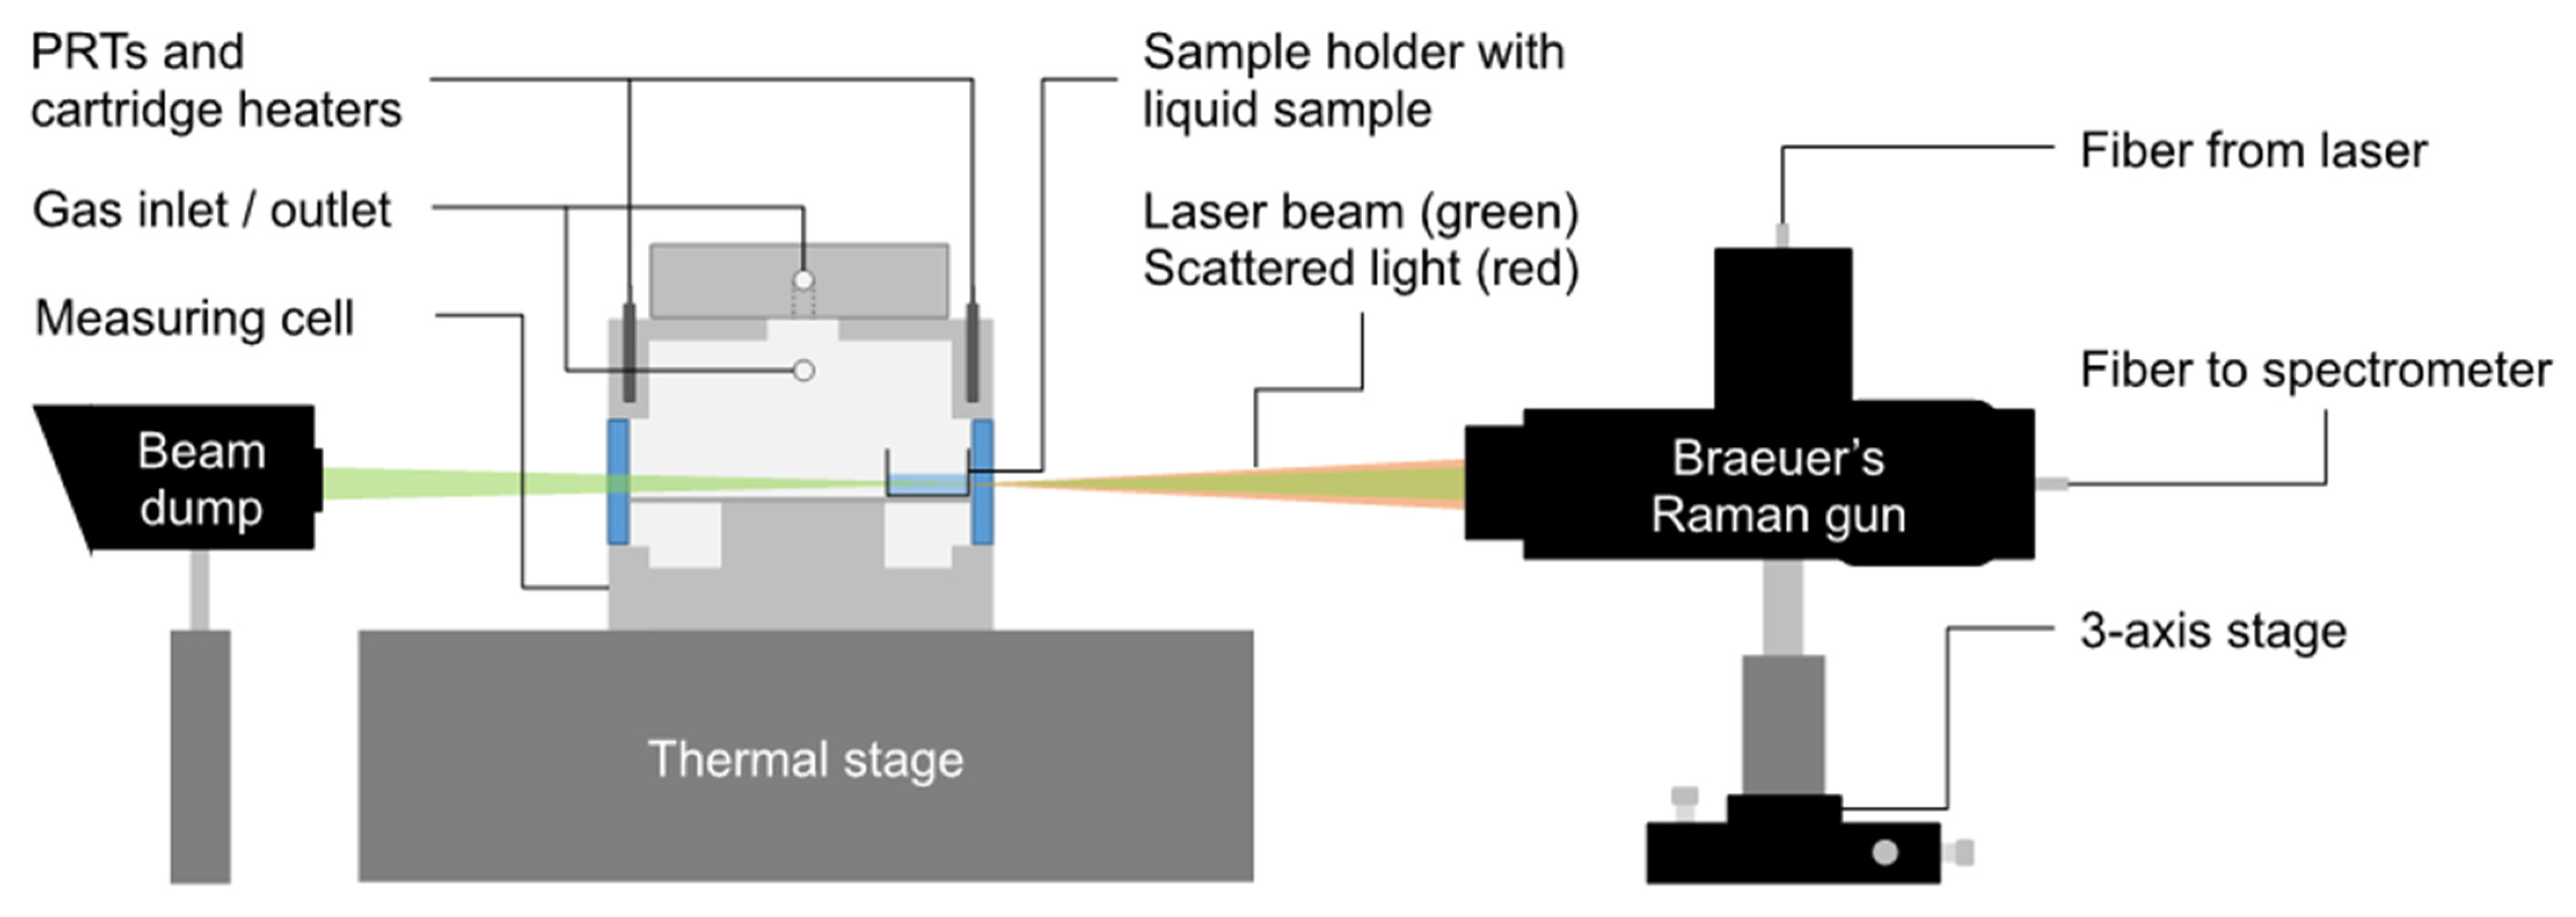
The experimental setup is shown in Figure 1. It consists of a custom-made measuring cell fabricated from stainless steel and a compact backscattering Raman setup.
In our experimental setup, signal detection is realized with Braeuer’s Raman gun (BRG) mounted on a 3-axis micrometer stage (RB13M/M, Thorlabs, Newton, NJ, USA) in connection with a fiber-coupled spectrometer (QEPro, Ocean Insight, Orlando, FL, USA). The BRG has already been described before [34,35], so only a brief description is given here. It consists of several optical elements that guide the inelastically scattered light from the measuring cell into an optical fiber, which subsequently transfers the signals to the spectrometer. A dichroitic mirror in the center of the Raman gun ensures that collimated light from the excitation laser with a wavelength shorter than λ = 532 nm is reflected into the cell, and inelastically scattered signals with a shifted wavelength that are longer than λ = 544 nm can pass freely. Elastically scattered light is removed by a long-pass filter, which is installed before the fiber that is connected to the spectrometer. The samples are excited with a frequency-doubled Nd:YAG laser with a wavelength of λ = 532 nm and an adjustable power output of P = 400 mW (MSL-FN, PhotonTec, Berlin, Germany). The circular sample holder (dimensions: do = 11.65 mm, di = 10.55 mm, h = 7.65 mm) is fabricated from borosilicate glass as are the windows of the measuring cell. The cell is connected to a diaphragm vacuum pump (DIVAC 4,8VT, Leybold, Cologne, Germany) with an ultimate pressure of pult ≤ 200 Pa. A piezoresisitive pressure transducer (PAA-33X, KELLER AG, Winterthur, Switzerland) with an expanded uncertainty (k = 1.73) of 5 kPa is used to monitor the pressure throughout the measurements.
Temperature regulation of the measuring cell is realized with two temperature controllers. A custom-made temperature controller is connected to four Peltier elements located at the bottom of the measuring cell (thermal stage) and is used for a rough regulation of the temperature. A second temperature controller (TEMP-2200, Fluke, Everett, WA, USA), which is connected to two cartridge heaters (S/HS/PT-8/80/125/230-A, Heinz Stegmeier GmbH, Fridingen, Germany) is used for the fine regulation of the temperature and enables temperature stability of 5 mK. For temperature measurements, a resistance bridge (MKT50, Anton Paar, Graz, Austria) is used in combination with two 100 Ω platinum resistance thermometers (PRTs). Both PRTs were calibrated by comparison in a specific temperature range to ensure ITS-90 compliance. Their resistance is checked regularly at the triple point of water. The uncertainty of the temperature measurement (k = 2) is 45 mK (TEMP-5606-50-B, Fluke, USA) and 85 mK (P-M-1/10-3-50-0-TS-2, Omega Engineering GmbH, Deckenpfronn, Germany), respectively.
2.2. Experimental Material
Research-grade chemicals were used for all experiments. They were used as received without any further analysis or purification, except for water. Details of all fluids are described in Table 1. Water was purified with a mixed-bed water demineralizer (DI 2000, Thermo Scientific, Waltham, MA, USA) to reach a water quality of σ = 0.1–20 µS·cm−1; this was required to allow a comparison with solubility data of carbon dioxide in de-ionized water found in the literature.
2.3. Experimental Procedure
The experimental approach for measurements with ionic liquids and water was very similar in each case, but there were a few key differences regarding the handling of the sample prior to the measurements. The sample holder was placed at the window of the measuring cell to avoid additional Raman signals from the carbon dioxide bulk phase during measurements in the liquid samples. In addition, the BRG was adjusted in such a way that the focus point of the laser was set to the far edge of the sample holder to avoid intensity attenuation given by the Beer–Lambert law. Prior to measurements with ionic liquids, the cell was heated to T = 333.15 K and evacuated for three hours to remove any dissolved gas in the sample. After the cell was cooled down to the temperature of the isotherm investigated, a dark spectrum was recorded to capture the baseline offset. Spectra of each ionic liquid were also recorded in vacuum with an illumination time of ti = 6 s. Ten recordings were averaged for one spectrum, and five spectra were recorded in total. After acquisition of the Raman spectra, the data were processed with the WiRe 3.4 software (Renishaw, United Kingdom) to subtract the baseline and determine the relevant peak area. This procedure was not possible with water since it would evaporate at the given conditions. In this case, the measuring cell has been flushed five times with helium to remove any other gas before the dark spectrum was recorded.
Spectra were recorded at each investigated (T, p) state point along the isotherms in the same way they were recorded in vacuum. An equilibration time of one hour was allowed before each measurement. For calibration purposes, the spectra of the vapor phase were also recorded at the given (T, p) state point. The position of the BRG was adjusted slightly for the recordings of the vapor phase so the focus point of the laser was above the sample but still within the sample holder to account for a possible influence of the sample holder.
3. Results and Discussion
3.1. Data Analysis
To calculate the gas solubility x from the measurements performed, it is necessary to calculate the density of dissolved gas molecules in the respective fluid ρsol and the concentration of the fluid cfl (see Equation (1)).
Calculation of cfl is straightforward (see Equation (2)). The density of the fluid at the respective temperature and pressure is divided by the molecular weight of the sample.
Prior to the data analysis, fluid densities ρfl can be calculated from an equation of state (EOS) that is implemented in a software like NIST’s REFPROP database [36] or in TREND [37]; alternatively, densities must be obtained, e.g., experimentally with an auxiliary device or through literature research. For water, the EOS of Wagner and Pruss [38] was used for density calculations with an uncertainty of 0.001% for each (T, p) state point. The density of the ionic liquids was taken from values found in the literature [39,40] and assumed to be constant throughout the measurements.
A more sophisticated data analysis is required to calculate ρsol (see Equation (3)).
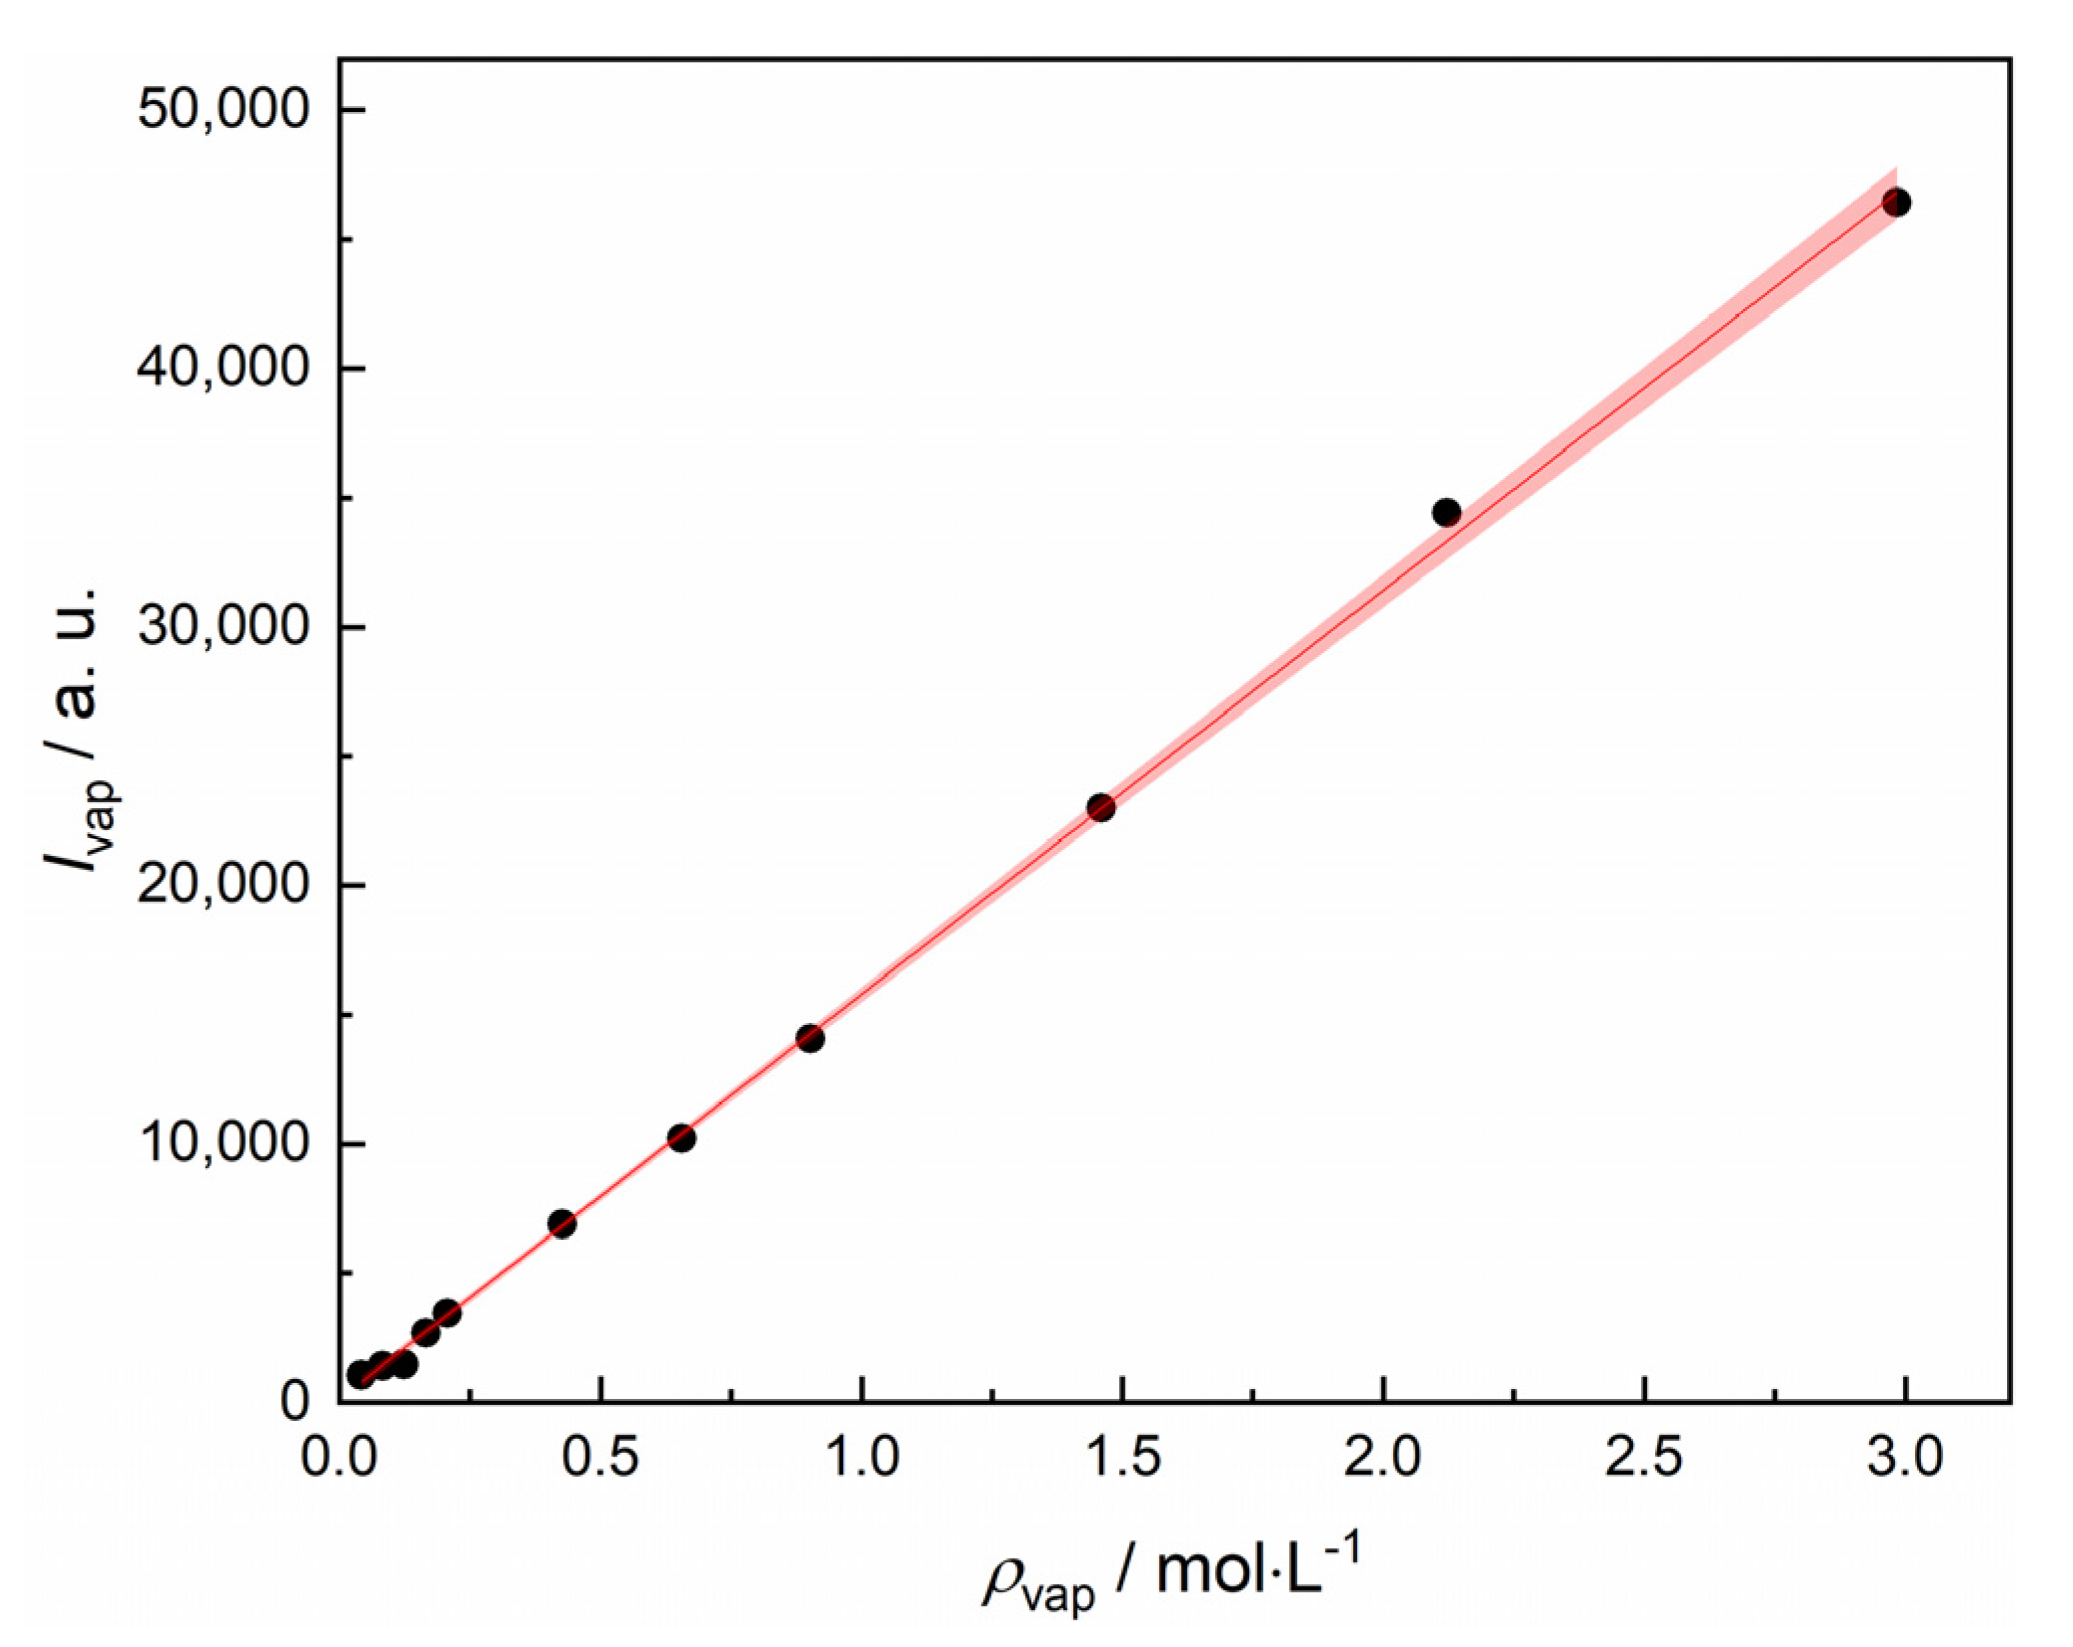
Here, the corrected intensity from the sample measurements Icor is needed alongside the calibration factor mcal. Vapor phase spectra have to be analyzed to calculate mcal. Since a linear relation between the density of molecules and the intensity of the inelastically scattered light is usually assumed [41], the intensity can be plotted against density values calculated at given temperature and pressure. The slope of the linear regression line then equals the calibration factor mcal. An example is shown in Figure 2.
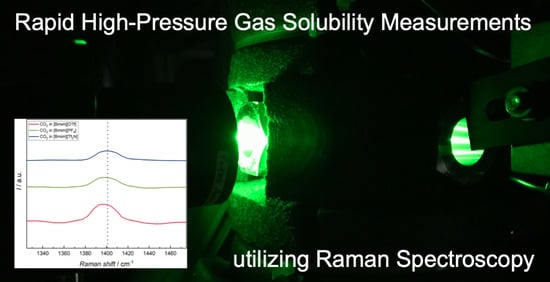
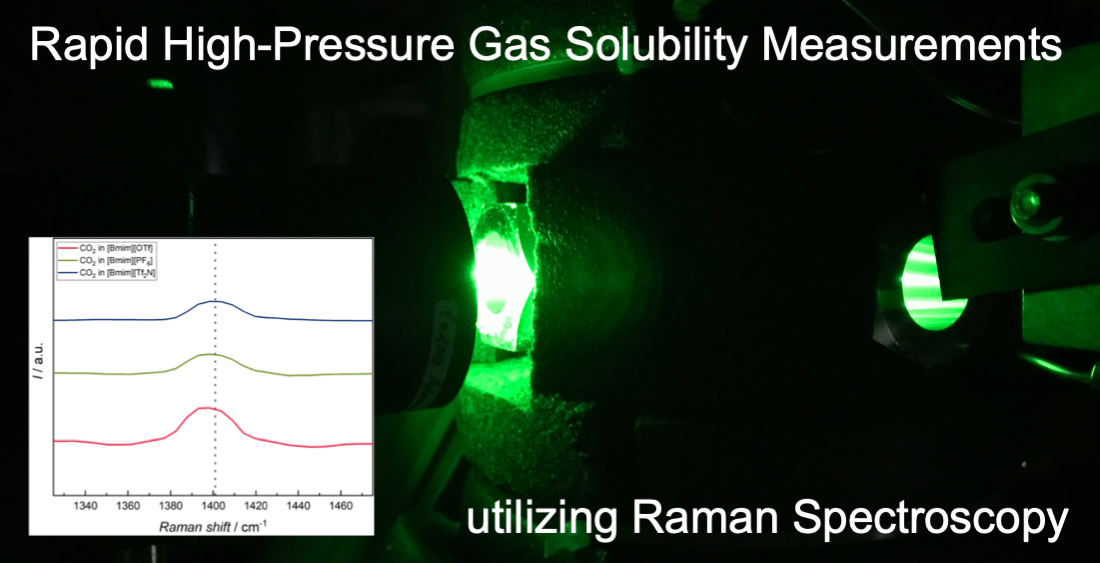
For the vapor phase, the intensity values Ivap can be directly derived from the recorded spectra if a suitable peak can be found. In the case of carbon dioxide, the peak area of the right peak of the Fermi dyad ((1380–1420) cm−1, center: 1404 cm−1) was used for the analysis in this work. A peak is considered to be suitable if it is also easily identifiable in the investigated liquid because the same peak must be used to determine Icor for the determination of ρsol. Temperature and pressure are recorded throughout the measurements and are used to calculate the density of molecules from an equation of state (EOS). The density for pure carbon dioxide at a (T, p) state point ρvap was calculated with the EOS by Span & Wagner [42] with an uncertainty of 0.03% within the temperature and pressure range of this work.
In order to calculate Icor, the detected intensity from the sample measurements Iraw,sol must be corrected (see Equation (4)) by the factor kexp which, in turn, is derived from the refractive index of the fluid nfl and the gas nvap (see Equation (5)).
This is due to a discrepancy between the detected intensity of a pure component and its intensity in a mixture, as described by Woodward and George [43]. The refractive index for carbon dioxide was calculated from the dielectric constant given by the EOS at the respective (T, p) state point (see Equation (6)), while nfl was taken from literature [44,45].
After the calculation of Icor, ρsol, and kexp, subsequently, the gas solubility can be determined.
3.2. Uncertainty in Measurement
To analyze the uncertainty in measurement, we followed the recommendations of the guide to the expression of uncertainty in measurement (GUM) [46]. For all results, we report the combined expanded uncertainty (k = 2) of the dissolved carbon dioxide in the respective fluid (U(xCO2)), which includes the uncertainties of temperature, pressure and spectroscopic measurements.
The main source of uncertainty originates from the recorded spectra and is tied to their quality. The uncertainty of the calibration slope is about 2 %, but the uncertainty contributed by the recorded spectra in the liquid phase depends on the amount of dissolved carbon dioxide in the respective liquid. It is higher at low pressures (p ≤ 1 MPa) and improves gradually with increasing pressures. The uncertainty contribution of the liquid phase spectra depends, therefore, not only on the pressure, but also on the investigated liquid and its behavior as a solvent. The combined expanded uncertainty is approximately U(xCO2,H2O) = 5% for the measurements in water and U(xCO2,IL) = 3% for the ILs (however, it must be noted that the results vary for each IL and each water isotherm; detailed information for the studied (T, p) state point is provided in Appendix A). For comparison, typical uncertainties of other solubility measurement techniques, such as ion chromatography, are in the range of 4%, whereby it is virtually never specified in the literature which uncertainty the authors report (single or combined uncertainty, standard or expanded uncertainty, just twice the standard deviation etc.).
3.3. Results for Solubilty of Carbon Dioxide in Water
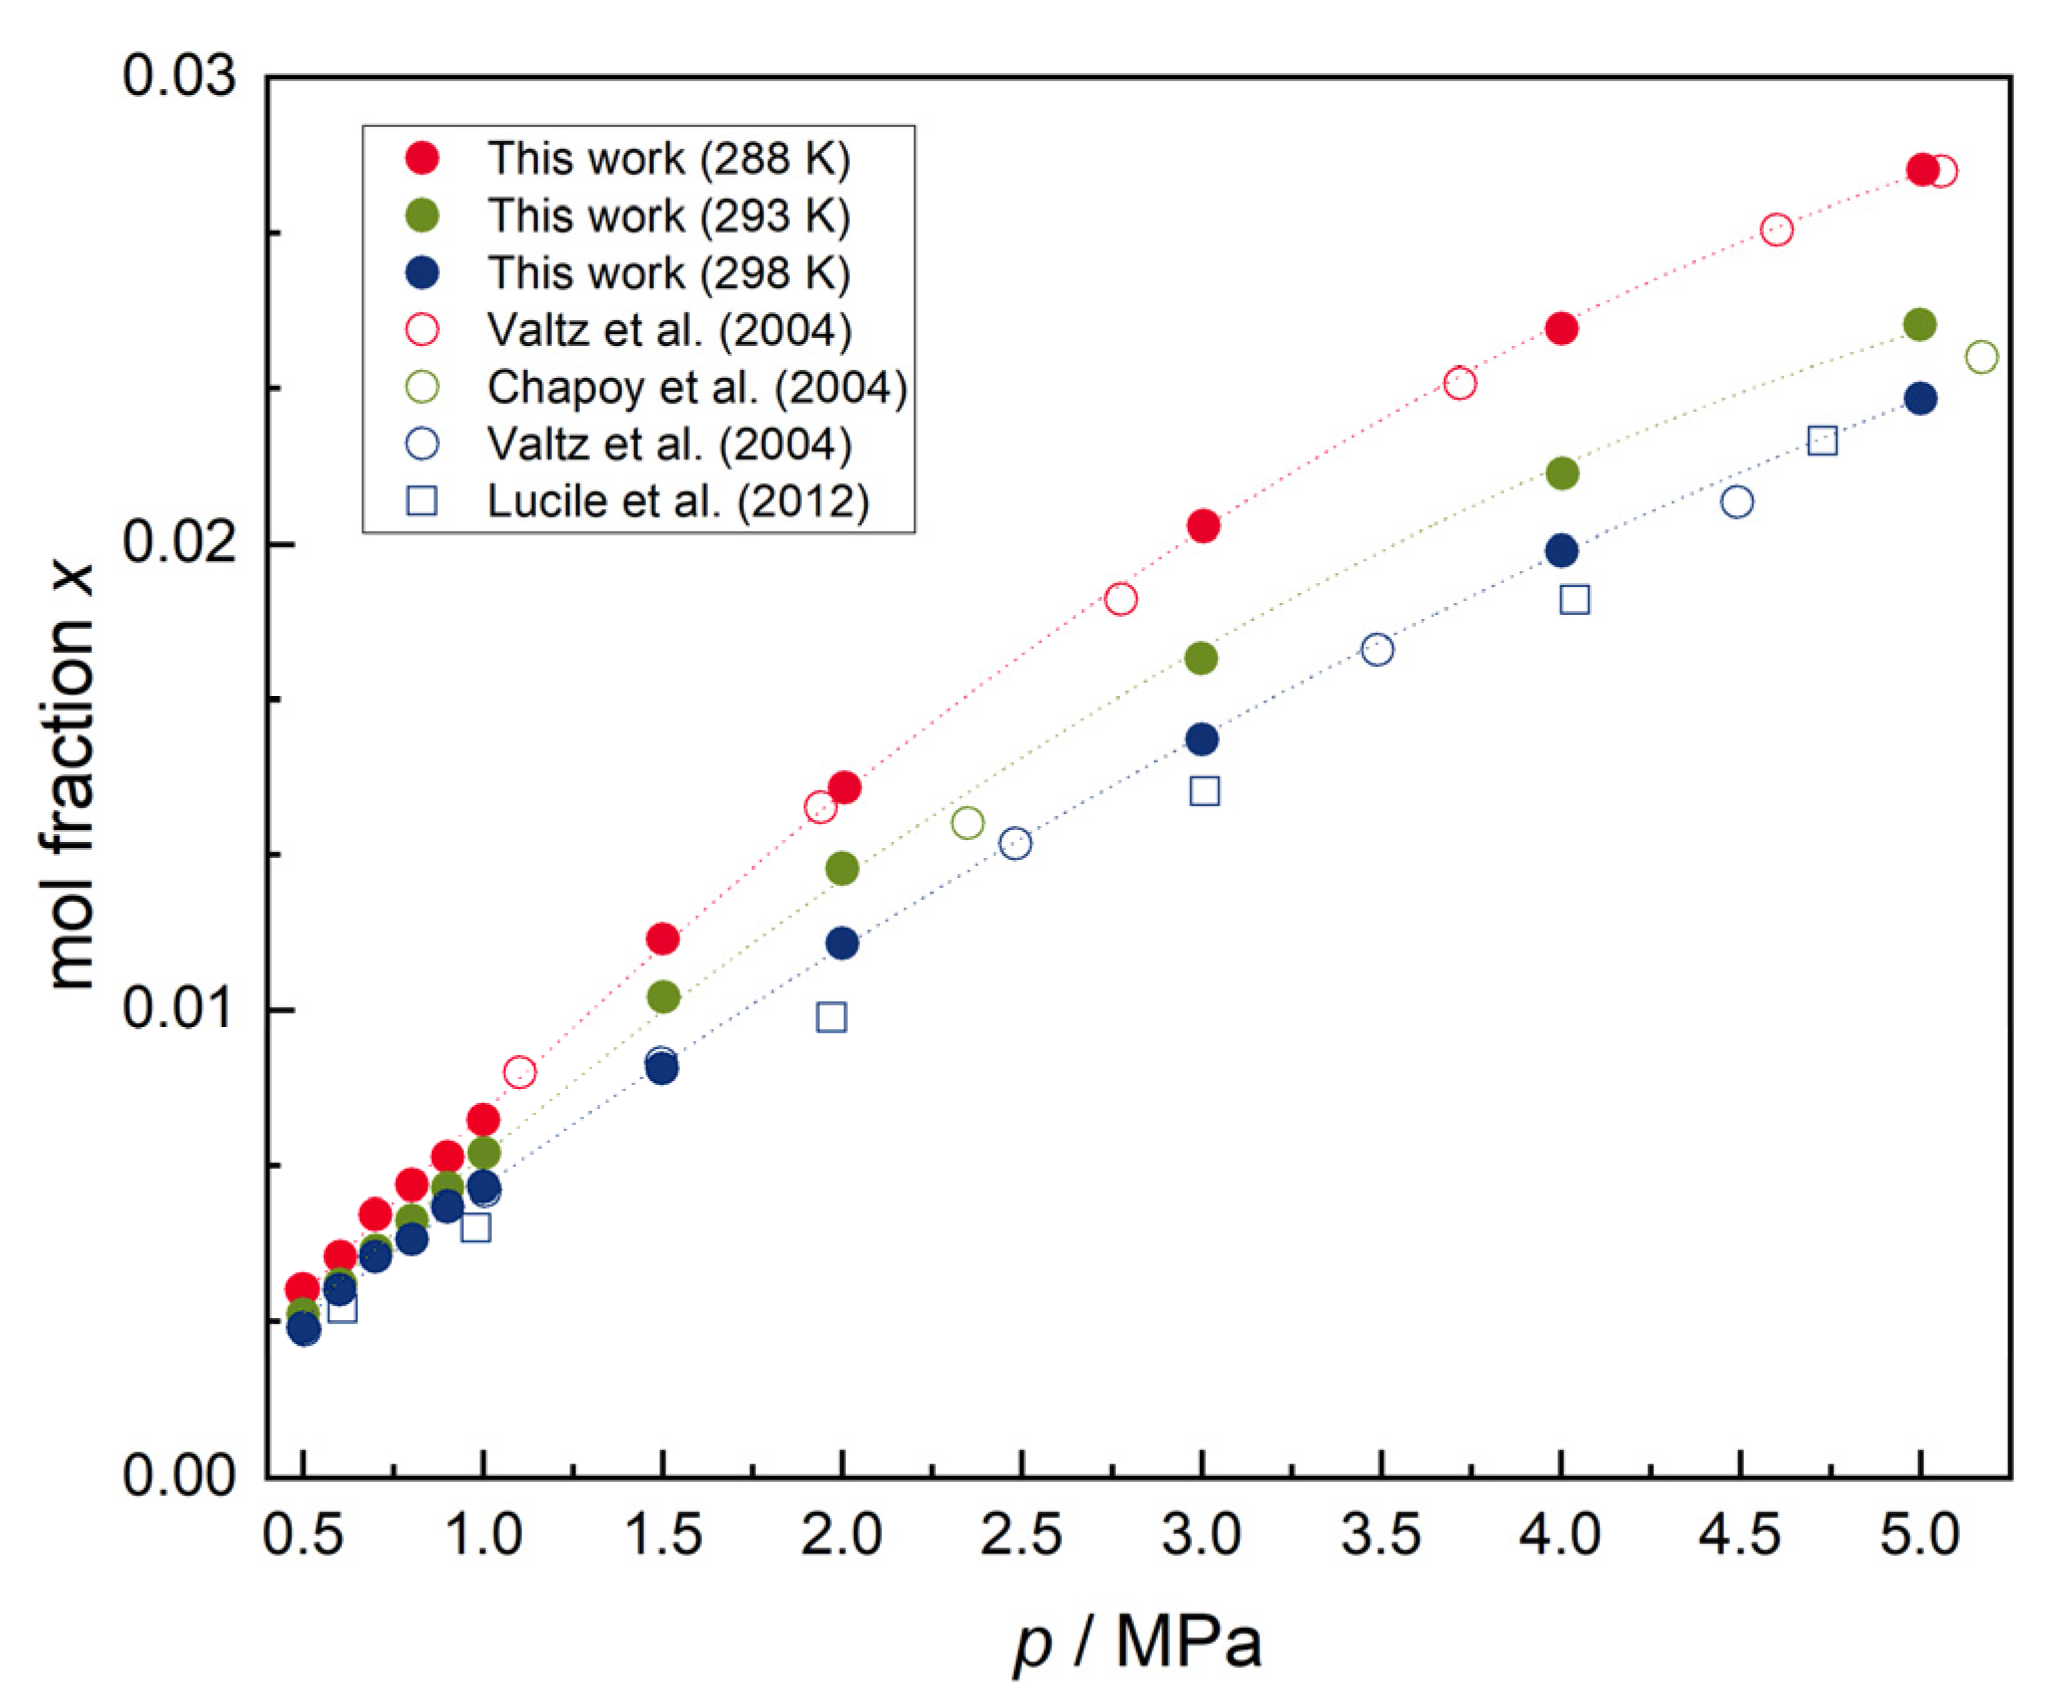
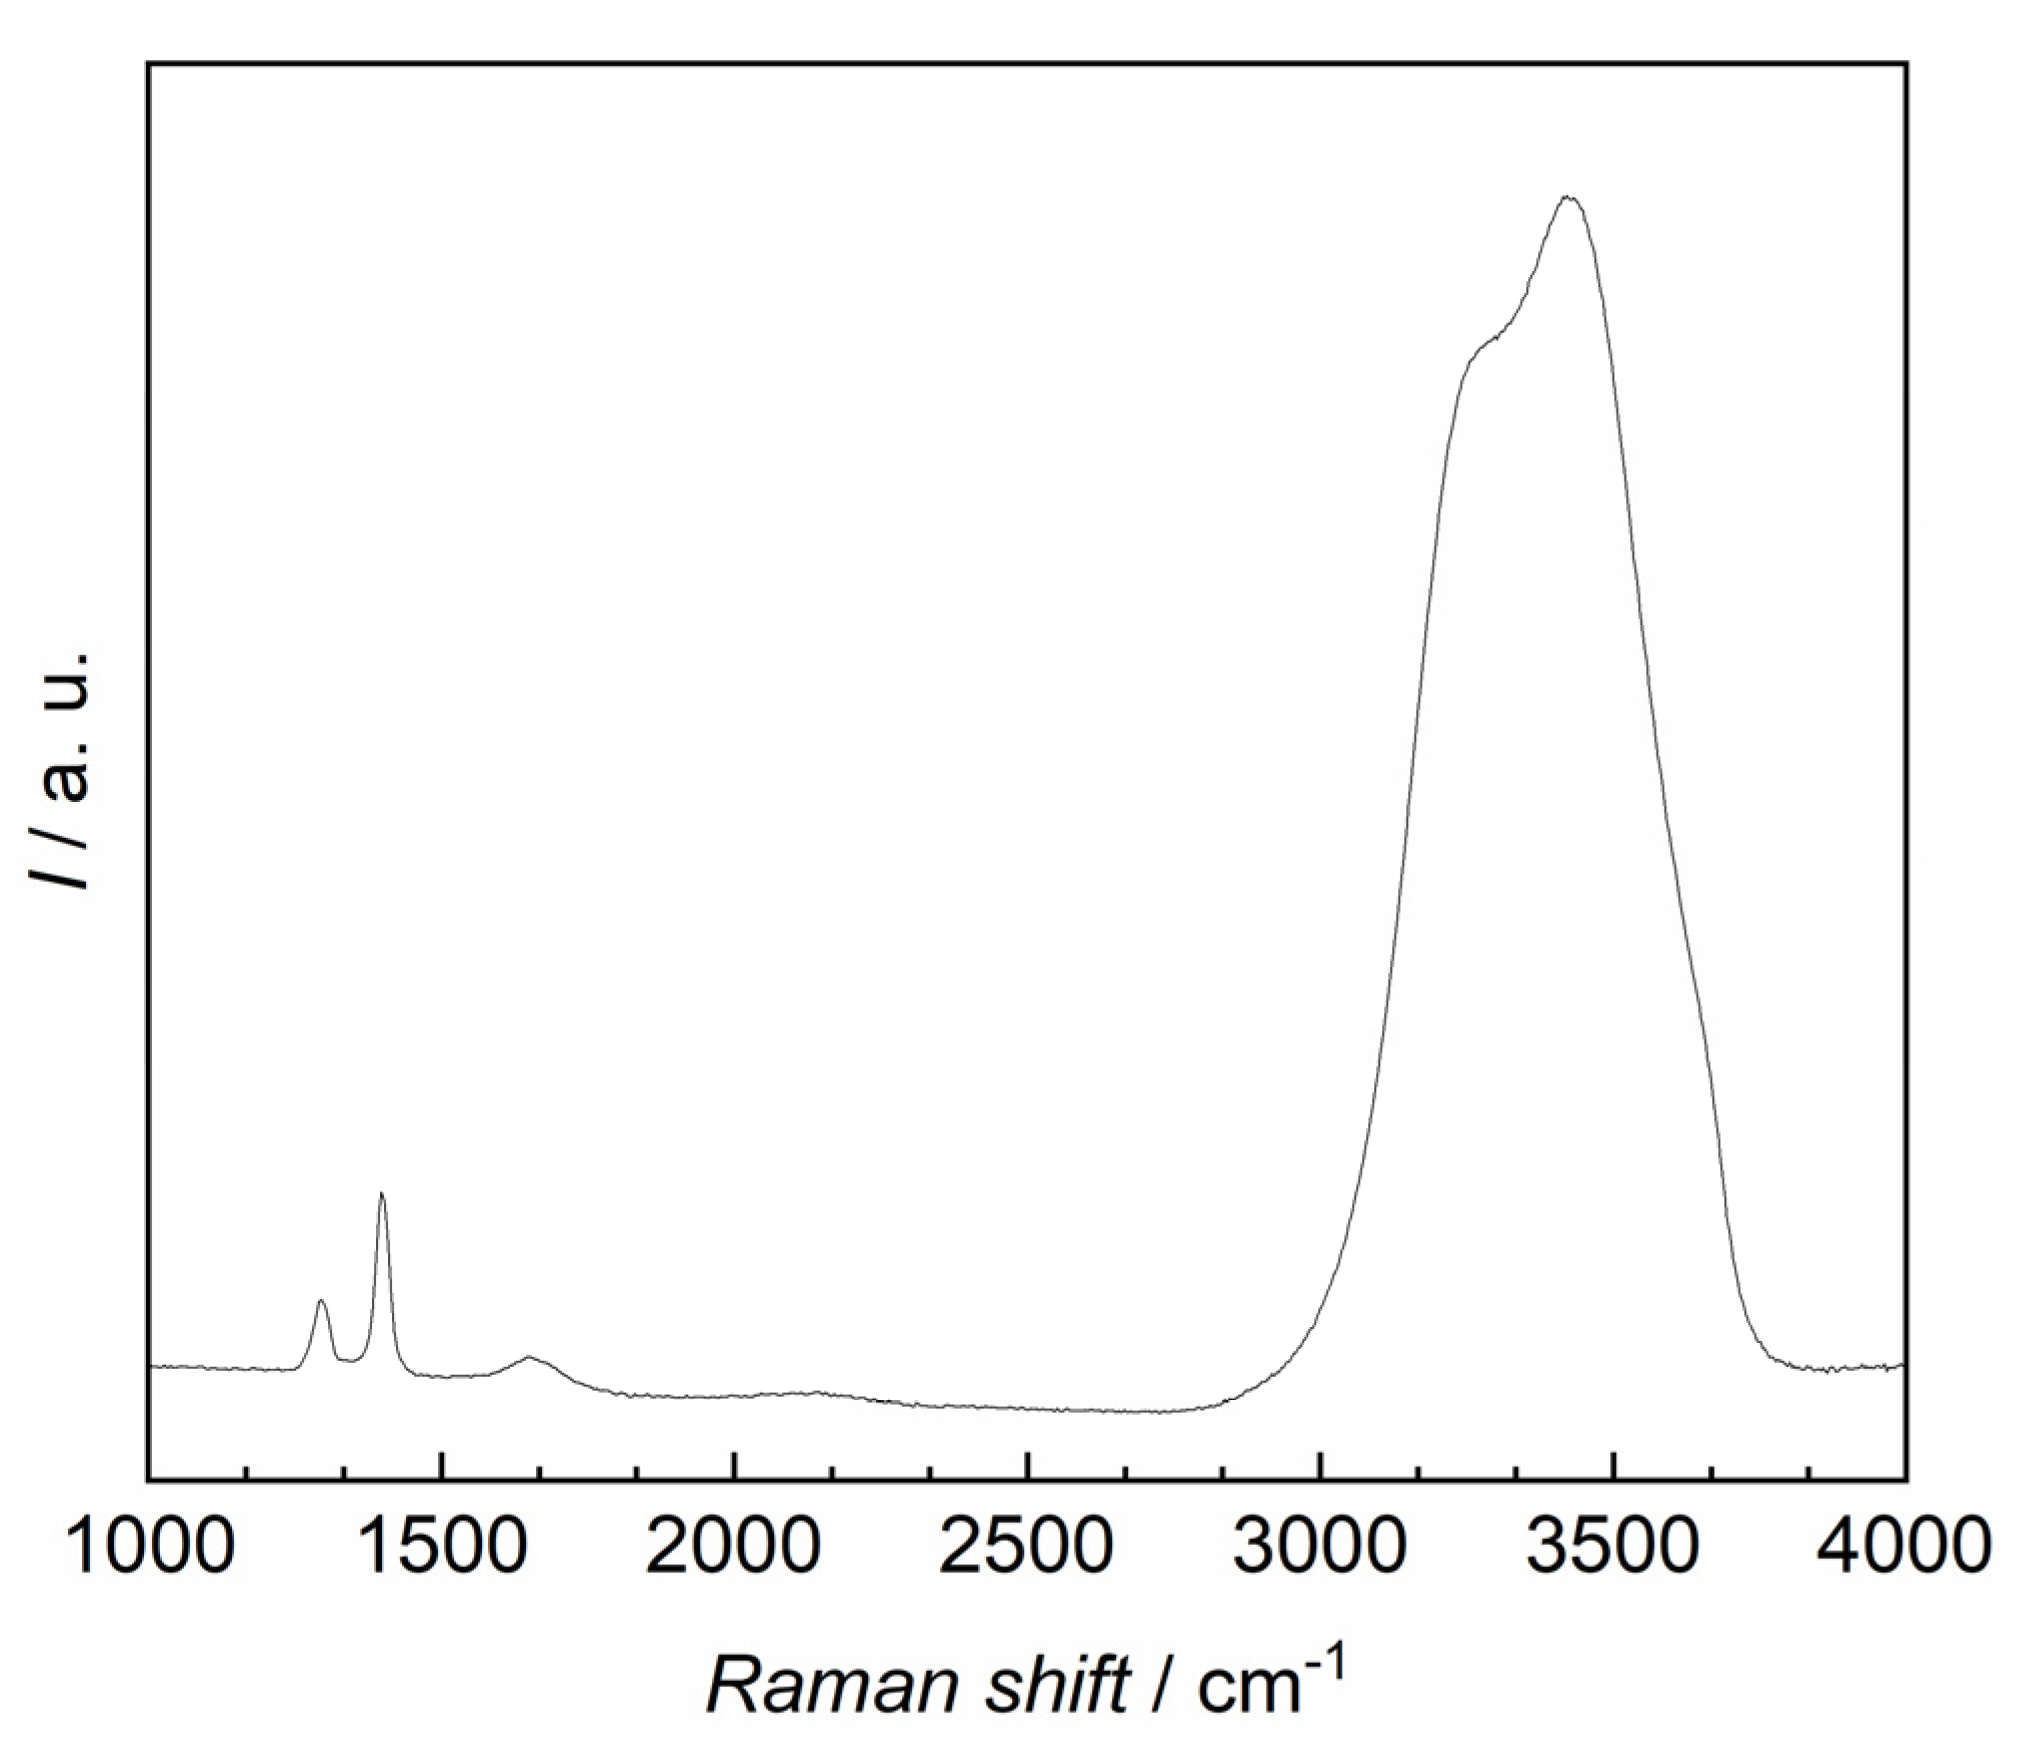
Solubility measurements of carbon dioxide in water were conducted along three isotherms T = (288.15, 293.15, 298.15) K within the scope of this work. The sensitivity of the Raman setup limited the measurements to a pressure range from p = (0.5–5) MPa. The signal-to-noise ratio at p < 0.5 MPa was insufficient to gather meaningful results due to the low solubility. Also, a slight shift in the investigated peak ((1380–1420) cm−1, center: 1400 cm−1) was observed due to the solvation of carbon dioxide in water, however, this is in agreement with previous reports [47]. As an example, the Raman spectrum of dissolved carbon dioxide in water at T = 288.15 K and p = 4 MPa is given in Appendix C. Although data for comparison was limited, the results show good agreement with the available literature data (see Figure 3) and are within the combined uncertainties of the involved measurement techniques, if available.
Measurements in the vicinity of the literature data [4,5,6] taken as a reference also show a consistent trend regarding the solubility. As gas solubility depends on the physical and chemical properties of the solvent and the solute, it was expected that the solubility of carbon dioxide would increase with decreasing temperature in water [48], and our measurements confirmed this behavior. However, the determined solubilities have a slight tendency to higher values in comparison to the literature data. This might be due to additional signals from the vapor phase in the measuring cell, which is caused by the measurement procedure presented.
The combined expanded uncertainty for the solubility measurements in water is high for every investigated isotherm due to the low solubility in comparison to the investigated ILs. Since the solubility at T = 298 K is the lowest, it shows also the highest uncertainty U(xCO2,H2O) = (6–7.5)% even at p = 5 MPa. The uncertainty is significantly lower at high pressures and lower temperatures, e.g., U(xCO2,H2O) = 3.7% at p = 5 MPa and T = 293 K.
3.4. Results for Solubilty of Carbon Dioxide in Ionic Liquids
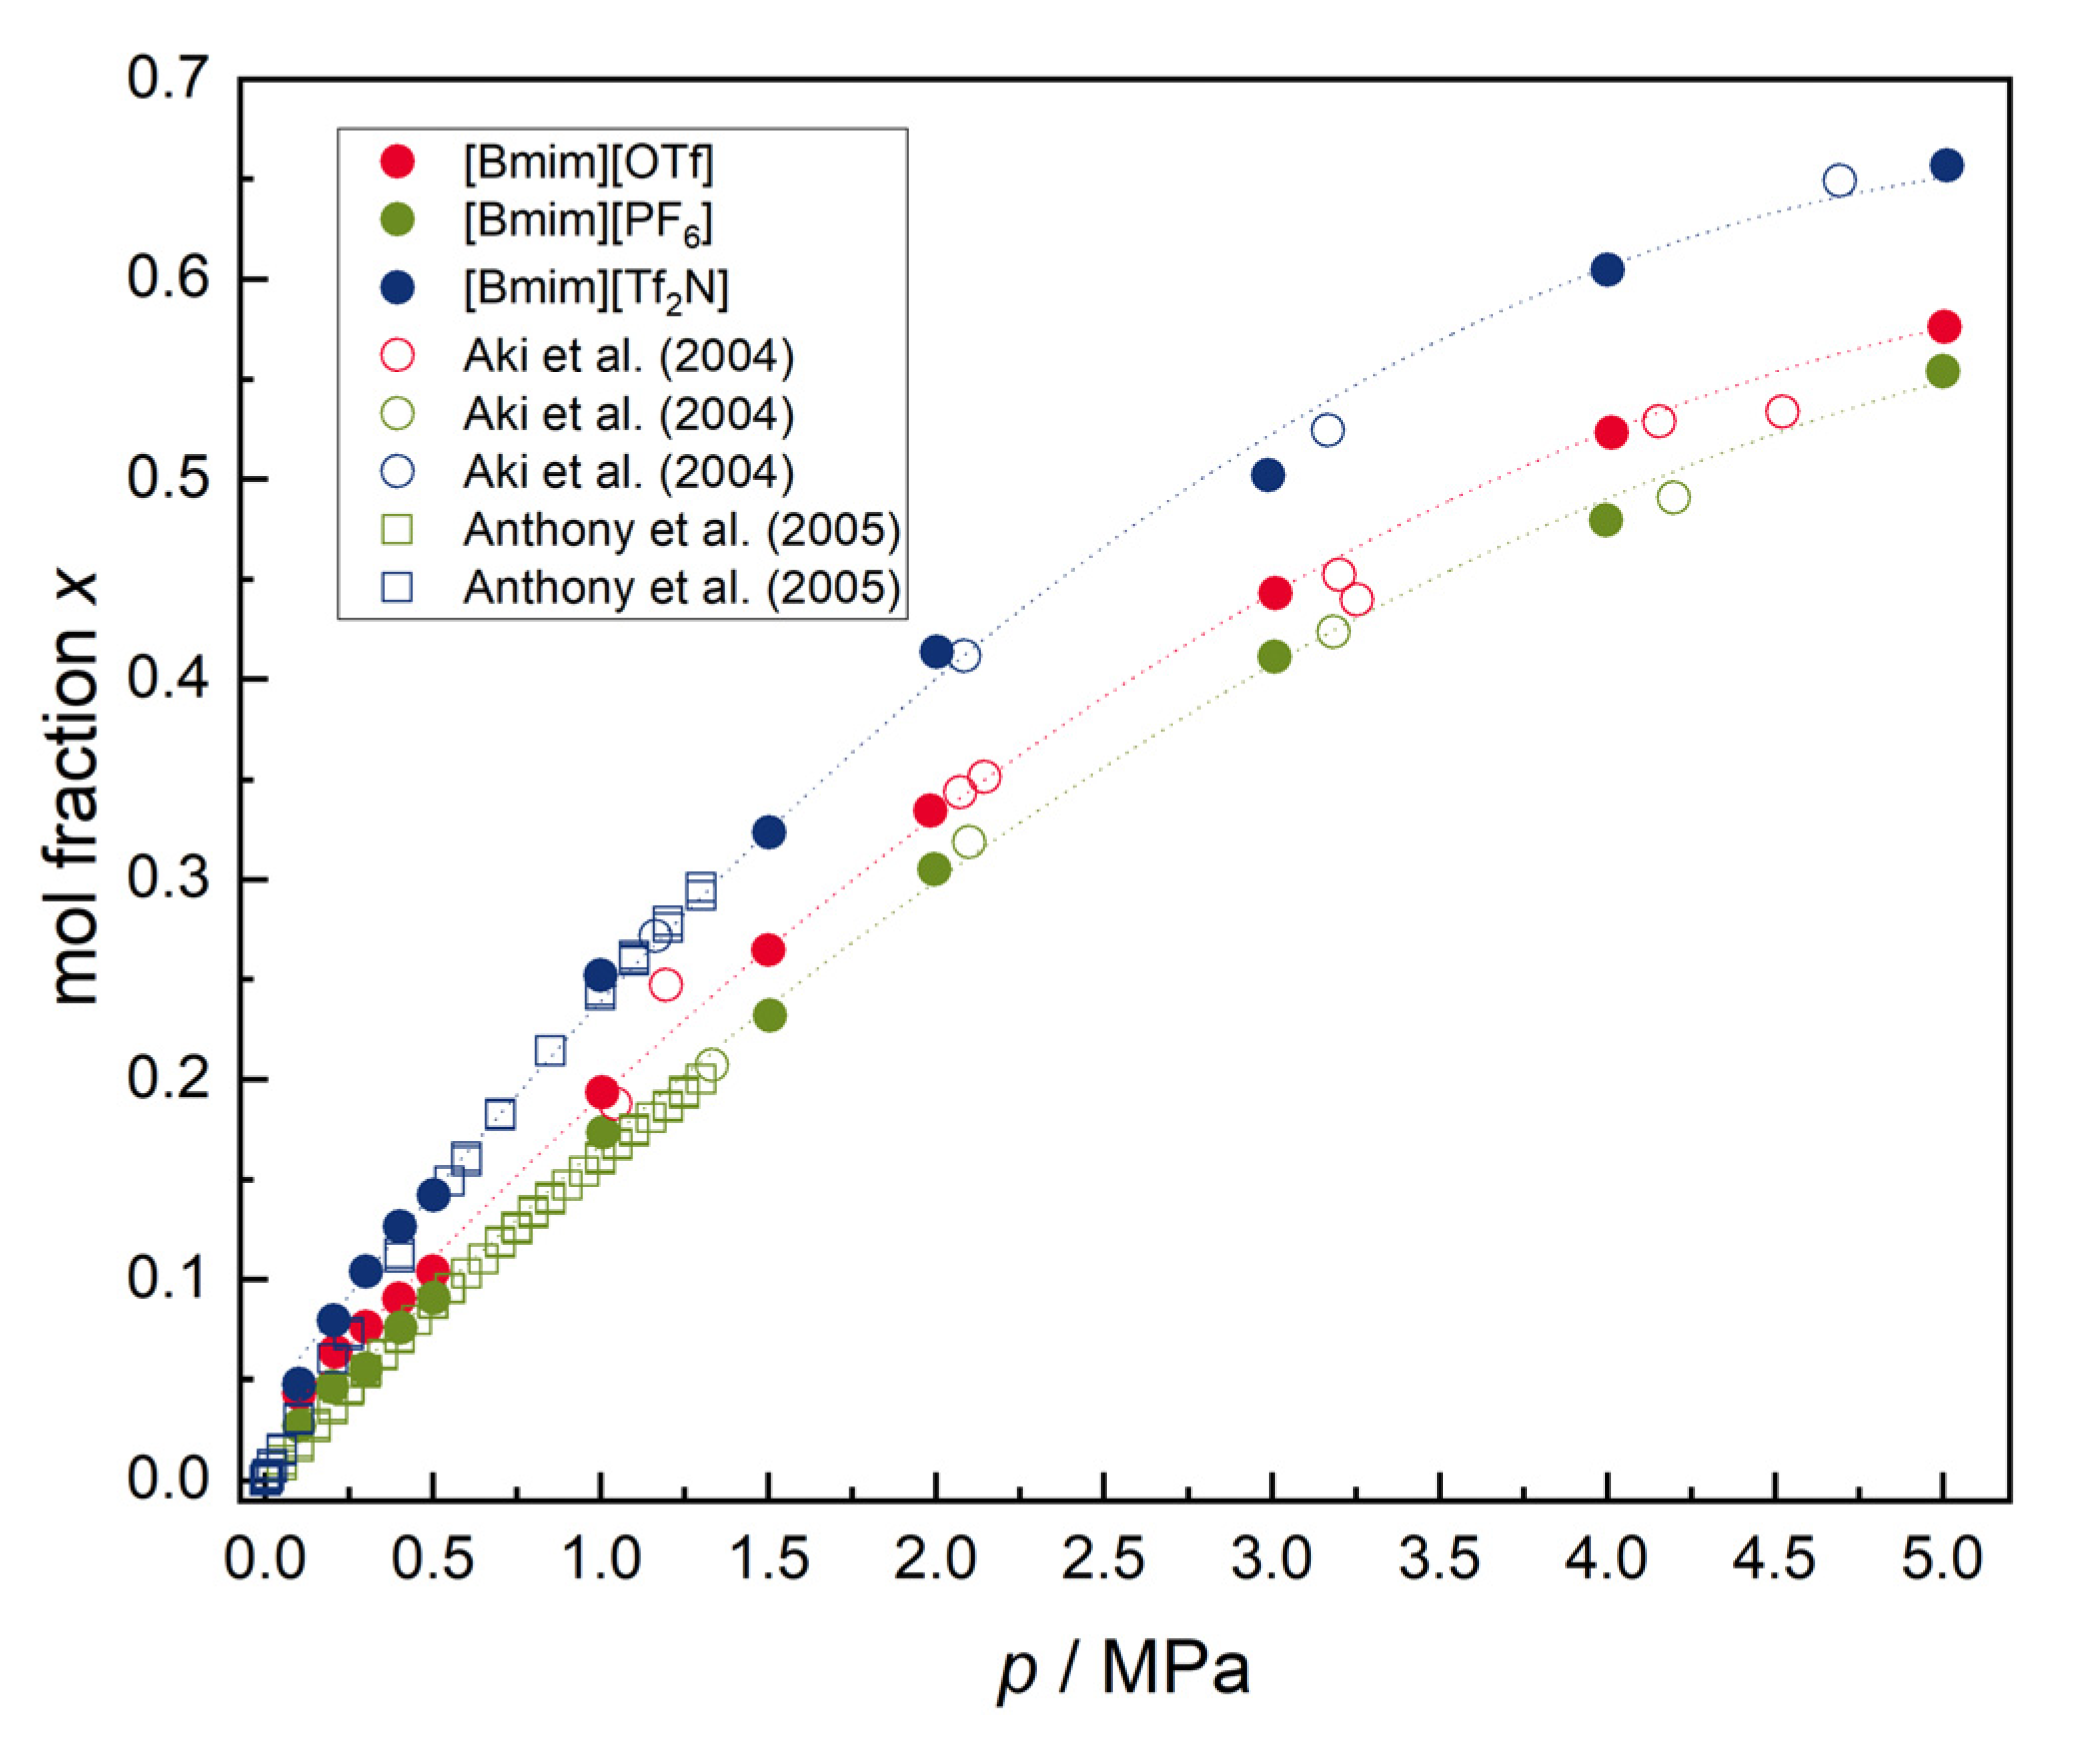
The solubility of carbon dioxide in three imidazolium-based ionic liquids, namely 1-Butyl-3-methyl-imidazolium-trifluormethansulfonat ([Bmim][OTf]), 1-Butyl-3-methyl-imidazolium-hexafluorophosphat ([Bmim][PF6]), and 1-Butyl-3-methylimidazolium-bis(trifluormethylsulfonyl)imid ([Bmim][Tf2N]), was investigated at T = 298.15 K. Literature data for all three ionic liquids is very scarce at p > 1.5 MPa and was not available for [Bmim][OTf] at p < 1 MPa. Measurements were still conducted in a pressure range from p = (0.5–5) MPa for all three ILs to obtain better comparability of the three ILs.
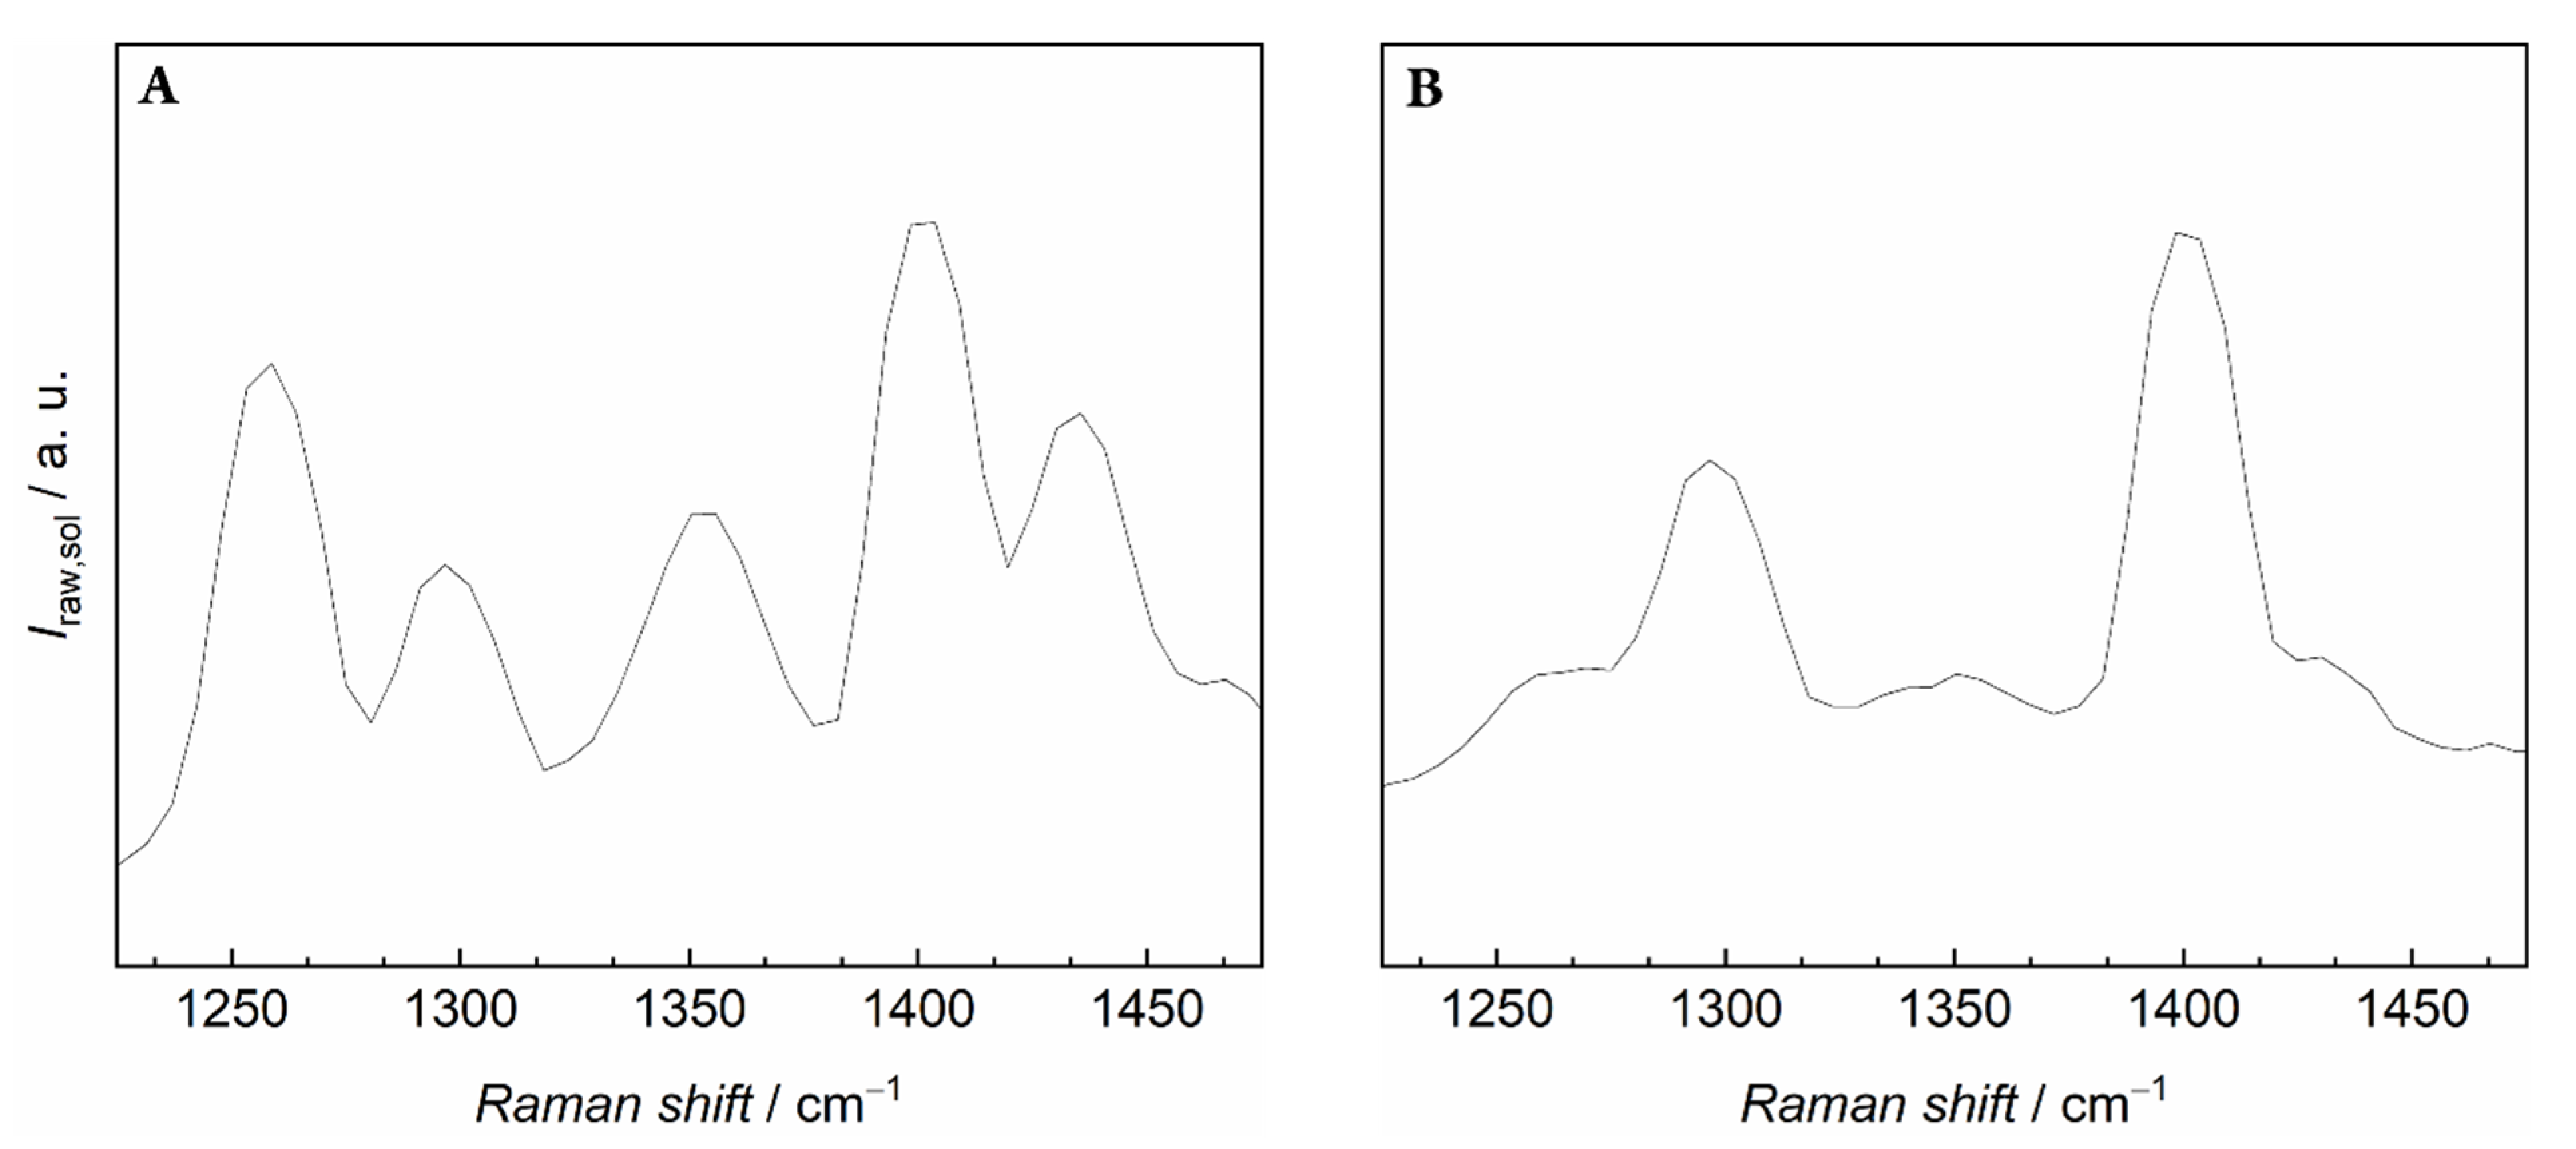
Due to the complex peak pattern at the relevant Raman shift (see Figure 4), data analysis had to be changed slightly for all three ILs. For the purpose of this analysis, it was assumed that the solubility spectra are a linear combination of a pure carbon dioxide and a pure IL spectrum. The Raman spectrum of the respective IL in vacuum was therefore subtracted from each spectrum of the solubility measurements. In this way, the Fermi dyad was revealed, and the relevant peak area could be determined. However, since a small bulge could be seen in between the peaks of the Fermi dyad (Figure 4B), it is possible that the carbon dioxide density was calculated with a larger uncertainty. Again, a shift of the investigated peak ((1380–1420) cm−1) was observed. However, the peak shift was dependent on the ionic liquid. While the shifts in [Bmim][OTf] (centre: 1397 cm−1) and [Bmim][PF6] (centre: 1398 cm−1) were very similar, this shift differed significantly for [Bmim][Tf2N] (centre: 1401 cm−1), thus indicating a possibly stronger interaction between the IL and the solute.
In contrast to water, solubility measurements of all ILs were possible at p < 0.5 MPa due to a higher solubility of carbon dioxide in ILs and, therefore, a better signal-to-noise ratio was obtained. As a result, measurements could be extended to a broader pressure range. The increased solubility of carbon dioxide in ILs in contrast to water was expected due to the quadrupole moment of carbon dioxide and its interaction with the ILs. Here, dispersion forces are likely to govern the solubility of the gas molecules [16]. Again, our results show good agreement with data found in the literature (see Figure 5) and are within the combined uncertainties of the measurement techniques, if available. A consistent data trend can be recognized for all isotherms.
As with water, the solubilities determined tend to higher values in comparison to the literature data. Since the measuring procedure that was applied was almost the same, additional vapor phase signals might be the cause of the offset here. This possible artefact will be studied further within the scope of our ongoing research.
The combined expanded uncertainty for the solubility measurements in ILs was found to be significantly lower than in water; it ranges from U(xCO2,IL2) = (1.7–5)% and decreases with increasing pressure due to the clearer carbon dioxide signal. The uncertainty values determined for each ionic liquid are quite similar and vary mainly because of a difference in calibration. Detailed results for each (T, p) state point are presented in Appendix B.
4. Conclusions and Outlook
A new sensor for the determination of gas solubility in liquids is presented in this paper. Experimental (p, T, x) data for the solubility of carbon dioxide in water at T = (288.15, 293.15, 298.15) K in a pressure range from p = (0.5–5) MPa and three ionic liquids at T = 298.15 K and pressures from p = (0.1–5) MPa are provided alongside a description of the experimental setup.
The successful application of Raman spectroscopy to solubility measurements opens the door to a rapid screening method, in particular for tailor-made liquids that can be used for specific gas separation processes. It offers short measurement times without the need for sample calibration prior to the experiments. Its measurement procedure and analysis are highly adaptive and can also be extended to solubility measurements of liquid mixtures in the near future. The measurements can be used to screen the samples even more efficiently when gas mixtures are utilized, since Raman spectroscopy can distinguish different gas species in the spectra. This is a clear advantage over conventional methods such as static methods that rely on gravimetric or volumetric analysis to determine the amount of dissolved gas.
The modular-built system can easily be improved with a different laser that offers a better stability and a high-resolution spectrometer. This would not only reduce the required measurement time but also impact the uncertainty of the measurements, since the quality of the spectra have the biggest impact on the results. An improved sample manifold that allows the flushing of the cell with an inert gas, e.g., helium, before each measurement would also benefit the quality of the results. Further improvements in the analysis involve consideration of the effect of dissolved gas on the density of the liquid [49,50], which was so far neglected during the data analysis.
Author Contributions
Conceptualization, G.L. and M.R.; methodology, G.L.; validation, G.L. and M.R.; formal analysis, G.L.; investigation, G.L.; resources, M.R.; data curation, G.L.; writing—original draft preparation, G.L.; writing—review and editing, M.R.; supervision, M.R.; project administration, M.R.; funding acquisition, M.R. All authors have read and agreed to the published version of the manuscript.
Funding
This research was funded by Deutsche Forschungsgemeinschaft, Cluster of Excellence RESOLV (EXC 1069) and by Bundesministerium für Wirtschaft und Energie based on a resolution of the German Bundestag, grant number ZF4147604VS9. Moreover, the authors thank Deutsche Forschungsgemeinschaft for funding their research within the Emmy Noether Programme, grant number RI 2482/2-1.
Institutional Review Board Statement
Not applicable.
Informed Consent Statement
Not applicable.
Data Availability Statement
Not applicable.
Acknowledgments
The authors thank Professor Andreas Bräuer of Technische Universität Bergakademie Freiberg for fruitful discussions and the technician of the Applied Thermodynamics Group at Technische Universität Chemnitz, Hans-Joachim Knobloch, for providing assistance with our electronic equipment.
Conflicts of Interest
The authors declare no conflict of interest.
Appendix A. Water

Table A1.
Experimental results for solubility measurements of pure carbon dioxide in water at T = 288.15 K using Raman spectroscopy. Recorded temperature (ITS-90), pressure, mol fraction and estimated uncertainties (k = 2) are listed in the table.
Table A1.
Experimental results for solubility measurements of pure carbon dioxide in water at T = 288.15 K using Raman spectroscopy. Recorded temperature (ITS-90), pressure, mol fraction and estimated uncertainties (k = 2) are listed in the table.
| T/K | p/MPa | xCO2 | U(xCO2) | U(xCO2)·(xCO2)−1/% |
|---|---|---|---|---|
| 288.170 | 0.49948 | 0.0040 | 0.0002 | 5.002 |
| 288.219 | 0.60390 | 0.0047 | 0.0002 | 4.696 |
| 288.213 | 0.70222 | 0.0056 | 0.0003 | 5.148 |
| 288.226 | 0.80377 | 0.0063 | 0.0003 | 4.268 |
| 288.232 | 0.90201 | 0.0068 | 0.0003 | 4.044 |
| 288.218 | 1.0.0180 | 0.0076 | 0.0003 | 4.182 |
| 288.341 | 1.50218 | 0.0115 | 0.0004 | 3.737 |
| 288.244 | 2.00692 | 0.0148 | 0.0006 | 3.940 |
| 288.245 | 3.00527 | 0.0204 | 0.0008 | 3.686 |
| 288.245 | 4.00375 | 0.0246 | 0.0009 | 3.594 |
| 288.261 | 5.00929 | 0.0280 | 0.0010 | 3.604 |
Table A2.
Experimental results for solubility measurements of pure carbon dioxide in water at T = 293.15 K using Raman spectroscopy. Recorded temperature (ITS-90), pressure, mol fraction, and estimated uncertainties (k = 2) are listed in the table.
Table A2.
Experimental results for solubility measurements of pure carbon dioxide in water at T = 293.15 K using Raman spectroscopy. Recorded temperature (ITS-90), pressure, mol fraction, and estimated uncertainties (k = 2) are listed in the table.
| T/K | p/MPa | xCO2 | U(xCO2) | U(xCO2)·(xCO2)−1/% |
|---|---|---|---|---|
| 293.288 | 0.50013 | 0.0035 | 0.0002 | 5.918 |
| 293.296 | 0.60432 | 0.0041 | 0.0002 | 4.151 |
| 293.314 | 0.70312 | 0.0049 | 0.0003 | 6.182 |
| 293.315 | 0.80243 | 0.0055 | 0.0003 | 5.193 |
| 293.303 | 0.90190 | 0.0062 | 0.0002 | 3.314 |
| 293.362 | 1.00330 | 0.0069 | 0.0003 | 3.763 |
| 293.305 | 1.50295 | 0.0103 | 0.0004 | 3.880 |
| 293.307 | 2.00047 | 0.0130 | 0.0004 | 3.117 |
| 293.320 | 3.00050 | 0.0170 | 0.0006 | 3.334 |
| 293.317 | 4.00540 | 0.0215 | 0.0006 | 2.899 |
| 293.322 | 5.00079 | 0.0247 | 0.0008 | 3.109 |
Table A3.
Experimental results for solubility measurements of pure carbon dioxide in water at T = 298.15 K using Raman spectroscopy. Recorded temperature (ITS-90), pressure, mol fraction, and estimated uncertainties (k = 2) are listed in the table.
Table A3.
Experimental results for solubility measurements of pure carbon dioxide in water at T = 298.15 K using Raman spectroscopy. Recorded temperature (ITS-90), pressure, mol fraction, and estimated uncertainties (k = 2) are listed in the table.
| T/K | p/MPa | xCO2 | U(xCO2) | U(xCO2)·(xCO2)−1/% |
|---|---|---|---|---|
| 298.122 | 0.50006 | 0.0032 | 0.0002 | 6.658 |
| 298.137 | 0.60229 | 0.0040 | 0.0002 | 6.078 |
| 298.145 | 0.70124 | 0.0047 | 0.0003 | 6.222 |
| 298.161 | 0.80192 | 0.0051 | 0.0003 | 6.157 |
| 298.154 | 0.90176 | 0.0058 | 0.0004 | 6.554 |
| 298.162 | 1.00143 | 0.0062 | 0.0003 | 5.133 |
| 298.163 | 1.49948 | 0.0088 | 0.0005 | 6.120 |
| 298.137 | 2.00118 | 0.0115 | 0.0007 | 5.813 |
| 298.143 | 3.00088 | 0.0158 | 0.0008 | 5.170 |
| 298.174 | 4.00231 | 0.0199 | 0.0011 | 5.711 |
| 298.182 | 5.00264 | 0.0231 | 0.0012 | 5.229 |
Appendix B. Ionic Liquids
Table A4.
Experimental results for solubility measurements of pure carbon dioxide in [Bmim][OTf] at T = 293.15 K using Raman spectroscopy. Recorded temperature (ITS-90), pressure, mol fraction, and estimated uncertainties (k = 2) are listed in the table.
Table A4.
Experimental results for solubility measurements of pure carbon dioxide in [Bmim][OTf] at T = 293.15 K using Raman spectroscopy. Recorded temperature (ITS-90), pressure, mol fraction, and estimated uncertainties (k = 2) are listed in the table.
| T/K | p/MPa | xCO2 | U(xCO2) | U(xCO2)·(xCO2)−1/% |
|---|---|---|---|---|
| 293.204 | 0.10185 | 0.0481 | 0.0020 | 4.111 |
| 293.245 | 0.20174 | 0.0622 | 0.0026 | 4.223 |
| 293.247 | 0.29971 | 0.0777 | 0.0032 | 4.102 |
| 293.266 | 0.40085 | 0.0961 | 0.0039 | 4.049 |
| 293.265 | 0.50234 | 0.1110 | 0.0041 | 3.678 |
| 293.258 | 0.99962 | 0.2075 | 0.0077 | 3.720 |
| 293.233 | 1.50541 | 0.2866 | 0.0077 | 2.695 |
| 293.236 | 2.00833 | 0.3590 | 0.0106 | 2.953 |
| 293.223 | 2.99711 | 0.4837 | 0.0131 | 2.702 |
| 293.242 | 4.03906 | 0.5630 | 0.0128 | 2.266 |
| 293.276 | 5.00981 | 0.6161 | 0.0133 | 2.162 |
Table A5.
Experimental results for solubility measurements of pure carbon dioxide in [Bmim][PF6] at T = 293.15 K using Raman spectroscopy. Recorded temperature (ITS-90), pressure, mol fraction, and estimated uncertainties (k = 2) are listed in the table.
Table A5.
Experimental results for solubility measurements of pure carbon dioxide in [Bmim][PF6] at T = 293.15 K using Raman spectroscopy. Recorded temperature (ITS-90), pressure, mol fraction, and estimated uncertainties (k = 2) are listed in the table.
| T/K | p/MPa | xCO2 | U(xCO2) | U(xCO2)·(xCO2)−1/% |
|---|---|---|---|---|
| 293.266 | 0.10030 | 0.0346 | 0.0011 | 3.205 |
| 293.256 | 0.20045 | 0.0545 | 0.0017 | 3.084 |
| 293.251 | 0.30380 | 0.0648 | 0.0019 | 2.984 |
| 293.229 | 0.40299 | 0.0896 | 0.0025 | 2.793 |
| 293.200 | 0.50020 | 0.1014 | 0.0027 | 2.676 |
| 293.214 | 0.99997 | 0.1986 | 0.0052 | 2.609 |
| 293.215 | 1.50415 | 0.2644 | 0.0065 | 2.471 |
| 293.207 | 2.01386 | 0.3318 | 0.0073 | 2.210 |
| 292.847 | 2.98469 | 0.4458 | 0.0079 | 1.781 |
| 293.026 | 4.00660 | 0.5292 | 0.0076 | 1.442 |
| 293.303 | 5.03079 | 0.6086 | 0.0082 | 1.340 |
Table A6.
Experimental results for solubility measurements of pure carbon dioxide in [Bmim][Tf2N] at T = 293.15 K using Raman spectroscopy. Recorded temperature (ITS-90), pressure, mol fraction, and estimated uncertainties (k = 2) are listed in the table.
Table A6.
Experimental results for solubility measurements of pure carbon dioxide in [Bmim][Tf2N] at T = 293.15 K using Raman spectroscopy. Recorded temperature (ITS-90), pressure, mol fraction, and estimated uncertainties (k = 2) are listed in the table.
| T/K | p/MPa | xCO2 | U(xCO2) | U(xCO2)·(xCO2)−1/% |
|---|---|---|---|---|
| 293.090 | 0.10145 | 0.0586 | 0.0029 | 4.966 |
| 293.279 | 0.20236 | 0.0860 | 0.0042 | 4.873 |
| 293.216 | 0.30252 | 0.1136 | 0.0056 | 4.904 |
| 293.200 | 0.40159 | 0.1440 | 0.0069 | 4.759 |
| 293.199 | 0.50097 | 0.1607 | 0.0075 | 4.641 |
| 293.190 | 0.99947 | 0.2782 | 0.0126 | 4.532 |
| 293.273 | 1.50195 | 0.3578 | 0.0141 | 3.942 |
| 293.180 | 2.01805 | 0.4424 | 0.0167 | 3.785 |
| 293.214 | 3.00150 | 0.5484 | 0.0203 | 3.695 |
| 293.219 | 4.00222 | 0.6194 | 0.0228 | 3.683 |
| 293.206 | 5.00784 | 0.6767 | 0.0242 | 3.578 |
Appendix C. Sample Spectrum of Carbon Dioxide in Water
Figure A1.
Raman spectrum of dissolved carbon dioxide in water at T = 288.15 K and p = 4 MPa. Different bands of carbon dioxide (1250–1450) cm−1 and water ~1649 cm−1, (2750–3750) cm−1 are displayed at the respective Raman shift.
Figure A1.
Raman spectrum of dissolved carbon dioxide in water at T = 288.15 K and p = 4 MPa. Different bands of carbon dioxide (1250–1450) cm−1 and water ~1649 cm−1, (2750–3750) cm−1 are displayed at the respective Raman shift.

References
- Somekawa, T.; Takeuchi, T.; Yamanaka, C.; Fujita, M. Raman spectroscopy measurements of CO2 dissolved in water and CO2 bubbles for laser remote sensing in water. In Remote Sensing of the Ocean, Sea Ice, Coastal Waters, and Large Water Regions, Proceedings of the SPIE Remote Sensing, Amsterdam, The Netherlands, 22–25 September 2014; SPIE: Bellingham, WA, USA, 2014; Volume 9240. [Google Scholar] [CrossRef]
- Somekawa, T.; Fujita, M. Raman Spectroscopic Measurements of CO2 Dissolved in Seawater for Laser Remote Sensing in Water. EPJ Web Conf. 2016, 119, 25017. [Google Scholar] [CrossRef] [Green Version]
- Li, L.; Zhang, X.; Luan, Z.; Du, Z.; Xi, S.; Wang, B.; Cao, L.; Lian, C.; Yan, J. In Situ Quantitative Raman Detection of Dissolved Carbon Dioxide and Sulfate in Deep-Sea High-Temperature Hydrothermal Vent Fluids. Geochem. Geophys. Geosyst. 2018, 19, 1809–1823. [Google Scholar] [CrossRef]
- Valtz, A.; Chapoy, A.; Coquelet, C.; Paricaud, P.; Richon, D. Vapour–Liquid Equilibria in the Carbon Dioxide–Water System, Measurement and Modelling from 278.2 to 318.2K. Fluid Phase Equilibria 2004, 226, 333–344. [Google Scholar] [CrossRef]
- Chapoy, A.; Mohammadi, A.H.; Chareton, A.; Tohidi, B.; Richon, D. Measurement and Modeling of Gas Solubility and Literature Review of the Properties for the Carbon Dioxide−Water System. Ind. Eng. Chem. Res. 2004, 43, 1794–1802. [Google Scholar] [CrossRef]
- Lucile, F.; Cézac, P.; Contamine, F.; Serin, J.-P.; Houssin, D.; Arpentinier, P. Solubility of Carbon Dioxide in Water and Aqueous Solution Containing Sodium Hydroxide at Temperatures from (293.15 to 393.15) K and Pressure up to 5 MPa: Experimental Measurements. J. Chem. Eng. Data 2012, 57, 784–789. [Google Scholar] [CrossRef]
- Zhang, J.; Tong, D.; Fennell, P.S.; Trusler, J.P.M. Solubility of CO2 in aqueous amine solutions: A study to select solvents for carbon capture from natural-gas power plant. In Proceedings of the 4th International Gas Processing Symposium; Elsevier: Amsterdam, The Netherlands, 2015; pp. 1–10, ISBN 978-0-444-63461-0. [Google Scholar]
- Kiepe, J.; Horstmann, S.; Fischer, K.; Gmehling, J. Experimental Determination and Prediction of Gas Solubility Data for CO2 + H2O Mixtures Containing NaCl or KCl at Temperatures between 313 and 393 K and Pressures up to 10 MPa. Ind. Eng. Chem. Res. 2002, 41, 4393–4398. [Google Scholar] [CrossRef]
- Koschel, D.; Coxam, J.-Y.; Rodier, L.; Majer, V. Enthalpy and Solubility Data of CO2 in Water and NaCl(Aq) at Conditions of Interest for Geological Sequestration. Fluid Phase Equilibria 2006, 247, 107–120. [Google Scholar] [CrossRef]
- Wu, G.; Cao, E.; Kuhn, S.; Gavriilidis, A. A Novel Approach for Measuring Gas Solubility in Liquids Using a Tube-in-Tube Membrane Contactor. Chem. Eng. Technol. 2017, 40, 2346–2350. [Google Scholar] [CrossRef] [Green Version]
- Wu, H.; Zheng, K.; Wang, G.; Yang, Y.; Li, Y. Modeling of Gas Solubility in Hydrocarbons Using the Perturbed-Chain Statistical Associating Fluid Theory Equation of State. Ind. Eng. Chem. Res. 2019, 58, 12347–12360. [Google Scholar] [CrossRef]
- Christmas, K.M.; Bassingthwaighte, J.B. Equations for O2 and CO2 Solubilities in Saline and Plasma: Combining Temperature and Density Dependences. J. Appl. Physiol. 2017, 122, 1313–1320. [Google Scholar] [CrossRef] [Green Version]
- Lei, Z.; Dai, C.; Chen, B. Gas Solubility in Ionic Liquids. Chem. Rev. 2014, 114, 1289–1326. [Google Scholar] [CrossRef]
- Aki, S.N.V.K.; Mellein, B.R.; Saurer, E.M.; Brennecke, J.F. High-Pressure Phase Behavior of Carbon Dioxide with Imidazolium-Based Ionic Liquids. J. Phys. Chem. B 2004, 108, 20355–20365. [Google Scholar] [CrossRef]
- Anthony, J.L.; Anderson, J.L.; Maginn, E.J.; Brennecke, J.F. Anion Effects on Gas Solubility in Ionic Liquids. J. Phys. Chem. B 2005, 109, 6366–6374. [Google Scholar] [CrossRef] [Green Version]
- Anthony, J.L.; Maginn, E.J.; Brennecke, J.F. Solubilities and Thermodynamic Properties of Gases in the Ionic Liquid 1- n -Butyl-3-Methylimidazolium Hexafluorophosphate. J. Phys. Chem. B 2002, 106, 7315–7320. [Google Scholar] [CrossRef]
- Barry, J.P.; Buck, K.R.; Lovera, C.; Brewer, P.G.; Seibel, B.A.; Drazen, J.C.; Tamburri, M.N.; Whaling, P.J.; Kuhnz, L.; Pane, E.F. The Response of Abyssal Organisms to Low PH Conditions during a Series of CO2-Release Experiments Simulating Deep-Sea Carbon Sequestration. Deep Sea Res. Part II Top. Stud. Oceanogr. 2013, 92, 249–260. [Google Scholar] [CrossRef]
- Leung, D.Y.C.; Caramanna, G.; Maroto-Valer, M.M. An Overview of Current Status of Carbon Dioxide Capture and Storage Technologies. Renew. Sustain. Energy Rev. 2014, 39, 426–443. [Google Scholar] [CrossRef] [Green Version]
- Laizāns, A. Analytical model and simulation of oxygen solubility in wastewater. In Proceedings of the International Scientific Conference, Jelgava, Latvia, 28–30 May 2012; pp. 109–114. [Google Scholar]
- Seewald, J.S.; Doherty, K.W.; Hammar, T.R.; Liberatore, S.P. A New Gas-Tight Isobaric Sampler for Hydrothermal Fluids. Deep Sea Res. Part I Oceanogr. Res. Pap. 2002, 49, 189–196. [Google Scholar] [CrossRef]
- Hallett, J.P.; Welton, T. Room-Temperature Ionic Liquids: Solvents for Synthesis and Catalysis. Chem. Rev. 2011, 111, 3508–3576. [Google Scholar] [CrossRef]
- Blanchard, L.A.; Gu, Z.; Brennecke, J.F. High-Pressure Phase Behavior of Ionic Liquid/CO2 Systems. J. Phys. Chem. B 2001, 105, 2437–2444. [Google Scholar] [CrossRef] [Green Version]
- Chauvin, Y.; Mussmann, L.; Olivier, H. A Novel Class of Versatile Solvents for Two-Phase Catalysis: Hydrogenation, Isomerization, and Hydroformylation of Alkenes Catalyzed by Rhodium Complexes in Liquid 1,3-Dialkylimidazolium Salts. Angew. Chem. Int. Ed. Engl. 1996, 34, 2698–2700. [Google Scholar] [CrossRef]
- Fonseca, I.M.A.; Almeida, J.P.B.; Fachada, H.C. Automated Apparatus for Gas Solubility Measurements. J. Chem. Thermodyn. 2007, 39, 1407–1411. [Google Scholar] [CrossRef] [Green Version]
- Dohrn, R.; Peper, S.; Fonseca, J.M.S. High-Pressure Fluid-Phase Equilibria: Experimental Methods and Systems Investigated (2000–2004). Fluid Phase Equilibria 2010, 288, 1–54. [Google Scholar] [CrossRef]
- Bunsen, R. Ueber das Gesetz der Gasabsorption. Ann. Chem. Pharm. 1855, 93, 1–50. [Google Scholar] [CrossRef]
- Bunsen, R. On the law of absorption of gases. Phil. Mag. Ser. 4 1855, 9, 116–130. [Google Scholar] [CrossRef]
- Bunsen, R. Memoire sur la loi de l’absorption des gaz par les liquides. Ann. Chim. Phys. Ser. 3 1855, 43, 496–507. [Google Scholar]
- Naim, A.B.; Baer, S. Method for Measuring Solubilities of Slightly Soluble Gases in Liquids. Trans. Faraday Soc. 1963, 59, 2735. [Google Scholar] [CrossRef]
- Liu, N.; Aymonier, C.; Lecoutre, Y.; Garrabos, Y.; Marre, S. Microfluidic approach for studying CO2 solubility in water and brine using confocal Raman spectroscopy. Chem. Phys. Lett. 2012, 551, 139–143. [Google Scholar] [CrossRef]
- Caumon, M.-C.; Sterpenich, J.; Randi, A.; Pironon, J. Measuring Mutual Solubility in the H2O–CO2 System up to 200 Bar and 100 °C by in Situ Raman Spectroscopy. Int. J. Greenh. Gas Con. 2016, 47, 63–70. [Google Scholar] [CrossRef]
- Guo, H.; Huang, Y.; Chen, Y.; Zhou, Q. Quantitative Raman Spectroscopic Measurements of CO2 Solubility in NaCl Solution from (273.15 to 473.15) K at p = (10.0, 20.0, 30.0, and 40.0) MPa. J. Chem. Eng. Data 2016, 61, 466–474. [Google Scholar] [CrossRef]
- Wang, Z.; Zhou, Q.; Guo, H.; Yang, P.; Lu, W. Determination of water solubility in supercritical CO2 from 313.15 to 473.15 K and from 10 to 50 MPa by in-situ quantitative Raman spectroscopy. Fluid Phase Equilibr. 2018, 476, 170–178. [Google Scholar] [CrossRef]
- Lipinski, G.; Holzammer, C.; Petermann, M.; Richter, M. Measurement of Sorption Phenomena near Dew Points of Fluid Mixtures: Concept for the Combination of Gravimetric Sorption Analysis and Raman Spectroscopy. Meas. Sci. Technol. 2018, 29, 105501. [Google Scholar] [CrossRef]
- Holzammer, C.; Finckenstein, A.; Will, S.; Braeuer, A.S. How Sodium Chloride Salt Inhibits the Formation of CO2 Gas Hydrates. J. Phys. Chem. B 2016, 120, 2452–2459. [Google Scholar] [CrossRef] [PubMed] [Green Version]
- Lemmon, E.; Harvey, A.; Hardin, G.; Bell, I.; Huber, M.; McLinden, M. NIST Reference Fluid Thermodynamic and Transport Properties Database (REFPROP), Version 10—SRD 23; National Institute of Standards and Technology: Boulder, CO, USA, 2018. [Google Scholar]
- Span, R.; Beckmüller, R.; Hielscher, S.; Jäger, A.; Mickoleit, E.; Neumann, T.; Pohl, S.; Semrau, B.; Thol, M. TREND. Thermodynamic Reference and Engineering Data 5.0; Ruhr University Bochum: Bochum, Germany, 2020. [Google Scholar]
- Wagner, W.; Pruss, A. International Equations for the Saturation Properties of Ordinary Water Substance. Revised According to the International Temperature Scale of 1990. Addendum to J. Phys. Chem. Ref. Data 16, 893 (1987). J. Phys. Chem. Ref. Data 1993, 22, 783–787. [Google Scholar] [CrossRef] [Green Version]
- Soldatović, D.; Vuksanović, J.; Radović, I.; Višak, Z.; Kijevčanin, M. Excess Molar Volumes and Viscosity Behaviour of Binary Mixtures of Aniline/or N,N-Dimethylaniline with Imidazolium Ionic Liquids Having Triflate or Bistriflamide Anion. J. Chem. Thermodyn. 2017, 109, 137–154. [Google Scholar] [CrossRef] [Green Version]
- Huo, Y.; Xia, S.; Ma, P. Densities of Ionic Liquids, 1-Butyl-3-Methylimidazolium Hexafluorophosphate and 1-Butyl-3-Methylimidazolium Tetrafluoroborate, with Benzene, Acetonitrile, and 1-Propanol at T = (293.15 to 343.15) K. J. Chem. Eng. Data 2007, 52, 2077–2082. [Google Scholar] [CrossRef]
- Kiefer, J. Recent Advances in the Characterization of Gaseous and Liquid Fuels by Vibrational Spectroscopy. Energies 2015, 8, 3165–3197. [Google Scholar] [CrossRef] [Green Version]
- Span, R.; Wagner, W. A New Equation of State for Carbon Dioxide Covering the Fluid Region from the Triple-Point Temperature to 1100 K at Pressures up to 800 MPa. J. Phys. Chem. Ref. Data 1996, 25, 1509–1596. [Google Scholar] [CrossRef] [Green Version]
- Woodward, L.A.; George, J.H.B. Refractive Index Correction in Relative Raman Intensity Measurements. Nature 1951, 167, 193. [Google Scholar] [CrossRef]
- Riazi, M.R.; Roomi, Y.A. Use of the Refractive Index in the Estimation of Thermophysical Properties of Hydrocarbons and Petroleum Mixtures. Ind. Eng. Chem. Res. 2001, 40, 1975–1984. [Google Scholar] [CrossRef]
- Tariq, M.; Forte, P.A.S.; Gomes, M.F.C.; Lopes, J.N.C.; Rebelo, L.P.N. Densities and Refractive Indices of Imidazolium- and Phosphonium-Based Ionic Liquids: Effect of Temperature, Alkyl Chain Length, and Anion. J. Chem. Thermodyn. 2009, 41, 790–798. [Google Scholar] [CrossRef]
- Guide to the Expression of Uncertainty in Measurement, 1st ed.; International Bureau of Weights and Measures; International Organization for Standardization (Eds.) International Organization for Standardization: Genève, Switzerland, 1993; ISBN 978-92-67-10188-0. [Google Scholar]
- Anderson, G.R. The Raman Spectra of Carbon Dioxide in Liquid Water and Water-D2. J. Phys. Chem. 1977, 81, 273–276. [Google Scholar] [CrossRef]
- Wiebe, R.; Gaddy, V.L. The Solubility of Carbon Dioxide in Water at Various Temperatures from 12 to 40° and at Pressures to 500 Atmospheres. Critical Phenomena. J. Am. Chem. Soc. 1940, 62, 815–817. [Google Scholar] [CrossRef]
- Ashcroft, S.J.; Isa, M.B. Effect of Dissolved Gases on the Densities of Hydrocarbons. J. Chem. Eng. Data 1997, 42, 1244–1248. [Google Scholar] [CrossRef]
- Watanabe, H.; Iizuka, K. The Influence of Dissolved Gases on the Density of Water. Metrologia 1985, 21, 19–26. [Google Scholar] [CrossRef]
Figure 1.
Schematic diagram of the experimental setup, consisting of Braeuer’s Raman gun mounted on a 3-axis stage (right), the measuring cell, including the sample holder (middle), and a beam dump (left) to absorb the excessive laser light. The gas outlet is connected to a diaphragm vacuum pump via a valve (both not shown in the diagram); the gas inlet is connected the filling and pressure measurement circuit.

Figure 2.
Example of an intensity vs. density plot of carbon dioxide at T = 293.24 K. The peak area of the right peak of the Fermi dyad, Ivap, is plotted against density values calculated with an EOS, ρvap. The slope of the linear regression line mcal (y = 20,691x, R2 = 0.9972) is used to calculate the density of the dissolved gas molecules, ρsol, and is given to 95% of confidence.

Figure 3.
Solubility of carbon dioxide in water at T = (288.24, 293.31, 298.16) K, respectively. Literature date are reported in references [4,5,6]. Uncertainty values are not shown for clarity but are provided in Appendix A.
Figure 3.
Solubility of carbon dioxide in water at T = (288.24, 293.31, 298.16) K, respectively. Literature date are reported in references [4,5,6]. Uncertainty values are not shown for clarity but are provided in Appendix A.

Figure 4.
Raman spectra of dissolved carbon dioxide in [Bmim][Tf2N] at p = 3.0015 MPa and T = 293.21 K. (A) Original spectrum without further processing in the relevant Raman shift range. (B) Spectrum of the revealed carbon dioxide Fermi dyad after subtraction of the Raman spectrum in vacuum.
Figure 4.
Raman spectra of dissolved carbon dioxide in [Bmim][Tf2N] at p = 3.0015 MPa and T = 293.21 K. (A) Original spectrum without further processing in the relevant Raman shift range. (B) Spectrum of the revealed carbon dioxide Fermi dyad after subtraction of the Raman spectrum in vacuum.

Figure 5.
Solubility of carbon dioxide in [Bmim][OTf], [Bmim][PF6] and [Bmim][Tf2N] at T = (298.21, 298.17, 298.22) K, respectively. Literature date are reported in references [14,15]. Uncertainty values are not shown for clarity but are provided in Appendix B.
Figure 5.
Solubility of carbon dioxide in [Bmim][OTf], [Bmim][PF6] and [Bmim][Tf2N] at T = (298.21, 298.17, 298.22) K, respectively. Literature date are reported in references [14,15]. Uncertainty values are not shown for clarity but are provided in Appendix B.

Table 1.
Molar purities of the pure substances studied in the present work.
| Chemical Name | Source | Purity |
|---|---|---|
| Carbon dioxide | Air Liquide | 99.9999% |
| Helium | Air Liquide | 99.9999% |
| 1-Butyl-3-methyl-imidazolium-trifluormethansulfonat | Sigma-Aldrich | ≥95.0% |
| 1-Butyl-3-methyl-imidazolium-hexafluorophosphat | Sigma-Aldrich | ≥97.0% |
| 1-Butyl-3-methylimidazolium-bis(trifluormethylsulfonyl)imid | Sigma-Aldrich | ≥98.0% |
Publisher’s Note: MDPI stays neutral with regard to jurisdictional claims in published maps and institutional affiliations. |
© 2021 by the authors. Licensee MDPI, Basel, Switzerland. This article is an open access article distributed under the terms and conditions of the Creative Commons Attribution (CC BY) license (https://creativecommons.org/licenses/by/4.0/).
Share and Cite
MDPI and ACS Style
Lipinski, G.; Richter, M. Raman Sensor for the Determination of Gas Solubility. Physchem 2021, 1, 176-188. https://0-doi-org.brum.beds.ac.uk/10.3390/physchem1020012
AMA Style
Lipinski G, Richter M. Raman Sensor for the Determination of Gas Solubility. Physchem. 2021; 1(2):176-188. https://0-doi-org.brum.beds.ac.uk/10.3390/physchem1020012
Chicago/Turabian StyleLipinski, Gregor, and Markus Richter. 2021. "Raman Sensor for the Determination of Gas Solubility" Physchem 1, no. 2: 176-188. https://0-doi-org.brum.beds.ac.uk/10.3390/physchem1020012