
Effect of Textile Characteristics on the AR-Glass Fabric Efficiency


1
Department of Civil and Environmental Engineering, Politecnico di Milano, 20133 Milan, Italy
2
Gavazzi Tessuti Tecnici S.p.a., 23801 Calolziocorte, Italy
*
Author to whom correspondence should be addressed.
Textiles 2021, 1(2), 387-404; https://0-doi-org.brum.beds.ac.uk/10.3390/textiles1020020
Submission received: 31 July 2021
/
Revised: 30 August 2021
/
Accepted: 7 September 2021
/
Published: 14 September 2021
(This article belongs to the Special Issue New Research Trends for Textiles)
Abstract
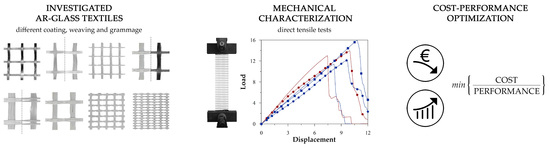
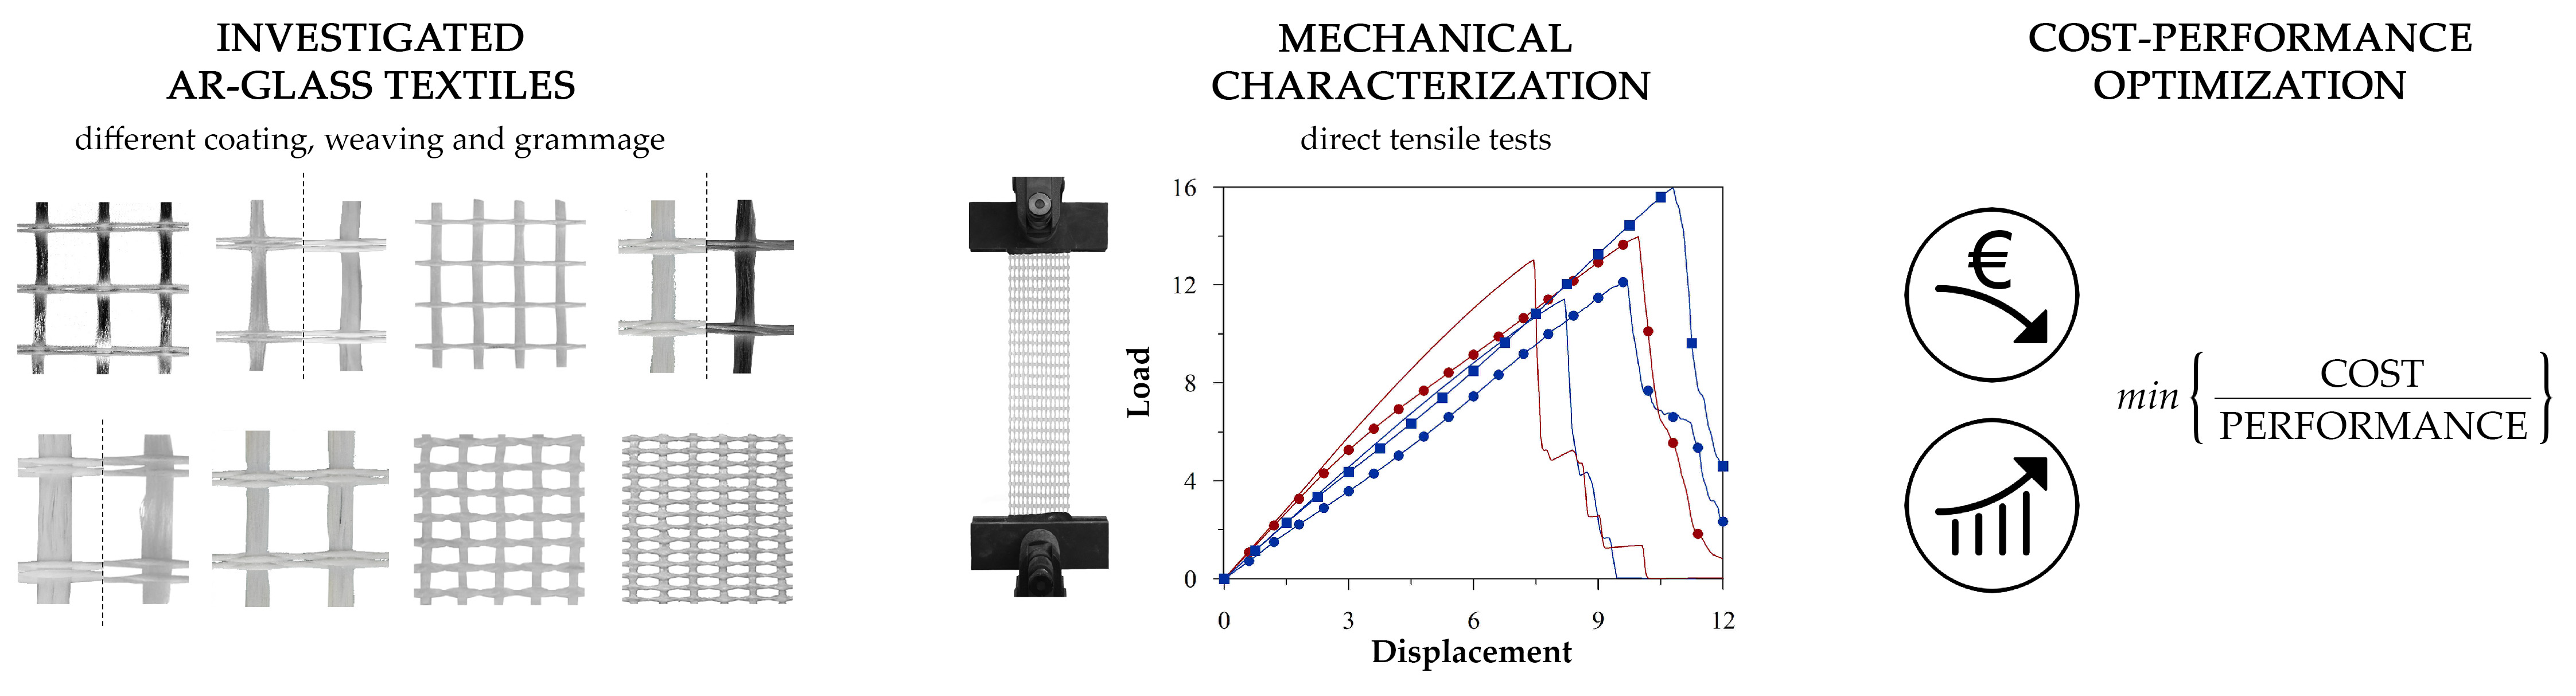
:Alkali-resistant (AR) glass textiles are used as the main reinforcement in several composite applications due to their good performance-to-cost ratio. A huge variety of textiles are already present in the market; they differ on various parameters, such as, for example, the filaments’ diameters, the geometry, the type of weaving, or the nature of the impregnation coating. To orient manufacturers towards the production of efficient textiles, the most important aspect is the balance between cost and performance. In this paper, a series of different fabrics designed for textile-reinforced cementitious composites were considered. Performance was assessed by means of uniaxial tensile tests and the results are presented in terms of load vs. displacement. Then, the selected AR-glass textiles were compared in terms of fabric efficiency, targeting the effect of each parameter on the textile capacity. The research here presented is part of a comprehensive campaign aimed at the optimization of glass-fabric-reinforced cementitious composites for structural retrofitting. To better discuss the different solutions tested, at the end, only considering a small number of the investigated textiles, an efficiency evaluation was carried out at the cementitious composite level.
1. Introduction
The use of textile-reinforced composites has steadily been growing in various sectors during recent years. In the construction field, alkali-resistant (AR) glass fabrics are mainly used due to their cost-to-performance ratio [1].
Typical cementitious-based composites embedding textiles of different nature (e.g., glass, carbon, basalt, PBO, etc.) are textile-reinforced concrete (TRC) [2,3], generally employed in new buildings, and fabric-reinforced cementitious matrix (FRCM) [4,5], conceived for the strengthening and retrofitting of existing structures. In TRCs and FRCMs the tensile capacity is ascribed to the reinforcing fabrics and a proper uniaxial response should result in a trilinear behavior in which the initial elastic branch is followed by the multi-cracking of the fine-grained inorganic matrix and, finally, by a marked strain-hardening phase mainly governed by the textiles.
For both manufacturers and designers, the most important aspects in devising and employing efficient composites for construction are, respectively, the reduction of the manufacturing cost and the selection, among many textiles available in the market, of those characterized by the highest performance-to-cost ratios. The weaving, the geometry, and the coating process influence the mechanical performance of the woven textiles [6,7], their suitability for the various applications, the sustainability of the different solutions, and the manufacturing costs. Moreover, the chemical nature of the coating [8,9,10,11,12] and the weaving characteristics [13,14,15] significantly affect the behavior of cementitious-based composites.
In this paper, several alternative textiles are characterized in tension and compared in terms of efficiency and costs, on the basis of the main textile characteristics. The here presented investigation represents the preliminary part of an extensive experimental campaign devoted to the optimization of AR-glass textile-based cementitious composites, namely fabric-reinforced cementitious matrix (FRCM), used in the strengthening and retrofitting of existing reinforced concrete structures, in particular those exposed to seismic actions.
2. Textiles Description: Production Method and Geometrical Properties
In this section, the description of the twenty different investigated AR-glass textiles is reported, together with the explanation of the procedures for their production and impregnation. To identify the effects of the different textile characteristics on their mechanical responses, the main differences between the various fabrics are highlighted. A summary of the main geometrical properties of the fabrics investigated in this study is reported in Table 1 and Table 2.
The AR-glass textiles are ordered at increasing equivalent thickness in the warp direction and they mainly differ in terms of roving fineness, weaving pattern, grid spacing, and nature of the coating used for the impregnation.
With the aim to compare the manufacturing costs of the different AR-glass textiles (considering material, weaving, and impregnation), the ratio between the cost of each fabric and that of one of the cheapest textiles, i.e., the raw fabric cost of F1-(S1), was computed and is reported in Table 1 as normalized cost, CN.

Table 1.
AR-glass fabric properties and costs (part 1, equivalent thickness in the warp direction lower than 0.05 mm/m).
Table 1.
AR-glass fabric properties and costs (part 1, equivalent thickness in the warp direction lower than 0.05 mm/m).
| Fabric | Roving Fineness | Filament Diameter | Wire Spacing | Equivalent Thickness | Coating | Normalized Cost, CN | |||
|---|---|---|---|---|---|---|---|---|---|
| Nature | Percentage | Raw Fabric | Coated Fabric | ||||||
| ID. | dir. | [Tex] | [µm] | [mm] | [mm/m] | [%] | [-] | [-] | |
| F1-(S1) | warp | 1200 | 19 | 25 | 0.035 | SBR 1 | 18.8 | 1 | 1.2 |
| weft | 2 × 1200 | 19 | 25 | 0.035 | |||||
| F1-(E2) | warp | 1200 | 19 | 25 | 0.035 | Epoxy 2 | 18.75 | 1 | 2.3 * |
| weft | 2 × 1200 | 19 | 25 | 0.035 | |||||
| F2-(S1) | warp | 640 | 14 | 25 | 0.038 | SBR 1 | 17.1 | 1 | 1.3 |
| weft | 2 × 1200 | 19 | 25 | 0.035 | |||||
| F2-(E1) | warp | 640 | 14 | 25 | 0.038 | Epoxy 1 | 17.1 | 1 | 2.2 |
| weft | 2 × 1200 | 19 | 25 | 0.035 | |||||
| F3-(S1) | warp | 2400 | 27 | 38 | 0.046 | SBR 1 | 18.75 | 1.3 | 2.2 |
| weft | 2 × 2400 | 27 | 38 | 0.046 | |||||
| F4-(S1) | warp | 1200 | 19 | 38 | 0.046 | SBR 1 | 19 | 1.3 | 2.2 |
| weft | 2 × 2400 | 27 | 38 | 0.046 | |||||
| F4-(S2) | warp | 1200 | 19 | 38 | 0.046 | SBR 2 | 19 | 1.3 | 2.2 |
| weft | 2 × 2400 | 27 | 38 | 0.046 | |||||
| F4-(E2) | warp | 1200 | 19 | 38 | 0.046 | Epoxy 2 | 15 | 1.3 | 2.3 * |
| weft | 2 × 2400 | 27 | 38 | 0.046 | |||||
| F5-(S1) | warp | 1200 | 19 | 18 | 0.049 | SBR 1 | 14.2 | 1.5 | 2.3 |
| weft | 2400 | 27 | 18 | 0.05 | |||||
| F6-(S2) | warp | 1200 | 19 | 18 | 0.049 | SBR 2 | 11.5 | 1.5 | 2.3 |
| weft | 2400 | 27 | 18 | 0.05 | |||||
* evaluated in proportion to the epoxy 1 coating cost and in proportion to the coating percentage.
Table 2.
AR-glass fabric properties and costs (part 2, equivalent thickness in the warp direction higher than 0.05 mm/m).
Table 2.
AR-glass fabric properties and costs (part 2, equivalent thickness in the warp direction higher than 0.05 mm/m).
| Fabric | Roving Fineness | Filament Diameter | Wire Spacing | Equivalent Thickness | Coating | Normalized Cost, CN | |||
|---|---|---|---|---|---|---|---|---|---|
| Nature | Percentage | Raw Fabric | Coated Fabric | ||||||
| ID. | dir. | [Tex] | [µm] | [mm] | [mm/m] | [%] | [-] | [-] | |
| F7-(S1) | warp | 1200 | 19 | 33 | 0.053 | SBR 1 | 13.5 | 1.5 | 2.4 |
| weft | 2 × 2400 | 27 | 33 | 0.053 | |||||
| F7-(E1) | warp | 1200 | 19 | 33 | 0.053 | Epoxy 1 | 17.9 | 1.5 | 2.7 |
| weft | 2 × 2400 | 27 | 33 | 0.053 | |||||
| F8-(S2) | warp | 2400 | 27 | 38 | 0.093 | SBR 2 | 13.5 | 2.6 | 3.3 |
| weft | 4 × 2400 | 27 | 38 | 0.093 | |||||
| F8-(E2) | warp | 2400 | 27 | 38 | 0.093 | Epoxy 2 | 13.8 | 2.6 | 4.8 * |
| weft | 4 × 2400 | 27 | 38 | 0.093 | |||||
| F8-(E1) | warp | 2400 | 27 | 38 | 0.093 | Epoxy 1 | 17 | 2.6 | 5.3 |
| weft | 4 × 2400 | 27 | 38 | 0.093 | |||||
| F9-(S1) | warp | 2400 | 27 | 38 | 0.093 | SBR 1 | 10.2 | 2.5 | 3.2 |
| weft | 4 × 2400 | 27 | 42 | 0.085 | |||||
| F10-(E1) | warp | 2400 | 27 | 33 | 0.106 | Epoxy 1 | 11.7 | 2.9 | 4.6 |
| weft | 4 × 2400 | 27 | 33 | 0.106 | |||||
| F11-(S2) | warp | 2400 | 27 | 10 | 0.179 | SBR 2 | 12.9 | 3.3 | 4.3 |
| weft | 2 × 1200 | 19 | 14 | 0.062 | |||||
| F11-(E1) | warp | 2400 | 27 | 10 | 0.179 | Epoxy 1 | 12.9 | 3.3 | 5.9 |
| weft | 2 × 1200 | 19 | 14 | 0.062 | |||||
| F12-(S1) | warp | 1200 | 19 | 5 | 0.179 | SBR 1 | 16 | 3.1 | 3.7 |
| weft | 2400 | 27 | 12 | 0.071 | |||||
* evaluated in proportion to the epoxy 1 coating cost and in proportion to the coating percentage.
2.1. Roving, Weaving, and Pattern Descriptions
The investigated textiles are based on the weavings of AR-glass rovings produced with filaments of different diameters. The roving is a flat yarn, without any torsion, composed of continuous AR-glass filaments. The diameter of each filament corresponds to the fineness of the single yarns, computed in Tex. The Tex is a direct measurement of the linear density, corresponding to the weight in grams per 1000 m of a yarn (glass yarn density is considered equal to 2680 kg/m3). The employed AR-glass rovings are the following:
- Roving 320 Tex, composed of 800 filaments of 14 μm diameter;
- Roving 640 Tex, composed of 1600 filaments of 14 μm diameter;
- Roving 1200 Tex, composed of 1600 filaments of 19 μm diameter;
- Roving 2400 Tex, composed of 1600 filaments of 27 μm diameter.
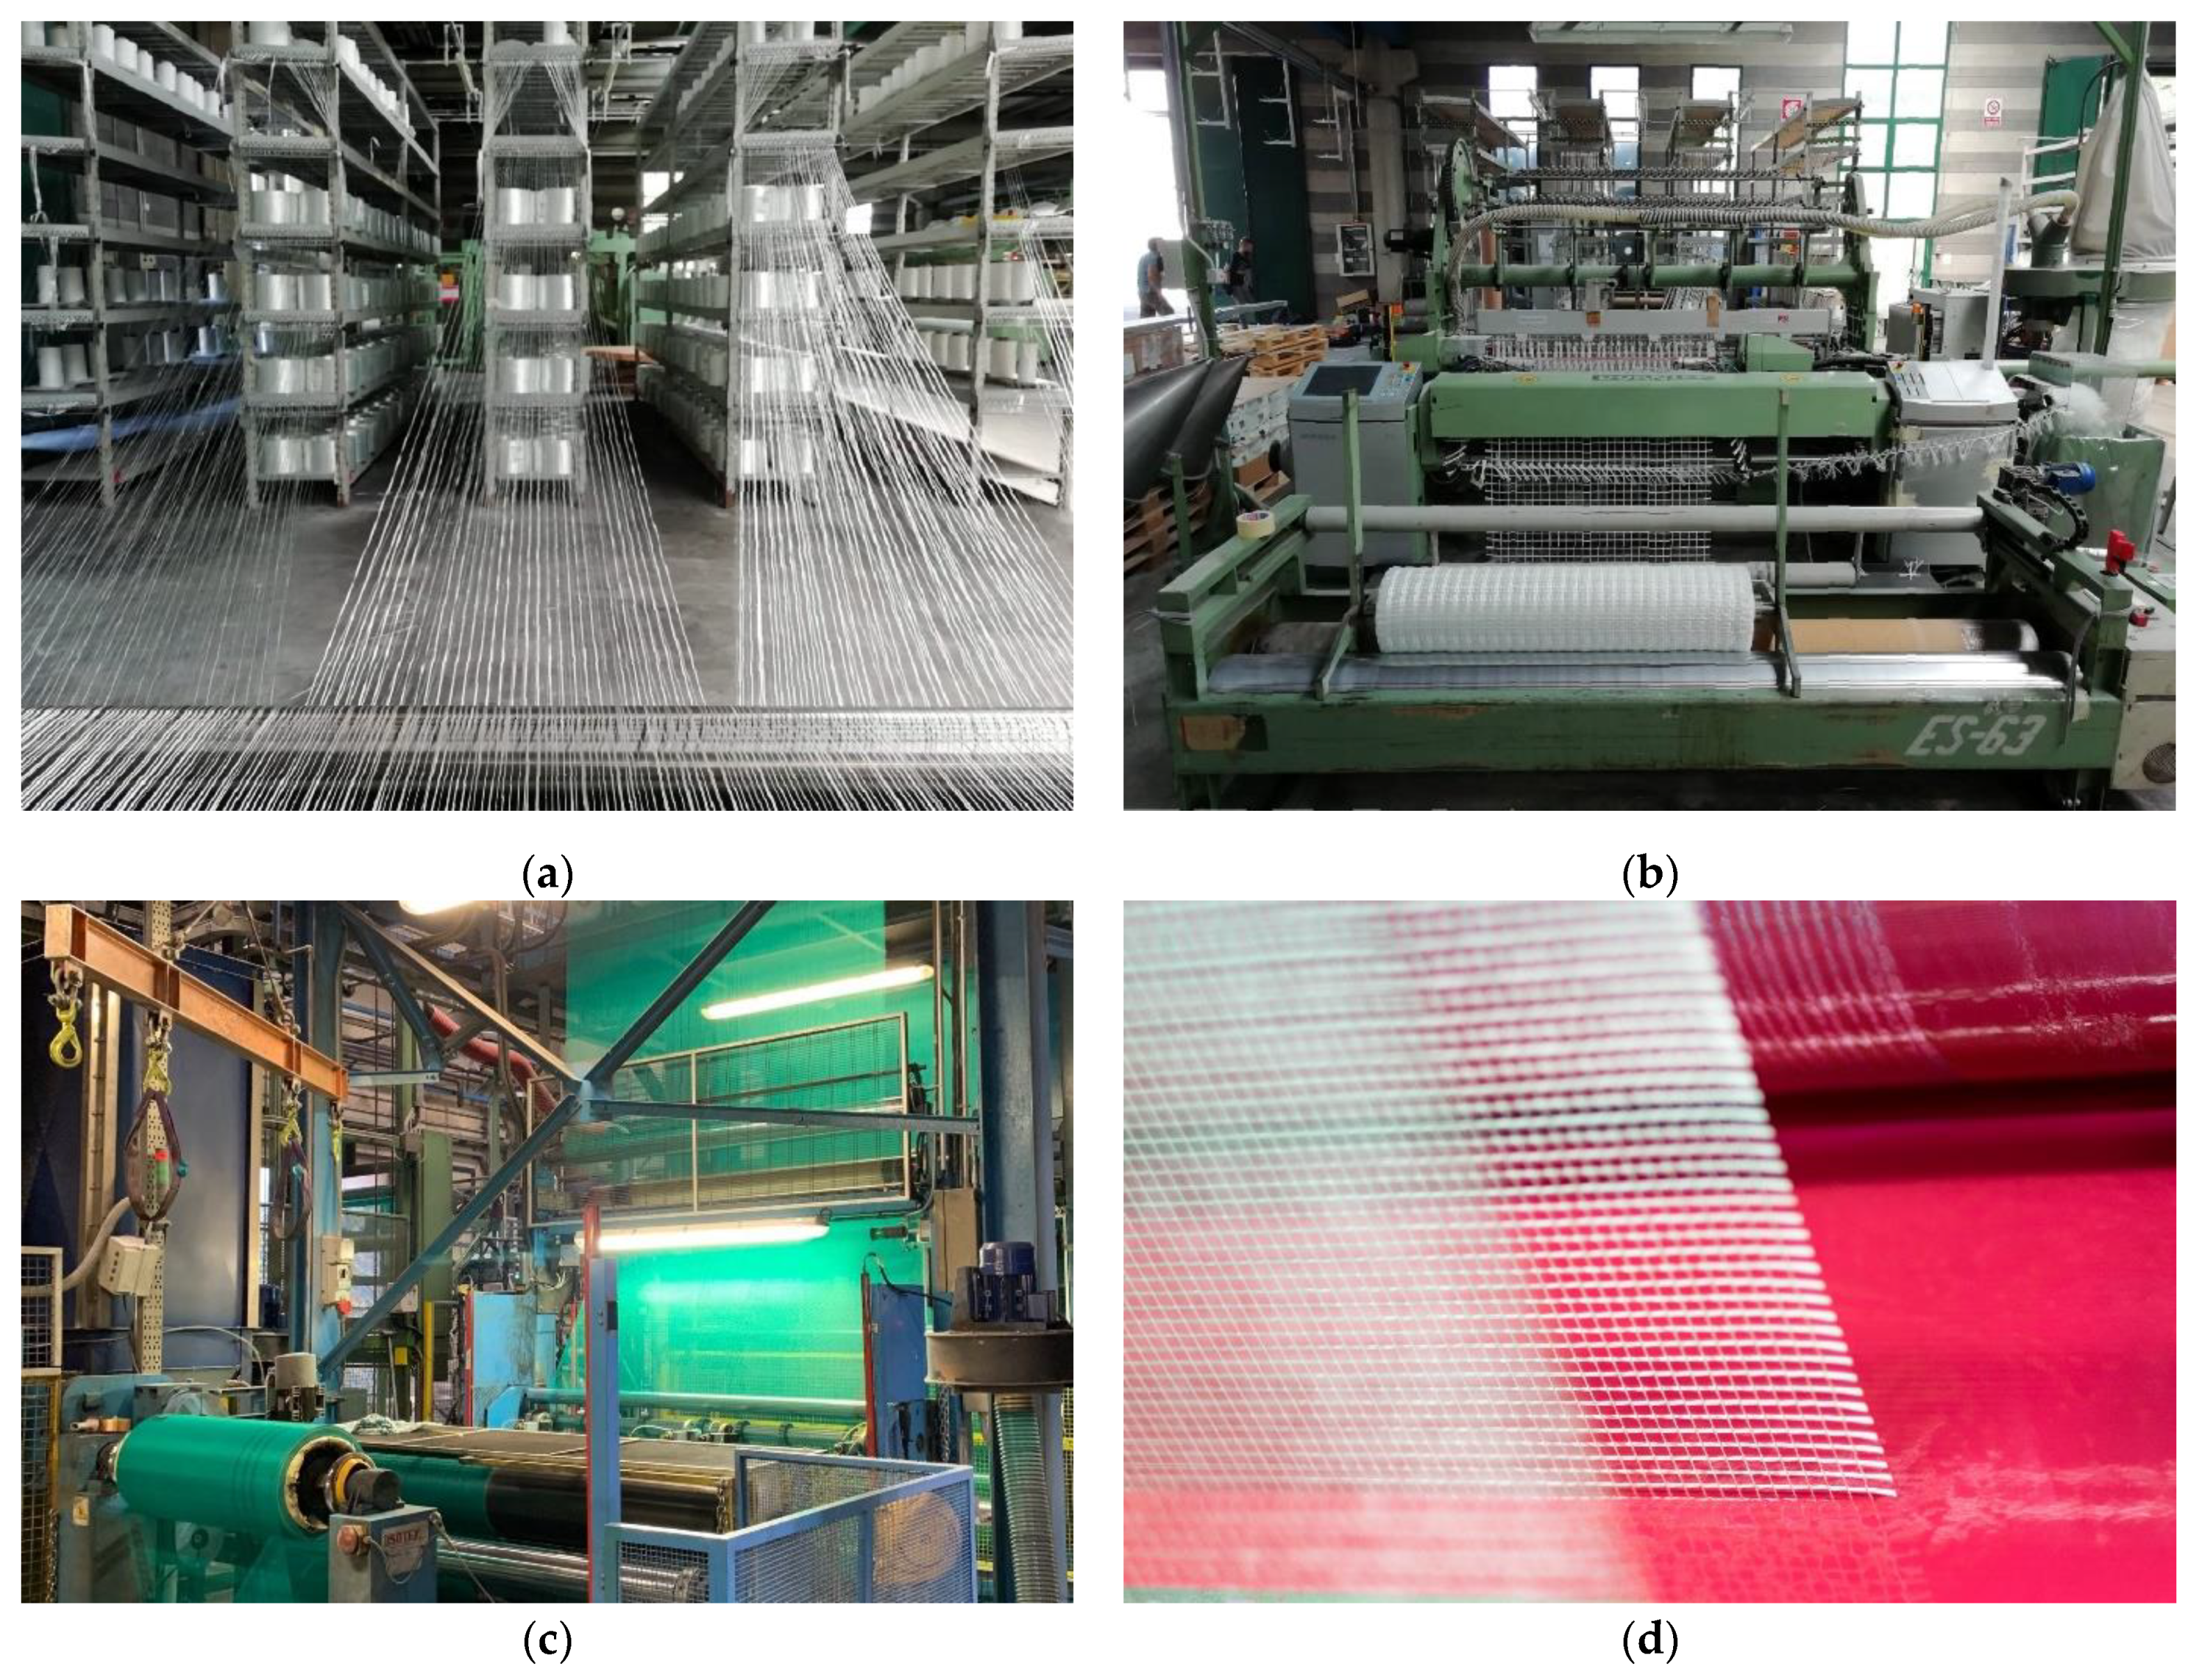
In the weaving process, the AR-glass spools forming the warp direction, according to the mesh construction, are placed on the creel and pulled in parallel to the weaving loom, where the weft rovings are inserted in the perpendicular direction, Figure 1a,b. The pattern of the mesh is built by the loom during the weaving process. Fabrics realized by two different patterns were taken into account in this study: plain and leno weave ones. In the case of the leno weave pattern, two warp yarns are twisted around the weft yarns, in order to guarantee a strong shear resistance of the mesh junctions. Leno weave produces an open fabric, with almost no yarn slip and higher flexibility to the warp direction, while the weft yarns remain completely flat. To increase the junction stiffness and the textile grammage, it is possible to produce textile meshes with double or triple leno patterns.
Plain weave is a textile pattern in which each warp roving crosses the perpendicular direction, passing alternatively over and under subsequent weft rovings during the entire weaving process. The rigidity and the tensile responses of the plain weave mesh are substantially the same in the two main directions, because both the warp and the weft rovings remain flat.
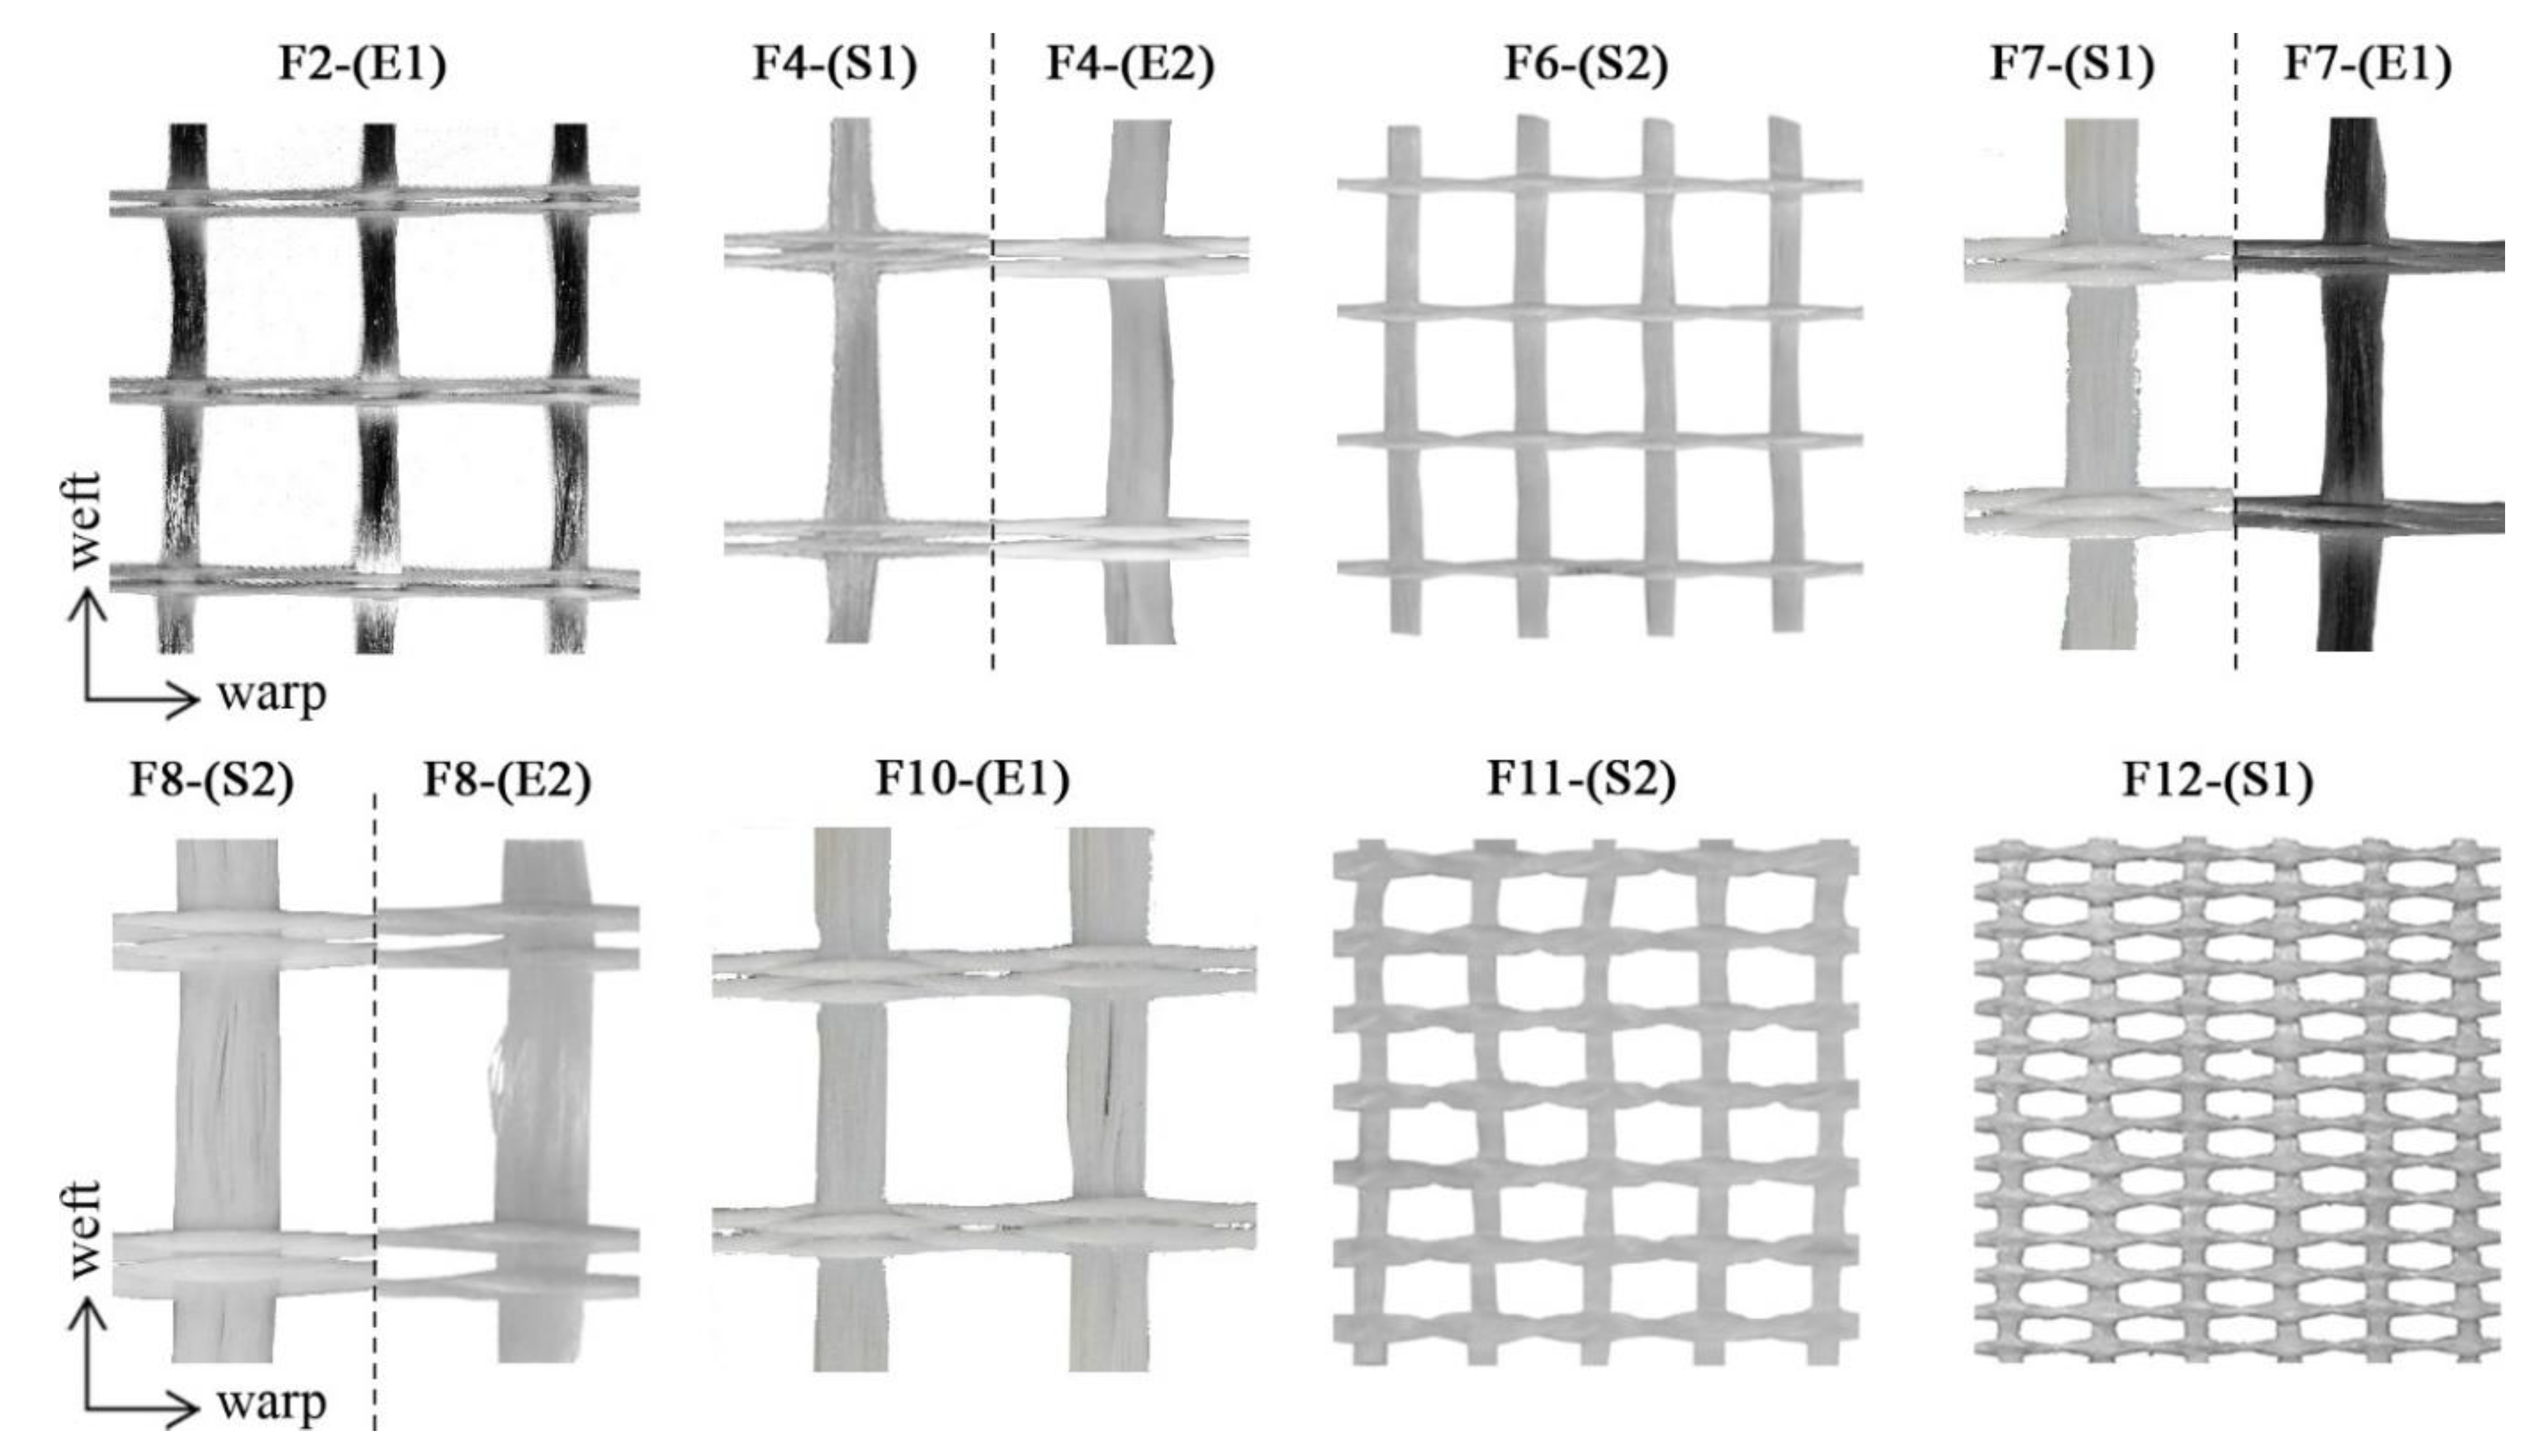
The different patterns of the textiles investigated in this study were: (i) the plain one for fabrics F1, F3, and F5; (ii) the leno one for the F11 and F12 meshes; and (iii) the double leno one for the F2, F4, F6, F7, F8, and F9 textiles (see Figure 2). The effect of the pattern on the mechanical response of the textiles is not herein discussed, due to numerically insufficient data.
2.2. Impregnation Phase and Coatings Description
Following the weaving of the raw mesh, fabrics are impregnated through a dip-coating process (Figure 1c,d), by means of wet liquids obtained with various chemical formulations; such compounds provide the impregnated textiles with stability, durability, higher stiffness under tensile actions, and an increase of mechanical performance with respect to the uncoated fabrics.
The most common chemical formulations for the impregnation of the textiles, in the case of building applications, are: (i) the butadiene-styrene rubber copolymer latex (SBR) and (ii) the epoxy (E) resin system. Both were considered in the process of impregnation of the textiles investigated in this study.
The SBR coating is an aqueous, anionic dispersion of a carboxylate self-crossing butadiene styrene copolymer, in which the dry content of polymers is equal to around 50% of the weight and the viscosity corresponds to approximately 250 mPa∙s. After drying and curing at temperatures above 140 °C, the polymer forms a tack-free, flexible, and tough film (glass transition of 0 °C) with an excellent water and alkali resistance (needed in case of cementitious-based composites). The crosslinking reticulation is guaranteed by the reaction with the heat reactive monomer, as the N-methylacrylamide groups are grafted on the co-polymer chain. The condensation of two methylol groups forms a methylene bridge between the two amide functions, releasing water and formaldehyde. Carboxylic acids, mostly used as functional co-monomers, provide a good adhesion with the sizing of the AR-glass yarns.
In this study, two alternative SBR latex formulations were used: (i) without any addition of additives, called SBR 1 (S1), and (ii) with the addition of a thermoset stiff additive in a fraction of 10% by weight, named SBR 2 (S2). This was done in order to evaluate the effect of the film rigidity on the mechanical responses of both the plain mesh and of the cementitious-based composite.
The epoxy resin system is a bi-component thermoset formulation consisting of an epoxy resin, based on bisphenol A, and a polyamine hardener, which should be introduced according to a stochiometric ratio in order to ensure the complete reticulation of the system after curing. The latter takes place at 250 °C and the system becomes highly reticulated and forms a very stiff resin film.
As for the SBR, two different epoxy systems are used: (i) epoxy 1 (E1), a medium-viscosity (around 300 mPa∙s) solvent-free epoxy system that provides high adhesion with the glass fibers, and ii) epoxy 2 (E2), a very low-viscosity (less than 100 mPa∙s) and low-surface-tension solvent-based system that allows users to “open” the glass fibers, improving the resin impregnation of the roving filaments (a study on the effect of the epoxy viscosity on the textile-reinforced mortar composites performance is reported in [16]).
Due to the chemical formulation and to the differences in the curing process (i.e., temperature and process velocity), the costs of the two alternative coating solutions, SBR and epoxy, are substantially different. The SBR solution is generally cheaper than the epoxy one and a small variation is already present between the SBR 1 and SBR 2 coatings due to the addition of a thermoset stiff additive.
As declared by the manufacturer, the epoxy coating has a glass transition temperature, Tg, of around 60 °C, higher than the one of the SBR coatings. The study of its effect on the textile’s efficiency was not investigated in the present study.
With the exclusion of the epoxy 2 system, all the coatings were made by the manufacturing company that weaves the AR-glass meshes. In order to ensure a fair comparison, the cost of the impregnation of epoxy 2 textiles was taken as equal to the one of the epoxy 1 system, proportionally to the applied coating percentage. This preliminary hypothesis, which was aimed at excluding the seller markup on epoxy 2 coating, can be considered acceptable, considering the balance between the lower cost of the resin and the higher cost of the impregnation process with respect to the epoxy 1 solution. In fact, the production process of solvent-free epoxy resin requires much more steps, compared to the manufacturing of the epoxy solvent-based system, which, on the contrary, implies a higher cost of the raw material (i.e., the resin).
3. Mechanical Characterization of the AR-Glass Textiles
The selected AR-glass fabrics were tested under uniaxial tensile action, according to the strip method [17], in both the warp and the weft directions. The fabric samples (70 × 400 mm2 in size) were clamped to an electromechanical jack and tested in displacement control at a stroke rate of 100 mm/min. To prevent stress localization and slip within the clamps, epoxy resin tabs were created at the specimen ends. Three or five nominally identical specimens were tested for each fabric type; it is worth noting that some results were removed from the comparison due to their premature failure, not complying with the [17] prescriptions (i.e., yarn misalignment and failure in the clamping zones). The nominal free lengths of the different samples were chosen equal to 300 mm; the effect of the effective free length of the tested samples on the global response is not discussed in this paper. The average peak loads, Pmax, are reported in Table 3 and Table 4 and the standard deviations (std) were computed for all the cases in which at least three samples exhibited a satisfactorily failure. Starting from the average loads over 70 mm width, the corresponding maximum value over 1 m was computed (Pmax divided by the number of yarns in 70 mm and multiplied by the number of yarns in 1 m). Then, the efficiency of the fabric was evaluated, as proposed by Rampini et al. [18], as:
where σfu is the glass filament strength, assumed equal to 2000 MPa accordingly to the manufacturer data. This efficiency parameter provides important information about the rate of utilization of the glass material, identifying the quantity of AR-glass filaments that effectively contributed to the mechanical performance of the fabric under tension. The computed parameters for both the warp and the weft fabric directions are reported in Table 3 and Table 4.
In order to introduce cost-efficiency considerations, the normalized costs, CN, evaluated as explained before, were divided by the maximum load, referring to a 1 m width mesh. This parameter, reported in Table 3 only for the warp direction, represents the normalized cost needed to obtain 1 kN of tensile load. Please note that, to evaluate the CN value referring only to the warp yarns, the total fabric costs of all the textiles were multiplied by the relative grammage ratio in the warp direction.
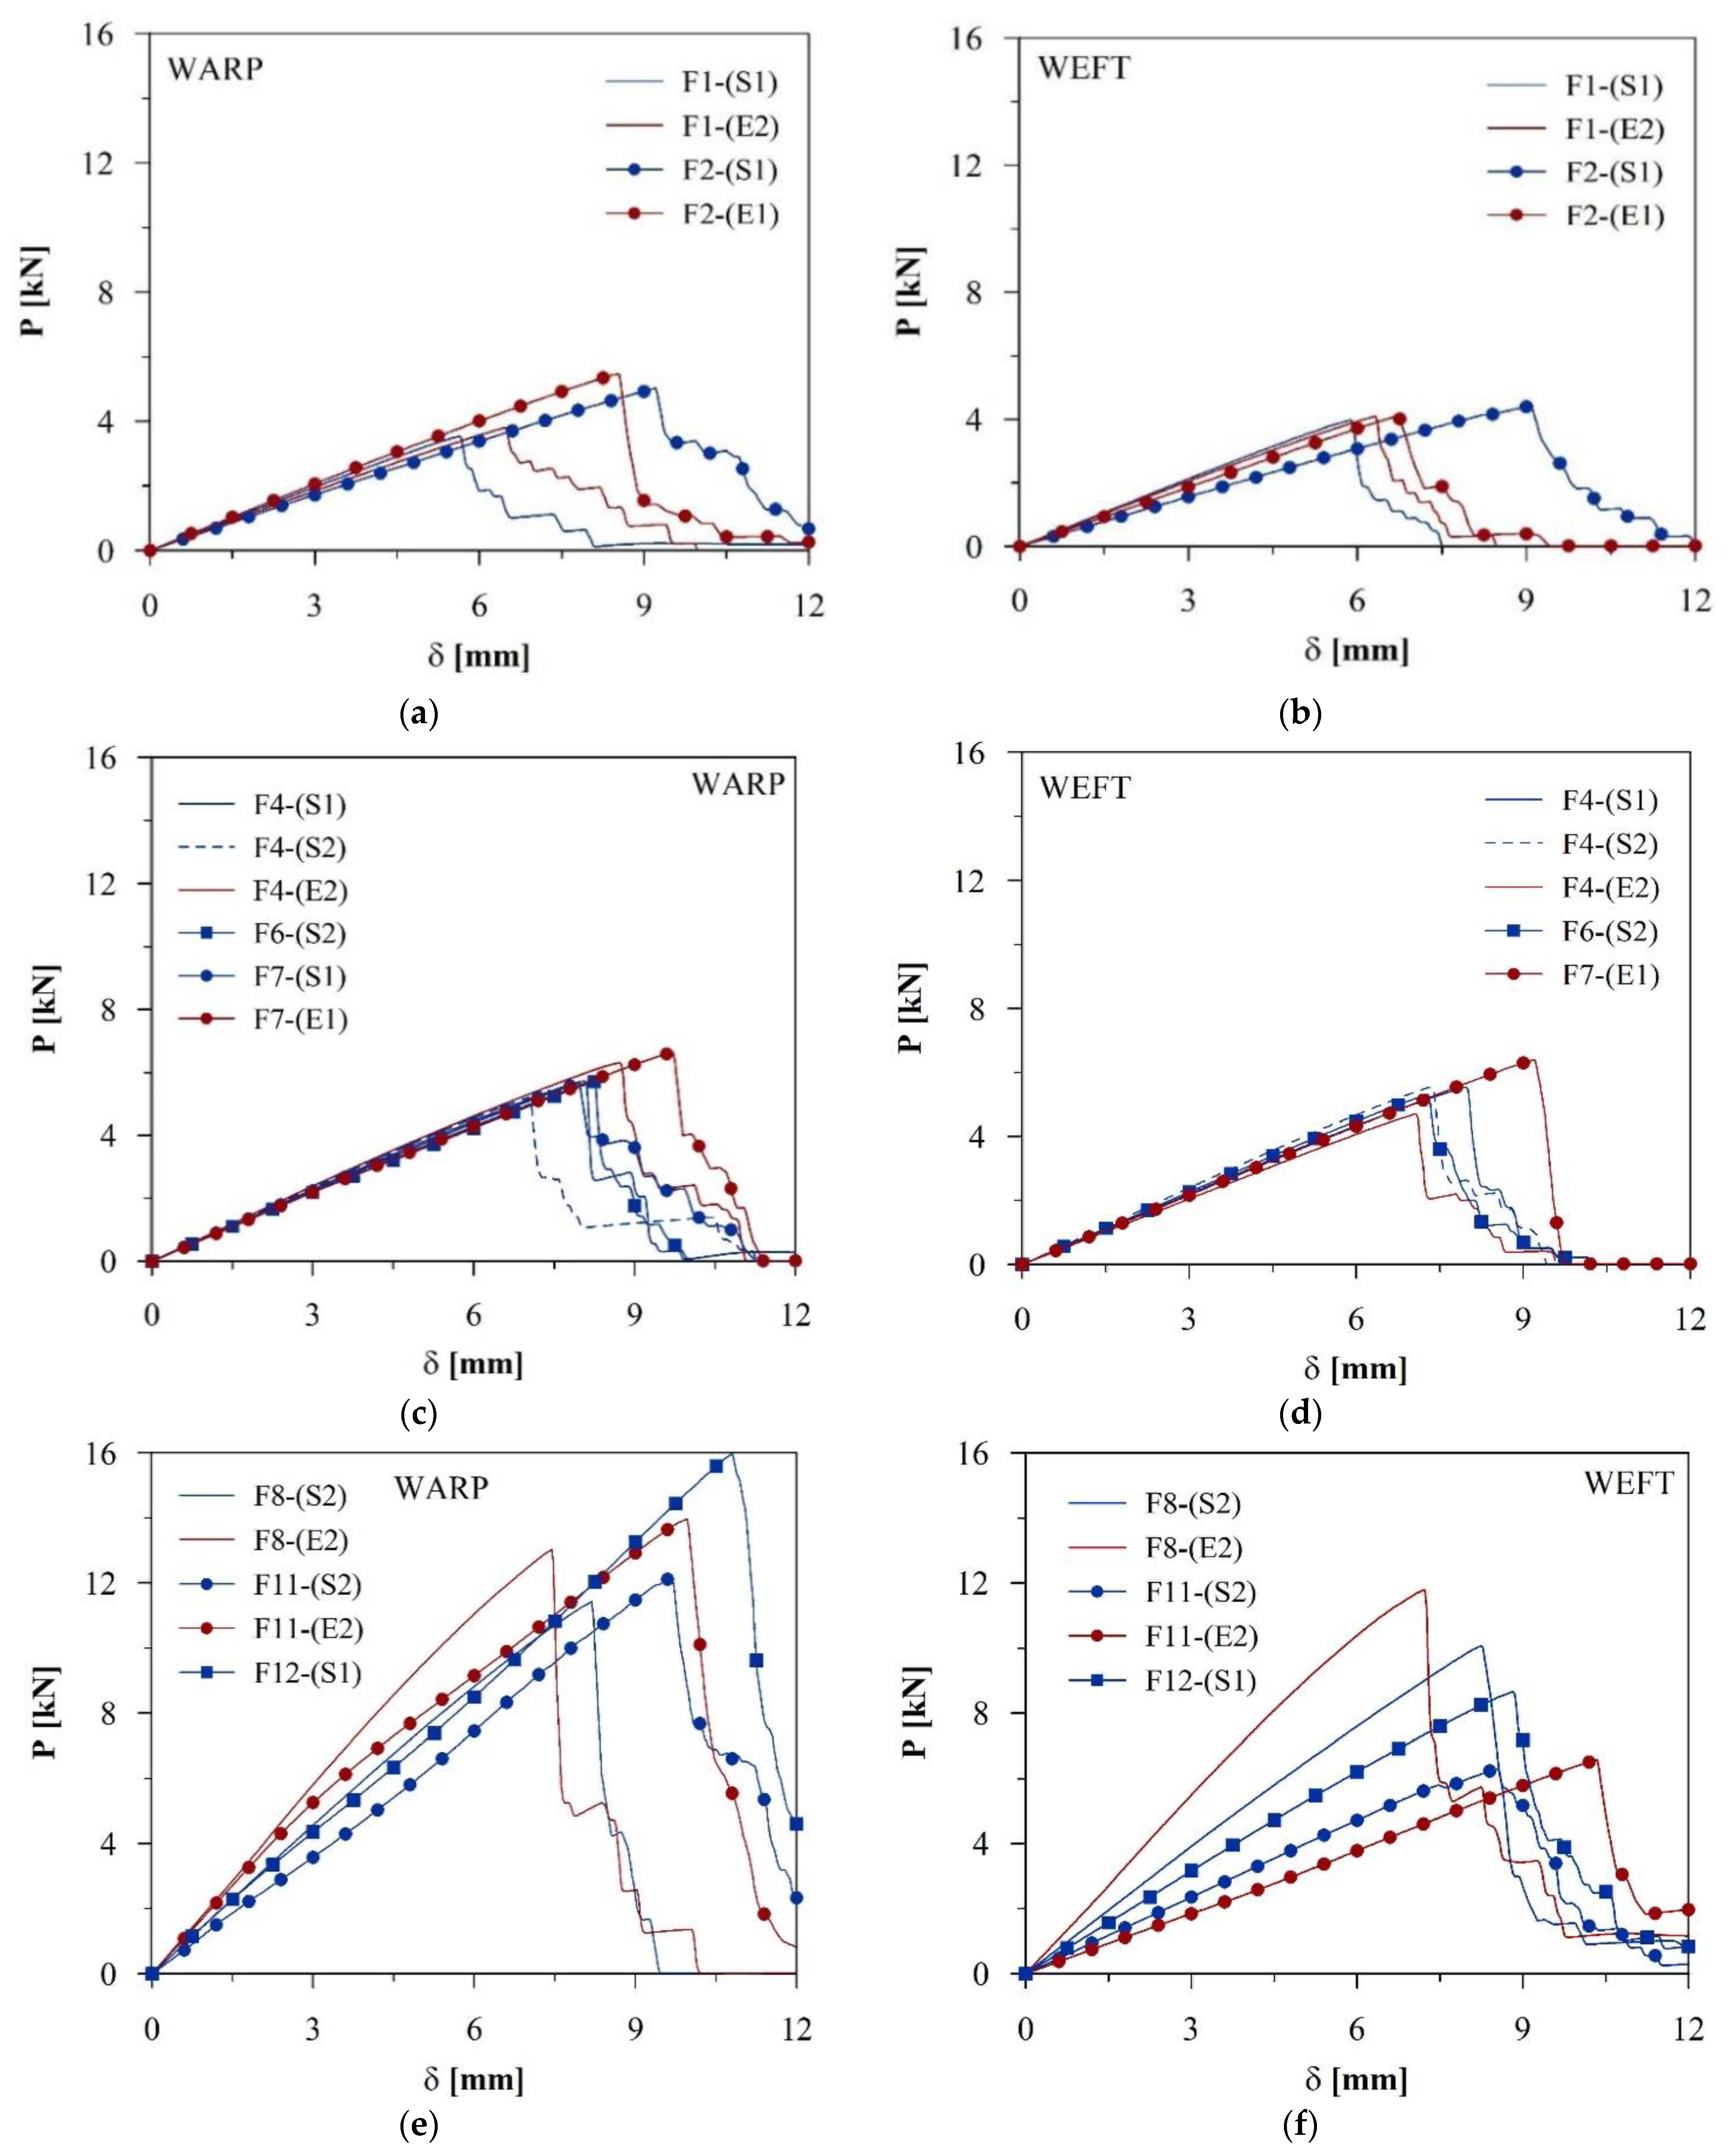
In Figure 3, some examples of the tensile response curves in terms of load vs. displacements are reported. It is possible to appreciate the similar slope of the different curves when geometrically identical fabrics (i.e., F4-F6-F7 in Figure 3c,d) are considered and the general increase of the maximum capacity with increasing grammage content.
Table 3.
Tensile test results in the warp direction and normalized cost per kN of the AR-glass textiles.
Table 3.
Tensile test results in the warp direction and normalized cost per kN of the AR-glass textiles.
| Fabric | Nr. Sample | Pmax over 70 mm | Af over 70 mm | Pmax over 1 m | EFf | Normalized Cost CN per kN | ||
|---|---|---|---|---|---|---|---|---|
| (Raw Fabric) | (Coated Fabric) | |||||||
| ID. | [-] | [kN] | [mm2] | [kN] | [-] | [1/kN] | [1/kN] | |
| F1-(S1) | 5 | avg. | 3.57 | 2.687 | 47.62 | 0.66 | 0.010 | 0.013 |
| (std) | (0.21) | |||||||
| F1-(E2) | 5 | avg. | 3.90 | 2.687 | 52.02 | 0.73 | 0.010 | 0.022 |
| (std) | (0.33) | |||||||
| F2-(S1) | 5 | avg. | 5.17 | 2.866 | 68.93 | 0.90 | 0.008 | 0.010 |
| (std) | (0.52) | |||||||
| F2-(E1) | 4 * | avg. | 5.47 | 2.866 | 72.98 | 0.95 | 0.007 | 0.016 |
| (std) | (0.11) | |||||||
| F3-(S1) | 5 | avg. | 5.19 | 3.582 | 67.44 | 0.72 | 0.010 | 0.016 |
| (std) | (0.23) | |||||||
| F4-(S1) | 5 | avg. | 5.77 | 3.582 | 74.99 | 0.81 | 0.009 | 0.015 |
| (std) | (0.28) | |||||||
| F4-(S2) | 4 * | avg. | 5.25 | 3.582 | 68.25 | 0.73 | 0.010 | 0.016 |
| (std) | (0.99) | |||||||
| F4-(E2) | 5 | avg. | 6.41 | 3.582 | 83.34 | 0.89 | 0.008 | 0.014 |
| (std) | (0.29) | |||||||
| F5-(S1) | 5 | avg. | 5.06 | 3.518 | 70.89 | 0.72 | 0.010 | 0.016 |
| (std) | (0.17) | |||||||
| F6-(S2) | 5 | avg. | 5.72 | 3.518 | 80.13 | 0.81 | 0.009 | 0.014 |
| (std) | (0.27) | |||||||
| F7-(S1) | 5 | avg. | 5.67 | 3.582 | 85.04 | 0.79 | 0.009 | 0.014 |
| (std) | (0.68) | |||||||
| F7-(E1) | 3 | avg. | 6.65 | 3.582 | 99.68 | 0.93 | 0.008 | 0.014 |
| (std) | (0.13) | |||||||
| F8-(S2) | 4 * | avg. | 11.44 | 7.164 | 148.72 | 0.80 | 0.009 | 0.011 |
| (std) | (0.63) | |||||||
| F8-(E2) | 4 * | avg. | 12.50 | 7.164 | 162.46 | 0.87 | 0.008 | 0.015 |
| (std) | (0.67) | |||||||
| F8-(E1) | 3 | avg. | 13.16 | 7.164 | 171.04 | 0.92 | 0.008 | 0.015 |
| (std) | (0.25) | |||||||
| F9-(S1) | 5 | avg. | 10.54 | 7.164 | 137.08 | 0.74 | 0.010 | 0.012 |
| (std) | (0.76) | |||||||
| F10-(E1) | 2 * | avg. | 12.83 | 7.164 | 192.47 | 0.90 | 0.008 | 0.012 |
| (std) | - | |||||||
| F11-(S2) | 4 * | avg. | 12.20 | 12.537 | 174.29 | 0.49 | 0.014 | 0.018 |
| (std) | (0.20) | |||||||
| F11-(E1) | 5 | avg. | 13.99 | 12.537 | 199.80 | 0.56 | 0.012 | 0.022 |
| (std) | (0.36) | |||||||
| F12-(S1) | 5 | avg. | 15.98 | 12.537 | 228.25 | 0.64 | 0.010 | 0.012 |
| (std) | (0.15) | |||||||
* one sample removed from the comparison.
Table 4.
Tensile test results in the weft direction of the AR-glass textiles.
| Fabric | Nr. Sample | Pmax over 70 mm | Af over 70 mm | Pmax over 1 m | EFf | |
|---|---|---|---|---|---|---|
| ID. | [-] | [kN] | [mm2] | [kN] | [-] | |
| F1-(S1) | 5 | avg. | 4.01 | 2.687 | 53.47 | 0.75 |
| (std) | (0.22) | |||||
| F1-(E2) | 4 * | avg. | 4.15 | 2.687 | 55.32 | 0.77 |
| (std) | (0.13) | |||||
| F2-(S1) | 5 | avg. | 4.43 | 2.687 | 59.08 | 0.82 |
| (std) | (0.33) | |||||
| F2-(E1) | 4 * | avg. | 4.12 | 2.687 | 54.94 | 0.77 |
| (std) | (0.43) | |||||
| F3-(S1) | 5 | avg. | 5.37 | 3.582 | 69.81 | 0.75 |
| (std) | (0.21) | |||||
| F4-(S1) | 5 | avg. | 5.58 | 3.582 | 72.60 | 0.78 |
| (std) | (0.30) | |||||
| F4-(S2) | 5 | avg. | 5.58 | 3.582 | 72.51 | 0.78 |
| (std) | (0.11) | |||||
| F4-(E2) | 5 | avg. | 4.81 | 3.582 | 62.54 | 0.67 |
| (std) | (0.33) | |||||
| F5-(S1) | 5 | avg. | 4.97 | 3.518 | 69.64 | 0.71 |
| (std) | (0.32) | |||||
| F6-(S2) | 5 | avg. | 5.36 | 3.582 | 74.98 | 0.75 |
| (std) | (0.27) | |||||
| F7-(S1) | not tested | |||||
| F7-(E1) | 3 | avg. | 6.41 | 3.582 | 96.13 | 0.89 |
| (std) | (0.06) | |||||
| F8-(S2) | 4 | avg. | 11.44 | 7.164 | 131.17 | 0.70 |
| (std) | (0.63) | |||||
| F8-(E2) | 4 * | avg. | 12.41 | 7.164 | 161.33 | 0.87 |
| (std) | (0.74) | |||||
| F8-(E1) | not tested | |||||
| F9-(S1) | 5 | avg. | 10.54 | 7.164 | 126.52 | 0.74 |
| (std) | (0.76) | |||||
| F10-(E1) | not tested | |||||
| F11-(S2) | 5 | avg. | 6.34 | 4.478 | 88.76 | 0.71 |
| (std) | (0.41) | |||||
| F11-(E1) | 4 * | avg. | 6.66 | 4.478 | 93.27 | 0.74 |
| (std) | (0.53) | |||||
| F12-(S1) | 5 | avg. | 8.69 | 5.373 | 115.93 | 0.81 |
| (std) | (0.71) | |||||
* one sample removed from the comparison.
4. Discussion of the Results: Performance and Cost Considerations
In this section, the effect of the main fabric characteristics on the mechanical performance of the different textiles is discussed, starting from the experimental results reported in Figure 3 and in Table 3 and Table 4. Moreover, both the performance efficiency and the manufacturing costs of the various textiles are accounted for in the comparison.
4.1. Considerations on the Fabric Efficiency
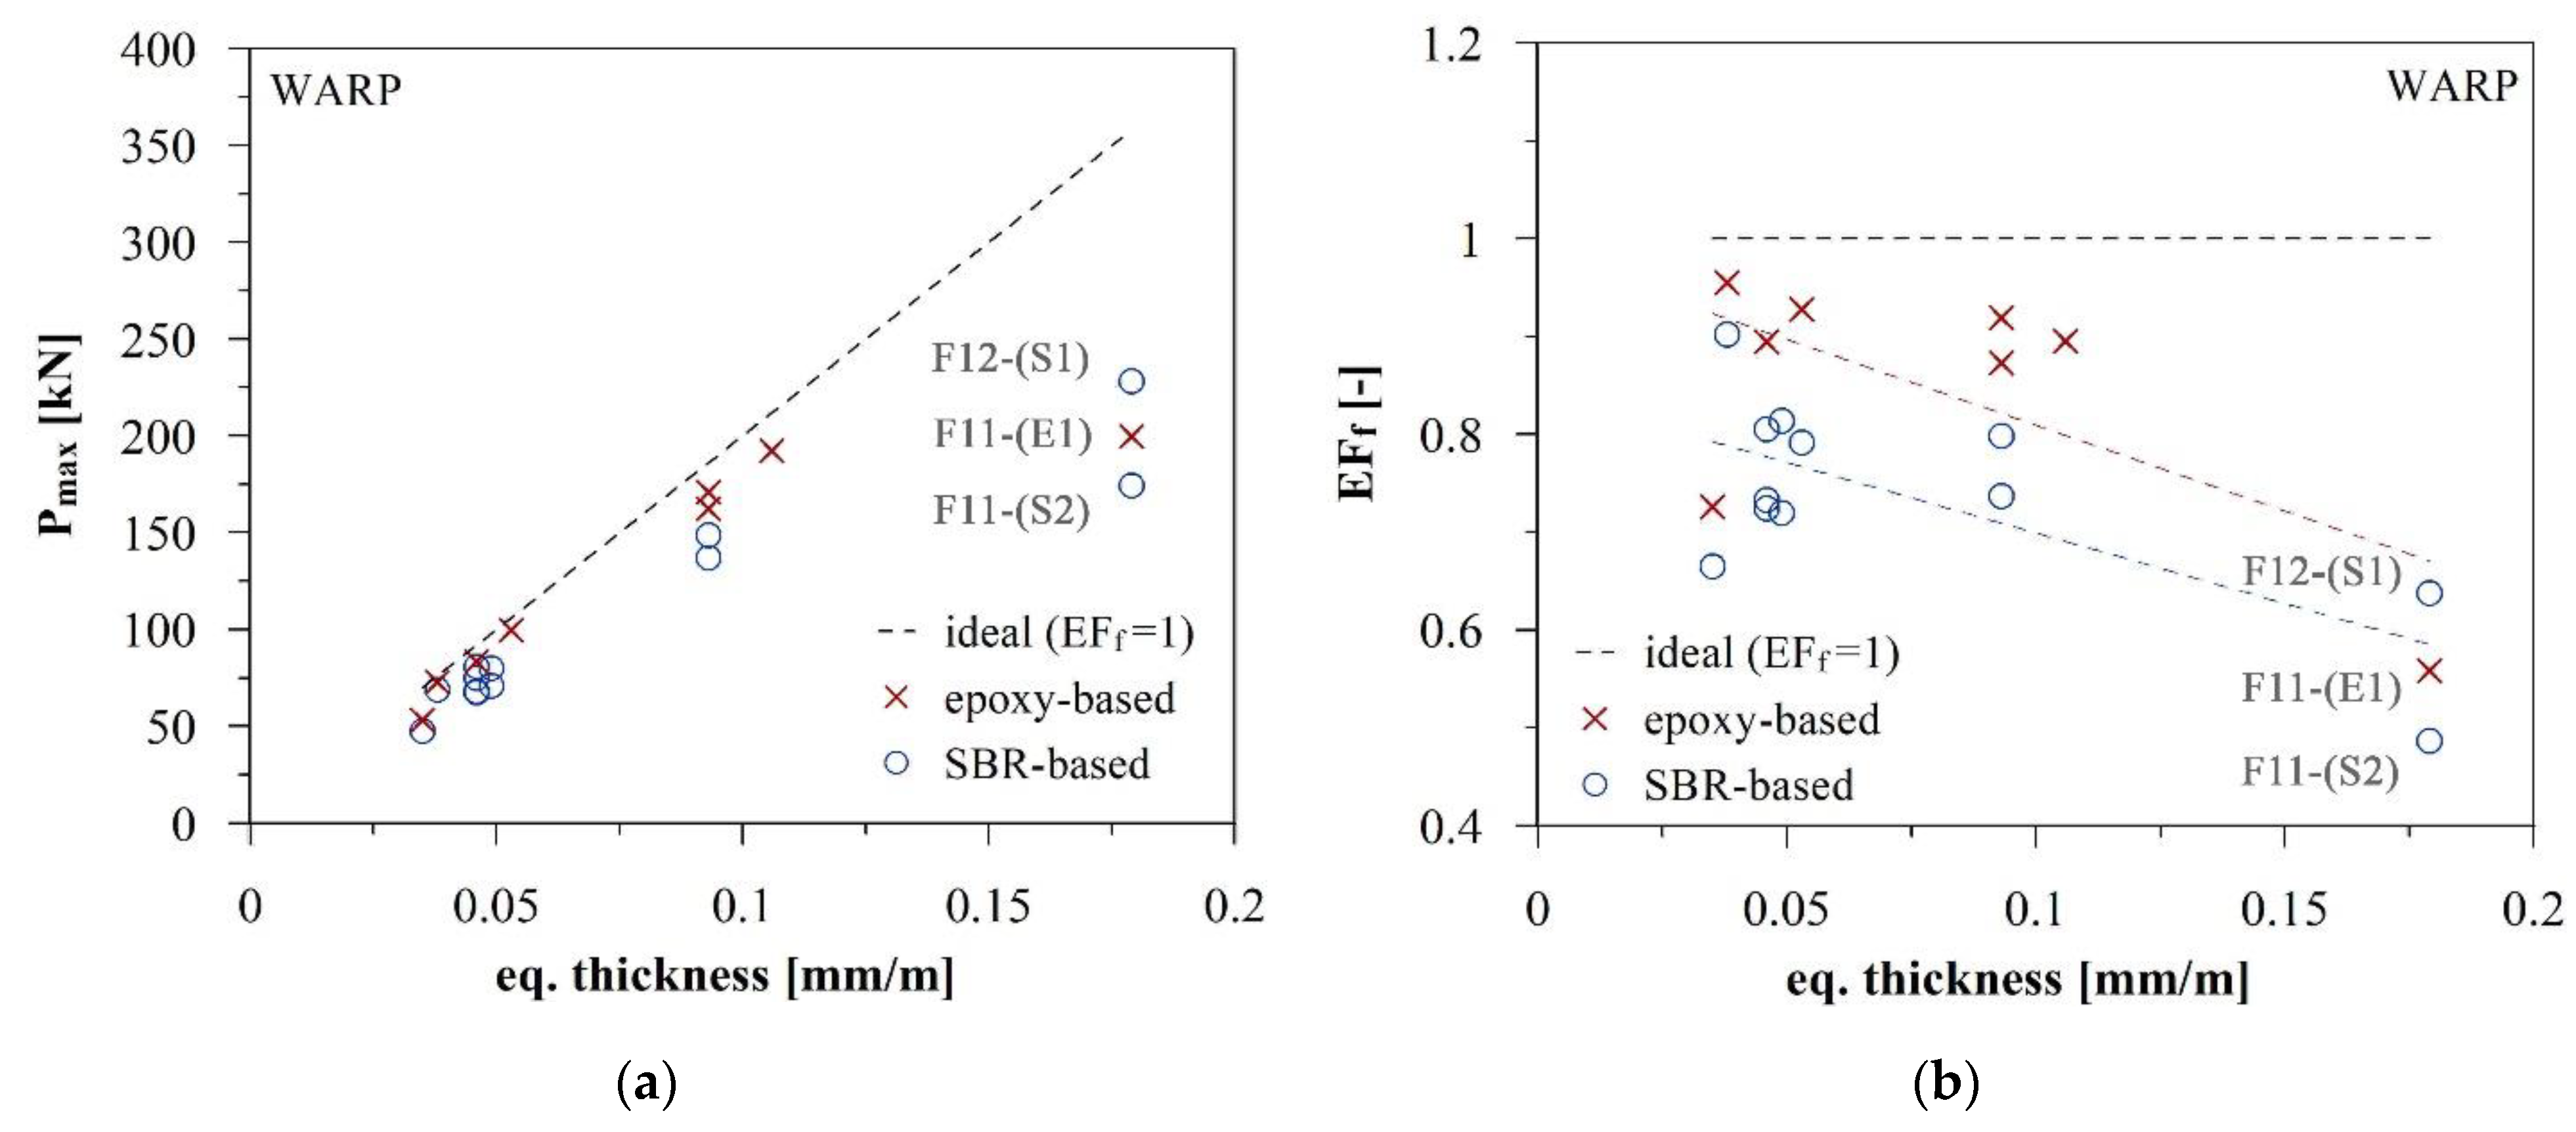
As visible from Figure 4a and Figure 5a, the increase of AR-glass quantity (reported in terms of the equivalent thickness on a 1 m width strip) generally corresponds to higher average maximum capacities. This observed trend can be considered linear up to medium grammage textiles (equivalent thickness up to about 0.1 mm/m), while, for high grammage textiles (i.e., F11 and F12 fabrics in the warp direction) the load increment is limited. It is also interesting to observe the crucial effect of the coating nature and process on the fabric efficiency; in fact, as clearly visible in Figure 4b for the warp direction, the epoxy-based coating entails a higher rate of utilization of the AR-glass strength with respect to SBR-coated fabrics. This is probably related to the already mentioned better impregnation of the filaments offered by the epoxy resin (better penetration due to lower resin viscosity and glass fibers opening in case of solvent treatment), which limits the telescopic failure [19], increasing the overall capacity.
In the weft direction, as shown in Figure 4b and Figure 5b, due to the flat shape of the weft yarn, which generally favors the resin penetration, the effect of the different coating nature appears negligible.
The limited load increase in case of high grammage textiles is probably related to both the crimp effect on the warp strand and the to the higher filament diameters. Moreover, in those cases, the yarn impregnation results are more complicated, limiting the beneficial effect of the use of an epoxy coating.
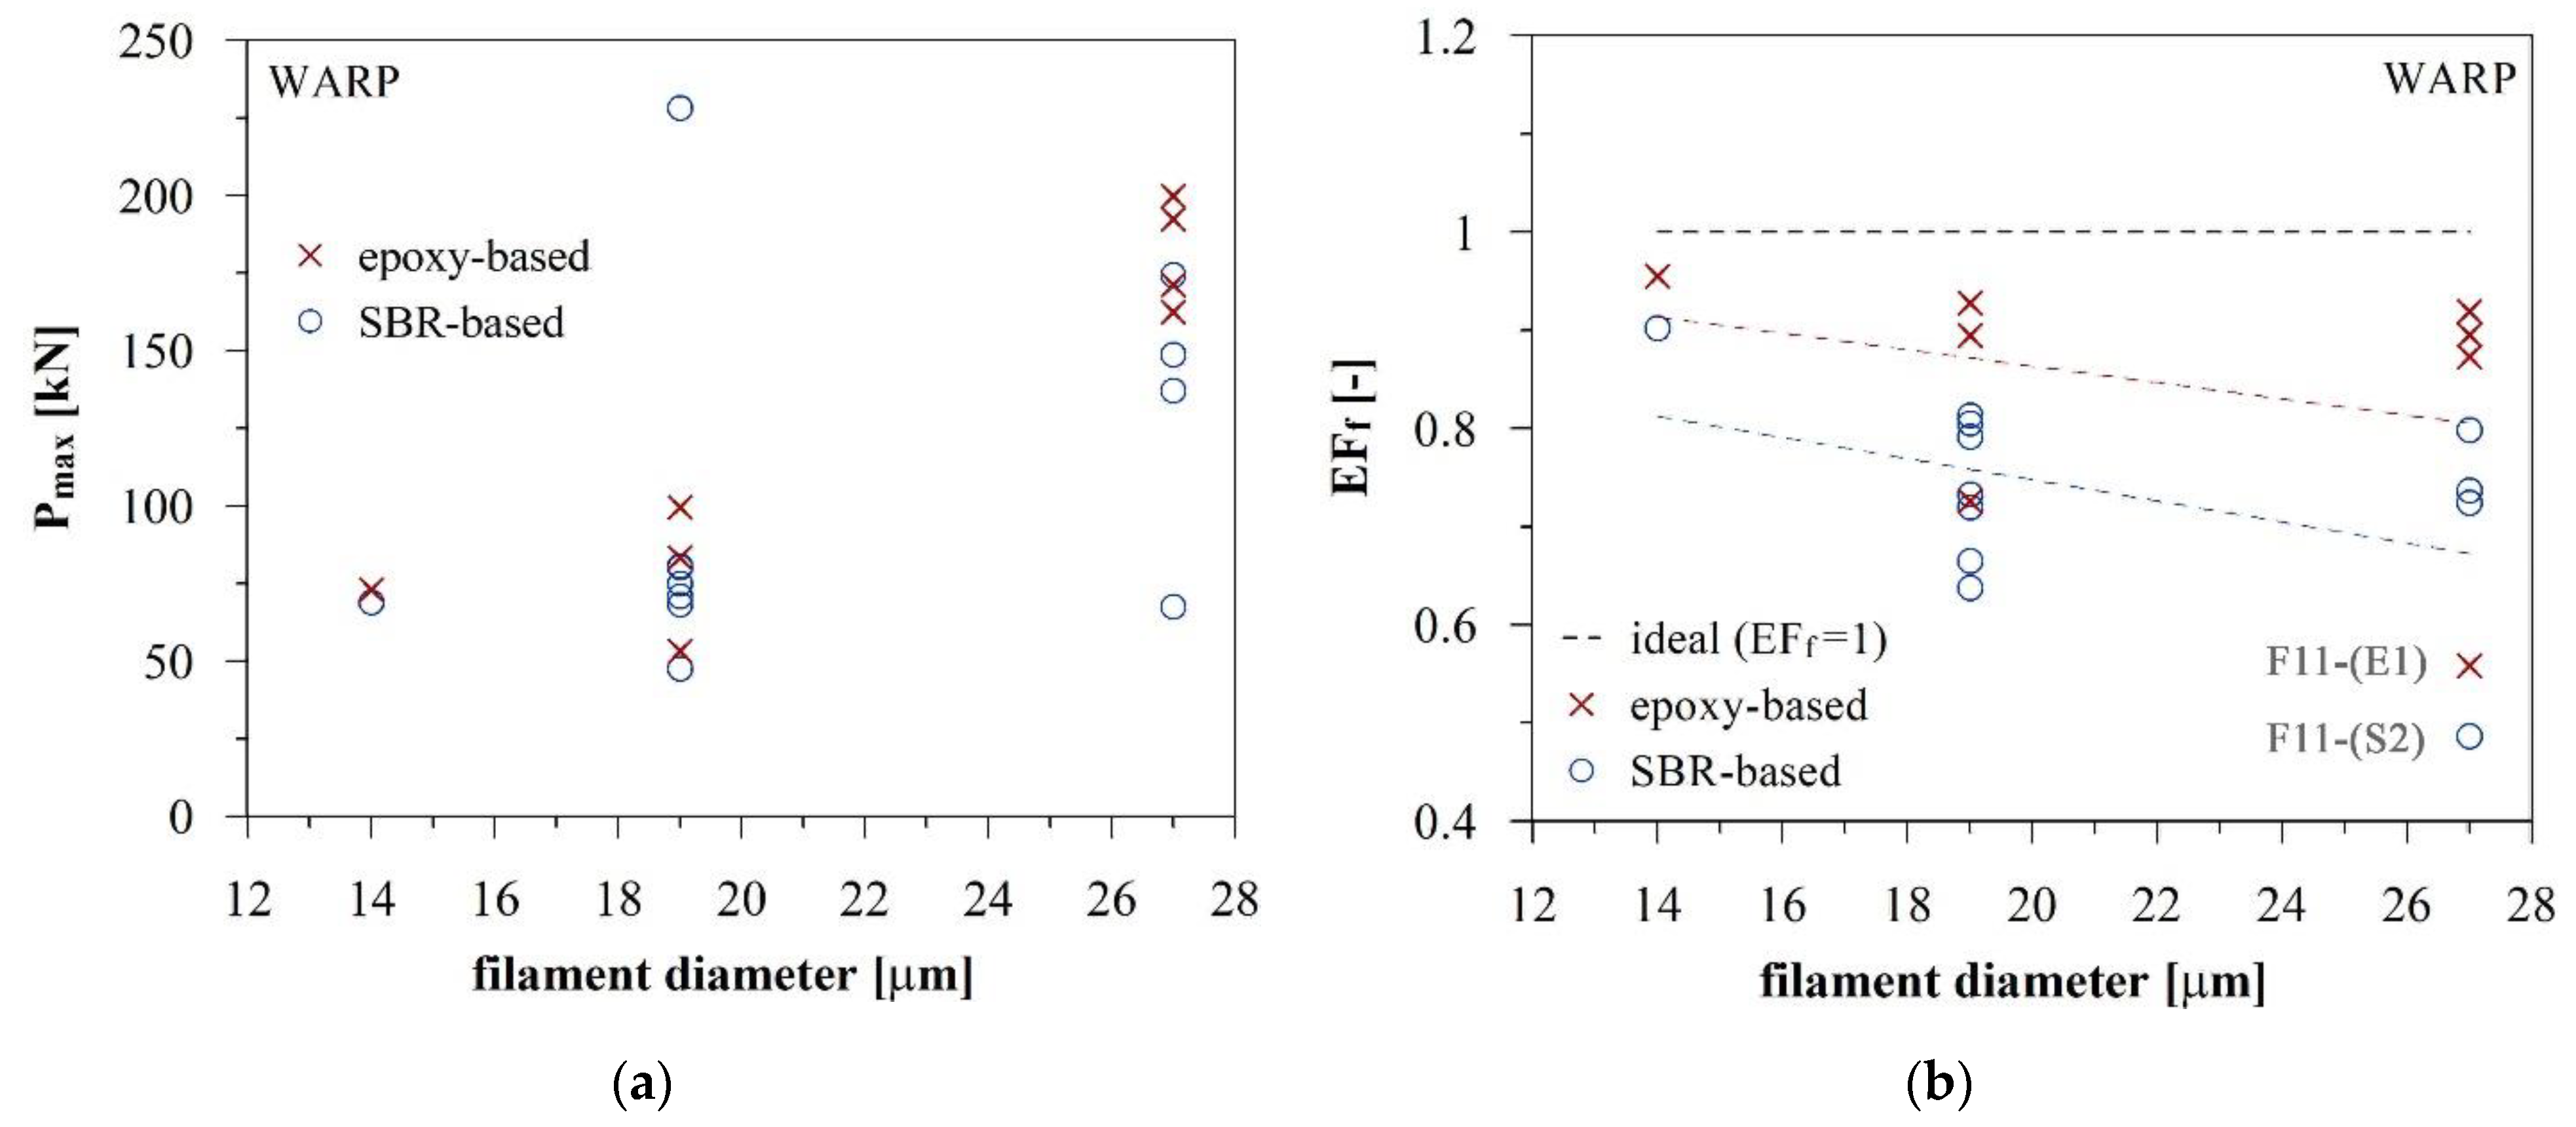
From the results reported in Figure 6, it is possible to observe the effect of the filament diameter on the fabric efficiency. Higher diameters imply lower flexibility of the AR-glass yarns and, consequently, the development of damage to the yarns at different stages of the weaving process due to abrasion and breakage when sliding against the loom machinery [20,21]. Moreover, increasing filament diameter causes a higher amount of surface defects, reducing the wire tensile strength [22]. In case of the F11 textiles, the limited fabric efficiency is related to both the filament diameters and the above-mentioned high grammage.
Figure 4.
Average maximum load (a) and fabric efficiency (b) vs. equivalent thickness of the investigated textiles in the warp direction.
Figure 4.
Average maximum load (a) and fabric efficiency (b) vs. equivalent thickness of the investigated textiles in the warp direction.

Figure 5.
Average maximum load (a) and fabric efficiency (b) vs. equivalent thickness of the investigated textiles in the weft direction.
Figure 5.
Average maximum load (a) and fabric efficiency (b) vs. equivalent thickness of the investigated textiles in the weft direction.

Figure 6.
Average maximum load (a) and fabric efficiency (b) vs. filament diameters of the investigated textiles in the warp direction.
Figure 6.
Average maximum load (a) and fabric efficiency (b) vs. filament diameters of the investigated textiles in the warp direction.

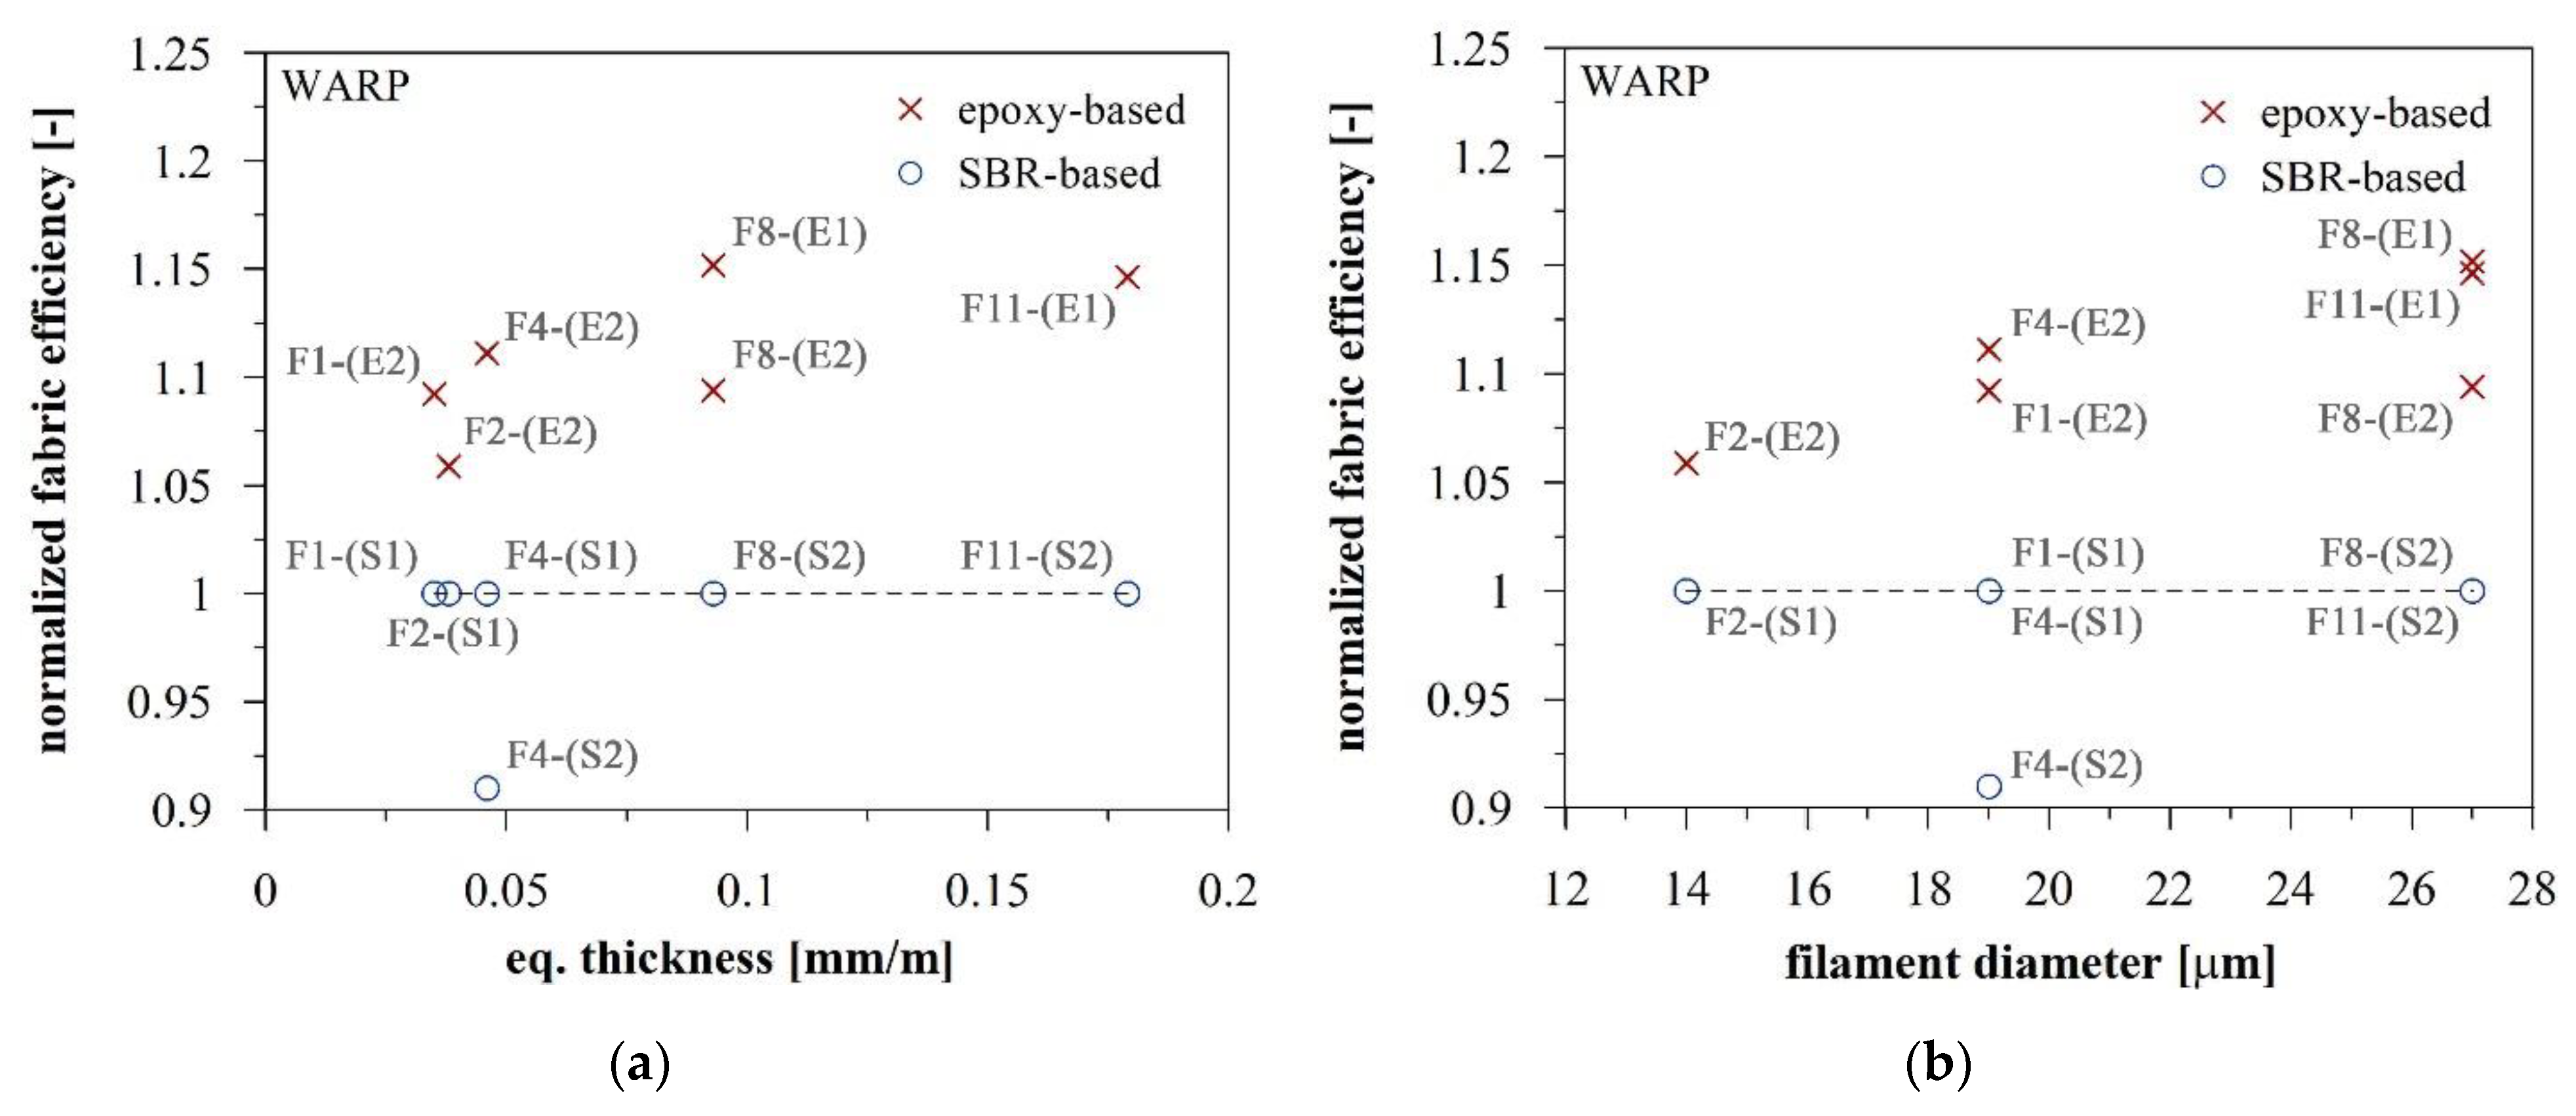
As previously observed, the coating process based on epoxy resin improves the mechanical performance with respect to the SBR case in the presence of higher filament diameters. In particular, considering geometrically identical meshes and comparing the fabric efficiency achieved with different coatings (normalized fabric efficiency in Figure 7 is the ratio between the fabric efficiency of each textile and the one of the mesh impregnated with SBR 1 coating), it is possible to appreciate that the effect of the better impregnation offered by the epoxy resin is more influenced by the increasing of the filament diameters than by the equivalent thickness. The beneficial effect of the epoxy coating is more significant in the cases with higher filament diameters, which suffer the most from the poor impregnation offered by the SBR coatings.
Please note that, in case of fabric F4-(S2) impregnated with the stiffer solution of the SBR coating (SBR 2), the lower tensile capacity is related to an overestimation of the maximum load due to the significant dispersion of the test results (a standard deviation of 0.99 kN and an average maximum load of 5.25 kN were recorded). The effect of the stiffer SBR coating, with respect to the base version, becomes visible in the cementitious composite application, as discussed in the following section.
Figure 7.
Normalized fabric efficiency vs. equivalent diameter (a) and filament diameters (b) in the warp direction.
Figure 7.
Normalized fabric efficiency vs. equivalent diameter (a) and filament diameters (b) in the warp direction.

4.2. Cost–Performance Considerations
The previous observations on the main features influencing the fabric efficiency of the textile can be a starting point to orient practitioners and manufacturers, respectively, to the design and to the production of more efficient textiles. In parallel to the efficiency considerations, the manufacturing cost of the AR-glass textiles must be taken into account in order not to waste raw glass and to make the process of production more sustainable from an economic standpoint. Due to this reason, the ratio between the normalized cost, CN, which comprises both the raw material and impregnation costs, and the maximum tensile capacity experimentally obtained, Pmax, were computed for each investigated textile. From the comparison of these parameters, which substantially represent the required cost to improve of 1 kN the fabric capacity, it is possible to highlight the balance between cost and mechanical performance, targeting optimized solutions. The following observations refer only to the warp direction, which, as mentioned, is the most influenced by the textile characteristics.
Although the effect of the coating in the yarn impregnation—especially in case of epoxy resins—is evident, the correlation between the coating percentage and the increasing of the mechanical capacity needs more investigation. In some cases, such as, for example, observed by visual inspection of the fabric F9-(S2), the increasing coating percentage does not correspond to a deep impregnation of the filaments and a significant amount of coating remains on the external surface of the fabrics. Moreover, in parallel to the coating percentage, other parameters influence the impregnation quality, such as, for example, the process velocity and the temperature and time of curing. Due to this reason, in addition to the normalized cost per unit load, CN/Pmax, for the coated textiles, the same parameters were evaluated neglecting the impregnation cost (both resin and dip-coating processes).
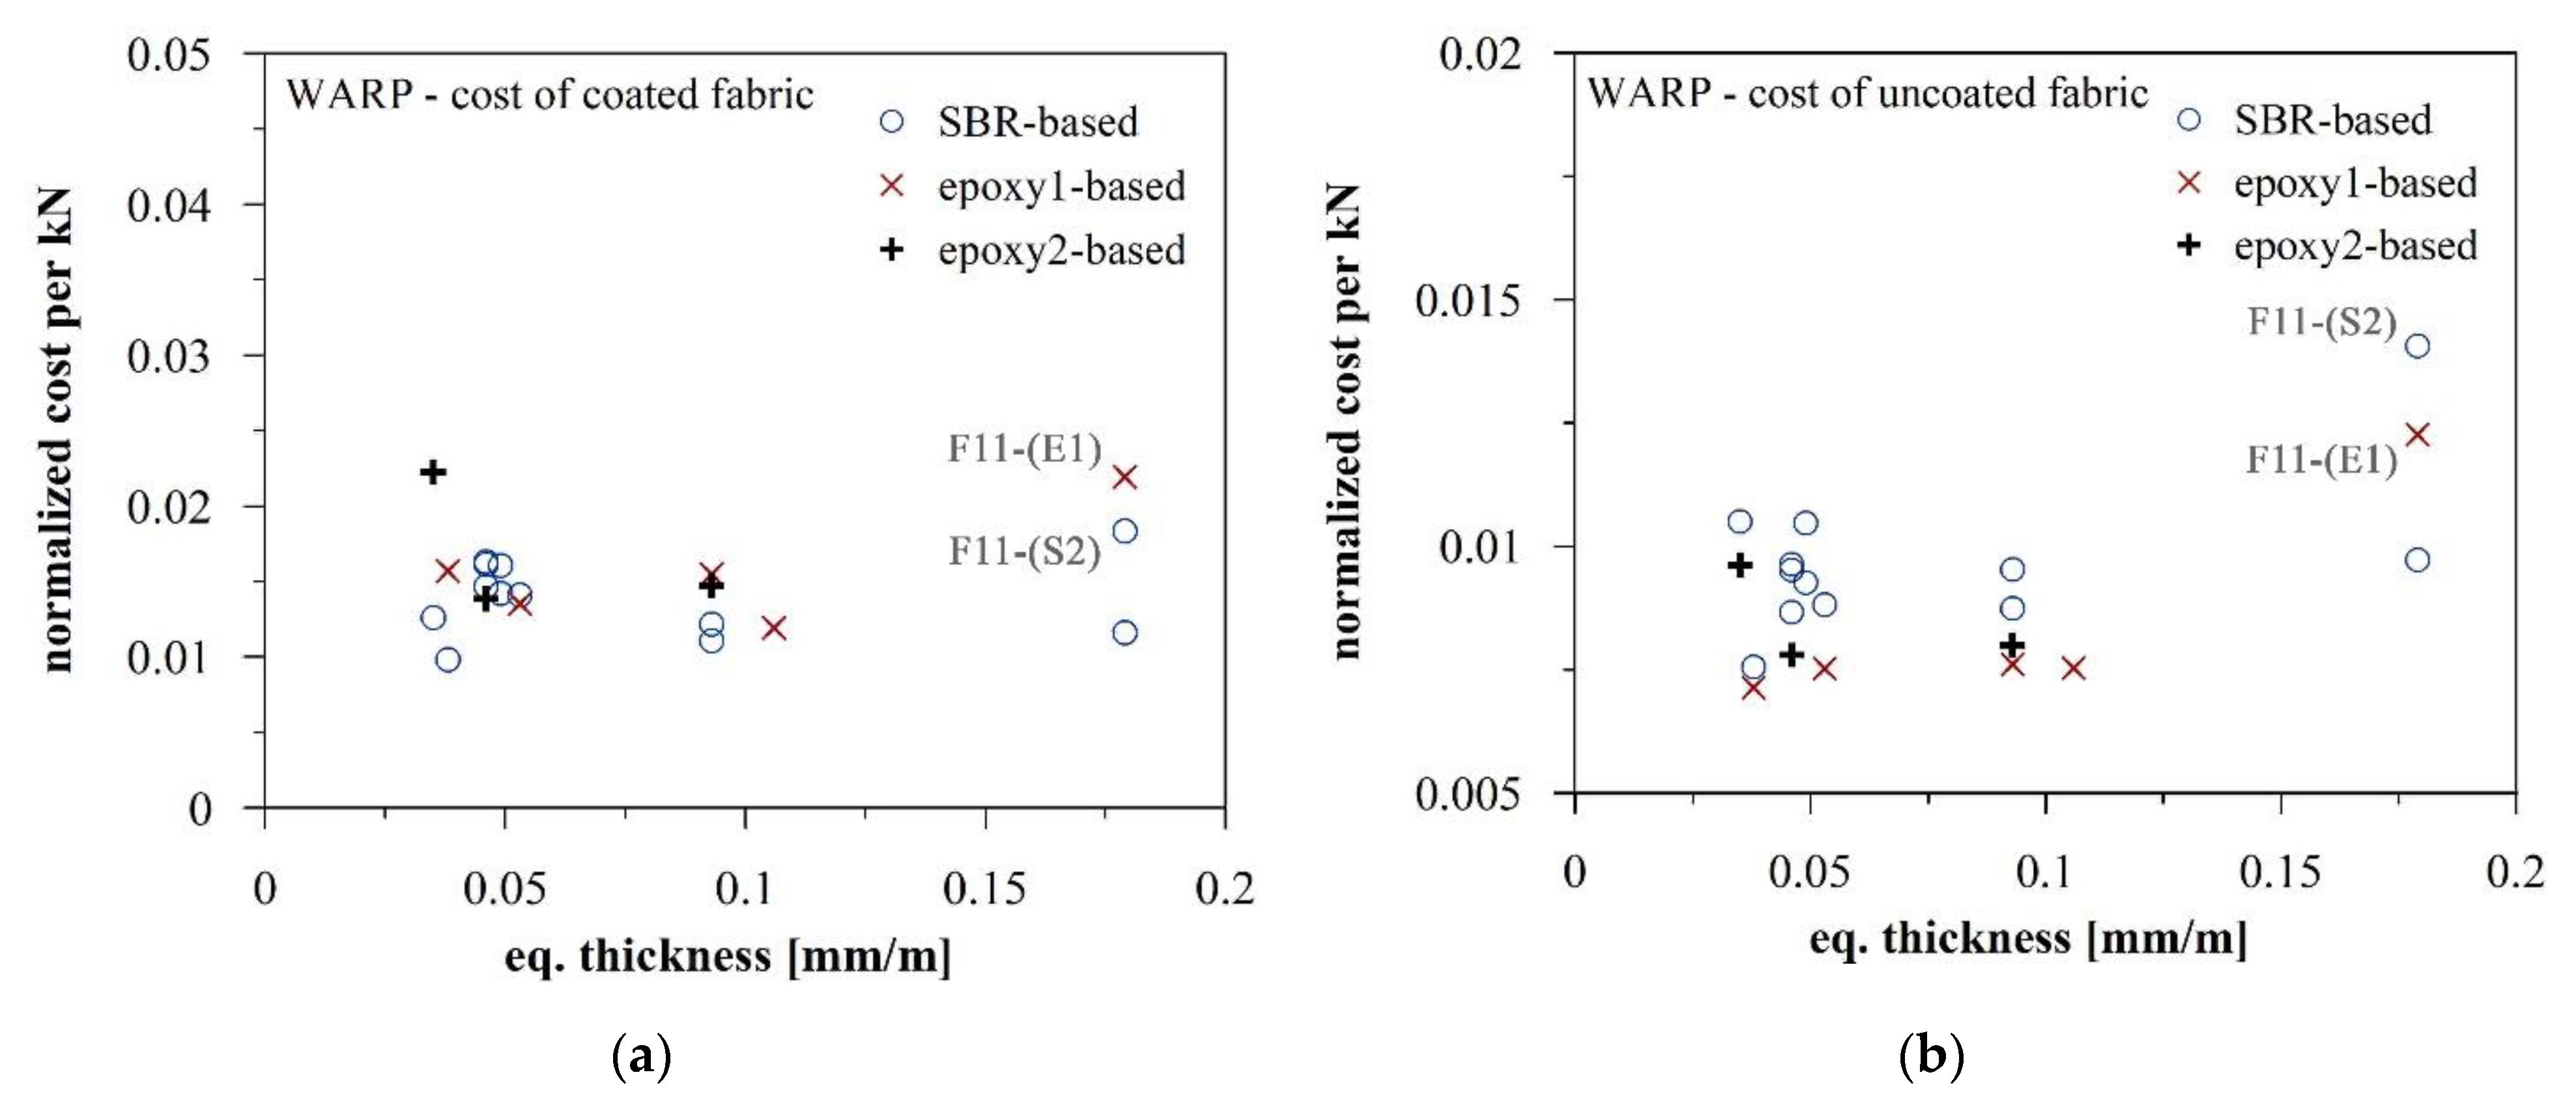
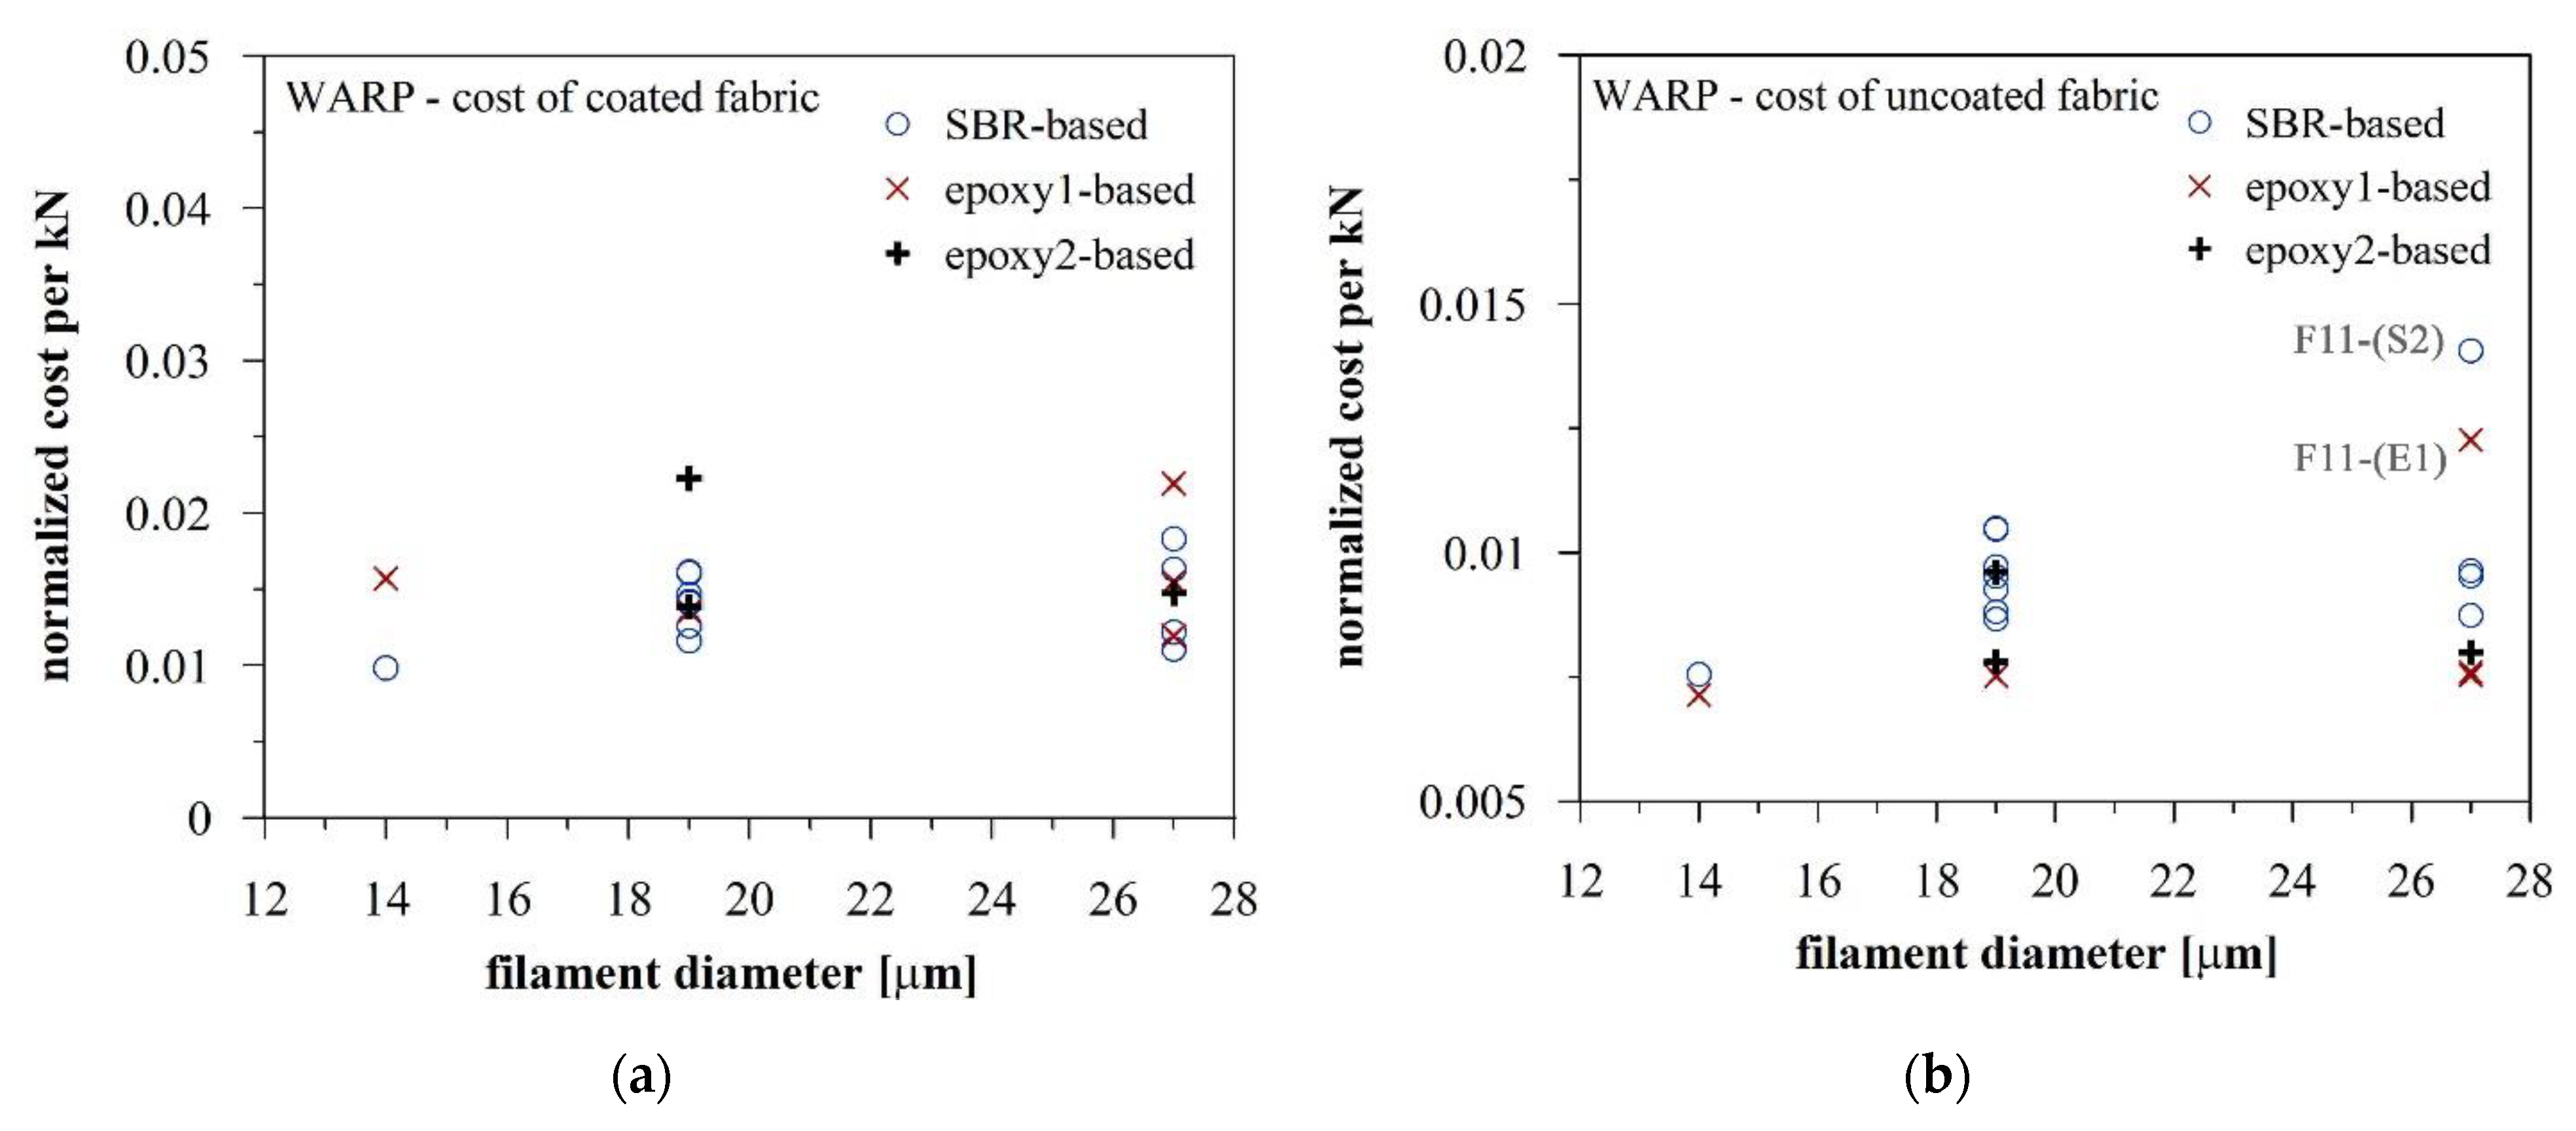
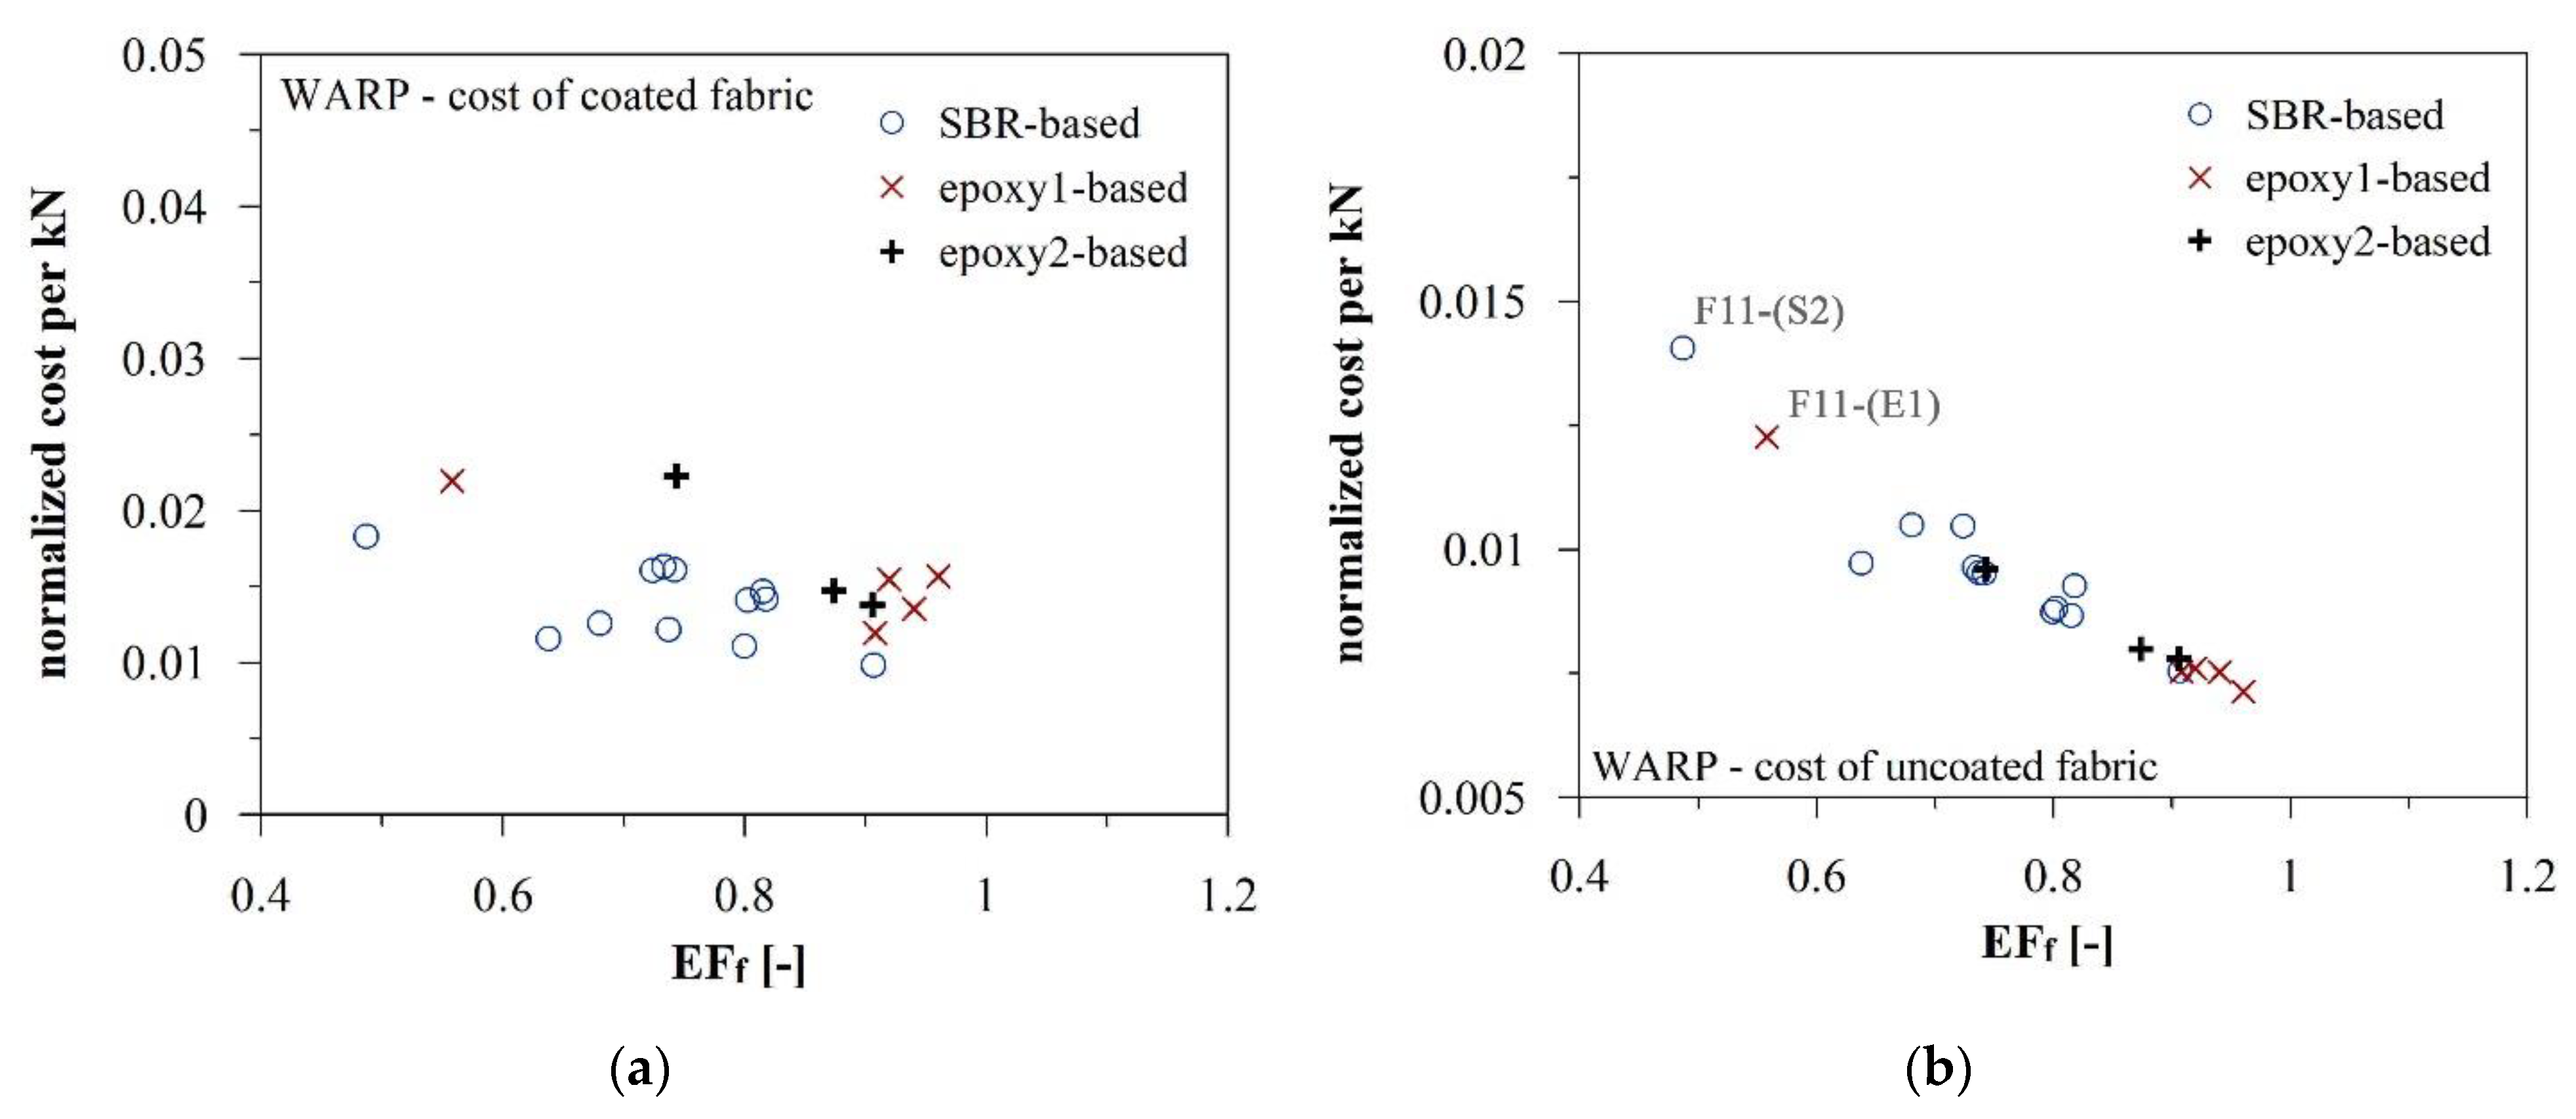
From the results reported in Figure 8a and Figure 9a, it is possible to observe that the variation of the defined cost/performance parameter on coated fabrics is not particularly influenced by either the equivalent thickness or the filament diameters. This means that increasing manufacturing costs correspond higher fabric capacities (see the CN/Pmax vs. EFf data in Figure 10a). On the contrary, considering only the cost of the uncoated fabrics, as shown in Figure 8b, Figure 9b and Figure 10b, the effect of the geometrical characteristics and of the coating nature are obviously more evident, confirming the observations related to the fabric efficiency trends highlighted in the previous section.
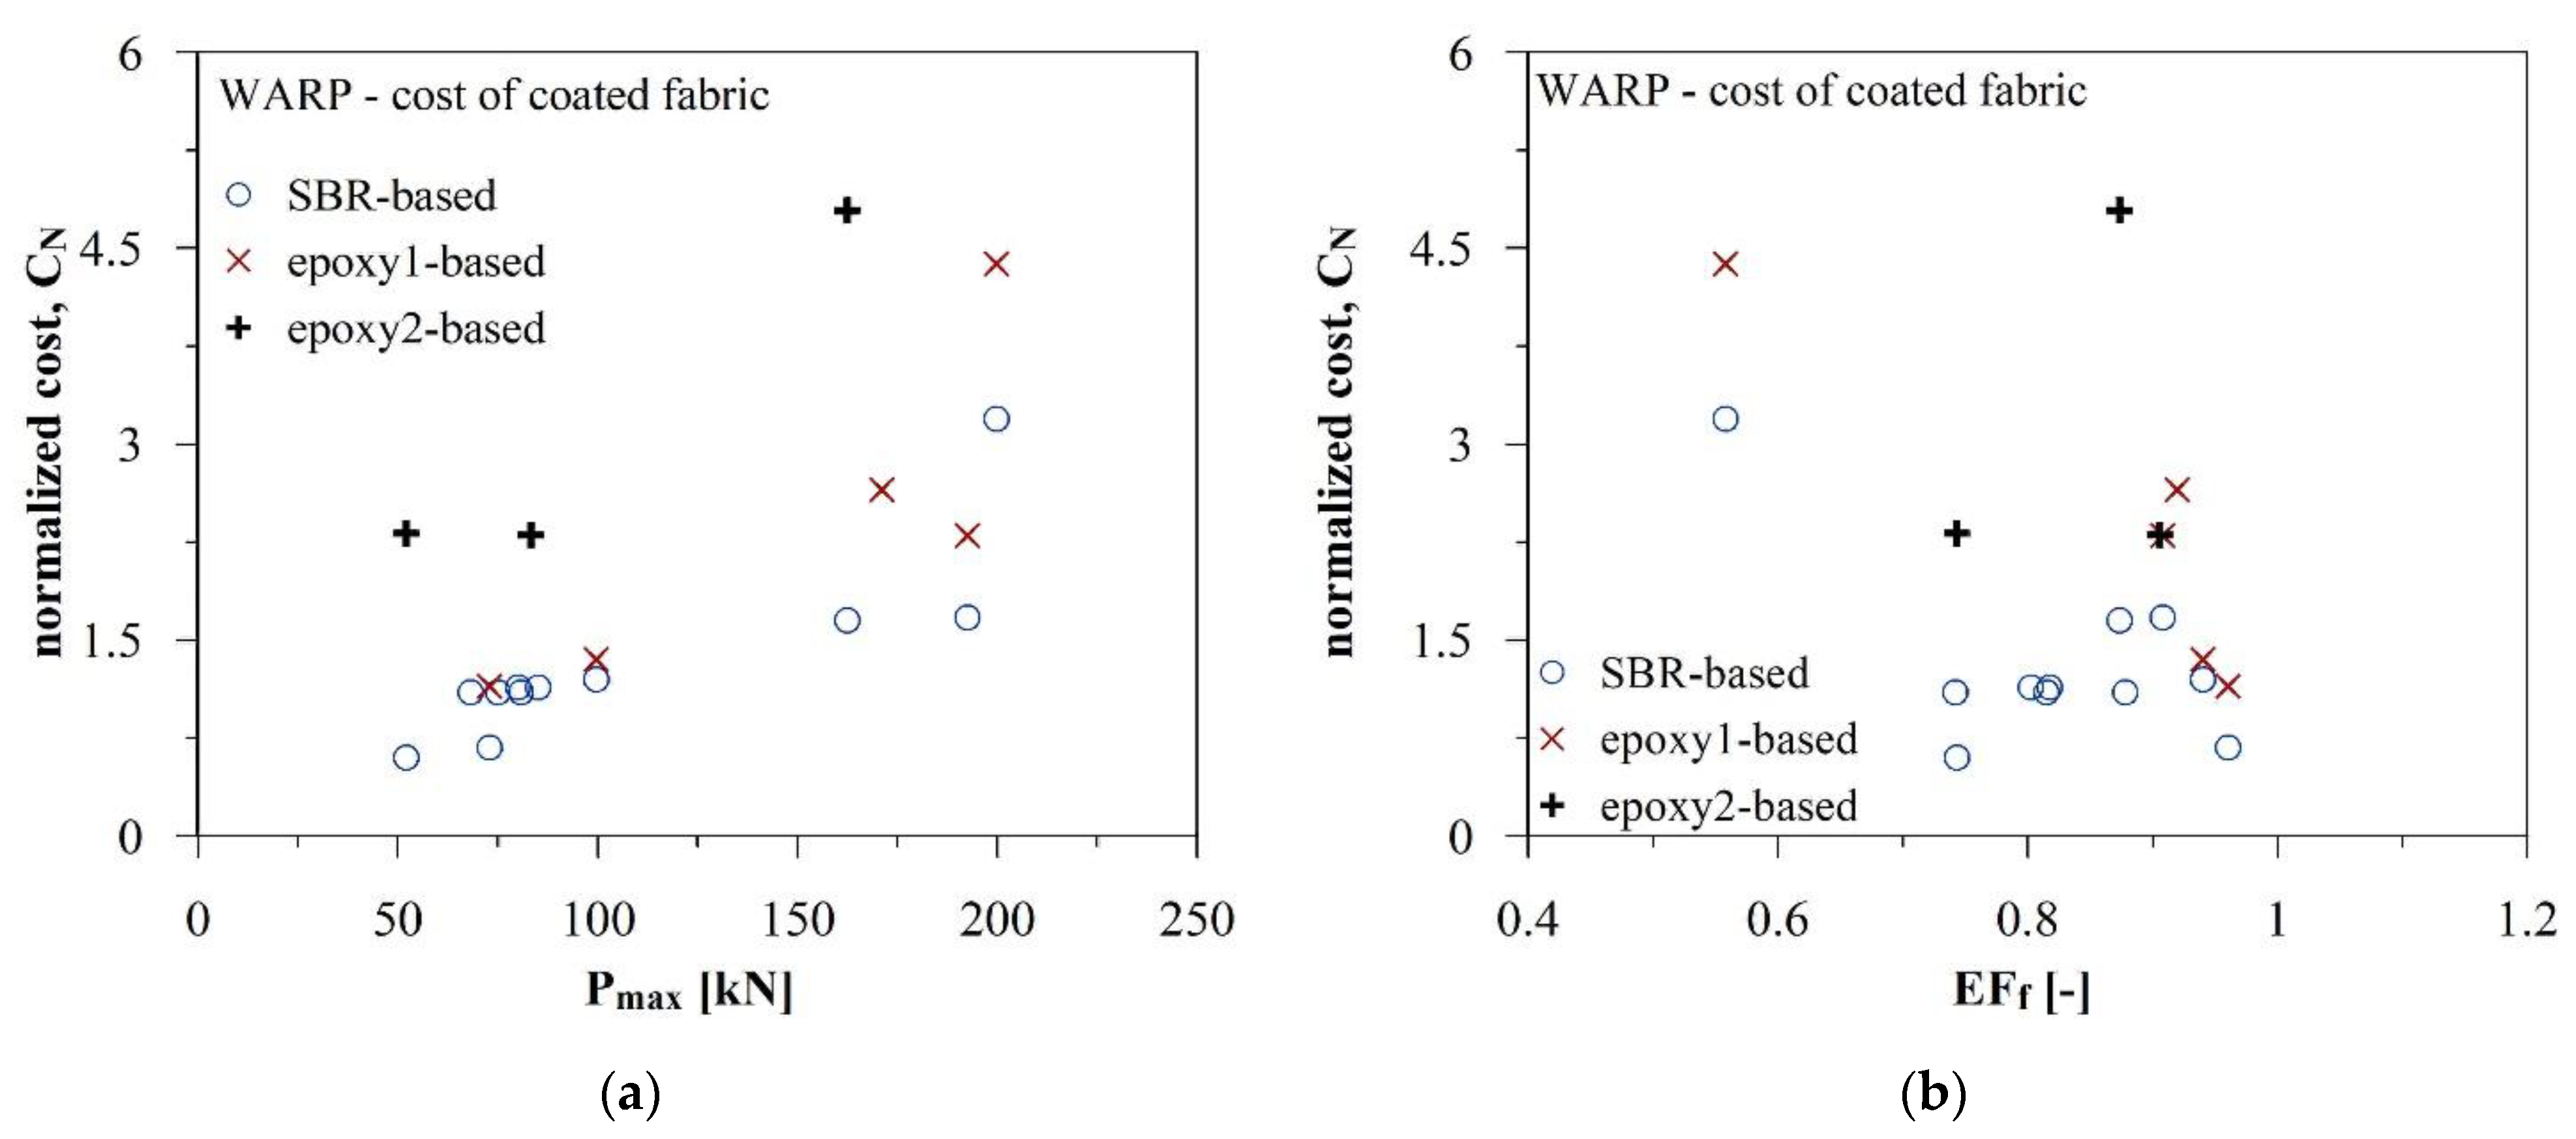
Note that, in real applications, the input data are the required tensile capacities of the textile. In Figure 11a, entering in the graph abscissa with the target load value, it is possible to identify the textile solution, which allows for a reduction in the manufacturing costs (both raw material and impregnation). In addition to this, observing the fabric efficiency reported in Figure 11b, it is worth noting that, once the input load is fixed, the cheapest textile may not correspond to the one with the highest rate of utilization of the AR-glass. This is an important aspect that may orient the decision-making process of the textiles, ensuring the best balance between cheapness, performance, and sustainability, minimizing the waste of raw material.
5. Cementitious-Based Composites: Preliminary Performance and Cost Considerations
From an economical point of view, the choice of the textile to be used in different applications cannot be related only to the cost to the previously computed fabric performance ratios (CN/Pmax). In fact, for any kind of application, the requests in terms of mesh geometry (grid spacing, thickness, or raw material grammage) are different and they might mutually affect the interaction of the fabric with the surrounding matrix. The latter plays the most important role in the overall composite behavior. For example, in the case of cementitious-based composites (textile-reinforced concrete, TRC, or fabric-reinforced cementitious matrix, FRCM) the fabric-to-mortar bond is generally improved by more rigid warp-to-weft junctions and by stiffer coatings.
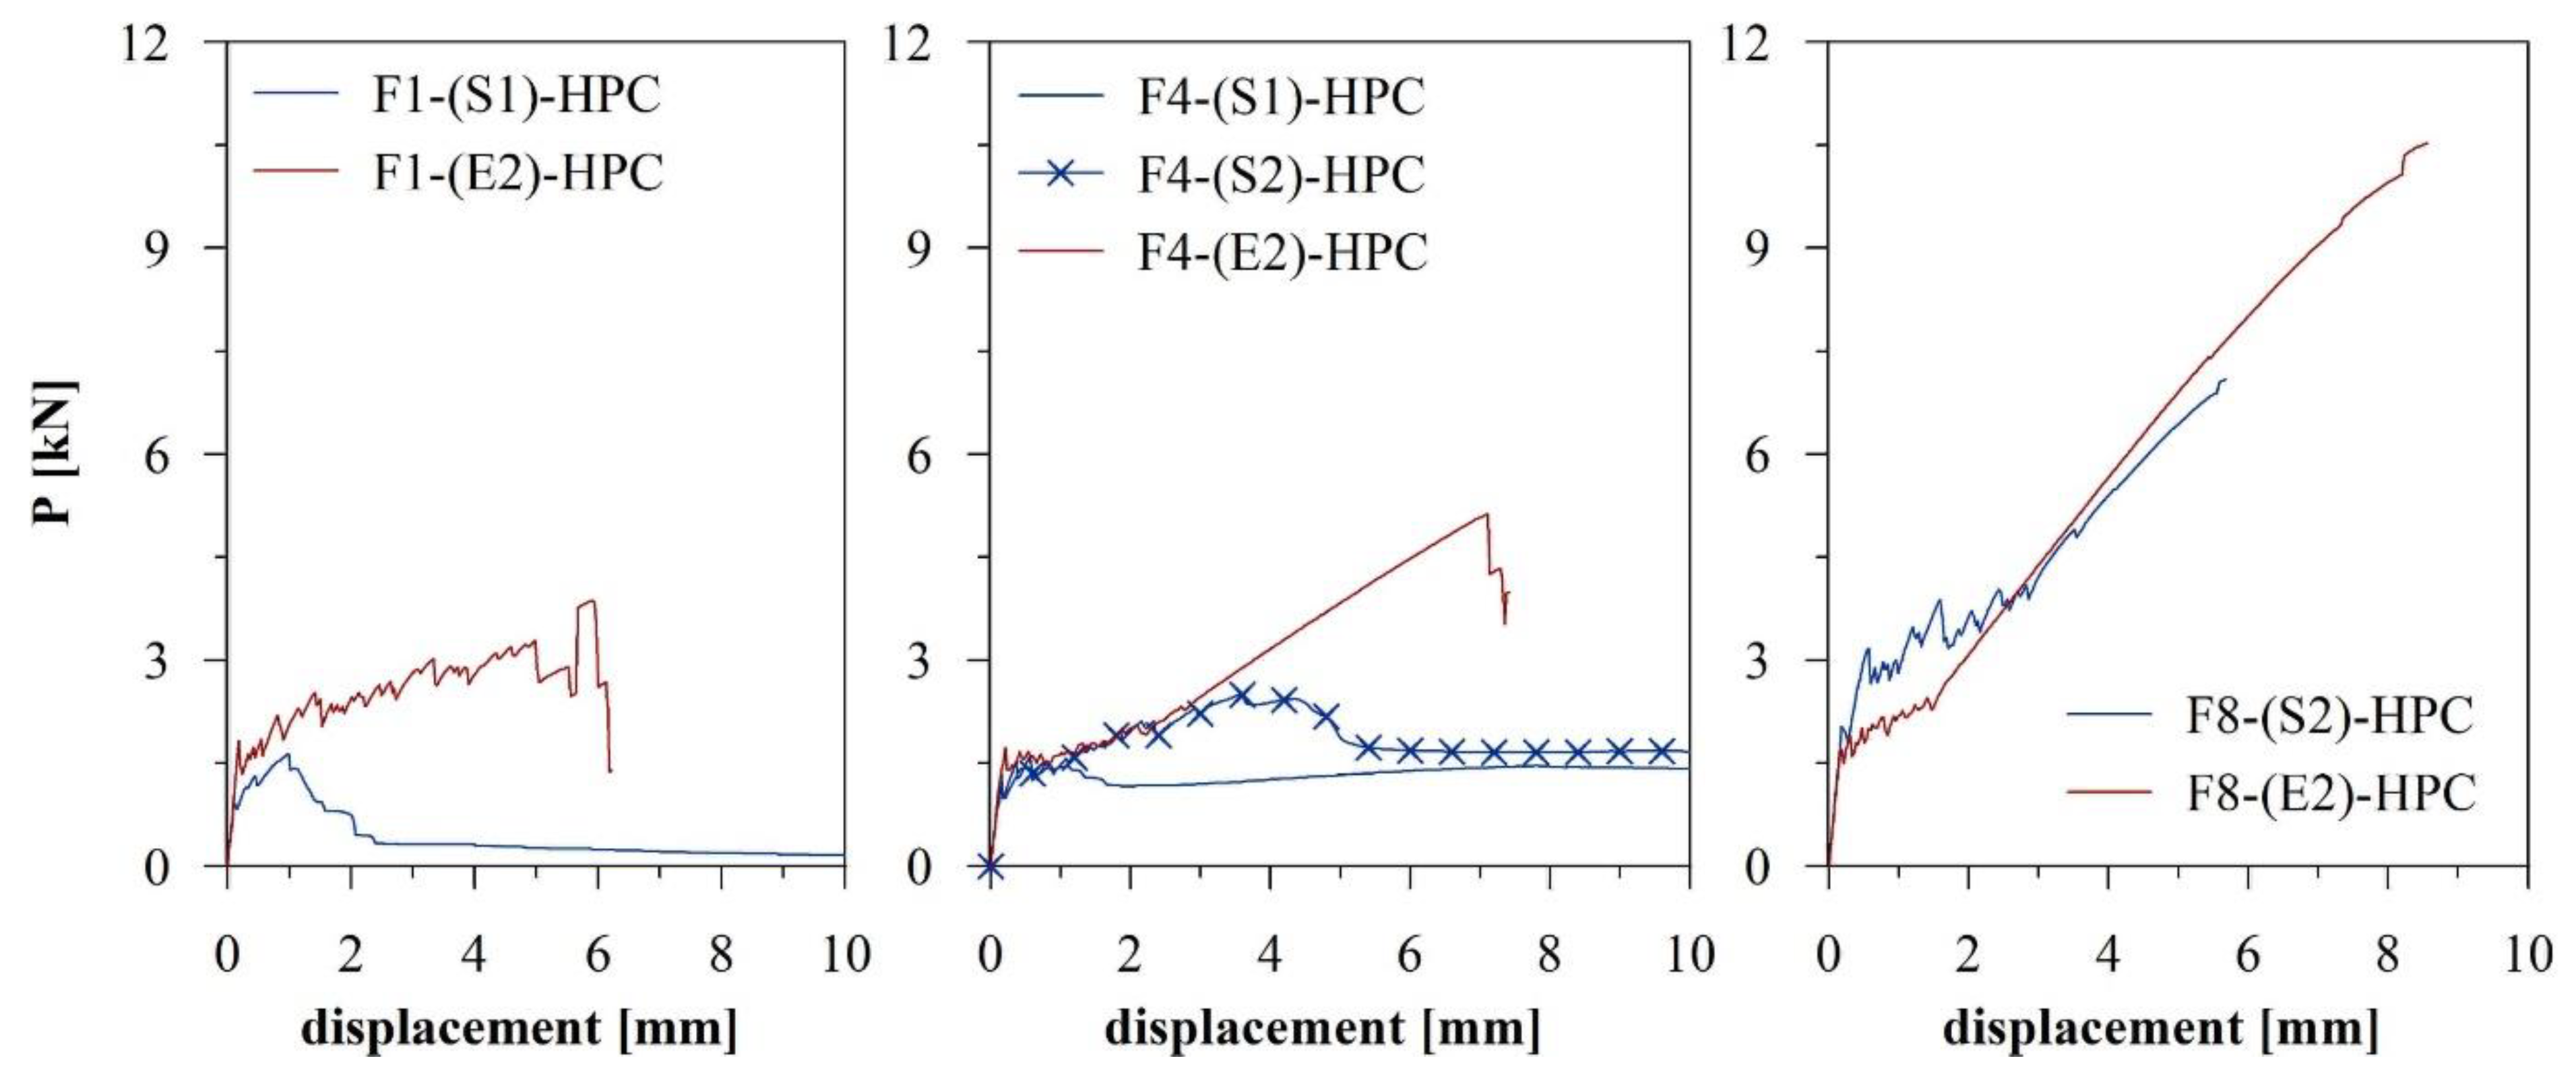
In this section, some of the previously investigated fabrics were used as reinforcements in cement-based TRC composites and performance and cost considerations have been similarly drawn. Three different fabrics (F1, F4, F8) coated with both SBR and epoxy resins were considered. In particular, only the epoxy 2 system was taken into account, with the aim of quantifying the beneficial effect of the coating on the overall response in case of the most expensive textiles. The chosen matrix was a fine-grained self-compacting high-performance concrete (HPC), characterized by an average flexural tensile strength of around 14 MPa and an average cubic compressive strength of around 90 MPa.
Three nominally identical samples (70 × 400 × 6 mm3 in size and free length between the clamps, L0, of about 300 mm) for each TRC composite system were cast and tested under tensile action, after at least 28 days of natural curing. Please note that, in case of composites made with fabric F8, the sample nominal thickness was increased to 9 mm, to account for the higher grammage of the fabric. For the sake of brevity, the details of the mortar mix design, its mechanical characterization, as well as the casting and testing procedures are here omitted and reported in [18].
From the average curves of the uniaxial tensile tests depicted in terms of load vs. displacement curves in Figure 12, the beneficial effect of the epoxy coating on the overall composite response appears clearly visible. In fact, the reached maximum loads in case of epoxy-impregnated textiles are higher than the SBR ones for all the tested TRC composites. Moreover, in the composites reinforced with SBR-impregnated low-grammage textiles, F1-(S1) and F4-(S1)/(S2), a slip of the fabric within the mortar occurred, preventing the development of the typical tri-linear response of TRC/FRCM composites and of a dense multi-cracking. The reason of that may be found in the lower impregnation, which implies that a certain amount of coating remains on the surface, degrading the bond with the cementitious mortar, and in the limited stiffness of the warp-to-weft nodes in the case of SBR coatings. Similar observations were already shown by several authors in [18,23].
In Table 5, in addition to the geometrical and mechanical parameters, the efficiency of the composite system, EFTRC,f, computed with respect to the maximum tensile strength of the AR-glass filaments (2000 MPa), is reported. This parameter, originally proposed in [18], was evaluated as follows:
where the Af is the glass section over a width of 70 mm.
As in the case of the tensile tests on the plain textile samples, the increasing of the equivalent fabric thickness is accompanied by an increase of the experimentally evaluated maximum tensile capacity. Please note that the trend is close to linear, as was the one reported in Figure 4a for the low and medium-grammage textiles in the warp direction. However, the main difference between the results at the fabric and at the composite levels appears visible by computing the system efficiency. In fact, on the contrary to what was observed for the plain textiles and depicted in Figure 4b, by augmenting the fabric grammage it is possible to obtain at least a constant value of the utilization rate (or even an increasing evolution of the EFTRC,f in case of SBR-coated mesh) with respect to the ultimate tensile strength of the glass filaments (Figure 13b). Even in case of poor impregnation, the stiffness of the grid nodes grows if more AR-glass yarns are introduced in the fabric weaving.
Table 5.
Tensile test results for TRC samples: geometry, mechanical parameters, and normalized costs per unit load.
Table 5.
Tensile test results for TRC samples: geometry, mechanical parameters, and normalized costs per unit load.
| t | b | L0 | Pmax | Af | σTRC,f,max | EFTRC,f | Normalized Cost per kN | ||
|---|---|---|---|---|---|---|---|---|---|
| [mm] | [mm] | [m] | [kN] | [mm2] | [MPa] | [-] | [1/kN] | ||
| F1-(S1)-HPC | avg. | 5.72 | 69.97 | 295.67 | 1.64 | 2.69 | 611.94 | 0.31 | 0.36 |
| (std) | (0.12) | (0.50) | (1.53) | (0.14) | (50.63) | ||||
| F1-(E2)-HPC | avg. | 5.97 | 70.35 | 294.67 | 3.69 | 2.69 | 1371.67 | 0.69 | 0.31 |
| (std) | (0.21) | (0.36) | (0.58) | (0.41) | (151.89) | ||||
| F4-(S1)-HPC | avg. | 5.68 | 69.90 | 298.00 | 1.71 | 3.58 | 477.96 | 0.24 | 0.64 |
| (std) | (0.42) | (0.48) | (1.00) | (0.40) | (112.25) | ||||
| F4-(S2)-HPC | avg. | 5.97 | 70.43 | 295.33 | 2.82 | 3.58 | 785.95 | 0.39 | 0.39 |
| (std) | (0.39) | (0.96) | (1.53) | (0.32) | (90.60) | ||||
| F4-(E2)-HPC | avg. | 5.89 | 70.04 | 295.67 | 5.26 | 3.58 | 1468.86 | 0.73 | 0.22 |
| (std) | (0.23) | (0.26) | (1.53) | (0.15) | (42.76) | ||||
| F8-(S2)-HPC | avg. | 8.77 | 70.58 | 294.00 | 6.46 | 7.16 | 902.36 | 0.45 | 0.26 |
| (std) | (0.12) | (0.89) | (1.00) | (0.82) | (114.31) | ||||
| F8-(E2)-HPC | avg. | 8.89 | 70.66 | 293.33 | 9.84 | 7.16 | 1373.14 | 0.69 | 0.24 |
| (std) | (0.29) | (0.57) | (0.58) | (0.68) | (94.33) |
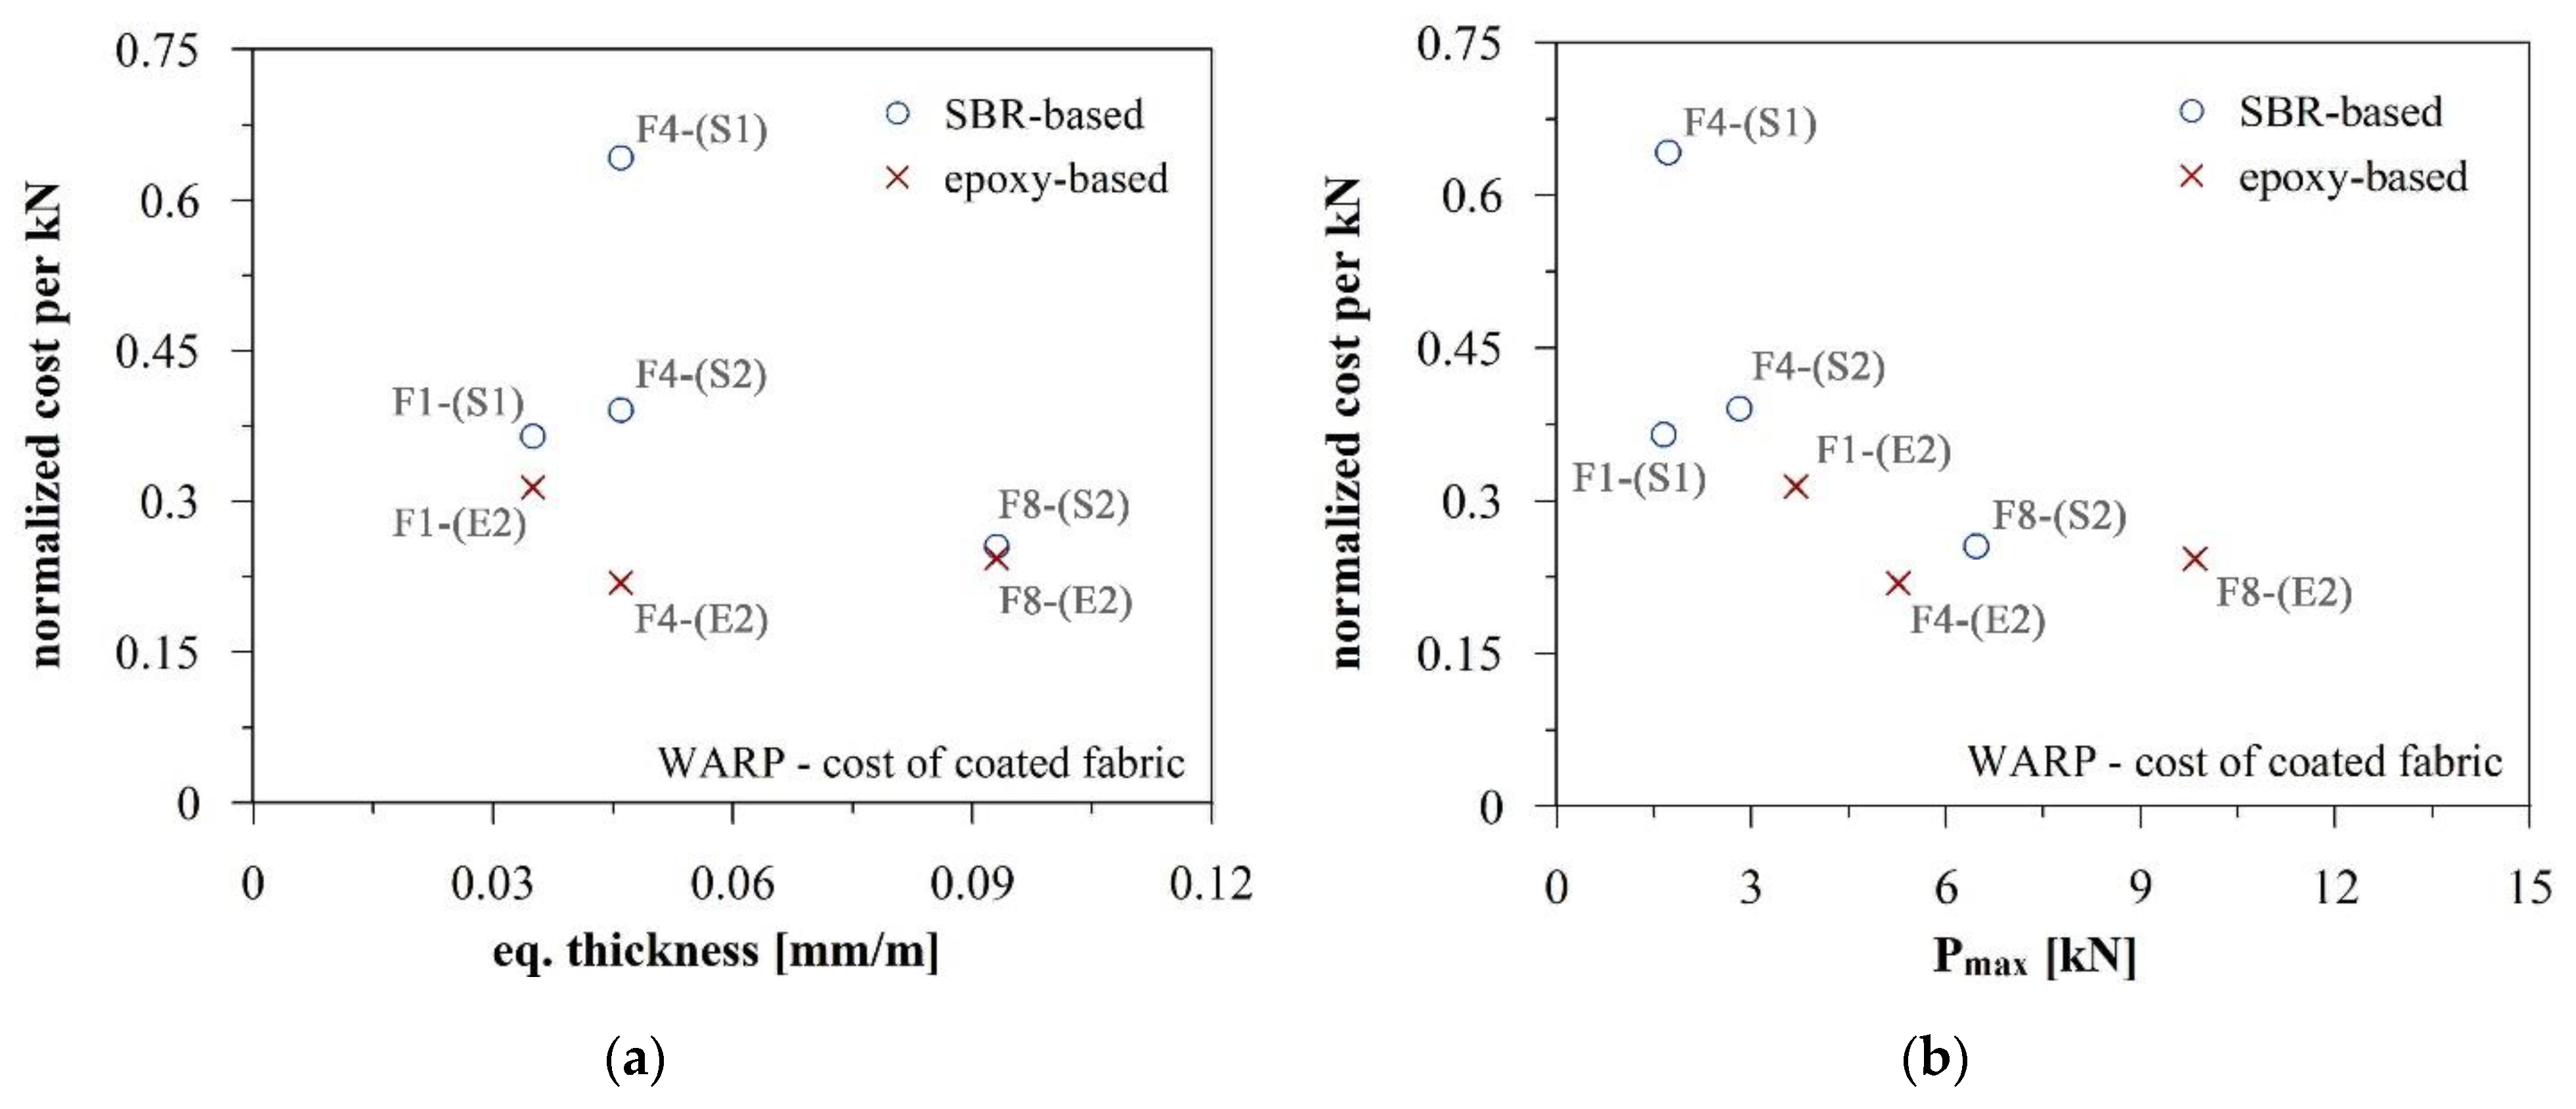
As for the plain textiles, the normalized cost per unit load was computed for the TRC composites and is reported in Table 5. In Figure 14, those values are expressed as a function of the equivalent thickness of the fabrics and of the maximum load recorded during the tensile test on the composites. The cost over performance ratio is generally lower in the case of epoxy-impregnated textiles. Only with regard to the F8-based composites does the difference obtained between the two types of impregnations seem negligible.
As determined for the plain textiles, the choice of the optimum composite solution should start from the required tensile capacity. In this way, for example, it is possible to highlight the effect of the epoxy impregnation, which leads to cheaper and more sustainable solutions with fixed required mechanical performance (See Figure 13a and Figure 14a). For example, assuming a target capacity of around 5 kN over a 70 mm wide strip, the F4-(E2)-HPC system would be less expensive than the F8-based one and require half of the glass quantity (equivalent thickness in the warp direction of 0.046 mm/m instead of 0.093 mm/m). Moreover, it is important to notice that, to reach certain load values, the adoption of an epoxy impregnation appears imperative.
Note that an important aspect that deserves further investigation is the possibility of using a combination of different fabrics within the same TRC composite. Further developments of this research could address the possible variation of the system efficiency, in the case of a single fabric with a defined sectional area or, as an alternative, multiple fabrics ensuring the same total amount of reinforcement. In those cases, the cost increase can be considered linear with the number of fabric layers (cost of the single fabric times the number of layers, neglecting the labor cost, which may increase with multiple fabric layers), but the performance efficiency may vary, affecting the identification of the optimum solution.
6. Conclusions
The behavior of the AR-glass based textiles under tension is significantly influenced by the mesh characteristics, such as the equivalent thickness, the filament diameter, and the nature of the impregnation coating. The fabric efficiency generally increases with the reduction of both the glass grammage and the roving fineness (i.e., filament diameters). Epoxy-impregnated textiles generally imply an increase of the manufacturing costs, but the better penetration within the filaments with respect to SBR-based solutions improves the fabric efficiency, making them excellent from a cost–performance point of view.
Similar observations regarding the efficiency increase due to the coating nature may be drawn at the TRC composite level. In the case of reinforcement with low-grammage textiles, the stiffer and low-viscosity epoxy coating is required to develop the typical tri-linear composite response and ensure the multi-crack of the cement-based sample. This aspect plays a key role, especially when fabric-reinforced cement-based composites (e.g., FRCM) are used in retrofitting/strengthening applications. Note that the above-mentioned observation shall be confirmed in the case of lime-based mortar composites (typically used in masonry applications), since the efficiency may be limited by the poor characteristics of the inorganic matrix. Moreover, cost–performance considerations are needed in order to limit the waste of raw glass material, orienting towards more sustainable and efficient fabric-reinforced composites.
Some open problems deserve further investigation, including the effects of the different weave patterns (plain or leno) and the relationship between the performance increase and the coating percentage at the textile levels, as well as the use of multiple fabric layers or different mortars at the composite scale.
Author Contributions
Conceptualization, M.C.R., G.Z., L.S., M.C. and M.d.P.; methodology, M.C.R., G.Z., L.S. and M.C.; investigation, M.C.R., G.Z. and L.S.; data curation, M.C.R., G.Z. and L.S.; writing—original draft preparation, M.C.R. and L.S.; writing—review and editing, M.C.R., G.Z., L.S., M.C. and M.d.P.; visualization, M.C.R.; supervision, G.Z., M.C. and M.d.P.; funding acquisition, L.S. and M.d.P. All authors have read and agreed to the published version of the manuscript.
Funding
This research was funded by the ReLUIS interuniversity consortium (ReLUIS WP 14 2019–2021) and by Gavazzi Tessuti Tecnici Spa in the field of a private research project.
Institutional Review Board Statement
Not applicable.
Informed Consent Statement
Not applicable.
Data Availability Statement
The data presented in this study are available within the manuscript.
Acknowledgments
The authors would like to acknowledge Gavazzi Tessuti Tecnici Spa. This company, founded in 1881 and located near Lecco in the north of Italy, is a leading manufacturer of technical textiles, especially for building applications, and it has been working with Politecnico di Milano since 2008 in the framework of the development and manufacturing of AR-glass reinforcements.
Conflicts of Interest
The authors Marco Carlo Rampini, Giulio Zani, Matteo Colombo, and Marco di Prisco declare no conflict of interest. The author Louis Schouler, representing one of the funders of this study, declares his role in the design of the study, in the collection and interpretation of data, in the writing of the manuscript, and in the decision to publish the results.
References
- Hagnell, M.; Åkermo, M. The economic and mechanical potential of closed loop material usage and recycling of fibre-reinforced composite materials. J. Clean. Prod. 2019, 223, 957–968. [Google Scholar] [CrossRef]
- Brameshuber, W. Textile reinforced concrete-state-of-the-art report of RILEM TC 201-TRC. In Proceedings of the Reunion Internationale des Laboratoires et Experts des Materiaux, Systemes de Construction et Ouvrages (RILEM), Aachen, Germany, 6 September 2006. [Google Scholar]
- Peled, A.; Bentur, A.; Mobasher, B. Textile Reinforced Concrete, 1st ed.; CRC Press: Boca Raton, FL, USA, 2017. [Google Scholar]
- De Felice, G.; De Santis, S.; Garmendia, L.; Ghiassi, B.; Larrinaga, P.; Lourenço, P.B.; Papanicolaou, C.G.; Paolacci, F.; Oliveira, D.V. Mortar-based systems for externally bonded strengthening of masonry. Mater. Struct. 2014, 47, 2021–2037. [Google Scholar] [CrossRef]
- Ascione, L.; De Felice, G.; De Santis, S. A qualification method for externally bonded Fibre Reinforced Cementitious Matrix (FRCM) strengthening systems. Compos. Part B Eng. 2015, 78, 497–506. [Google Scholar] [CrossRef]
- Saiman, M.P.; Wahab, M.S.; Wahit, M.U. The effect of fabric weave on the tensile strength of woven kenaf reinforced unsaturated polyester composite. In Proceedings of the International Colloquium in Textile Engineering, Fashion, Apparel and Design, Singapore, 9 October 2014; pp. 25–29. [Google Scholar]
- Kim, S.J.; Kim, H.A. Effect of fabric structural parameters and weaving conditions to warp tension of aramid fabrics for protective garments. Text. Res. J. 2017, 88, 987–1001. [Google Scholar] [CrossRef]
- Hegger, J.; Voss, S. Investigations on the bearing behaviour and application potential of textile reinforced concrete. Eng. Struct. 2008, 30, 2050–2056. [Google Scholar] [CrossRef]
- Scheffler, C.; Gao, S.; Plonka, R.; Mäder, E.; Hempel, S.; Butler, M.; Mechtcherine, V. Interphase modification of alkali-resistant glass fibres and carbon fibres for textile reinforced concrete II: Water adsorption and composite interphases. Compos. Sci. Technol. 2009, 69, 905–912. [Google Scholar] [CrossRef]
- D’Antino, T.; Papanicolaou, C. Mechanical characterization of textile reinforced inorganic-matrix composites. Compos. Part B Eng. 2017, 127, 78–91. [Google Scholar] [CrossRef]
- Messori, M.; Nobili, A.; Signorini, C.; Sola, A. Mechanical performance of epoxy coated AR-glass fabric Textile Reinforced Mortar: Influence of coating thickness and formulation. Compos. Part B Eng. 2018, 149, 135–143. [Google Scholar] [CrossRef] [Green Version]
- Bompadre, F.; Donnini, J. Surface modification of glass textile for the reinforcement of a cement-based composite: A review. Appl. Sci. 2021, 11, 2028. [Google Scholar] [CrossRef]
- Peled, A.; Bentur, A. Geometrical characteristics and efficiency of textile fabrics for reinforcing cement composites. Cem. Concr. Res. 2000, 30, 781–790. [Google Scholar] [CrossRef]
- Peled, A.; Bentur, A. Fabric structure and its reinforcing efficiency in textile reinforced cement composites. Compos. Part A Appl. Sci. Manuf. 2003, 34, 107–118. [Google Scholar] [CrossRef]
- Donnini, J.; Corinaldesi, V.; Nanni, A. Mechanical properties of FRCM using carbon fabrics with different coating treatments. Compos. Part B Eng. 2016, 88, 220–228. [Google Scholar] [CrossRef]
- Signorini, C.; Nobili, A.; Sola, A.; Messori, M. Designing epoxy viscosity for optimal mechanical performance of coated Glass Textile Reinforced Mortar (GTRM) composites. Constr. Build. Mater. 2019, 233, 117325. [Google Scholar] [CrossRef]
- The British Standards Institution. Implementation of ISO 4606:1995 Textile Glass—Woven Fabric—Determination of Tensile Breaking Force and Elongation at Break by the Strip Method; ISO: Geneva, Switzerland, 1995; Volume 1995, pp. 1–16. [Google Scholar]
- Rampini, M.C.; Zani, G.; Colombo, M.; Di Prisco, M. Mechanical behaviour of TRC composites: Experimental and analytical approaches. Appl. Sci. 2019, 9, 1492. [Google Scholar] [CrossRef] [Green Version]
- Cohen, Z.; Peled, A. Controlled telescopic reinforcement system of fabric—Cement composites—Durability concerns. Cem. Concr. Res. 2010, 40, 1495–1506. [Google Scholar] [CrossRef]
- Lee, B.; Leong, K.H.; Herszberg, I. Effect of weaving on the tensile properties of carbon fibre tows and woven composites. J. Reinf. Plast. Compos. 2001, 20, 652–670. [Google Scholar] [CrossRef]
- Lee, L.; Rudov-Clark, S.; Mouritz, A.; Bannister, M.; Herszberg, I. Effect of weaving damage on the tensile properties of three-dimensional woven composites. Compos. Struct. 2002, 57, 405–413. [Google Scholar] [CrossRef]
- Scheffler, C.; Gao, S.; Plonka, R.; Mäder, E.; Hempel, S.; Butler, M.; Mechtcherine, V. Interphase modification of alkali-resistant glass fibres and carbon fibres for textile reinforced concrete I: Fibre properties and durability. Compos. Sci. Technol. 2009, 69, 531–538. [Google Scholar] [CrossRef]
- Raupach, M.; Orlowsky, J.; Büttner, T.; Dilthey, U.; Schleser, M.; Hegger, J. Epoxy-impregnated textiles in concrete-load bearing capacity and durability. In Proceedings of the 1st International RILEM Conference, Aachen, Germany, 6–7 September 2006; pp. 77–88. [Google Scholar]
Figure 1.
Textile manufacturing phases: AR-glass spools on the creel (a), weaving loom machine (b), impregnation machine (c), and detail of the dip-coating process within the impregnation tank (d).
Figure 1.
Textile manufacturing phases: AR-glass spools on the creel (a), weaving loom machine (b), impregnation machine (c), and detail of the dip-coating process within the impregnation tank (d).

Figure 2.
Overview of the some of the investigated AR-glass textiles (70 × 70 mm2 in size).

Figure 3.
Examples of average load vs. displacement response curves for the investigated textiles in the warp and in the weft direction: low (a,b), medium (c,d), and high warp grammage textiles (e,f).
Figure 3.
Examples of average load vs. displacement response curves for the investigated textiles in the warp and in the weft direction: low (a,b), medium (c,d), and high warp grammage textiles (e,f).

Figure 8.
Normalized cost per kN vs. equivalent thickness: cost of the coated (a) and of the uncoated fabrics (b).
Figure 8.
Normalized cost per kN vs. equivalent thickness: cost of the coated (a) and of the uncoated fabrics (b).

Figure 9.
Normalized cost per kN vs. filament diameters: cost of the coated (a) and of the uncoated fabrics (b).
Figure 9.
Normalized cost per kN vs. filament diameters: cost of the coated (a) and of the uncoated fabrics (b).

Figure 10.
Normalized cost per kN vs. fabric efficiency, EFf: cost of the coated (a) and of the uncoated fabrics (b).
Figure 10.
Normalized cost per kN vs. fabric efficiency, EFf: cost of the coated (a) and of the uncoated fabrics (b).

Figure 11.
Normalized cost, CN, vs. average maximum tensile load (a) and fabric efficiency (b) in the warp direction.
Figure 11.
Normalized cost, CN, vs. average maximum tensile load (a) and fabric efficiency (b) in the warp direction.

Figure 12.
Average tensile response in terms of load vs. displacement curves for the F1/F4/F8-based TRC composites in the warp direction.
Figure 12.
Average tensile response in terms of load vs. displacement curves for the F1/F4/F8-based TRC composites in the warp direction.

Figure 13.
Average maximum load (a) and fabric efficiency (b) vs. equivalent thickness of the investigated textiles in the case of TRC composites reinforced with the fabrics in the warp direction.
Figure 13.
Average maximum load (a) and fabric efficiency (b) vs. equivalent thickness of the investigated textiles in the case of TRC composites reinforced with the fabrics in the warp direction.

Figure 14.
Normalized cost per kN vs. equivalent thickness (a) and maximum tensile capacity (b) for the TRC composites reinforced in the warp direction.
Figure 14.
Normalized cost per kN vs. equivalent thickness (a) and maximum tensile capacity (b) for the TRC composites reinforced in the warp direction.

Publisher’s Note: MDPI stays neutral with regard to jurisdictional claims in published maps and institutional affiliations. |
© 2021 by the authors. Licensee MDPI, Basel, Switzerland. This article is an open access article distributed under the terms and conditions of the Creative Commons Attribution (CC BY) license (https://creativecommons.org/licenses/by/4.0/).
Share and Cite
MDPI and ACS Style
Rampini, M.C.; Zani, G.; Schouler, L.; Colombo, M.; di Prisco, M. Effect of Textile Characteristics on the AR-Glass Fabric Efficiency. Textiles 2021, 1, 387-404. https://0-doi-org.brum.beds.ac.uk/10.3390/textiles1020020
AMA Style
Rampini MC, Zani G, Schouler L, Colombo M, di Prisco M. Effect of Textile Characteristics on the AR-Glass Fabric Efficiency. Textiles. 2021; 1(2):387-404. https://0-doi-org.brum.beds.ac.uk/10.3390/textiles1020020
Chicago/Turabian StyleRampini, Marco Carlo, Giulio Zani, Louis Schouler, Matteo Colombo, and Marco di Prisco. 2021. "Effect of Textile Characteristics on the AR-Glass Fabric Efficiency" Textiles 1, no. 2: 387-404. https://0-doi-org.brum.beds.ac.uk/10.3390/textiles1020020