1. Introduction
Traditional station-based carsharing has already existed for more than 60 years. A fleet of cars can be shared by several users, who can drive a car when they need it, without having to own one [
1]. During the last century, station-based carsharing became an important tool for transport policymakers, as a demand increase of these systems could reduce the number of cars and pollution, resulting in more sustainable cities. The literature has accepted the following main positive effects for traditional station-based carsharing systems in restricted environments: Reduction in total CO2 emissions [
2], individual reduction in vehicle-kilometers travelled [
3] and reduction in the average number of vehicles per household [
4].
Recently, customers have been attracted by new Free-Floating Carsharing systems FFCS [
5,
6], which allows members to borrow a car from the street and return it anywhere in the service zone. It is a one-way, non-station-based system and it offers users greater flexibility. Flexibility is the reason why FFCS systems have grown very fast in the last decade [
7,
8]. Until now, most of the FFCS literature relies on survey-based methodologies [
9] and simulations [
1,
5,
10,
11], but little research has been devoted to the analysis of current FFCS flows through revealed web-based data. As a consequence, the impacts that these FFCS may generate on user behavior and even on the public transport system remain partly unexplored. Methodologies based on FFCS web-based data are starting to be developed in order to achieve better knowledge of these systems.
The arrival of electric vehicles in the carsharing market has occurred at the same time as the free-floating systems, generating positive environment effects in urban scenarios. In some European cities, like Madrid, all the FFCS companies are operating with electric cars. Electric cars are experienced by users as a new type of transportation mode in which the “limited range” (associated to the distance travelled and the location of recharging points) has been demonstrated to be a real preoccupation for customers: A notion called “range anxiety” [
12]. Recharging points are difficult to find in the cities and most of the FFCS companies usually have their own large recharging points, so the company staff has to move the vehicles to depots for recharging.
In order to reach the goal of transport decarbonization, electric cars will be an important chain of the new urban scenario. Rail stations can play an important role, such as the parking of the rail station can be prepared to accept, with priority, electric cars but also to recharge them while their users are travelling by commuters or long-distance trains. The processes of high-speed trains braking could provide, if the suitable technology is implemented, the station parking zones with a clean electrical power.
This paper contributes to the existing literature by designing a web-based platform in order to collect real FCCS data in order to analyze the demand of FFCS cars in the area of rail stations. As high-speed rail stations offer a sustainable tool for electric recharging, special attention should be paid to this city’s intermodal center. The scientific contribution of this research is based on the analysis of real FFCS data. Moreover, Madrid is a city with one of the highest FCCS utilization rates in Europe, and almost all FFCS systems are electric. This article has been divided into the following parts in order to describe the research as a whole: Introduction (
Section 1); a review of the literature on FFCS systems (
Section 2); a description of the materials (Madrid case study) and methods used (design of a web-based platform, data acquisition and cleaning) in
Section 3; the main results (
Section 4) and finally, the presentation of the most important conclusions and policy recommendations (
Section 5).
2. Free Floating Carsharing: An Overview
FFCS is an evolution of the one-way carsharing model. In the one-way carsharing, users collect the car at a station and return it to the station of their choice, not necessarily to the station where they initially collected the car. FFCS involves the user simply taking and returning the car to any public parking space inside a specific operating area. The pioneer of this system was Car2go, a Daimler AG subsidiary which launched its first fleet in October 2008 in a small German city called Ulm. Since then, the company has expanded throughout the world (25 cities in Asia, US and Europe). The second system worldwide in terms of membership and number of vehicles operating, Drive Now, was also supported by a car manufacturer, the BMW Group. Today, there are many FFCS companies operating in the world, and dozens of other free-floating carsharing models not based on cars, like moto-sharing or bike-sharing.
Clearly, new ICTs (information and communication technologies) have enabled the boom of the FFCS as the Smartphone apps allow the user to search and book a car close to their current geographic position in the city (inside a geofence, a virtual perimeter, defined by FFCS company). In this geofence, people hire and drop cars near or directly at their demand points. The car movements and user profiles are controlled (through the ICT used in running the system) by the companies that provide FFCS services and they are reluctant to share this information. Recent research [
7] has demonstrated that there is an accepted average maximum distance of 500 m, around the user’s position, to an available car, and consequently, an accepted maximum waiting time for an available car in a tolerable radius.
Due to the ICT used in running the system, the companies that provide FFCS services control the entire database of car movements and user behavior and profiles. However, due to commercial and competence reasons, they are reluctant to share this information with the scientific community. From a scientific point of view, there are still many questions as to whether these systems increase the overall vehicle miles travelled in urban areas, and negatively affect traditional public transportation. However, in the US context in 2016, FFCS systems were backed by the positive environmental results of an extensive study [
10], the direct transfer of these results to European capitals is complex. The first concern is focused on the denser network of public transportation in European cities, which is more sensitive to the rapid rise of FFCS vehicles operating in the streets. The second concern is about the behavior towards FFCS, which depends strongly on the city and the user’s socioeconomic profiles.
The first studies assessing the FFCS positive environmental impacts were backed by customer surveys. In 2016, Marten and Shaheen [
9] carried out a survey in the US to analyze the customers’ behavior towards car ownership once they had tried FFCS services. Special focus was devoted to survey their willingness, in the future, to forego a private car purchase, which it is the key issue to demonstrate the positive environmental impacts of FFCS. Some years later, Wang et al. [
13] and Namazu and Dowlatabadi [
14], replicated this approach in other surveys. Carsharing users, in general, tend to have a low sense of vehicle ownership and a different view of mobility and some authors [
15,
16,
17] have already detected this attitude. However, car ownership is complex to analyze and people who avoid vehicle ownership usually have other reasons rather than simply being a member of a FFCS system, as pointed out by Sprei in 2017 [
18]. These “other reasons” may include an increase in the cost of car insurance or/and maintenance, a job change, stricter parking regulations or a previous car that has broken down [
19].
Other group of FFCS studies based on a simulation, combined with surveys, was developed in Germany (the origin place of the FFCS systems). In 2011, Firnkorn and Müller [
10] aimed to assess the eco-sustainability of the fuel-powered Car2go FFCS operating in the city of Ulm. Based on a quantitative survey, they calculated three scenarios after the launch of Car2go (2009), and the results showed a CO2 reduction per average Car2go member. The survey campaign also comprised some ownership questions (more than a quarter of the surveyed sample stated that if Car2go were always available, they might forgo a car purchase and drive a Car2go instea). In 2012, Firnkorn [
11] validated ULM outputs using triangulation with retrospective data. Some years later, in the city of Berlin, Ciari et al. (2014) [
1] used MATSim (an agent-based simulation model software) to compare fuel powered FFCS to the existing station-based carsharing, finding a good complementarity of FFCS and station-based systems. This approach was replicated in 2015 by Wielinski et al. [
8] in Montreal (Canada), but with a different methodology, using a targeted survey, GPS tracking for FFCS cars and four databases of transactional data for both services.
Lastly, FFCS operational problems (parking prices, walking distance to FFCS cars, car relocation strategies) comprise the third group of studies on FFCS. Operational policies on FFCS usually aims to increase FFCS service frequency and there are basically two ways to achieve this objective: Increasing the fleets cars (more expensive) or implementing relocation strategies in the rented car mobility. In comparison to station-based carsharing, FFCS systems offer more options for interacting with users (through ITc), providing customers with incentives to relocate the car themselves. If members of FFCS are economically motivated, users can deliver the car to an alternative destination, and walk (or take public transport) a greater distance to their final destination. In the city of Hamburg, Hermann et al. (2014) [
7] used surveys to analyze different pricing incentives for users in the case of implementing smart relocation strategies and the user tolerance to walk towards an available car. This type of survey was carried out later in Madrid among university students [
20].
In European cities, the first findings in the literature suggest that carsharing is complementary to existing private car usage in cities, rather than a replacement [
21,
22]. As a consequence, it is important to promote FFCS as a chain of intermodal routes totally covered by public transport. The option to rent a FFCS car after taking the urban bus or the metro depends strongly on the distance to walk until reaching an FFCS car. As FFCS use on-street parking lots, the availability of public space to park is a key issue to attract FFCS demand. Le Vine et al. [
23] pointed out that, although the public sector does not directly deliver shared-mobility services, transport planners play a decisive role, as any FFCS system depends on privileged access to street space (uncongested streets, free or cheap parking space), which can only be granted by the public sector. For example, in Madrid, from the point of view of parking space availability, municipal regulations in Madrid [
24,
25] allow free parking for electric vehicles in regulated streets, which are all located inside the area within the M-30 orbital motorway. The first FFCS company, Car2go, took advantage of this condition to enter the Madrid market.
Urban rail stations are big modal interchangers and FFCS is now a new transport mode that needs easy access to it. Urban buses usually have stops inside the perimeter area of rail stations and metro access is able to get the traveler inside the rail station. Car parking space (private parking lots) inside the central rail stations of big urban areas is usually very scarce and parking places in the streets near the station are highly demanding. However, most of the central rail stations at big European metropolitan areas are provided with a dense connection to the public transportation system (underground, urban buses), access by electric carsharing should not be dismissed. However, what is the current level of FFCS demand at rail stations? A study of the availability of FFCS cars in the streets near the rail stations could help to estimate the FFCS demand levels in these city areas.
Until now, little research on FFCS has been devoted to work with revealed web-based data [
26,
27,
28,
29]. Revealed we-based data collect the current position of available FFCS cars (parked and not booked). The operator supplies the car position and is publicly available through web pages (or smartphone apps) to enable the users to find, book and open unoccupied vehicles. The web-site also provides the vehicle identity number in the reservation process, and once the data have been collected, the FFCS car´s movement can be tracked, and consequently the O-D trip matrix can be estimated for the period of the data collection. Obviously, this process of estimation of trips is not easy, as it is based on the assumption of certain hypotheses and an interpretation of the operation in terms of car recharging options and vehicle booking times. The difficulties in obtaining data directly from the FFCS companies has forced the scientific community to harvest data directly from the operators’ website.
Only a few researches have benefited from real data from operators. In Munich and Berlin, Smöller et al. [
26] used data from DriveNow and car2go to study carsharing usage and to spatially identify the socio-economic factors that influence demand for this type of carsharing. Two years of booking data and the number of registered members for a shorter period of time were provided by the operators. In Berlin, Müller et al. [
27] worked with the booking data provided by DriveNow to analyze the influence of land use and census data on FFCS demand. They used a negative binomial model to estimate the number of carsharing trip starts per city district. The model was afterwards validated in the Munich and Cologne, with similar population sizes. Müller et al. [
27] highlighted an important issue concerning the methodology of reading the FFCS operator’s API (Application Programming Interface), underlining the difficulty in the identification of real FFCS flows, which should avoid errors related to the company’s operation. For example, the (non-)availability of a vehicle on the map can be due a customer trip or a service trip (for operational reasons such as relocation strategies or recharging).
Habibi et al. [
28] and Ciociola et al. [
29] were the first to harvest FFCS data directly from the operators´ API. With data publicly available on the web pages of 3 different operators, Habibi et al. [
28] compared FFCS usage patterns in 22 cities (in Europe and the US). Although an origin-destination trip analysis was not included in the study (with the exception of the city of Stockholm), they found that the most frequent origins and destinations were further than 500 meters from a metro (or regional train) station. This result indicates that FFCS is probably being used as a complementary mode of transport to transit (rather than as a substitution for it).
For the city of Turin (Italy), Ciociola et al. [
29] designed a web platform to collect and analyze FFCS data from two different operators for 52 days. The platform collected data each minute in real time and stored the data in a data lake. Moreover, the platform was able to build historical series before augmenting and processing them. One of the main contributions of this research was the FFCS spatial approach, obtaining the FFCS trips per origin and destination. The authors underlined the need to clean the harvested data before the analysis and to address issues such as collection mistakes and problems (identification of cars undergoing maintenance or recharging, web failures, GPS fix limitations, etc.). When the authors made travel time comparisons between FFCS trips and public transport trips, the results showed that FFCS trips in Turin were 36% shorter (on average) than on public transport, and the choice for FCCS starts when public transport time is over ten minutes.
This paper analyses the availability of FFCS trips (and the origin of this trips) around central rail stations in Madrid by designing a web-based dataset. Central rail stations in Madrid (Atocha and Chamartín) are provided with High-Speed Rail (HSR) services and the regenerative braking of high-speed trains can provide a clean energy to directly feed the recharging for electric cars (including FFCS). This is a pioneering experience in Madrid, a city with one of the highest FFCS utilization rates in the world. The next section describes the evolution of FFCS carsharing services in Madrid, the design of web-based platform to harvest FFCS data and the results obtained for the rail stations area.
3. Materials and Methods
Madrid is the selected case study for this research. While Madrid has a long tradition of public transport, the level of pollution still exceeds legal air quality limits according to Directive 2008/50/EC [
30]. For that reason, during the last decades, the city council has designed pollution protocols to be implemented during high-pollution episodes and promoted low emissions parking policies. FFCS systems have mushroomed in Madrid since 2015, due mainly to the favorable parking policies for electric vehicles promoted by the council. The first company to see these parking policies’ potential was car2go, which started operation in November 2015, with 500 units of electric Smart’s two-seater model. The second FFCS company to be implemented in Madrid was Emov in December 2016, a start-up design by the French car manufacturer PSA Group. Emov started operation with 600 units of compact four-seater BEV Citroen C-Zero. The third FFCS company to start operation was Zity (December 2017), which was launched by the Spanish infrastructure developer Ferrovial Group, in collaboration with Renault, the French car maker. This start-up started with a fleet of 650 Renault Zoe BEVs. Car2go, Emov and Zity have totally electric fleets, which means entirely Battery Electric Vehicles (BEVs). Unlike other countries, in Madrid all the FFCS vehicles are charged only by the service operators, instead of offering users the possibility of charging in exchange for rate reductions. Wible has been the last FFCS operator to arrive in Madrid (June 2018), but the first system to use plug-in hybrid electric vehicles (PHEV) instead of BEVs: 500 Kia Niro model cars. These four FFCS companies currently coexist in Madrid with an average service area of 80 km
2, a total fleet of over 2000 cars and an average service area of 80 km
2.
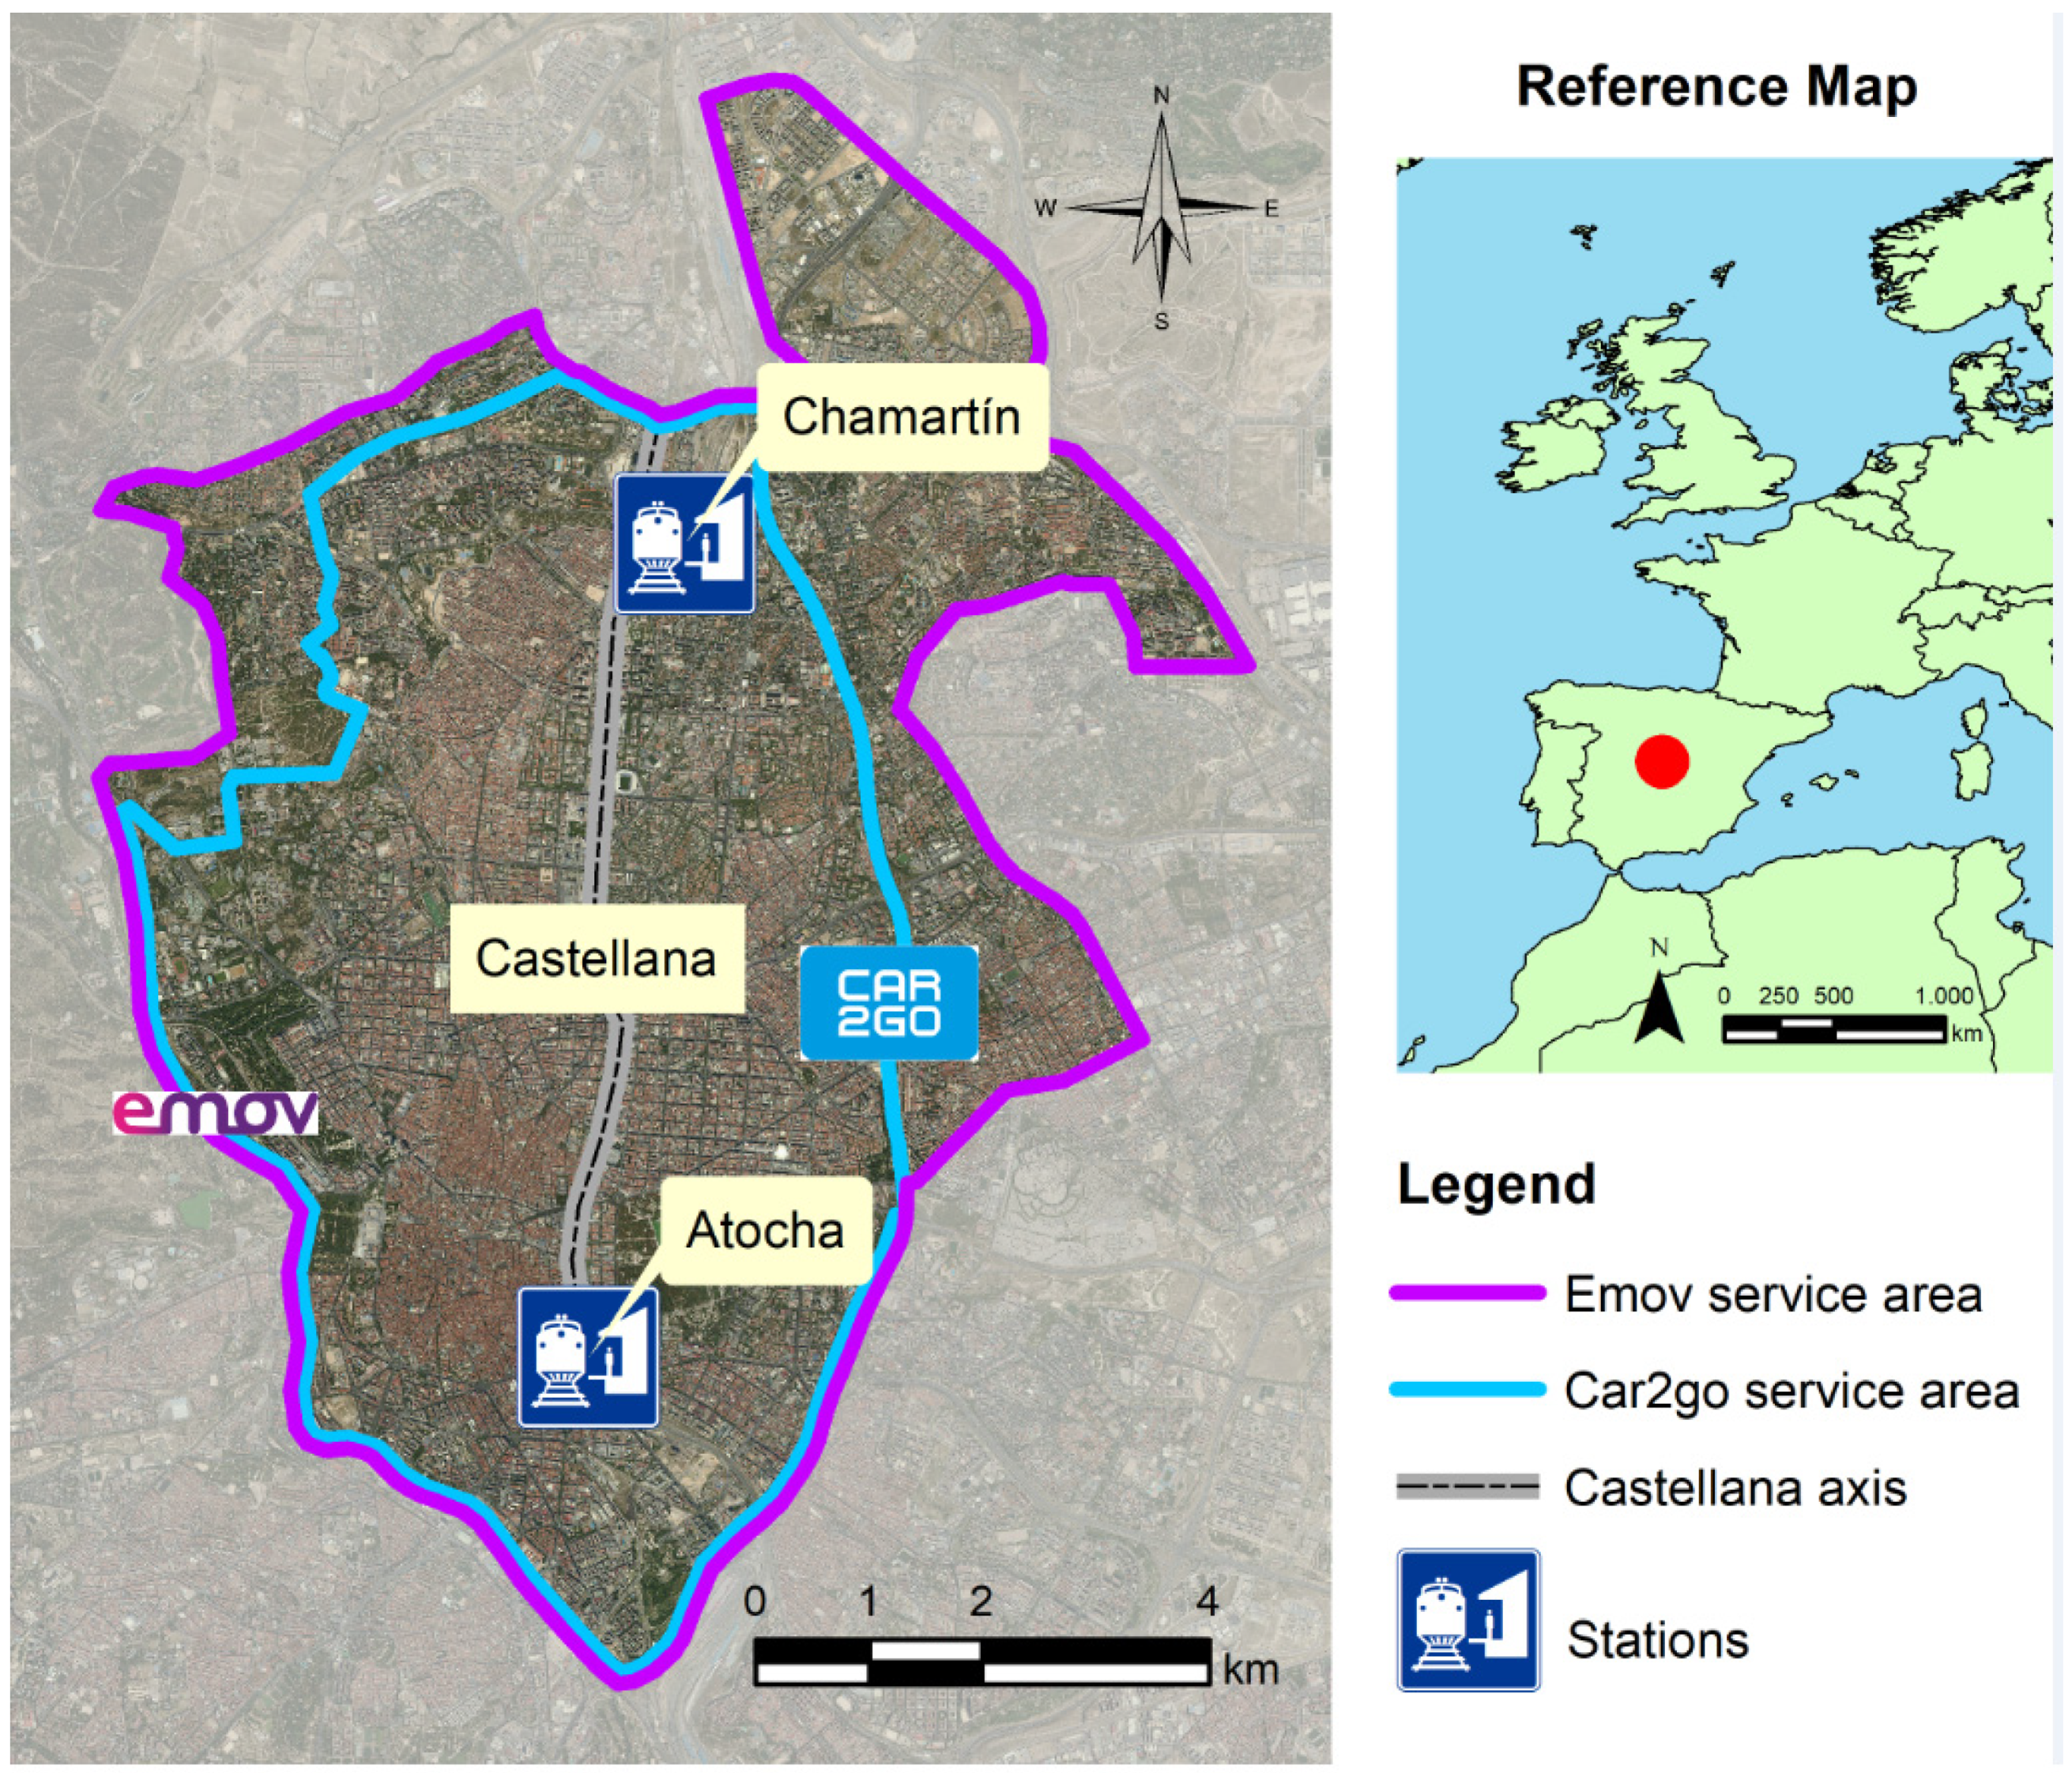
Atocha and Chamartín are the main central rail stations in Madrid; they are provided with high-speed, conventional trains and urban rail connections (metro and commuter rail). The private parking lots of Atocha (P1, P2, P3A, P3B and P4) offer a capacity of 1560 cars, while Chamartín is only provided with 685 parking points (P1 and P2). Station private parking cannot be used by FFCS, as the majority of FFCS operators only allow parking their vehicles in public on-street parking lots (for common short-duration rentals).
Figure 1 shows the location of Atocha and Chamartín in the city of Madrid and the FFCS service area.
Recharging electric FFCS cars in an efficient way is a complex logistic problem for FFCS operators [
31], because this activity implies a relocation of vehicles (being unavailable for users during this period) and an amount of staff trips to a limited number of available recharging points, usually located outside the city center. An agreement between FFCS operators and the Rail Administration can provide FFCS systems with a fixed electric recharging point at the city center. Moreover, this recharging point can be offered to private Electric Vehicles EV through a fee. In 2019, Funke et al. [
32] demonstrated that public charging infrastructure, as alternative to home charging, is only needed in some densely populated areas (as Madrid). The possibility to charge a fee in public space recharging zones has also been assessed in the literature [
33]. For electric vehicle users, a fee can be very effective in increasing efficiency at a charging station located in the public space. The response to the fee varies among EV drivers depending on their current behavior and the level of parking pressure they experience near their home.
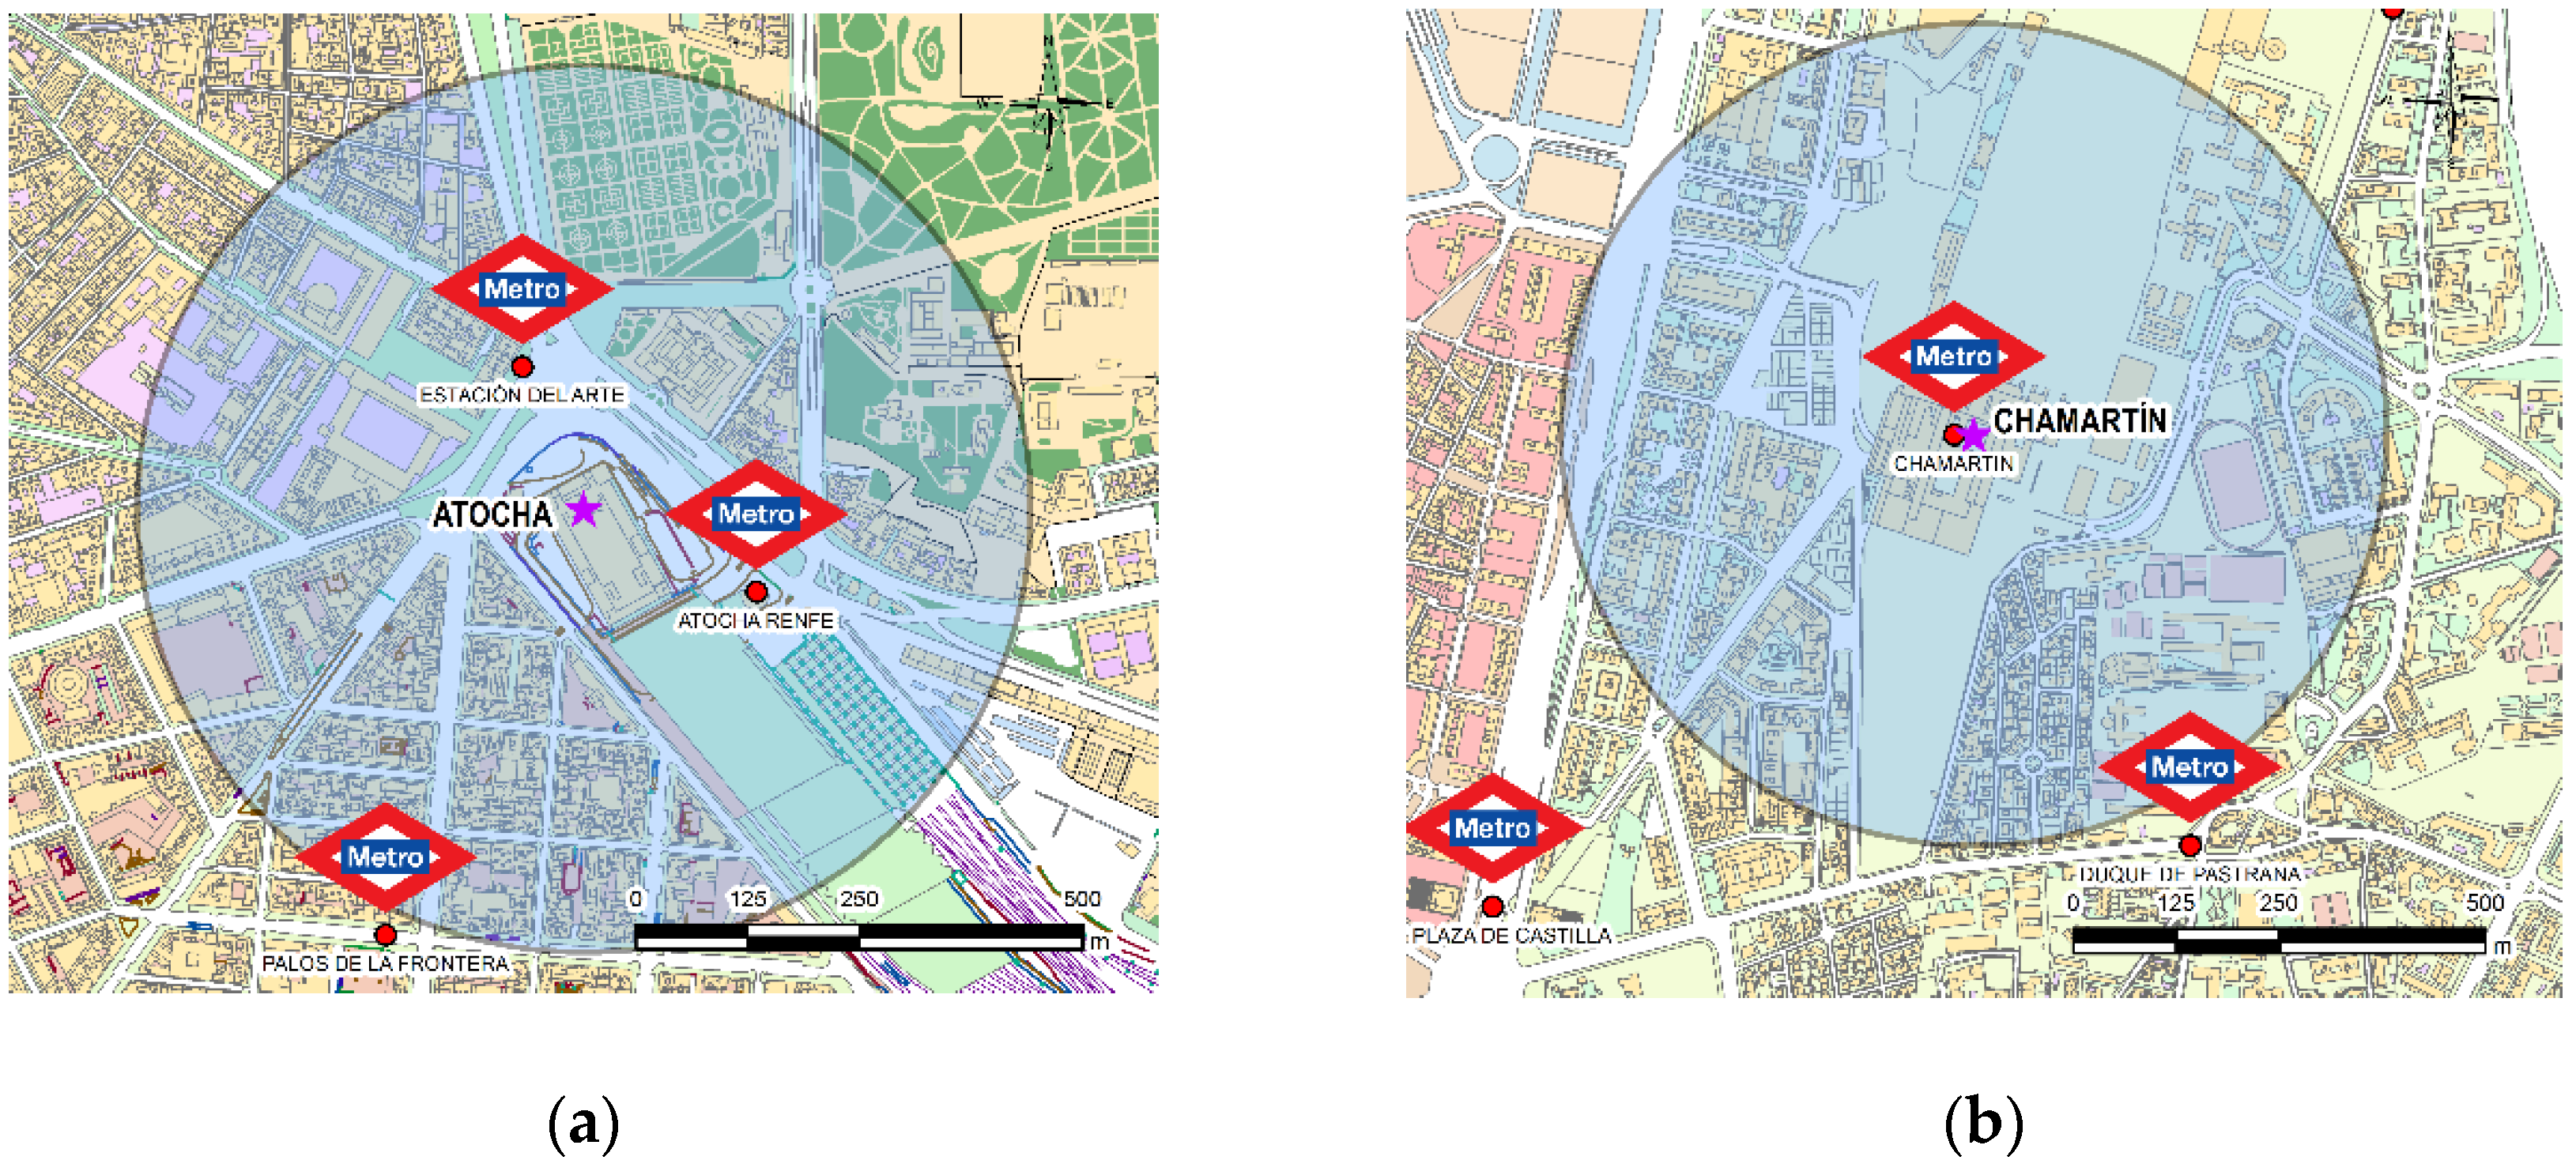
Our research aims to analyze FFCS demand in the station’s surrounding areas. Based on the results obtained in 2014 by Hermann et al. [
7], which revealed (from the user point of view) a maximum tolerance distance of 500 m towards an available FFCS car and circular buffers of 500 m around the stations of Atocha and Chamartín have been defined.
Figure 2 shows the circular buffers of 500 m around the stations of Atocha and Chamartín.
Our research methodology was based on scraping FFCS APIs in order to process the demand information. Car-Track was the platform designed in the research for the data acquisition. Car-Track gathered the latitude, longitude, battery level, address and car-id of all available cars (those that are free and can be rented) every 30 s. This data was stored in a Cassandra database, which offers high availability and throughput. While data were acquired for a more extended period of time, a time period of two weeks (from 12th March 2018 to 25th March 2018) was selected for analysis in this paper. These two weeks were selected as a sample, because the pilot phase of the platform had been overcome and no special events took place during the period (no holidays, no pollution protocols, etc. Additionally, from a meteorological point of view, they were not rainy days. The data were captured from the public data available on the websites of two of the three free-floating carsharing operators in Madrid: Car2go and Emov, capturing more than 60% of the FFCS in Madrid by then. This paper analyzes a pre COVID-19 scenario for FFCS in Madrid and authors are conscious of the mobility pattern changes introduced by the COVID-19 pandemic, especially for carsharing. In any case, the sample selected aims to represent the level of FFCS demand at rail stations in a pandemic-free period.
Once the data set was obtained, FFCS cars, located in the buffers of 500 m of the rail stations, were extracted. In order to study, the level of FFCS availability, density of available cars per km2 was calculated in the two buffers and compared to the FFCS density in the rest of Madrid’s neighborhoods. Districts are the city’s administrative spatial units. Each district is divided into two or more neighborhoods and the neighborhoods were chosen as territorial units for density comparison with buffers around the station. The municipality of Madrid is made up of 21 districts, which are at the same time divided into an average of six neighborhoods each. There are almost 50 neighborhoods within the FFCS service areas, most of which belong to the seven districts inside the Central Almond of the city. All available FFCS cars in Madrid districts were compared during these two weeks, taking into account the effective areas for street parking. Districts and buffer areas have been corrected by discounting those zones where street parking is not available (parks/gardens, train tracks, etc.). For example, the Retiro neighborhood includes the biggest park in Madrid (Retiro) and it is quite close to Atocha station, but a great proportion of this area cannot be used to park, so this green area should be discounted for the estimation of FFCS car densities.
After the study of densities, the origin and destination of FFCS cars parked near the station have been studied. Neighborhoods were also identified as the units of origin and destination of trips. The process of identification of trips was very complex and needed to establish some hypothesis. A lack of information about a car’s availability on the operator’s website usually means that a trip is underway, and origin and destination can be identified by the ID of the FFCS vehicle. However, there are exceptions that may be due to other reasons. Sometimes cars are unavailable because someone has booked them without making the trip. Other times unavailable cars are undergoing charging, maintenance or cleaning operations. Web system connectivity problems may also cause the car to be temporarily out of service. In order to obtain the most similar information to real trips, data have to be cleaned. At the first stage, web connectivity problems were detected and deleted, and afterwards, booking without a trip were identified. Bookings consists of all the records in which the car is unavailable, whether a trip takes place or not. In a second stage, the bookings with no movement (the origin and destination neighborhoods are the same) and whose battery consumption is null were separated to identify only real trips. This group consists of those bookings that comply with the following conditions: They either start and end in different neighborhoods, the battery level at the end of the trip is lower than the initial battery level, or both. An excessive duration of car unavailability was a criterion to identify false trips: Staff trips for charging or refueling, trips for maintenance and cleaning tasks or relocations. These movements were discarded. According to the data for the current FFCS systems in Madrid, cars should be charged between once a day and once every two days. Taking into account the speed of charging and the fact that maintenance tasks can be accomplished in the meantime, this is estimated to be 5% of the time. The next section shows the main results obtained with the analysis of the cleaned database.
4. Results
The availability of FFCS cars near rail stations was analyzed with a temporal and spatial approach. In the first stage, the evolution of the temporal FFCS availability was studied.
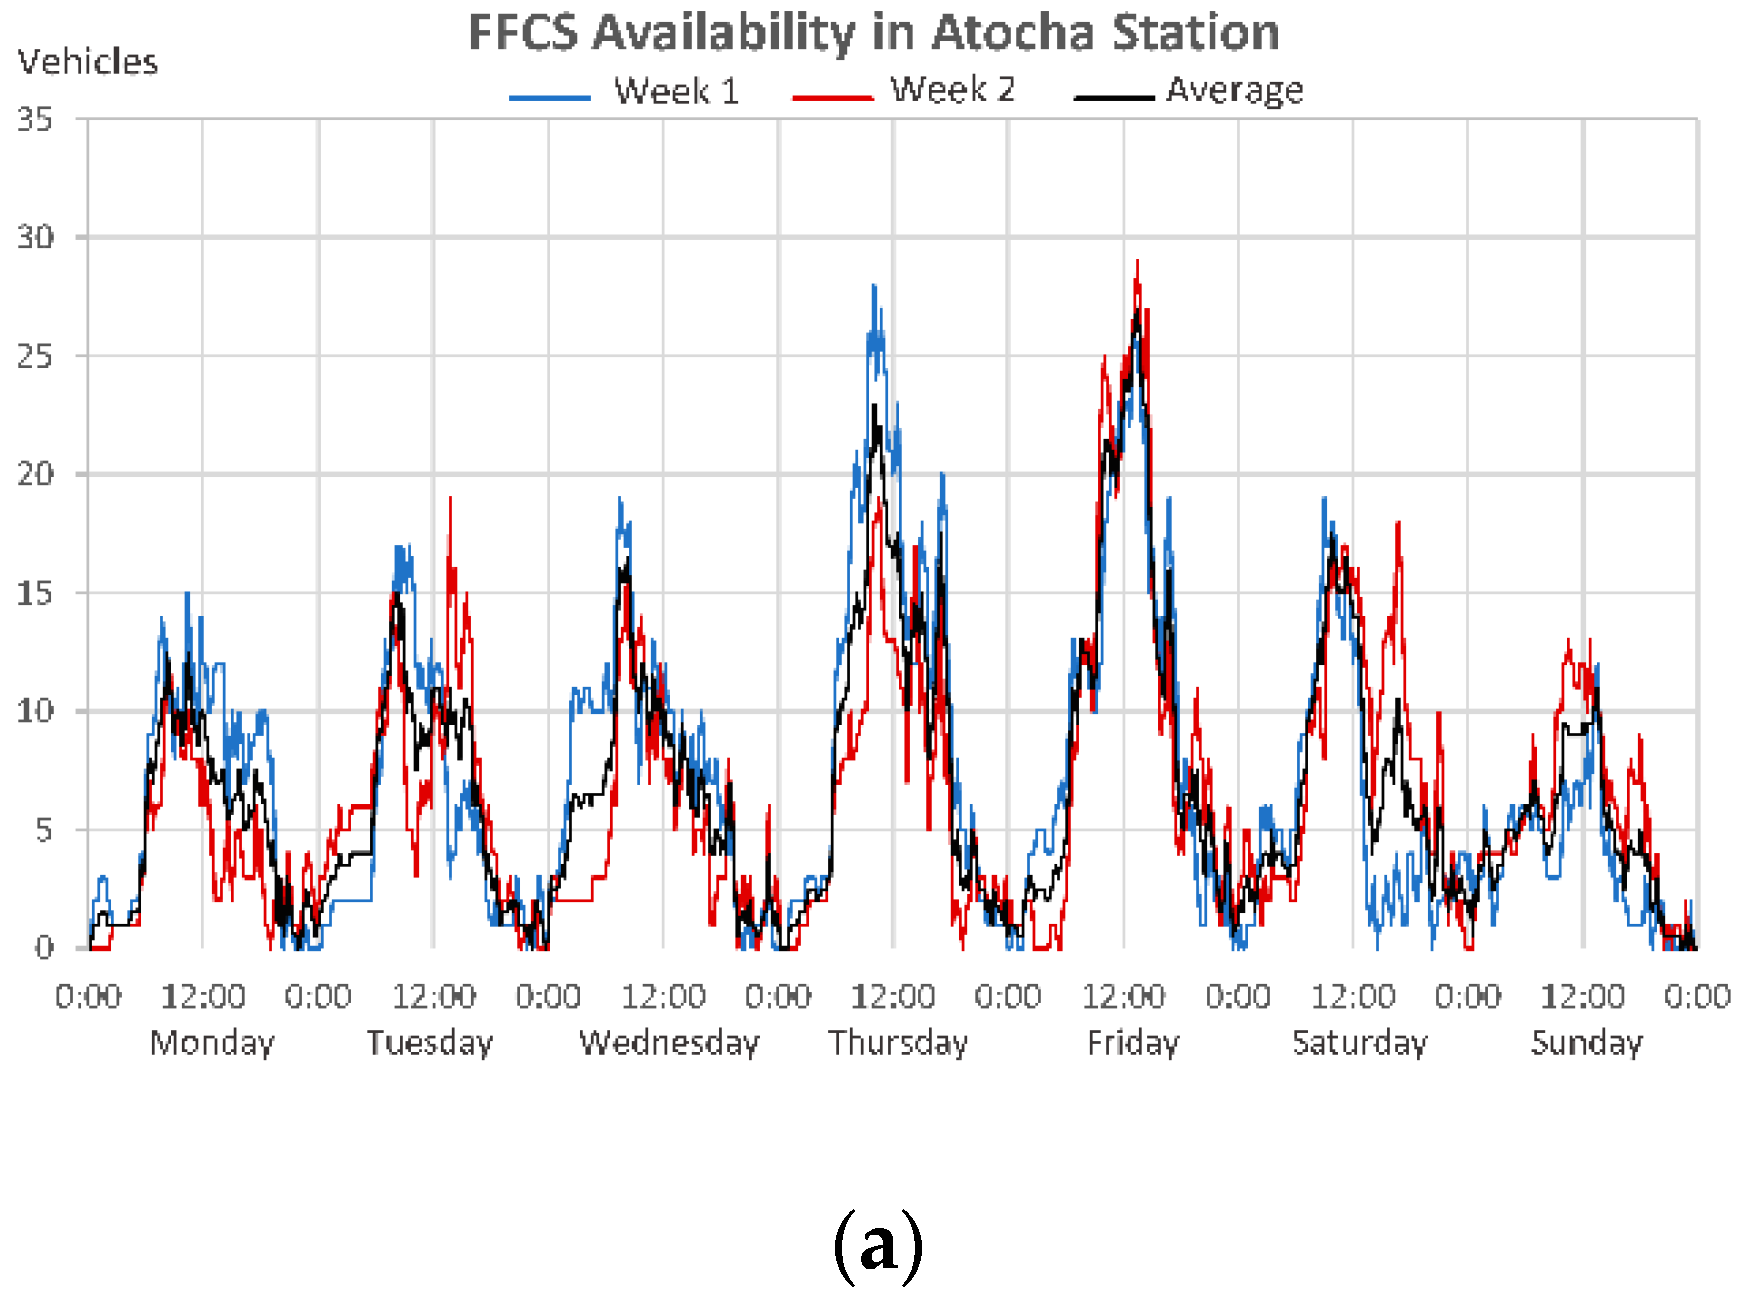
Figure 3 shows the evolution of FFCS availability in the buffers during 2 weeks (from 12 March 2018 to 25 March 2018). Comparing to the behavior of other neighborhoods in Madrid, the rail station buffers show a different pattern for weekends (including Fridays as part of the weekend period).
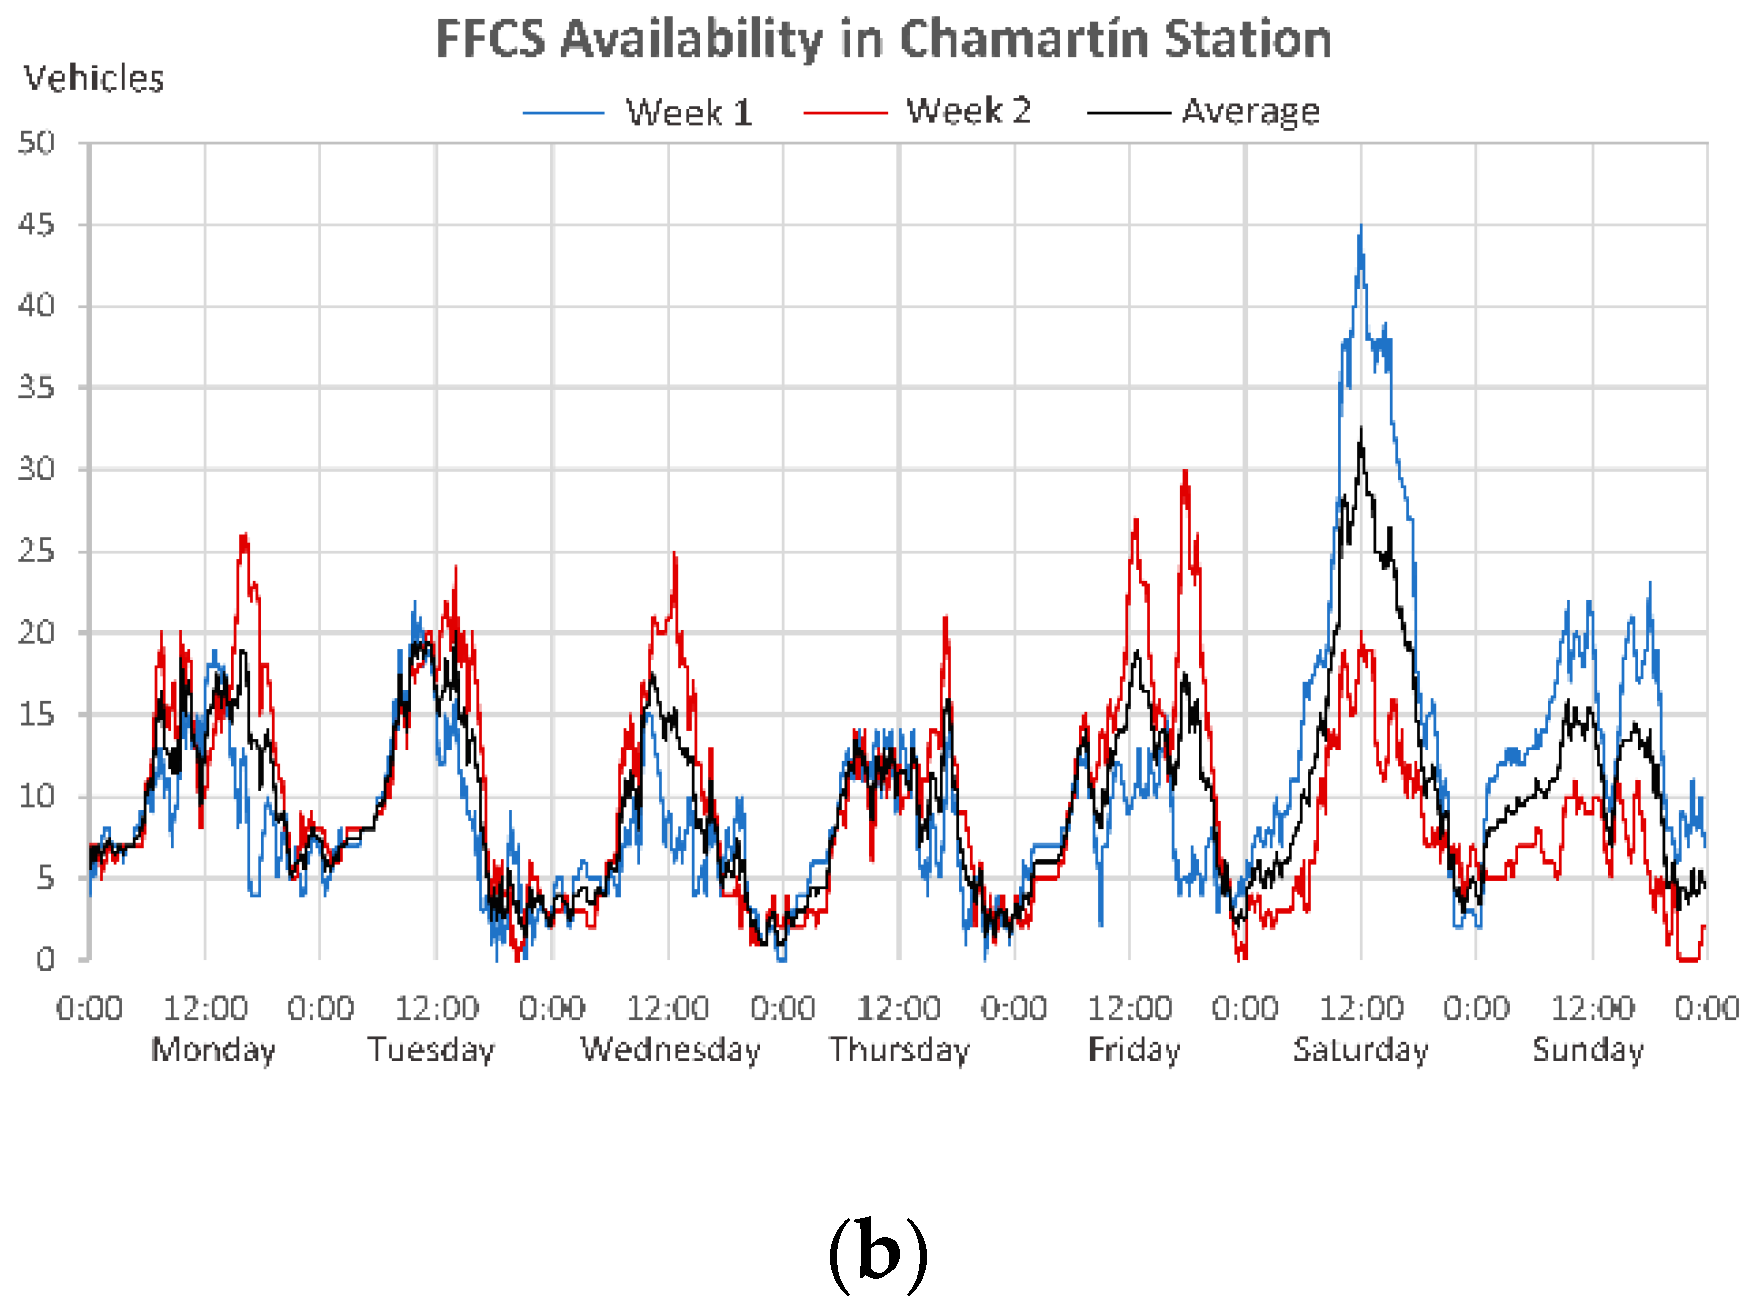
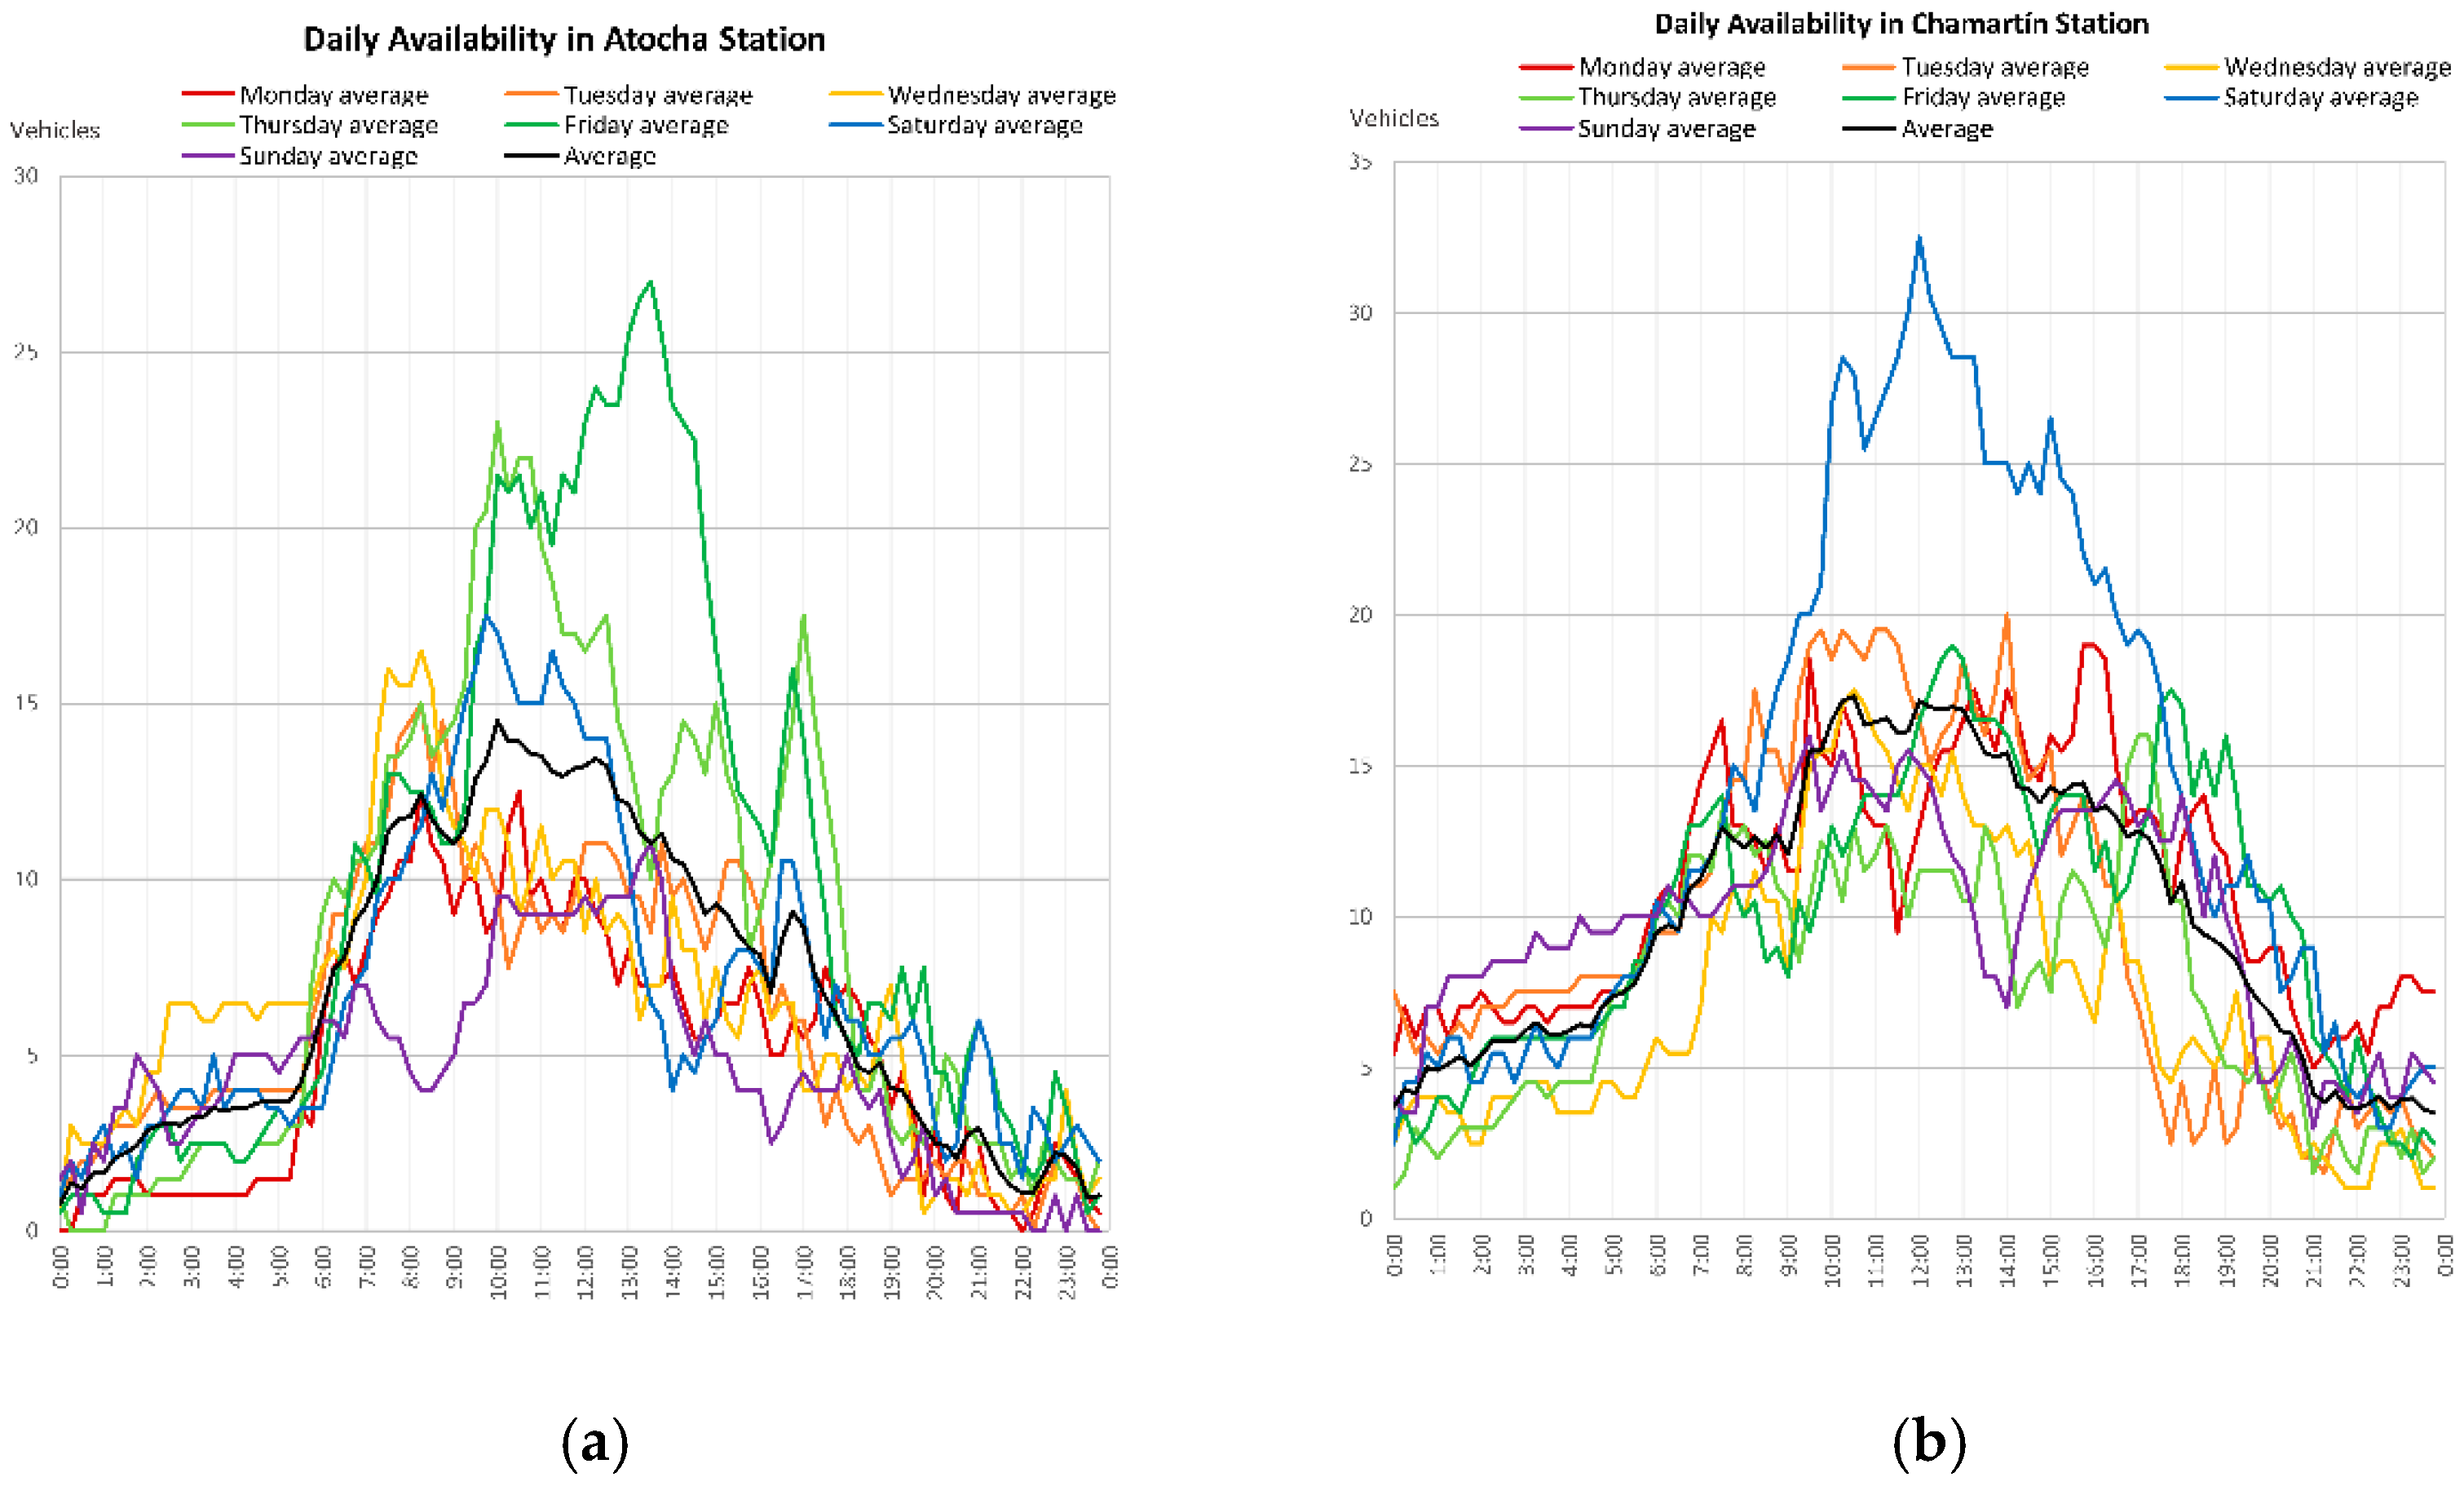
Figure 4 shows a more detailed daily evolution per day of the week in order to analyze the different daily time slots and to determine the similarities and peculiarities throughout the week. In addition, the average distribution of the entire study period (2 weeks) is also represented in black.
In Atocha station, both weeks follow the same patterns and values, resulting in Thursdays and Fridays having the largest number of FFCS vehicles, with approximate maximum values of 25 cars at peak times, while for the rest of the days those values were around 15, with Sundays having the least fluctuations.
Figure 4 reveals that it is during the morning (from 8:00 to 12:00) when more available vehicles can be found near Atocha station, however, these peak hours are displaced (delayed) in relation to public transport peak hours. This effect is a common pattern of FFCS usage in working days morning period. At noon (from 12:00 to 18:00) it can be seen how availability decreases at the beginning and increases again slightly at the end, coinciding with the time of lunch and the beginning of afternoon shifts. That behavior is typical of the FFSC Spanish usage profile, as people have lunch time between 13:30–15:00 h. Finally, at night (from 21:00 to 7:00) the availability of vehicles is constant because the use of this type of vehicle is low.
In Chamartín station, in contrast to Atocha, the peak day is Saturday. This week’s absolute lowest availability (like in) Atocha, is at night, although there are several nights, such as Monday to Tuesday and Friday to Thursday, which have a higher availability than usual for those hours. In general terms, in the mornings (from 8:00 to 12:00), there are more available car near the station as a result of the start of the working day. At noon (from 12:00 to 16:00), from Monday to Thursday, availability remains more or less constant, while from Friday to Sunday the trend is completely different.
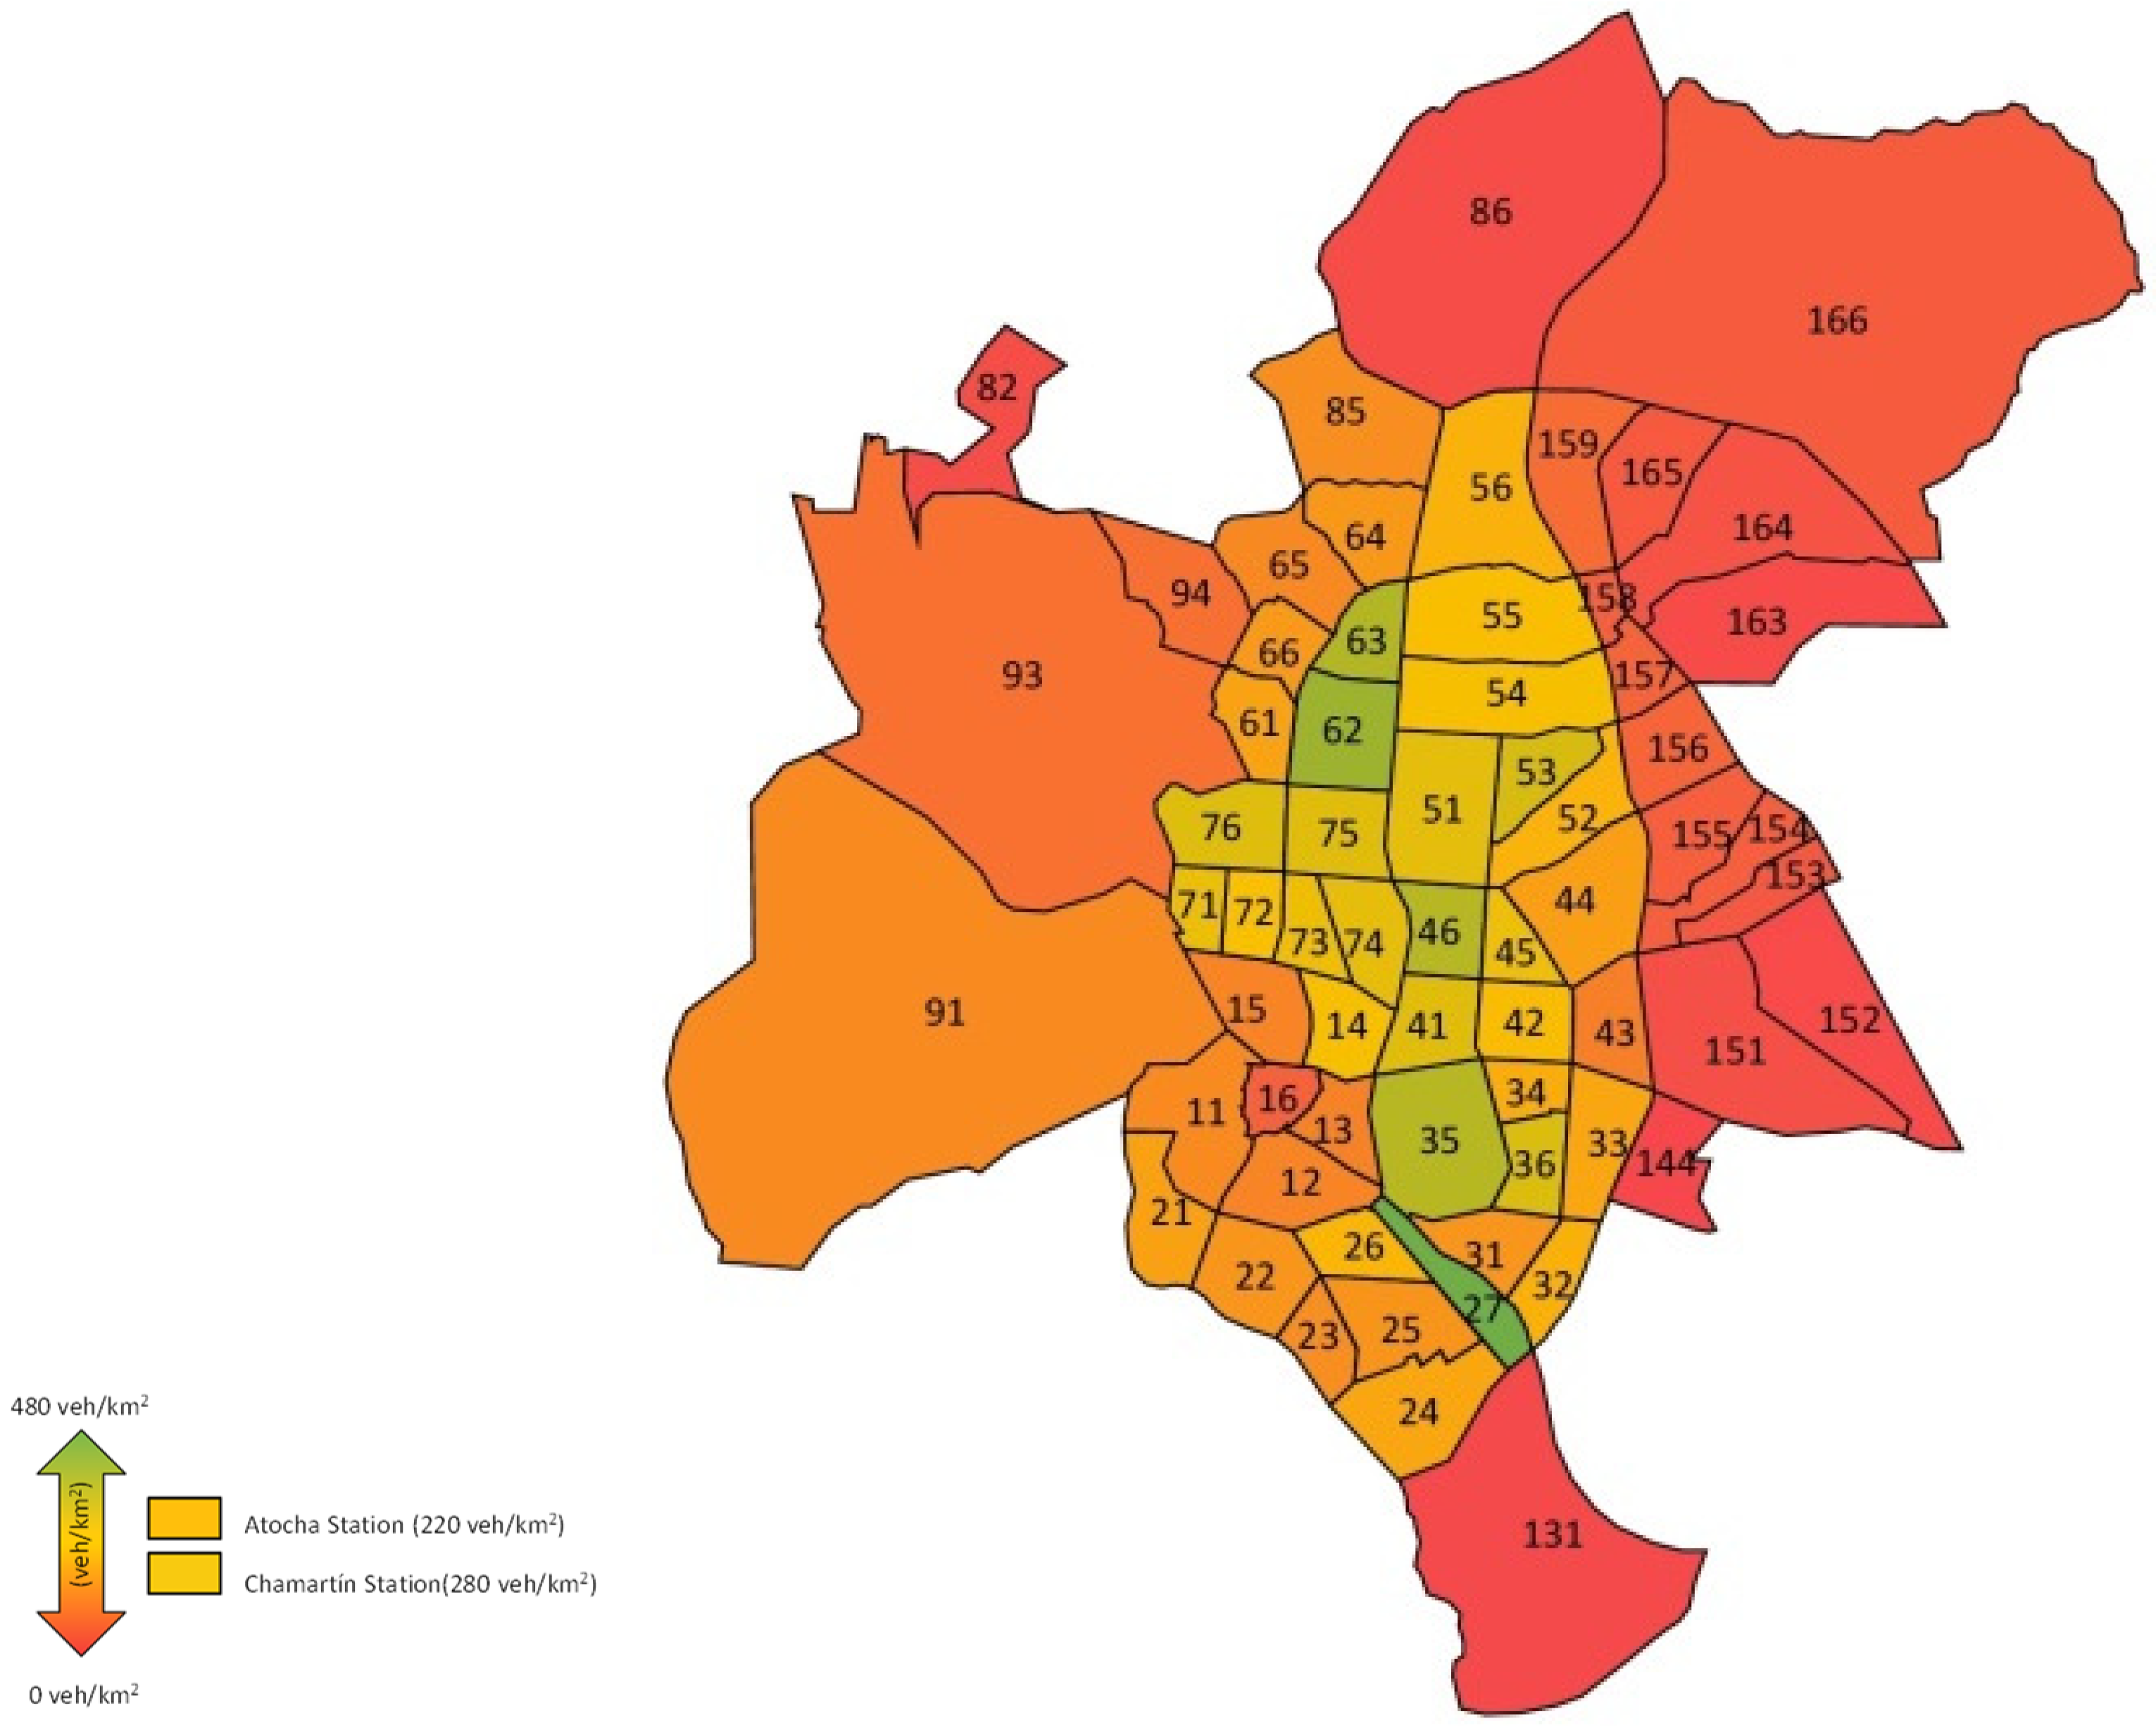
In order to study the density of FFCS available cars, all the neighborhoods in Madrid were compared during these two weeks, taking into account the effective areas for street parking. District and buffer areas have been corrected by discounting those zones where street parking is not available (parks/gardens, train tracks, etc.).
Figure 5 shows the results of this comparative study per district. Neighborhoods with green color are revealed like the ones with the highest FFCS availability in Madrid and are located in the city center, while the red color denotes the lowest availability and corresponds to neighborhoods located in the surroundings. The access to street parking is also a key factor to rent a FFCS car: Green zones are usually provided with more street parking areas than the red ones. The buffers of Chamartín and Atocha are located at the 13th and 23rd positions of a ranking of 66 Madrid neighborhoods, revealing that they are areas of considerable FFCS demand. This fact backs the idea of recharging electric vehicles at stations using the rail network. This technical solution (called “Ferrolinera”) has been designed by ADIF and it should be noted that ADIF has registered the Ferrolinera mark under application M2965746-6 of the Spanish Office of Patents and Trademarks. The origin of the energy is a railway catenary, which is powered by an electric traction substation. In every true kilometer there is a point of connection to the catenary and this point feeds a power converter, which can be connected to the Ferrolinera of ADIF, having a storage module that focuses the energy from the electric breaking of trains. A pilot experience has been successfully developed by ADIF in a high-speed station in Málaga (María Zambrano Station).
After the study of densities, the origin and destination of FFCSs parked near the station has been analyzed. However, in this case, station-centric buffers could not be established, so the data to be processed, on the one hand, correspond to the neighborhoods near the stations. As showed in
Figure 6, specifically for Atocha the neighborhoods considered are the following: 12, 13, 26, 35, 31 and 27. For Chamartín station, the neighborhood 56 is the origin or destination of all routes.
Once the corresponding data has been selected from the dataset, it has was analyzed in regards to which are the most frequent origins and destinations for trips with a node in the rail station area (
Table 1 and
Table 2).
Table 1 shows the Origin and destination district of the FFCS cars available in Atocha area. The FFCS flows have been represented as a % of trips per district that start or end in Atocha over the total trips. For example, in case of district 11, 1.49% of the FFCS trips with Atocha as destination were generated in district 11, while the 1.21% of FFCS trips originated in Atocha had district 11 as destination.
Table 2 shows the same O-D flows, but considering Chamartín station as a reference node.
First of all, it can be observed how, in general, regardless of the neighborhood, they all have a similar number of trips in terms of origin and destination, that is, that approximately the same number of cars come and aim for the same neighborhood. Secondly, it can be seen how the vast majority of journeys take place through the most central neighborhoods and close to Atocha station, between neighborhoods 21–56 (in a more greenish tone).
As
Table 2 shows, the results are very different from those obtained for Atocha, although it does maintain the trend that the number of vehicles from a neighborhood are very similar to those that are in the destination of that same neighborhood. In Chamartín, the main trips to/from the station are between neighborhoods 51–56, as well as 85—that is, the neighborhoods that are located in the same district (05 Chamartín) and the neighborhood La Paz. This fact shows how most trips take place in the vicinity of the station and mainly to areas where work activity is high, such as in
Cuatro Torres Business Area or
La Paz Hospital. It can be said that in both stations there is an unexpected phenomenon: The areas with the greatest FFCS demand to or from the stations are close to the station, or even coincide with the neighborhoods which the stations are located. For this reason, the durations of those journeys have been estimated and analyzed in order to determine whether the average travel times are consistent with the distances travelled.
Table 3 and
Table 4 below show the average times and typical deviations of trips to the most frequent areas at both stations. The first one corresponds to Atocha station, while the second to Chamartín station.
The results show that the average travel time is a period between 20 and 30 min, depending on the distance of the trip (i.e., those trips between somewhat farther neighborhoods are closer to 30 min while trips between the adjoining neighborhoods are closer to 20 min). In addition, typical deviations are not more than 20 min, which shows that common travel on such services is relatively short.
Two main results can be derived from the web-based data analysis in the city of Madrid. First of all, the high demand of FFCS services near rail stations despite the low available on-street parking. Despite the good accessibility to these rail stations in in public transport, FFCS services are still being used to reach the stations. This fact confirms the idea of FFCS complementing public transport instead of replacing it. Secondly, the origin and destination of these FFCS trips correspond to the closest rail stations districts and the durations of those journeys have been analyzed in order to determine whether the average travel times are consistent with the distances travelled. Effectively, the majority of trips are linked to the closest districts, which also have a good connection in public transport with the stations. Before starting this research, the authors expected a different profile of FFCS trips from/to the central station: Longer trips linked to city districts located outside of the Madrid Central Almond. These key districts were expected to have a poor public transport connection to the stations, but the web-based data on FFCS flows reflects another scenario. Obviously, this research has limitations as the period of data collection should have been longer (taking into account seasonal variations and the total number of FFCS operators), but previous literature also shows similar types of conclusions.
These results feed the discussion on the role of FFCS systems in the public transport systems. This role seems to be a complementary one, instead of a private car substitution role. Public transport must continue to be the spinal cord of the urban transport system in order to reduce congestion and pollution, but can be complemented with other clean mobility forms. The idea of sharing trips together with sharing clean vehicles should also be promoted. Favoring the access of electric vehicles to the rail stations, through recharging zones, can be a good measure if a clean and efficient public transport is simultaneously promoted by policy makers.
5. Conclusions and Policy Recommendations
Collaborative mobility is changing the urban scenario of public transportation in big metropolitan areas. The boom of the FFCS systems and the electric cars reveals small changes in the user behavior that needs scientific attention. The urban transport system cannot be studied by splitting up transportation modes and the urban rail station, as an intermodal transport hub should be adapted to new vehicles and new collaborative user behaviors. The innovation project “Ferrolineras” developed by ADIF has demonstrated that some urban railway stations could become an important link of the electro-mobility chain within the city. In this context, electric FFCS systems can take advantage of this innovative solution, using the parking zones of the station as recharging points. A FFCS demand study was necessary to make a proposal with this innovative solution at stations. The Madrid case study has been a suitable example to analyze as all the FFCS systems implemented are based on electric cars.
Privileged access to street parking has been revealed a key issue for the development of FFCS systems. The admissible distance for the FFCS users to walk in search of an available car (500 m, according to European studies) can condition the market share of the FFCS. In this paper, buffers of 500 m around the two main rail stations of Madrid have been analyzed and results shows how these two circular areas are in the top of FFCS density ranking. FFCS is demanded at urban rail stations and providing more parking spaces at stations could increase the use of these systems. At the same time, the access to the rail station for electric private cars can be promoted offering them “electric parking” as recharging points. For example, the current size of one of the parking lots of Atocha (P4) allows for the installation of 42 recharging points and 22 conventional parking ones. Part of the recharging points can be fixed only for FFCS users and the rest for private electric cars. This approach will promote the development of one of the largest electric vehicles recharging infrastructures, contributing to the demand for electric vehicles, and not only for electric FFCS. The same type of project can be developed in Chamartín Station.
Obviously, the authors recognize that this research has limitations and is only the first step of a project that needs a business plan and a sound demand study. Additionally, further research on the origin-destination FFCS flows is needed to analyze the movements of the cars in the rail station buffers. FFCS use for short distances and even between further O-D where a high quality of public transport is offered should make transport policymakers think about a more efficient and social equitable use of the urban transport system. FFCS role seems not to be focused on private car substitution but on a public transport complementary role. That means that local public administrations should promote shared trips on private cars too and not only the sharing of vehicles. Local parking regulation could also favor vehicles used for shared trips as a first step to support the sharing behavior.
Parking policies are a key issue to promote the trip and vehicle sharing behavior. Parking lots at rail stations can also have an important role in the urban transportation system of a city. Research on this topic could contribute to improve the sustainability of new smart cities, being a good example of circular economy as currently high-speed trains energy dissipates into heat if there are no reversible substations in the catenary network. Investments on public transportation should promote synergies among different transport modes and the research presented in this paper is a good example of how collaborative and circular economy can interact.
Finally, future research should also concentrate in the FFCS demand changes generated by the COVID-19. Due to the required social distancing in the current scenario, the image of car sharing and public transport has been seriously damaged. As this research analyzed pre-COVID data, new post-pandemic data should be analyzed in order to quantify the level of demand recovery and to recommend successful measures to again attract users.


