Article

Cell-Cycle Synchronization Prior to Radiotherapy: A Mathematical Model of the Use of Gemcitabine on Melanoma Xenografts

by
Frederika Rentzeperis
1,2,*,
Benjamin Coleman
1 and
Dorothy Wallace
1
1
Department of Mathematics, Dartmouth College, Hanover, NH 03755, USA
2
Icahn School of Medicine at Mount Sinai, New York City, NY 10029, USA
*
Author to whom correspondence should be addressed.
Submission received: 6 December 2023 / Revised: 16 January 2024 / Accepted: 18 January 2024 / Published: 4 February 2024

Abstract

:
Radiotherapy can differentially affect the phases of the cell cycle, possibly enhancing suppression of tumor growth, if cells are synchronized in a specific phase. A model is designed to replicate experiments that synchronize cells in the S phase using gemcitabine before radiation at various doses, with the goal of quantifying this effect. The model is used to simulate a clinical trial with a cohort of 100 individuals receiving only radiation and another cohort of 100 individuals receiving radiation after cell synchronization. The simulations offered in this study support the statement that, at suitably high levels of radiation, synchronizing melanoma cells with gemcitabine before treatment substantially reduces the final tumor size. The improvement is statistically significant, and the effect size is noticeable, with the near suppression of growth at 8 Gray and 92% synchronization.

1. Introduction

Melanoma is a common form of skin cancer and has the highest mortality rate of skin cancers in the U.S. [1]. Radiation therapy works by inducing cellular damage and thus has the potential to damage normal tissue [2]. Historically, melanoma has been deemed a radioresistant tumor [3,4]. Radiation is used when surgery is not possible and sometimes in combination with other therapies [5,6].
To proliferate, cancer cells progress through the cell cycle, some stages of which are known to be more sensitive to radiotherapy [7,8,9,10,11,12,13]. A variety of drugs are known to produce cell-cycle arrest in tumors, resulting in the synchronization of the cells in a particular stage of the cell cycle [14,15,16,17]. By administering a synchronizing drug to increase the proportion of tumor cells in a radiosensitive stage of the cell cycle, more cells may die from radiotherapy than in an unsynchronized tumor. As such, cell-cycle synchronization prior to radiation treatment is regarded as a potential therapeutic target, which has been explored in several studies [18,19].
For example, cell survival from radiotherapy was lowest during mitosis and late G 1 to early S phase in HeLa cells, a cervical cancer cell line [20]. Otani et al. carried out a similar study, exposing various human cell lines, including HeLa (cervical cancer), HCT166 (colorectal cancer), PANC-1 and MIA PaCa-2 (pancreatic cancers), MG-63 (osteosarcoma), and B16BL6 (melanoma), to fixed doses of radiation [19]. PANC-1 and MG-63 both showed some increased susceptibility to radiotherapy during the S phase, but this was not statistically significant. B16BL6 was uniquely radioresistant among the cell lines tested and at high doses of radiotherapy showed significant susceptibility in the S phase relative to other cell-cycle phases. The remaining cell lines were highly radiosensitive, with all cells dying at moderate doses of radiation, and they did not show clear susceptibility in a given cell cycle stage.
An observed improvement in radiation response, even if statistically significant, may not make a big enough difference to be worth pursuing in a clinical trial. Predicting a likely outcome requires a quantitative approach. Some attempts have been made to quantify aspects of this phenomenon using mathematical models [21,22,23].
The mathematical model used here to investigate cell-cycle effects on radiosensitivity is constructed in a nested manner to take advantage of monolayer, spheroid, and xenograft data, based on the work of He et al. [24]. In some studies, these three experimental modalities are investigated simultaneously, although this is rare [25]. Instead, the mathematical model here relies on a series of experiments on melanoma cell lines reported in the literature.
A three-dimensional, or spheroid, cell culture is an important intermediate step between monolayer and xenograft models [26,27,28,29,30,31,32]. To represent a spheroid culture, the model used in this study retains the parameters for the cell cycle determined from the monolayer experimental data and adds quiescent and necrotic compartments. In addition, the model incorporates the cytokine, tumor necrosis factor alpha (TNF- α ), which is produced by the necrotic core and induces apoptosis in proliferating cells as described by Wallace et al. and He et al. [24,33]. Spheroid growth data are taken from Browning et al. [34].
The xenograft model retains the features and parameters of the spheroid model, adding in angiogenesis and its dual roles of providing nutrients and removing cellular waste. Vasculature grows in the model in response to vascular endothelial growth factor (VEGF), produced by quiescent and proliferating cells in response to TNF- α . In addition to delivering nutrients, vasculature removes waste and clears both TNF- α and VEGF. The full model is explained in detail by He et al. [24]. Xenograft control data are taken from Dorasamy et al. [35].
Radiation treatment is modeled after the experiments of Otani et al., in which gemcitabine, a clinically used anti-cancer drug, induces cell-cycle arrest during the early S phase in the B16BL6 melanoma cell line [19]. After cell-cycle arrest, various doses of radiotherapy were administered, as measured in Grays (Gy), the standard unit of ionizing radiation. An in vitro analysis showed higher radiosensitivity of cells in early S-phase as compared to the other cell cycle stages at a dose of 8 Gy. The in vivo study compared a single dose of radiation given to B16BL6 xenografts in mice with and without prior gemcitabine treatment. This experiment resulted in regrowth of a smaller tumor in the gemcitabine-synchronized xenograft tumors.
One clinical study compared the radiation treatments of 32 Gy in 8 Gy weekly fractions versus 50 Gy in 2.5 Gy daily fractions for melanoma. Not much difference in response between these dosage patterns was observed [36]. For this reason, and because 8 Gy produced more noticeable results in vitro, our numerical experiment administers 24 Gy in 8 Gy weekly fractions for a total of three treatments applied to the xenograft model, with and without the reported synchronization from gemcitabine.

2. Methods

Unlike most modeling approaches that seek to parameterize a model using a single data set, a nested set of models is matched to monolayer, spheroid, and xenograft data in that order. In doing so, the model leverages more experimental data and reduces the number of parameters that need to be fit at each level of the model. The linear monolayer model represents proliferating cells transitioning through the cell cycle, and it grows exponentially. This system is expanded to a non-linear spheroid model by including quiescent and necrotic cells, as well as the production and action of TNF- α via Michaelis–Menten kinetics, giving bounded growth. The spheroid model is further expanded to the xenograft model with the inclusion of growing vasculature through angiogenesis. It also incorporates the production of vascular endothelial growth factor (VEGF) by proliferating tumor cells interacting with TNF- α via the p75 receptor and by quiescent cells presumed to be hypoxic. The full xenograft model grows quickly at first, then settles into a linear growth pattern. The equations for the system are similar to those of He et al. [24] and may be found in Appendix A; a more thorough description of the parameter selection and the development of the model equations can also be found in the paper by He et al. A compartment diagram of the system is shown in Figure 1.
Monolayer data, including doubling time and the proportion of cells in each phase of the cell cycle, are used to determine the transition parameters for the proliferating cells. These parameters are retained in a spheroid model, which is further matched to determine transition parameters for quiescent and necrotic cells, as well as TNF- α production and interaction with proliferating cells. The spheroid parameters are finally lifted to a xenograft model, which is matched with tumor growth data to give the remaining parameters. Appendix B shows the parameters used for the untreated xenograft model and both submodels (Table A1), as well as the initial conditions (Table A2).

2.1. Monolayer Parameters

Linear models of the monolayer culture show spontaneous desynchronization of the cell cycle [33,37]. This is because the limiting cell-cycle distribution is the eigenvector associated to the largest eigenvalue of the system, which is given by the intrinsic growth rate, computed from the doubling time as derived in Wallace et al. [33]. This approach allows empirically derived measures to be used to calculate all transition rates for the linear monolayer model. The measurements were determined from three studies—the doubling time was taken from Liberato et al. [38], the cell-cycle analysis from Pan et al. [14], and the initial conditions from Otani et al. [19].

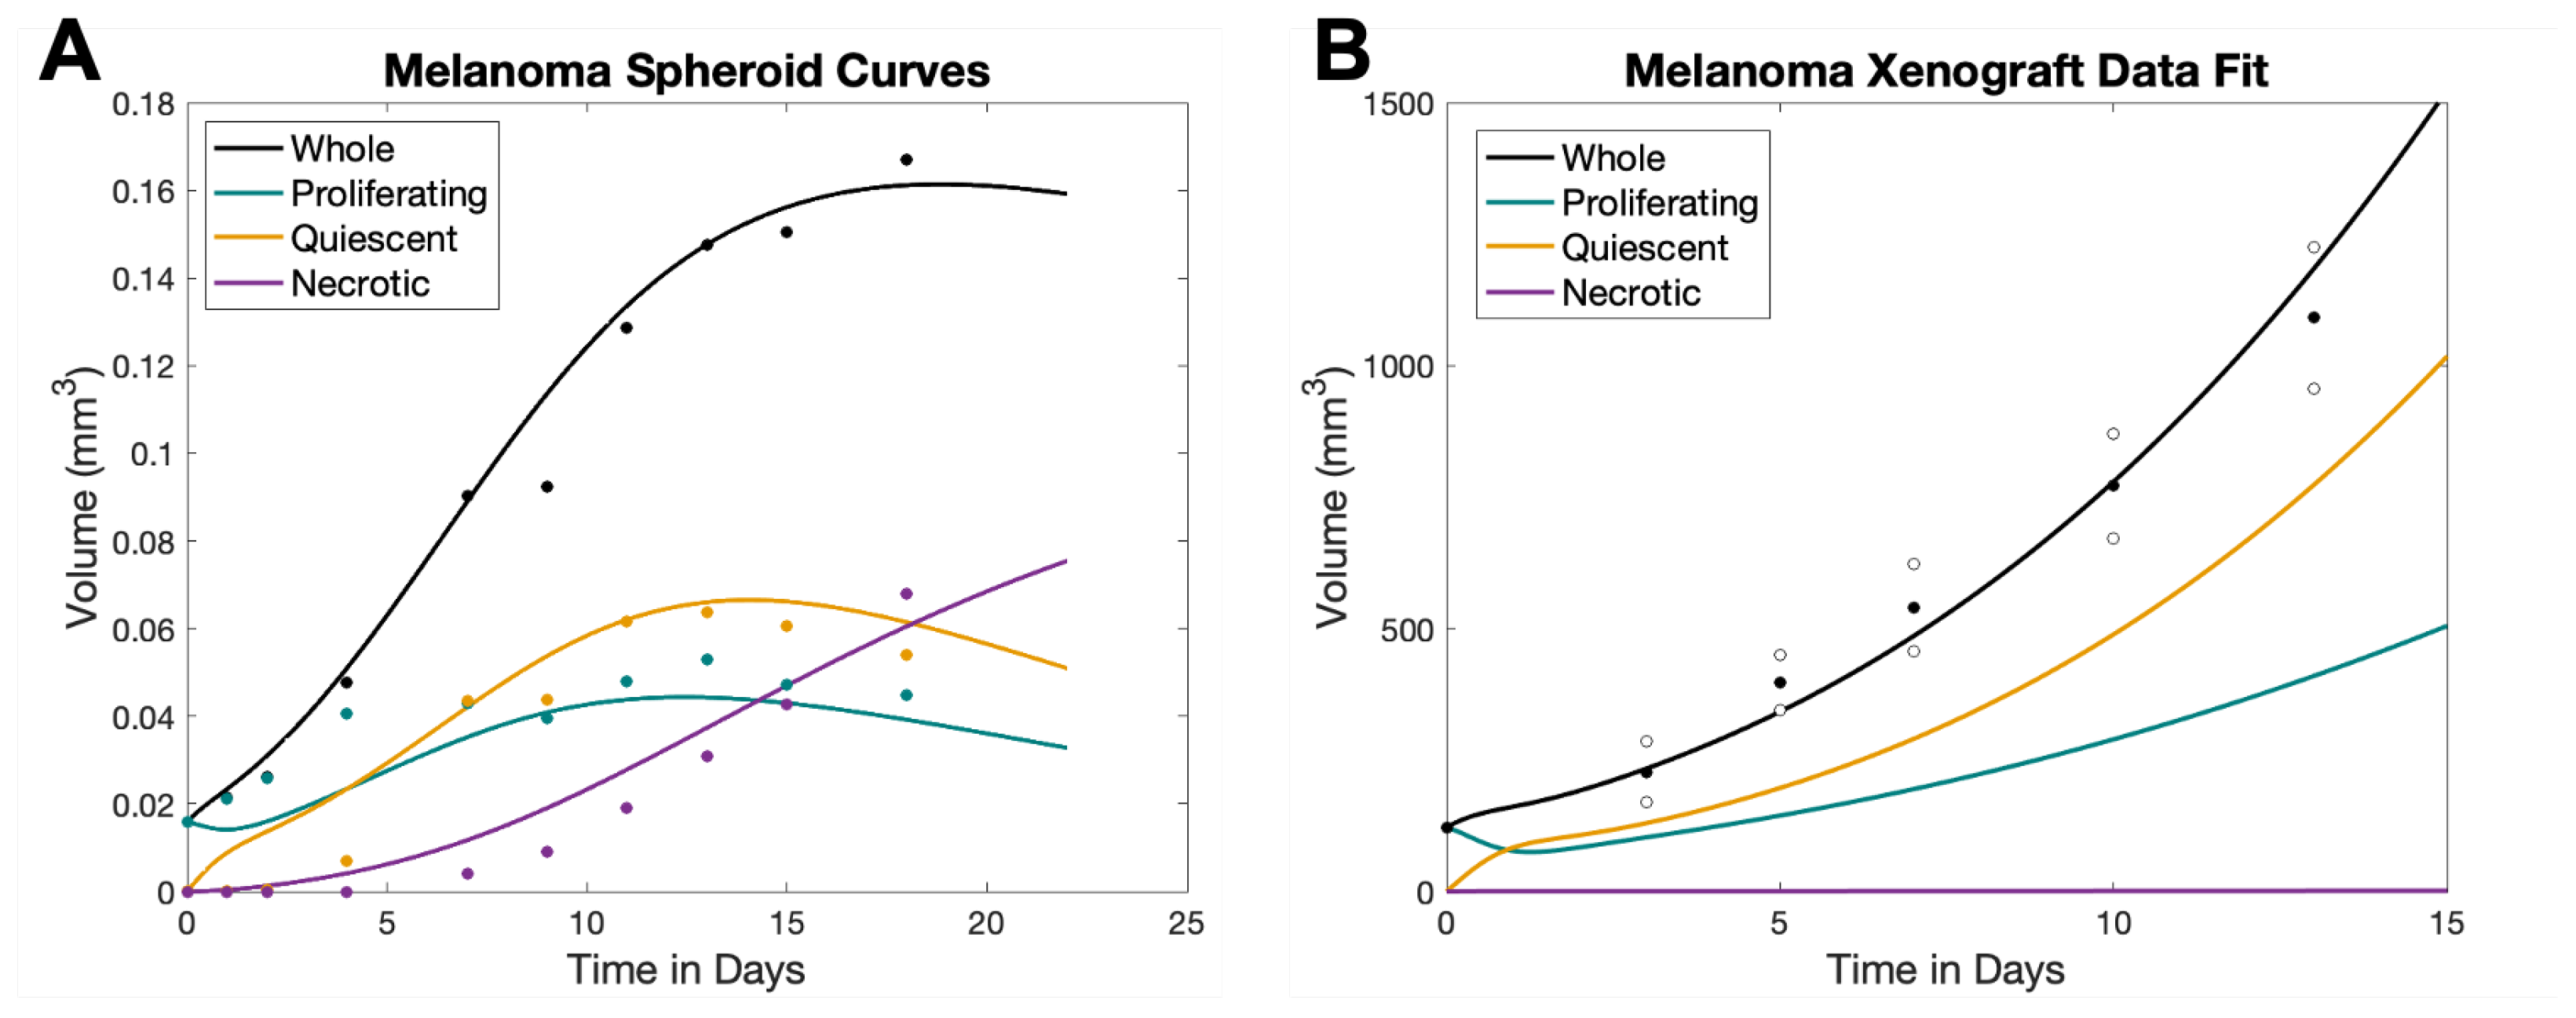
2.2. Spheroid Parameters

Spheroid parameters were derived from a fit of data from Browning et al. [34]. They took confocal images of 318 WM938b spheroids and 317 WM793b spheroids, both of which are human melanoma cell lines. The WM793b spheroids did not reach a steady state during their experimental window but the WM938b spheroids did, so the second set was selected. Additionally, they studied three different seeding densities for their spheroids (2500 cells, 5000 cells, and 10,000 cells); the dense spheroids were close to a steady state in the plots they presented, while the 2500 cell spheroids started with a smaller volume and moved toward a steady state throughout the experimental window and were thus the better choice for parameterizing the spheroid model.
The experimental measurements include R (total spheroid radius), ϕ (fraction of the radius from the center of the spheroid to the outer edge of the quiescent compartment), and η (fraction of the radius accounted for by the necrotic core). The authors provided a link to their github that includes the raw measurements of the spheroids from confocal images on experimental days 3, 4, 5, 7, 10, 12, 14, 16, 18, 21 [34]. Volumes for the whole spheroid (W), proliferative compartment (P), quiescent compartment (Q), and necrotic compartment (N) were computed, assuming that the spheroid is a perfect sphere comprised of a necrotic core, covered by quiescent cells, which are in turn covered by proliferating cells. The resulting volumes were divided by 10 9 so they would be in units of mm3 and are reported in Appendix C (Table A3). Mean volumes across the spheroids at each time point were computed, and the model parameters were manually tuned to match the data for whole volume, proliferating, quiescent, and necrotic volumes simultaneously. The match to data is shown in Figure 2A.

2.3. Xenograft Parameters

The remaining parameters for the xenograft model without radiotherapy were determined from a fit to the data in Dorasamy et al. [35]. They used A375 xenografts—a different human melanoma cell line. They stated that after 14 days of tumor growth, the xenografts attained a volume of 1090.0 ± 134.7 mm3; the MATLAB “grabit ” function was used to extract data for the remaining experimental timepoints [39]. The extracted values for mean xenograft volume and standard error of the mean are presented in Appendix C (Table A4).
It is of note that all but one of the spheroid parameters was held constant in parametrizing the xenograft; v 0 was allowed to vary because the nutrient availability in the microenvironment is expected to differ when transitioning from the cell culture to an in vivo model. Parameters were first fit manually and later refined using a genetic algorithm with 200 individuals over 200 generations. The relative mean squared error (rMSE) of the manual parameterization is 0.076709; the rMSE after the genetic algorithm is 0.03773. The plot of the final data fit for the xenograft is shown in Figure 2B. After the genetic algorithm, the model curve for the whole tumor volume fits within the SEM boundaries for each time point.

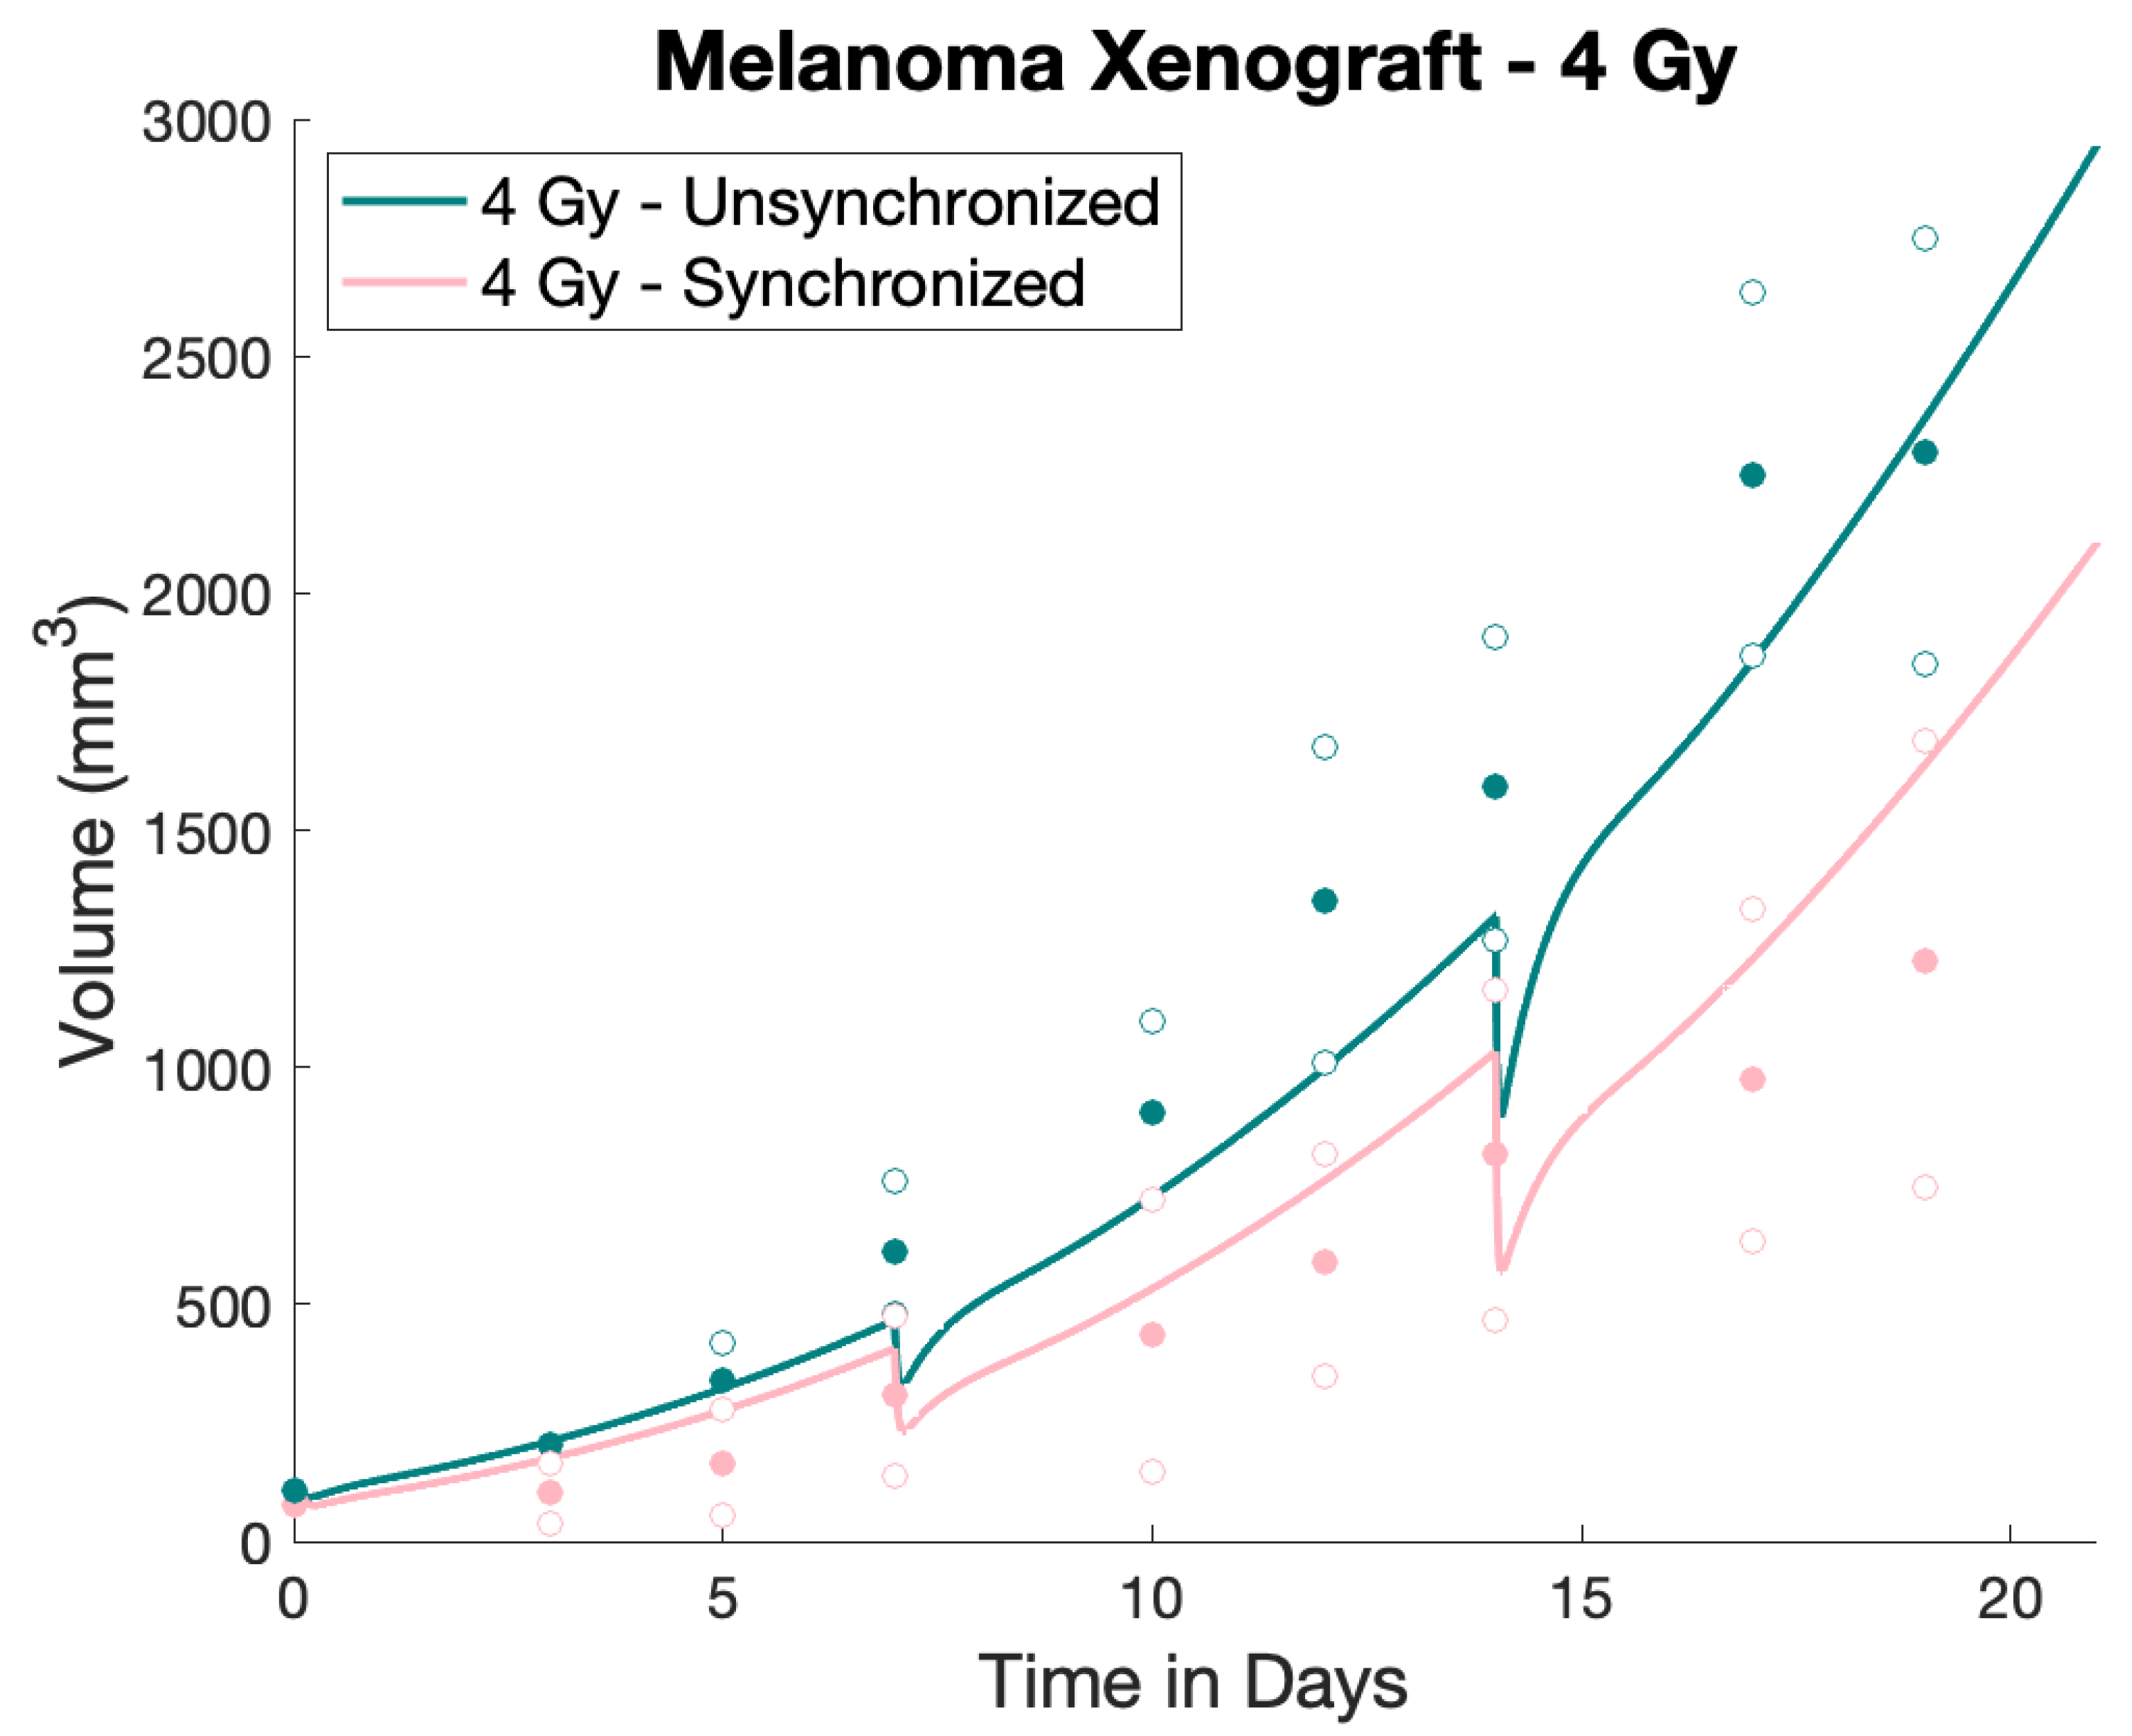
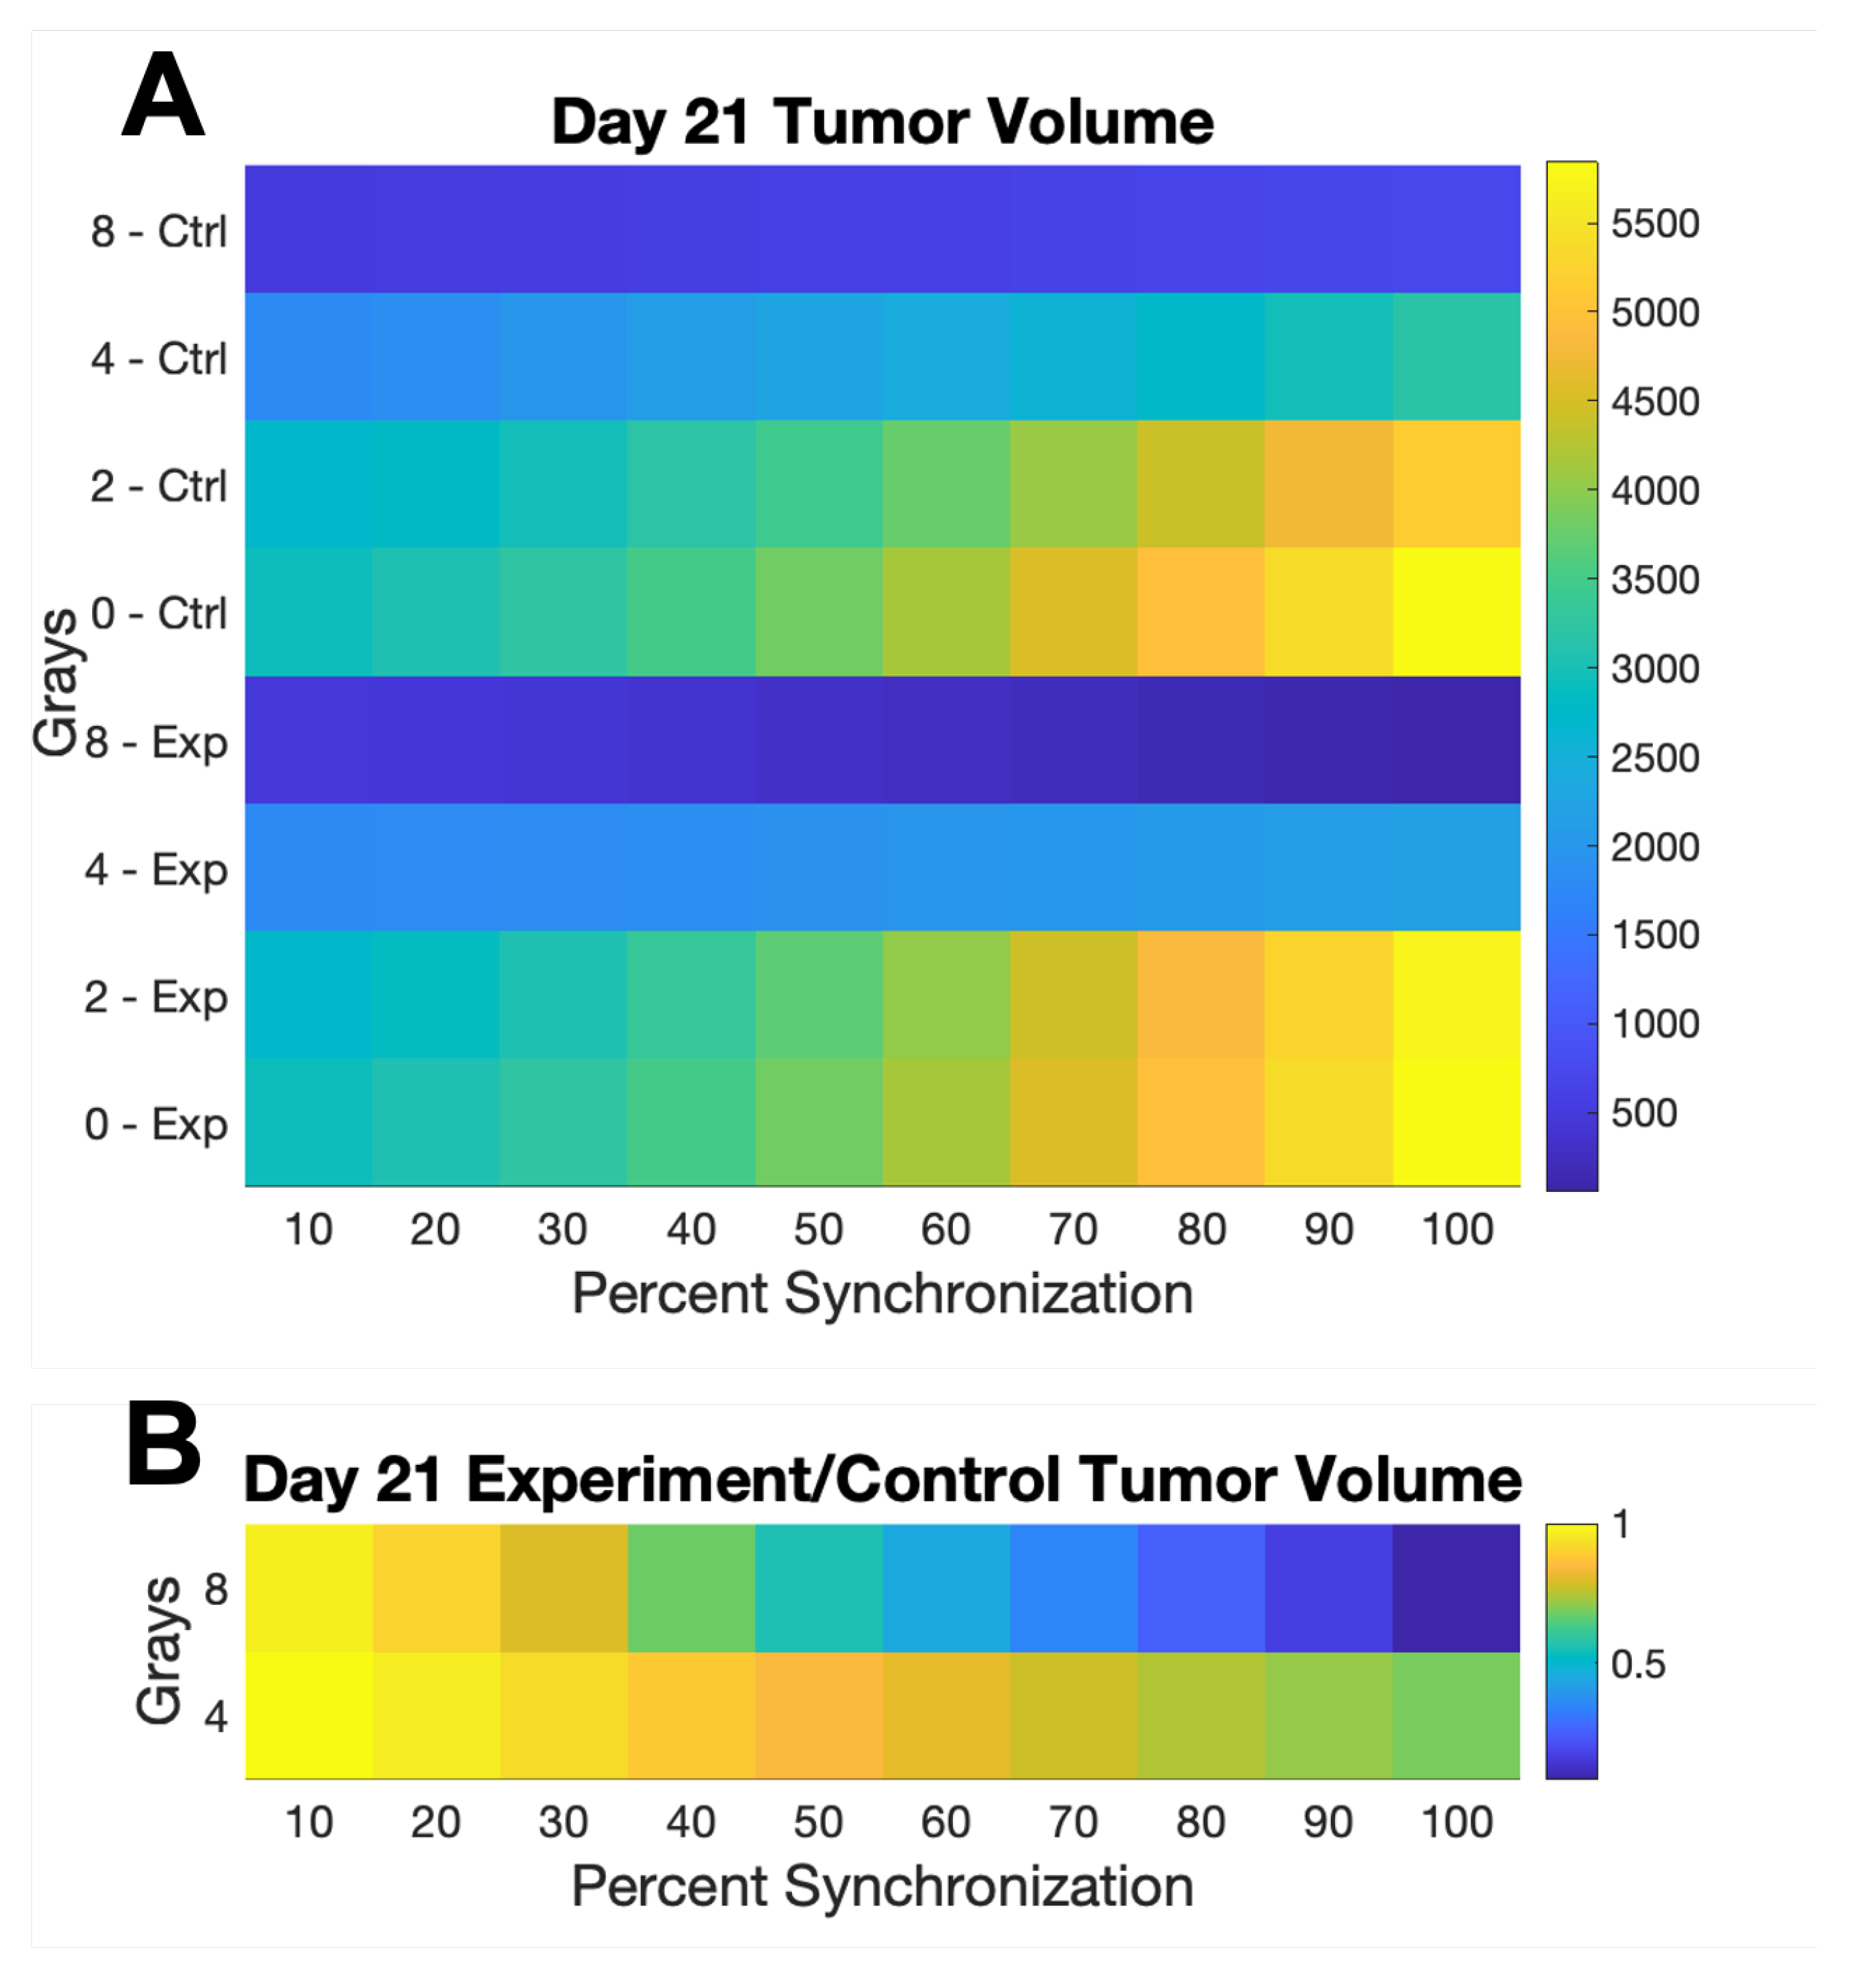
2.4. Numerical Treatment Simulations

There are two elements to the treatments administered by Otani et al.: cell-cycle synchronization in the S-phase by the administration of gemcitabine and irradiation with varied Grays (Gy) of ionizing radiation. Radiotherapy is simulated at 2, 4, and 8 Gy according to the in vitro cell survival measurements for the various compartments, extracted from the figures in the work of Otani et al. using MATLAB’s grabit function [39]. The cell-cycle phases presented by Otani et al. are not exact—late G0/G1 is taken as G 1 in the model, retained G0/G1 as Q, early S as S, and late S/G2/M as G 2 . Table A5 in Appendix C displays the extracted values for each cellular compartment for the different irradiation levels. For the simulations, cells that die due to radiation are immediately added to the necrotic compartment, and surviving cells are reallocated based on the ratios described in Table A5. Per the experimental data from Kaeppler et al., even under 15 Gy of radiation, the vascular structure in the tumors was minimally disrupted, even with the death of endothelial cells [40]. For this reason, the vasculature compartment (V) is not reduced during radiotherapy in the model.
The experimental protocol from Otani et al. involved synchronizing the cells via an intraperitoneal injection of gemcitabine. The cells stayed synchronized for 12–18 hours, after which point they rapidly desynchronized. Mice were separated into two groups: an experimental group that received gemcitabine, followed by irradiation 12–15 hours later (when the cells were maximally synchronized), and a control group that received radiotherapy first, followed by gemcitabine 8–10 hours later to control for the possible effects of the drug. For the in silico model, the experimental group was synchronized and immediately “treated” with radiotherapy, while the control group first received radiation, followed by immediate synchronization of the cells in S-phase.
Figure 3d from the paper by Otani et al. gives us information about the effectiveness of the gemcitabine treatment in synchronizing cells in vivo. Two-photon microscopy was used to detect green fluorescing Fucci-expressing B16BL6 cells, which correspond to the early S-phase when the cells had 2N DNA content. From 12 to 18 hours post-gemcitabine treatment, all viable cells were roughly 92% synchronized in the early S-phase as determined by extracting data corresponding to the mean at 12 hours using MATLAB’s grabit function [39].
Otani et al. did not specify how many Grays the mice received, only stating that radiotherapy was administered at a rate of 0.7 Gy/min, without stating the duration of exposure. Radiation was administered 7, 14, and 21 days after tumor induction. For the purpose of the model, the tumor size at model day 0 corresponds to the size of a tumor one week after induction, so the administration of the treatment on model day 0 is the same as treating on experimental day 7. MATLAB’s grabit function was used to extract the resulting data mean and error bars for the synchronization–irradiation experiment [39].
Simulations of the experiment were run with synchronization at 92% of all viable cells ( G 1 , S, G 2 , and Q)—92% of the total cell count were moved to the S phase, with the remainder allocated to the other viable compartments based on the ratios of cells in these compartments just prior to synchronization. At 4 Gy, the curves from the model matched the data from the paper satisfactorily. Note that the starting volume was retained from the xenograft fit from Dorasamy et al., as it fell near the datapoint for the tumor volume on day 0 (one week post-tumor induction) presented by Otani et al. [19,35]. The model’s output for 92% synchronization and 4 Gy administered on days 0, 7, and 14 is shown along with the extracted data points in Figure 3.
Different levels of synchronization after treatment with gemcitabine may be present in other contexts, such as human tumors. The model was tested for various levels of synchronization at 0, 2, 4, and 8 Gy, with the final tumor size and percent of control shown in Figure 4.
With the model now parameterized, it is necessary to compare treatment with 92% synchronization at 8 Gy with treatment at 8 Gy with no gemcitabine at all as would be compared in a clinical trial. A simulated clinical trial was conducted by varying parameters in the underlying model to create 200 individuals to be assigned randomly for experimental and control treatment. One hundred of these individuals were treated at 8 Gy with 92% synchronization. The other 100 individuals were treated at 8 Gy with no synchronization (no gemcitabine). Patient individuality was simulated by varying model parameters within a 20% box about the original parameter value, using a Latin hypercube sampling system. Each simulated patient had the same initial conditions (i.e., same initial tumor size), but the variable model parameters resulted in varying the tumor growth over time. The results of this simulation with 100 patients per group are shown in Figure 5.
The resulting final tumor sizes were compared and are illustrated as a histogram in Figure 6.

3. Results

Figure 2A shows the result of matching the underlying spheroid and xenograft models to data from two studies. The spheroid model is matched to measurements by Browning et al. of the proliferating, quiescent, and necrotic compartments, as well as the total spheroid volume [34]. The model is extended to include vasculature, resulting in the xenograft model, shown with data points for the total tumor volume from Dorasamy et al. [35] in Figure 2B.
Figure 3 shows the model comparison for 4 Gy radiation with gemcitabine. The ”unsynchronized” group received gemcitabine after radiation, while the ”synchronized” group received gemcitabine prior to radiation. Data points and error bars are from Otani et al. [19]. Both treatment conditions fail to control the tumors and thus correspond to tumor growth throughout the 21-day simulation, but the synchronized treatment is more effective, resulting in slower tumor growth.
The result of varying both the radiation dose and the level of synchronization is shown as a heat map in Figure 4A. As the level of synchronization increases, the final tumor volume rises for the four control groups. This is likely because the simulation transfers cells from the quiescent compartment into the proliferating S-phase of the cell cycle. This design choice is based on the experimenters’ statement that 92% of all viable cells were in the S-phase following synchronization. The same phenomenon happens for the experimental group at 0, 2, and 4 Gy. At 8 Gy, however, higher synchronization in the experimental group leads to a lower final tumor volume. For 4 and 8 Gy, the second heat map (Figure 4B). shows the ratio of the final tumor volumes, experiment divided by control. The experiment simulation (synchronized) always corresponds to slower tumor growth than the control simulation (unsynchronized), with the best effect at 8 Gy and 100% synchronization.
An in silico clinical trial was carried out with 100 individuals assigned to the control (24 Gy radiation fractionated once weekly in 8 Gy doses) and 100 individuals assigned to the experimental condition (the same radiotherapy following 92% synchronization in the S-phase with gemcitabine). Tumor growth was suppressed in the experimental condition, as shown in Figure 5. The simulated clinical trial shows a clear difference in the outcomes for synchronized and unsynchronized treatments, seen in Figure 6. Synchronized cells had a mean final volume of 104.92 mm3, (sd = 15.45). Unsynchronized cells had a mean final volume of 466.31 mm3, (sd = 58.23). The two means are significantly different ( p < 0.0001 ).

4. Discussion

As seen in Figure 2, the model presented in this study matches the data from spheroid and xenograft experiments, building on the previous monolayer and spheroid model set forth by Wallace et al. [33]. Similar to the work of Wallace et al., the model is constructed in tiers. In each tier—monolayer, spheroid, and xenograft—additional parameters are incorporated that express the increasing complexity of the tumor environment.
The model is robust across a variety of growth scenarios. Figure 3 shows the fit of the model to experimental data under two simulated treatments: treatment with 4 Gy of radiotherapy preceded by 92% cell synchronization in the S-phase, as well as treatment with 4 Gy of radiotherapy followed by cell synchronization. The model parameters used in Figure 3 are identical to those used in Figure 2B.
The model’s versatility is made possible by its nested construction. Its three functional tiers—monolayer, spheroid, and xenograft—each layer on new model parameters, and each successive tier retains the parameters of the previous tiers. In this way, the complete 24-parameter xenograft model only involves fitting 11 parameters—the remaining 4 that were fit to the monolayer data, and the 9 that were fit to the spheroid data, are fixed. This reduces the potential for over-fitting to a single dataset.
The simulation at 4 Gy and 92% synchronization is a good match to the data in the work of Otani et al. [19]. Figure 3 shows that the 4 Gy dose is not effective at containing the tumor size, either in simulation or in the data. Humans can handle doses of 8 Gy, however, and the simulation makes the advantages of the higher dose clear. Figure 4 simulates an 8 Gy weekly treatment, which is highly effective at reducing the tumor volume when compared to the lower Gy doses. In addition, the simulations show a reduction in tumor volume when cells are synchronized before treatment.
Otani et al. reported a statistically significant difference between single versus combined radiation/synchronization therapies in suppressing the proliferation of cells in vitro. They further reported a statistically significant difference in tumor growth in vivo ( p < 0.05 ) for their small sample of xenografts. The in silico clinical trial in this study (see Figure 5) confirms the significance of this treatment schedule at 8 Gy ( p < 0.0001 ) with a larger sample of 200 simulated patients and suppression of tumor growth in the experimental group.
Table A5 in Appendix C shows the highest death rates across all phases of the cell cycle at the 8 Gy dose. Likewise, Figure 5 simulates this 8 Gy dose over 3 weeks for a tumor that is treated without synchronization versus with synchronization. The simulations confirm the results in Otani et al. [19]—a treatment schedule that includes cell synchronization before radiotherapy can help to reduce tumor growth.

Future Directions

Otani et al. found that up to 92% of all xenograft cells were found in the S-phase after gemcitabine treatment; this was only possible in our model if we allowed quiescent cells that reside in the G 0 phase described by Otani to also enter the S-phase upon synchronization. This assumption should be validated experimentally with further cell-sorting assays to determine whether quiescent cells reenter the cell cycle and arrest in the S-phase or if they are simply not responsive to gemcitabine. The model could easily be adjusted to reflect a different assumption if warranted by experimental data. The experimenters also claim that gemcitabine alone suppresses growth in vitro, although the exact method of measuring this was not given.
Additionally, a xenograft differs substantially from a human tumor, as it lacks an immune response and is induced in a mouse, which has a different metabolism and size from a human. Future work would add a simplified immune response to the system of differential equations underlying this simulation. At present, how to measure immune system parameters directly remains a quandary. The immune response would naturally enhance the effect of radiation and could possibly show tumor suppression at a lower dose of radiation, or eradication at a higher dose.

5. Conclusions

Is it worth synchronizing cells before administering radiation treatment? The simulations offered in this study support the statement that, at suitably high doses of radiation, synchronizing melanoma cells with gemcitabine before treatment results in substantial improvement in the final tumor size. The improvement is statistically significant and the effect size is noticeable, with near suppression of growth at 8 Gy and 92% synchronization.

Author Contributions

Conceptualization, D.W.; methodology, F.R., B.C. and D.W.; software, F.R. and B.C.; validation, F.R. and D.W.; formal analysis, F.R., B.C. and D.W.; investigation, F.R., B.C. and D.W.; data curation, F.R. and D.W.; writing—original draft preparation, F.R., B.C. and D.W.; writing—review and editing, F.R., B.C. and D.W.; visualization, F.R.; supervision, D.W.; project administration, D.W. All authors have read and agreed to the published version of the manuscript.

Funding

This research received no external funding.

Institutional Review Board Statement

Not applicable.

Informed Consent Statement

Not applicable.

Data Availability Statement

No new data were created or analyzed in this study. Data sharing is not applicable to this article.

Acknowledgments

The authors would like to acknowledge Heiko Enderling, who initially proposed this problem.

Conflicts of Interest

The authors declare no conflicts of interest.

Appendix A. Model Equations

Equations (A1)–(A8) as presented below were taken from Wallace et al. and He et al. and extended to include the treatment [24,33]. Figure 1 is a visualization of these equations.

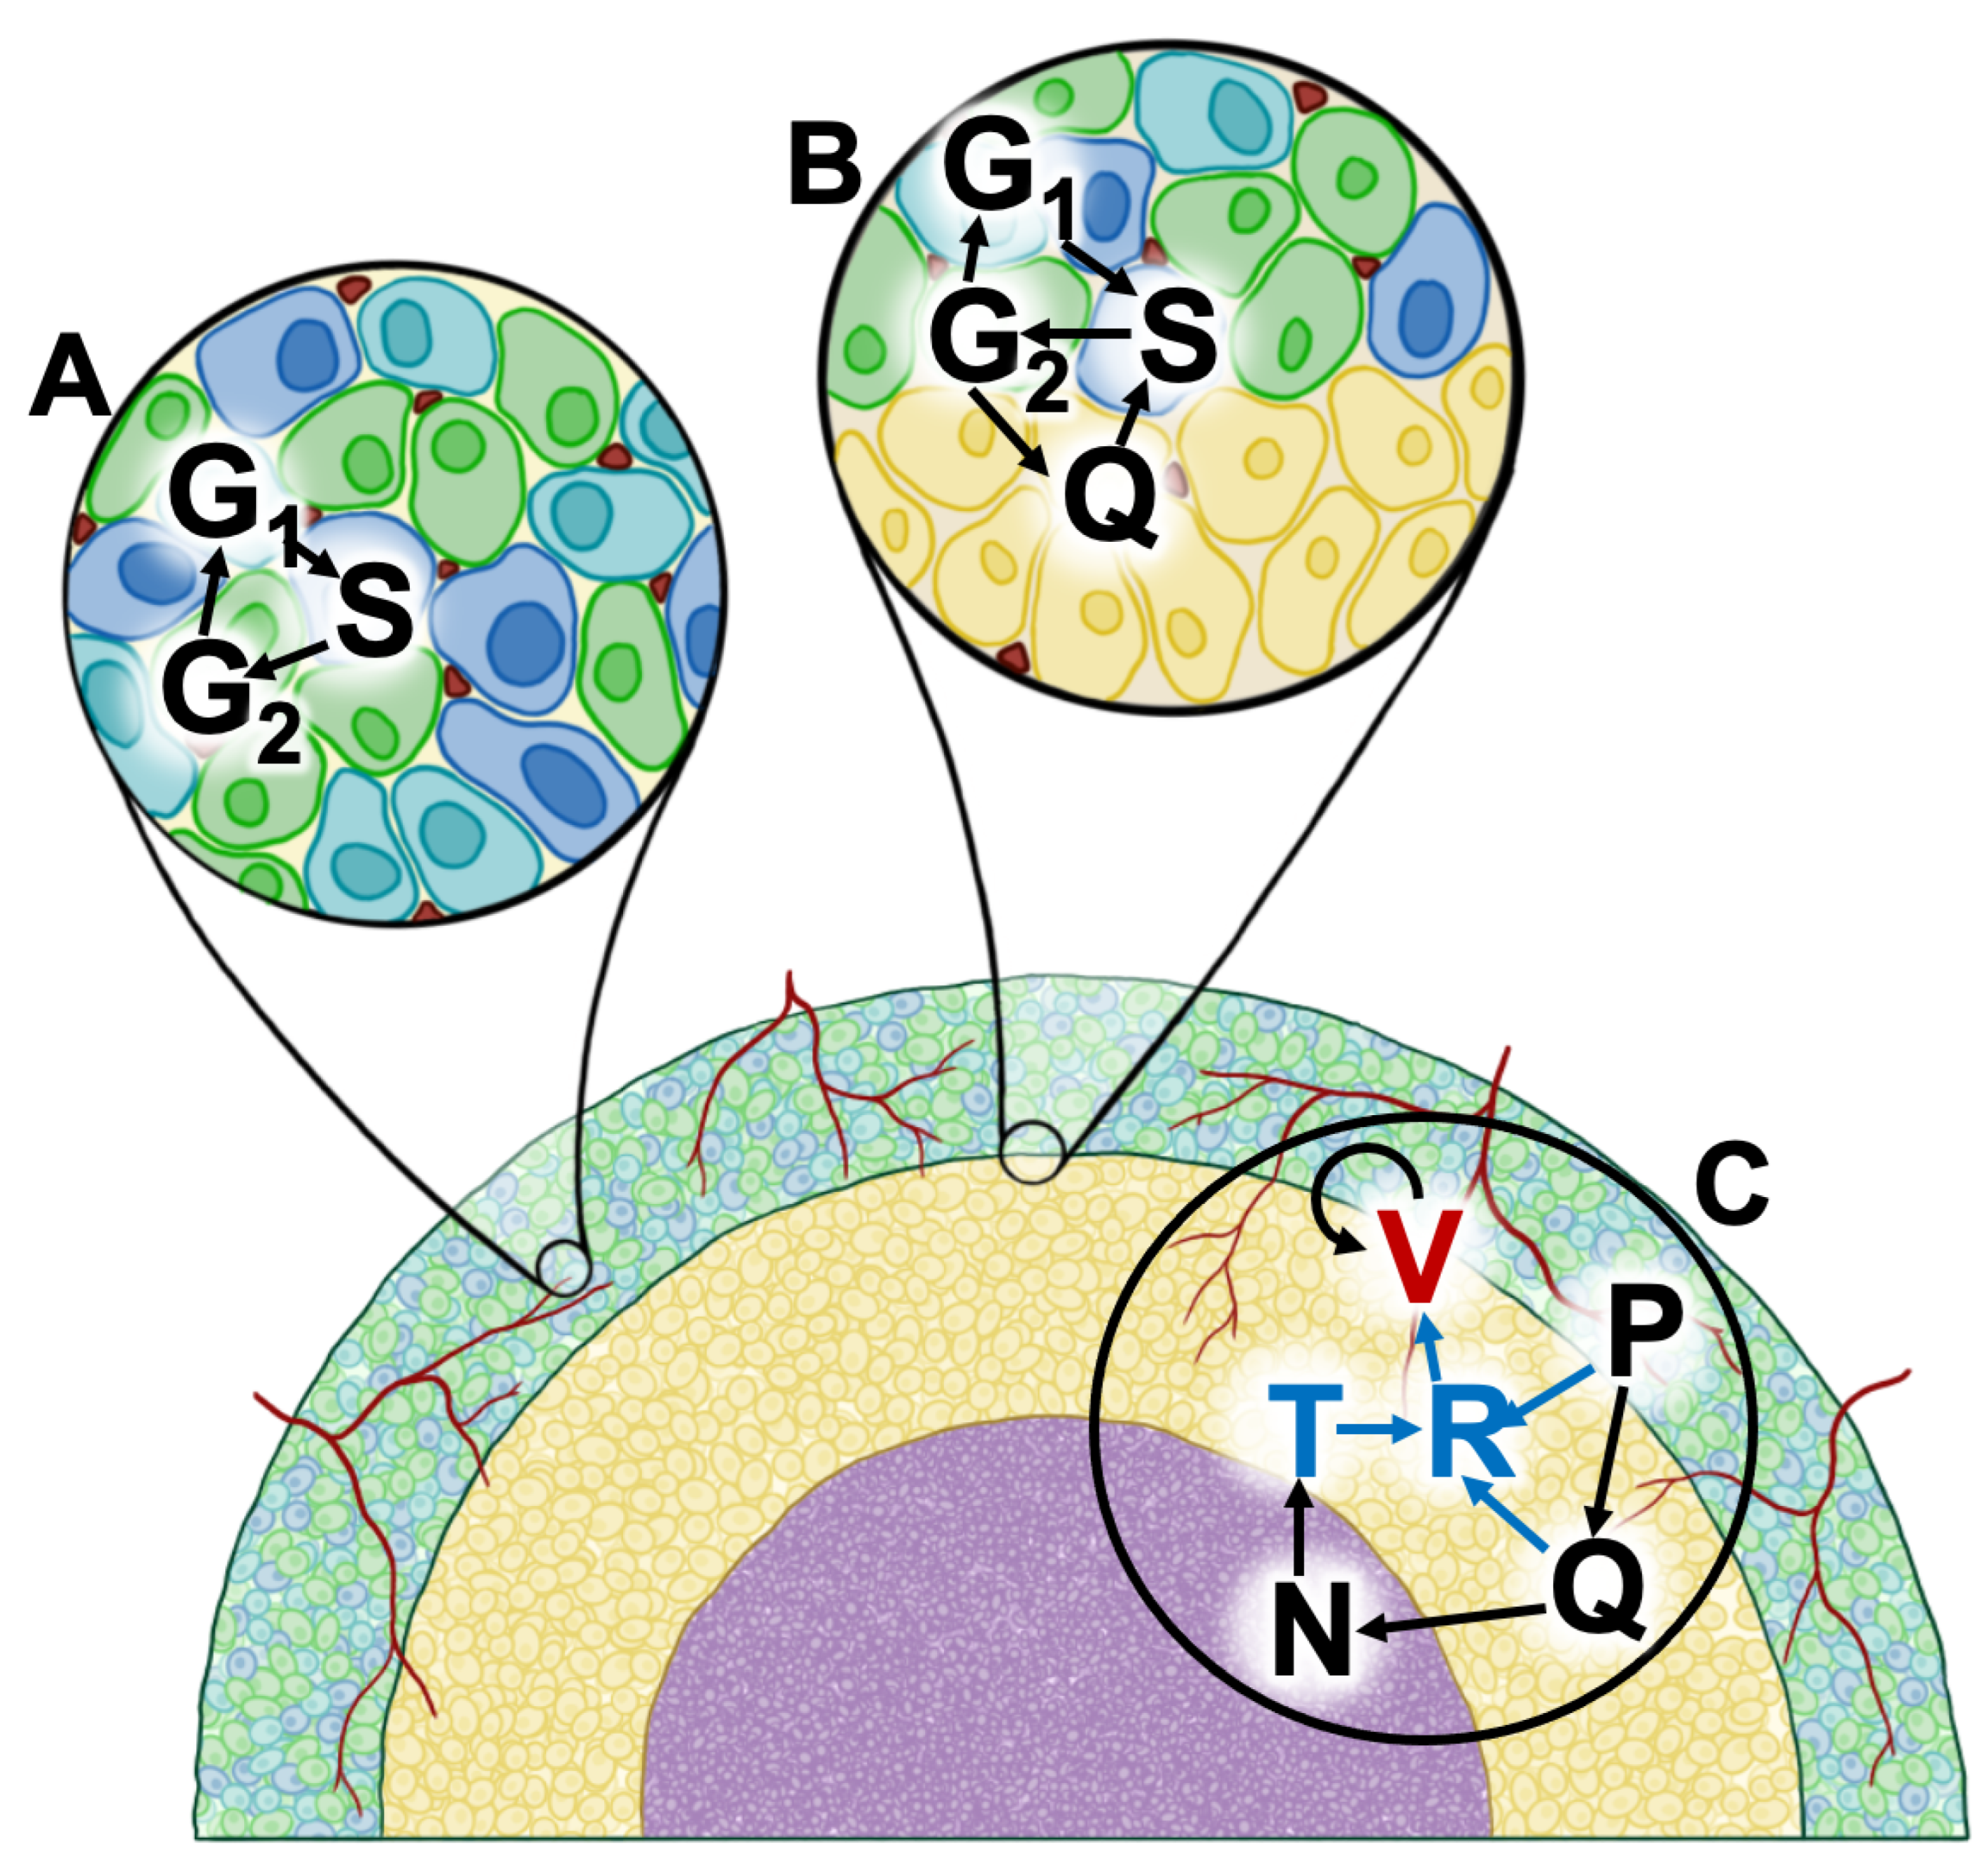
Appendix A.1. Proliferating Tumor Cells (G1-Phase)

d G 1 d t = 2 c 2 G 2 c 1 ( B ) G 1 c 1 ( 1 B ) G 1 c f F G 1 = cell division and transition to the G 1 - phase transition to the S-phase quiescence apoptosis due to TNF

Appendix A.2. Proliferating Tumor Cells (S-Phase)

d S d t = c 1 B G 1 c s S + C Q c f F S = transition to the S-phase transition to the G 2 phase + return of cells from Q apoptosis due to TNF - α

Appendix A.3. Proliferating Tumor Cells (G2 Phase)

d G 2 d t = c s S c 2 G 2 d a G 2 c f F G 2 = transition to the G 2 - phase cell division and transition to the G 1 - phase natural cell apoptosis apoptosis due to TNF - α

Appendix A.4. Quiescent Cells

d Q d t = c 1 ( 1 B ) G 1 C Q e H Q = transition of hypoxic cells from G 1 return of cells to S necrotic death of Q

Appendix A.5. Necrotic Cells

d N d t = e H Q m ( v 0 + V ) N = necrotic death of Q natural removal of dead matter

Appendix A.6. TNF-α

d T d t = j N k ( v 0 + V ) T = production of TNF - α from necrotic tissue removal of T by vasculature

Appendix A.7. VEGF Production and Removal

d R d t = c R ( G 2 + S + G 1 ) T s R + T + c q v ( Q ) q R ( v 0 + V ) R = production of VEGF by proliferating cells in the presence of TNF - α + production of VEGF by quiescent cells , natural removal of VEGF signal

Appendix A.8. Development of Vasculature

d V d t = c v R ( v 0 + V ) s v + R + v 0 + V = vasculature growth in the presence of VEGF signal

Appendix B. Model Parameters

Table A1. Model Parameters.
MonolayerSpheroidXenograftExplanation
d a 000Natural Death Rate
c 1 1.533721.533721.53372 G 1 to S Transition
c s 1.50041.50041.5004S to G 2 Transition
c 2 63.10463.10463.104 G 2 to G 1 Transition
v 0 N/A2.9100Ambient Nutrient
jN/A1.11.1 TNF- α Production
kN/A0.140.14 TNF- α Removal
s 1 N/A11B Half-Saturation Constant
s q N/A300300C Half-Saturation Constant
eN/A0.080.08 Necrotic Death of Q
mN/A0.0040.004 Natural Removal of N
s n N/A6060F Half-Saturation Constant
c q N/A5555 Maximum Rate of C
c f N/A0.830.83 TNF- α -Induced Apoptosis of P
c v N/AN/A70 Vascular Growth
c R N/AN/A223.05148 Production of VEGF by P
s R N/AN/A103.45178 Stimulation of VEGF by TNF- α
q R N/AN/A5.50064 VEGF Removal
c q v N/AN/A0.01 Production of VEGF by Q
c q s N/AN/A0.17877Controls C
s v N/AN/A100Controls Vasculature
s h N/AN/A0.1H Half-Saturation Constant
f h N/AN/A0.1Controls H
g h N/AN/A0.1Controls H
Table A2. Initial Conditions.
MonolayerSpheroidXenograftExplanation
G 1 0 2.8735 × 10 5 cells0.00908 mm369.76 mm3 G 1 Phase Cells
S 0 2.08 × 10 5 cells0.00657 mm350.50 mm3S Phase Cells
G 2 0 0.049 × 10 5 cells0.000155 mm31.190 mm3 G 2 Phase Cells
Q 0 N/A00Quiescent Cells (mm3)
N 0 N/A00Necrosis (mm3)
T 0 N/A00TNF- α
R 0 N/AN/A0VEGF
V 0 N/AN/A0Vasculature

Appendix C. Tabulated Data from Browning et al., Dorasamy et al., and Otani et al.

Table A3. Experimental spheroid volumes (mm3) [34].
Day W vol P vol Q vol N vol
30.01580.01580.00010
40.02150.02120.00020
50.02620.02580.00040
70.04770.04060.00710
100.09030.04280.04340.0041
120.09220.03950.04360.0091
140.12870.04790.06170.0192
160.14750.05280.06380.0308
180.15030.04710.06050.0427
210.16690.04480.05400.0680
Table A4. Experimental in vivo volumes (mm3) [35].
DayVolume (Mean ± SEM)
1 121.4
4 227.7 ± 58.8
6 397.3 ± 52.7
8 538.9 ± 83.1
11 771.6 ± 99.8
14 1090.8 ± 134.8
Table A5. Monolayer surviving fraction [19].
GraysW G 1 QS G 2
011111
20.98960.97220.84030.98101
40.66430.75730.63140.50370.8007
80.19640.31750.24490.031540.1804

References

  1. Aggarwal, P.; Knabel, P.; Fleischer, A.B., Jr. United States burden of melanoma and non-melanoma skin cancer from 1990 to 2019. J. Am. Acad. Dermatol. 2021, 85, 388–395. [Google Scholar] [CrossRef] [PubMed]
  2. Brown, K.R.; Rzucidlo, E. Acute and chronic radiation injury. J. Vasc. Surg. 2011, 53, 15S–21S. [Google Scholar] [CrossRef] [PubMed]
  3. Matthews, N.H.; Li, W.Q.; Qureshi, A.A.; Weinstock, M.A.; Cho, E.; Norval, M.; Wright, C.Y.; Belter, B.; Haase-Kohn, C.; Pietzsch, J.; et al. Cutaneous melanoma. Lancet 2017, 383, 816–827. [Google Scholar]
  4. Shi, W. Radiation Therapy for Melanoma; Exon Publications: Brisbane City, QLD, Australia, 2017; pp. 101–120. [Google Scholar]
  5. Trappetti, V.; Potez, M.; Fernandez-Palomo, C.; Volarevic, V.; Shintani, N.; Pellicioli, P.; Ernst, A.; Haberthür, D.; Fazzari, J.M.; Krisch, M.; et al. Microbeam Radiation Therapy controls local growth of radioresistant melanoma and treats out-of-field locoregional metastasis. Int. J. Radiat. Oncol. Biol. Phys. 2022, 114, 478–493. [Google Scholar] [CrossRef] [PubMed]
  6. Tagliaferri, L.; Lancellotta, V.; Fionda, B.; Mangoni, M.; Casà, C.; Di Stefani, A.; Pagliara, M.M.; D’Aviero, A.; Schinzari, G.; Chiesa, S.; et al. Immunotherapy and radiotherapy in melanoma: A multidisciplinary comprehensive review. Hum. Vaccines Immunother. 2022, 18, 1903827. [Google Scholar] [CrossRef] [PubMed]
  7. Shimono, H.; Kaida, A.; Homma, H.; Nojima, H.; Onozato, Y.; Harada, H.; Miura, M. Fluctuation in radioresponse of HeLa cells during the cell cycle evaluated based on micronucleus frequency. Sci. Rep. 2020, 10, 20873. [Google Scholar] [CrossRef] [PubMed]
  8. Menegakis, A.; Klompmaker, R.; Vennin, C.; Arbusà, A.; Damen, M.; van den Broek, B.; Zips, D.; van Rheenen, J.; Krenning, L.; Medema, R.H. Resistance of hypoxic cells to ionizing radiation is mediated in part via hypoxia-induced quiescence. Cells 2021, 10, 610. [Google Scholar] [CrossRef] [PubMed]
  9. Chen, J.H.; Ozanne, S.E.; Hales, C.N. Heterogeneity in premature senescence by oxidative stress correlates with differential DNA damage during the cell cycle. DNA Repair 2005, 4, 1140–1148. [Google Scholar] [CrossRef]
  10. Pawlik, T.M.; Keyomarsi, K. Role of cell cycle in mediating sensitivity to radiotherapy. Int. J. Radiat. Oncol. Biol. Phys. 2004, 59, 928–942. [Google Scholar] [CrossRef]
  11. Hauge, S.; Eek Mariampillai, A.; Rødland, G.E.; Bay, L.T.; Landsverk, H.B.; Syljuåsen, R.G. Expanding roles of cell cycle checkpoint inhibitors in radiation oncology. Int. J. Radiat. Biol. 2023, 99, 941–950. [Google Scholar] [CrossRef]
  12. Seong, K.M.; Kim, C.S.; Jeon, H.Y.; Oh, S.H.; Nam, S.Y.; Yang, K.H.; Kim, J.Y.; Jin, Y.W. Intrinsic radiosensitivity correlated with radiation-induced ROS and cell cycle regulation. Mol. Cell. Toxicol. 2010, 6, 1–7. [Google Scholar] [CrossRef]
  13. Yount, G.L.; Haas-Kogan, D.A.; Vidair, C.A.; Haas, M.; Dewey, W.C.; Israel, M.A. Cell cycle synchrony unmasks the influence of p53 function on radiosensitivity of human glioblastoma cells. Cancer Res. 1996, 56, 500–506. [Google Scholar] [PubMed]
  14. Pan, Z.; Qu, C.; Chen, Y.; Chen, X.; Liu, X.; Hao, W.; Xu, W.; Ye, L.; Lu, P.; Li, D.; et al. Bufotalin induces cell cycle arrest and cell apoptosis in human malignant melanoma A375 cells. Oncol. Rep. 2019, 41, 2409–2417. [Google Scholar] [CrossRef] [PubMed]
  15. Pan, Z.; Luo, Y.; Xia, Y.; Zhang, X.; Qin, Y.; Liu, W.; Li, M.; Liu, X.; Zheng, Q.; Li, D. Cinobufagin induces cell cycle arrest at the S phase and promotes apoptosis in nasopharyngeal carcinoma cells. Biomed. Pharmacother. 2020, 122, 109763. [Google Scholar] [CrossRef] [PubMed]
  16. Xie, Q.; Fan, X.; Han, Y.; Wu, B.X.; Zhu, B. Daphnoretin Arrests the Cell Cycle and Induces Apoptosis in Human Breast Cancer Cells. J. Nat. Prod. 2022, 85, 2332–2339. [Google Scholar] [CrossRef] [PubMed]
  17. Kee, J.Y.; Han, Y.H.; Kim, D.S.; Mun, J.G.; Park, S.H.; So, H.S.; Park, S.J.; Park, R.; Um, J.Y.; Hong, S.H. β-Lapachone suppresses the lung metastasis of melanoma via the MAPK signaling pathway. PLoS ONE 2017, 12, e0176937. [Google Scholar] [CrossRef] [PubMed]
  18. Sinclair, W.K.; Morton, R.A. X-Ray and Ultraviolet Sensitivity of Synchronized Chinese Hamster Cells at Various Stages of the Cell Cycle. Biophys. J. 1965, 5, 1–25. [Google Scholar] [CrossRef]
  19. Otani, K.; Naito, Y.; Sakaguchi, Y.; Seo, Y.; Takahashi, Y.; Kikuta, J.; Ogawa, K.; Ishii, M. Cell-cycle-controlled radiation therapy was effective for treating a murine malignant melanoma cell line in vitro and in vivo. Sci. Rep. 2016, 6, 30689. [Google Scholar] [CrossRef]
  20. Terasima, T.; Tolmach, L.J. Variations in several responses of HeLa cells to x-irradiation during the division cycle. Biophys. J. 1963, 3, 11–33. [Google Scholar] [CrossRef]
  21. Hufnagl, A.; Herr, L.; Friedrich, T.; Durante, M.; Taucher-Scholz, G.; Scholz, M. The link between cell-cycle dependent radiosensitivity and repair pathways: A model based on the local, sister-chromatid conformation dependent switch between NHEJ and HR. DNA Repair 2015, 27, 28–39. [Google Scholar] [CrossRef]
  22. Buffa, F.M.; West, C.; Byrne, K.; Moore, J.V.; Nahum, A.E. Radiation response and cure rate of human colon adenocarcinoma spheroids of different size: The significance of hypoxia on tumor control modelling. Int. J. Radiat. Oncol. Biol. Phys. 2001, 49, 1109–1118. [Google Scholar] [CrossRef] [PubMed]
  23. Kempf, H.; Hatzikirou, H.; Bleicher, M.; Meyer-Hermann, M. In silico analysis of cell cycle synchronisation effects in radiotherapy of tumour spheroids. PLoS Comput. Biol. 2013, 9, e1003295. [Google Scholar] [CrossRef] [PubMed]
  24. He, Y.; Kodali, A.; Wallace, D.I. Predictive modeling of neuroblastoma growth dynamics in xenograft model after bevacizumab anti-VEGF therapy. Bull. Math. Biol. 2018, 80, 2026–2048. [Google Scholar] [CrossRef] [PubMed]
  25. West, C.M.; Sutherland, R.M. The radiation response of a human colon adenocarcinoma grown in monolayer, as spheroids, and in nude mice. Radiat. Res. 1987, 112, 105–115. [Google Scholar] [CrossRef] [PubMed]
  26. Lv, D.; Hu, Z.; Lu, L.; Lu, H.; Xu, X. Three-dimensional cell culture: A powerful tool in tumor research and drug discovery. Oncol. Lett. 2017, 14, 6999–7010. [Google Scholar] [CrossRef] [PubMed]
  27. Habanjar, O.; Diab-Assaf, M.; Caldefie-Chezet, F.; Delort, L. 3D cell culture systems: Tumor application, advantages, and disadvantages. Int. J. Mol. Sci. 2021, 22, 12200. [Google Scholar] [CrossRef] [PubMed]
  28. Chaicharoenaudomrung, N.; Kunhorm, P.; Noisa, P. Three-dimensional cell culture systems as an in vitro platform for cancer and stem cell modeling. World J. Stem Cells 2019, 11, 1065. [Google Scholar] [CrossRef] [PubMed]
  29. Fontana, F.; Marzagalli, M.; Sommariva, M.; Gagliano, N.; Limonta, P. In vitro 3D cultures to model the tumor microenvironment. Cancers 2021, 13, 2970. [Google Scholar] [CrossRef]
  30. Zanoni, M.; Piccinini, F.; Arienti, C.; Zamagni, A.; Santi, S.; Polico, R.; Bevilacqua, A.; Tesei, A. 3D tumor spheroid models for in vitro therapeutic screening: A systematic approach to enhance the biological relevance of data obtained. Sci. Rep. 2016, 6, 19103. [Google Scholar] [CrossRef]
  31. Weiswald, L.B.; Bellet, D.; Dangles-Marie, V. Spherical cancer models in tumor biology. Neoplasia 2015, 17, 1–15. [Google Scholar] [CrossRef]
  32. Nath, S.; Devi, G.R. Three-dimensional culture systems in cancer research: Focus on tumor spheroid model. Pharmacol. Ther. 2016, 163, 94–108. [Google Scholar] [CrossRef]
  33. Wallace, D.I.; Dunham, A.; Chen, P.X.; Chen, M.; Huynh, M.; Rheingold, E.; Prosper, O. A model for spheroid versus monolayer response of SK-N-SH neuroblastoma cells to treatment with 15-deoxy-PGJ 2. Comput. Math. Methods Med. 2016, 2016, 3628124. [Google Scholar] [CrossRef]
  34. Browning, A.P.; Sharp, J.A.; Murphy, R.J.; Gunasingh, G.; Lawson, B.; Burrage, K.; Haass, N.K.; Simpson, M. Quantitative analysis of tumour spheroid structure. Elife 2021, 10, e73020. [Google Scholar] [CrossRef] [PubMed]
  35. Dorasamy, M.S.; Aravind, A.; Nellore, K.; Wong, P.F. Synergistic inhibition of melanoma xenografts by Brequinar sodium and Doxorubicin. Biomed. Pharmacother. 2019, 110, 29–36. [Google Scholar] [CrossRef] [PubMed]
  36. Sause, W.; Cooper, J.; Rush, S.; Ago, C.; Cosmatos, D.; Coughlin, C.; Janjan, N.; Lipsett, J. Fraction size in external beam radiation therapy in the treatment of melanoma. Int. J. Radiat. Oncol. Biol. Phys. 1991, 20, 429–432. [Google Scholar] [CrossRef] [PubMed]
  37. Vittadello, S.T.; McCue, S.W.; Gunasingh, G.; Haass, N.K.; Simpson, M.J. Mathematical models incorporating a multi-stage cell cycle replicate normally-hidden inherent synchronization in cell proliferation. J. R. Soc. Interface 2019, 16, 20190382. [Google Scholar] [CrossRef] [PubMed]
  38. Liberato, T.; Pessotti, D.S.; Fukushima, I.; Kitano, E.S.; Serrano, S.M.; Zelanis, A. Signatures of protein expression revealed by secretome analyses of cancer associated fibroblasts and melanoma cell lines. J. Proteom. 2018, 174, 1–8. [Google Scholar] [CrossRef] [PubMed]
  39. MATLAB. MATLAB and Statistics Toolbox Release 2018a; The MathWorks Inc.: Natick, MA, USA, 2018. [Google Scholar]
  40. Kaeppler, J.R.; Chen, J.; Buono, M.; Vermeer, J.; Kannan, P.; Cheng, W.C.; Voukantsis, D.; Thompson, J.M.; Hill, M.A.; Allen, D.; et al. Endothelial cell death after ionizing radiation does not impair vascular structure in mouse tumor models. EMBO Rep. 2022, 23, e53221. [Google Scholar] [CrossRef]
Figure 1. Process diagram for the nested model. G 1 , G 2 , and S are the cell-cycle stages of the same name. P is the proliferating compartment, comprised of G 1 , S, and G 2 phases. Q is the quiescent cells and N is necrosis. The blue letters, T and R, are the cytokines TNF- α and VEGF, respectively. V is the vasculature. (A) Diagram of the model compartments representing cell-cycle stages in the well-oxygenated, proliferating region of the tumor. (B) The transitions between proliferating and quiescent compartments further from vasculature in the hypoxic region. (C) The remaining transitions, including the necrotic death of quiescent cells, the secretion of TNF- α and VEGF by necrotic and viable cells, respectively, and the promotion of angiogenesis by VEGF.
Appliedmath 04 00010 g001
Figure 2. (A) Spheroid data fit. Black represents the whole tumor volume, green is the proliferative volume, yellow is the quiescent volume, and purple is the necrotic volume. The dots in corresponding colors represent mean spheroid volumes at each time point, collected by Browning et al. [34]. (B) In vivo data fit. The data fit for the xenograft simulation. Black represents the whole tumor volume, green is the proliferative volume, yellow is the quiescent volume, and purple is the necrotic volume. Solid black dots are the mean tumor volume obtained from Dorasamy et al., and the open black circles are the SEM also from Dorasamy et al. [35].
Appliedmath 04 00010 g002
Figure 3. Simulated tumor experiment showing the model fit to the data from Otani et al. [19]. Closed circles represent mean experimental xenograft volumes measured by Otani et al., and the open circles are the SEM. The green curve is the model output of xenograft volume for 4 Gy without synchronization (gemcitabine administered after radiotherapy), and the pink curve is the model output for 4 Gy following synchronization with gemcitabine.
Appliedmath 04 00010 g003
Figure 4. (A) Final simulated tumor volume (mm3) for control and experimental treatment at 0, 2, 4, and 8 Gy and various percentages of cells synchronized before (Exp) or after (Ctrl) radiation treatment. (B) Ratio of experiment to control tumor volume at 4 and 8 Gy for various levels of synchronization.
Appliedmath 04 00010 g004
Figure 5. Three treatments of 8 Gy each. Green curves represent simulations with radiation only. Pink curves correspond to 92% synchronization just prior to each dose of radiation.
Appliedmath 04 00010 g005
Figure 6. Final tumor volume for tumors treated with 8 Gy on days 0, 7, and 14. In pink is the frequency of day 21 tumor volumes for 100 trials with gemcitabine treatment prior to radiotherapy (synchronized), and in green is the same for 100 trials without gemcitabine treatment prior to radiotherapy (unsynchronized).
Appliedmath 04 00010 g006
Disclaimer/Publisher’s Note: The statements, opinions and data contained in all publications are solely those of the individual author(s) and contributor(s) and not of MDPI and/or the editor(s). MDPI and/or the editor(s) disclaim responsibility for any injury to people or property resulting from any ideas, methods, instructions or products referred to in the content.

