

Design, Construction and Evaluation of an Oscillating Vane Gust Generator for Atmospheric Flow Simulation


Department of Mechanical Engineering, College of Engineering, University of Maine, Orono, ME 04469, USA
*
Author to whom correspondence should be addressed.
Wind 2021, 1(1), 63-76; https://0-doi-org.brum.beds.ac.uk/10.3390/wind1010004
Submission received: 10 September 2021
/
Revised: 5 November 2021
/
Accepted: 9 November 2021
/
Published: 11 November 2021
Abstract
:The study of unsteady aerodynamic phenomena in wind tunnels is supported by gust-generating devices capable of generating adjustable magnitude and periodicity velocity fluctuations in a flowfield. Gusts are typically generated actively by introducing moving vanes to direct the flow, or passively by tailoring the boundary layer growth and shape in the tunnel. The flow facility used here is a student-built closed-return low-speed wind tunnel, with a test section size of 750 mm × 750 mm and a maximum speed of 25 m/s. A two-vane gust generator utilizing NACA0018 airfoil sections of 150 mm chord length was designed and installed upstream of the test section. The flowfield was mapped with the installed vanes with and without gust actuation, utilizing a hot wire system. The tunnel with gust vanes exhibits a spatially uniform baseline turbulence intensity of 5%, with a steady state velocity deficit of 1 m/s in the vane–wake region. Upon introducing the gusting conditions at vane deflection angles of up to ±45°, velocity differences of up to 4 m/s were attained at 18 m/s freestream velocity at oscillation frequencies ranging between 1 Hz and 2 Hz.
1. Introduction
Gust generators have been widely used to study the unsteady aerodynamic effects of atmospheric flows by modeling natural wind turbulence [1,2]. They constitute important instruments in a wide range of applications that range from the experimental exploration of gusts on uncrewed aerial vehicles (UAV’s) [3,4], to gust responses of high aspect ratio wings [5,6], to high speed vehicle environmental effects [7], and atmospheric and building related flows [8,9].
Fundamentally, gust generation is the unsteady modification of the boundary conditions at the inlet, tunnel test section walls, or on the model of interest [10]. This can be achieved either by a passive method or by the active deflection of aerodynamic surfaces in the flow [11]. Passive methods introduce a type of obstruction into the inlet flow which causes a steady and repeatable turbulence condition. Active methods rely on controllable moving vanes or tabs to produce larger flow structures and impart turbulent energy into the flow [1,12]. For the work presented here, an active gust generation method was chosen in order to maximize the gust velocity and provide a means of adjusting the gusting frequency.
A common approach to active gust generation is an oscillating vane gust generator [13]. An oscillating vane, or gust vane, is a thin object that spans the width or height of a wind tunnel and can rotate in an oscillatory motion. Oscillating vane systems can produce gusts laterally and longitudinally by changing the array layout and oscillating the airfoils in or out of phase with each other [13]. These types of gust generators have been successfully used to produce large wind gusts in a variety of wind tunnels [3,4,7,10,11]. This is useful in high-load testing and fatigue testing, as the gusts have large velocity differences and vary sinusoidally.
Another type of active gust generator relies on active grids to produce the gust. These consist of a type of array or grid of deflectable surface that spans the tunnel cross section and that can actively be controlled. Grid gust generators, such as the Makita grid system [12] were developed to increase the integral length scales of turbulence while maintaining gust isotropy. In this grid system, the diamond shaped wings are oriented on rods that rotate independently from each other using separate driving motors. The original development of this grid used random pulse control to randomly rotate the rods for a better representation of atmospheric turbulence.
The tandem oscillating vane generator [13] and Makita active grid [12] are the only gust generators capable of producing atmospheric turbulence conditions, as well as large wind gusts used for aerodynamic model testing.
The work presented here introduces the design process and the characterization of a dual-vane gust generator to simulate atmospheric gust conditions for infiltration studies in buildings. While oscillating-vane gust generators are well established instruments in experimental fluid mechanics, they are not widely used, and as such there is limited experimental data available to inform future development. This work presents experimental data that augments published oscillating-vane gust generator data, specifically by presenting absolute velocity fluctuation magnitudes for oscillation amplitudes up to ±45° and oscillation frequencies up to 2 Hz at three streamwise locations in the test section. This experimental data can help inform optimal downstream measurement stations to acquire model test data, as well as the oscillation amplitude vs. gust amplitude response. In addition, the effect of the undeflected vanes in the tunnel is characterized by presenting the spatial turbulence distributions at the same streamwise locations.
Section 2 introduces the physical configuration of the gust generator, the wind tunnel and flow instrumentation, and presents a Computational Fluid Dynamics (CFD) model and related computational results utilized in the design process. Section 3 presents the experimental results including a characterization of the flow in the tunnel with the vanes in streamlined position (including velocity fields and turbulence intensity distribution,) followed by the measured gust velocity magnitudes as a function of streamwise and transverse position, and frequency and vane oscillation amplitude. A power spectrum plot of the observed frequencies closes the results section, followed by overall conclusions.
2. Materials and Methods
The gust generator presented here was designed and tested in a closed-return low-speed wind tunnel to conduct measurements of building infiltration under unsteady wind loading conditions.
The University of Maine Crosby Hall Wind Tunnel is a student-built, closed-loop, subsonic wind tunnel. Wind is driven by a 29.8 kW fan with a rotor diameter of 965 mm, rated for 10.86 m3/s. The contraction ratio is 7:1 and it has an aluminum honeycomb screen that is used for flow straightening in the settling chamber before the contraction. The tunnel test section is 750 mm × 750 mm × 2000 mm and the peak wind speed is 24.14 m/s. The tunnel does not have active cooling provisions; thus, it cannot experience prolonged runs over approximately 5 min without experiencing noticeable heating.
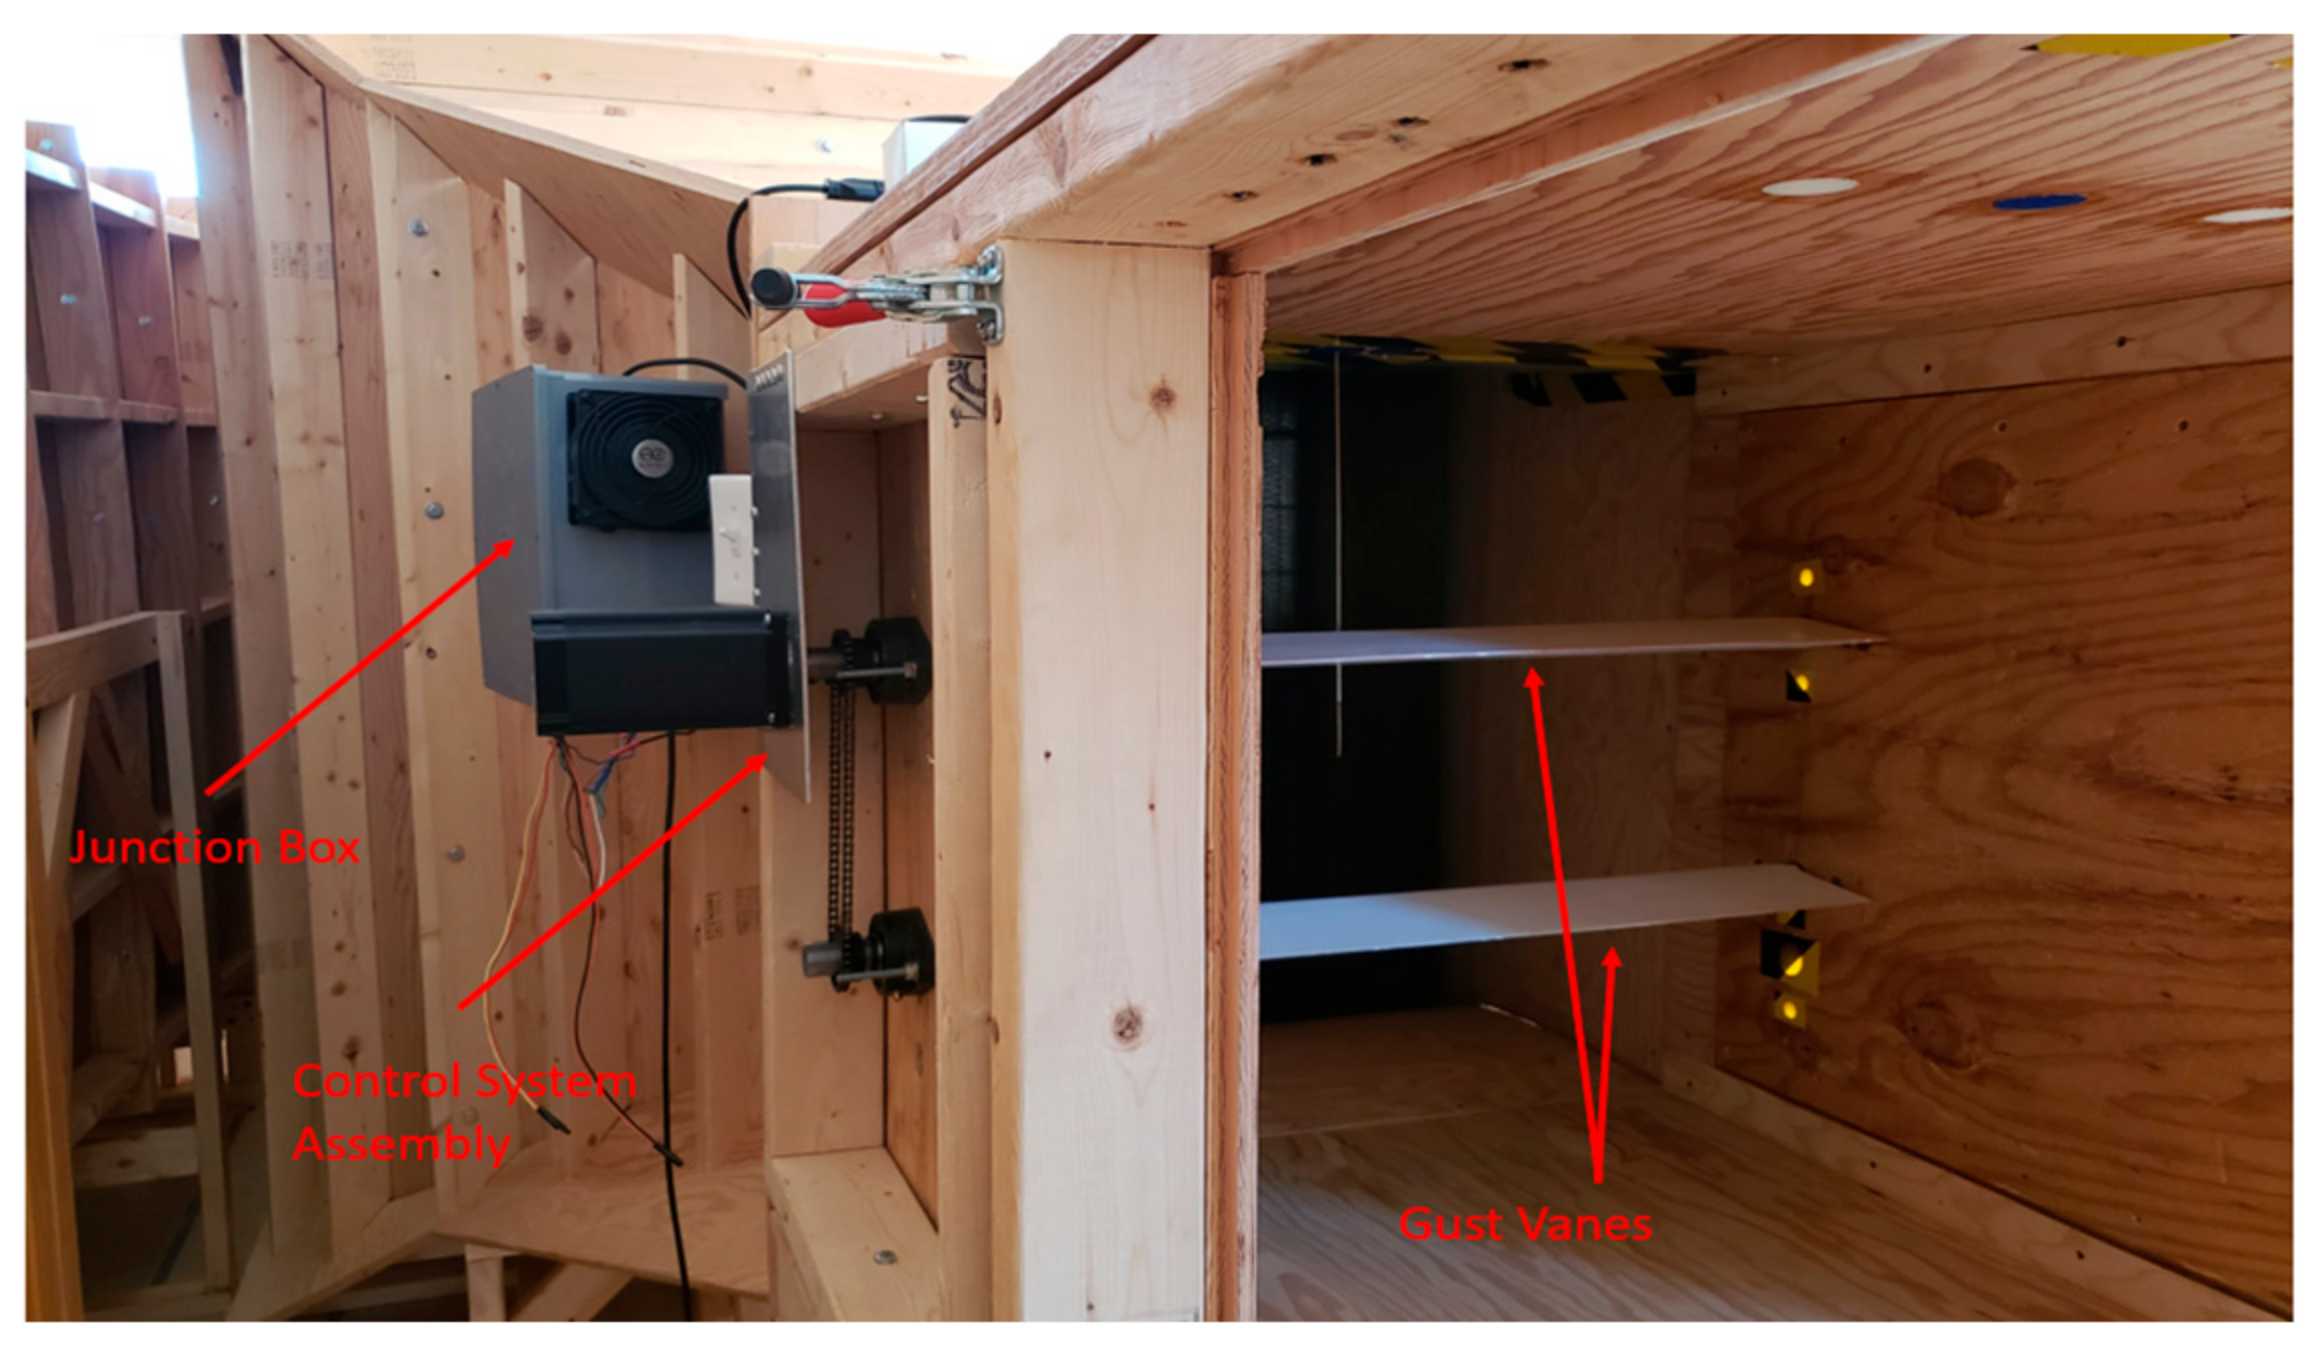
An oscillating-vane gust generator was chosen due to its ability to produce large longitudinal gusts, simplicity of implementation, and its suitability for the test section size of the Crosby Wind Tunnel. While a range of vane configurations were considered [14], a full-width two-vane horizontal configuration (Figure 1) utilizing NACA0018 airfoils with a chord length of 150 mm was chosen based on manufacturability and recommendations from previous work [10,13].
The vane oscillation was driven by a stepper motor capable of producing 12.75 N-m of torque, and a chain–sprocket drive which was controlled using a stepper motor driver and LabVIEW-designed control system. In order to simplify the system, the vanes were driven synchronously and in phase, with the aim of generating a sinusoidal oscillation of magnitude and direction. Figure 2 shows the location of the gust generator vanes in the test section.
The gust vanes were positioned 168 mm into the tunnel for structural mounting reasons and to ensure their location in the uniform flow field after the tunnel contraction. The 230 mm spacing between the gust vanes ensured that they could not physically come in contact even in the case of a driving system failure, while retaining tight spacing to improve gust uniformity [15]. The vanes were manufactured using a cored composite construction, with a steel tube main spar and driving shaft (Figure 3).
Flow velocity was measured using a Dantec MiniCTA hot-wire anemometer system with a single-wire hot-wire probe. The Dantec MiniCTA is a single-channel constant temperature anemometer suitable for hot-wire and hot-film probes, with a bandwidth of 10 kHz at 50 m/s for wire probes in air, and optimized for measurements up to 100 m/s [16]. A single hot-wire probe placed perpendicular to the downstream direction of the wind tunnel was chosen over an X-wire capable of 2D flow due to the nature of the research conducted in the flow facility. The work conducted required wind-pressure fluctuations on a simulated building wall located orthogonal to the flow direction and, as such, a single hot-wire probe was deemed appropriate to assess the stagnation pressure. An external traverse positioned the hot-wire probe in a 100 mm by 100 mm grid across the tunnel cross section and at three streamwise locations (745 mm, 1100 mm and 1495 mm) downstream of the test section inlet. The standard calibration procedure was followed prior to each data run, and runtimes were short (of the order of 1 to 2 min) to minimize heating of the flow.
The data acquisition used for the hot wire was a NI USB 6001 analog and digital input device. It is compatible with the LabVIEW graphical programming software and offers single-ended voltage input and differential voltage input. It has a voltage input range of ±10 V and sampling rate of 20,000 samples per second. The data acquisition was configured to read differential voltage inputs from the hot-wire anemometry. The aggregate accuracy due to hysteresis, linearization, gain error, and system noise was ±6 mV.
Estimated uncertainty of the hot-wire anemometer was calculated accounting for linearization and A/D resolution of the data acquisition, calibration uncertainty, and temperature variation within the wind tunnel. Linearization and A/D resolution uncertainty was based on manufacturer values, and temperature variation uncertainty was computed based on the recommendations of Jørgensen [17]. Calibration uncertainty was calculated independently, and the total uncertainty was then used in the hot-wire uncertainty calculation. The resulting overall hot wire measurement uncertainty ranged between ±4% to ±5%.
To process the velocity data, a moving average was used in evaluating the low frequency wind gusts to mitigate the effect of high frequency outliers. The moving average was taken over every 100 points, corresponding to an average over every 0.1 milliseconds.
The numeric evaluation of different design alternatives was conducted using STAR CCM+ v12.04 (Siemens PLM software) and ANSYS CFX CFD software packages. The velocity field with the gust vanes installed was evaluated for different angles of attack, using a NACA0018 airfoil geometry with a 150 mm chord length. The constant chord vanes spanned the tunnel, and thus the flow is approximated as 2D.
Flow domains with identical boundary conditions were created for all CFD simulations. Curvature meshing and defining the boundary layer on the airfoils was used to increase the mesh density around the airfoils in the model. Tetrahedral elements were used throughout the domain, with the minimum allowable size of the mesh elements being 1 × 10⁻³ mm, and the maximum size being 5 mm. A mesh convergence study over five mesh sizes was conducted to validate the mesh. The size of the domain was 750 mm × 2000 mm. The inlet velocity was set to 18.00 m/s uniformly over the vertical height of the domain, with the airfoils and the walls above and below being defined as non-slip walls. The outlet flow condition was set to 0 Pa gauge pressure (Figure 4).
To ensure a two-dimensional flow, the front and back faces of the domain were defined as symmetrical, which assumed the flow was symmetrical in the transverse direction of the model (along the length of the vanes). The system was simulated at 0° angle of attack, ±5° angle of attack, and ±10° angle of attack. A steady-state solution was sought (deemed appropriate due to the low gust frequency of 0.5 Hz to 1 Hz, which generates a quasi-steady state condition); thus, a second-order upwind scheme was used for faster simulation time. The turbulence model used was a shear stress transport, or SST, k-ω model, selected due to its better performance in enclosed flows compared to k-ϵ models [18]. Figure 5 shows the results at zero angle of attack for a reference velocity field.
The increasing angle of attack cases were simulated to view the velocity differences between the roof and floor of the tunnel test section. The examples of these cases are shown in Figure 6 and Figure 7.
Overall, when the configuration was operated in parallel vane deflection up to ±10 degrees and at a tunnel inlet velocity of 18 m/s, a gust of 3.9 m/s (22% of flow velocity) could be generated. It is noted that higher deflection angles were not simulated, but subsequently tested in the experimental phase. Other motion configurations (such as opposing blade deflection) were not simulated or tested due to the added mechanical complexity of such a system.
3. Results and Discussion
The performance of the gust generator was analyzed in a two-step process; first, the tunnel with the gust generator vanes at 0° angle of attack was characterized (velocity distribution and turbulence levels), and then the gusting conditions were quantified (velocity distribution, turbulence levels, and oscillation spectra).
3.1. Tunnel/Gust Generator Configuration Flow Characterization
Results for the gust vanes at zero angle of attack consisted of average planar velocity profiles at all tested downstream stations, and an evaluation of the turbulence intensities using the time series data at these locations. Uncertainties in the results were obtained using the Kline–McClintock [19] method, with additional consideration for the temperature fluctuations in the wind tunnel.
3.1.1. Average Velocities at Longitudinal Cross-Sections
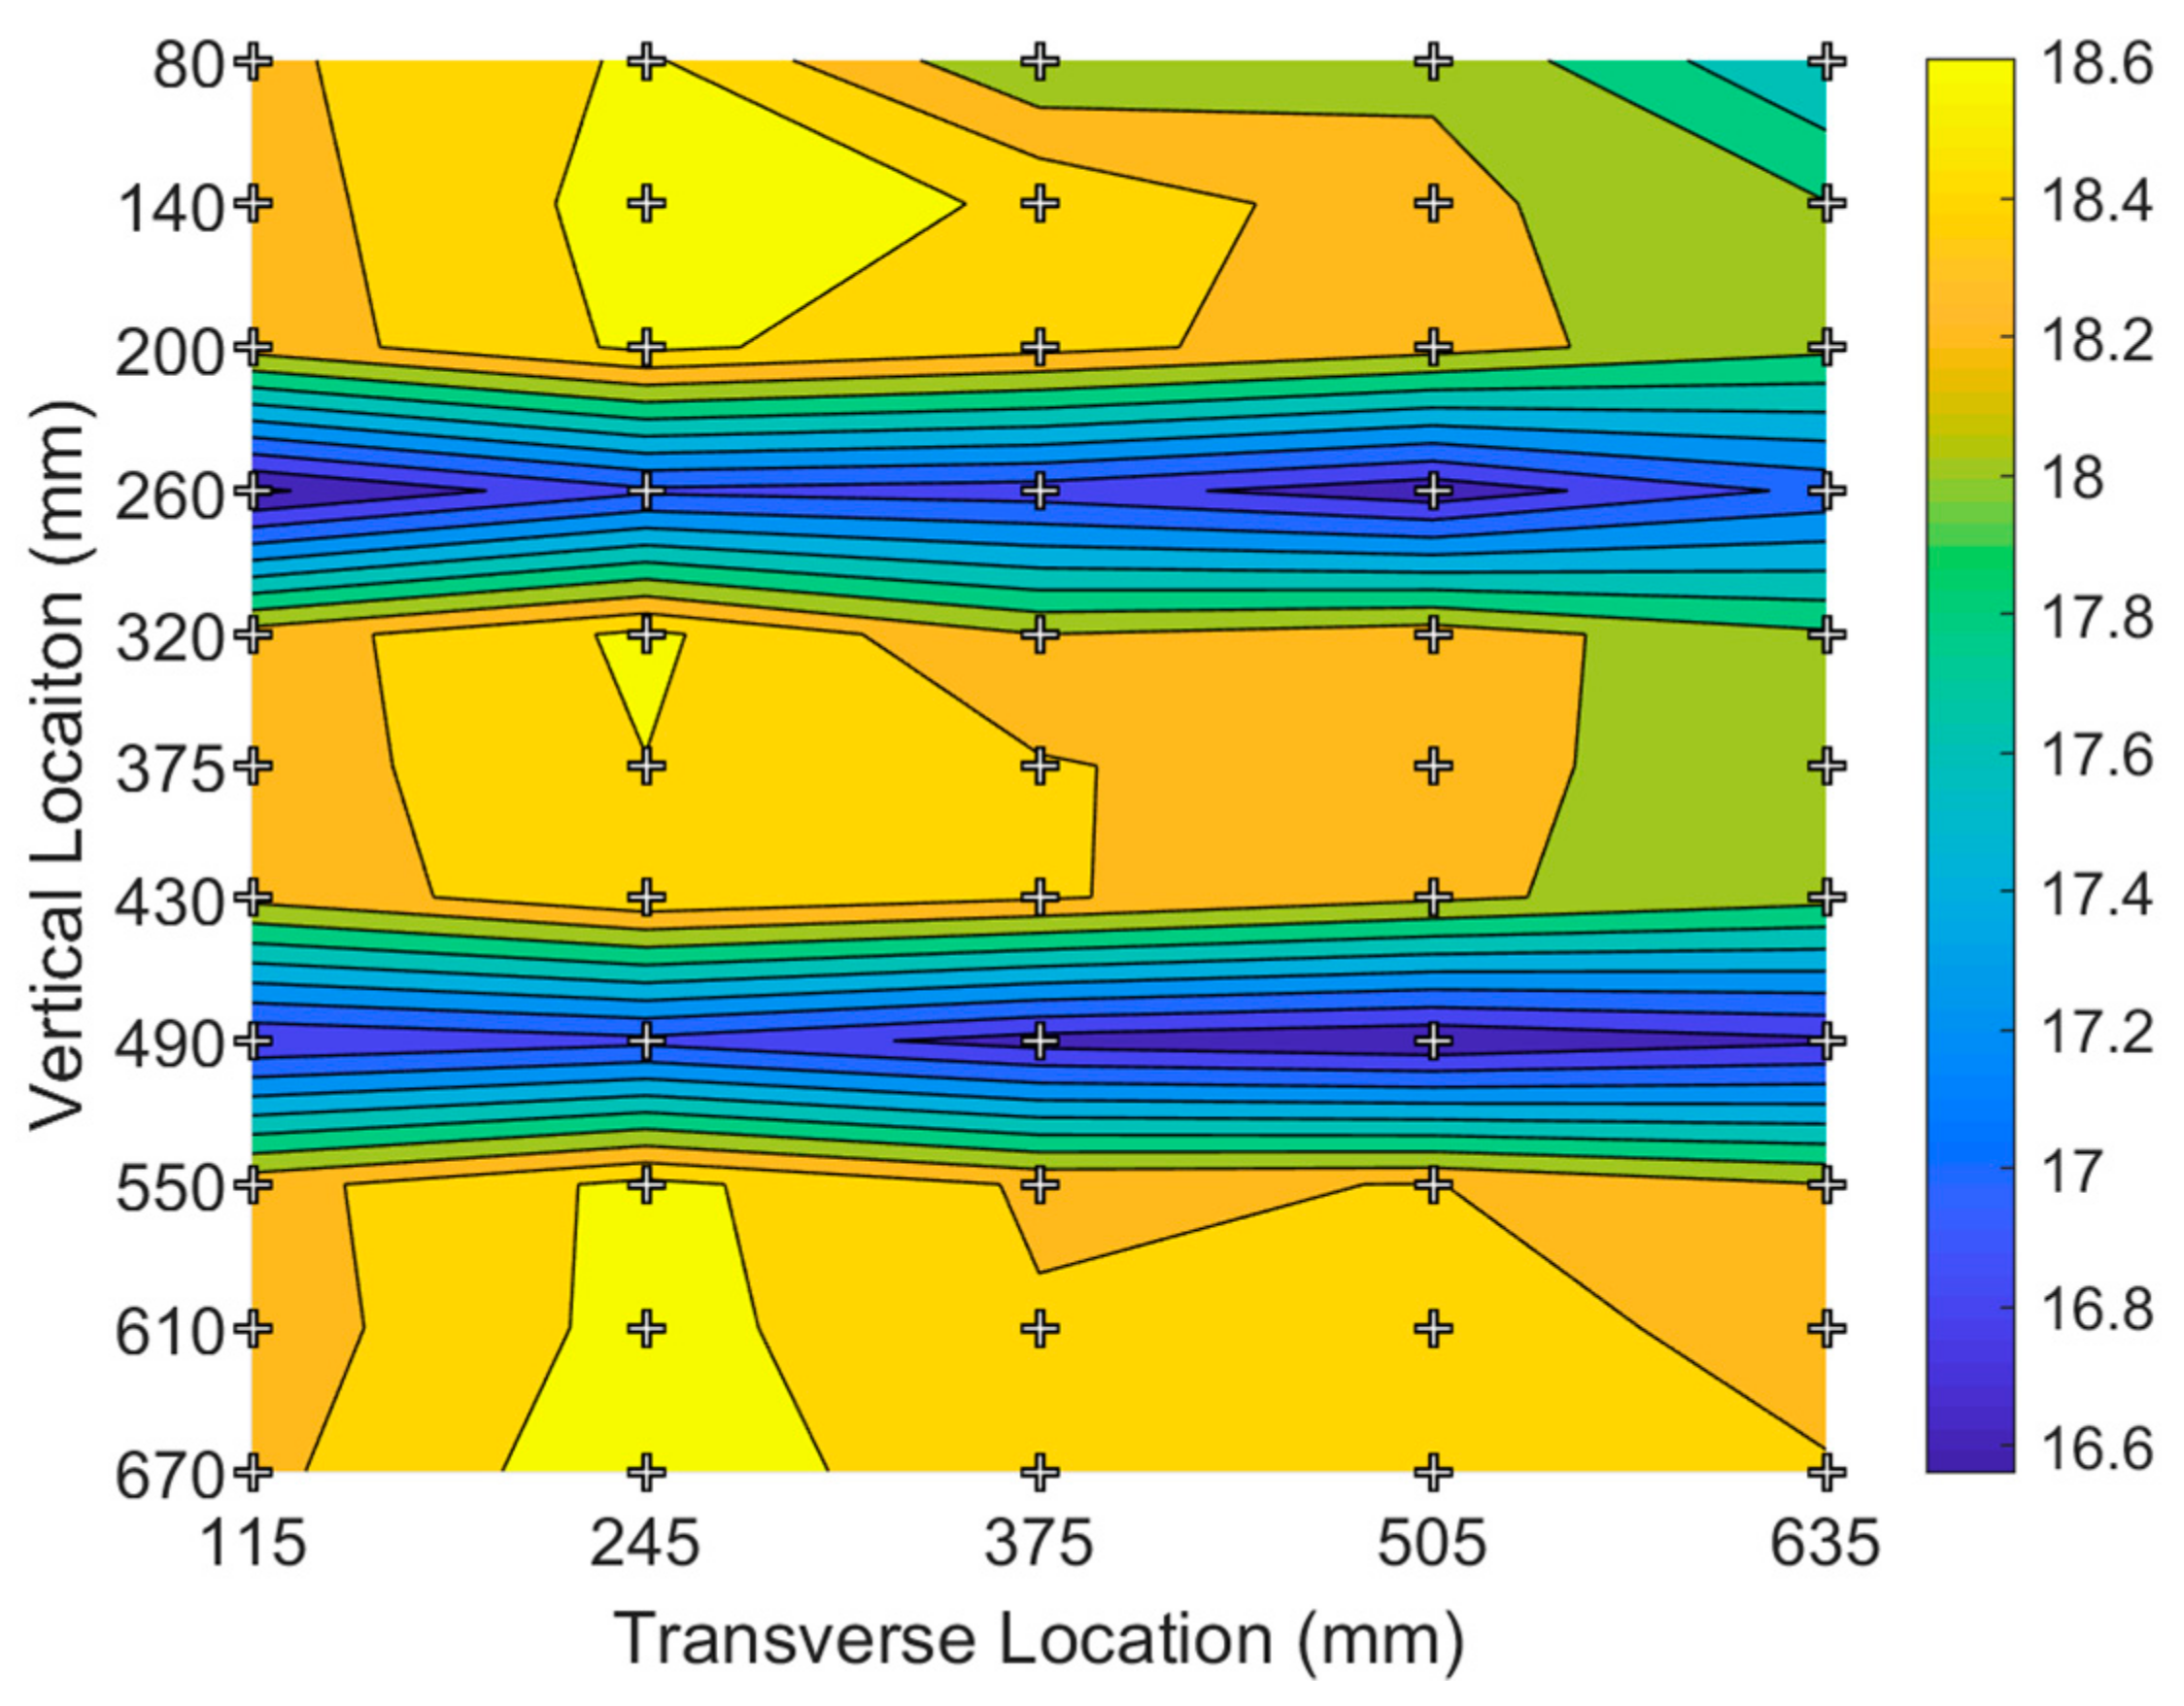
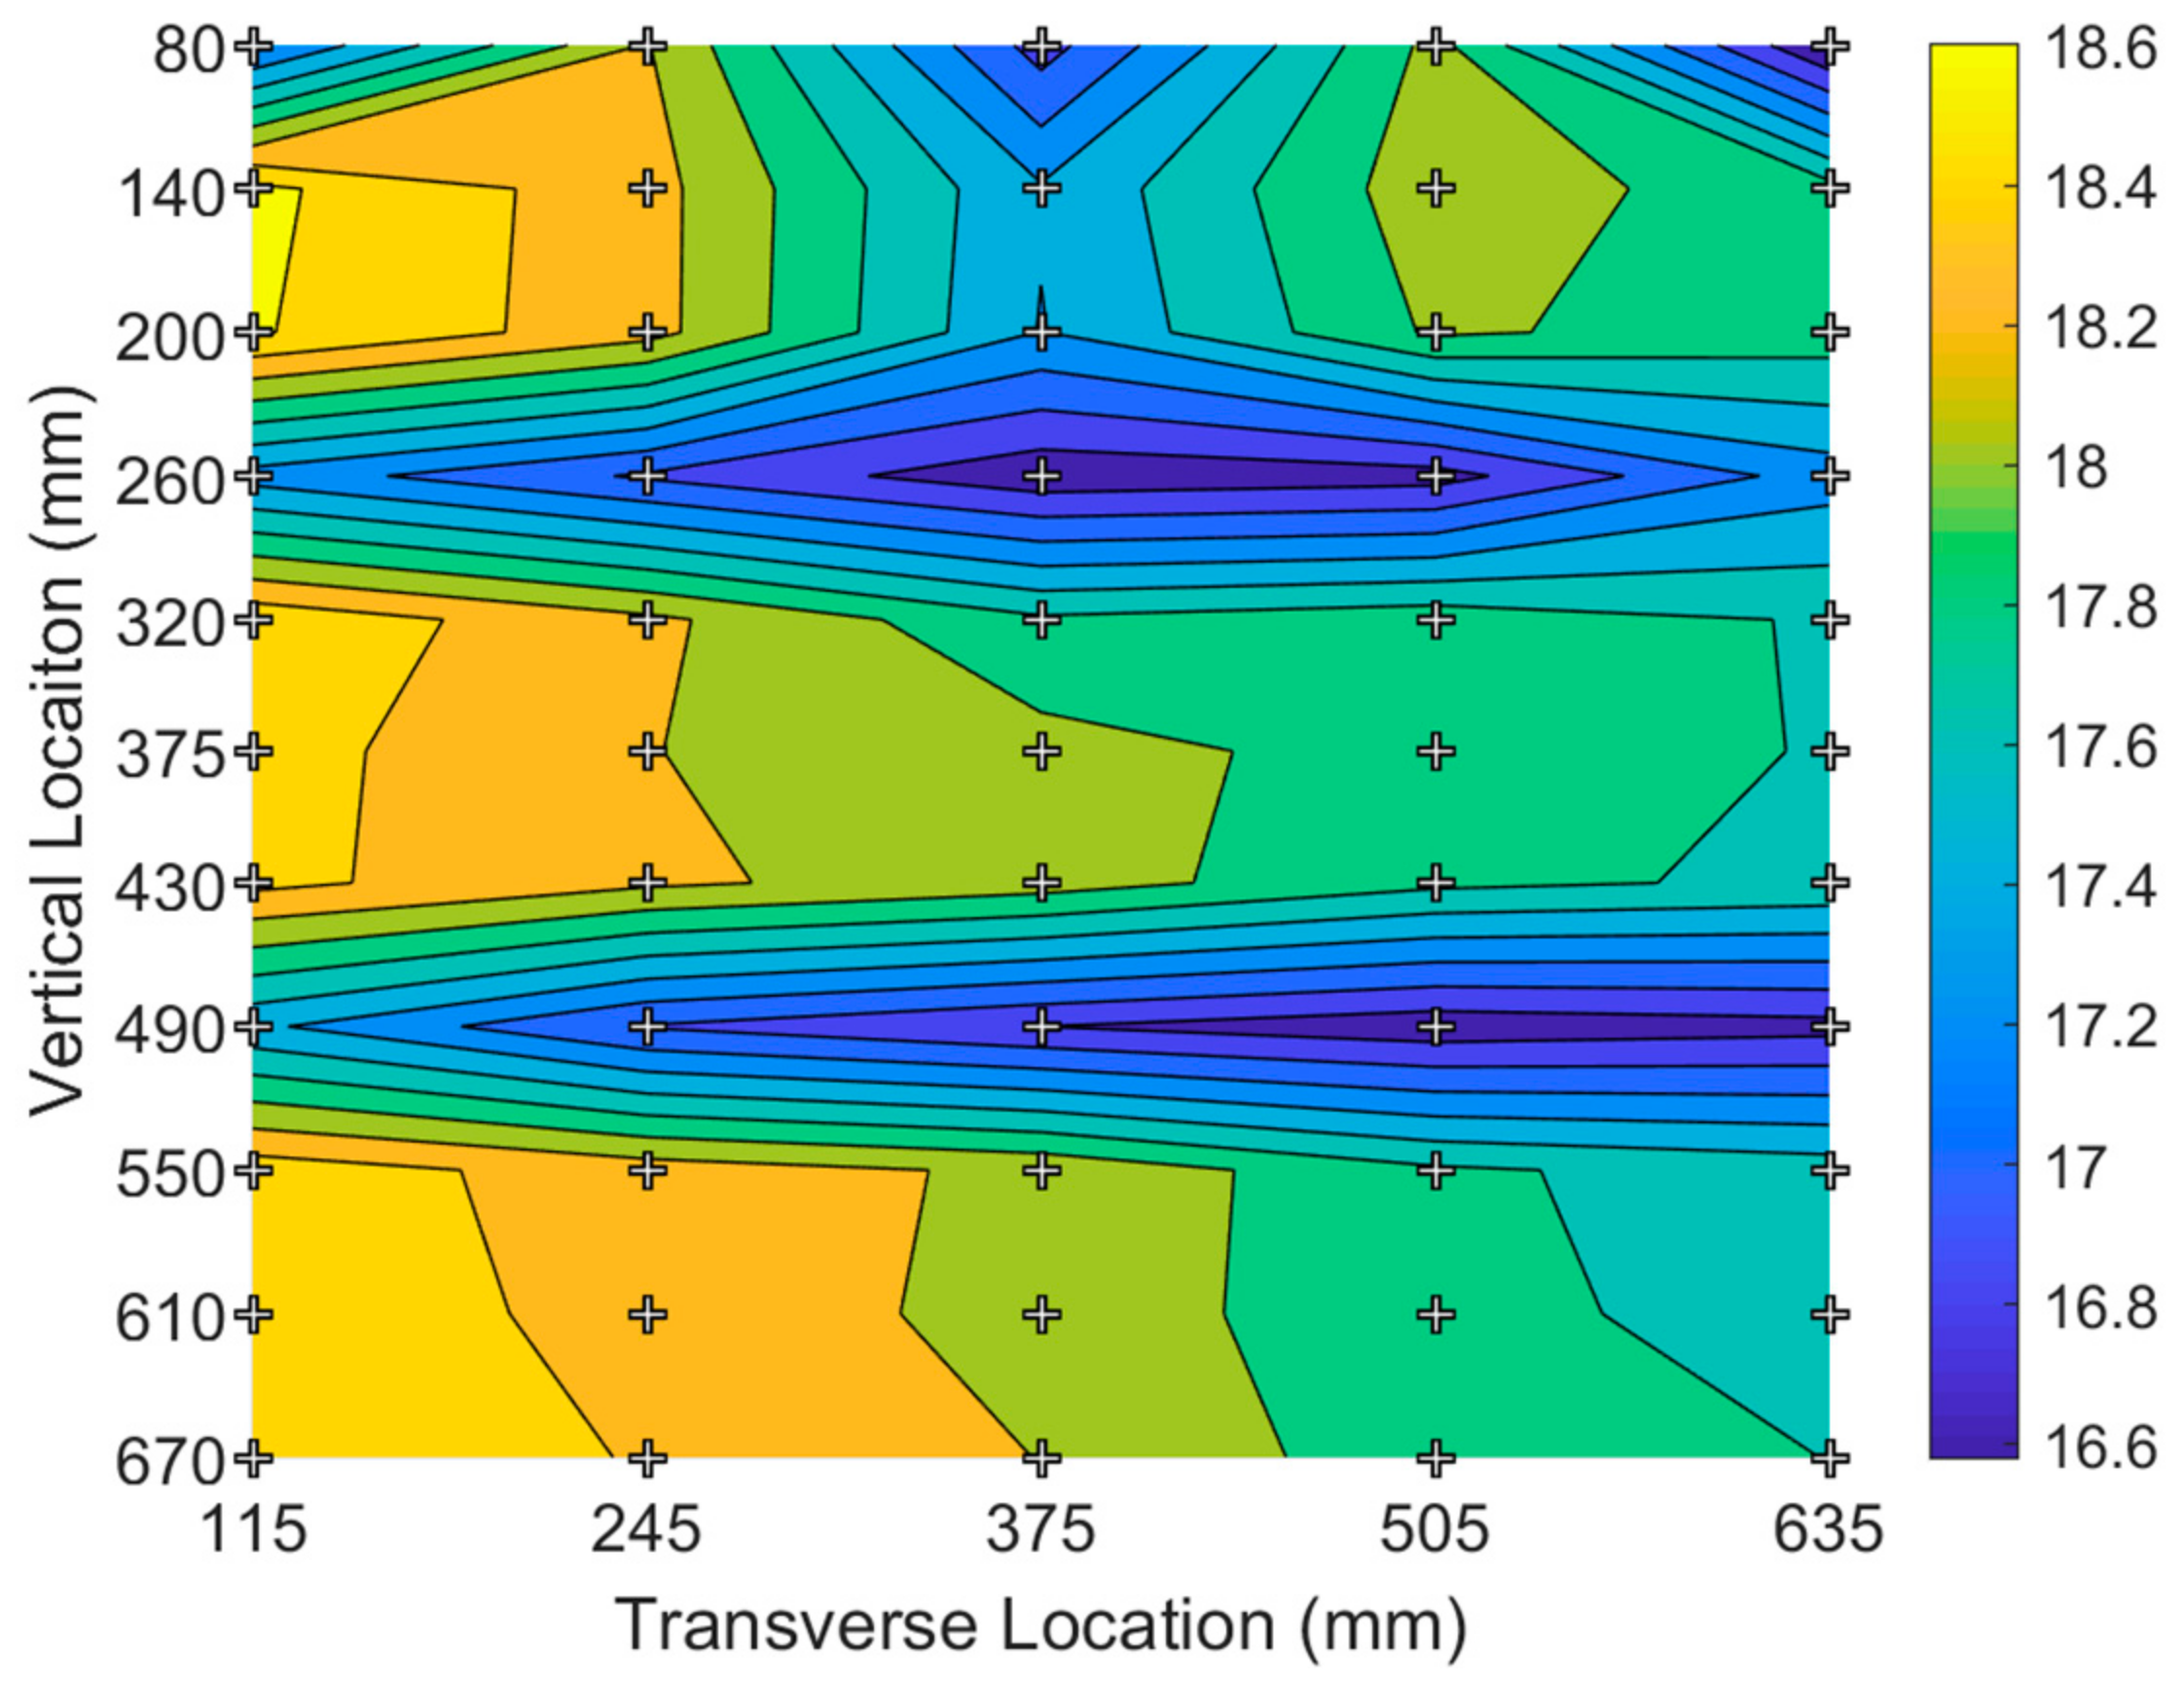
Instantaneous velocities were acquired at each measurement location and time-averaged over 10 s to obtain an average velocity. The spatial variation in the mean velocity for the cross sections are shown as contour plots for the three locations in Figure 8, Figure 9 and Figure 10.
The velocity deficit in the wake of the gust vanes is clearly visible in Figure 8 through Figure 10. The effect was larger near the gust vanes, at 745 mm longitudinally, where the difference between maximum and minimum velocities was approximately 2 m/s. This effect was diminished at the 1495 mm longitudinal location, with differences of the order of 1 m/s between the vane locations and the surrounding points. Calculation of the uncertainty was ±0.75 m/s. This corresponded to an uncertainty of 4.2% of the 18 m/s wind speed. This relatively high uncertainty was caused by the aggregate of the uncertainty related to flow instrumentation in addition to the temperature drift in the tunnel over the duration of the run (there was no active cooling system available in the tunnel).
The magnitude of velocity difference in CFD was similar to the experimental results in the area directly downstream of the airfoils. However, the velocity was affected in a larger region than seen in CFD, likely due to the imperfect airfoil shape and vane alignment uncertainties.
3.1.2. Turbulence Intensities at Longitudinal Cross-Sections
Using the time series data, the turbulence intensity [7] was computed at each measurement point
where TI is the turbulence intensity, is the standard deviation of the wind time series, and is the mean wind speed.
Figure 11, Figure 12 and Figure 13 show the results for turbulence intensities as contour plots at the three longitudinal locations for an angle of attack of 0° (simulating the tunnel in undisturbed condition).
The turbulence intensities varied between 0.055 and 0.066 (5.5% and 6.6%) in the middle of the test section. While this turbulence intensity is high for a research grade tunnel, the facility used here was designed and constructed by undergraduate students and is used primarily for educational purposes with only limited research applications. Turbulence intensities were consistently higher in a small area near the top of the test section. The transition between the contraction and the test section, as well as the various openings for testing equipment in the roof of the test section are likely to have caused this.
These results indicate that the presence of the vanes in the 0° orientation did not introduce significant additional turbulence. While there is an increase in turbulence near the vanes, this dissipated quickly, yielding a uniform flow field further downstream in the test section.
3.2. Characterization of Gusting Conditions
The gusting conditions were implemented at airspeeds of 9 m/s and 18 m/s, with gust vane oscillation angles (deflection angle from streamlined position, oscillating in both clockwise and counterclockwise direction) of ±15°, ±30°, and ±45°. Oscillation frequencies were set at 0.5 Hz, 1 Hz, and 2 Hz.
The velocities were measured using the Dantec MiniCTA hot-wire system employed in the previous characterization. The hot wire was located at the same three downstream positions, and centrally in the tunnel at a height of 200 mm above the tunnel wall. This location was chosen to coincide with position of the shape tested with the gust generator.
Average Velocity Differences and Power Spectra
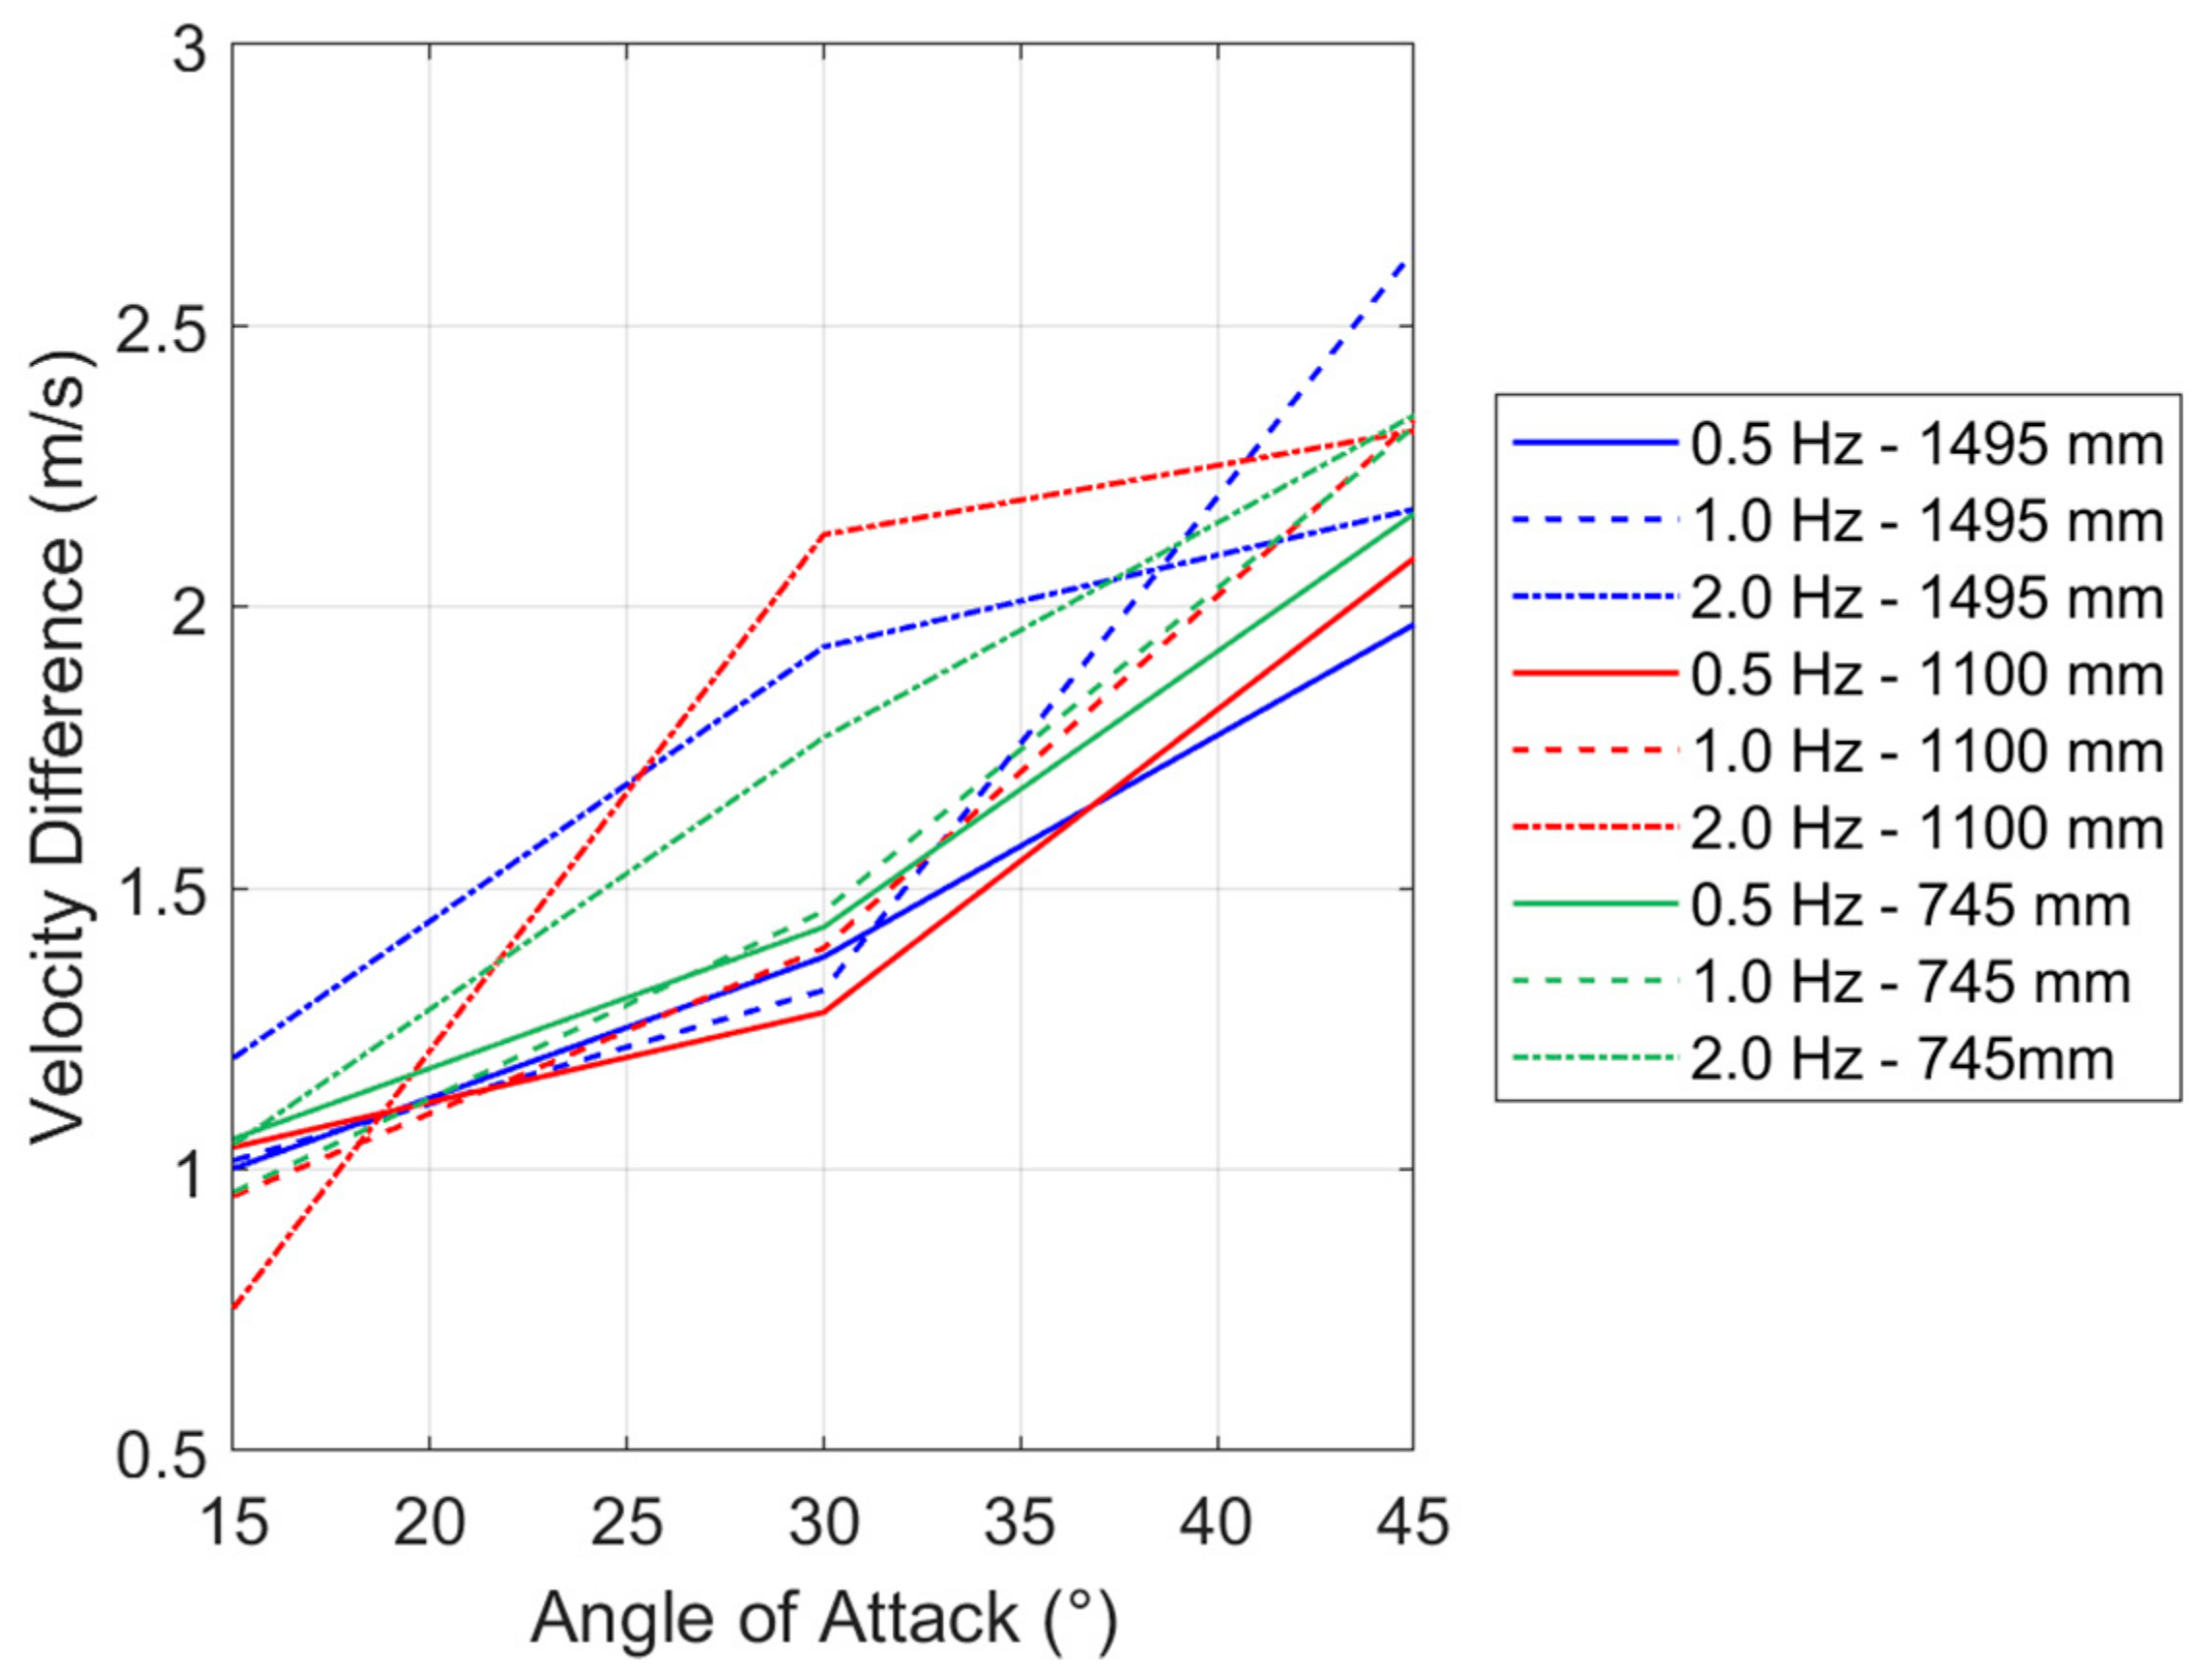
The intensity of the produced gust is the difference between maximum and minimum airspeed in a vane oscillation cycle. Velocity differences were calculated from the minimum and maximum averaged values for each gust. These velocity differences were averaged from all gusts in the time series for each combination of variables, shown in Figure 14 for the 9 m/s wind speed and Figure 15 for the 18 m/s wind speed. Shown in the legends are the oscillation frequencies and longitudinal location as the results vary with angle of attack amplitude. Uncertainty for these measurements ranges between 0.5 m/s and 0.85 m/s. This range of uncertainty is a result of both velocity measurement and temperature variation.
At a wind speed of 18 m/s, the largest average velocity difference was 4.08 m/s. Percentage uncertainty is comparable to the zero angle of attack flow, where it ranged from 4.5% to 5.3% for the highest average wind speed flows and lowest average wind speed flows, respectively.
The positive correlation between angle of attack and gust magnitude is consistent in each case. This was expected due to the tunnel blockage effect, as the airfoils at the higher angle of attack would increase the tunnel blockage resulting in higher velocities outside of the airfoil wake.
There is no clear relationship between the velocity difference and the oscillation frequency for the range tested. All results showed that if the velocity difference increased, it was not by more than 0.85 m/s, and in several cases it decreased.
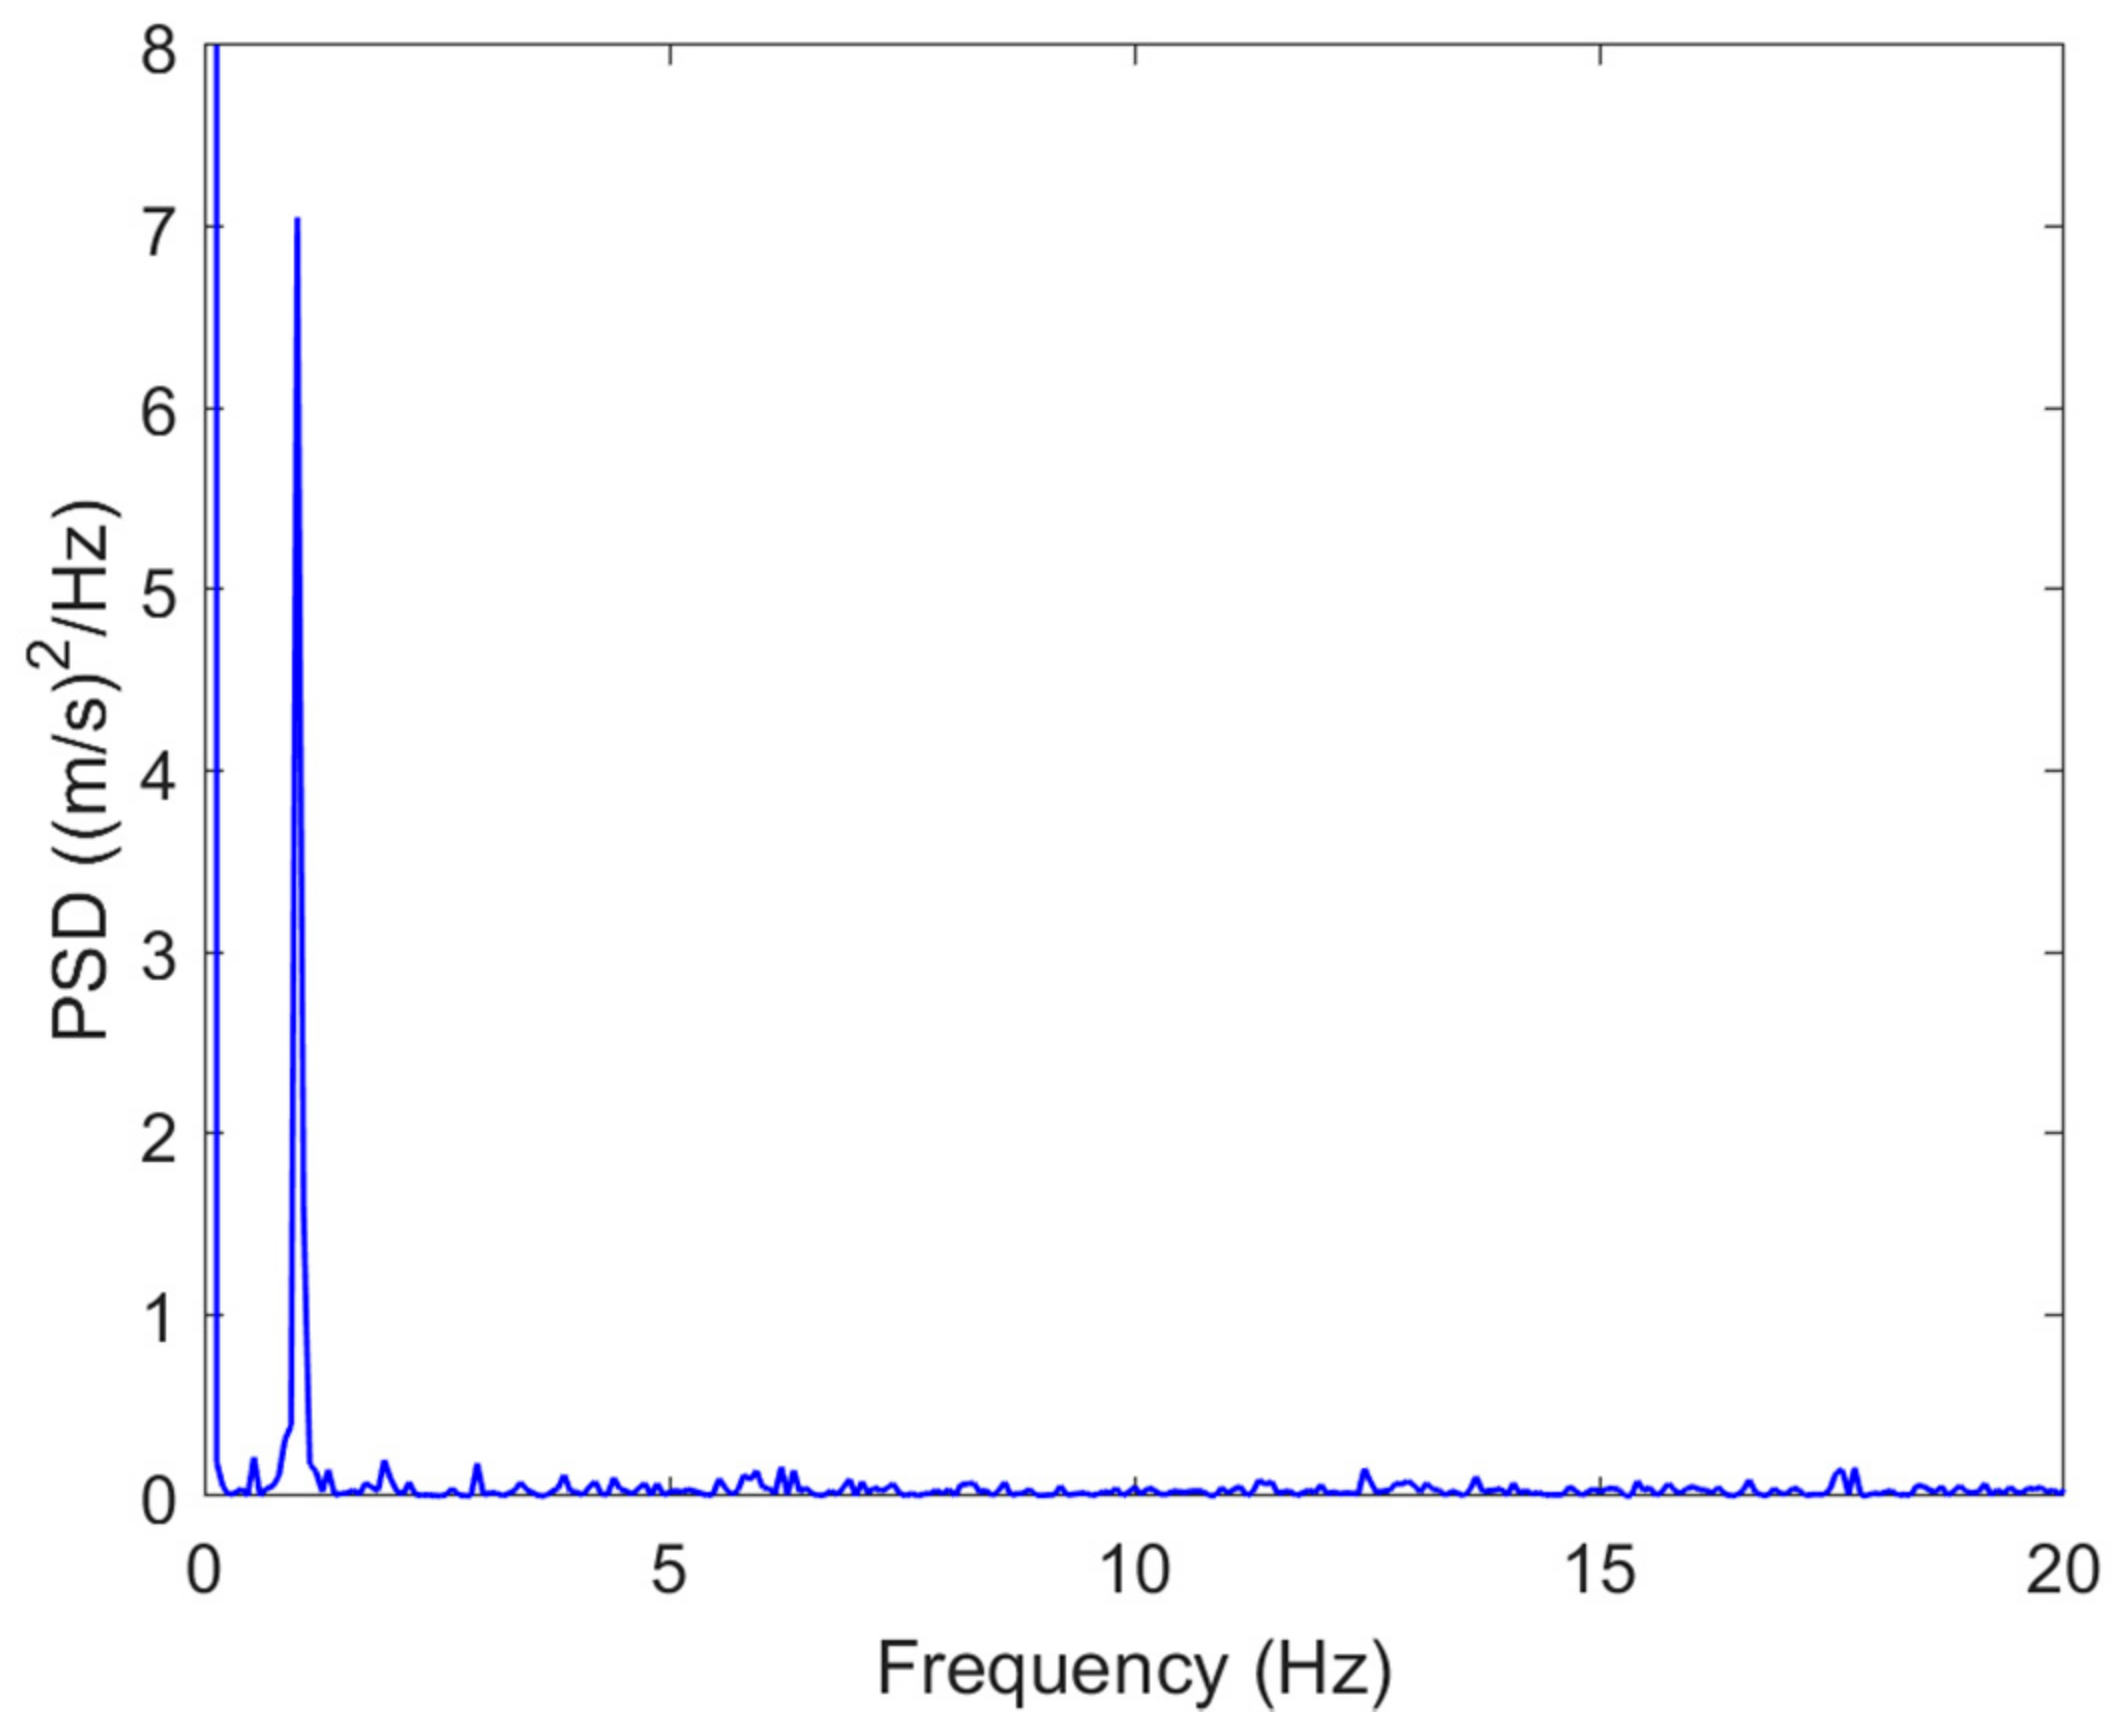
Fourier analysis was performed on all test data set to see if the oscillation frequency was well represented in the power spectrum. Variable combinations with the largest magnitudes in the power spectrum indicate that flow that was less disturbed by unintended frequency due to turbulence. Figure 16 and Figure 17 show a comparison between two tests that had clear peaks in the power spectrum with similar variables, the difference being oscillation frequency.
The largest spike in the power spectrum appeared near the oscillation frequency in both cases. However, the 2 Hz oscillation case had significantly more frequency signals that appeared, meaning the turbulence contained more power in several higher harmonics of the base oscillation frequency than intended.
4. Conclusions
A gust generator was designed and constructed to simulate atmospheric gusting conditions in a low-speed subsonic wind tunnel. An active system, with two horizontal vanes utilizing a NACA0018 airfoil of 150 mm chord length, was chosen based on initial CFD analysis that demonstrated its capacity to generate low-frequency high-magnitude wind gusts. The system was actuated by a sprocket-and-chain system driven by a stepper motor controlled using LabView.
The effect of the installed gust generator (with vanes at zero degrees angle of attack) on the tunnel turbulence distribution was assessed, yielding a localized disturbance in close proximity to the wake, but that dissipated quickly moving downstream into the tunnel. Further, a small velocity deficit in the wake region of the blades was both predicted and observed.
Utilizing oscillation frequencies of up to 2 Hz and windspeeds up to 18 m/s, velocity fluctuations in excess of 4 m/s (22% of freestream) were measured at fluctuation angles of ±45°. Measurements at 9 m/s show similar results, with up to 27% velocity fluctuation also at ±45°. A positive correlation between gust magnitude and fluctuation angles was observed, while the gust magnitude was not sensitive to the gusting frequency over the experimental range (0.5 to 2 Hz). Fourier analysis shows that the oscillation frequency was dominant in the power spectrum.
Further improvements can be achieved by addressing the limitations of the wind tunnel, primarily by improving the baseline tunnel turbulence by utilizing improved turning vanes and screens. Furthermore, additional modes of oscillation can be generated (for example with converging-diverging blade motion) if a dedicated stepper motor is used to drive each vane.
Author Contributions
Conceptualization, A.F. and W.F.; methodology, A.F., W.F. and A.G.; software, A.F.; validation, A.F., W.F., A.G. and Berube; formal analysis, A.F.; investigation, A.F. and W.F.; resources, W.F., A.G. and K.B.; data curation, A.F., W.F. and A.G.; writing—original draft preparation, A.F. and W.F.; writing—review and editing, W.F., A.G. and K.B.; supervision, W.F.; project administration, W.F. All authors have read and agreed to the published version of the manuscript.
Funding
This research received no external funding.
Institutional Review Board Statement
Not applicable.
Informed Consent Statement
Not applicable.
Data Availability Statement
The data presented in this study are available on request from the corresponding author. The data are not publicly available due to privacy reasons.
Acknowledgments
The authors acknowledge the University of Maine Department of Mechanical Engineering and its faculty for the continuing support of the applied aerodynamics research activities and the use of the Crosby Wind Tunnel.
Conflicts of Interest
The authors declare no conflict of interest.
Nomenclature
| UAV | Uncrewed Aerial Vehicle |
| A/D | Analog to Digital |
| CFD | Computational Fluid Dynamics |
| SST | Shear Stress Transport |
| TI | Turbulence intensity (%) |
| Standard deviation of the wind time series (m/s) | |
| Mean wind speed (m/s) | |
| PSD | Power Spectrum Density ((m/s)2/Hz) |
References
- Fernandez, F.; Cleaver, D.; Gursul, I. Unsteady aerodynamics of a wing in a novel small-amplitude transverse gust generator. Exp. Fluids 2021, 62, 9. [Google Scholar] [CrossRef]
- Conrad, N.A. Simulation of Gust Generator-Induced Wind Tunnel Flow Fields. Master’s Thesis, University of Washington, Washington, DC, USA, 7 September 2021. ISBN: 9798641790169. [Google Scholar]
- Liu, Y.; Xie, C.; Yang, C.; Cheng, J. Gust response analysis and wind tunnel test for a high-aspect ratio wing. Chin. J. Aeronaut. 2016, 29, 91–103. [Google Scholar] [CrossRef] [Green Version]
- Roadman, J.; Mohseni, K. Gust Characterization and Generation for Wind Tunnel Testing of Micro Aerial Vehicles. In Proceedings of the 47th AIAA Aerospace Sciences Meeting including the New Horizons Forum and Aerospace Exposition, Orlando, FL, USA, 5–8 January 2009. [Google Scholar] [CrossRef]
- Wu, Z.; Chen, L.; Yang, C. Study on gust alleviation control and wind tunnel test. Sci. China Technol. Sci. 2013, 56, 762–771. [Google Scholar] [CrossRef]
- Mai, H.; Neumann, J.; Hennings, H. Gust response: A validation experiment and preliminary numerical simulations. In Proceedings of the 15th International Forum on Aeroelasticity and Structural Dynamics, Paris, France, 27–30 June 2011. [Google Scholar]
- Navarro-Medina, F.; Sanz-Andres, A.; Perez-Grande, I. Gust wind tunnel study on ballast pick-up by high-speed trains. Exp. Fluids 2012, 52, 105–121. [Google Scholar] [CrossRef] [Green Version]
- Fernández-Cabán, P.L.; Masters, F.J. Effects of Freestream Turbulence on the Pressure Acting on a Low-Rise Building Roof in the Separated Flow Region. Front. Built Environ. 2018, 4, 17. [Google Scholar] [CrossRef]
- Simiu, E.; Yeo, D. Wind Effects on Structures: Modern Structural Design for Wind, 4th ed.; John Wiley & Sons: Hoboken, NJ, USA; ISBN 978-1-119-37588-3.
- Brion, V.; Lepage, A.; Amosse, Y.; Soulevant, D.; Senecat, P.; Abart, J.C.; Paillart, P. Generation of vertical gusts in a transonic wind tunnel. Exp. Fluids 2015, 56, 145. [Google Scholar] [CrossRef]
- Bateman, D. Design and Qualification of an Upstream Gust Generator in a Low-Speed Wind Tunnel. Master’s Thesis, University of Colorado at Boulder, Boulder, CO, USA, 2017. ISBN 978-0-355-64769-3. [Google Scholar]
- Mydlarski, L. A turbulent quarter century of active grids: From Makita (1991) to the present. Fluid Dyn. Res. 2017, 49, 061401. [Google Scholar] [CrossRef]
- Buell, D.A. An Experimental Investigation of the Velocity Fluctuations behind Oscillating Vanes; NASA Technical Note TN-5543; 1969. NTRS-NASA Technical Reports Server. Available online: https://ntrs.nasa.gov/citations/19700001995 (accessed on 10 November 2021).
- French, A. Investigation of Infiltration Measurements Using Wind Induced Pressure Response on an Enclosure. Master’s Thesis, The University of Maine, Orono, ME, USA, 2020. ISBN 9798662426498. [Google Scholar]
- Lancelot, P.M.G.J.; Sodja, J.; Werter, N.P.M.; Breuker, R. Design and Testing of a Low Subsonic Wind Tunnel Gust Generator; Central Aerohydrodynamic Institute (TsAGI): Moscow, Russia, 2017; Available online: https://explore.openaire.eu/search/publication?pid=10.12989%2Faas.2017.4.2.125 (accessed on 10 September 2021). [CrossRef] [Green Version]
- MiniCTA. Dantec Dynamics|Precision Measurement Systems & Sensors. Available online: https://www.dantecdynamics.com/solutions-applications/solutions/fluid-mechanics/constant-temperature-anemometry-cta/minicta/ (accessed on 25 October 2021).
- Jørgensen, F. How to Measure Turbulence with Hot-Wire Anemometers—A Practical Guide. 2005. Available online: https://www.dantecdynamics.com/wp-content/uploads/2020/08/pratical-guide-how-to-measure-turbulence.pdf (accessed on 25 October 2021).
- Zhai, Z.J.; Zhang, Z.; Zhang, W.; Chen, Q.Y. Evaluation of Various Turbulence Models in Predicting Airflow and Turbulence in Enclosed Environments by CFD: Part 1-Summary of Prevalent Turbulence Models. HVACR Res. 2007, 13, 853–870. [Google Scholar] [CrossRef]
- Kline, S.; McClintock, F. Describing Uncertainties in Single-Sample Experiments. Mech. Eng. 1953, 75, 3–8. [Google Scholar]
Figure 1.
Gust generator installed in the wind tunnel.

Figure 2.
Location of the gust vanes in the tunnel in relation to the tunnel test section inlet and outlet.
Figure 2.
Location of the gust vanes in the tunnel in relation to the tunnel test section inlet and outlet.

Figure 3.
Gust vanes under construction.

Figure 4.
CFD mesh with boundary conditions.

Figure 5.
CFD simulation of magnitude of flow velocity in m/s around two 150 mm chord airfoils at zero angle of attack in the wind tunnel test section.
Figure 5.
CFD simulation of magnitude of flow velocity in m/s around two 150 mm chord airfoils at zero angle of attack in the wind tunnel test section.

Figure 6.
CFD simulation of magnitude of flow velocity in m/s for two 150 mm airfoils at 5°angle of attack in wind tunnel test section.
Figure 6.
CFD simulation of magnitude of flow velocity in m/s for two 150 mm airfoils at 5°angle of attack in wind tunnel test section.

Figure 7.
CFD simulation of magnitude of flow velocity in m/s for two 150 mm airfoils at 10° angle of attack in wind tunnel test section.
Figure 7.
CFD simulation of magnitude of flow velocity in m/s for two 150 mm airfoils at 10° angle of attack in wind tunnel test section.

Figure 8.
Contour plot of the average velocity at the 745 mm downstream tunnel cross section: all velocity units are in m/s, and grid points indicate measurement locations.
Figure 8.
Contour plot of the average velocity at the 745 mm downstream tunnel cross section: all velocity units are in m/s, and grid points indicate measurement locations.

Figure 9.
Contour plot of the average velocity at the 1100 mm downstream tunnel cross section: all velocity units are in m/s and grid points indicate measurement locations.
Figure 9.
Contour plot of the average velocity at the 1100 mm downstream tunnel cross section: all velocity units are in m/s and grid points indicate measurement locations.

Figure 10.
Contour plot of the average velocity at the 1495 mm downstream tunnel cross section: all velocity units are in m/s and grid points indicate measurement locations.
Figure 10.
Contour plot of the average velocity at the 1495 mm downstream tunnel cross section: all velocity units are in m/s and grid points indicate measurement locations.

Figure 11.
Turbulence intensity field at the 745 mm longitudinal location: grid points indicate measurement locations.
Figure 11.
Turbulence intensity field at the 745 mm longitudinal location: grid points indicate measurement locations.

Figure 12.
Turbulence intensity field at the 1100 mm longitudinal location: grid points indicate measurement locations.
Figure 12.
Turbulence intensity field at the 1100 mm longitudinal location: grid points indicate measurement locations.

Figure 13.
Turbulence intensity field at the 1495 mm longitudinal location: grid points indicate measurement locations.
Figure 13.
Turbulence intensity field at the 1495 mm longitudinal location: grid points indicate measurement locations.

Figure 14.
Comparison of velocity differences for each combination of variables at 9 m/s wind speed.
Figure 14.
Comparison of velocity differences for each combination of variables at 9 m/s wind speed.

Figure 15.
Comparison of velocity differences for each combination of variables at 18 m/s wind speed.
Figure 15.
Comparison of velocity differences for each combination of variables at 18 m/s wind speed.

Figure 16.
Power spectrum plot of the velocity time series at 745 mm longitudinal distance, 45° angle of attack, 18 m/s wind speed, and 0.5 Hz oscillation frequency.
Figure 16.
Power spectrum plot of the velocity time series at 745 mm longitudinal distance, 45° angle of attack, 18 m/s wind speed, and 0.5 Hz oscillation frequency.

Figure 17.
Power spectrum plot of the velocity time series at 745 mm longitudinal distance, 45° angle of attack, 18 m/s wind speed, and 2 Hz oscillation frequency.
Figure 17.
Power spectrum plot of the velocity time series at 745 mm longitudinal distance, 45° angle of attack, 18 m/s wind speed, and 2 Hz oscillation frequency.

Publisher’s Note: MDPI stays neutral with regard to jurisdictional claims in published maps and institutional affiliations. |
© 2021 by the authors. Licensee MDPI, Basel, Switzerland. This article is an open access article distributed under the terms and conditions of the Creative Commons Attribution (CC BY) license (https://creativecommons.org/licenses/by/4.0/).
Share and Cite
MDPI and ACS Style
French, A.; Friess, W.; Goupee, A.; Berube, K. Design, Construction and Evaluation of an Oscillating Vane Gust Generator for Atmospheric Flow Simulation. Wind 2021, 1, 63-76. https://0-doi-org.brum.beds.ac.uk/10.3390/wind1010004
AMA Style
French A, Friess W, Goupee A, Berube K. Design, Construction and Evaluation of an Oscillating Vane Gust Generator for Atmospheric Flow Simulation. Wind. 2021; 1(1):63-76. https://0-doi-org.brum.beds.ac.uk/10.3390/wind1010004
Chicago/Turabian StyleFrench, Aaron, Wilhelm Friess, Andrew Goupee, and Keith Berube. 2021. "Design, Construction and Evaluation of an Oscillating Vane Gust Generator for Atmospheric Flow Simulation" Wind 1, no. 1: 63-76. https://0-doi-org.brum.beds.ac.uk/10.3390/wind1010004