
Sugar as an Analogue for Snow in Penetration Testing: A Preliminary Comparison


School of Science, Technology and Engineering, University of the Sunshine Coast, Sippy Downs 4556, Australia
*
Author to whom correspondence should be addressed.
†
These authors contributed equally to this work.
Powders 2022, 1(1), 33-46; https://0-doi-org.brum.beds.ac.uk/10.3390/powders1010004
Submission received: 10 January 2022
/
Revised: 7 February 2022
/
Accepted: 11 February 2022
/
Published: 24 February 2022
(This article belongs to the Special Issue Feature Papers in Powders)
Abstract
:Snow is a sintered matrix of ice, the strength of which is determined by the number and size of bonds between ice grains. However, because snow is a thermally unstable material, it is problematic to transport and store samples for accurate ex situ testing of mechanical behaviour. As an analogue for snow, we examined the sintering behaviour of different types of granular sugar at different humidities over different temporal periods and then assessed the extent of sintering and resistance to penetration of these samples. Like snow, increased sintering occurs in sugar over time. Sintering extent and rate are affected by the humidity environment and penetration resistance generally increases after increased sintering time. This preliminary examination suggests that in the absence of snow testing facilities, humidity-controlled sintered sugar may serve as a valuable proxy for examining the temporal variation of penetration resistance in snow.
1. Introduction
Understanding the mechanical properties of snow and ice is necessary for the efficient design and construction of cold regions infrastructure. Testing and evaluation is most commonly undertaken in situ or using samples within cold labs. However, there is an inevitable uncertainty as to the accuracy of results obtained from ex situ testing. Therefore, development of suitable proxies for snow, such as sugar or foam, is valuable, potentially enabling further research in this field. Snow has been specifically considered as a foam or a cellular solid by Brown [1], Petrovic [2] and others including Johnson [3]; Kirchner et al. [4] particularly examined the use of foam as a mechanical proxy for snow. Sugar is a crystalline particulate that sinters or bonds within different humidity environments, and fractures upon penetration; could sugar be a viable analogue for snow, for the purposes of mechanical testing?
In this paper, we briefly review the processes of sintering and then investigate the properties of sugar as an analogue for snow in penetration testing. We examine the sintering properties of three different types of sugar when subjected to different humidities over a thirty day period, and then we assess the resistance to penetration of these samples. We demonstrate that under specific environmental conditions, some sintered sugars may exhibit characteristics that enable their use as a proxy or analogue for various snow types in penetration testing.
2. Background
Blackford [5], in her review of ice, defined sintering as a thermal treatment for bonding particles into a coherent, predominantly solid structure via mass transport events that often occur on the atomic scale and Paterson [6] said that sintering of ice and snow is driven by the thermodynamical requirement to decrease surface energy, inducing an increase in both density and strength. The initial stages involve the transformation of the snow ice crystals into a spherical form. Because the radius of an ice particle is larger than the concave radius of the bond joining it to an adjacent ice particle, there is a driving force to move mass to this concave neck area. Two previously spherical particles start tending towards a dumb-bell shaped particle joined by a neck; this bonding leads to improved strength and a lower energy system [7].
This process of mass distribution occurs throughout the sintering process. When this process occurs under additional pressure such as when snow is buried owing to accumulation, it is termed pressure sintering, and the rate of sintering is increased. Material densification results from the sintering process; however, Alley [8] clarifies that although numerous processes occur throughout the pressure sintering process, not all contribute to densification. Herron and Langway [9] identified three main phases in the densification process: settling and packing of particles, pore-space reduction, then pore-space closure. In snow, the densification process slows down in each stage, and also occurs intermittently throughout the year, depending on accumulation rates [10]. This process of intermittent densification was recently demonstrated by Einav and Guillard [11] using rice crispies and was previously described as self-organised criticality by Sammonds [12].
The primary mechanical observation to be drawn from this discussion is that the strength of snow is controlled by the size of the bonds formed between grains through sintering [13] and that the rate and amount of sintering occurs at different rates under varying environmental conditions.
The increase in snow strength attained over time can be assessed in various ways [14]. One of the most efficient means is penetration testing. Schneebeli [15] has extensively examined the strength of snow undergoing penetration with a micro-penetrometer and McCallum [16] has examined such behaviour using a friction-sleeve-equipped cone penetrometer. More recently, Peinke et al. [17] examined snow sintering at microscopic and macroscopic scales with high-resolution cone penetration tests. They showed that macroscopic penetration force increased over time due to microstructural bond strengthening.
In the absence of snow, other analogues have served as a proxy to describe the behaviour of snow under mechanical testing; these include:
- Geomaterials. Leroueil and Vaughan [20] showed that deposits normally treated as soils usually have characteristics due to bonded structure which are similar to those of porous weak rock, resulting in mechanically stiff behaviour followed by yield. They showed that such characteristics are common in natural geological materials and that it is the structure of weak rock and cemented sands that gives them their strength. This structure, arising from different causes, gives similar behaviour in many different materials including snow [20].
- Sedimentary material. Snow has historically been viewed specifically as a sedimentary material (Benson [21], Pielmeier and Schneebeli [22] and Schweizer et al. [23] amongst others) that ultimately may develop structure and thus behave in accordance with Leroueil and Vaughan’s supposition [20] above.
- Porous Rock. Leite and Ferland [24], in their work on the indentation of porous material, note linear elasticity, yielding and structural collapse at a critical value, and strain hardening as the crushed material is compacted; all these behaviours are observed in the penetration of snow (of certain density). Tharp [25], in his work on polyphase rocks, suggests that incompetent phases (essentially non-load-bearing phases such as air) within a material result in the load-carrying framework behaving much like a porous solid, and snow has been considered as such by numerous authors including Brown [1], Kirchner et al. [4], and Petrovic [2].
- Foam. Snow has been specifically considered as a foam or a cellular solid by Brown [1], Kirchner et al. [4], Petrovic [2] and others including Johnson [3]. In his work on a statistical micromechanical theory for penetration in granular materials, Johnson [3] draws upon initial work presented by Gibson and Ashby [26], who examine the behaviour of foam under penetration in their review of the behaviour of cellular solids. Examination of Gibson and Ashby’s work [26] suggests that below the pore close-off density of ∼840 kg m, snow might be regarded as an open-cellular foam, whilst above this density, description as a closed-cellular foam may be appropriate.
- Polycrystalline ice. The main constituent of dry snow is ice, thus snow’s behaviour must tend towards that of polycrystalline ice as density increases. Nicot [27] states that on the microscopic scale, the behaviour of grain bonds (within snow) is governed by the behaviour of ice, Gubler [28] describes the load-bearing capacity of snow in terms of ice chains, and Bartelt and von Moos [29] note the straining of the ice lattice within snow during triaxial testing. Graphs of stress versus strain rate generated by Kinosita [30] through loading of snow are almost identical in form to those presented by Schulson [31] for polycrystalline ice.
Numerous analogues have been used successfully as a proxy for snow. We suggest that granular sugar may be a low-cost and readily available material that could be used to simulate the mechanical behaviour of snow.
3. Sugar as an Analogue for Snow?
Sugar is a synthesised organic material available in several shapes and sizes [32]. Raw sugars are refined and softened by removing the molasses coating through the process of affination [33]. The resulting syrup is then processed by precipitating and filtering solids in the syrup, then the liquor is spun using a centrifuge, separating the white crystals from the solution. These white crystals are dried in hot air and can then be used or packaged [34].
When stored in a sealed container, bonding between sugar grains is not evident [35]. However, when stored in a high humidity environment, sugar crystals bond; Bagster [36] speculated that these intergranular bonds form via crystalline bridging. Bagster [35] demonstrated an increase in raw sugar shear strength over time (out to ∼100 days), in a constant humidity environment. Zafar et al. [37] showed that sintering in a ’powder’ such as sugar is influenced by time, temperature and moisture, and that increased bonding will result in an increase in material strength, similar to what is observed in dry snow.
We consider different sugar types (and grain sizes) as a proxy for different-sized snow grains, and we consider the variation in sintering over time, as for snow. Moreover, we consider the extent of sintering and the increase in strength for the sugars, at different humidity environments (at room temperature). This may serve as a proxy for different temperatures in snow sintering; because: the rate of sintering in snow, increases with greater temperatures [38], and the rate of sintering in sugar, increases with greater humidity [37].
4. Materials and Methods
Three types of refined sugar, of different grain size, raw, white and caster, were selected for testing; sugar densities were 1237, 1367 and 1225 kg m, respectively. An amount of 500 g of each sugar type was used to determine a representative particle size distribution (sieve analysis); testing was conducted in accordance with AS 1289.3.6.1-2009. Three humidity environments were then established for each of five temporal periods in fifteen 240 mm × 210 mm × 100 mm plastic containers. Relative humidity (RH) within each container was established using particular types and quantities of saturated salt solutions, as described by Greenspan [39] (Table 1).
A small hole was drilled in the base of each container to enable insertion of temperature and humidity probe cables; these cables were connected to an Arduino UNO V2.0 Board and Expansion Board and then via USB to a PC.
Penetration testing of each sugar type, subjected to each of the three humidity environments, was envisaged after periods of 1, 5, 11, 18 and 25 days, and therefore 135 sugar samples were prepared in small aluminium dishes of diameter 80 mm and height 63 mm, and three samples of each sugar type were placed in each of the 15 plastic humidity containers. Aluminium dish dimensions were chosen to ensure that sufficient distance was maintained between the 22 mm diameter circular indentor and the dish boundary during penetration testing [26].
4.1. Penetration Testing
Compressive loading via plates or indenters is the standard method for assessing the mechanical properties of snow (Wuori [40]; Abele [41,42]; Huang and Lee [43]; McCallum [44]; Peinke et al. [45]) and indentation tests have been used extensively in vehicle/snow interaction studies to obtain stress/displacement relationships (Jellinek [46]; Yong et al. [47]; Edens and Brown [48]; Shoop and Alger [49]).
A 10 kN Shimadzu AGS-X table-top universal test frame and manufactured cylindrical stainless-steel 22 mm diameter indenter was used to generate Force (N) versus displacement (mm) data for each sugar sample; these data were then converted to stress (kPa) and strain (%). Penetration rate was 0.1 mm s; penetration depth was limited to 20 mm. Three samples were tested for each sugar type (raw, white and caster), from each humidity environment (33, 75 and 98%) after a period of 1, 5, 11, 18 and 25 days, resulting in a total of 135 penetration tests; data were saved as .csv files.
4.2. Light Microscopy
During the 25 day testing period each sample was observed using an Olympus BX53M light microscope (Olympus Corporation, Shinjuku, Tokyo, Japan) to visually identify macroscopic sintering processes of grain necking, coarsening and densification. Olympus calibration software was used to align each sample under the scope and focused images were optimised for maximum contrast then saved as .jpeg files. Samples were observed for a short period of time (typically < 5 min) to minimise temperature/humidity variation.
5. Results and Discussion
5.1. Particle Size Distribution
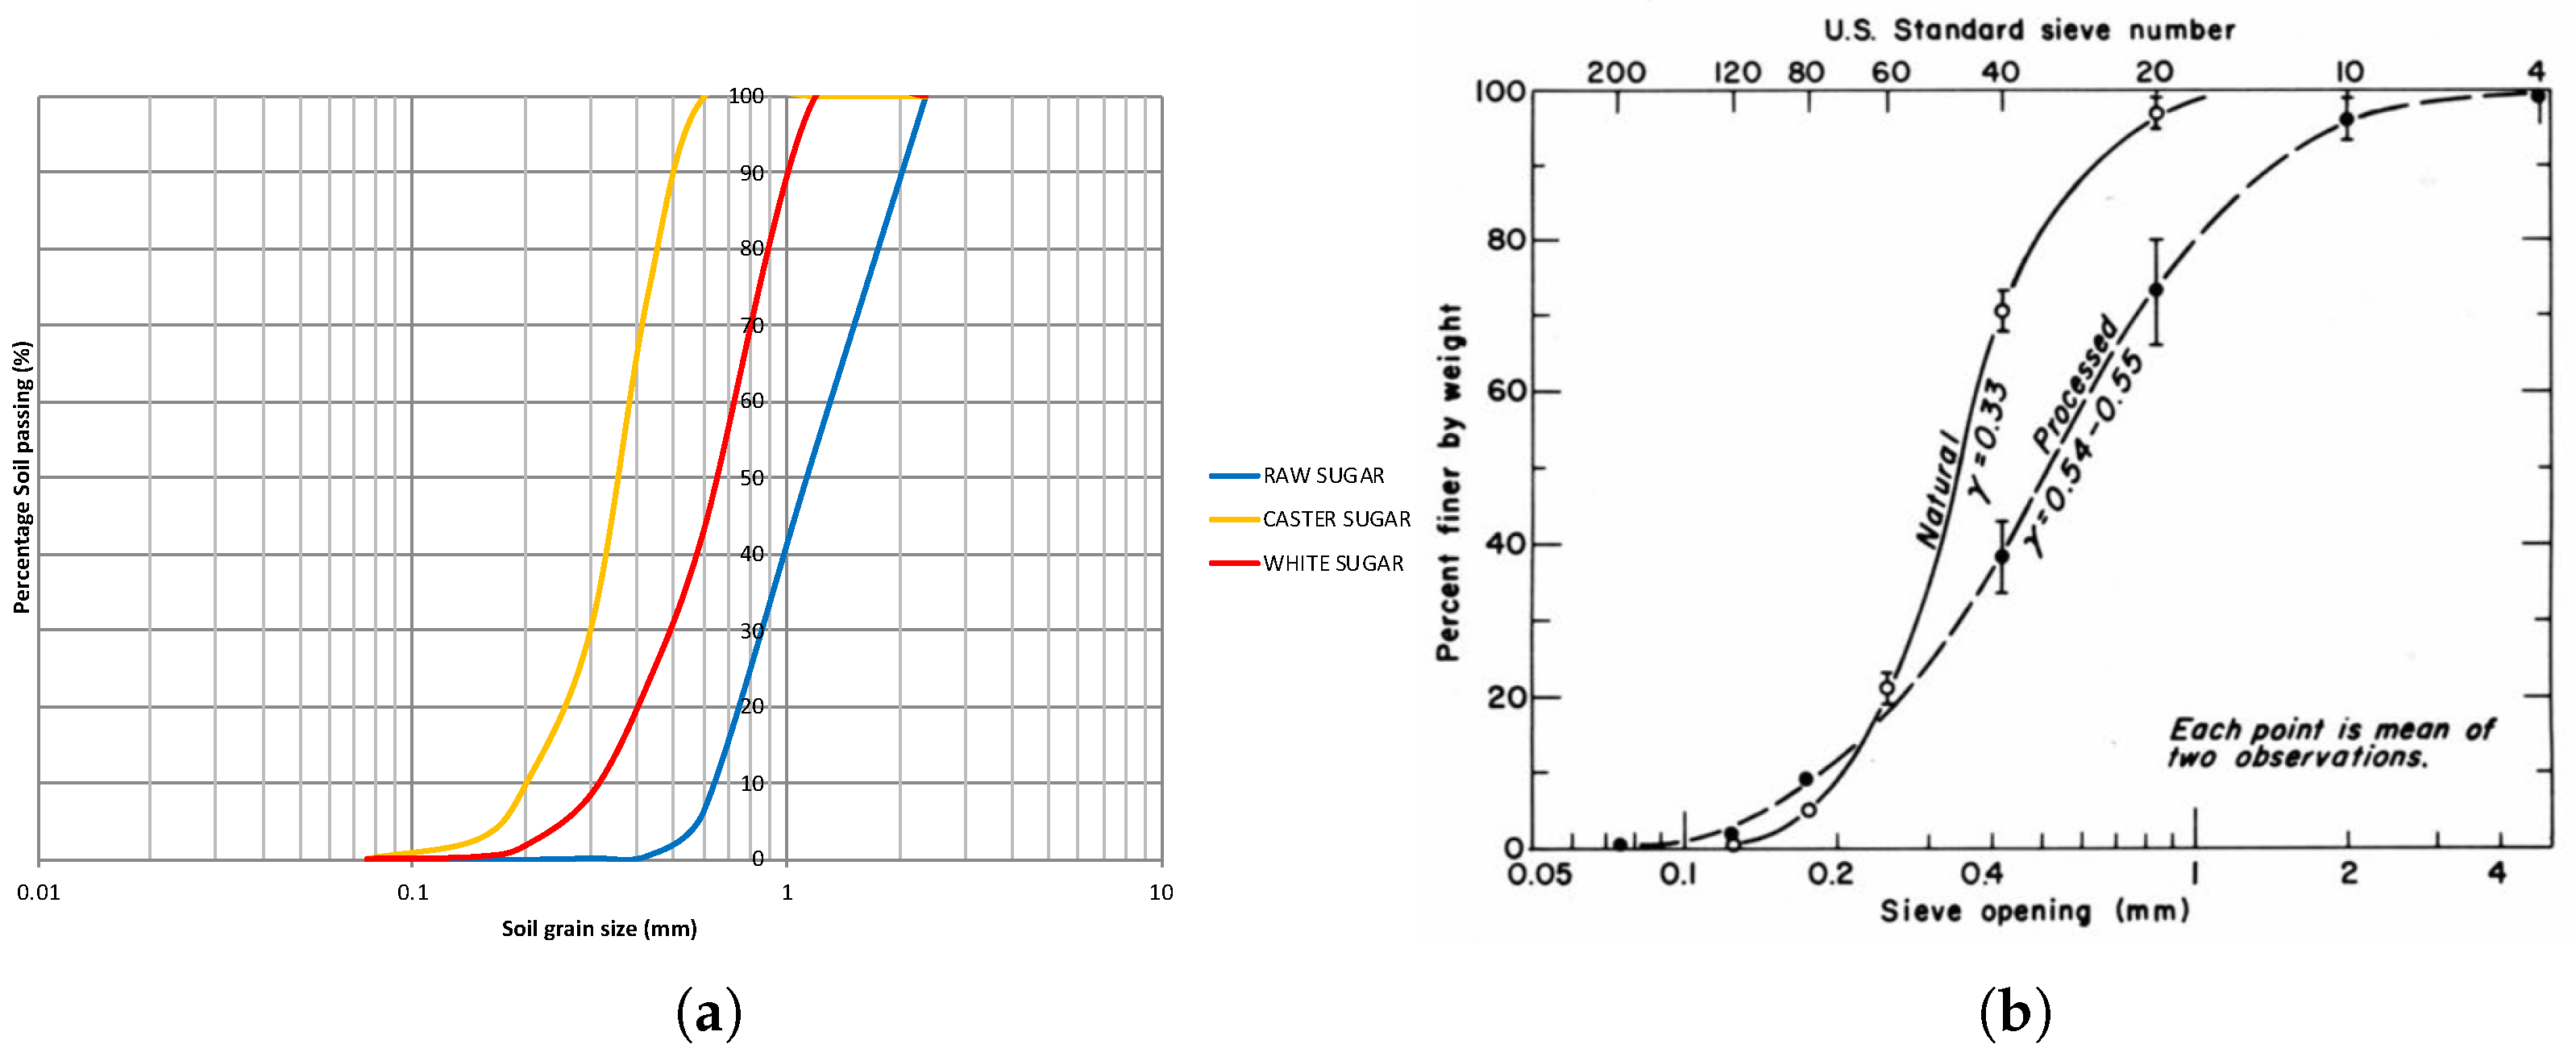
The particle size distribution for each sugar type is shown in Figure 1. These results suggest all samples were poorly graded or of consistent grain size. This is expected for manufactured sugar that has not experienced significant disturbance.
5.2. Sample Temperature and Relative Humidity
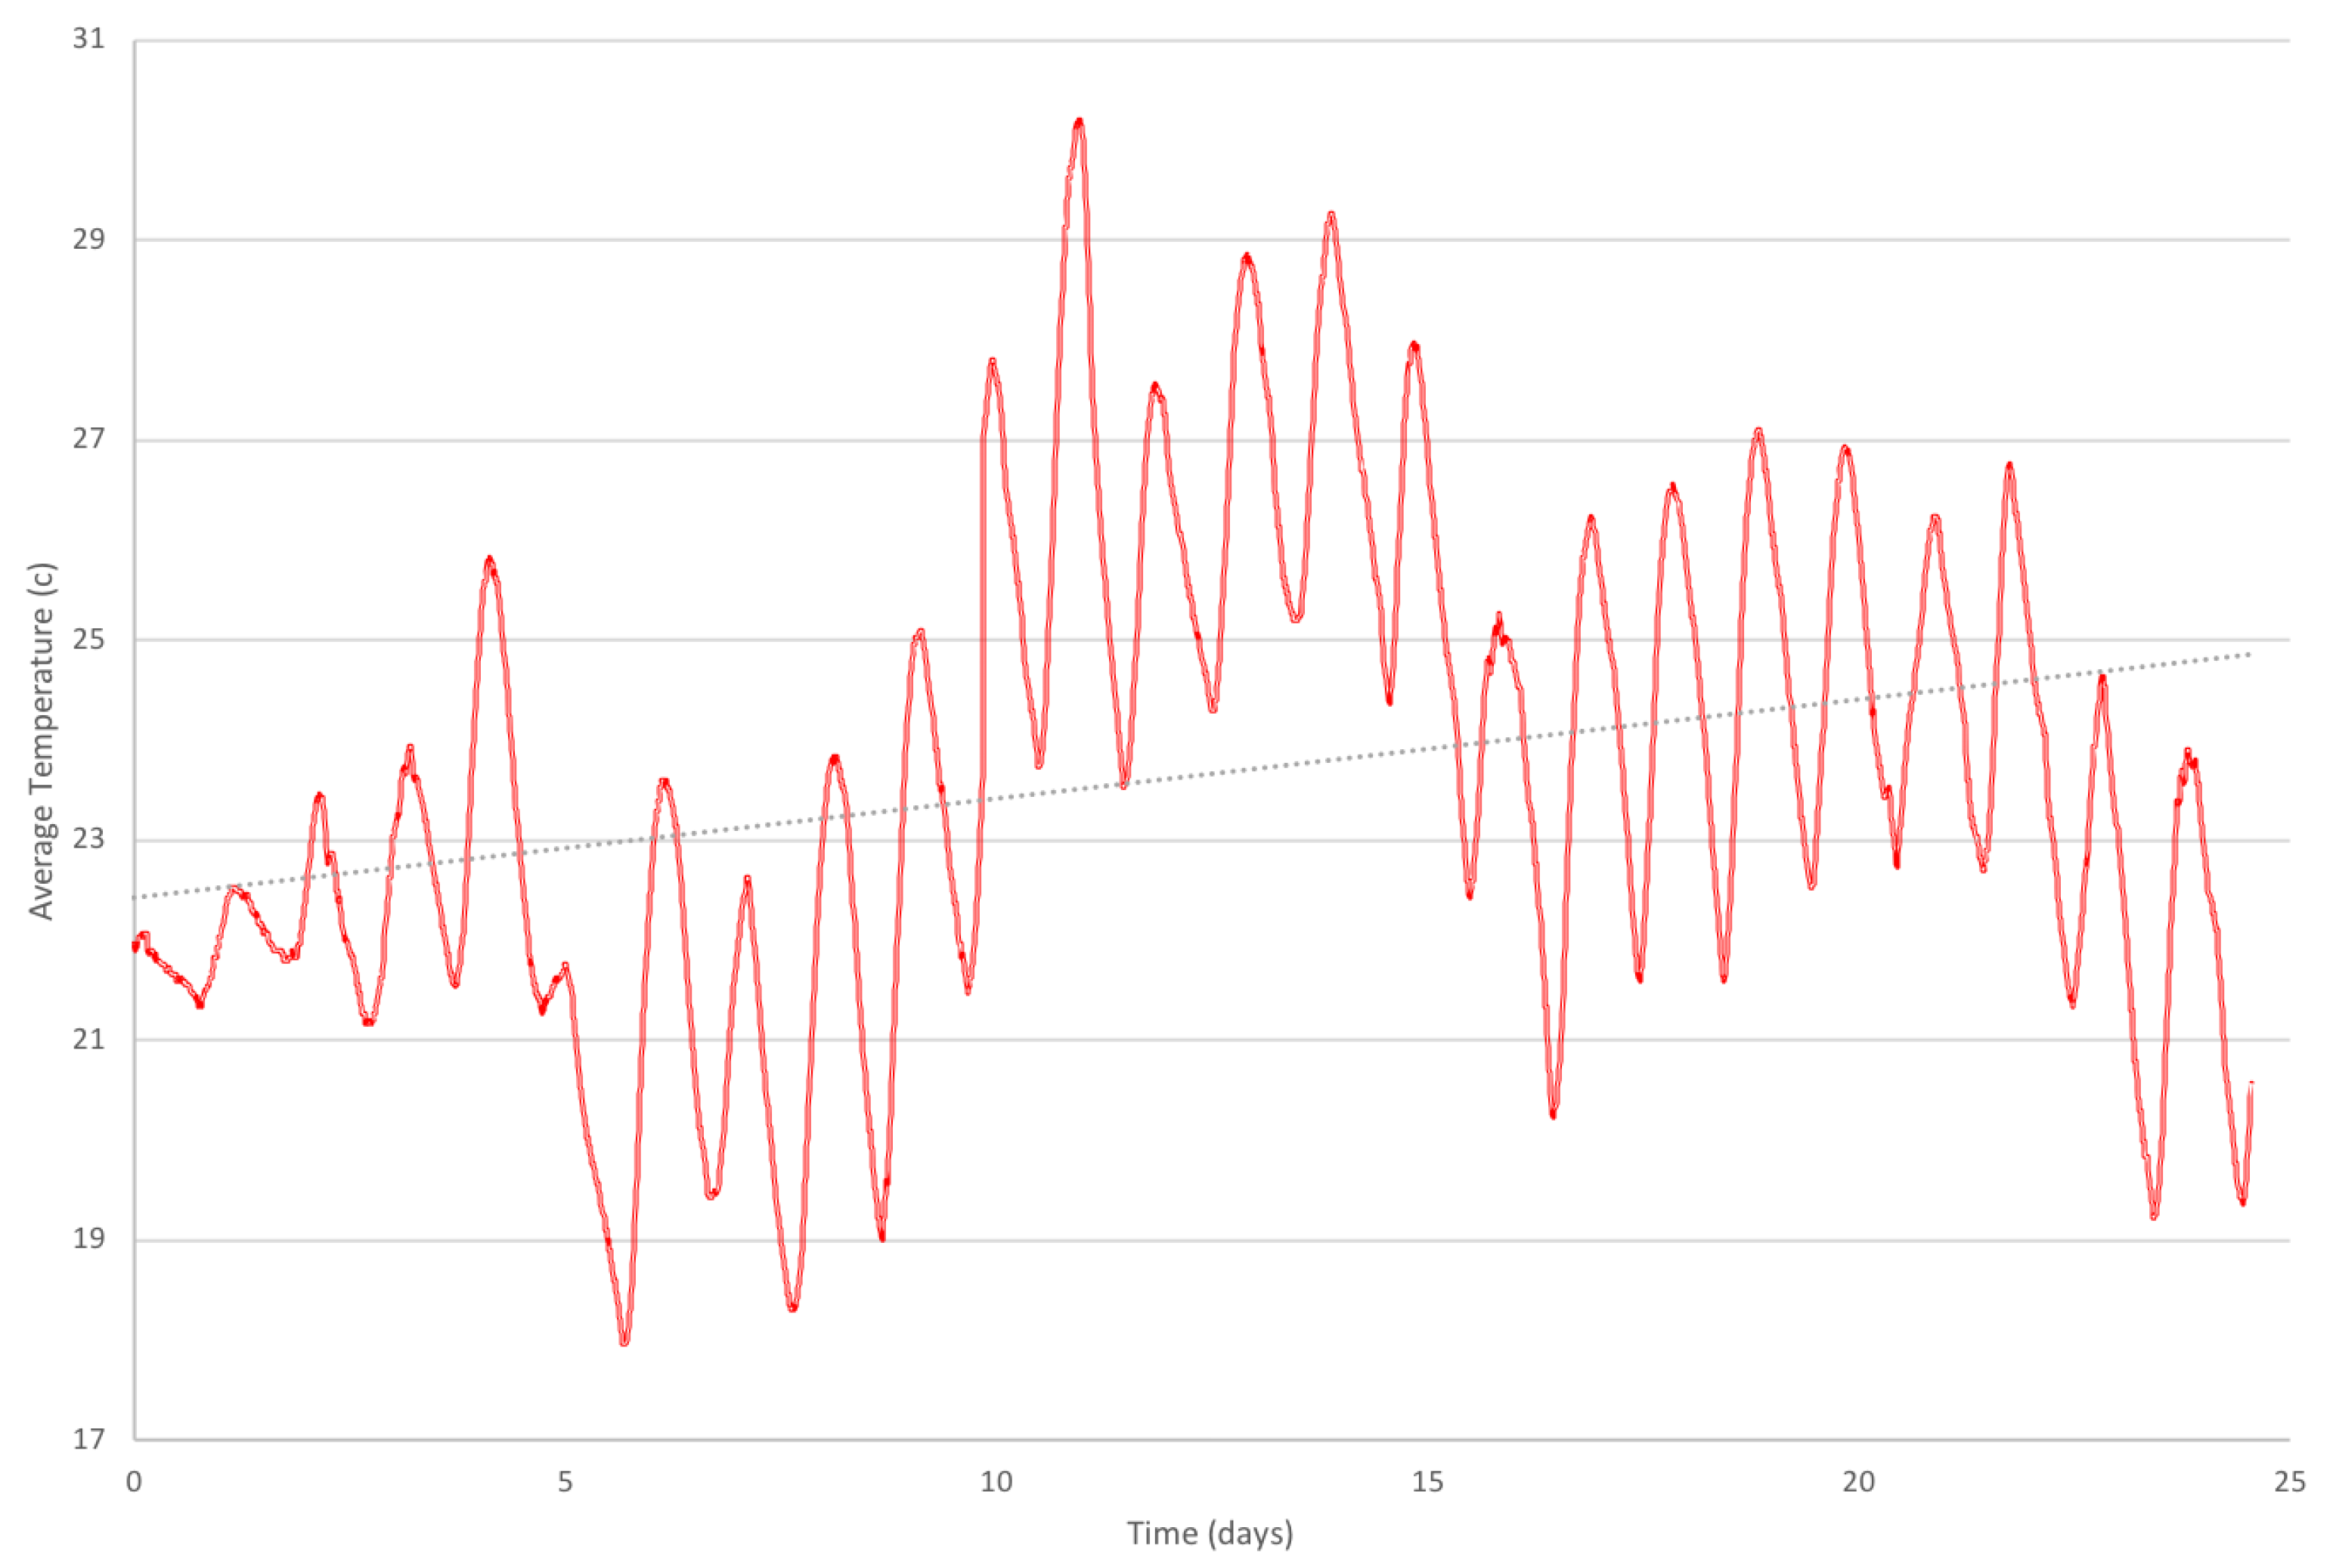
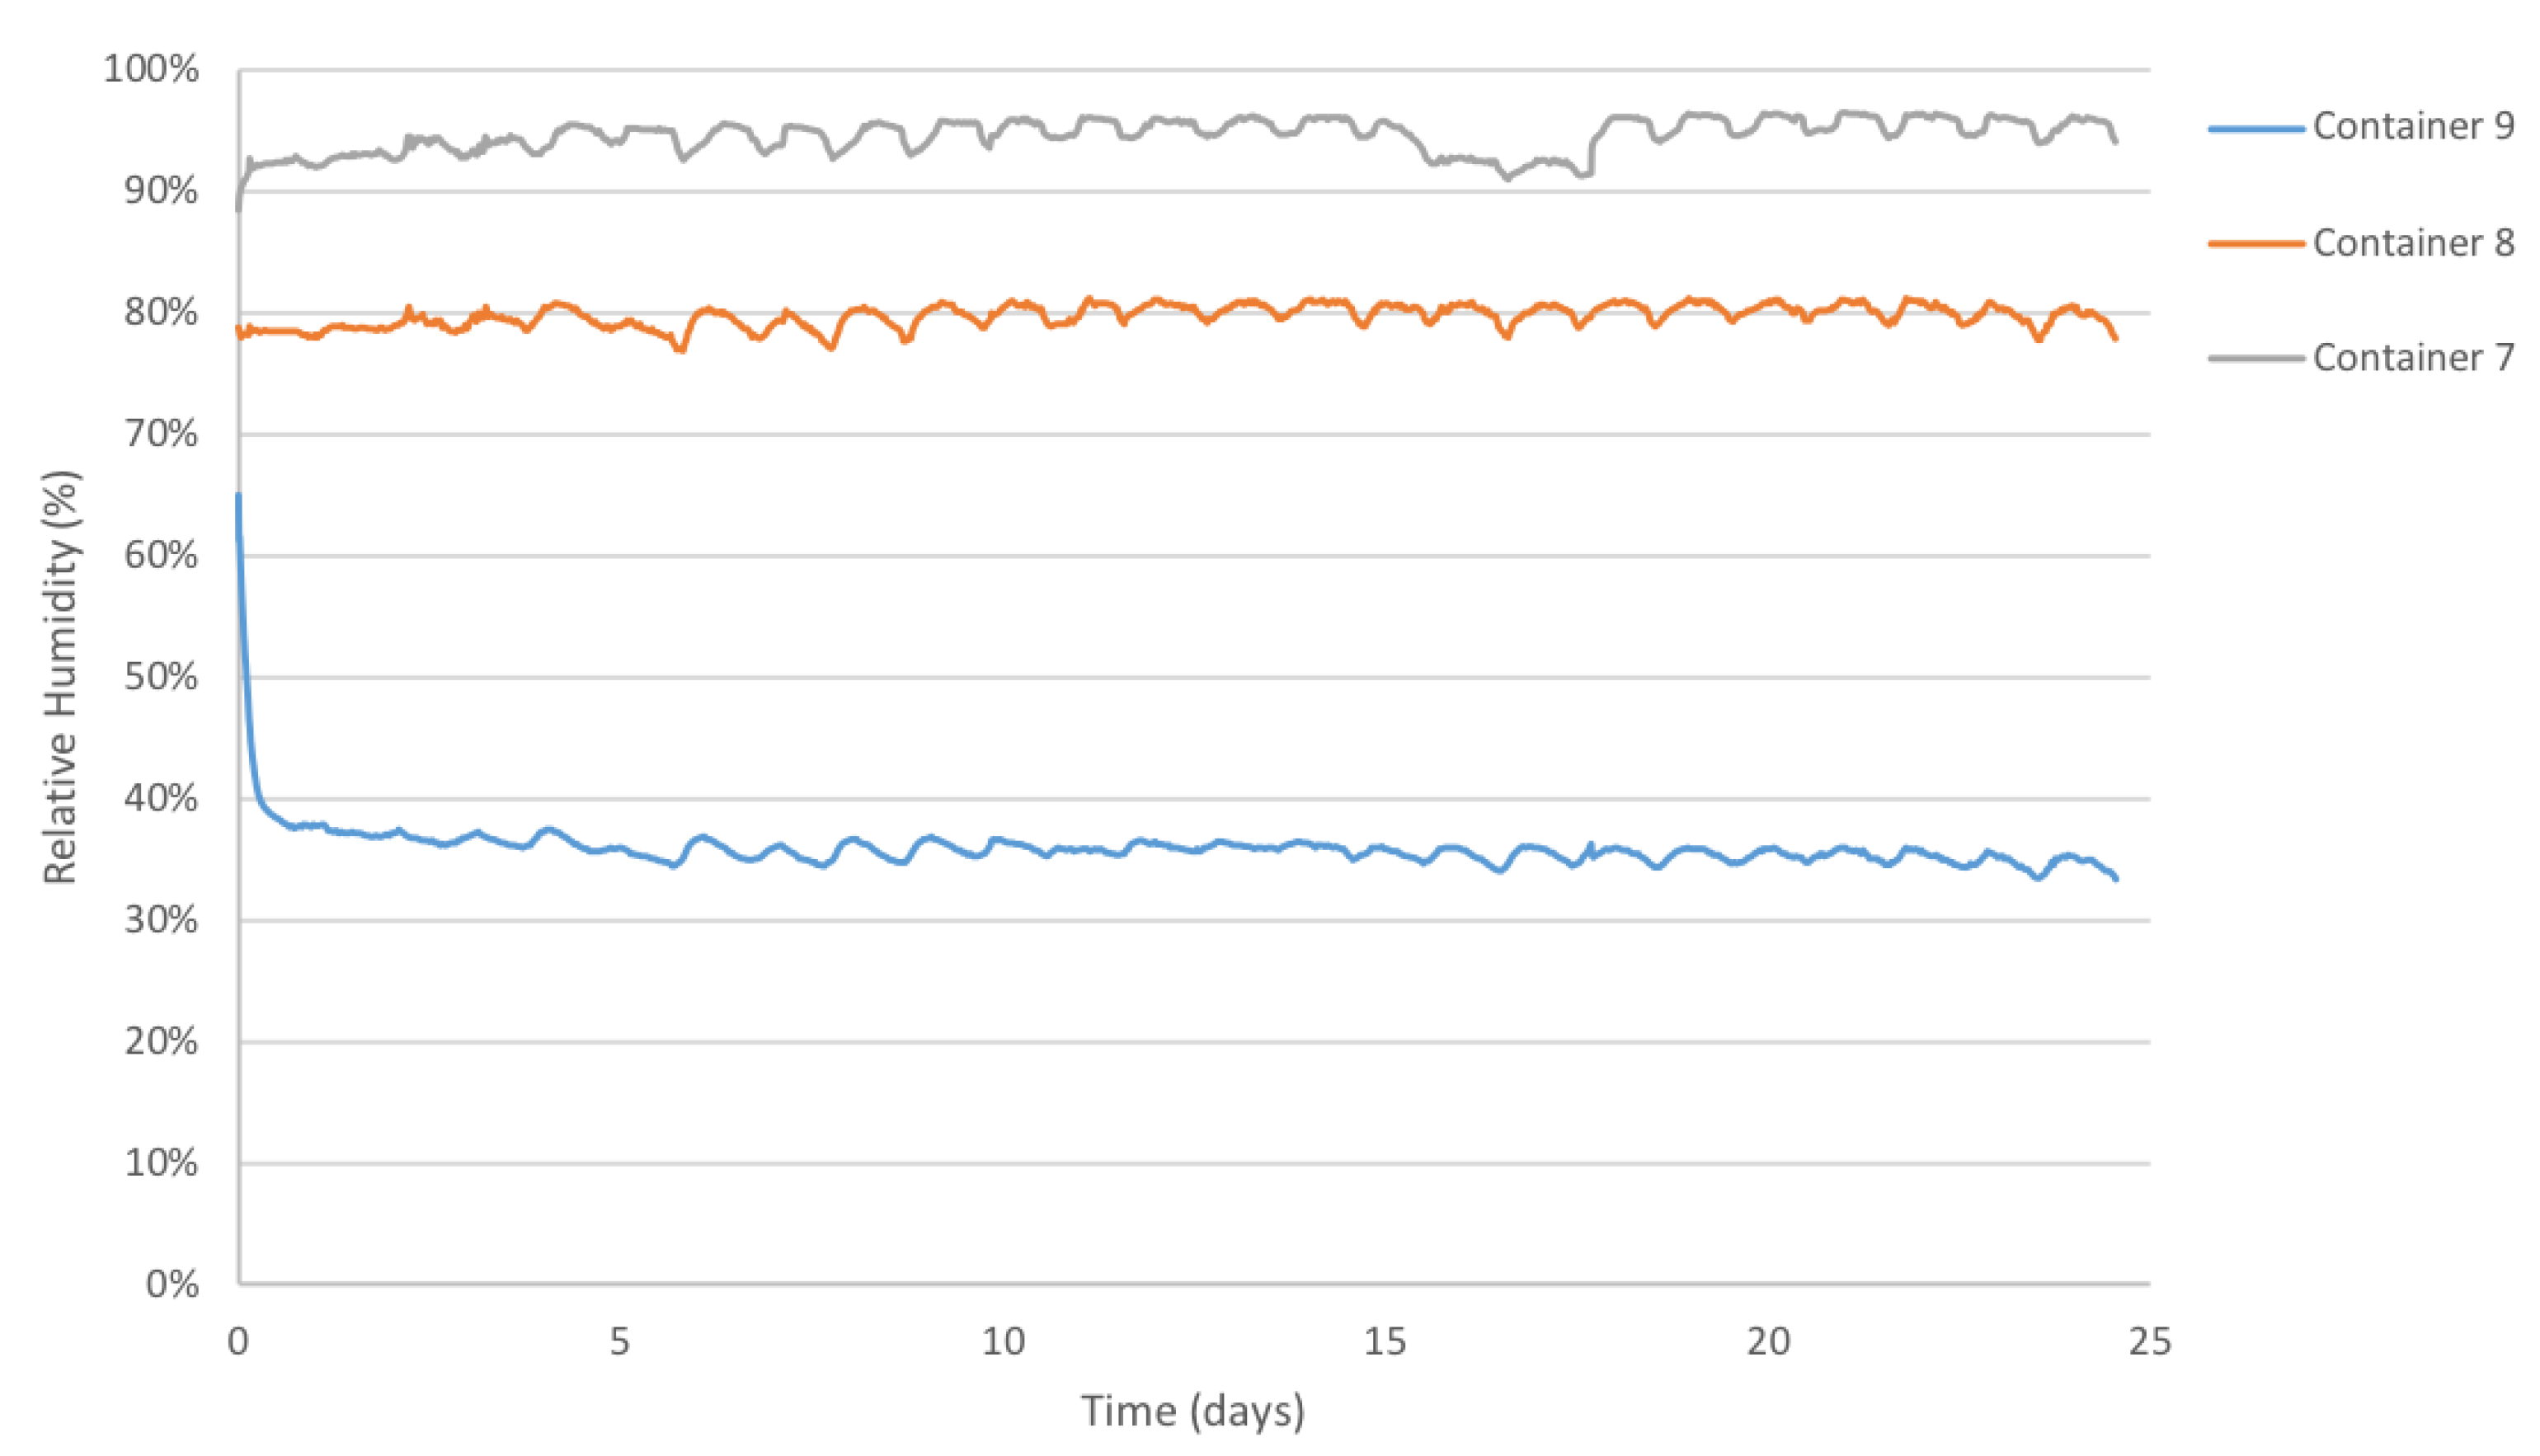
Variation in temperature and relative humidity was monitored for containers 7, 8 and 9, containing potassium sulphate, sodium chloride and magnesium chloride, respectively, over the 25 day period prior to testing (Figure 2 and Figure 3).
After equilibrium was reached, humidities were observed to remain largely constant and temperature was observed to vary with day-night variations; the average temperature over the 25 days was 23 °C. Average humidity recorded for each salt solution over the 25 day testing duration varied little from the theoretical relative humidities of 98%, 75% and 33%. Small variations (+/−5%) were evident; for example, container 9 (magnesium chloride) had an average RH of 36% over the 25 day duration, and container 7 (potassium sulphate) had an average RH of 95%. Container 8 (sodium chloride) exhibited the most variation, with an average reading of 80% RH.
5.3. Penetration Testing
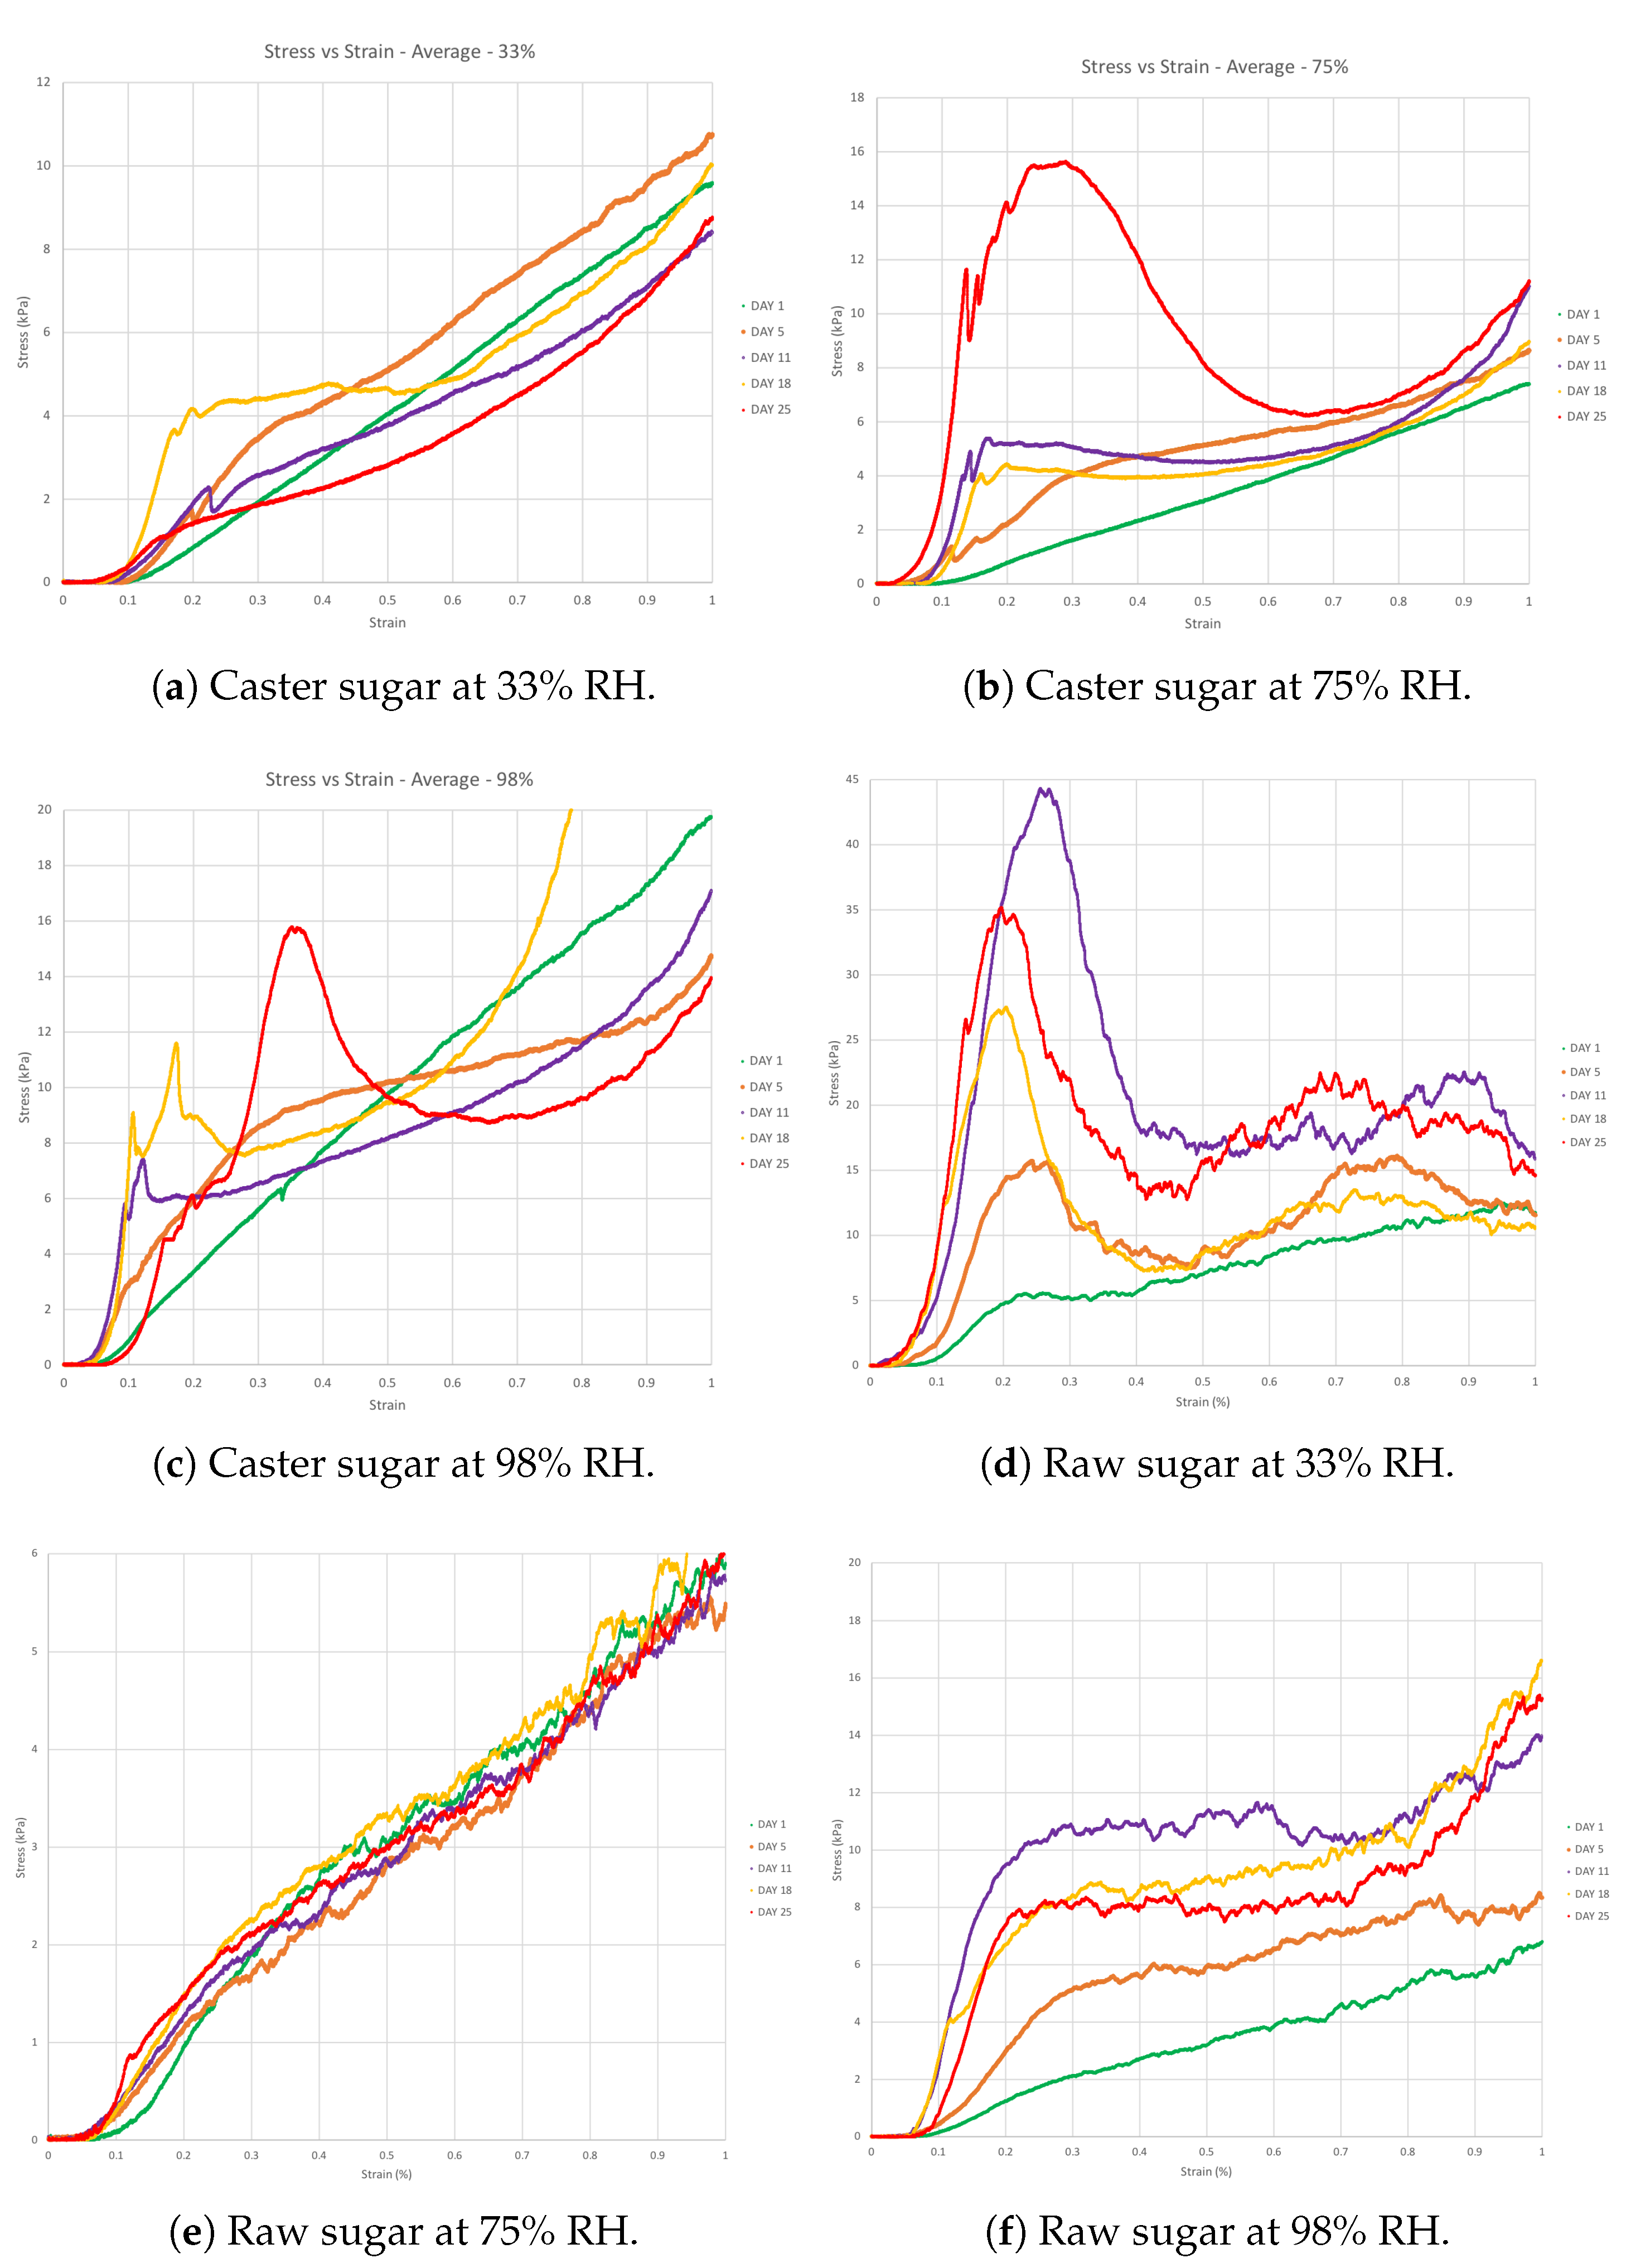
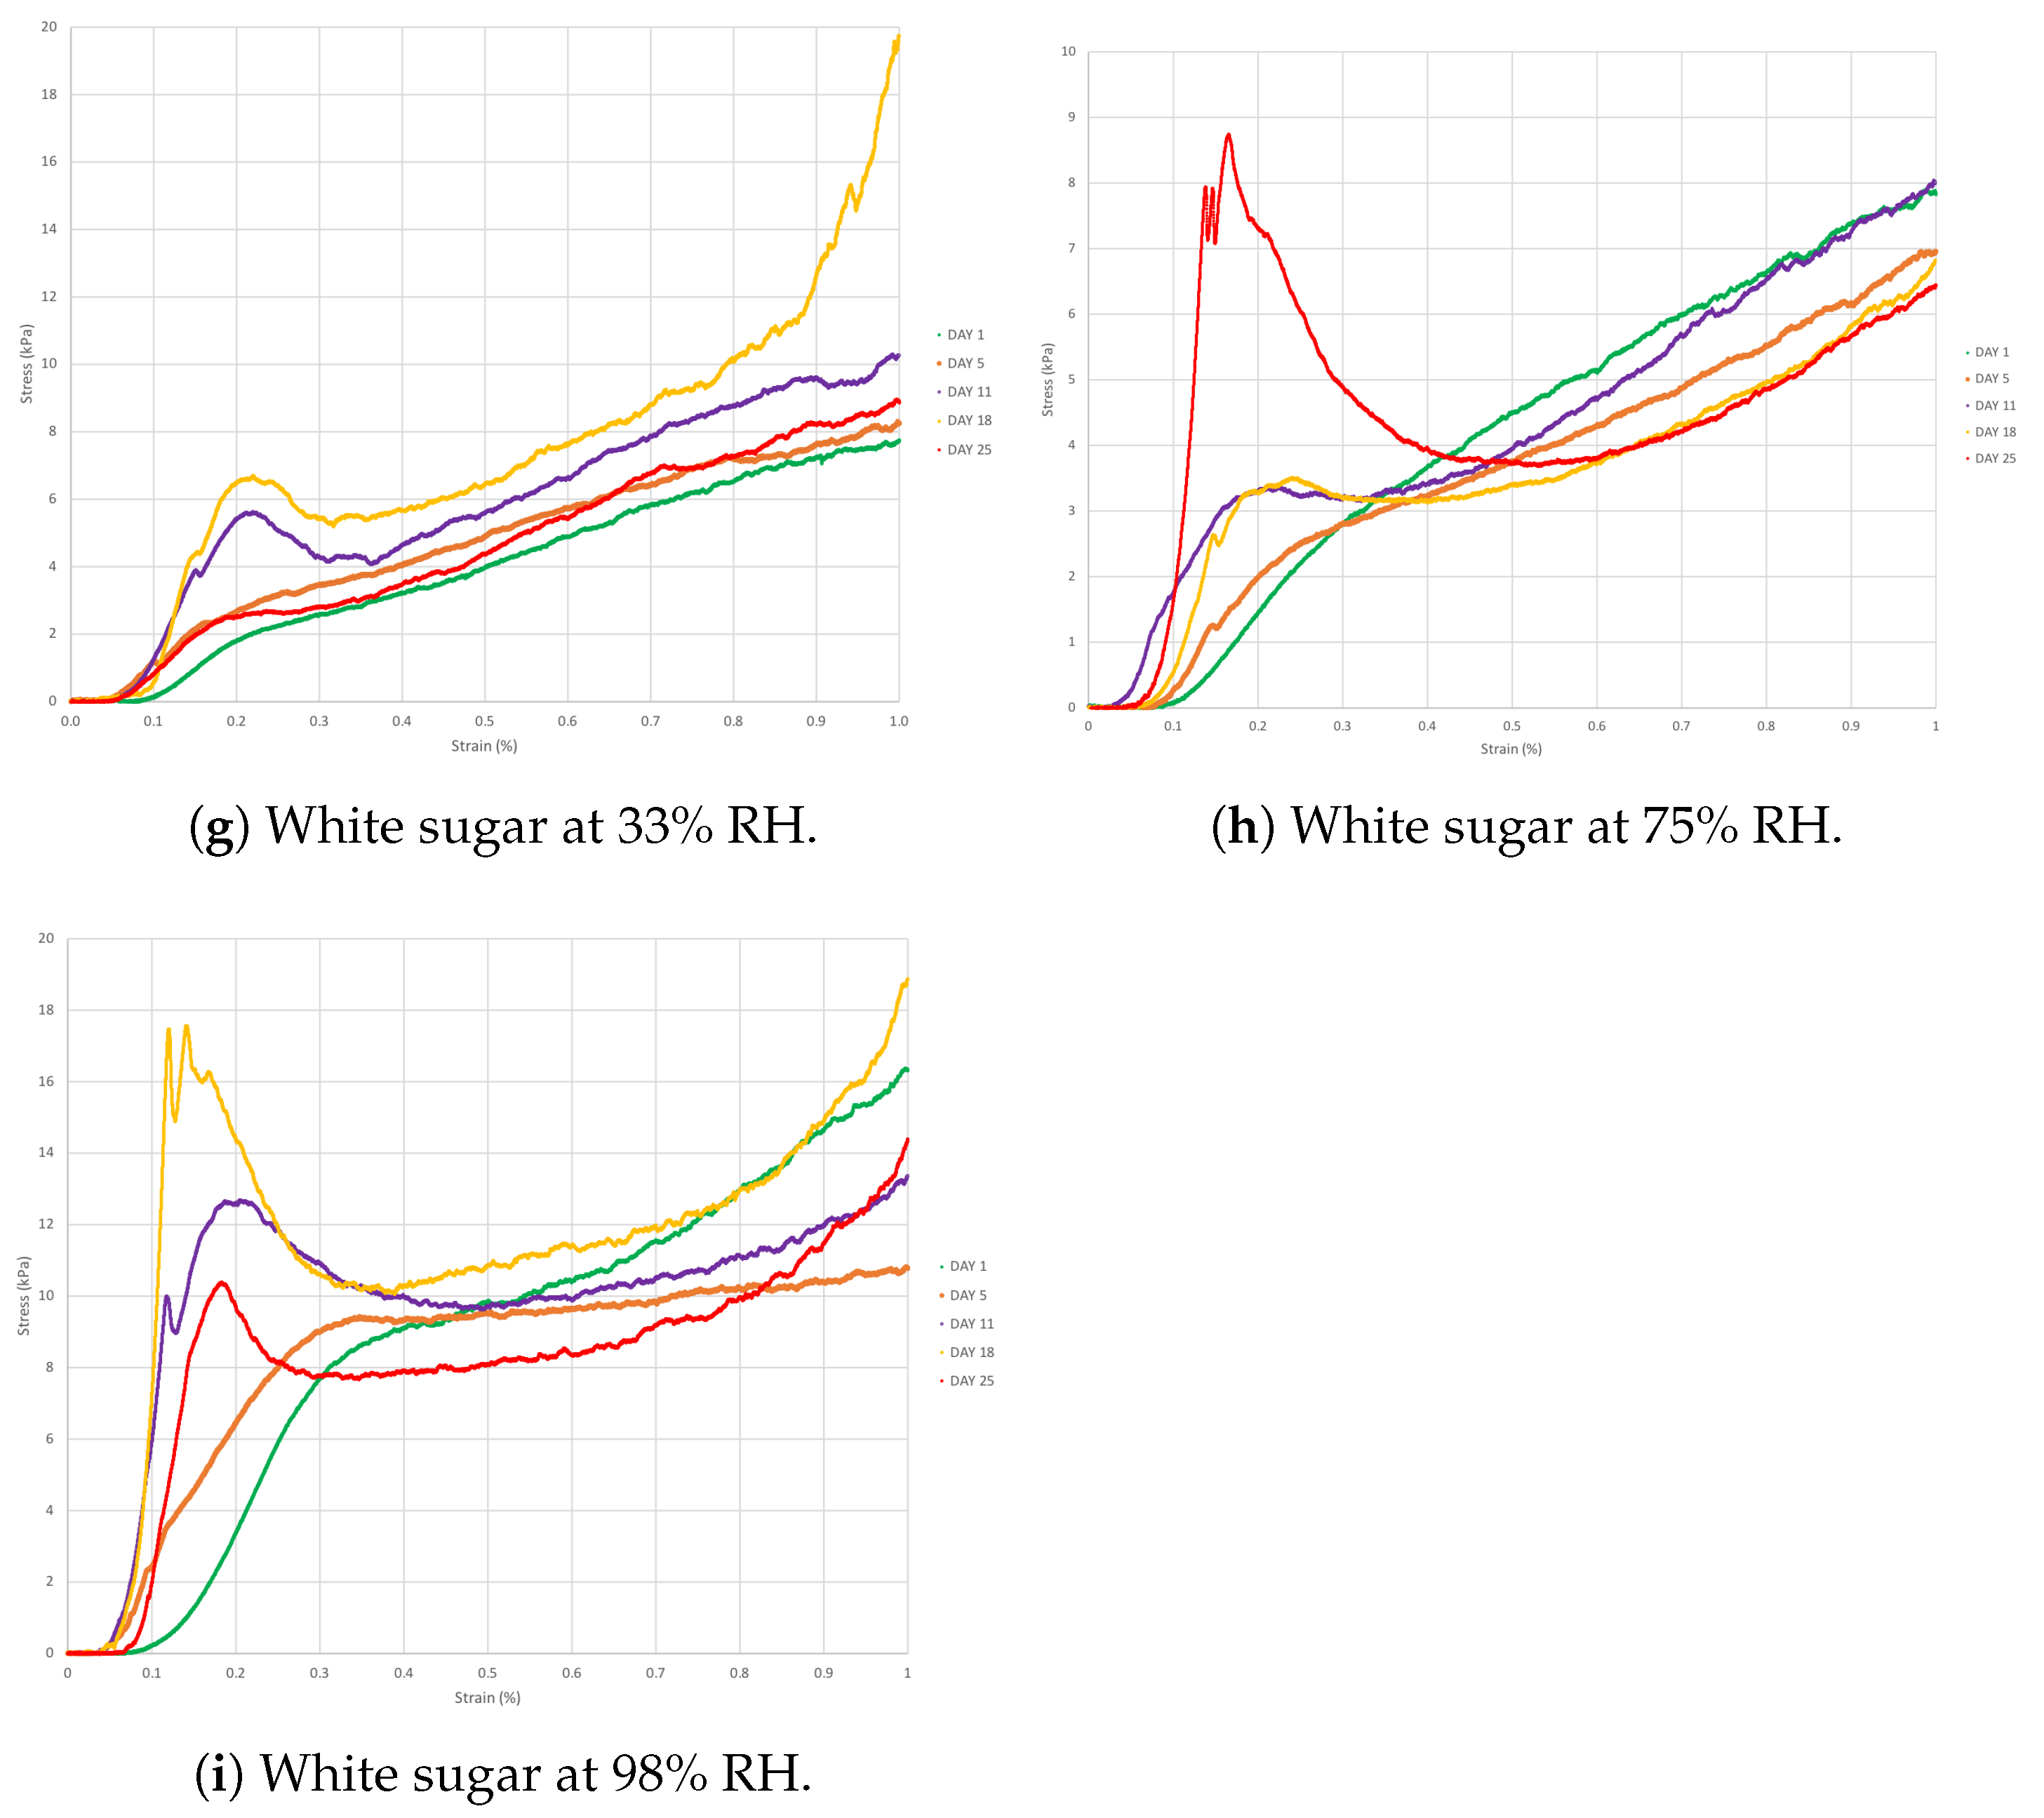
Graphs of average stress (kPa) versus strain (%) are presented for each sugar sample at each relative humidity and elapsed time period; data shown are the average obtained from three tests (Figure 4a–i).
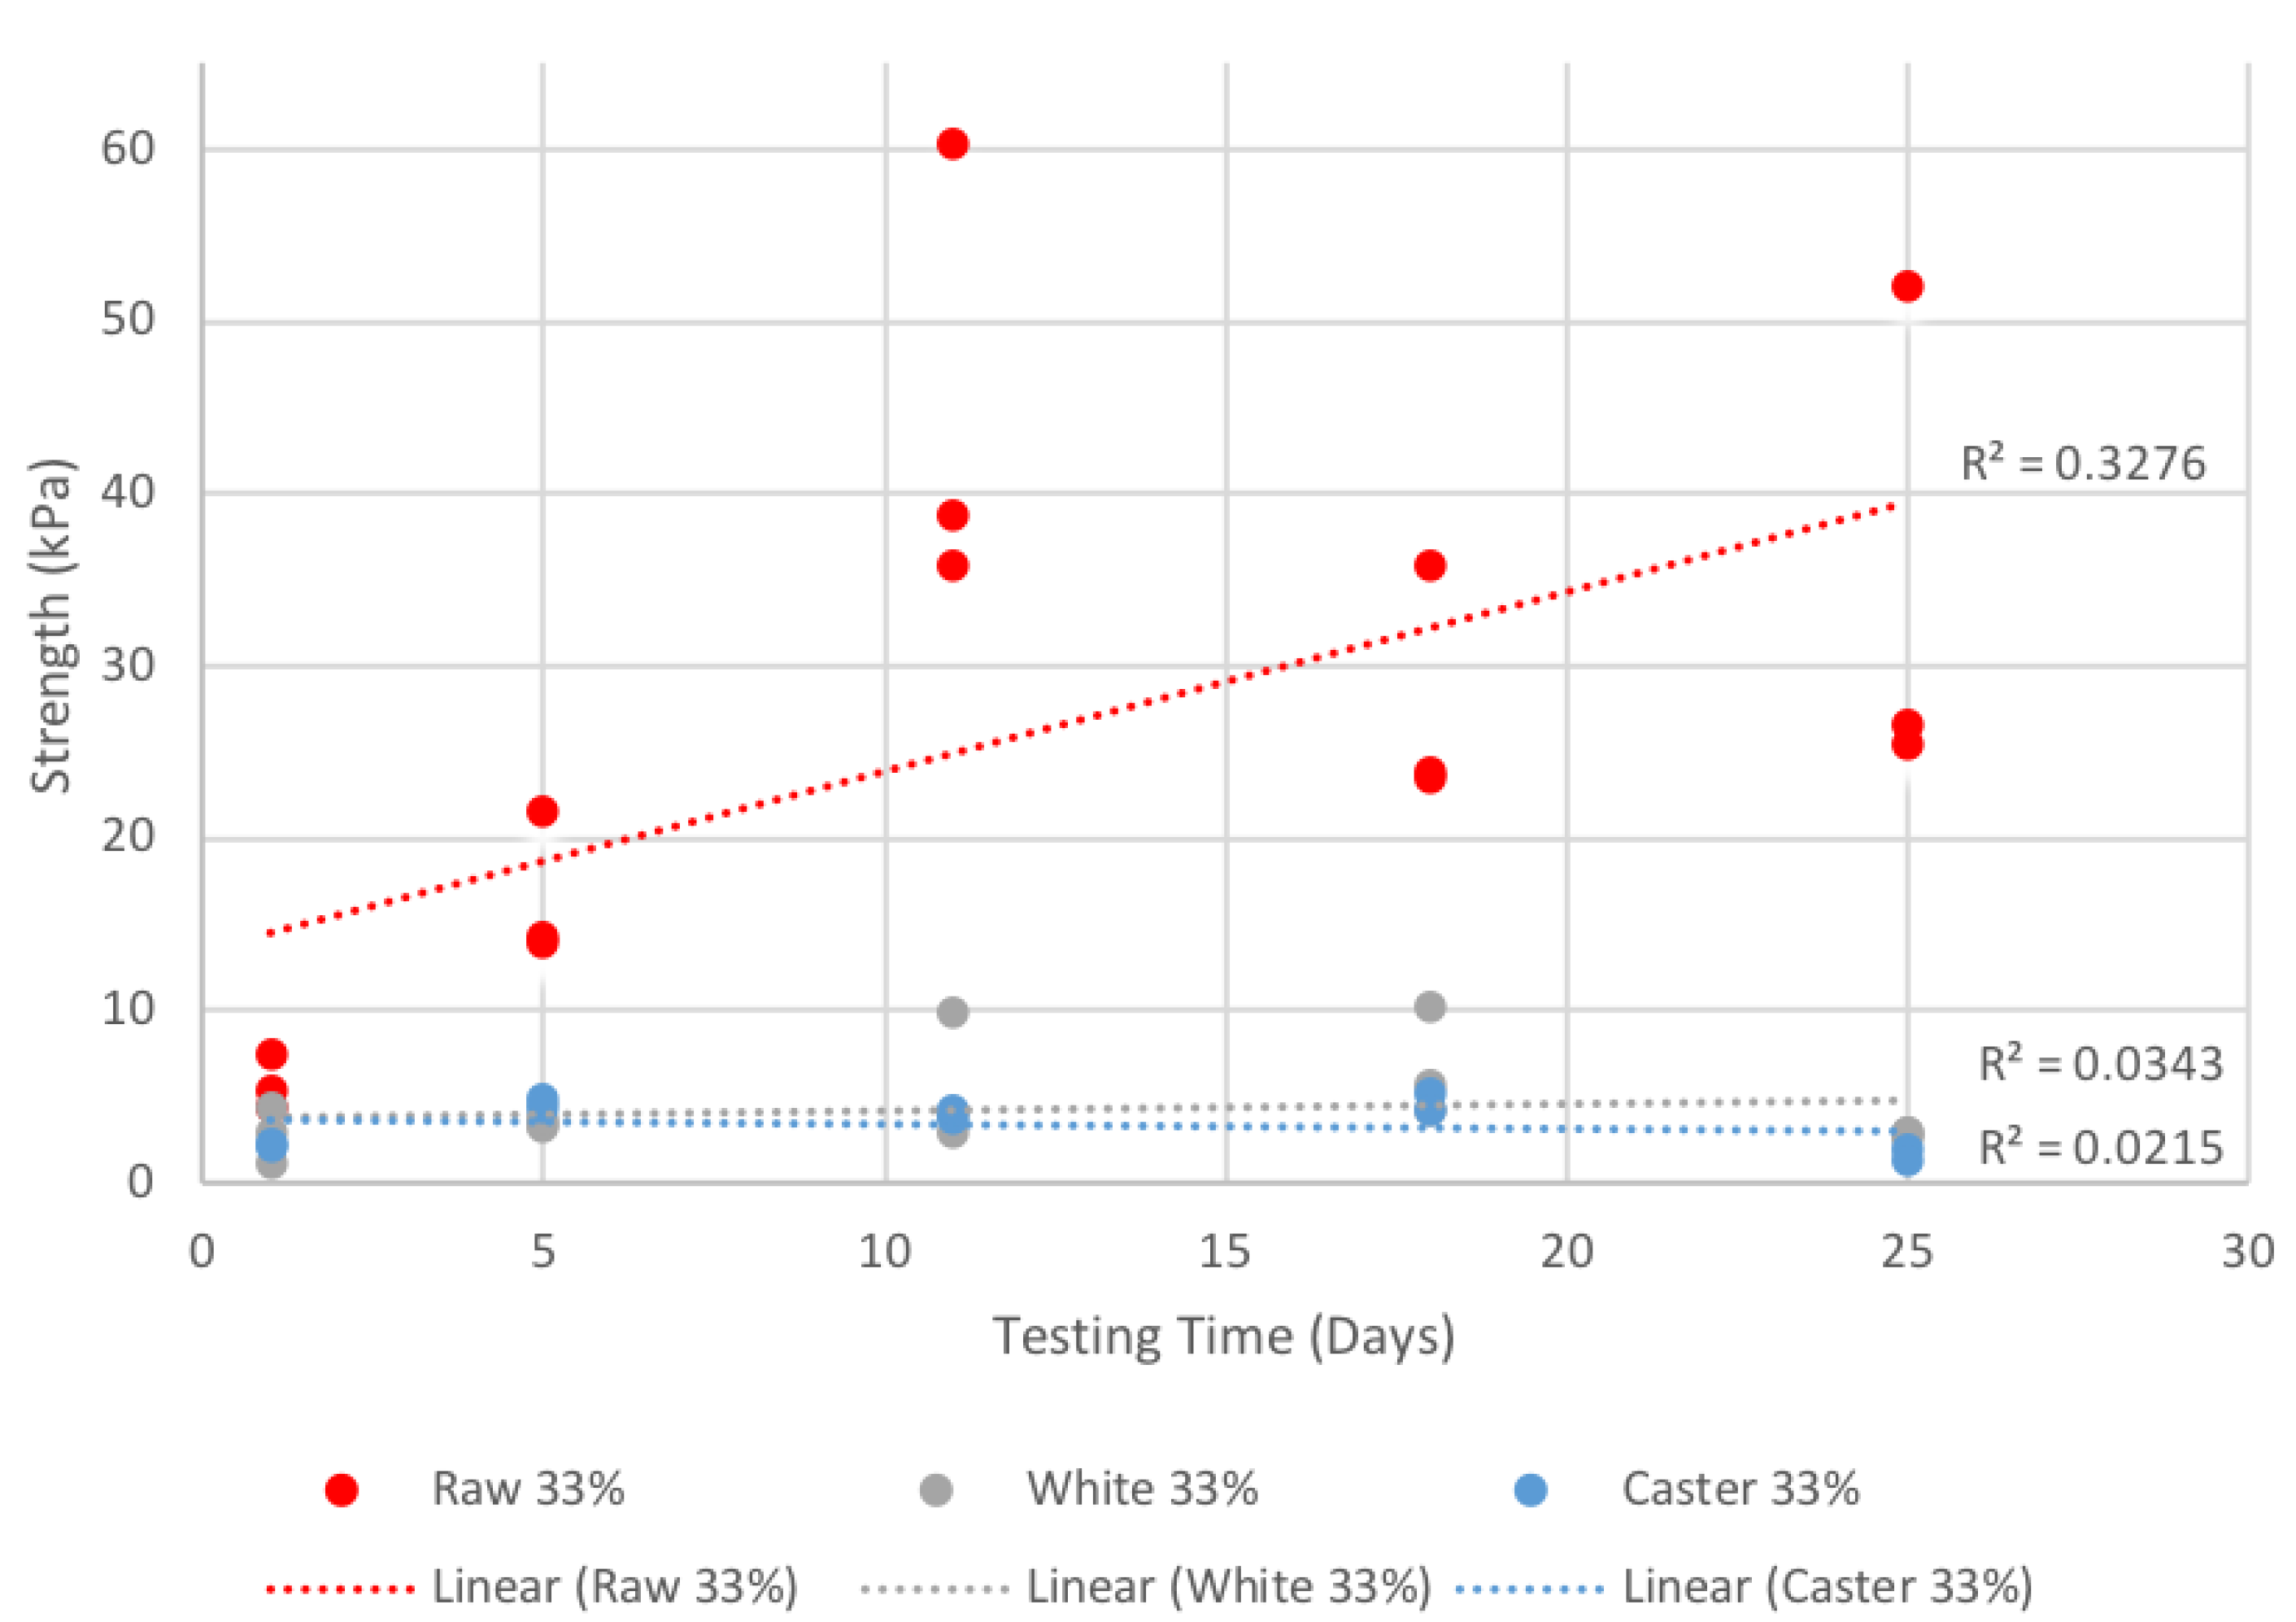
For sugars exposed to 33% humidity, the average strength of raw sugar was seen to increase the most; both white sugar and caster sugar showed little to no increase in average strength over the over the 25 day duration (Figure 5). Linear lines of best fit are shown.
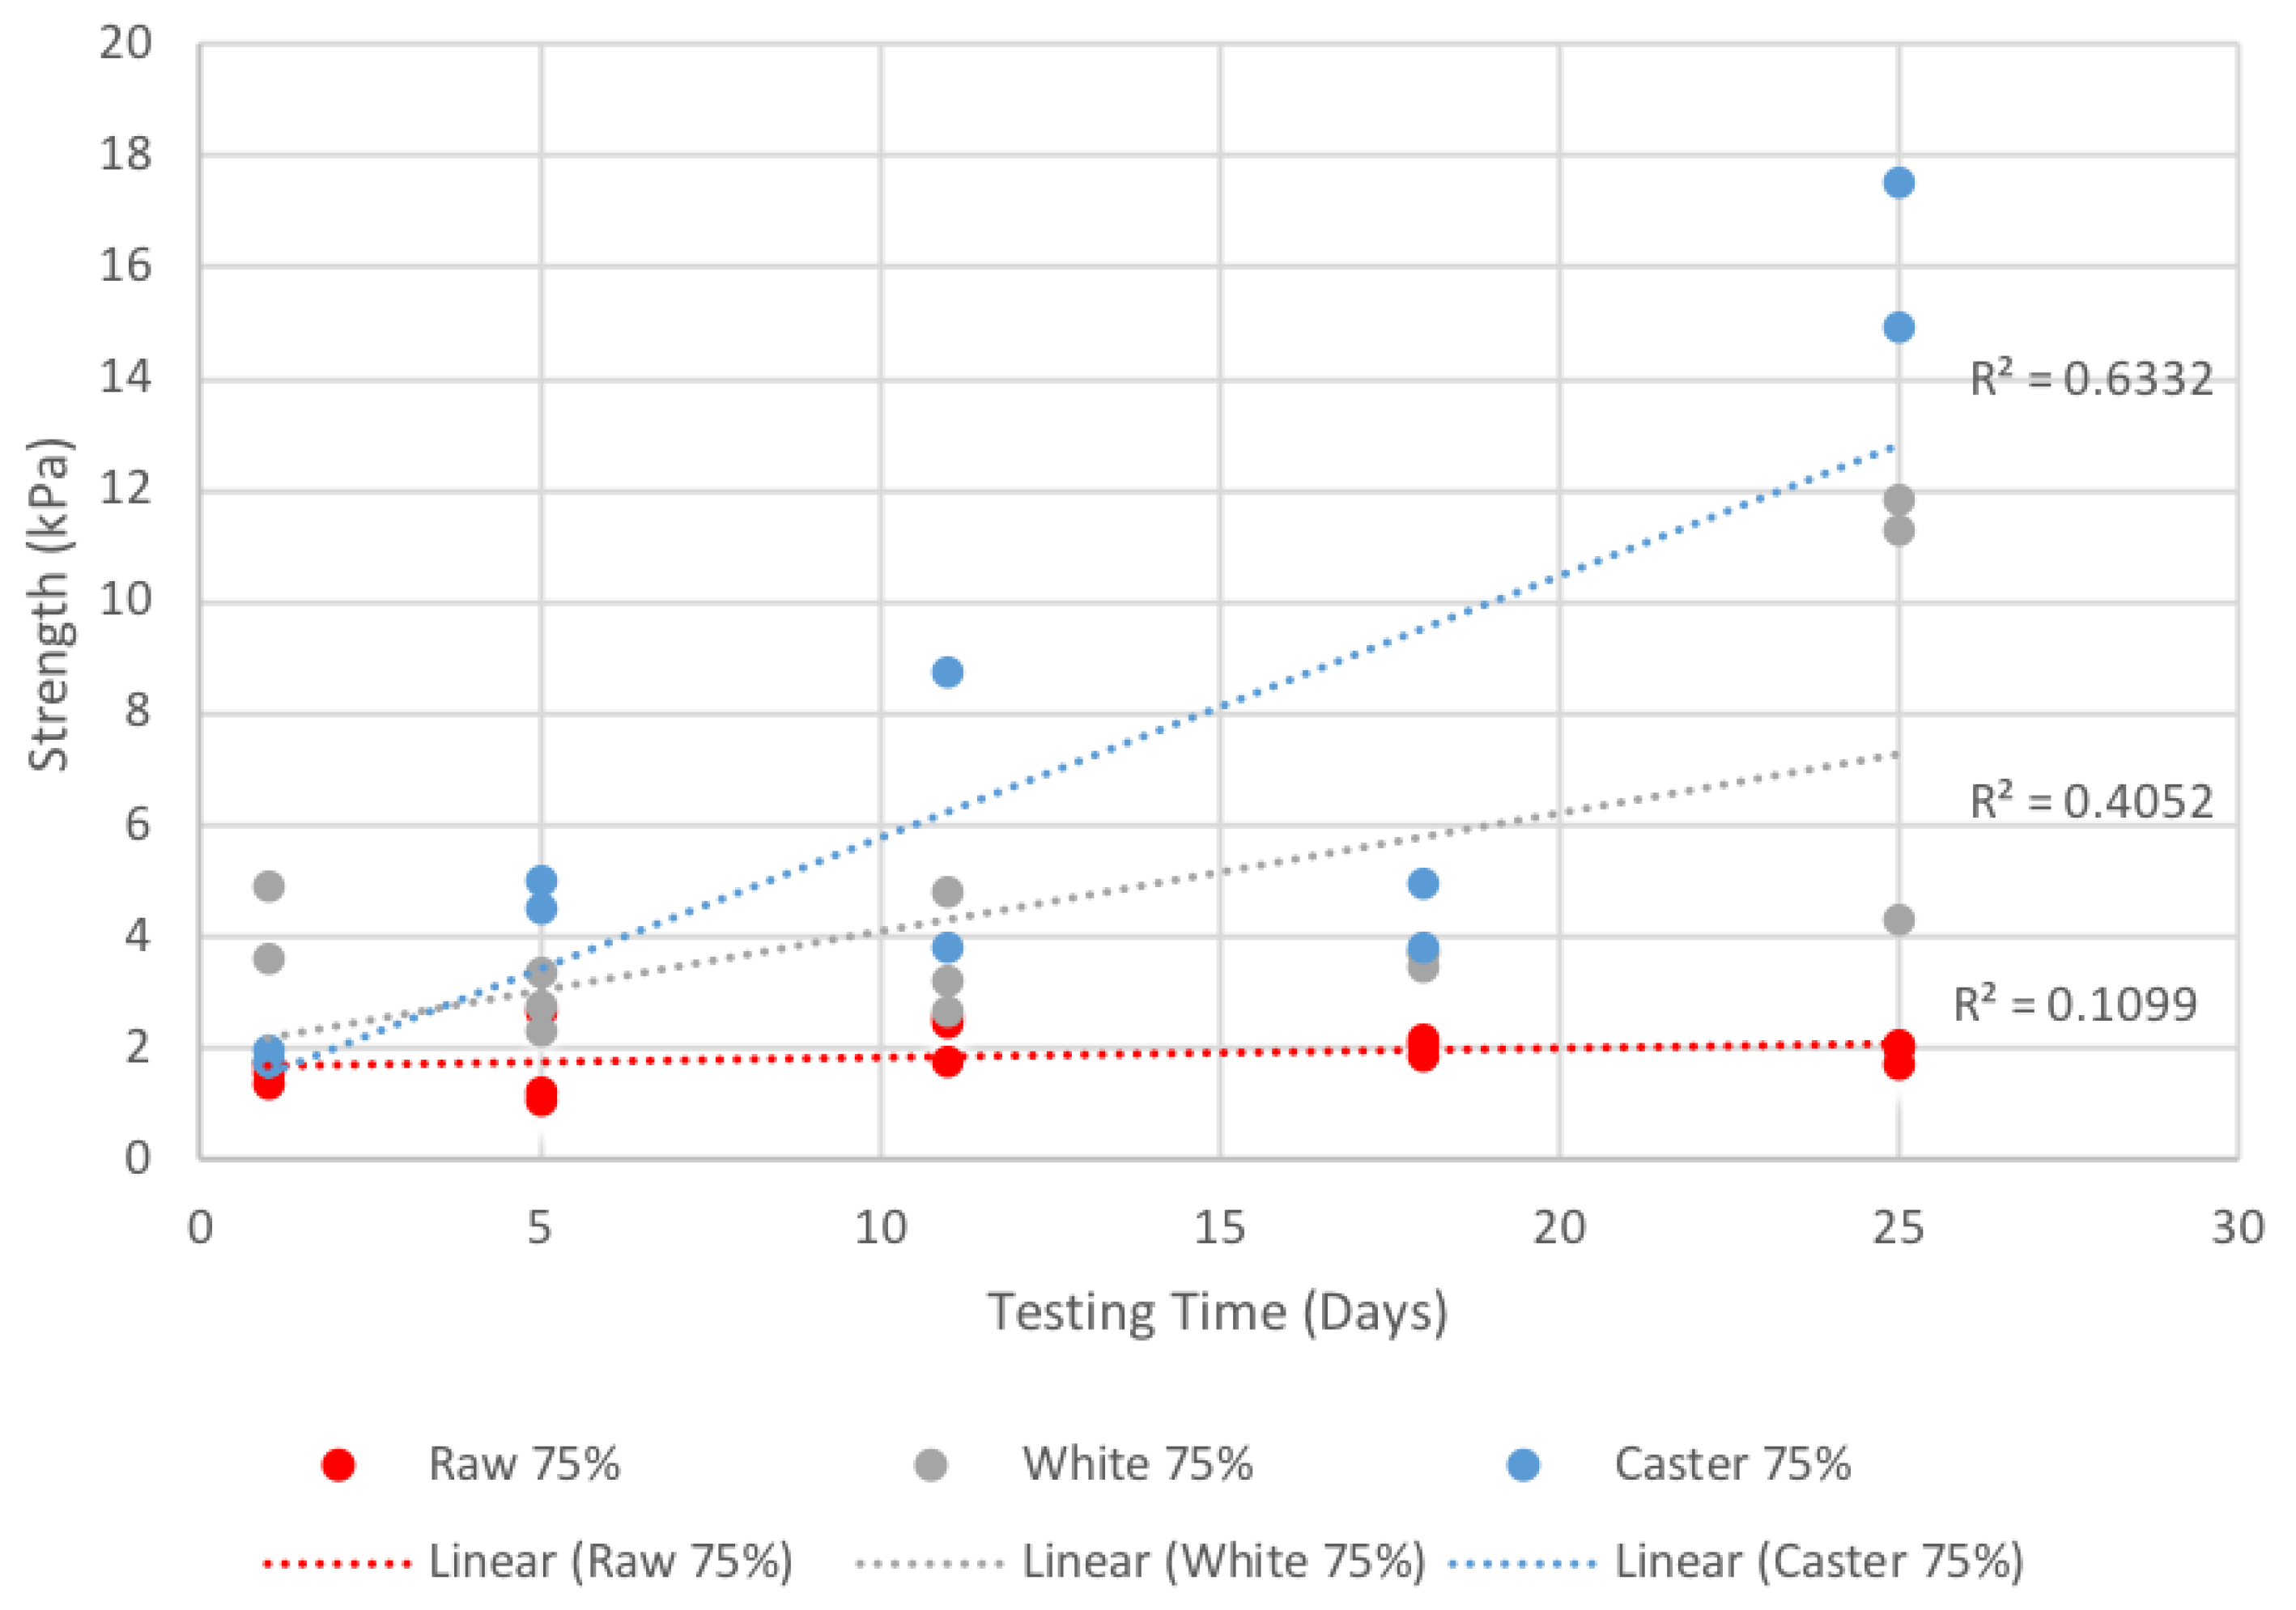
For samples exposed to 75% humidity, caster sugar is observed to demonstrate the most significant increase in average strength over the testing duration. White sugar also increased in strength over time whilst raw sugar was observed to increase very little in strength over the 25 day period (Figure 6). Linear lines of best fit are shown.
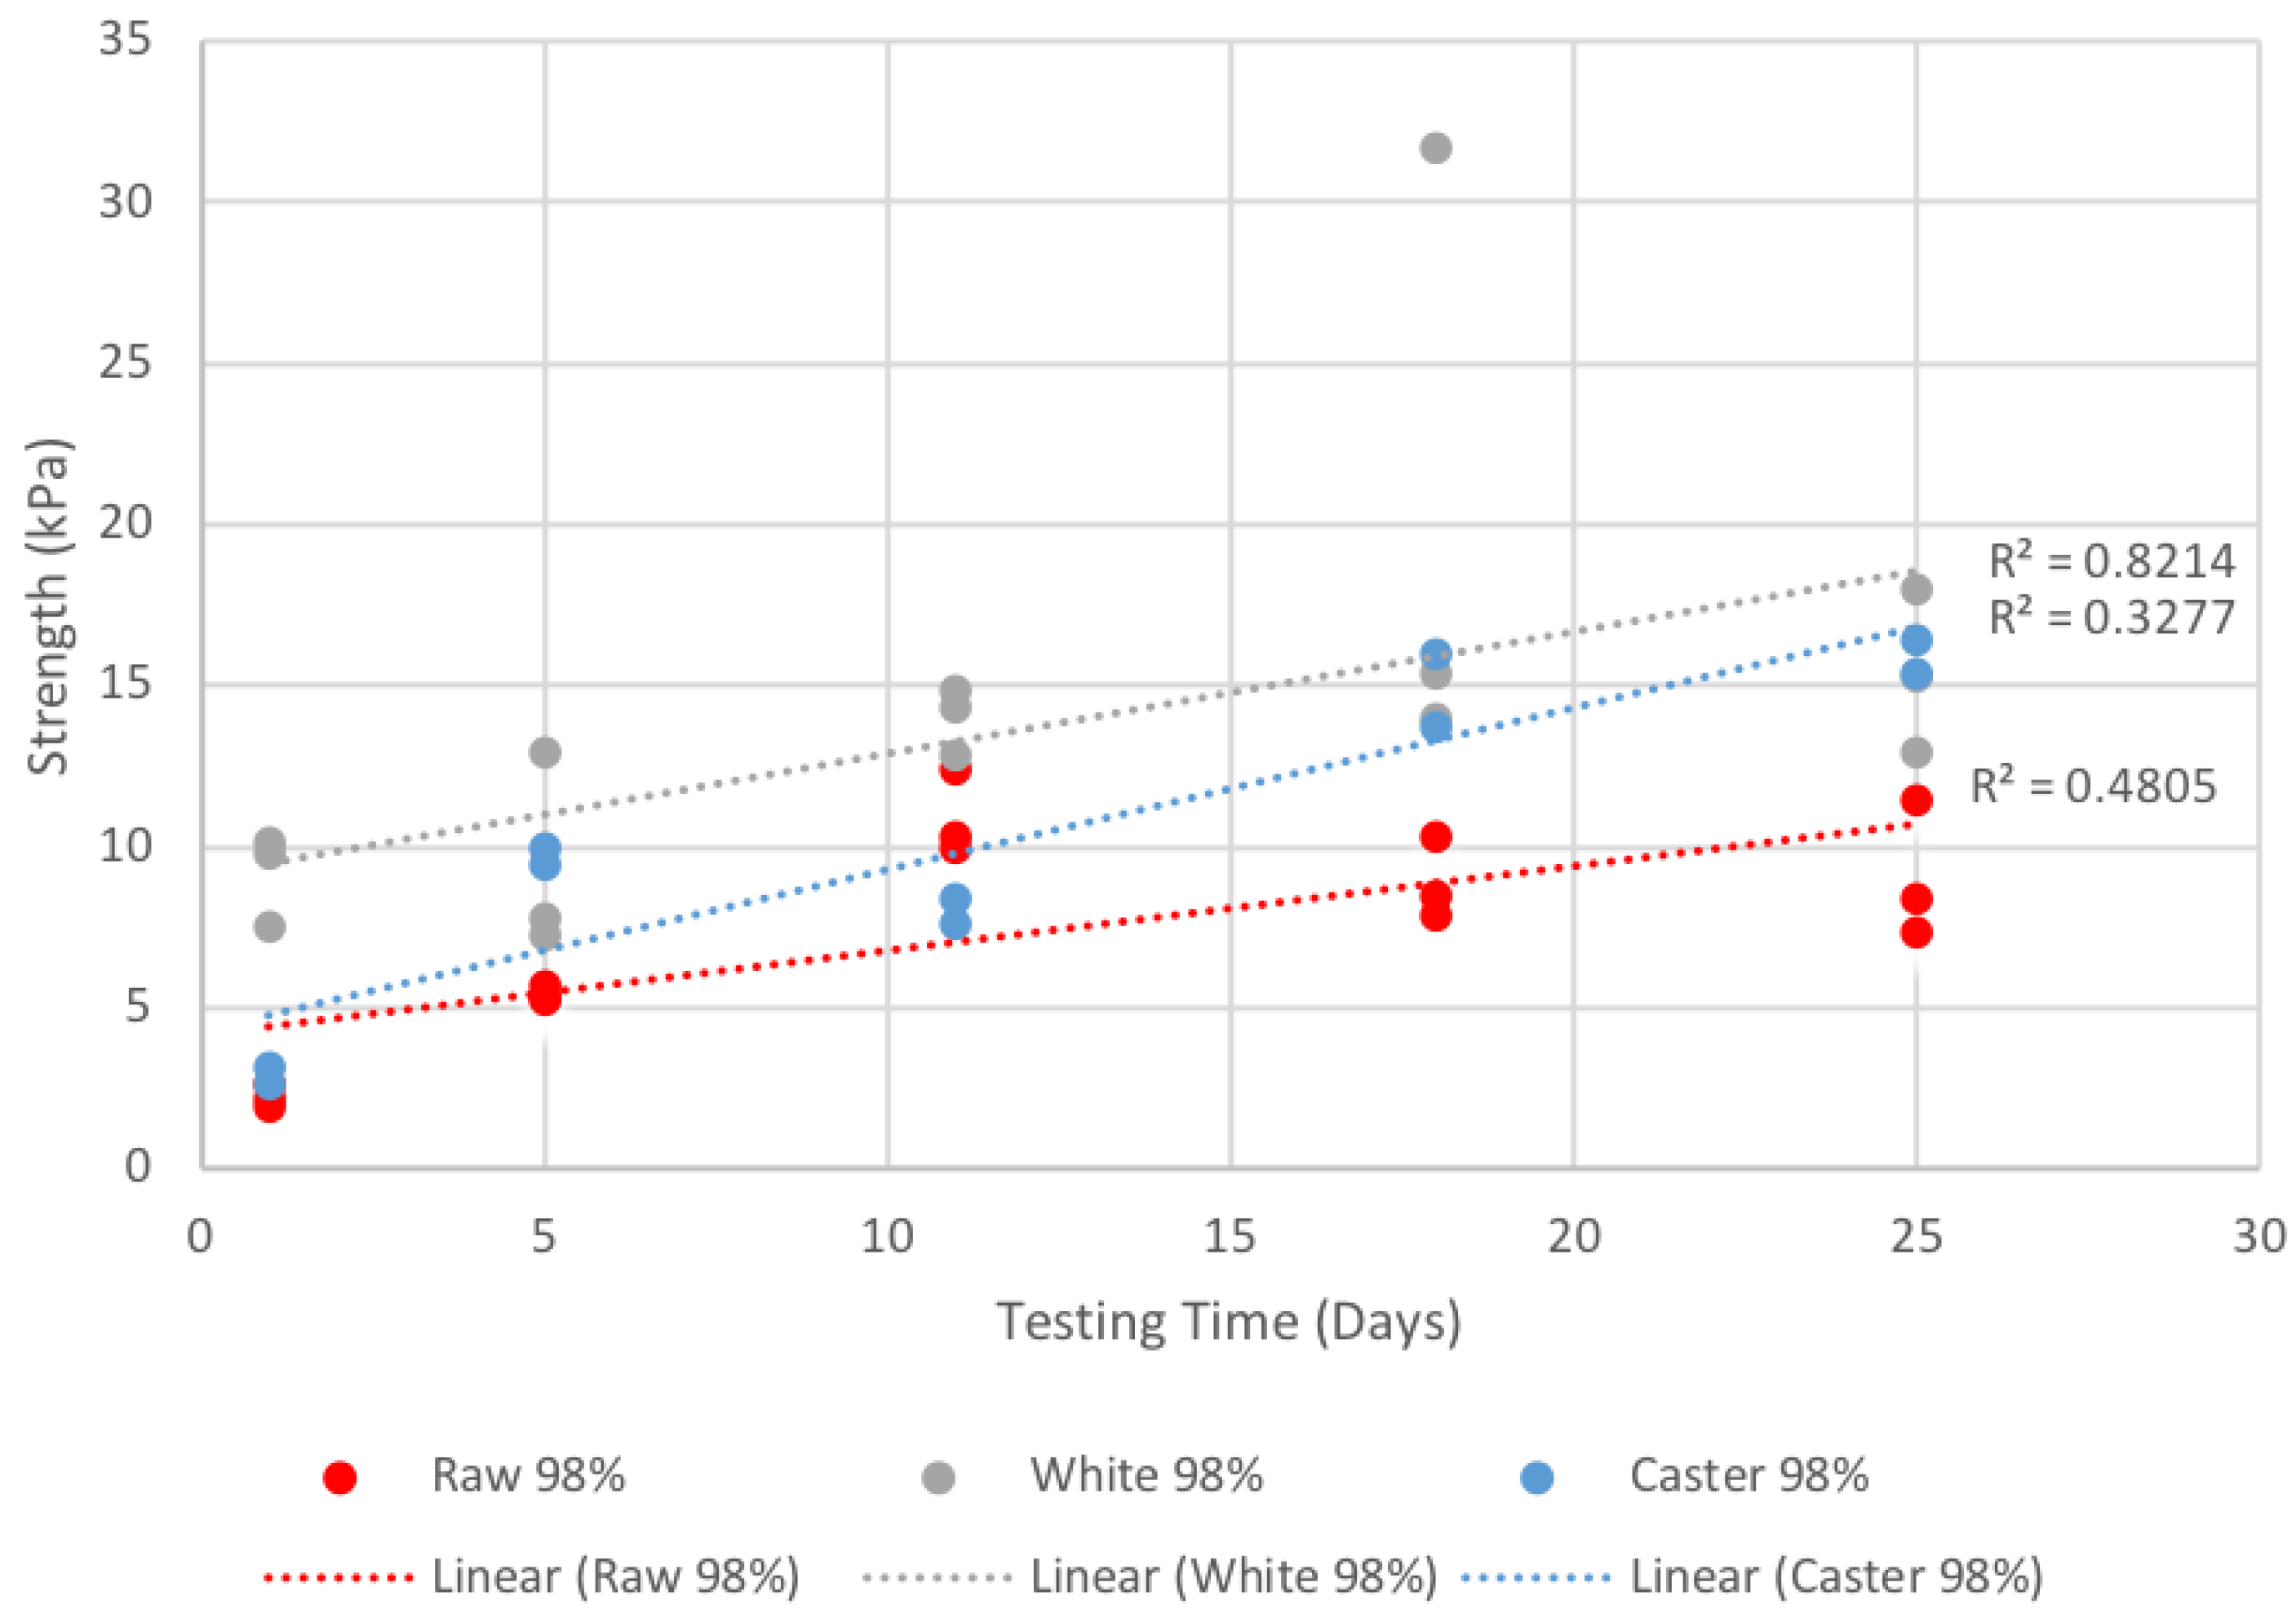
For samples exposed to 98% humidity, a general increase in strength is identified across all sugar types, with white sugar demonstrating the greatest increase. Caster sugar experienced the second greatest increase in strength whilst raw sugar experienced the least (Figure 7). Linear lines of best fit are shown.
The trends evident across all observations are that as sintering time increases, resistance to penetration also increases; this is consistent with Colbeck’s observation in snow Colbeck [13] and is consistent with Bagster [35]. It is also generally evident that as environmental humidity increases, absolute strength increases, presumably because the size of the sintered bonds between sample particles increases. This is broadly consistent with Bagster’s observations of raw sugar using an electron-microscope and optical means [35] and is consistent with [37]. What is intriguing is the variation exhibited by raw sugar: significant strength increase is observed over time at RHs of both 33% and 98%. However, negligible strength increase is evident at 75% RH. We are unable to explain this discrepancy at this time.
5.4. Visual Observations from Light Microscopy
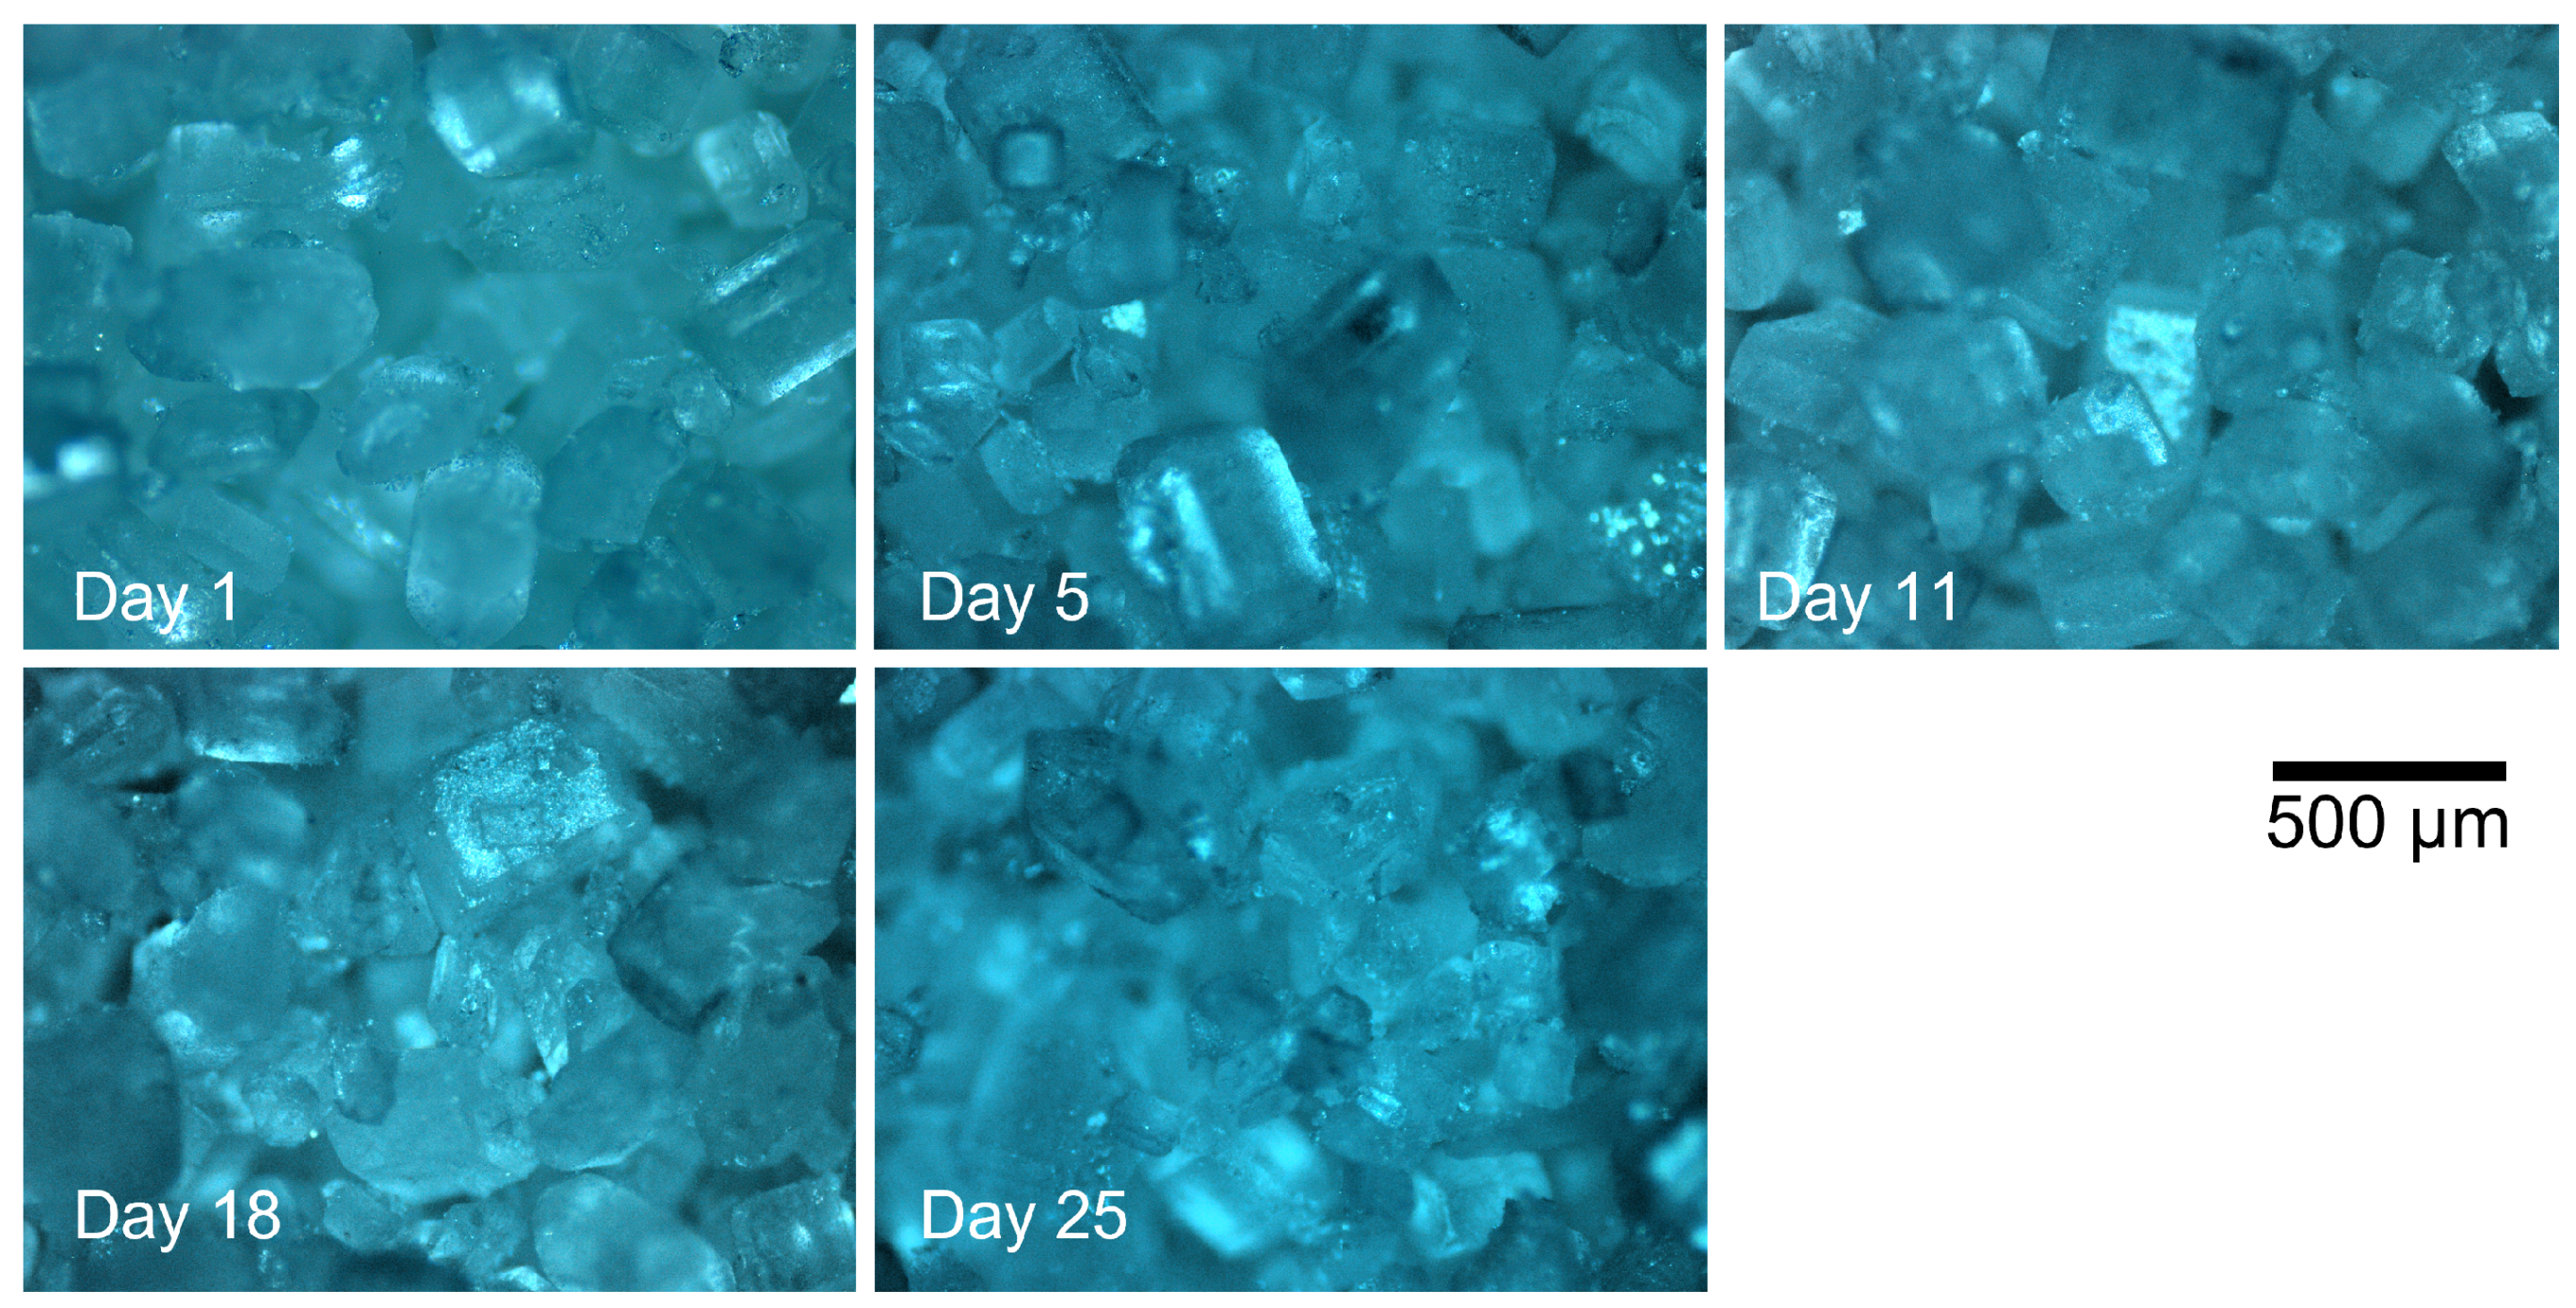
Images from light microscopy of caster sugar show increased sintering over time (Figure 8; caster sugar at 33% RH). Images for remaining sugars and humidities are available upon request.
Little to no structural change is observed from the light microscopy samples obtained at 33% RH; this is consistent with mechanical strength data that show little to no increase in strength over 25 days. Bagster [35] observed no strength increase in raw sugar after about six weeks (loaded under 15.2 kPa; humidity unknown). Raw sugar samples display a small amount of coarsening and some bonding between particles is apparent.
For samples exposed to 75% RH, coarsening and some particle bonding and pore shrinkage associated with early stage sintering were evident in the smaller-grained caster and white sugars, compared to the coarser raw sugar. These observations are consistent with the penetration tests that illustrate an increase in strength in both caster and white sugar.
Macroscopic sintering was evident in all samples exposed to the 98% RH salt solution. Small sintering necks were evident between particles in all samples through days 1–5 with pore shrinkage and grain coarsening evident between 5 and 18 days. Coarsening remains evident in raw sugar at day 25, whereas both smaller-grained sugars show evidence of complete pore disappearance after this time. These observations are consistent with penetration test data where both caster and white sugar at 98% RH illustrate greater strength properties than raw sugar.
5.5. Comparisons with Snow
Particle size distributions (PSDs) for both natural and processed snow are very similar in shape and absolute magnitude to the PSDs for the three types of sugar (Figure 1), with natural snow and caster sugar particularly showing similar distribution between sizes of 0.1 mm and 1 mm.
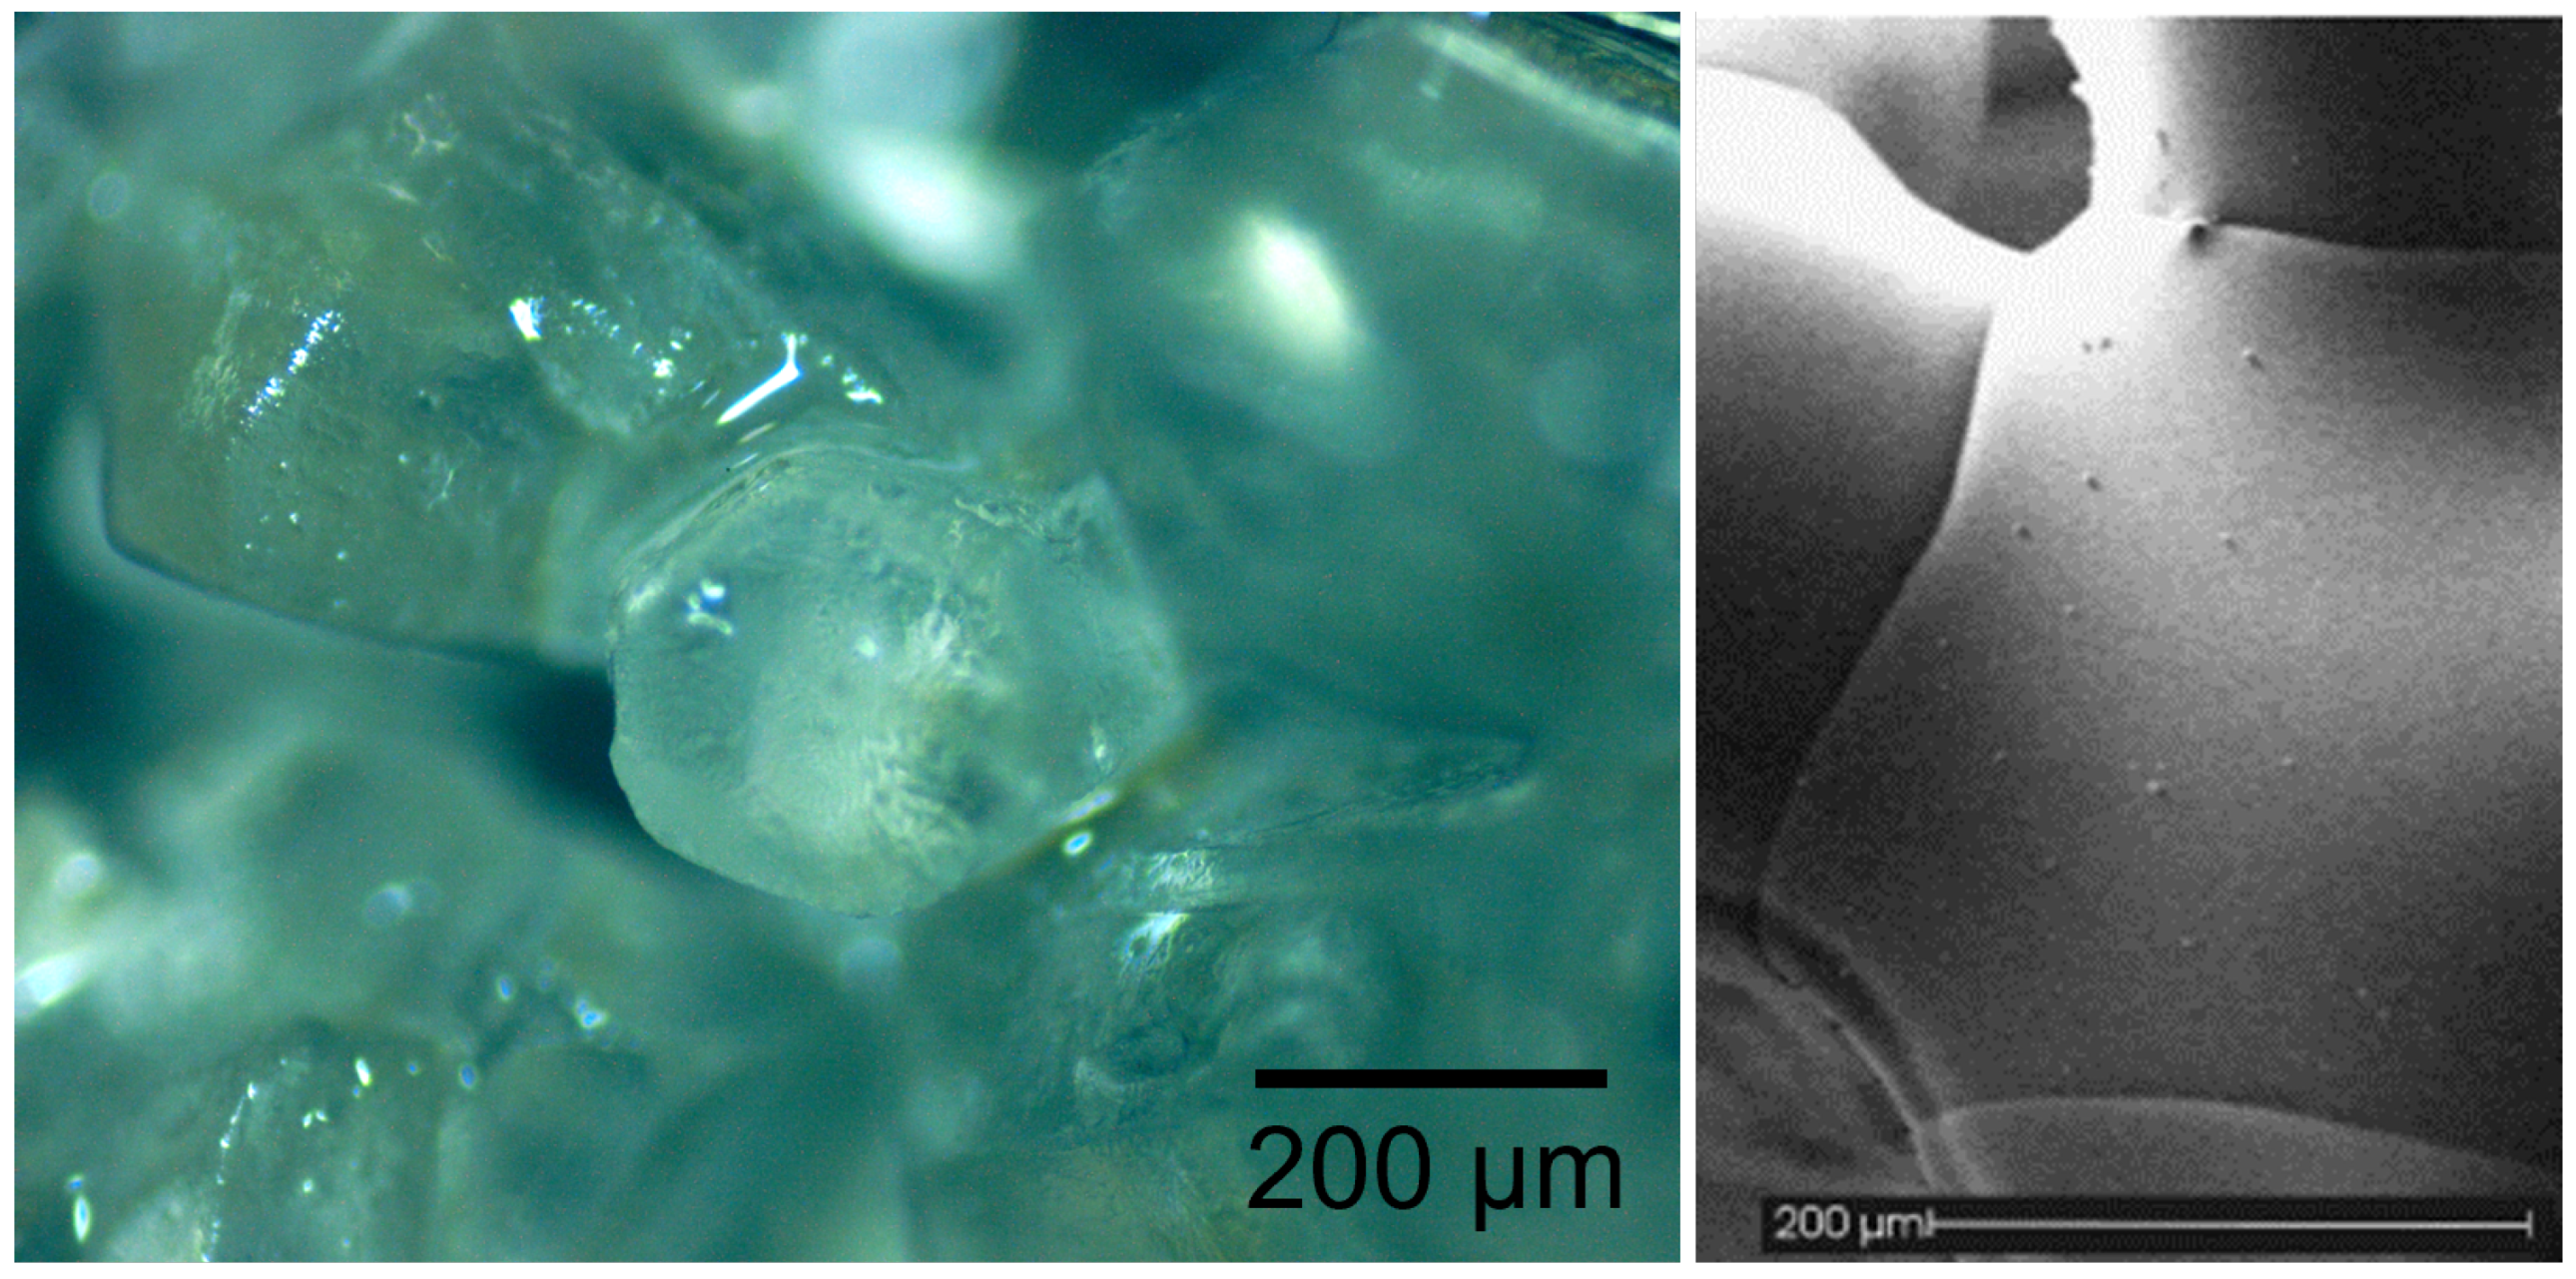
Comparison of light microscopy images shows that the initial stages of necking within raw sugar exposed to 98% RH after 1 day is similar to necking observed in sintered snow (Figure 9).
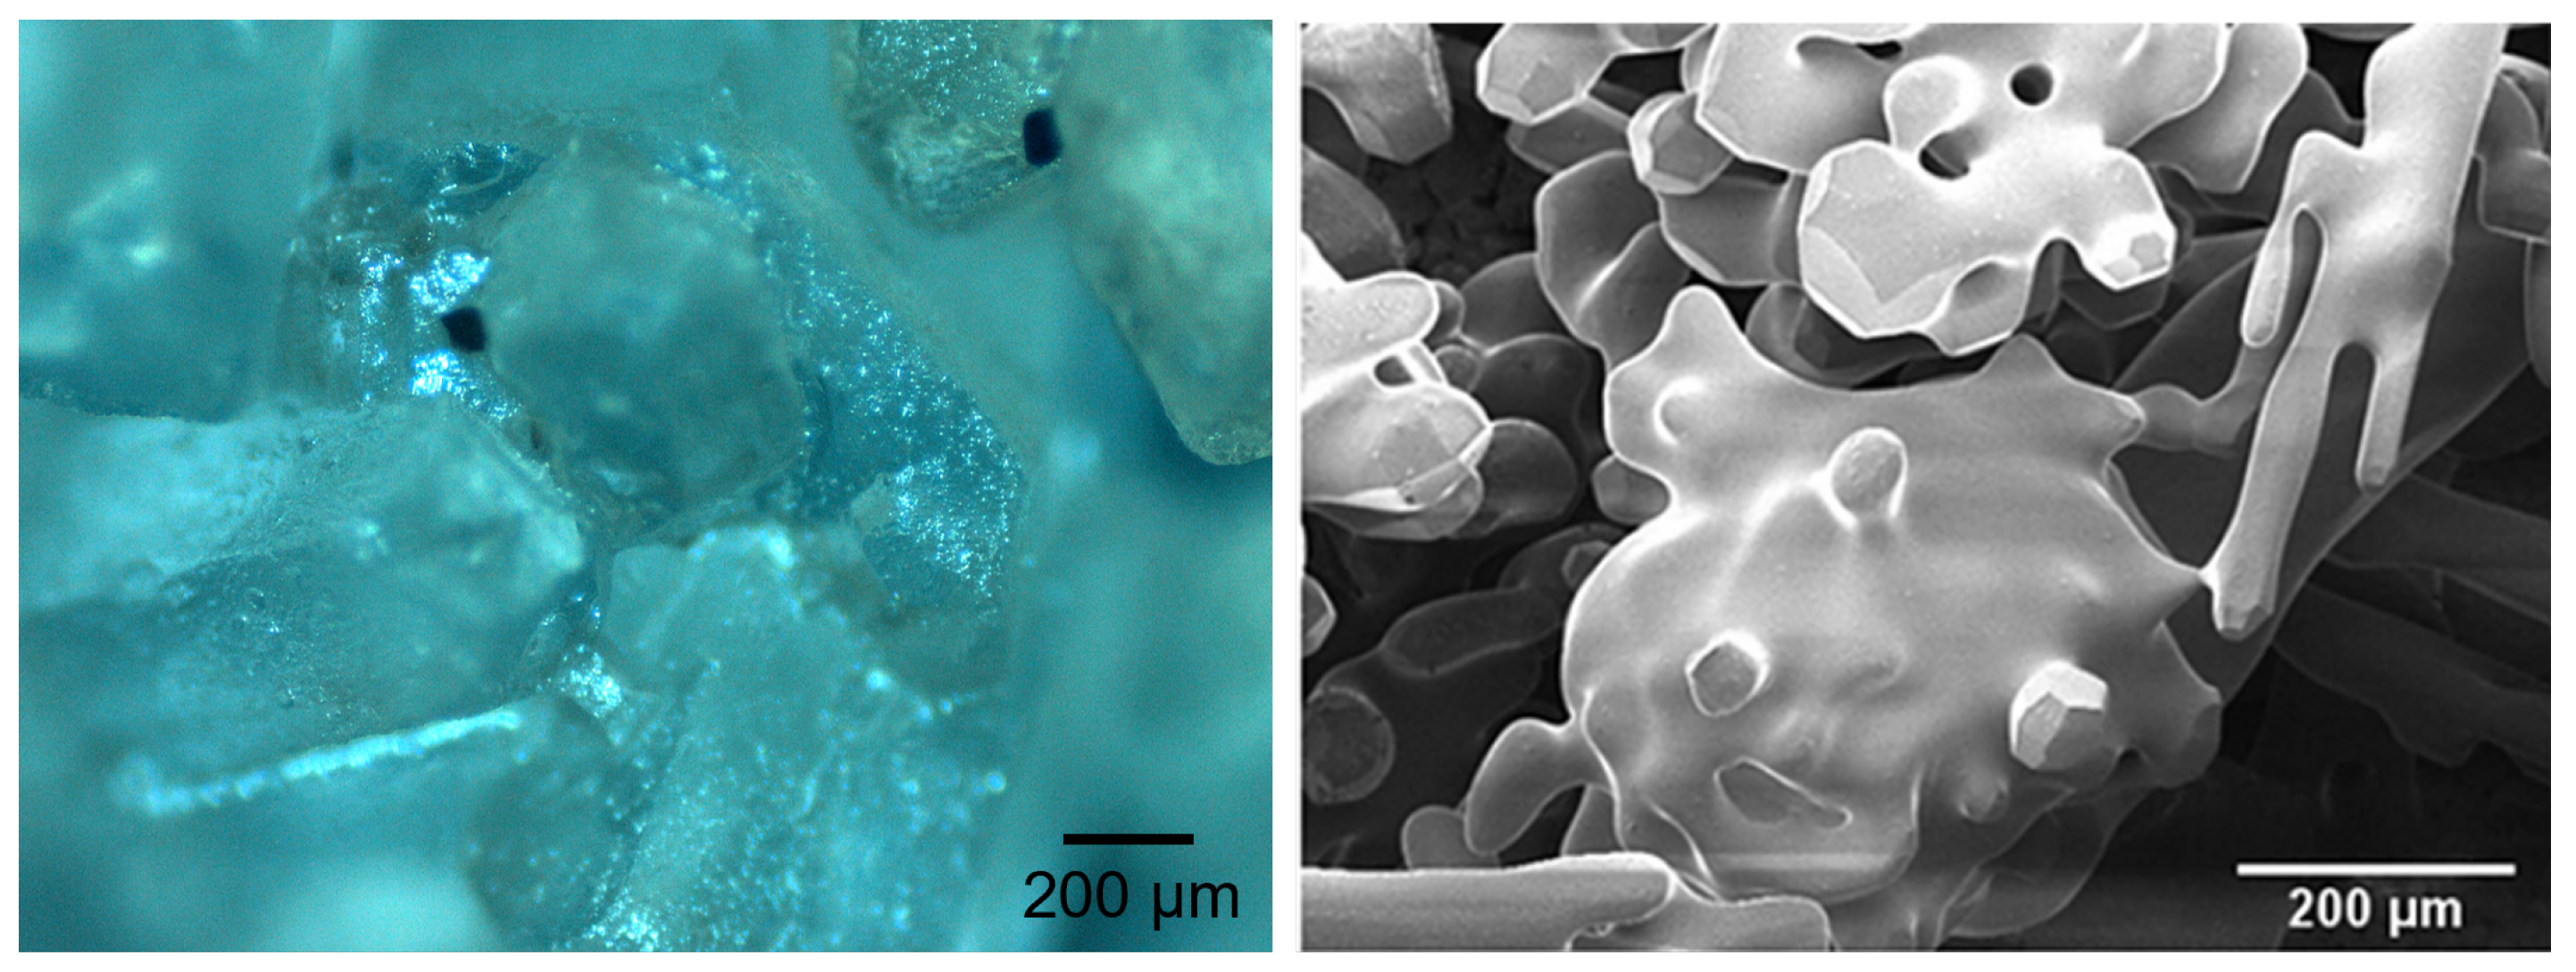
Although shapes differ, similar necking boundaries are evident. Similarities in macroscopic grain coarsening are also observed between sugar and snow crystals (Figure 10).
Hardness or resistance obtained via penetration is accepted to be equivalent to the compressive strength of snow [53]. Herein, sugar strengths determined through penetration testing are similar to the strength (∼4 kPa) exhibited by unprocessed snow subjected to uniaxial compression [54]; this strength is comparable to that observed in sugar subjected to the following conditions:
- Raw sugar at 33% RH after 1 day,
- White sugar at 75% RH after 11–18 days,
- Caster sugar at 75% RH after 5–18 days, and
- Raw sugar at 98% RH after 5 days.
Wang and Baker [52] also examined strength variation in unprocessed natural snow of various densities. Representative strengths for sintered low-temperature (SLT) and fresh high-temperature (FHT) snow are similar to the strength observed for raw sugar at 33% after 18–25 days (20–30 kPa) and representative strengths for FHT-1 and FHT-2 (20 kPa) are comparable to those observed in sugar subjected to the following conditions:
- Caster sugar at 75% RH after 25 days,
- Caster sugar at 98% RH after 25 days, and
- White sugar at 98% RH after 18 days.
Mede et al. [55] also present natural snow compressive strengths similar to strengths determined from the sugar samples. Peak strength observed from all sugar penetration tests was for raw sugar at 33% RH after 25 days (60 kPa). This strength is similar to that observed in sintered snow at −49 °C after 1–10 days undergoing unconfined compression testing (∼50 to 100 kPa) [14].
Most snow strengths determined by Wang and Baker [52] (up to ∼45 kPa) are an order of magnitude greater than those we observed in sugar (∼5 kPa), but some sugar strengths (raw sugar at 33%; see Figure 4) did exceed 50 kPa. These preliminary observations and comparisons suggest that particular sugar types after specific sintering periods at particular humidities, may be useful as an analogue for snow undergoing penetration testing under specific environmental conditions.
6. Conclusions
In this study, we briefly examined whether sintered sugar can be used as an analogue for snow in penetration testing. Through direct light microscopy observations, we determined that sugar is seen to illustrate similar macroscopic sintering processes to snow; and via penetration testing, we determined that sugar sintered within various relative humidity environments gains increased strength over time, demonstrating strengths similar to that observed within low-density unprocessed natural snow. Testing over the temporal periods described herein suggests that sugar may need to sinter for a greater period of time to realise strengths typically evident in sintered snow. However, in the absence of cold-room testing facilities, it appears that sugar may serve as a useful proxy for snow both qualitatively and quantitatively, over a range of different material types, humidities and sintering durations. Although no sugars were seen to share similar characteristics to processed snow at higher temperatures, these characteristics may be equivalent to conditions experienced by natural snow in cold polar environments.
Author Contributions
Conceptualization, A.B.M.; methodology, A.B.M., D.K. and D.L.; formal analysis, A.B.M., D.K. and D.L.; investigation, A.B.M., D.K. and D.L.; writing—original draft preparation, D.L.; writing—review and editing, A.B.M., D.K. and D.L.; supervision, A.B.M.; project administration, A.B.M. All authors have read and agreed to the published version of the manuscript.
Funding
Materials and equipment were funded by School of Science, Technology and Engineering, University of the Sunshine Coast, Australia.
Institutional Review Board Statement
Not applicable.
Informed Consent Statement
Not applicable.
Data Availability Statement
Data are available via email from the corresponding author.
Acknowledgments
This work was only possible because of the invaluable assistance provided by Mr Bernhard Black, Manager of the University of the Sunshine Coast Engineering laboratories. We would also like to thank the anonymous reviewers whose considered advice assisted us in improving this manuscript.
Conflicts of Interest
The authors declare no conflict of interest.
References
- Brown, R.L. A Volumetric Constitutive Law for Snow Subjected to Large Strains and Strain Rates; Technical Report 79-20; US Army Cold Regions Research and Engineering Laboratories: Hanover, Germany, 1979. [Google Scholar]
- Petrovic, J.J. Mechanical properties of ice and snow. J. Mater. Sci. 2003, 38, 1–6. [Google Scholar] [CrossRef]
- Johnson, J.B. A Statistical Micromechanical Theory of Cone Penetration in Granular Materials; Technical Report ERDC/CRREL TR-03-3; Cold Regions Research and Engineering Laboratory: Hanover, Germany, 2003. [Google Scholar]
- Kirchner, H.O.K.; Michot, G.; Narita, H.; Suzuki, T. Snow as a foam of ice: Plasticity, fracture and the brittle-to-ductile transition. Philos. Mag. A 2001, 81, 2161. [Google Scholar] [CrossRef]
- Blackford, J.R. Sintering and microstructure of ice: A review. J. Phys. D Appl. Phys. 2007, 40, R355–R385. [Google Scholar] [CrossRef]
- Paterson, W. The Physics of Glaciers, 3rd ed.; Elsevier Science Ltd.: Oxford, UK, 1994. [Google Scholar]
- German, R.M. Sintering Theory and Practice; Wiley Interscience: New York, NY, USA, 1996. [Google Scholar]
- Alley, R.B. Firn Densification by Grain-boundary sliding: A 1st Model. J. Phys. 1987, 48, 249–256. [Google Scholar]
- Herron, M.M.; Langway, C.C. Firn densification—An empirical-model. J. Glaciol. 1980, 25, 373–385. [Google Scholar] [CrossRef]
- Mellor, M. A Review of Basic Snow Mechanics. In International Symposium on Snow Mechanics; International Association of Hydrological Sciences Publication 114, International Association of Hydrological Sciences: Grindewald, Switzerland, 1975; pp. 251–291. [Google Scholar]
- Einav, I.; Guillard, F. Tracking time with ricequakes in partially soaked brittle porous media. Sci. Adv. 2018, 4, eaat6961. [Google Scholar] [CrossRef] [PubMed] [Green Version]
- Sammonds, P.R. Deformation dynamics: Plasticity goes supercriticial. Nat. Mater. 2005, 4, 425–426. [Google Scholar] [CrossRef]
- Colbeck, S.C. Sintering in a dry snow cover. J. Appl. Phys. 1998, 84, 4585–4589. [Google Scholar] [CrossRef] [Green Version]
- Abele, G. Snow Roads and Runways; Technical Report 90-3; US Army Cold Regions Research and Engineering Laboratory: Hanover, Germany, 1990. [Google Scholar]
- Schneebeli, M.; Pielmeier, C.; Johnson, J.B. Measuring snow microstructure and hardness using a high resolution penetrometer. Cold Reg. Sci. Technol. 1999, 30, 101. [Google Scholar] [CrossRef] [Green Version]
- McCallum, A.B. Direct estimation of snow density from CPT. In 3rd International Symposium on Cone Penetration Testing; Robertson, P.K., Cabal, K.I., Eds.; ISSMGE Technical Committee TC 102: Las Vegas, NV, USA, 2014; pp. 583–590. [Google Scholar]
- Peinke, I.; Hagenmuller, P.; Chambon, G.; Roulle, J. Investigation of snow sintering at microstructural scale from micro-penetration tests. Cold Reg. Sci. Technol. 2019, 162, 43–55. [Google Scholar] [CrossRef]
- Tancret, F.; Osterstock, F. Modelling the toughness of porous sintered glass beads with various fracture mechanisms. Philos. Mag. 2003, 83, 137–150. [Google Scholar] [CrossRef]
- Mellor, M. Snow mechanics. Appl. Mech. Rev. 1966, 19, 379–389. [Google Scholar]
- Leroueil, S.; Vaughan, P.R. The general and congruent effects of structure in natural soils and weak rocks. Geotechnique 1990, 41, 467–488. [Google Scholar] [CrossRef]
- Benson, C.S. Stratigraphic Studies in the Snow and Firn of the Greenland Ice Sheet; Research Report 70; US Army Snow, Ice and Permafrost Research Establishment: Hanover, Germany, 1962. [Google Scholar]
- Pielmeier, C.; Schneebeli, M. Stratigraphy and changes in hardness of snow measured by hand, ramsonde and snow micro penetrometer: A comparison with planar sections. Cold Reg. Sci. Technol. 2003, 37, 393–405. [Google Scholar] [CrossRef]
- Schweizer, J.; Heilig, A.; Bellaire, S.; Fierz, C. Variations in snow surface properties at the snowpack-depth, the slope and the basin scale. J. Glaciol. 2008, 54, 846–856. [Google Scholar] [CrossRef] [Green Version]
- Leite, M.H.; Ferland, F. Determination of unconfined compressive strength and Young’s modulus of porous materials by indentation tests. Eng. Geol. 2001, 59, 267. [Google Scholar] [CrossRef]
- Tharp, T.M. Analogies between the high-temperature deformation of polyphase rocks and the mechanical behavior of porous powder metal. Tectonophysics 1983, 96, T1–T11. [Google Scholar] [CrossRef]
- Gibson, L.J.; Ashby, M.F. Cellular Solids—Structure and Properties, 2nd ed.; Cambridge University Press: Cambridge, UK, 1997. [Google Scholar]
- Nicot, F. Constitutive modelling of snow as a cohesive-granular material. Granul. Matter 2004, 6, 47–60. [Google Scholar] [CrossRef]
- Gubler, H. Determination of the mean number of bonds per snow grain and of the dependence of the tensile strength of snow on stereological parameters. J. Glaciol. 1978, 20, 329–341. [Google Scholar] [CrossRef] [Green Version]
- Bartelt, P.; von Moos, M. Triaxial tests to determine a microstructure-based snow viscosity law. Ann. Glaciol. 2000, 31, 457–462. [Google Scholar] [CrossRef] [Green Version]
- Kinosita, S. Compression of snow at constant speed. Phys. Snow Ice Proc. 1967, 1, 911–927. [Google Scholar]
- Schulson, E.M. Brittle failure of ice. Eng. Fract. Mech. 2001, 68, 1839. [Google Scholar] [CrossRef]
- Mao, B.; Zhang, F.L. Effect of granulated sugar as pore former on the microstructure and mechanical properties of the vitrified bond cubic boron nitride grinding wheels. Mater. Des. 2014, 60, 328–333. [Google Scholar] [CrossRef]
- Rahman, A.; Kamel, A. New Trends in the Clarification Process in the Sugar Industry. In Proceedings of the International Conference on ‘Arab Region and Africa in the World Sugar Context’, Aswan, Egypt, 9–12 March 2003. [Google Scholar]
- Short, S.W.; Bocken, N.P.; Barlow, C.Y.; Chertow, M.R. From refining sugar to growing tomatoes. Ind. Ecol. Bus. Model Evol. 2014, 18, 603–618. [Google Scholar] [CrossRef]
- Bagster, D.F. A Study of the Caking Behaviour of Raw Sugar under Storage. J. Bulk Solids Handl. 1985, 5, 437–441. [Google Scholar]
- Bagster, D.F. The anomalous flow properties of raw sugar under storage. In Proceedings of Australian Society of Sugar Cane Technologists (ASSCT), Townsville, Australia, 19–23 April 1982. [Google Scholar]
- Zafar, U.; Vivacqua, V.; Calvert, G.; Ghadiri, M.; Cleaver, J. A review of bulk powder caking. Powder Technol. 2017, 313, 389–401. [Google Scholar] [CrossRef]
- Gow, A.J. Time-temperature dependence of sintering in perennial isothermal snowpacks. Int. Assoc. Hydrol. Sci. Publ. 1975, 114, 25–41. [Google Scholar]
- Greenspan, G.W. Humidity fixed points of binary saturated aqueous solutions. J. Res. Natl. Bur. Stand. Phys. Chem. 1976, 81A, 89–92. [Google Scholar] [CrossRef]
- Wuori, A.F. Supporting Capacity of Processed Snow Runways; Technical Report 82; Cold Regions Research and Engineering Laboratories: Hanover, Germany, 1962. [Google Scholar]
- Abele, G. Deformation of Snow under Rigid Plates at a Constant Rate of Penetration; Research Report 273; US Army Cold Regions Research and Engineering Laboratory: Hanover, Germany, 1970. [Google Scholar]
- Russell-Head, D.S.; Budd, W.F. Compacted-Snow Runways: Guidelines for Their Design and Construction in Antarctica; Technical Report 89-10; US Army Cold Regions Research and Engineering Laboratories: Hanover, Germany, 1989. [Google Scholar]
- Huang, D.; Lee, J.H. Mechanical properties of snow using indentation test: Size effects. J. Glaciol. 2013, 59, 35–46. [Google Scholar] [CrossRef] [Green Version]
- McCallum, A.B. Cone Penetration Testing (CPT): A valuable tool for investigating polar snow. J. Hydrol. (N. Z.) 2013, 52, 97–113. [Google Scholar]
- Peinke, I.; Hagenmuller, P.; Ando, E.; Chambon, G.; Flin, F.; Roulle, J. Experimental Study of Cone Penetration in Sow Using X-Ray Tomography. Front. Earth Sci. 2020, 8. [Google Scholar] [CrossRef]
- Jellinek, H.H.G. Compressive strength properties of snow. J. Glaciol. 1959, 3, 345–354. [Google Scholar] [CrossRef] [Green Version]
- Yong, R.N.; Fukue, M. Performance of snow in confined compression. J. Terramechanics 1977, 14, 59–82. [Google Scholar] [CrossRef]
- Edens, M.Q.; Brown, R.L. Changes in microstructure of snow under large deformations. J. Glaciol. 1991, 37, 193–202. [Google Scholar] [CrossRef] [Green Version]
- Shoop, S.A.; Alger, R. Snow deformation beneath a vertically loaded plate formation of pressure bulb with a limited lateral displacement. In Proceedings of the Ninth International Conference on Cold Regions Engineering; American Society of Civil Engineers: Duluth, MN, USA, 1998; pp. 143–150. [Google Scholar]
- Abele, G.; Gow, A.J. Compressibility Characteristics of Compacted Snow; Technical Report 76-21; US Army Cold Regions Research and Engineering Laboratory: Hanover, Germany, 1976. [Google Scholar]
- Barnes, P.R. Grain boundary ridge on sintered bonds between ice crystals. J. Appl. Phys. 2003, 93, 783–785. [Google Scholar] [CrossRef]
- Wang, X.; Baker, I. Observation of the microstructural evolution of snow under uniaxial compression using X-ray computed microtomography. J. Geophys. Res. Atmos. 2013, 118, 12371–12382. [Google Scholar] [CrossRef] [Green Version]
- McCallum, A.B. Cone Penetration Testing in Polar Firn. Ph.D. Thesis, Scott Polar Research Institute, University of Cambridge, Cambridge, UK, 2012. [Google Scholar]
- Reiweger, I.; Schweizer, J.; Ernst, R.; Dual, J. Load-controlled test apparatus for snow. Cold Reg. Sci. Technol. 2010, 62, 119–125. [Google Scholar] [CrossRef]
- Mede, T.; Chambon, G.; Hagenmuller, P.; Nicot, F. Mechanical behaviour of weak snow layers: Modelling a porous structure of sintered grains. EPJ Web Conf. 2017, 140, 06008. [Google Scholar] [CrossRef] [Green Version]
Figure 1.
(a) Sieve analysis shows the variation in grain size between sugars and that all sugar types were poorly graded; compare with (b) typical particle size distribution for natural snow (density 330 kg m) and processed snow (density 540–550 kg m) (from Abele and Gow [50]).
Figure 1.
(a) Sieve analysis shows the variation in grain size between sugars and that all sugar types were poorly graded; compare with (b) typical particle size distribution for natural snow (density 330 kg m) and processed snow (density 540–550 kg m) (from Abele and Gow [50]).

Figure 2.
Average temperature readings across containers 7, 8, and 9, with linear temperature average trend line.
Figure 2.
Average temperature readings across containers 7, 8, and 9, with linear temperature average trend line.

Figure 3.
Average humidity readings for final containers throughout the 25 day testing period.

Figure 4.
Average stress vs. strain for all sugars at each humidity at all assessed temporal periods. (a). Caster sugar at 33% relative humidity, (b). Caster sugar at 75% relative humidity, (c). Caster sugar at 98% relative humidity, (d). Raw sugar at 33% relative humidity, (e). Raw sugar at 75% relative humidity, (f). Raw sugar at 98% relative humidity, (g). White sugar at 33% relative humidity, (h). White sugar at 75% relative humidity, (i). White sugar at 98% relative humidity.


Figure 5.
Temporal variation in strength for all sugars sintered at 33% RH. Note: vertical axis differs to Figure 6 and Figure 7.

Figure 6.
Temporal variation in strength for all sugars sintered at 75% RH. Note: vertical axis differs to Figure 5 and Figure 7.

Figure 7.
Temporal variation in strength for all sugars sintered at 98% RH. Note: vertical axis differs to Figure 5 and Figure 6.

Figure 8.
Light microscopy images of caster sugar samples over a 25 day period at 33% relative humidity.
Figure 8.
Light microscopy images of caster sugar samples over a 25 day period at 33% relative humidity.

Figure 9.
Grain necking in raw sugar after one day compared to necking in snow crystals after eight days (reproduced from Barnes [51], with the permission of AIP Publishing).
Figure 9.
Grain necking in raw sugar after one day compared to necking in snow crystals after eight days (reproduced from Barnes [51], with the permission of AIP Publishing).

Figure 10.
Comparison of raw sugar crystal coalescing and 3D scanned FHT snow coalescing (from Wang and Baker [52]).
Figure 10.
Comparison of raw sugar crystal coalescing and 3D scanned FHT snow coalescing (from Wang and Baker [52]).


Table 1.
Salt solutions used and corresponding relative humidity generated.
| Salt Type | Water Content (ml) | Salt Content (g) | Humidity (%) |
|---|---|---|---|
| Magnesium chloride | 20 | 100 | 33 |
| Sodium chloride | 75 | 100 | 75 |
| Potassium sulphate | 100 | 100 | 98 |
Publisher’s Note: MDPI stays neutral with regard to jurisdictional claims in published maps and institutional affiliations. |
© 2022 by the authors. Licensee MDPI, Basel, Switzerland. This article is an open access article distributed under the terms and conditions of the Creative Commons Attribution (CC BY) license (https://creativecommons.org/licenses/by/4.0/).
Share and Cite
MDPI and ACS Style
McCallum, A.B.; Kent, D.; Lee, D. Sugar as an Analogue for Snow in Penetration Testing: A Preliminary Comparison. Powders 2022, 1, 33-46. https://0-doi-org.brum.beds.ac.uk/10.3390/powders1010004
AMA Style
McCallum AB, Kent D, Lee D. Sugar as an Analogue for Snow in Penetration Testing: A Preliminary Comparison. Powders. 2022; 1(1):33-46. https://0-doi-org.brum.beds.ac.uk/10.3390/powders1010004
Chicago/Turabian StyleMcCallum, Adrian B., Damon Kent, and Denham Lee. 2022. "Sugar as an Analogue for Snow in Penetration Testing: A Preliminary Comparison" Powders 1, no. 1: 33-46. https://0-doi-org.brum.beds.ac.uk/10.3390/powders1010004