
Exploring Synergistic Effect on the Stability of Ni-, Pd-, Ir-Doped TiN (N = 1–15) Nanoparticles
Materials Modelling Centre, University of Limpopo, Private Bag x1106, Sovenga 0727, South Africa
*
Author to whom correspondence should be addressed.
Alloys 2024, 3(1), 15-30; https://0-doi-org.brum.beds.ac.uk/10.3390/alloys3010002
Submission received: 1 December 2023
/
Revised: 17 January 2024
/
Accepted: 19 January 2024
/
Published: 26 January 2024
Abstract
:Bimetallic nanoclusters have attracted great interest due to their ability to enhance the catalytic properties of nanoclusters through synergetic effects that emerge from the combination of the metal nanocluster with different transition metal (TM) species. However, their indefinite composition and broad distribution hinder the insightful understanding of the interaction between these invasive metals in bimetallic doped nanoalloys. In this study, we report a density functional theory calculation with the PBEsol exchange-correlation functional for 16-atom TiN−1TM (TM = Ni, Ir, Pd) nanoalloys, which provides new insights into the synergetic effect of these invasive metals. The probe into the effect of these metal impurities revealed that the replacement of a Ti atom with Ni, Ir and Pd enhances the relative stability of the nanoalloys, and the maximum stability for a lower bimetallic composition is reached for Ti4Ir, Ti5Pd and Ti7Ni. The most stable nanoalloy is reached for the Ti12Ir cluster in comparison with the Ti12Pd and Ti12Ni clusters and pure Ti13 monoatomic nanocluster. This stability trend is as revealed well by both the binding energy and the dissociation energy. The average HOMO-LUMO gap for the bigger clusters revealed that the valence electrons in the HOMO can absorb lower energy, which is indicatory of a higher reactivity and lower stability. The quantum confinement is higher for the smaller clusters, which illustrates a higher stability and lower reactivity for those systems.
Keywords:
clusters; doping; binding energy; relative stability; HOMO-LUMO; charge density difference1. Introduction
The study of the structural and electronic properties of transition metal nanoclusters has received significant attention due to its importance in nanoscience and nanotechnology. The atomic reduction, with respect to size, down to the nanometer scale leads to the emergence of a wide variety of new insights, making small metals very attractive due to their reactivity. Heteroatom-doped clusters have been highlighted for the possibility of tuning their reactivity by changing the cluster size and composition. The intension of a doping process is to insert a heteroatom into a material to manipulate the properties of that material [1]. Researchers have achieved a deeper understanding of the influence of impurities on the nanoparticles [1,2,3]. Metal nanoparticles have received ever increasing interest in comparison with bulk metal materials [4,5,6]. Particularly, nanoparticles with metal impurities are currently receiving significant attention due to their large surface-to-volume ratio, quantum size effect properties and promising applications [7,8,9,10]. Yan et al. [11] used the DFT framework to study Al-doped Ti nanoparticles. The Ti4Al isomer was reported to be the most stable nanoparticle. The valent transition of the Al atom was found to be associated with the structural transfer that originated with Ti10Al.
The DFT calculations predicted that the addition of impurities to aluminum clusters can enhance the stability of certain “magic” clusters and tune them to exhibit desirable physical and chemical properties [12,13]. Jiang et al. [14] studied the structures and stabilities of the AlNB and AlNB2 (N = 1−7) using B3LYP and CCSD(T) methods and found that the mixed AlB clusters exhibit peculiar aromatic behaviors. Bergeron et al. [13,15] found that the Al13I2− cluster has chemical characteristics like the triiodide ion, and Al13Ix− clusters exhibit high stability with even numbers of I atoms, while Al14Ix− exhibits stability with odd numbers of I atoms. Other studies have reported that inert elements in the bulk, for example, gold, become reactive at the nanoscale [16,17], suggesting the possibility of using clusters as catalysts, with size-dependent and reaction-specific properties [18,19]. Ferrari et al. [20] studied the reactivity of small metallic clusters using mass spectrometric methods. They reported that the doping strongly influences the electronic structure of a cluster, and the effect of doping is size-dependent, strongly altering the odd−even pattern of the reaction probability.
In amorphous carbon materials, dispersed platinum nanoparticles (Pt/C) are standard catalysts for the oxygen reduction reaction, ORR, which is the principal reaction in PEMFCs [21,22]. In comparison with the pure Pt bulk catalysts, the Pt–TM alloys doped with other transition metal elements in the 3d block (Co, Ni, Fe, etc.) display better catalytic activity and lower cost [23,24]. The tendency to dissolve in acidic solutions was reported to be attributed to the relatively low cohesive energy of Pt-alloyed nanoparticles [25,26]. Thus, the alloying of Pt-based nanoparticles raises the cohesive energy which improves their stability [27,28].
Regardless of the extensive studies on doped transition metal nanoclusters, research studies are comparatively rare for the Ti-bearing bimetallic nanoparticles. Reports have stated that early transition metal nanoclusters, particularly Ti nanoclusters, possess complicated electronic ground state structures due to the almost empty d-band with different multiplicities. The energies between those multiplicities are so close that determining the ground state structures is always complicated [29,30,31]. Small M-doped titanium (M = V, Fe, Ni) clusters were investigated by Du et al., 2009 [29], using the DFT approach. It was found that triangle bipyramid geometries are the most stable structures for Ti4V, Ti4Fe and Ti4Ni. Du et al., 2010 [30], used the DFT method PW91PW91 to investigate the changes in the geometrical, electronic and magnetic properties of titanium clusters when one titanium atom is substituted by boron. They found out that the Ti5 and Ti7 clusters have stronger stabilities than their respective neighbors. The Ti4B and Ti6B indicated stronger stabilities with Ti6B as the most stable configuration.
Rodríguez-Kessler and Rodríguez-Domínguez [31] used first principles calculations to investigate the structure and electronic properties of TiNV (N = 1−16). They reported that when a single V impurity is added to TiN clusters, an increase in the average binding energy occurs, especially for N = 12 or Ti12V. The binding energy was reported to be similar for Ti1–10V clusters, except for Ti3V and Ti6V clusters, where it is lower than pure TiN clusters.
Verkhovtsev et al. [32] employed Ab initio and classical approaches to characterize the small pure and Ni-doped titanium clusters. It was found that the doping with a Ni atom in the titanium clusters does not significantly affect the stability of the compounds. Thus, with the amount of the research that has been completed on Ti-doped nanoclusters, the study of Pd-, Ir- and Ni-doped Ti nanoparticles (N > 13) have not been investigated until the current study. The fusion of Ir, Ni and Pd with Ti as one nanocluster entity might retain the chemical and magnetic properties of the individual components. To investigate the stability and electronic properties of TiN−1M (N = 2−16, M = Pd, Ir, Ni) clusters, this work was organized as follows. In Section 2, we emphasized the construction method of the models and the computational details. The results and their discussions were presented in Section 3. We paid attention to their binding energies, relative stabilities and electronic properties. The average binding energies, relative stabilities and the dissociation energies are compared with the bare Ti clusters with respect to their cluster size N. We discussed the density of states (DOS), HOMO-LUMO and charge density for Ti12M clusters. A brief conclusion was given in Section 4. The structural characterization will not be included in this paper since the most preferred positions for these systems were discussed in the previous paper [33]. The search for the most stable positions was done by hand; benchmarking with Pt and these positions were further used to optimize Ir-, Pd- and Ni-doped Ti clusters. This is the reason why we will only investigate the effect of these impurities on the stability and electronic properties of titanium nanoclusters. We refer the reader to our earlier publication [33] for details.
2. Materials and Methods
The calculations in this work were performed within the frameworks of Knowledge Led Master Code (KMLC) software [34,35,36] and the density functional theory (DFT) [37,38] for pure Ti and Ir-, Pd-, Ni-doped Ti nanoclusters. Firstly, the Knowledge Led Master Code was used to search for global and local minima for pure Ti nanoclusters. The KLMC software calls on a range of third party software so as to compute energies and minimize atomic forces for global optimization. This program automates many tasks that traditionally have been attempted by hand, such as, the creation of input files, submission of calculations using the input files on either local or external computer platforms and extraction of data from output files. The code automates multistage optimization, computing energy and atomic forces at various levels of theory during structure relaxation, allowing for flexibility in searching for interatomic potential structures on DFT energy landscapes. The GA module, as implemented within KMLC, is employed to locate the local (LM) and global minima (GM) on the potential energy surface (PES) [39,40]. The search is performed at an interatomic potential level of theory using Generalized Utility Lattice Program (GULP) code [41,42]. The use of reliable and quality interatomic potentials (IPs) has been used successfully in previous studies [43,44]. In the current work, the PES of TiN nanoclusters is evaluated using a many-body embedded atom method (EAM), which includes a combination of a many-body attractive term, , and a repulsive two-body Born–Mayer IP, .
where and are empirical parameters; is the equilibrium first neighbor distance in hcp solid; represents the distance between atoms and . The initial candidate structures were created by randomly placing atoms in a cube with length between 4 Å, for the smallest clusters, and 15 Å, for the largest, with a distance of 80% of bond length to prevent unfeasibly dense structures and unwanted formation of metal–metal bonds. Secondly, after the global and local minima structures were located, selected structures of titanium were further reoptimized at a DFT level of theory using all-electron, full-potential code FHI-aims [45]. This code was further utilized to optimize doped nanoclusters of titanium using FHi-aims’ default “tight” settings and grid combined with a scalar ZORA relativistic treatment [46], using the solids-corrected Perdew–Burke–Ernzerhof (PBEsol) [47] generalized gradient approximation (GGA) [48] exchange correlation functional to reduce computational cost. The PBEsol exchange correlation functional was chosen due to its unbiased nature and low computational cost. Thirdly, the plane wave pseudopotential method as implemented in Cambridge Serial Total Energy Package (CASTEP) code [49,50] was used to perform the full geometry optimization for the doped titanium nanoclusters to calculate the charge density difference for the most stable configurations of Ti12M (Ir, Pd, Ni). The ultrasoft pseudopotentials represented the interaction between the ionic core and valence electrons. The plane wave cut-off energy of 500 eV was found to be sufficient to converge the total energies, where the plane wave generalized gradient approximation of the Perdew–Burke–Ernzerhof (GGA-PBEsol) exchange correlation functional was employed. The convergence tolerance for the force, ionic displacement, energy and self-consistent field (SCF) were 0.05 eV/Å, 0.002 Å, 2.0 × 10⁻⁵ eV/atom and 2.0 × 10⁻⁶ eV/atoms. Lastly, to calculate the iso-surface of the HOMO-LUMO, the GGA-PBE exchange correlation functional [51] as implemented within the DMol3 code [52,53] was employed for the relaxation of the magic nanoclusters for doped titanium. The self-consistent field, max displacement, convergence tolerance for the force and energy were set at 1.0 × 10⁻⁵, 0.005 Å, 0.004 Ha/Å and 2.0 × 10⁻⁶.
3. Results and Discussion
This section gives a more detailed discussion on the binding energy, relative stability, dissociation energy, HOMO-LUMO and charge density difference for TiNM (M = Pd, Ir, Ni). The stable conformations of the titanium nanoclusters that were used to dope the Pd, Ni and Ir impurities were reported for the Pt-doped Ti nanoclusters [33]. Section 3.1 only focuses on the stability, and in Section 3.2, the electronic properties of the doped Ti nanoclusters are investigated.
3.1. Stability of the TiNM (M = Pd, Ir, Ni)
The stability of the and (M = Pd, Ni, Ir) clusters can be investigated on the basis of the binding energy per atom (), relative stability or second-order energy difference () and dissociation energy (). These quantities can be calculated using the following formulas:
and for the -doped clusters, the stability is defined as
where , and are the total energies of the pure atoms, with representing the Pd, Ni, Ir atoms and the doped cluster, while denotes the number of atoms in the cluster, respectively.
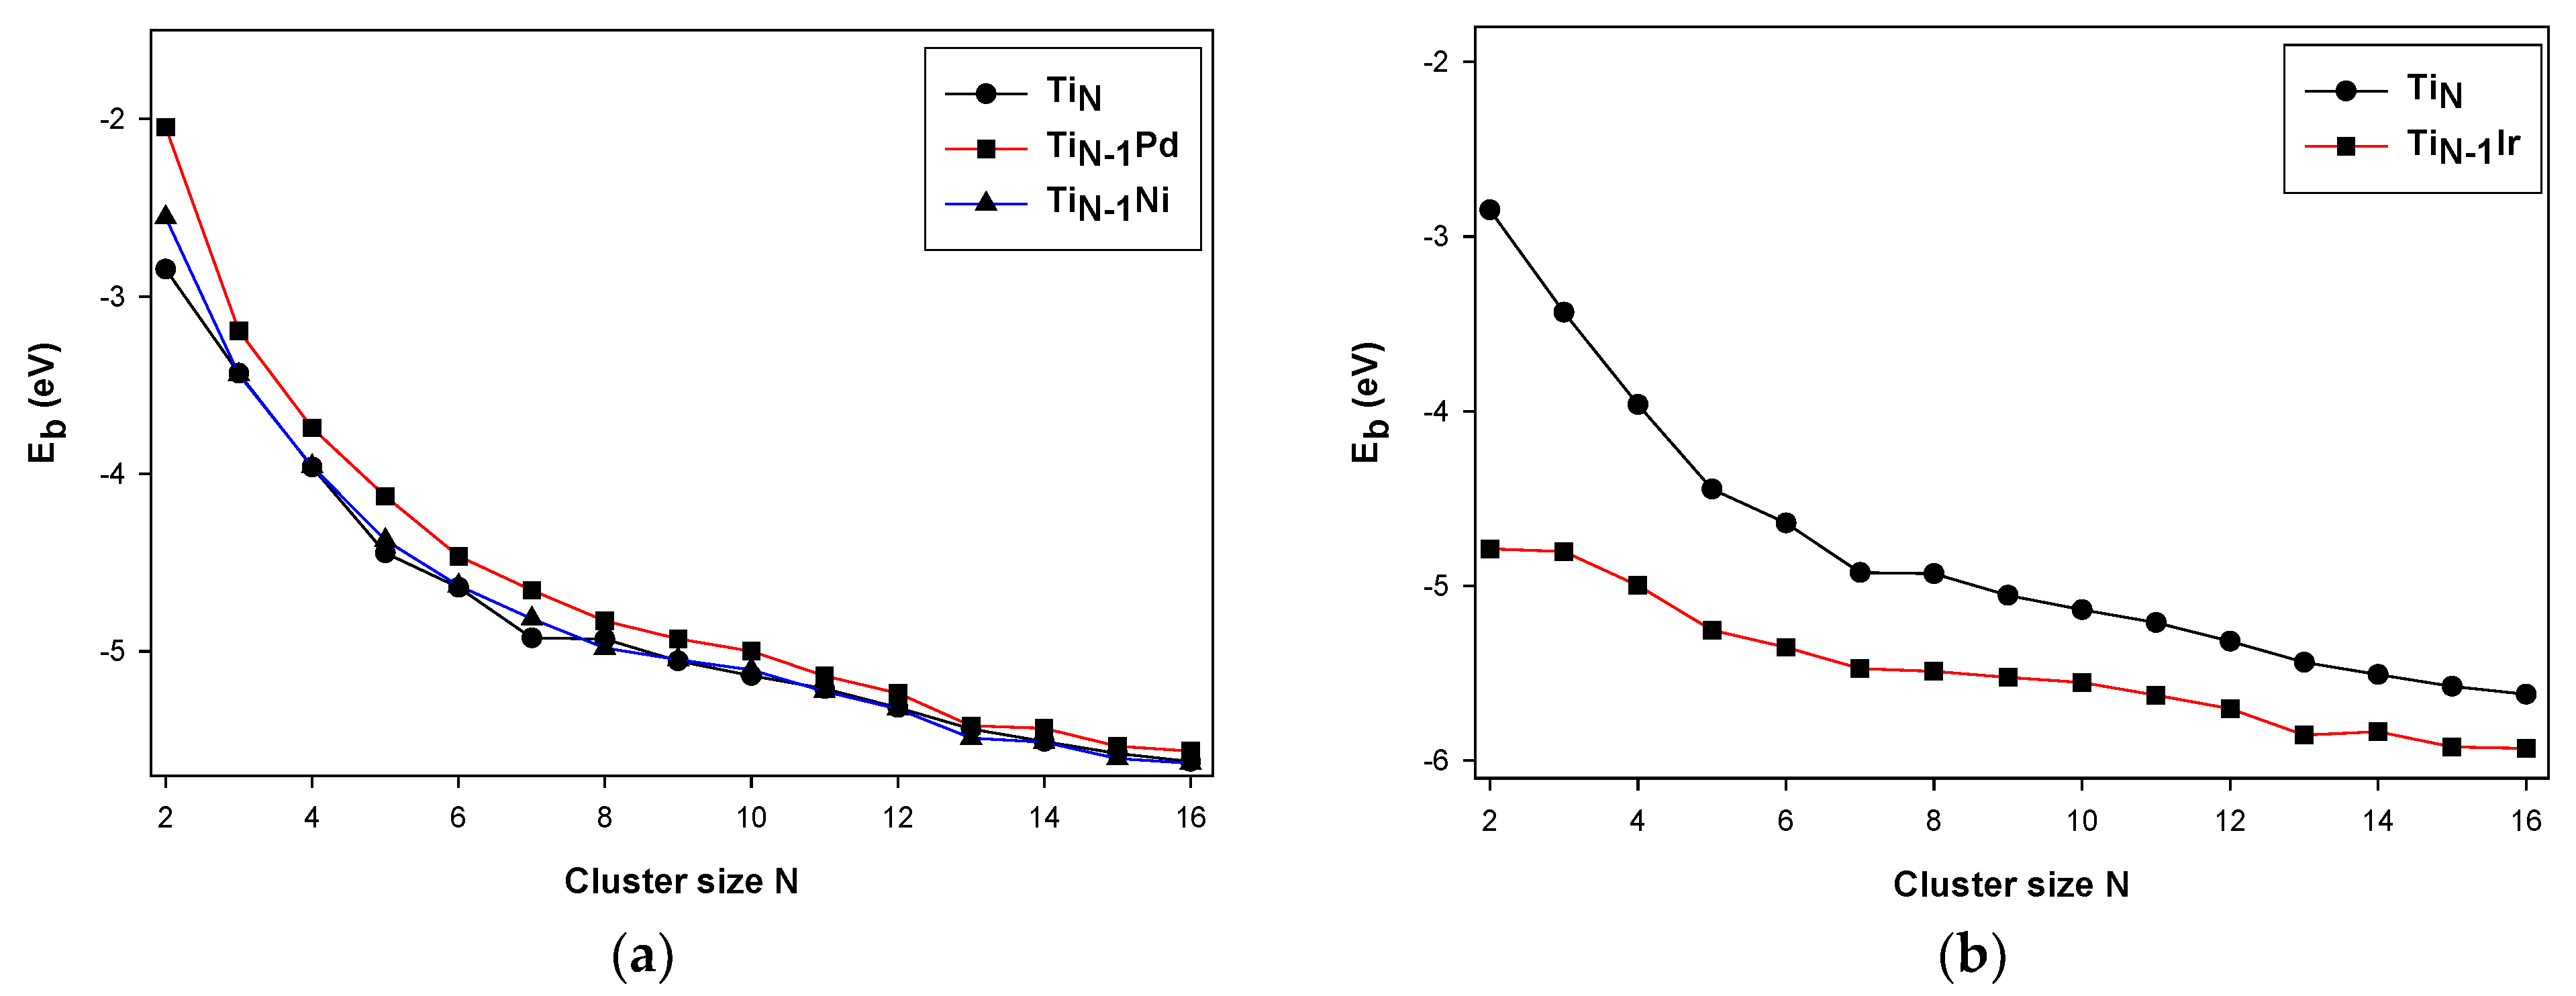
Figure 1a,b show the binding energy of the pure TiN and TiN−1M clusters for N = 2−16. The binding energy for the pure Ti gradually decreases with the cluster size rapidly up to N ≤ 7, then the energy becomes smooth with clusters where N > 7, indicating that these clusters could continue to be more negative during the growth process. Furthermore, when the Ti clusters are doped with Ni and Pd impurities, the binding energy trend is similar for the Pd and Ni impurities, except for the Ir impurities.
The Pd impurity is observed to have a binding energy that is slightly higher than bare Ti clusters, whereas the binding energy for the Ni impurity is relatively similar to that of the bare Ti clusters. Additionally, the binding energy for the Pd-doped Ti clusters is observed to be lower compared to that of the Ni and bare clusters at N > 10 onwards. The pure Ti clusters are found to have lowered binding energy at N = 7 which signifies greater stability; however, with the Ni and Pd dopants, the binding energy is found to be lowered at N = 13. This illustrates the conversion of the stability of the Ti clusters from N = 7 to N = 13 when doped with Ni and Pd. This phenomenon is attributed to the cluster exhibiting a wide range of electronic properties by varying the doping element or the doped transition metal element absorbing the dangling bond present in the cages of the icosahedral isomer [54,55]. The same behavior was also reported by Rodríguez-Kessler and Rodríguez-Domínguez [31] and Phaahla et al. [33]. In the case of the Ir dopant, the binding energy is found to be more enhanced as compared to the Ni and Pd dopants.
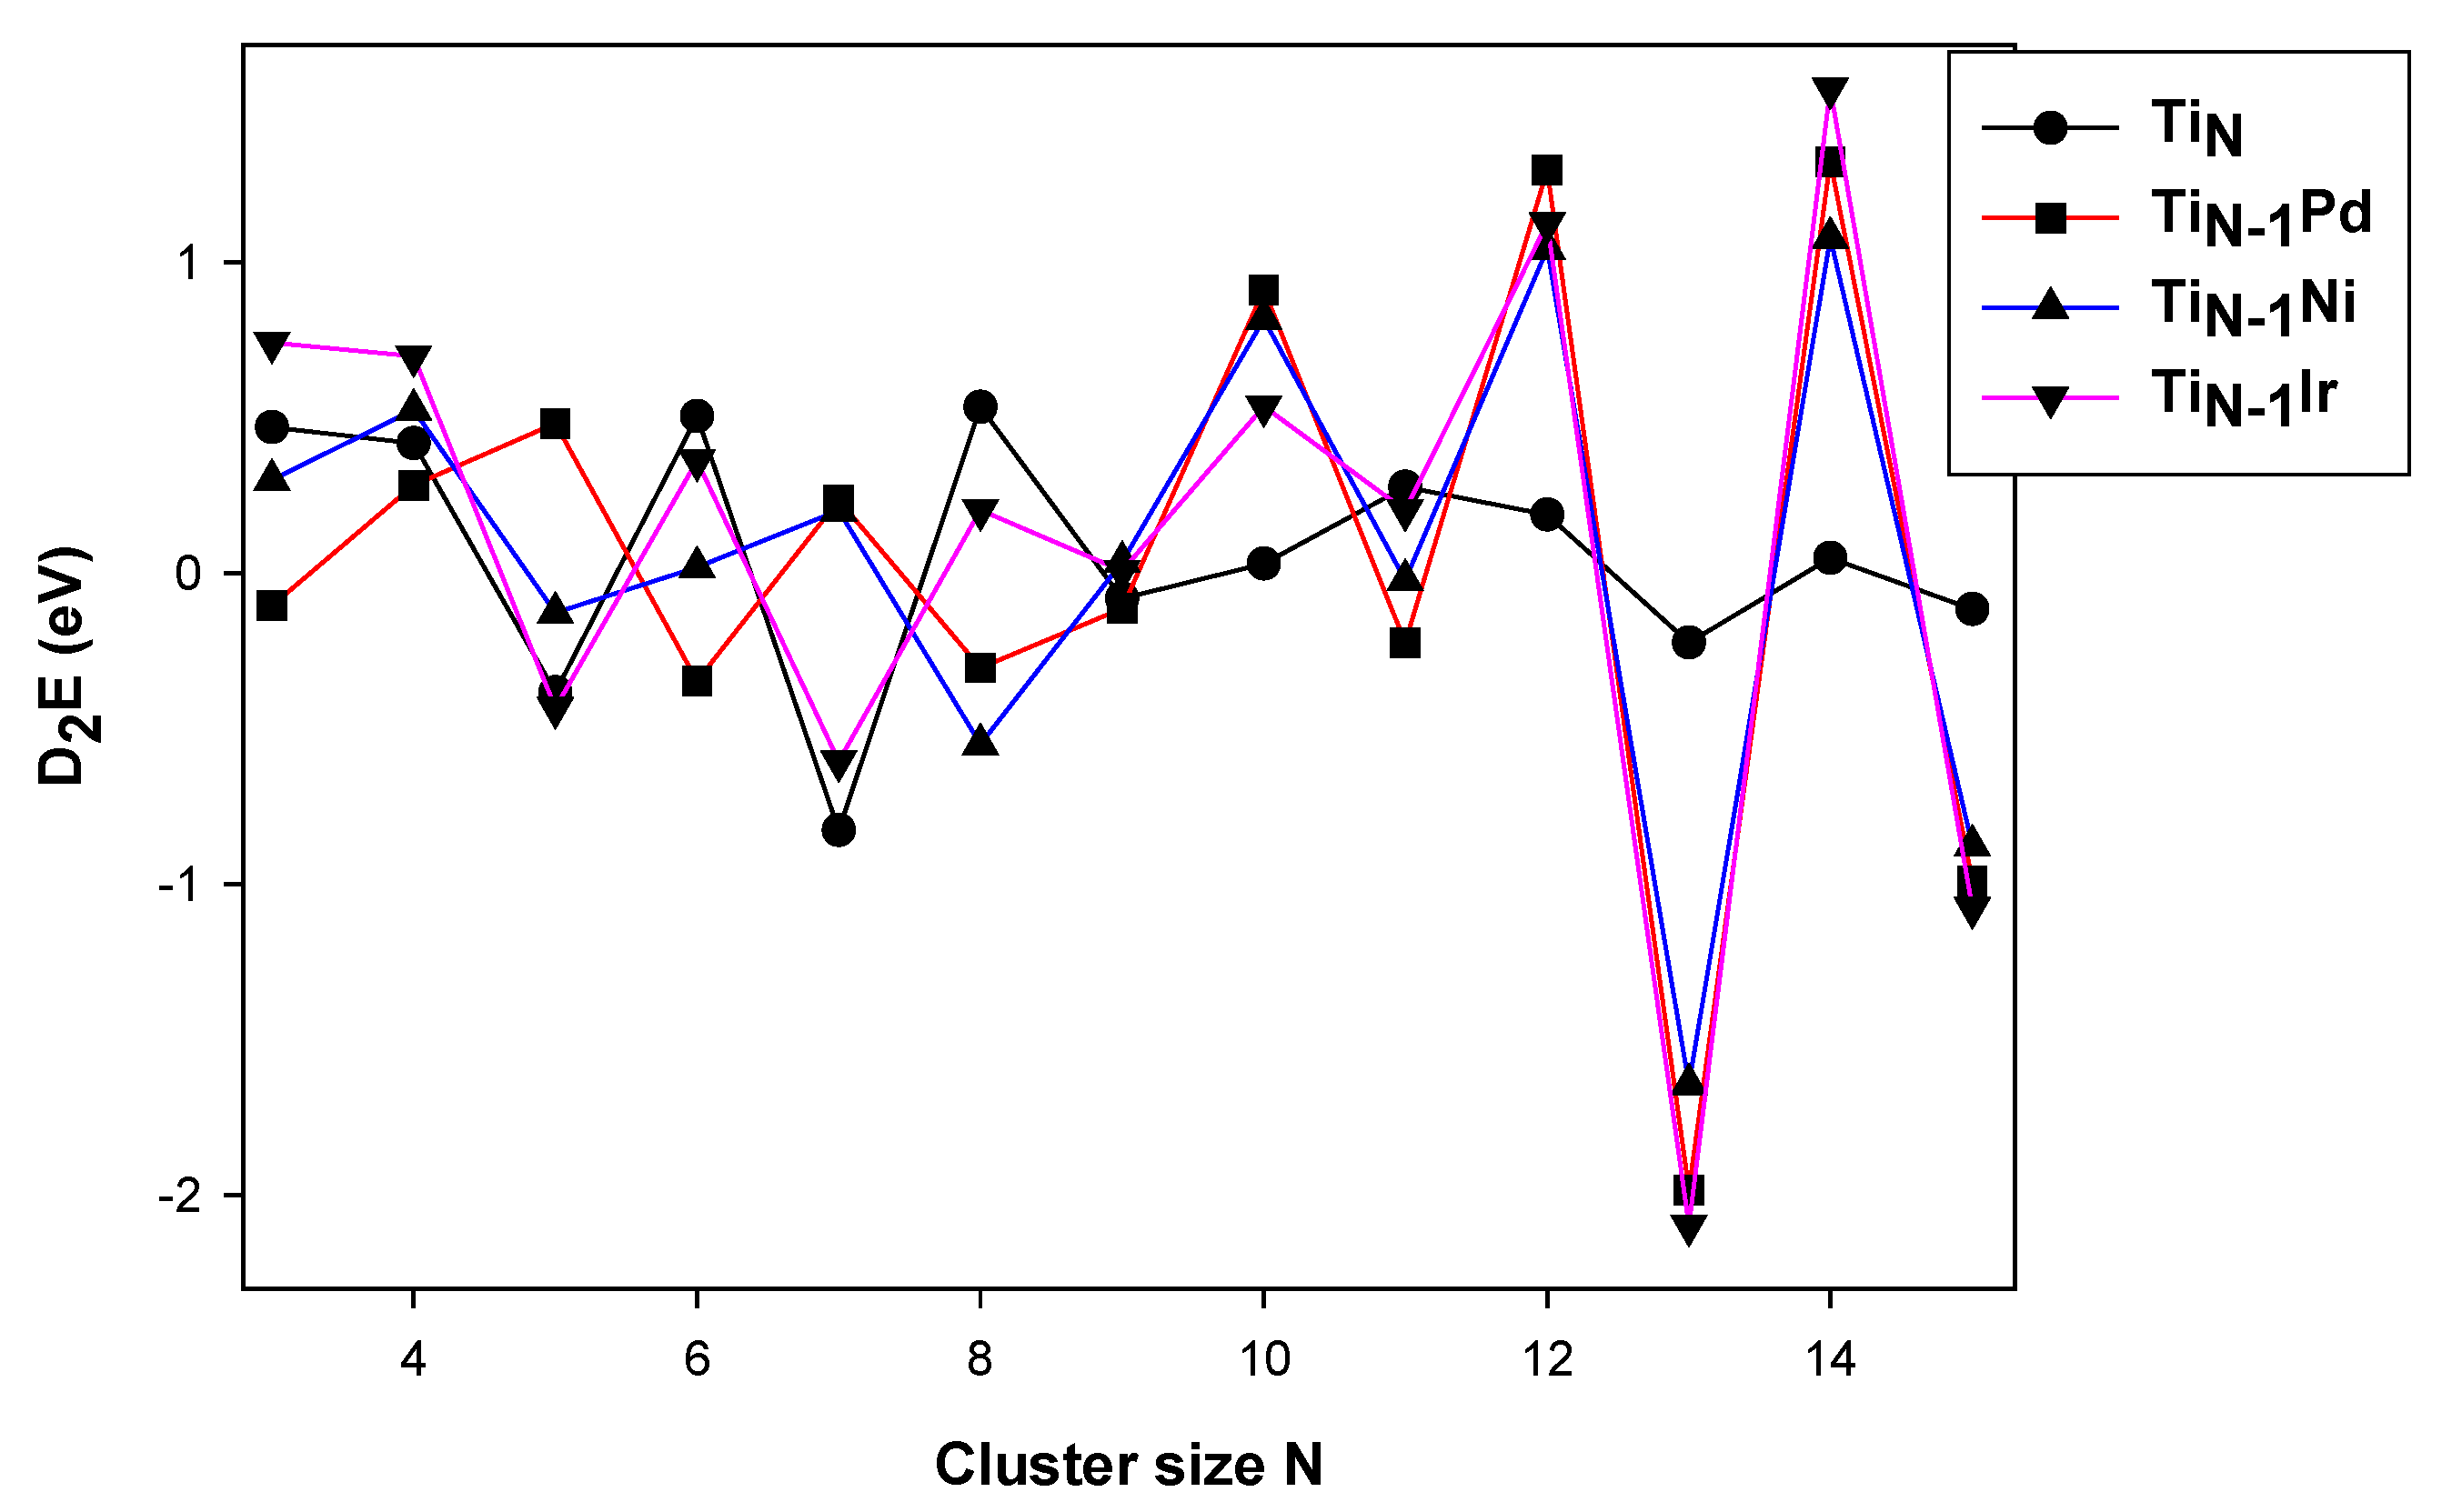
These observations display the Ir dopant as having the lowest binding energies in comparison with the Pd and Ni dopants. Interestingly, all the Ti12M clusters display a lowered energy at N = 13. However, the Ir dopant depicts a slightly lowered energy at N = 7, illustrating that the Ir impurity did not completely remove the magic behavior of the N = 7 cluster as compared to the Ni and Pd, it slightly reduced the strength of the magic behavior for N = 7. It is also observed that as the cluster size is increased, the binding energy of the doped Ti clusters is lowered towards the binding energy of the bare Ti clusters, suggesting that as the cluster size is increased, the stabilizing effect of a single atom dopant is reduced. Additionally, nickel and palladium belong to the same group, and they are expected to react with other elements in the same way. Hence, their binding energies for both dopants are relatively closer to that of the bare Ti clusters. The second-order energy difference (D2E) plotted in Figure 2 and dissociation energy (Ed) in Figure 3 are the sensitive quantities that can reflect the relative stability of the TiNM clusters compared with their neighbors.
The relative energy and dissociation energies usually exhibit even–odd alternation behavior which illustrates the stable and meta-stable clusters. The size dependence of the relative stability for the TiNM clusters was investigated and plotted in Figure 2. For the relative energy, an odd–even pattern is shown with the minimum values at N = 5, 7, 8, 11, 13 and 15, with the Ir impurity having the lowest energy in the N = 13 cluster, followed by Pd and Ni. This stability behavior corresponds well with the pure Ti13 cluster, which is also in excellent agreement with the previous experimental [56,57] and theoretical results [45,58,59]. There is a different impact of the impurities that is noted for the smaller clusters (N = 4−8). At N = 3−4, the Ir and bare Ti clusters are observed to have a similar binding energy trend. The Pd and Ni impurities are also observed to have a similar trend that is different to that of the bare clusters and those with the Ir dopant.
The Ir impurity is found to enhance the stability of the N = 5 isomer; however, Pd and Ni are observed to reduce the stability of this cluster, with the Pd impurity converting the N = 5 cluster into a non-stable isomer. The enhanced energy of the N = 5 cluster was also reported by Hurtado et al. [60]. At N = 6, the Ir and bare cluster are observed to have relatively similar energies. The Ir and Pd dopants are observed to stabilize the cluster, with the Pd dopant having converted the cluster into one of the magic clusters. For the N = 7 isomer, the Ir dopant is observed to have reduced stability compared to the bare Ti cluster, whereas Pd and Ni converted the cluster into a non-stable configuration. This agrees with what is observed in Figure 1.
At N = 8, Ni and Pd converted the bare cluster into a stable geometry, with Ni stabilizing the cluster more than the Pd dopant. The Ir dopant is observed to have slightly lowered the relative energy compared with the bare cluster. For N = 9, the clusters are observed to have relatively similar relative energies. At N = 10, all the dopants are observed to have increased the relative energy of the isomer. This illustrates the loss of stability of the cluster. The the Ni, Ir and Pd dopants are observed to have stabilized the N = 11 geometry. The dopants converted the N = 11 isomer into a stable configuration, with Pd enhancing the relative stability more in comparison with Ni and Ir.
For N = 12, the dopants are found to highly stabilize the isomer compared to the N ≤ 11 clusters. The metal impurities are found to have converted the N = 13 cluster into the most stable isomer *magic cluster*, with the Ir impurity stabilizing the cluster more than the Pd and Ni impurities. These results correlate well with the binding energy. This is due to the increase in orbitals in the octahedral complexes that further stabilize the isomers with six or less metals [61]. Additionally, the odd-electron bonded species are open shell; therefore, they are kinetically less stable under normal conditions than the closed shell systems. Hence, the icosahedral is observed to be the most stable isomer. At N = 14, the impurities destabilize the cluster more in comparison with all other clusters. N = 15 depicts all the impurities stabilizing the isomer, with Ir lowering the relative energy more than the other dopants.
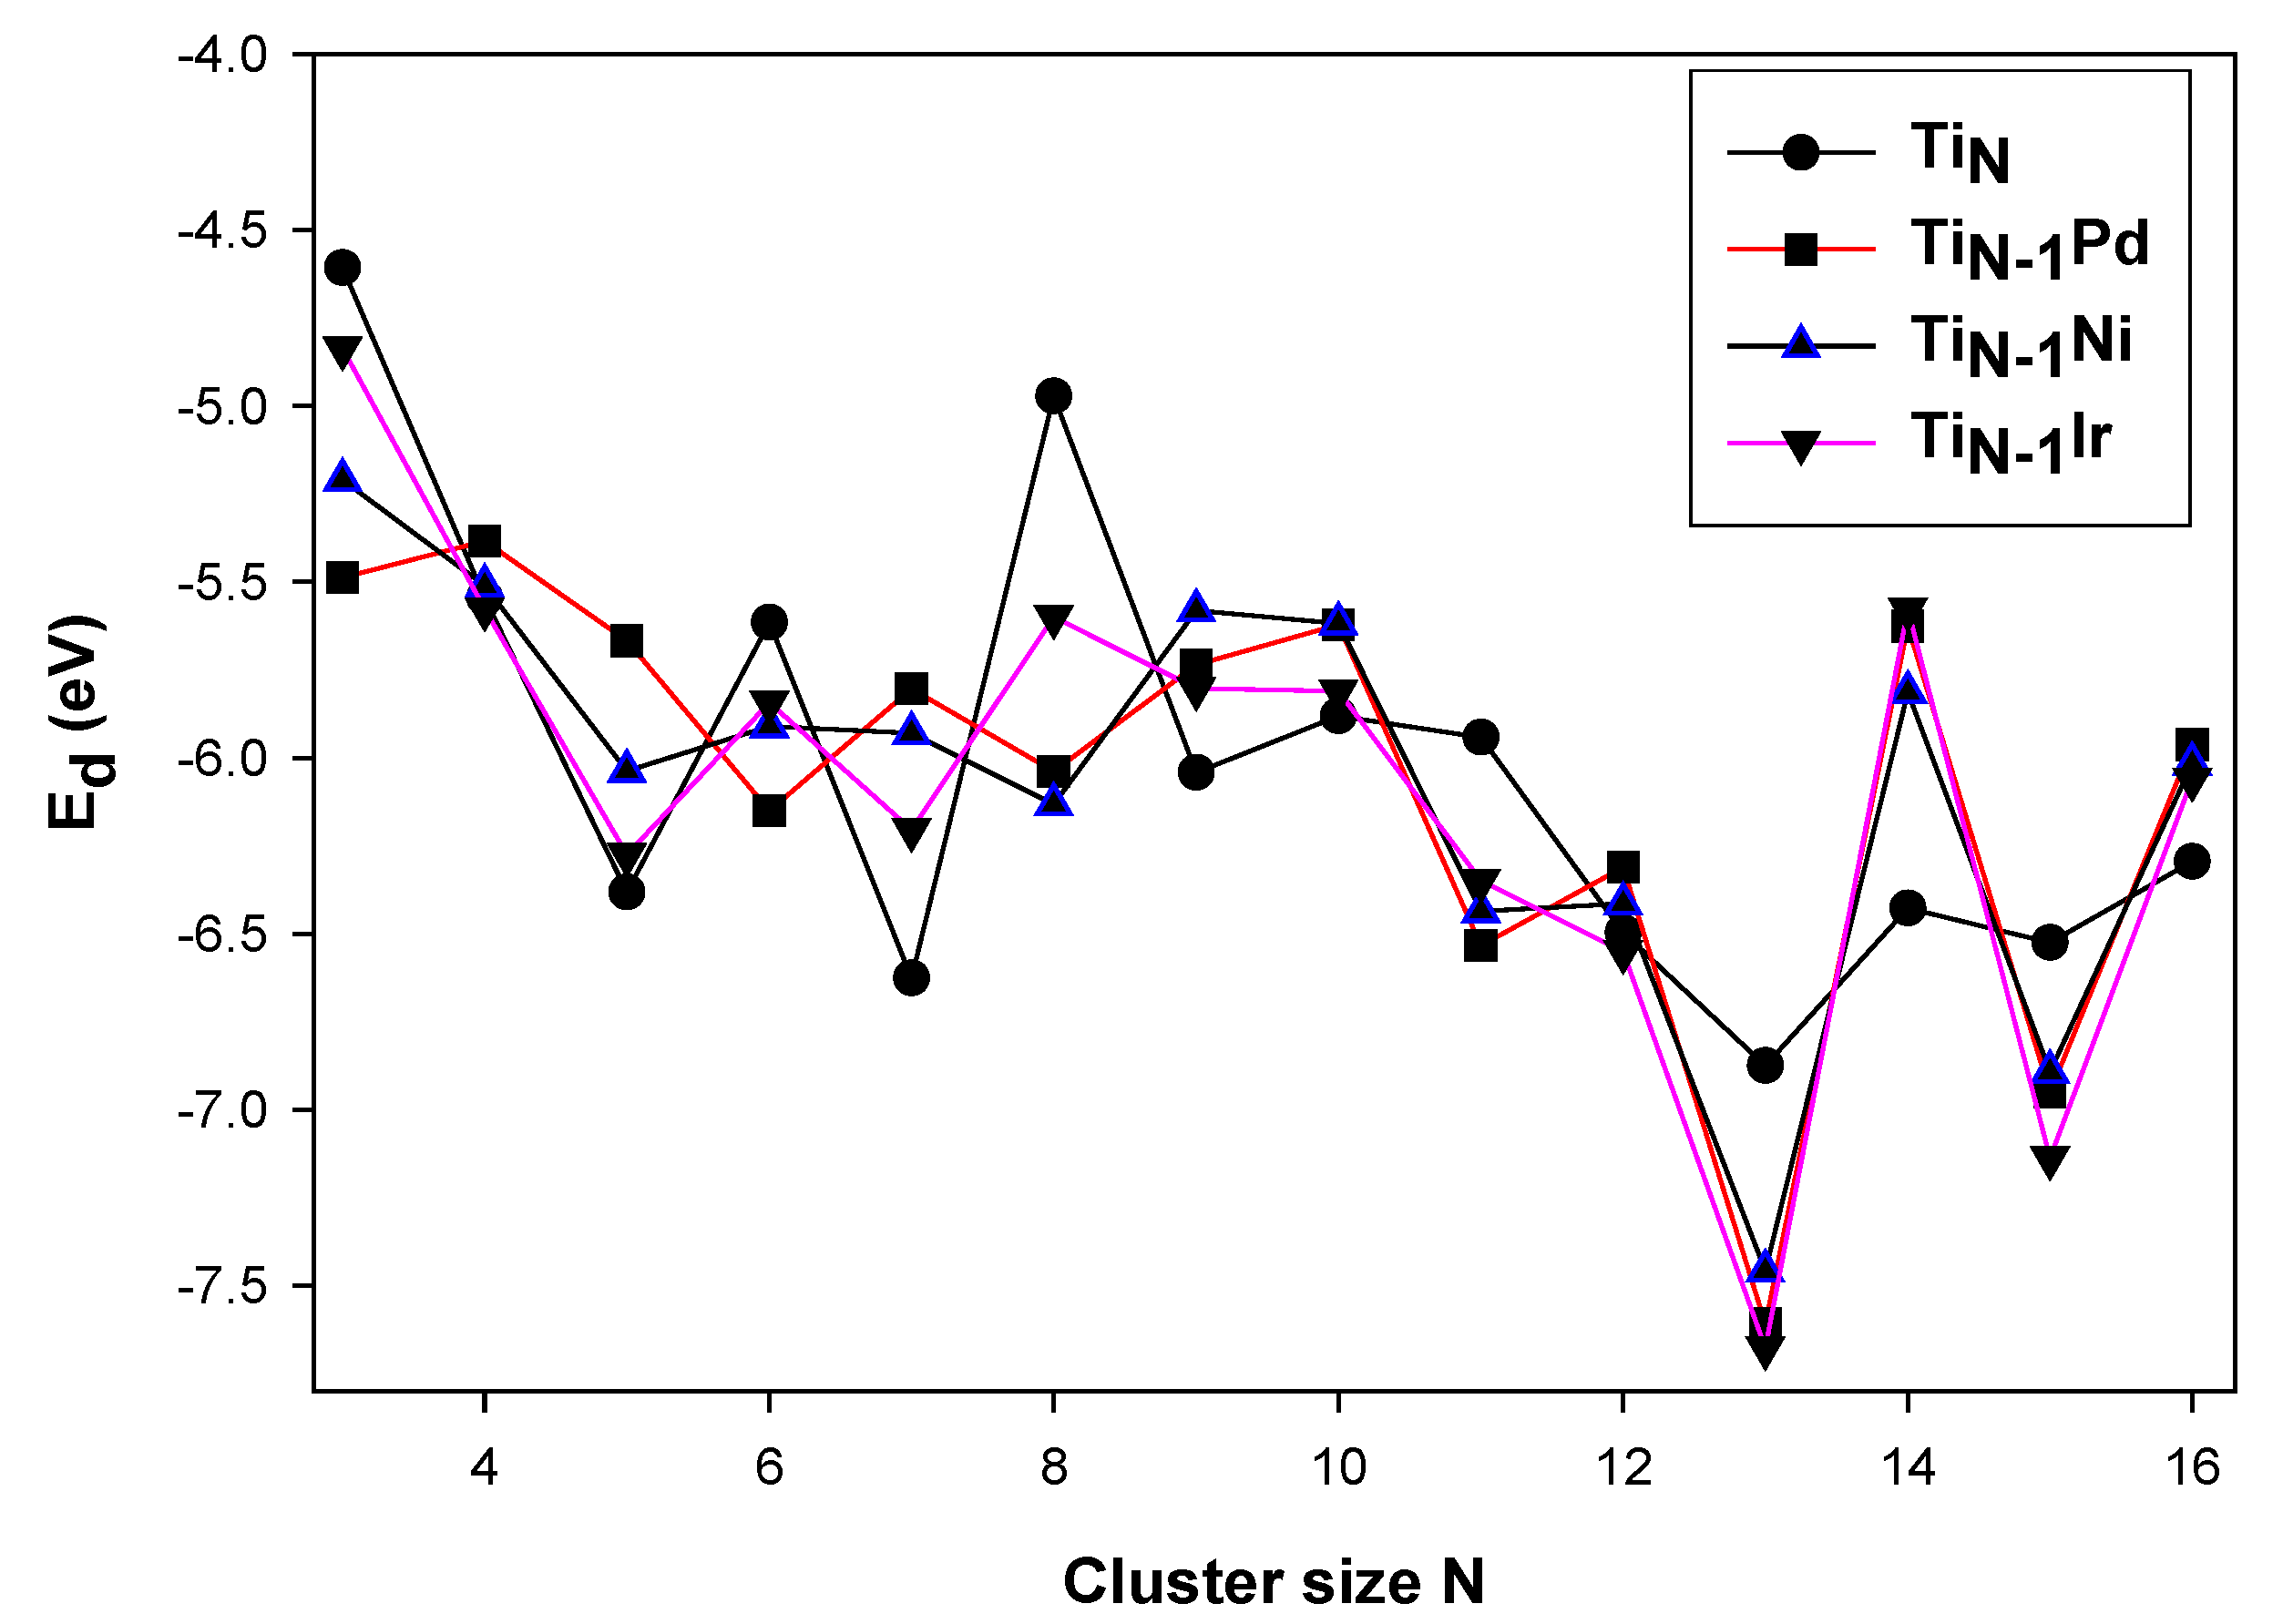
In Figure 3, there is also an even–odd alternation behavior in N = 2−16. The dissociation energy at N = 4 shows the highest stability for the Pd dopant; however, the Ir and Ni dopants display relatively similar energies that are stable in comparison with the bare Ti cluster. The N = 8 isomer is observed to be stabilized, with Pd and Ni displaying relatively similar energies.
At N = 9, the Pd and Ir impurities also have relatively similar dissociation energies that are observed to destabilize the isomer. All the clusters display relatively similar energies for N = 12. For N = 13 and 14, Ir and Pd displays similar dissociation energies that are observed to have a higher stability for N = 13 as compared to other clusters and destabilizing effects for N = 14 isomer.
The dissociation energies confirm that Ti12M stabilities are the strongest. In particular, the Ti12Ir has the greater stability in comparison with the other dopants. At N = 15, Ni and Pd are observed to have similar dissociative effect, with the Ir dopant displaying the lowest dissociation energy, illustrating greater stability. For N = 16, Pd, Ir and Ni are observed to have relatively similar dissociation energies displaying higher dissociation in comparison with its neighboring cluster. These results revealed a correlation between the binding energy, relative energies and dissociation energies for the TiNM (N = 2−16, M = Pd, Ir, Ni) clusters.
3.2. Electronic Properties
3.2.1. HOMO-LUMO Analysis for the Lowest-Energy Configurations
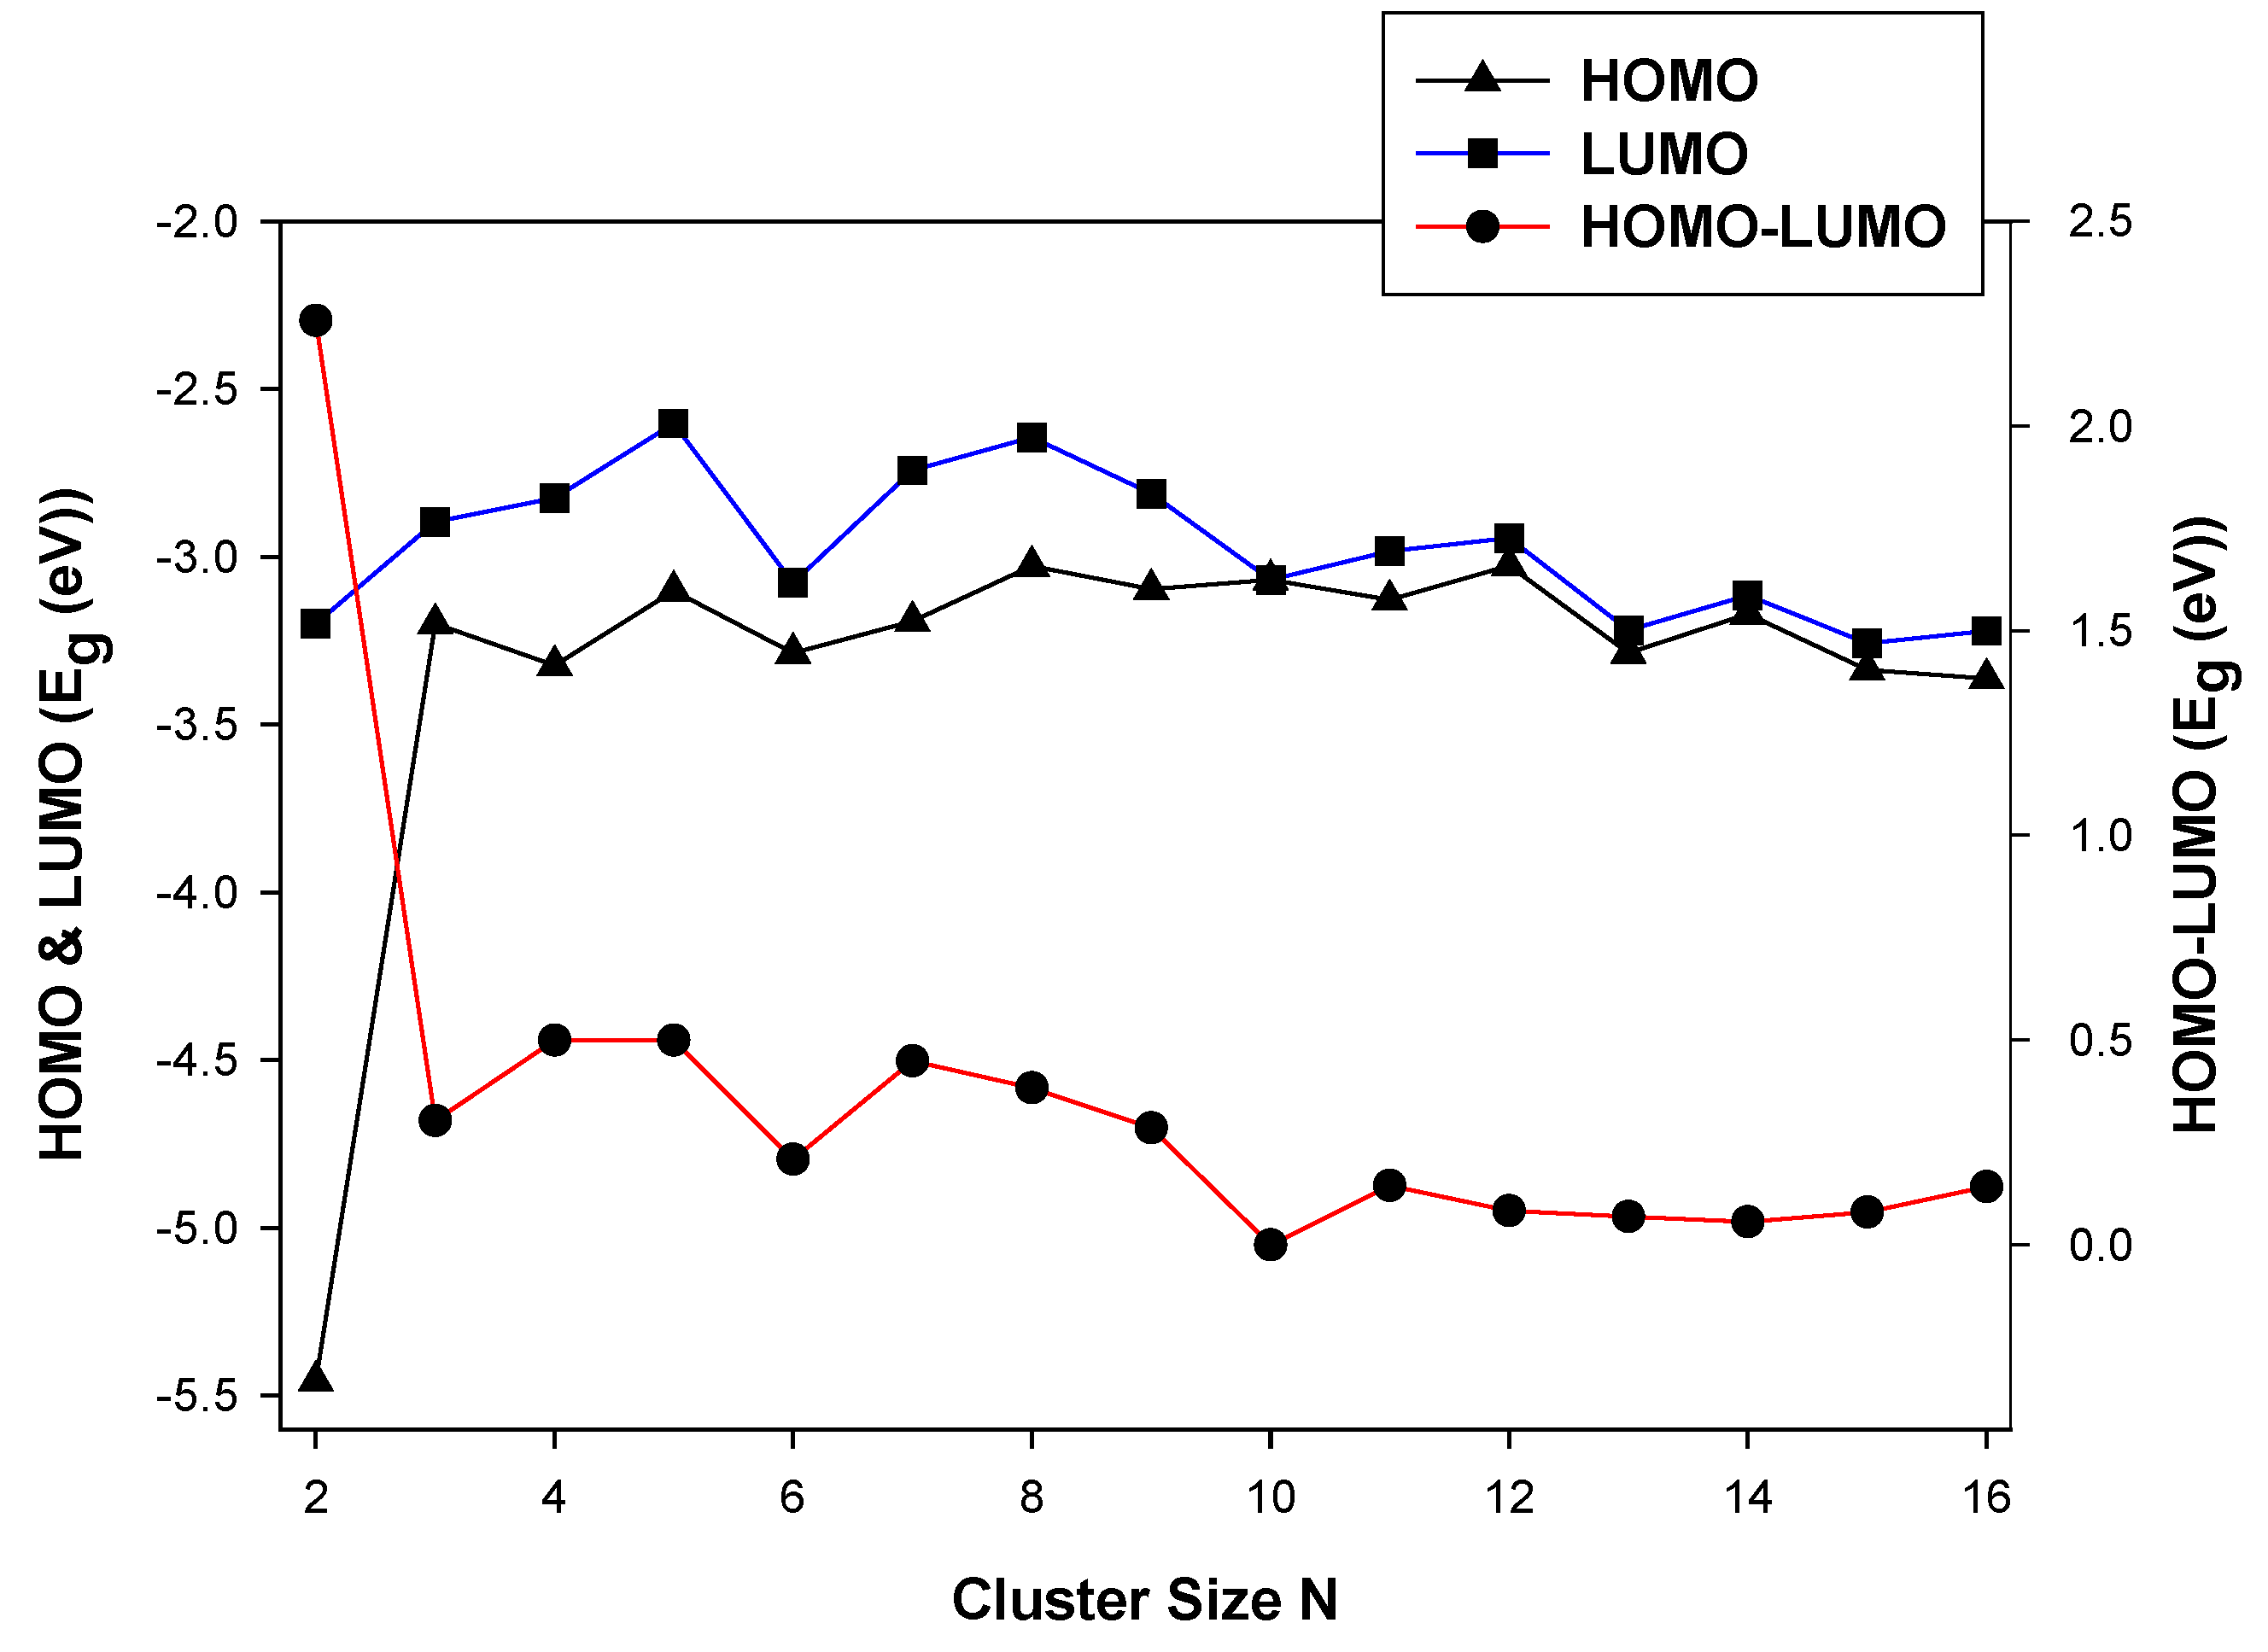
In Figure 4, we show the HOMO and LUMO energy and the average HOMO-LUMO energy as a function of the cluster size, N.
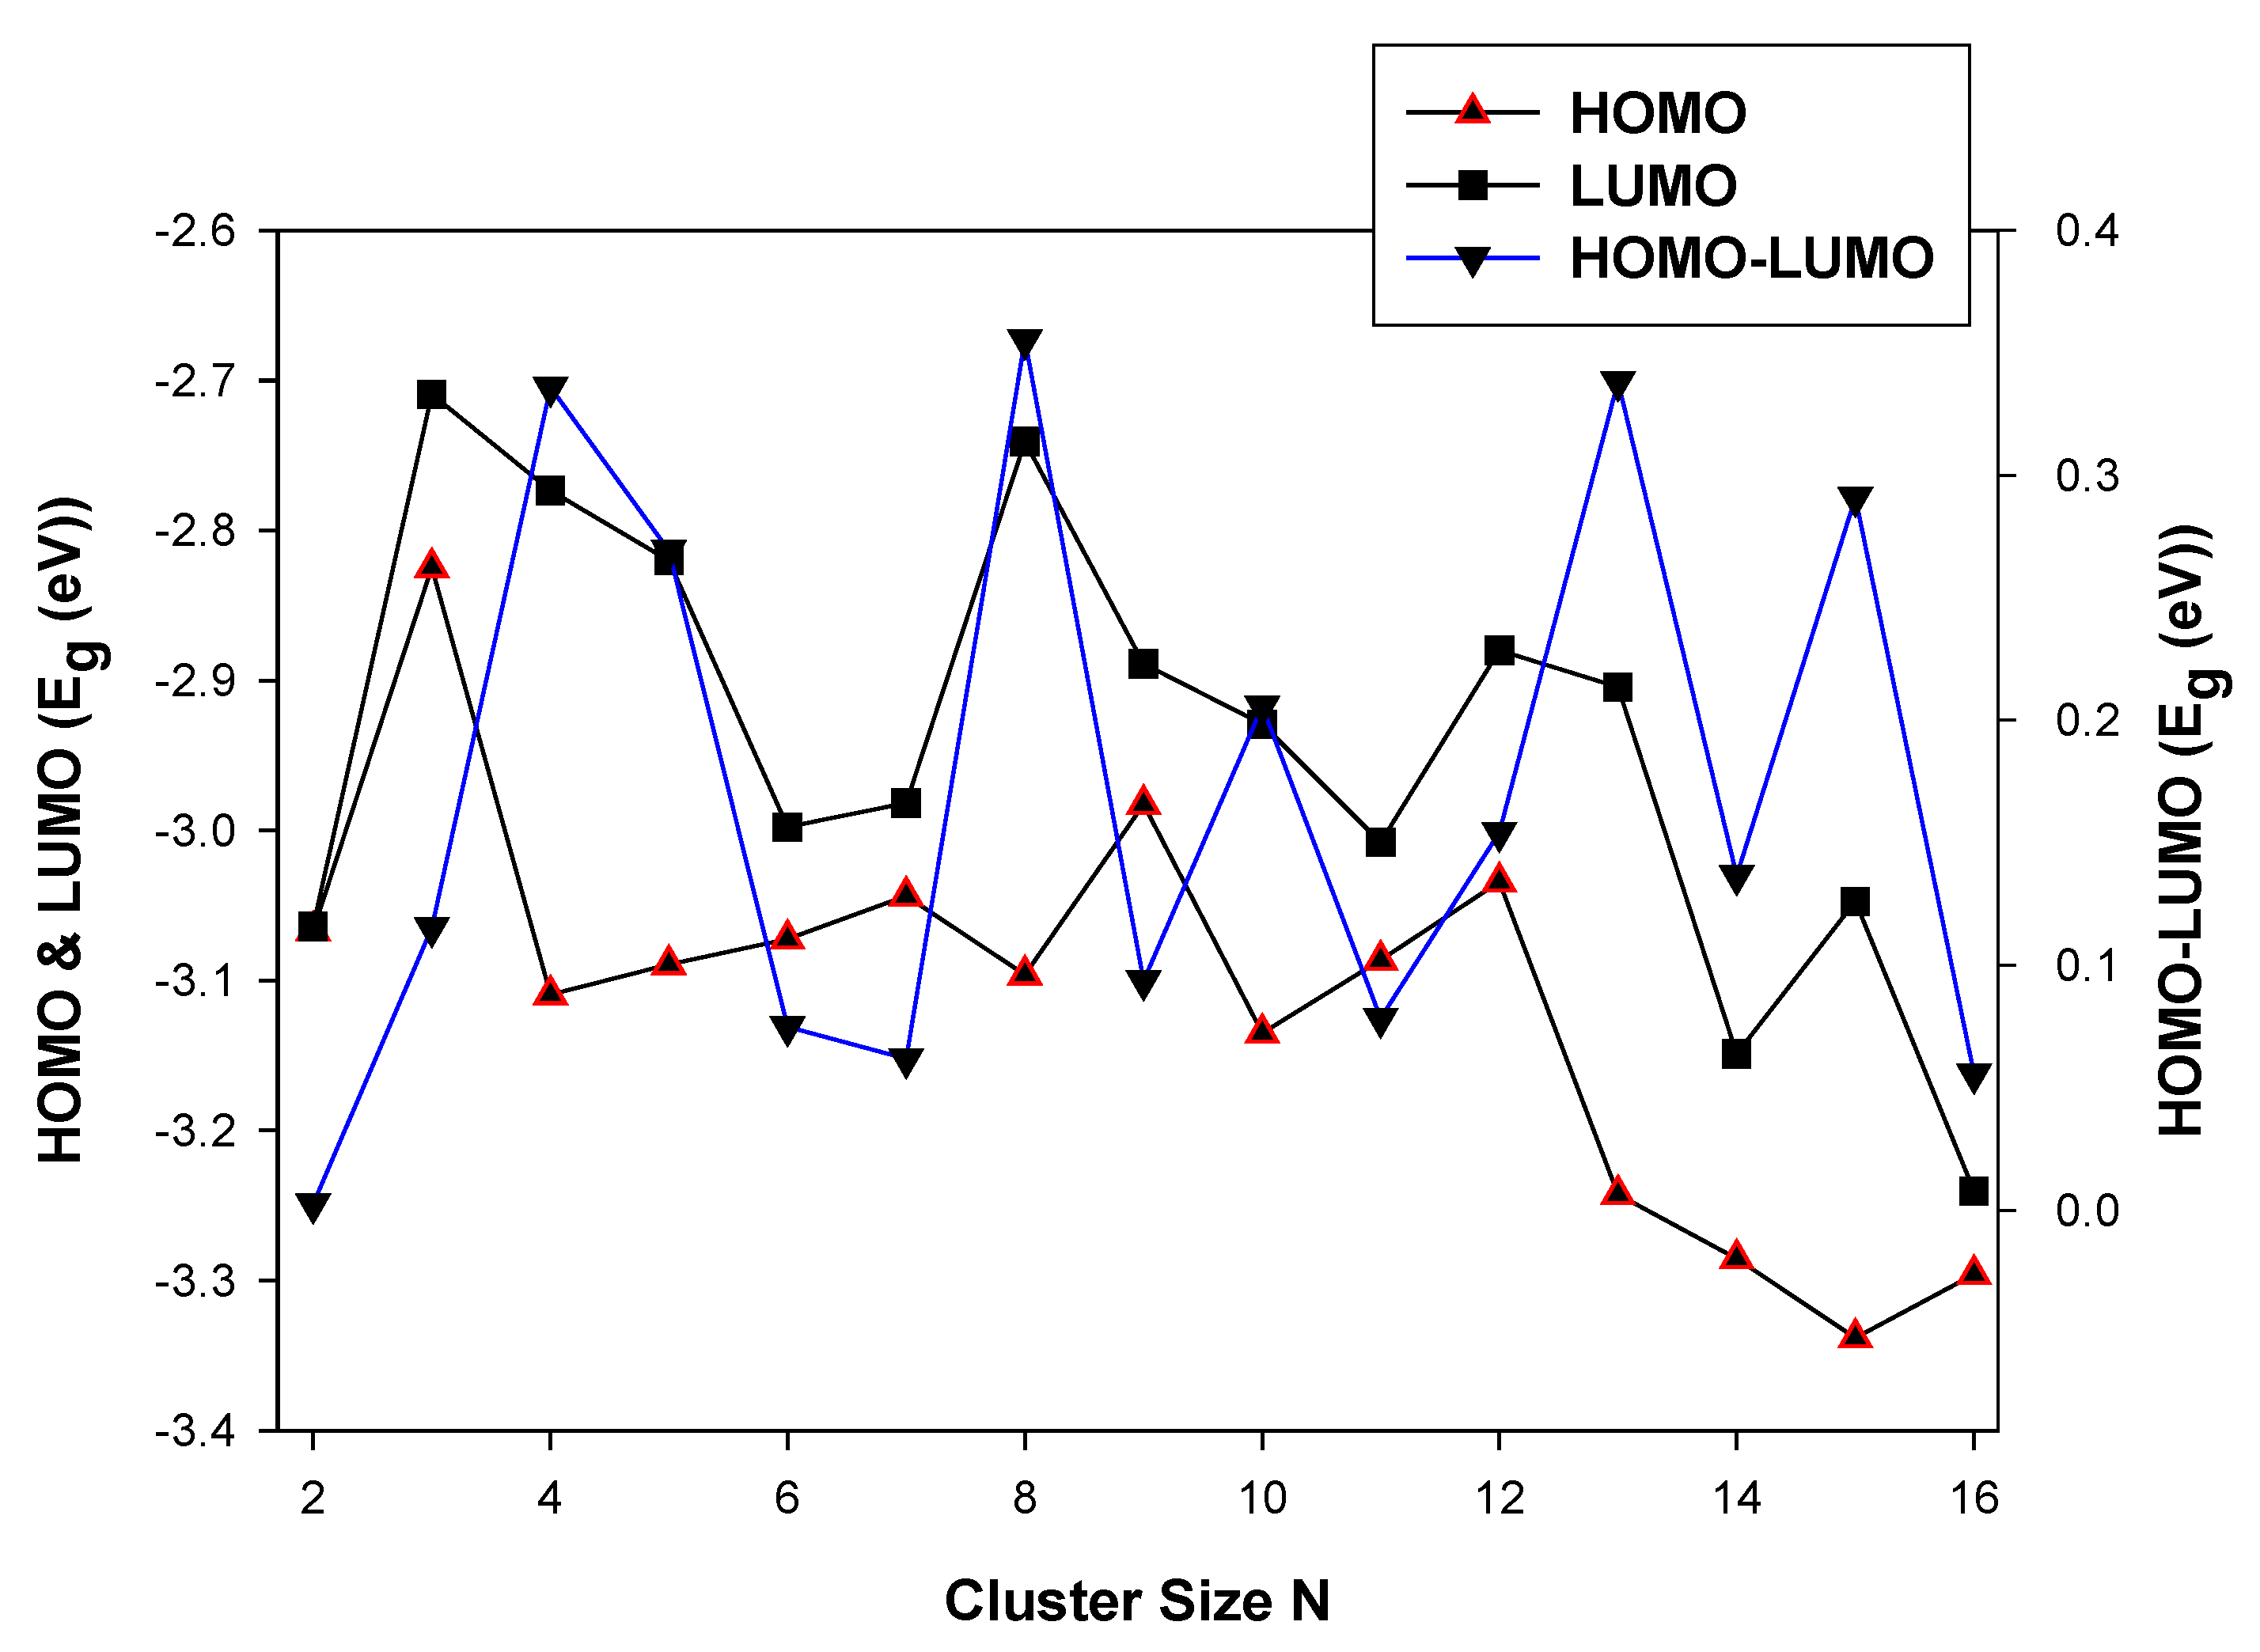
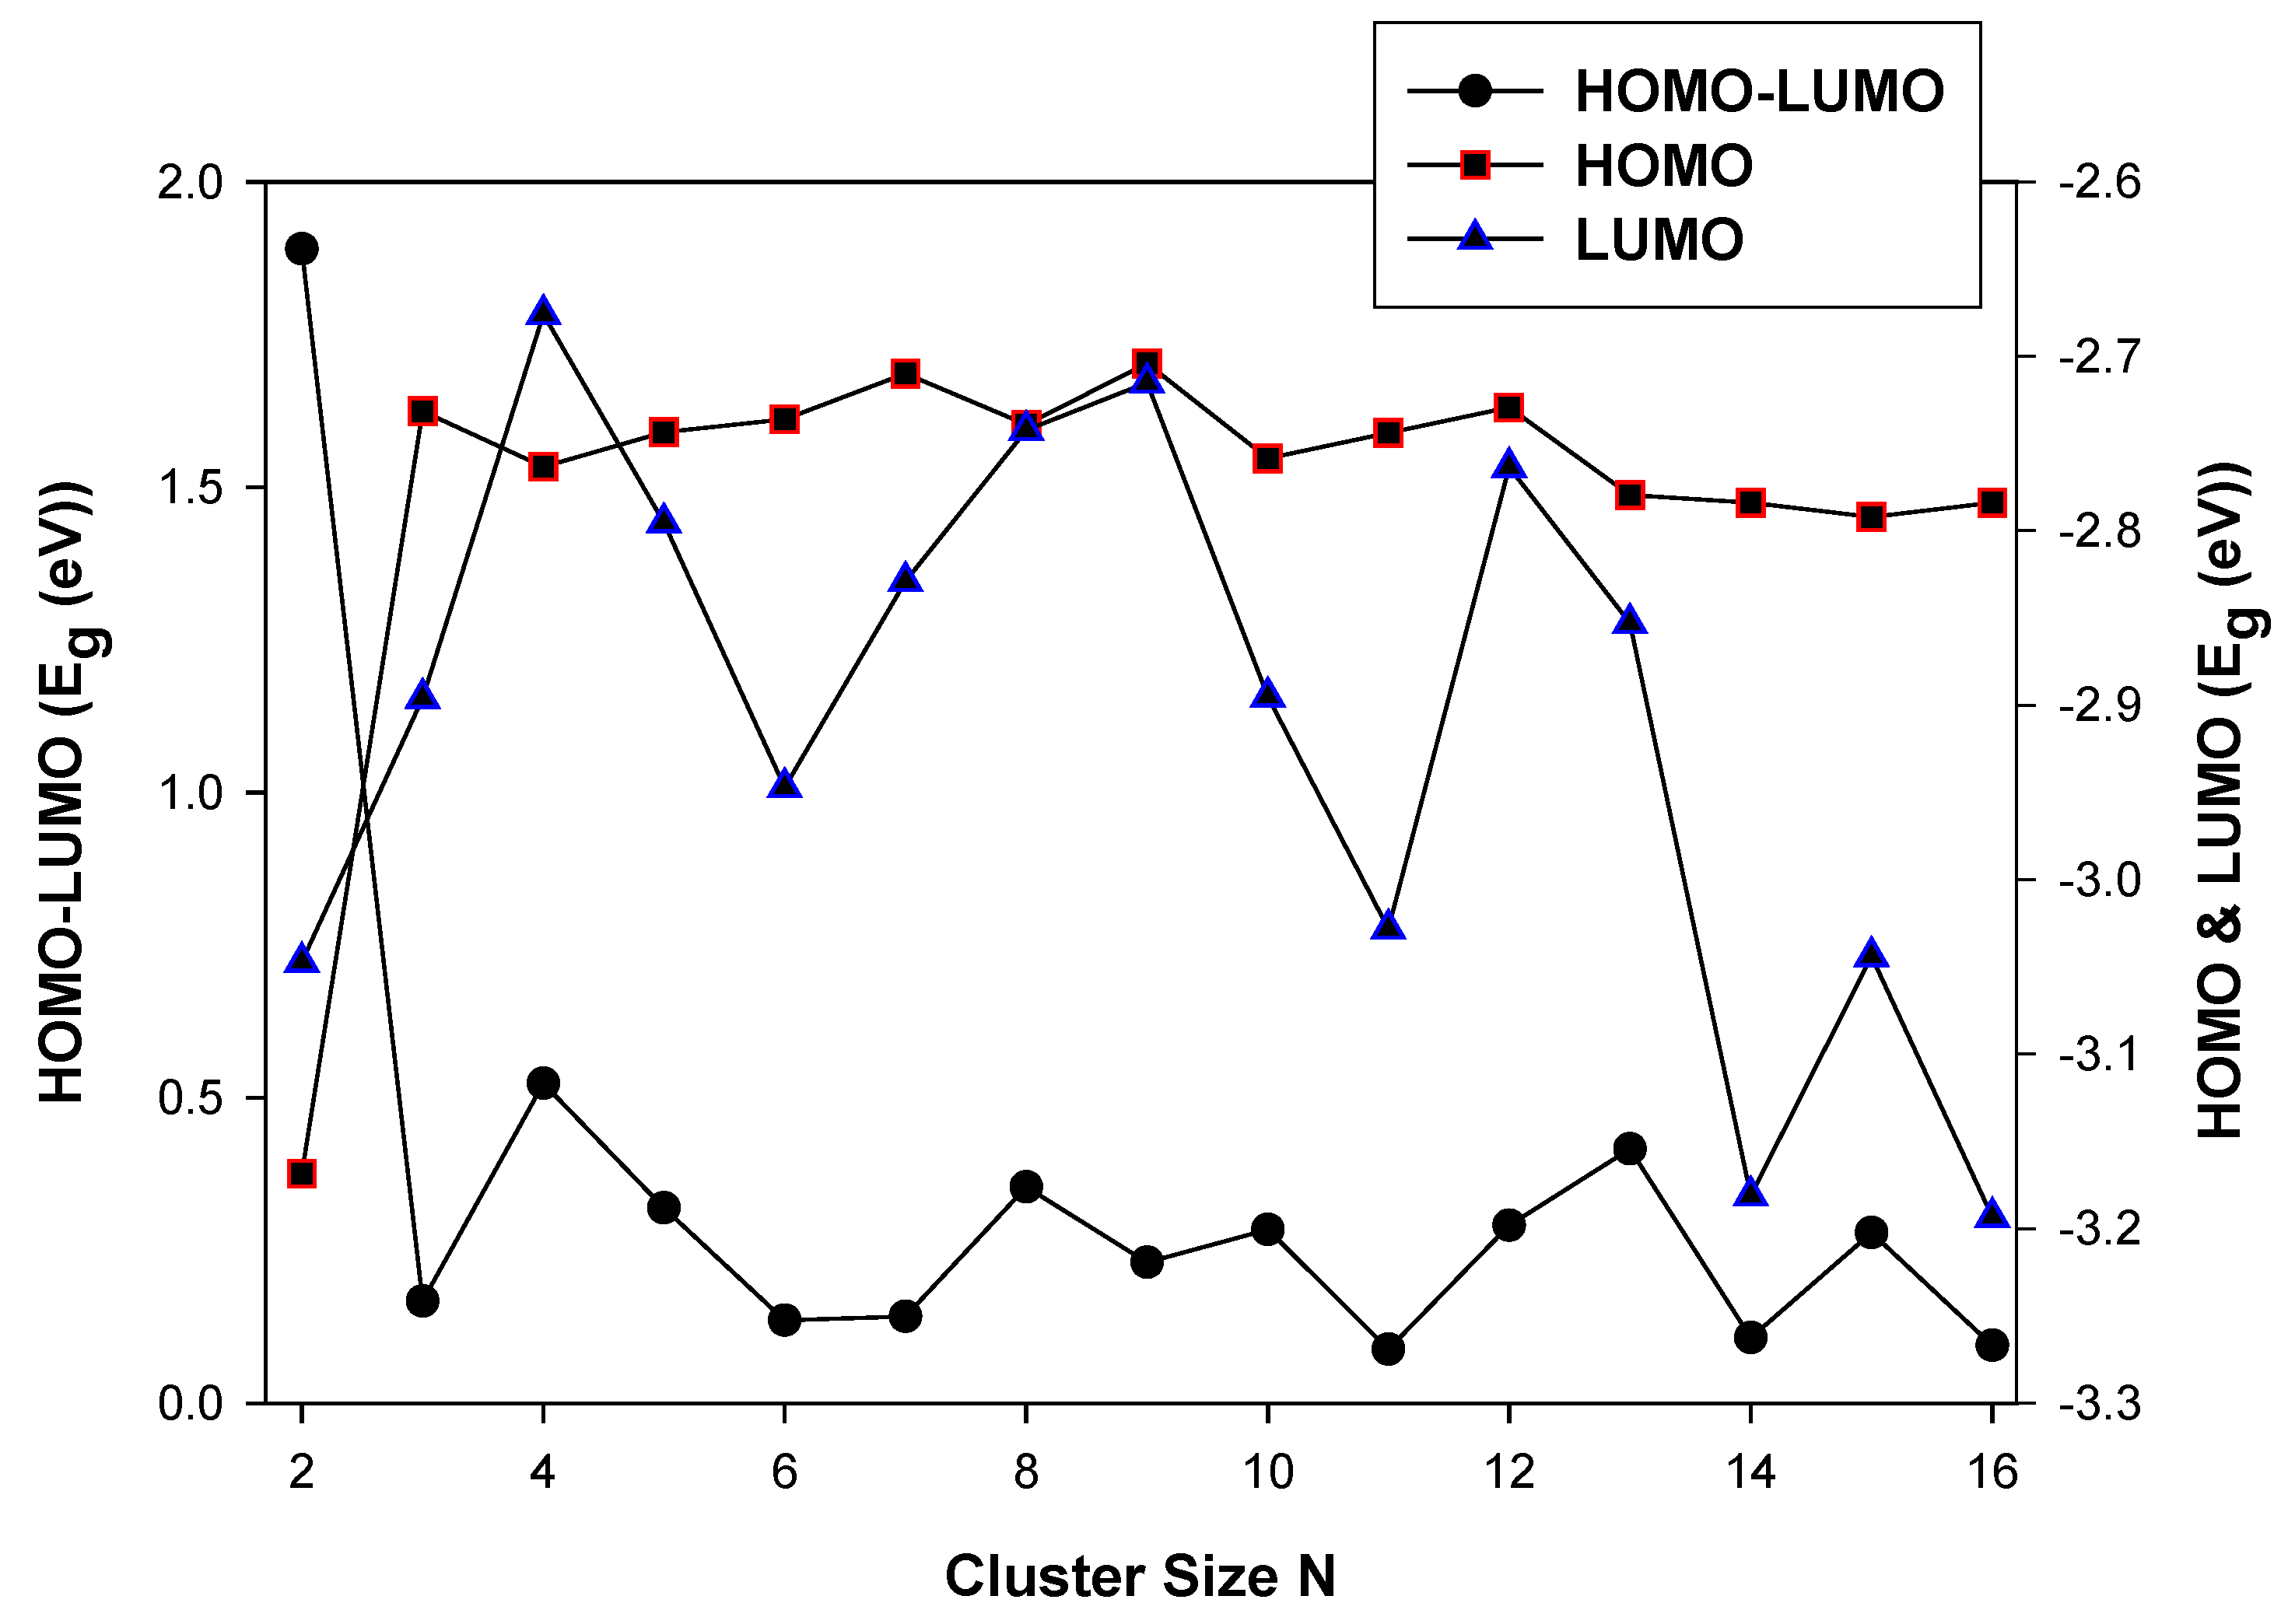
The energy gap decreases, resulting in the stabilization of the LUMO energy as the cluster size N increases. The HOMO and LUMO energy gaps show a higher energy difference at TiIr (N = 2). This is attributed to the electron pairs becoming spatially confined when the diameter of the particle approaches the De Broglie wavelength in the conduction band. At N < 10, the LUMO energy stabilizes and reduces the energy gap. However, at N > 10 the confinement of the electron pairs appears to be reduced. Among the different clusters of a particular size, the HOMO-LUMO shows a steep at Ti2Ir (N = 3), Ti5Ir (N = 6) and Ti9Ir (N = 10). However, The Ti9Ir (N = 10) energy is 0.000 eV. This observation illustrates higher chemical reactivity for these systems. In the case of TiN−1Ni, shown in Figure 5, the highest occupied (HOMO) and the lowest unoccupied (LUMO) molecular orbitals, and the calculated average HOMO-LUMO gap for TiN−1Ni are discussed. The HOMO and LUMO energy gaps decrease as the cluster size is increased.
The LUMO energy displays the highest peaks at Ti2Ni (N = 3) and Ti7Ni (N = 8), however, stabilise as the cluster size increases. The largest cluster with the lowest HOMO energy gap is Ti14Ni (−3.30 eV), whereas the largest cluster with the lowest LUMO energy gap is Ti15Ni (−3.24 eV). These observations show that the valence electrons in the HOMO can absorb lower energy which is indicative of a lower reactivity and higher stability [62]. For the TiN−1Pd cluster, shown in Figure 6, the LUMO energy exhibits a greater variation than the HOMO as the cluster size is increased.
This behavior is linked to eigenstates in the conduction band of the clusters being more sensitive to the addition of an atom. This phenomenon makes the levels discrete and decreases the bandgap and consequently, the band energy also decreases [63]. The observed trend for the clusters of a decrease in the bandgap with increasing cluster size suggests that it is approaching that of the bulk TiPd bimetallic structure. The LUMO displays the highest peak at N = 4.
This is attributed to the quantum confinement effect on the more diffuse conduction-band-like state increases, and the LUMO becomes unstable. The quantum confinement is manifested as an increase in the bandgap or average HOMO-LUMO energy gap [64]. The HOMO energy, however, remains relatively constant as the cluster size, N, increases. At N > 12, the LUMO and HOMO energies show that the clusters with relatively icosahedral isomerization exhibit shifts of the valence band maximum and conduction band (reduction in quantum confinement).
3.2.2. The Density of States (DOS) for the Stable and Metastable Doped Ti Nanoclusters
We compare clusters with the same composition to mimic the stability trend with respect to their behavior at the Fermi level (E-EF = 0). This approach has been previously used on metal alloys [65,66]. It was suggested that structures with the highest and lowest states at the Fermi level (EF) are considered the least and most stable, respectively. This may further be confirmed by observing the trend of the Fermi level with respect to the pseudo-gap and that the system the states of which fell in the deep pseudo-gap correspond to the stable system.
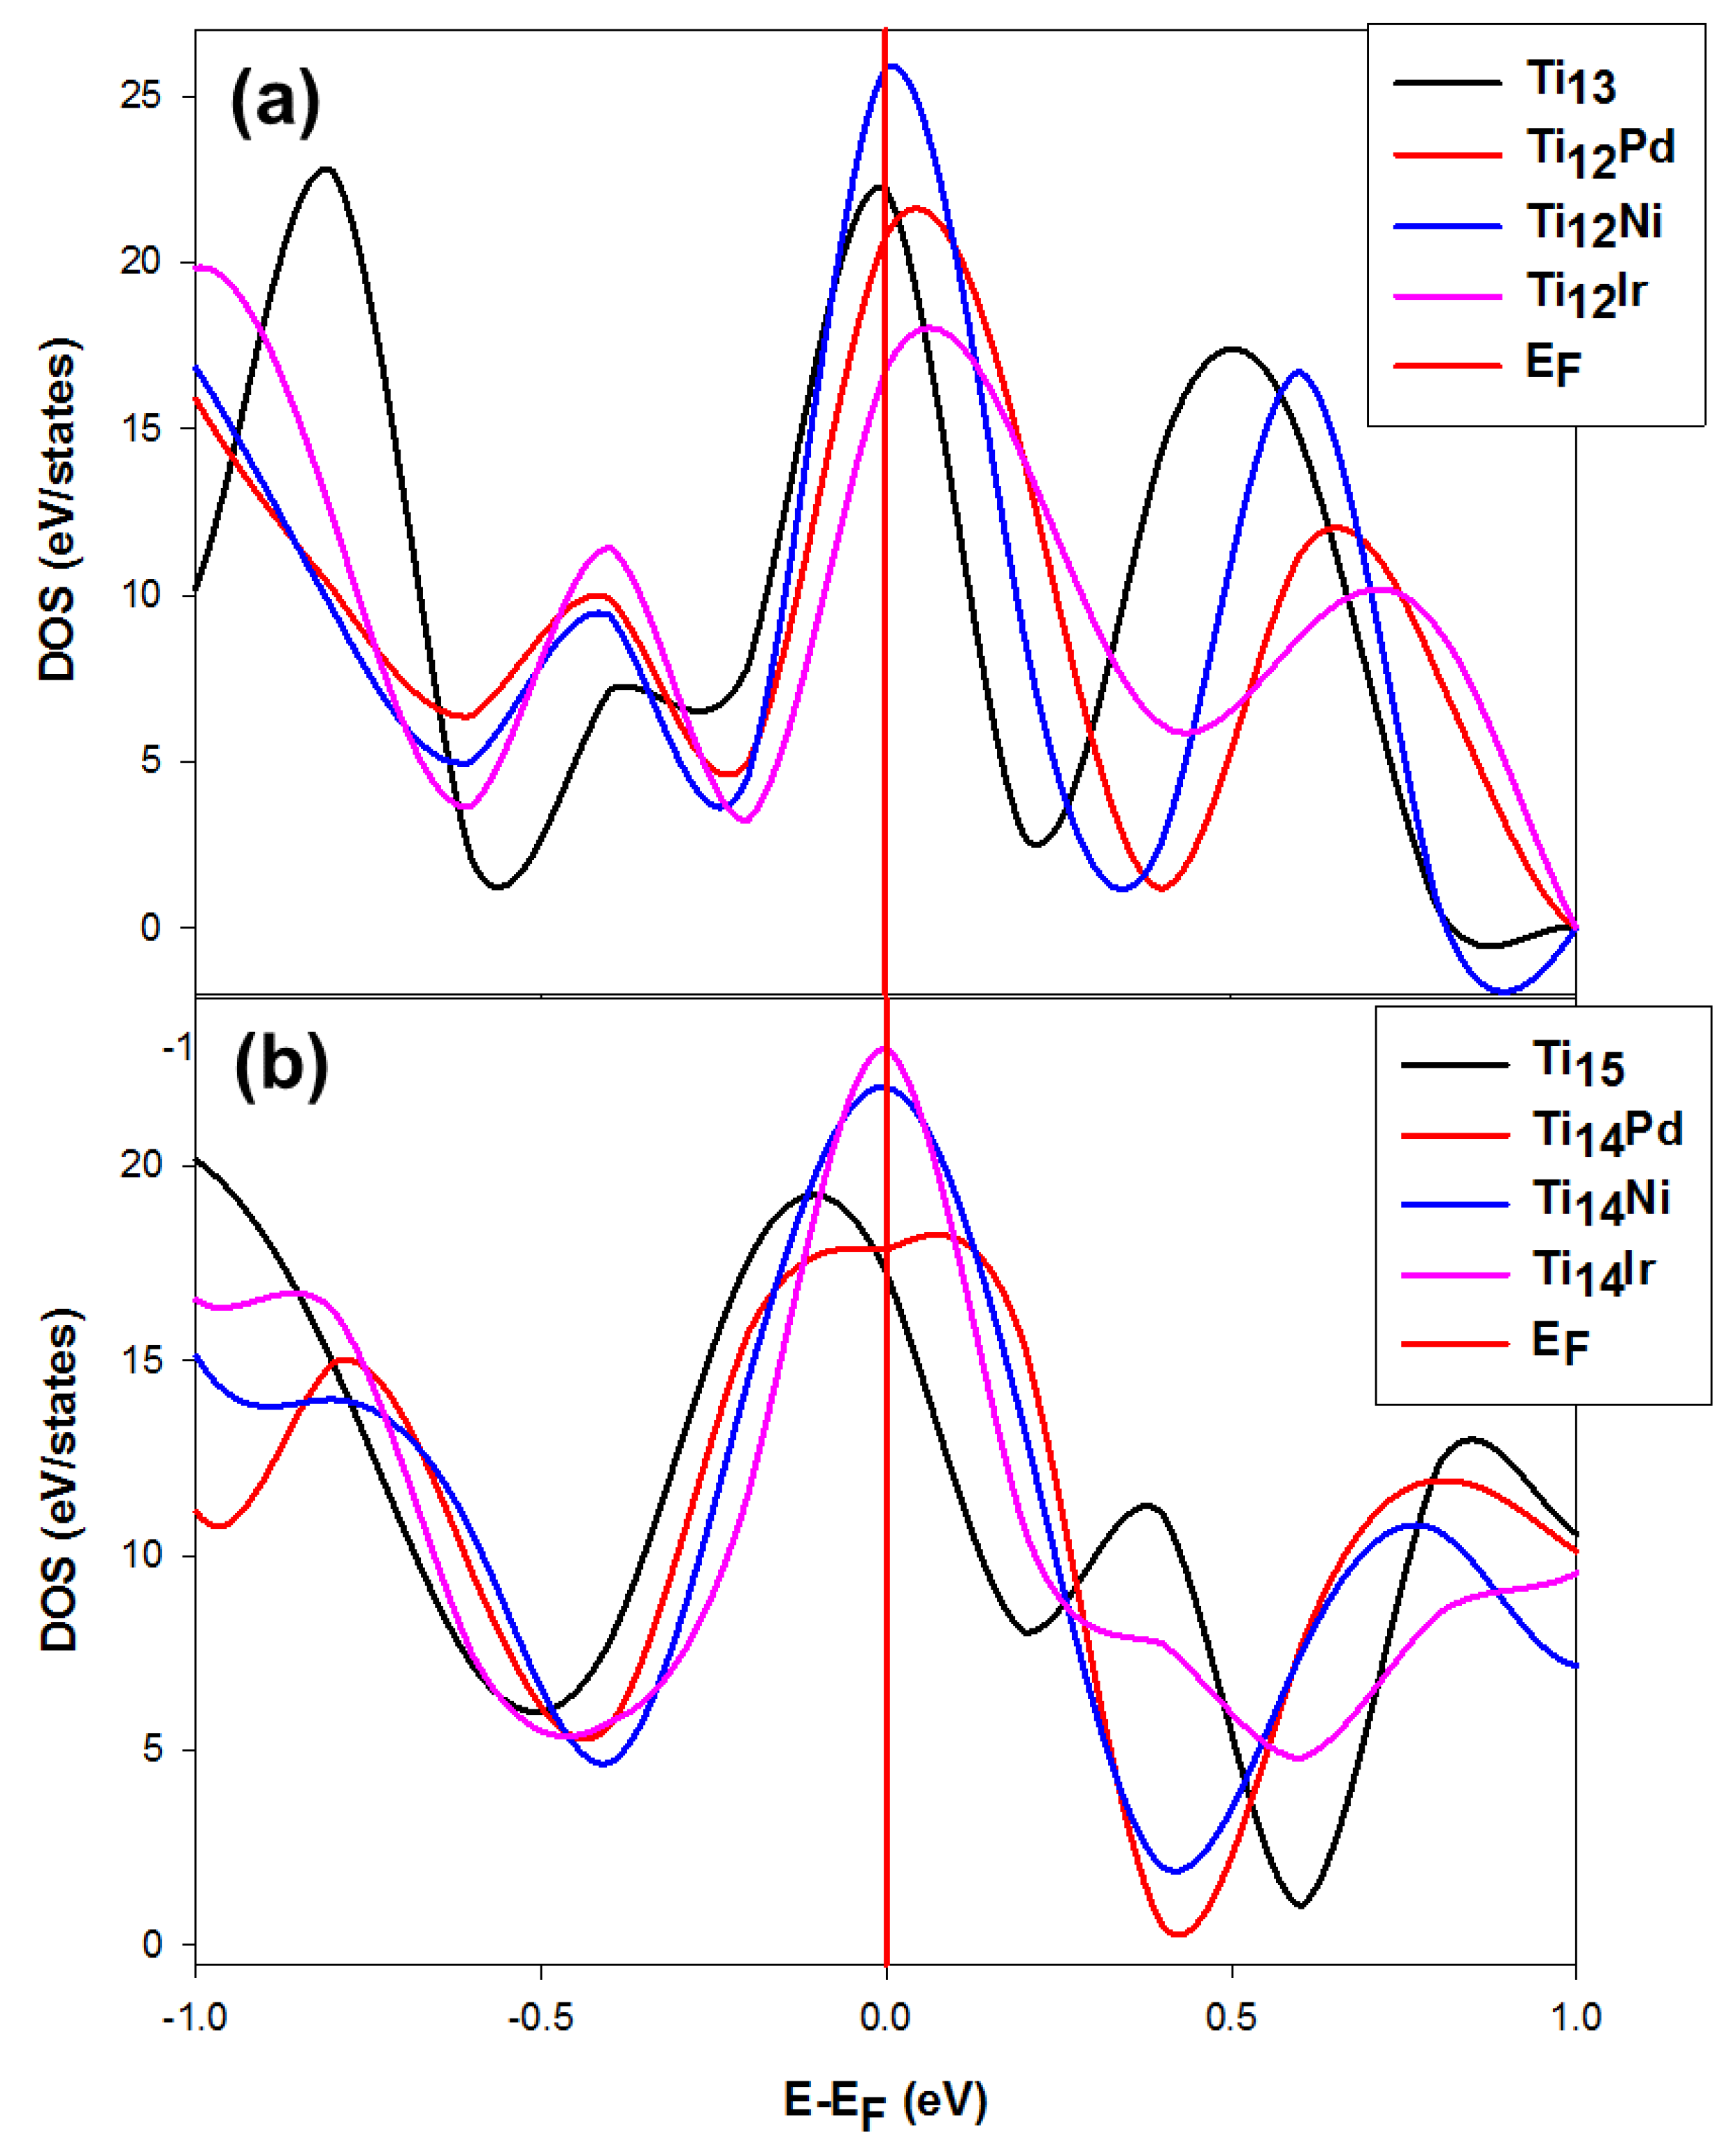
Figure 7 shows the total density of states (DOS) for the magic numbers of the TiN (N = 13 and 15) clusters when doped with Pd, Ni and Ir. In Figure 7a, is clearly seen that the Ni dopant increased the Ti13 states at the Fermi level with the EF hitting the DOS peak at the tip, which is attributed to the instability of the cluster. The Ir and Pd dopants lowered the Ti13 states at the Fermi level, with the pseudogap shifting slightly to the right of the Fermi level. Interestingly, the EF hit both the Pd- and Ir-doped Ti13 DOS peaks on the left shoulder, which is attributed to the stable behavior. The structural stability trend using the density of states is thus Ti12Ir > Ti12Pd > Ti13 > Ti12Ni, whereas the D2E found Ir > Pd > Ni > Ti.
The density of states also shows correlation between the DOS and stability (D2E and Ed). Meanwhile, the Ti14Ni and Ti14Ir clusters in Figure 7b show that the EF hit the DOS peak at the tip, which suggests the instability of the cluster. The Ti15 clusters, however, have their pseudo-gap shifting slightly to the left of the EF. The EF hit the DOS peak of the dopants particularly on the right shoulder, which is ascribed to stability.
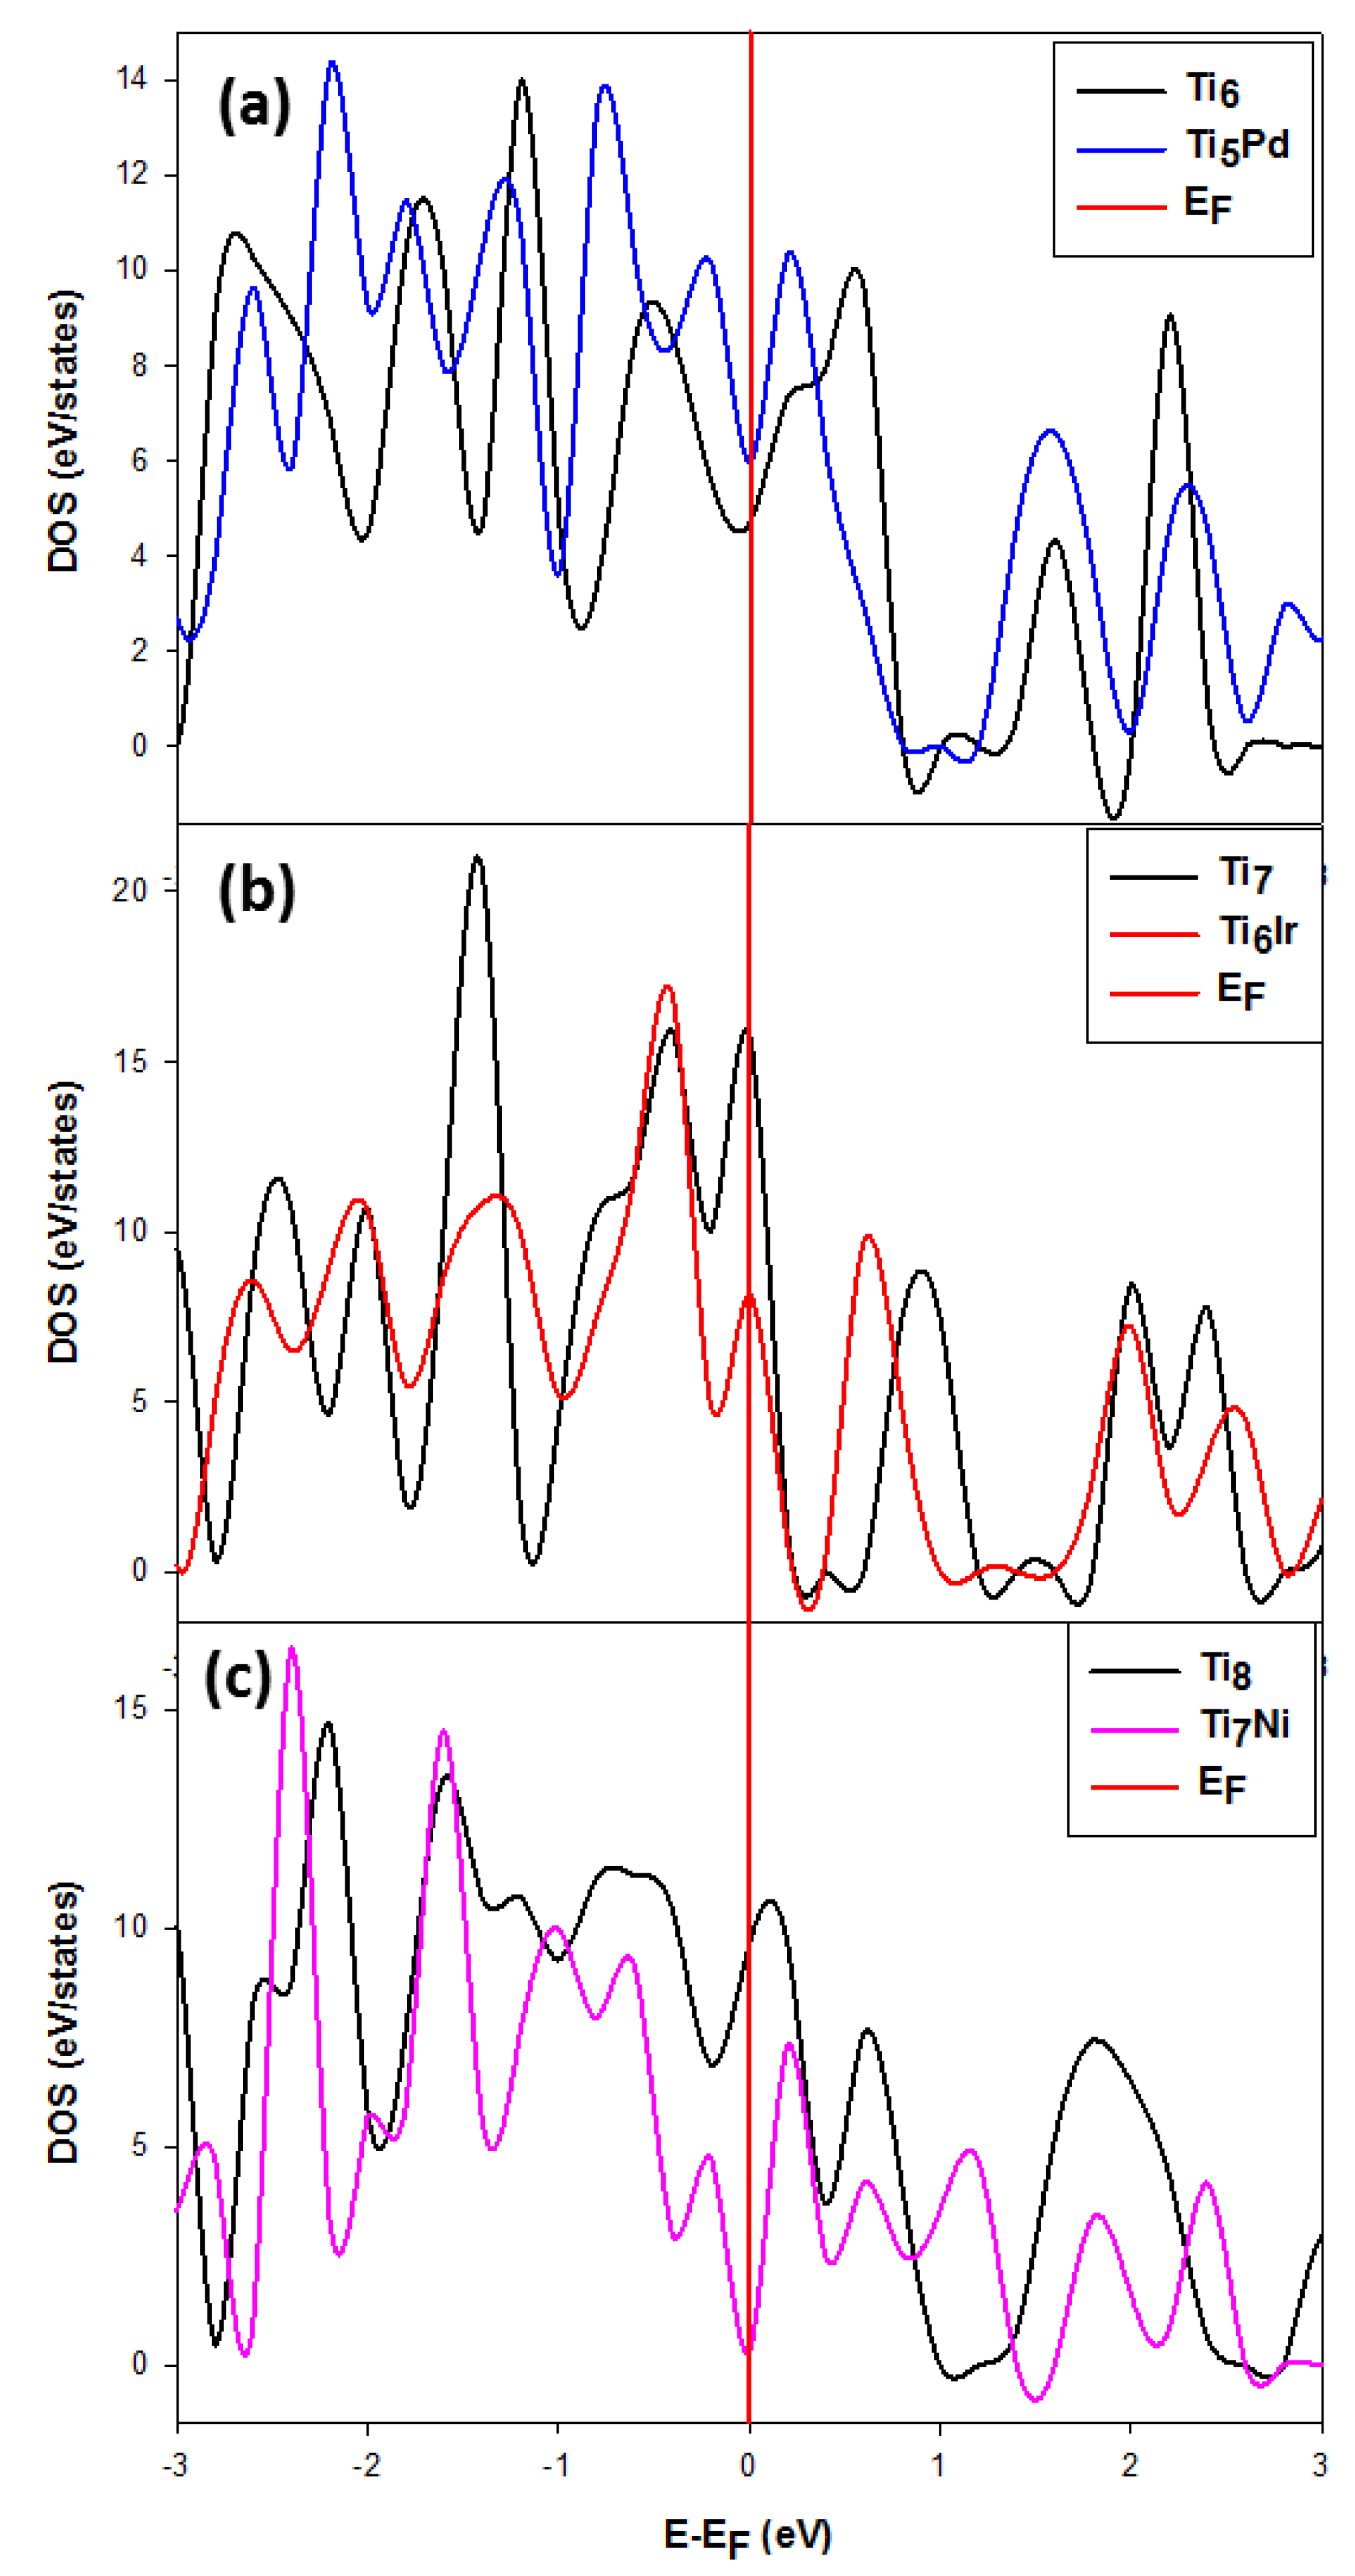
We also note that the Ti14Pd DOS are broader at the EF and its pseudo-gap shifted to the right of the EF compared to the sharp peak observed for the Ti14Ir cluster, which makes it the least stable. Figure 8 shows the comparison of the density of states for Ti6 when doped with Pd, Ti7 with Ir and Ti8 with Ni. The DOS for the M-doped TiNM (M = Pd, Ir, Ni; N = 6, 7, 8) are discussed since the Ni, Ir and Pd impurities were observed to stabilize these cluster sizes. In the case of the Ti6 doped cluster, shown in Figure 8a, the pseudo-gap slightly shifted to the right and its state fell in the slightly deep pseudo-gap. The pure Ti6 is observed to have higher states compared to the doped Ti5Pd. Thus, the Pd impurity electronically stabilizes the Ti6 cluster.
The Ti7 and Ti6Ir states shown in Figure 8b display the Fermi level hitting the DOS peak at the tip. However, for Ti6Ir, the states are lowered, which indicates that Ir may stabilize the Ti7 cluster, as confirmed by the lowered DOS at EF. The pure Ti8 states are higher at EF as compared to the Ti7Ni states. It is clearly seen that Ni lowered the states and became more stable since the EF fell deep in the pseudo-gap, compared to Ti8, the DOS peak of which shifts slightly to the right of the EF. The small emergence of a small peak is observed on the left of the EF, which may be attributed to the Ni d-states.
3.2.3. Charge Distribution Analysis
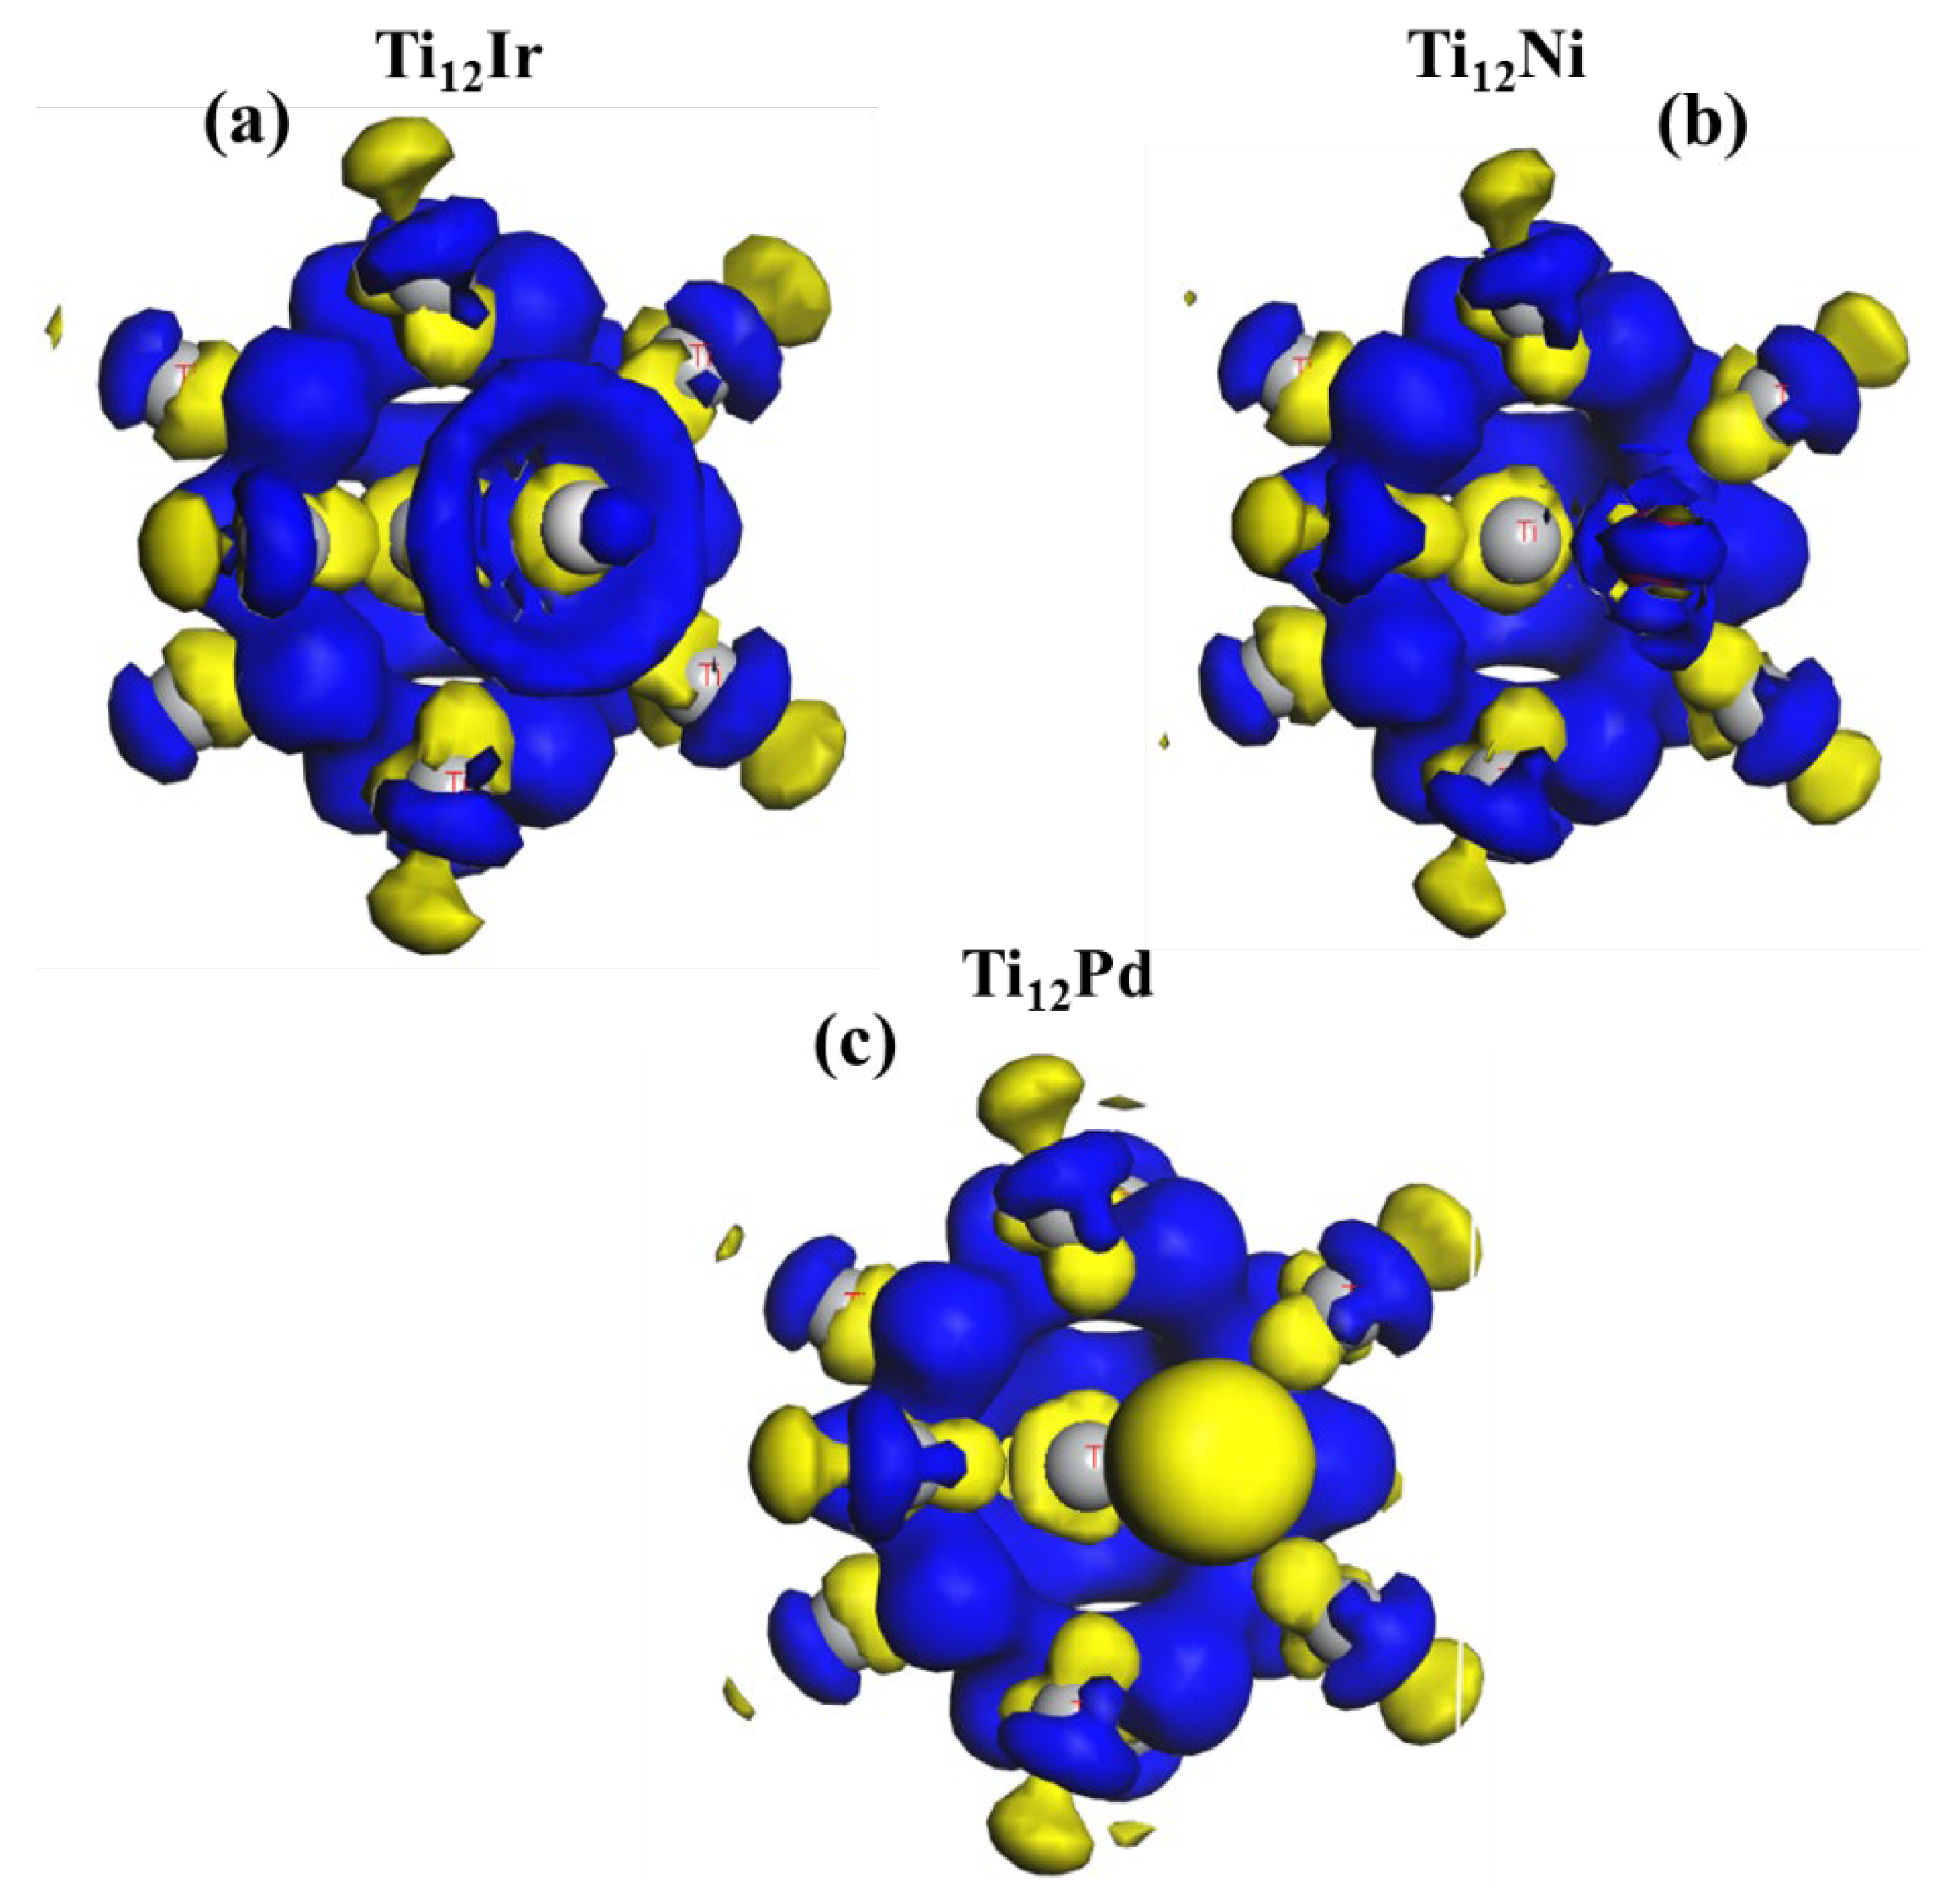
This approach was previously used on metal surfaces [67] and metal nanostructured titanium dioxide [68]. Bader et al. [69] reported that the change in the density difference of the ionic bonding displays a charge density map that is localized on a single atom. Figure 9 shows the charge density difference of the Ti13 cluster doped with (Pd, Ni and Ir) on the face of the Ti13 cluster. The magnitude of the charge is displayed by different colors, where the blue color indicates the electron-rich region and the yellow color indicates the electron-depleted or electron-poor region. The stability of the metal finite-sized clusters can be derived by calculating the electron density distribution [70].
The electron accumulation is observed to be higher on the Ir atom which may be associated with the highest states. This phenomenon is attributed to the depletion of electrons from the Ti atom into the Ir atom.
The iso-surface diagram of the Ti12Ir charge density difference reveals an electron-rich cloud surrounding the Ir atom. It also reveals the overlapping of the d and p orbitals. The Ti atoms surrounding the Ir atom are observed to have a higher electron density, in which the p and d orbitals overlap. Furthermore, the Pd impurity shows a more negative region surrounding its atom, which is also associated with greater electron depletion. There is no electron-rich cloud observed for the Pd impurity. This observation suggests that electrons are redistributed from the Pd atom into the Ti atom. The electron densities are more deformed in the Pd-doped than the Ir- and Ni-doped titanium clusters.
The nickel atom displays a particularly more positive region surrounding the atom which corresponds to the electron-rich areas. All the central atoms of Ti are electron-depleted. We observed that the degree of electronic depletion around the impurities is as follows; Pd > Ir > Ni. Moreover, the Ir impurity is noted to have the highest states, followed by Ni, and lastly, Pd. This trend is observed to be in good correlation with the binding energy, where Ir was observed to have the lowest binding energy. Their binding energy values are as follows: −5.85 eV, −5.45 eV and −5.42 eV, respectively. This illustrates that the highest states for the Ir impurity had the utmost effect in tuning the stability of the 13-atom cluster.
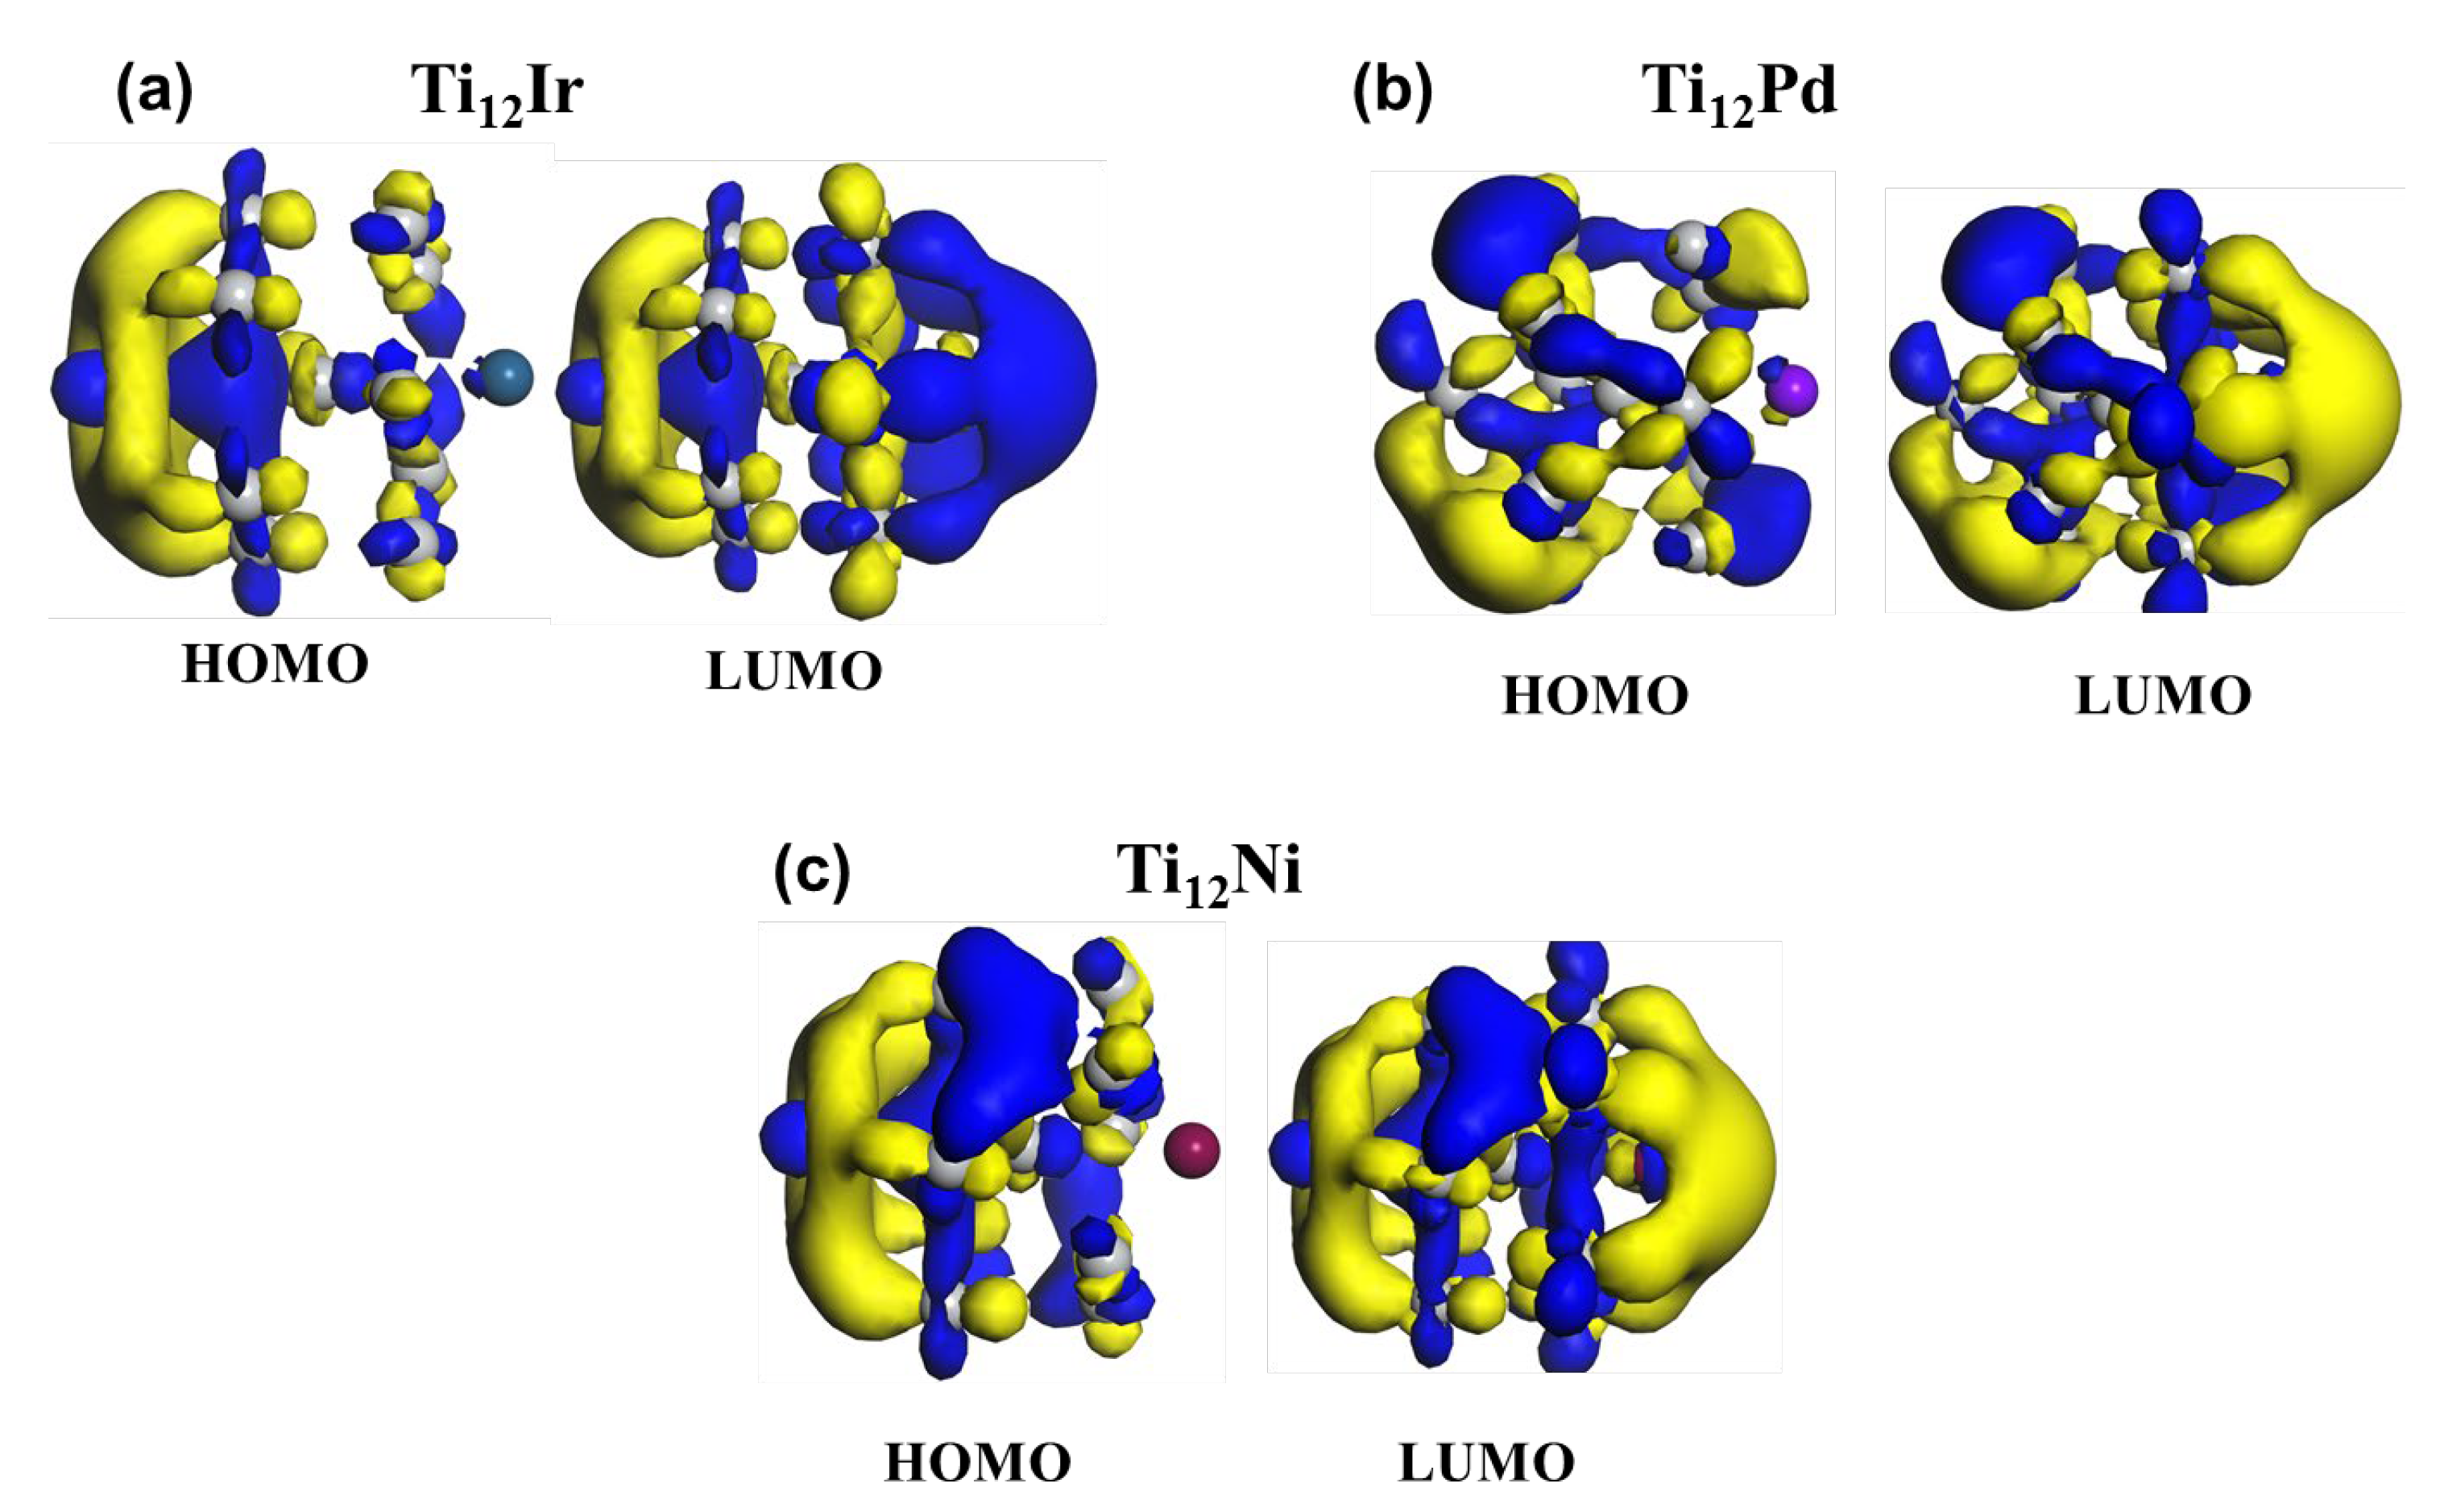
Figure 10 shows the computed iso-surfaces of the HOMO-LUMO for Ti12M (M = Pd, Ir, Ni). This approach has previously been used on doped stable rhodium clusters [70] and doped titanium and vanadium clusters [71]. Dutta et al. [70] found that electronic redistribution occurs from HOMO (Rh) to LUMO (non-metal).
It is observed that the electronic cloud for HOMO is located at the titanium atoms for all the doped clusters. For the Ti12Ir, Ti12Pd and Ti12Ni clusters, higher orbital densities are observed around the titanium atoms, which reveals that the d-orbitals of the titanium atoms are involved in bond formation. There is little contribution of the electron density to the formation of the Pd- and Ir-doped titanium cluster, whereas no contribution of electron density is observed in the formation of the Ni-doped titanium cluster.
Amongst all the cluster HOMO electronic densities, they are mainly observed to be localized around the titanium atoms. In the case of the LUMO orbital, Ti12Ir is observed to have a higher electronic cloud at the iridium atom. This observation suggests electronic redistribution or migration amongst the Ti and Ir atoms. These clusters are observed to have overlapping d-orbitals and p-orbitals of titanium. Electrons are observed to be moved from the p-orbitals into the d-orbitals. This can clearly be seen from the electron-deficient p-orbitals. The electronic iso-surface diagram of Ti12M (M = Pd, Ni) reveals that all the cluster HOMO electronic densities are seen to be situated at the titanium atoms, whereas LUMO displays an electron-deficient cloud around the Ni and Pd atoms. The p-orbital displays the movement of electrons from Pd and Ni into the titanium atoms.
4. Conclusions
The density functional theory technique was successfully used to investigate the stability and electronic properties of TiN−1M (M = Pd, Ir, Ni, N = 2−16). The binding energies for the Ni dopant were observed to be relatively similar with the pure Ti energies, whereas the Pd dopant energies were relatively higher than the pure Ti energies. The Ir impurity was observed to enhance the binding energies of the pure Ti more in comparison with the other impurities. The relative stability and dissociation energy for all the dopants were found to be energetically favored at N = 13.
The magic cluster, N = 7, is observed to be shifted to N = 13 for the doped Ti clusters. For the N = 13 cluster, the Ir impurity was observed to stabilize the Ti clusters more compared to the other impurities. The change in the stability of the cluster can be associated with the (111) facets that are highly active. The icosahedral isomer possesses 30 threefold hollow (111) facets, and the pentagon bi-pyramid (N = 7) has 15 (111) facets which are half of the icosahedral isomer. Hence, these clusters show characteristics of magic clusters.
The total DOS of N = 6, 7, 8, 13 and 15 were calculated for comparison, which showed that Pd electronically stabilizes the N = 7 clusters, whereas it is the least stabilizing impurity for the N = 13 cluster. The iridium dopant was found to stabilize the N = 15 cluster more compared to Ni. The iso-surface of the charge density and H-L revealed higher electronic charge transfer from the inner core of the Ti atoms towards the surface of the cluster, where there is Ti–Ir bonding. These results showed a charge depletion from the Ti atoms and charge accumulation near the Ir impurity. The electron densities were found to be more deformed in the Pd-doped than the Ir- and Ni-doped titanium clusters.
Author Contributions
T.P. and H.C. prepared the manuscript, constructed the models and analytical tools. T.P. performed the simulations. T.P. and H.C. analyzed the results. P.N. and H.C. substantially contributed to the formulation or the design of the project. All authors have read and agreed to the published version of the manuscript.
Funding
The authors wish to recognize the support of the South African Research Chair initiative of the Department of Science and Innovation and the National Research Foundation. The authors would also like to acknowledge the financial support of the Department of Science and Innovation (DSI), through the Titanium Competency Centre (TiCoC) of the Advanced Materials Initiative (AMI).
Institutional Review Board Statement
Not applicable.
Informed Consent Statement
Not applicable.
Data Availability Statement
The original contributions presented in the study are included in the article, further inquiries can be directed to the corresponding author.
Acknowledgments
The authors thank Richard Arthur Catlow, University College London (UCL) for his research inputs in the course of this project. This work made use of the facilities of the Materials Modelling Centre (MMC), University of Limpopo and the Centre for High-Performance Computing (CHPC), Cape Town.
Conflicts of Interest
The authors declare no conflicts of interest.
References
- Yang, Y.; Chen, O.; Angerhofer, A.; Cao, Y.C. On Doping CdS/ZnS Core/Shell Nanocrystals with Mn. J. Am. Chem. Soc. 2008, 130, 15649–15661. [Google Scholar] [CrossRef]
- Huang, X.; Zhao, Z.; Cao, L.; Chen, Y.; Zhu, E.; Lin, Z.; Li, M.; Yan, A.; Zettl, A.; Wang, Y.M.; et al. High-performance transition metal–doped Pt3Ni octahedra for oxygen reduction reaction. Science 2015, 348, 1230–1234. [Google Scholar] [CrossRef] [PubMed]
- Norris, D.J.; Efros, A.L.; Erwin, S.C. Doped Nanocrystals. Science 2008, 319, 1776–1779. [Google Scholar] [CrossRef] [PubMed]
- Linic, S.; Christopher, P.; Xin, H.; Marimuthu, A. Catalytic and photocatalytic transformations on metal nanoparticles with targeted geometric and plasmonic properties. Acc. Chem. Res. 2013, 46, 1890–1899. [Google Scholar] [CrossRef] [PubMed]
- Saha, K.; Agasti, S.; Kim, C.; Li, X.; Rotello, V.M. Gold Nanoparticles in Chemical and Biological Sensing. Chem. Rev. 2012, 112, 2739–2779. [Google Scholar] [CrossRef]
- Jin, R.; Cao, Y.; Mirkin, C.A.; Kelly, K.L.; Schatz, G.C.; Zheng, J.G. Photoinduced Conversion of Silver Nanospheres to Nanoprisms. Science 2001, 294, 1901–1903. [Google Scholar] [CrossRef]
- Henglein, A. Small-particle research: Physicochemical properties of extremely small colloidal metal and semiconductor particles. Chem. Rev. 1989, 89, 1861–1873. [Google Scholar] [CrossRef]
- Gao, F.; Goodman, D.W. Pd–Au bimetallic catalysts: Understanding alloy effects from planar models and (supported) nanoparticles. Chem. Soc. Rev. 2012, 41, 8009–8020. [Google Scholar] [CrossRef] [PubMed]
- Link, S.; Wang, Z.L.; El-Sayed, M.A.J. Alloy formation of gold–silver nanoparticles and the dependence of the plasmon absorption on their composition. Phys. Chem. B 1999, 103, 3529–3533. [Google Scholar] [CrossRef]
- Chen, Y.-H.; Yeh, C.-S. A new approach for the formation of alloy nanoparticles: Laser synthesis of gold–silver alloy from gold–silver colloidal mixtures. Electronic supplementary information (ESI) available: Experimental details, UV–VIS spectra, TEM images and EDX analysis for molar ratios (Au:Ag) of 1:2 and 2:1. Chem. Commun. 2001, 4, 371–372. [Google Scholar] [CrossRef]
- Xiang, J.; Wei, S.H.; Yan, X.H.; You, J.Q.; Mao, Y.L. A density-functional study of Al-doped Ti clusters: TiNAl (N = 1–13). J. Chem. Phys. 2004, 120, 4251–4257. [Google Scholar] [CrossRef]
- Wang, B.L.; Zhao, J.J.; Shi, D.N.; Chen, X.S.; Wang, G.H. Geometric Transition and Electronic Properties of Titanium-Doped Aluminum Clusters. Phys. Rev. A 2005, 72, 023204. [Google Scholar] [CrossRef]
- Bergeron, D.E.; Castleman, A.W., Jr.; Morisato, T.; Khanna, S.N. Formation of Al13I-: Evidence for the Superhalogen Character of Al13. Science 2004, 304, 84–87. [Google Scholar] [CrossRef]
- Jiang, Z.Y.; Yang, C.J.; Li, S.T.J. Structures and stability of B-doped Al clusters: AlNB and AlNB2 (N = 1–7). Chem. Phys. 2005, 123, 204315. [Google Scholar] [CrossRef]
- Bergeron, D.E.; Roach, P.J.; Castleman, A.W., Jr.; Jones, N.O.; Khanna, S.N. Al Cluster Superatoms as Halogens in Polyhalides and as Alkaline Earths in Iodide Salts. Science 2005, 307, 231–235. [Google Scholar] [CrossRef]
- Haruta, M.; Yamada, N.; Kobayashi, T.; Iijima, S. Gold Catalysts Prepared by Coprecipitation for Low-Temperature Oxidation of Hydrogen and of Carbon Monoxide. J. Catal. 1989, 115, 301–309. [Google Scholar] [CrossRef]
- Sanchez, A.; Abbet, S.; Heiz, U.; Schneider, W.D.; Håkkinen, H.; Barnett, R.N.; Landman, U. When Gold Is Not Noble: Nanoscale Gold Catalysts. J. Phys. Chem. A 1999, 103, 9573–9578. [Google Scholar] [CrossRef]
- Neumaier, M.; Weigend, F.; Hampe, O.; Kappes, M.M. Binding energies of CO on gold cluster cations Aun+ (n = 1−65): A radiative association kinetics study. J. Chem. Phys. 2005, 122, 104702. [Google Scholar] [CrossRef] [PubMed]
- Lang, S.M.; Bernhardt, T.M.; Chernyy, V.; Bakker, J.M.; Barnett, R.N.; Landman, U. Selective C-H bond cleavage in methane by small gold clusters. Angew. Chem. Int. Ed. 2017, 56, 13406–13410. [Google Scholar] [CrossRef] [PubMed]
- Ferrari, P.; Vanbuel, J.; Janssens, E.; Lievens, P. Tuning the reactivity of small metal clusters by heteroatom doping. Acc. Chem. Res. 2018, 51, 3174–3182. [Google Scholar] [CrossRef] [PubMed]
- Nørskov, J.K.; Rossmeisl, J.; Logadottir, A.; Lindqvist, L.; Kitchin, J.R.; Bligaard, T.; Jónsson, H. Origin of the over potential for oxygen reduction at a fuel-cell cathode. J. Phys. Chem. B 2004, 108, 17886–17892. [Google Scholar] [CrossRef]
- Reitz, W. Handbook of fuel cells: Fundamentals, technology, and applications, (volume 2), in: W. Vielstich, A. Lamm, H.A. Gasteiger (editors). Mater. Manuf. 2007, 22, 789. [Google Scholar] [CrossRef]
- Mayrhofer, K.J.J.; Blizanac, B.B.; Arenz, M.; Stamenkovic, V.R.; Ross, P.N.; Markovic, N.M. The impact of geometric and surface electronic properties of Pt-catalysts on the particle size effect in electrocatalysis. J. Phys. Chem. B 2005, 109, 14433–14440. [Google Scholar] [CrossRef]
- Han, B.C.; Miranda, C.R.; Ceder, G. Effect of particle size and surface structure on adsorption of O and OH on platinum nanoparticles: A first-principles study. Phys. Rev. B 2008, 77, 075410. [Google Scholar] [CrossRef]
- Jinnouchi, R.; Toyoda, E.; Hatanaka, T.; Morimoto, Y. First principles calculations on site-dependent dissolution potentials of supported and unsupported Pt particles. J. Phys. Chem. C 2010, 114, 17557–17568. [Google Scholar] [CrossRef]
- Antolini, E.; Salgado, J.; Gonzalez, E. The stability of Pt-M (M = first row transition metal) alloy catalysts and its effect on the activity in low temperature fuel cells: A literature review and tests on a Pt Co catalyst. J. Power Sources 2006, 160, 957–968. [Google Scholar] [CrossRef]
- Piotrowski, M.; Piquini, P.; Da Silva, J. Platinum-based nanoalloys PtnTM55-n (TM = Co, Rh, Au): A density functional theory investigation. J. Phys. Chem. C 2021, 116, 18432–18439. [Google Scholar] [CrossRef]
- Guedes-Sobrinho, D.; Nomiyama, R.K.; Chaves, A.S.; Piotrowski, M.J.; Da Silva, J.L.F. Structure, electronic, and magnetic properties of binary PtnTM55-n (TM = Fe, Co, Ni, Cu, Zn) nanoclusters: A density functional theory investigation. J. Phys. Chem. C 2015, 119, 15669–15679. [Google Scholar] [CrossRef]
- Du, J.G.; Sun, X.Y.; Jiang, G. A DFT study on small M-doped titanium (M = V, Fe, Ni) clusters: Structures, chemical bonds and magnetic properties. J. Eur. Phys. D 2009, 55, 111–120. [Google Scholar] [CrossRef]
- Du, J.; Sun, X.; Chen, J.; Jiang, G. The changes in the geometrical, electronic and magnetic properties of titanium clusters as one titanium atom is substituted by boron. J. Phys. B At. Mol. Opt. Phys. 2010, 43, 205103. [Google Scholar] [CrossRef]
- Rodríguez-Kessler, P.L.; Rodríguez-Domínguez, A.R. Structures and Electronic Properties of TiNV (N = 1−16) Clusters: First-Principles Calculations. J. Phys. Chem. A 2016, 120, 2401–2407. [Google Scholar] [CrossRef] [PubMed]
- Verkhovtsev, A.V.; Hanauske, M.; Yakubovich, A.V.; Solov’yov, A.V. Characterization of small pure and Ni-doped titanium clusters: Ab initio versus classical approaches. Comput. Mater. Sci. 2013, 76, 80–88. [Google Scholar] [CrossRef]
- Phaahla, T.M.; Ngoepe, P.E.; Catlow, C.R.A.; Chauke, H.R. The effect of doping with pt impurity on ti clusters: A density functional theory study. Suid-Afrik. Tydskr. Natwet. Tegnol. 2021, 40, 75–78. [Google Scholar] [CrossRef]
- Woodley, S.M. Knowledge Led Master Code Search for Atomic and Electronic Structures of LaF3 Nanoclusters on Hybrid Rigid Ion–Shell Model–DFT Landscapes. J. Phys. Chem. C 2013, 117, 24003–24014. [Google Scholar] [CrossRef]
- Farrow, M.R.; Chow, Y.; Woodley, S.M. Structure prediction of nanoclusters; a direct or a pre-screened search on the DFT energy landscape? Phys. Chem. Chem. Phys. 2014, 16, 21119–21134. [Google Scholar] [CrossRef] [PubMed]
- Lazauskas, T.; Sokol, A.A.; Buckeridge, J.; Catlow, C.R.A.; Escher, S.G.E.T.; Farrow, M.R.; Mora-Fonz, D.; Blum, V.W.; Phaahla, T.M.; Chauke, H.R.; et al. Thermodynamically accessible titanium clusters TiN, N = 2–32. Phys. Chem. Chem. Phys. 2018, 20, 13962–13973. [Google Scholar] [CrossRef]
- Mattson, A.E.; Schultz, P.A.; Desjarlais, M.P.; Mattsson, T.R.; Leung, K. Designing meaningful density functional theory calculations in materials science. J. Mod. Simul. Mater. Sci. Eng. 2005, 13, 1–32. [Google Scholar] [CrossRef]
- Hohenberg, P.; Kohn, W. Inhomogeneous Electron Gas. Phys. Rev. B 1964, 136, 864–871. [Google Scholar] [CrossRef]
- Lazauskas, T.; Sokol, A.A.; Woodley, S.M. An efficient genetic algorithm for structure prediction at the nanoscale. Nanoscale 2017, 9, 3850–3864. [Google Scholar] [CrossRef]
- Escher, S.G.; Lazauskas, T.; Zwijnenburg, M.A.; Woodley, S.M. Structure prediction of (BaO) n nanoclusters for n ≤ 24 using an evolutionary algorithm. Comput. Theor. Chem. 2017, 1107, 74–81. [Google Scholar] [CrossRef]
- Gale, J.D. GULP: A computer program for the symmetry-adapted simulation of solids. J. Chem. Soc. Faraday Trans. 1997, 93, 629–637. [Google Scholar] [CrossRef]
- Gale, J.D.; Rohl, A.L. The General Utility Lattice Program (GULP). Mol. Simul. 2003, 29, 291–341. [Google Scholar] [CrossRef]
- Mora-Fonz, D.; Lazauskas, T.; Farrow, M.R.; Catlow, C.R.A.; Woodley, S.M.; Sokol, A.A. Why are polar surfaces of ZnO stable? Chem. Mater. 2017, 29, 5306–5320. [Google Scholar] [CrossRef]
- Mora-Fonz, D.; Buckeridge, J.; Logsdail, A.J.; Scanlon, D.O.; Sokol, A.A.; Woodley, S.M.; Catlow, C.R.A. Morphological features and band bending at nonpolar surfaces of ZnO. J. Phys. Chem. C 2015, 119, 11598–11611. [Google Scholar] [CrossRef]
- Blum, V.; Gehrke, R.; Hanke, F.; Havu, P.; Havu, V.; Ren, X.; Reuter, K.; Scheffler, M. Ab initio molecular simulations with numeric atom-centered orbitals. Comput. Phys. Commun. 2009, 180, 2175–2196. [Google Scholar] [CrossRef]
- Vanlenthe, E.; Baerends, E.J.; Snijders, J.G. Relativistic total energy using regular approximations. J. Chem. Phys. 1994, 101, 9783–9792. [Google Scholar] [CrossRef]
- Perdew, J.P.; Ruzsinszky, A.; Csonka, G.I.; Vydrov, O.A.; Scuseria, G.E.; Constantin, L.A.; Zhou, X.; Burke, K. Restoring the density-gradient expansion for exchange in solids and surfaces. Phys. Rev. Lett. 2008, 100, 136406. [Google Scholar] [CrossRef]
- Burke, K.; Perdew, J.P.; Ernzerhof, M. Why the generalized gradient approximation works and how to go beyond it. Int. J. Quantum Chem. 1997, 61, 287–293. [Google Scholar] [CrossRef]
- Milman, V.; Winkler, B.; White, J.A.; Pickard, C.J.; Payne, M.C.; Akhmatskaya, E.V.; Nobes, R.H. Electronic structure of materials. Int. J. Quantum Chem. 2000, 77, 799–926. [Google Scholar]
- Segall, M.D.; Lindan, P.L.D.; Probert, M.J.; Pickard, C.J.; Hasnip, P.J.; Clark, S.J.; Payne, M.C. First-principles simulation: Ideas, illustrations and the CASTEP code. Phys. Condens. Matter 2002, 14, 2717–2744. [Google Scholar] [CrossRef]
- Perdew, J.P.; Burke, K.; Ernzerhof, M. Generalised gradient approximation made simple. Phys. Rev. Lett. 1996, 77, 3865–3868. [Google Scholar] [CrossRef] [PubMed]
- Delley, B. An all-electron numerical method for solving the local density functional for polyatomic molecules. J. Chem. Phys. 1999, 92, 508–517. [Google Scholar] [CrossRef]
- Delley, B. From molecules to solids with the DMol3 approach. J. Chem. Phys. 2000, 113, 7756–7764. [Google Scholar] [CrossRef]
- Kumar, V.; Kawazoe, Y. Metal-encapsulated fullerenelike and cubic caged clusters of silicon. Phys. Rev. Lett. 2001, 87, 045503. [Google Scholar] [CrossRef]
- Kumar, V.; Kawazoe, Y. Metal-encapsulated caged clusters of germanium with large gaps and different growth behavior than silicon. Phys. Rev. Lett. 2002, 88, 235504. [Google Scholar] [CrossRef]
- Sakurai, M.; Watanabe, K.; Sumiyama, K.; Suzuki, K. Magic numbers in transition metal (Fe, Ti, Zr, Nb, and Ta) clusters observed by Time-of-flight mass spectroscopy. J. Chem. Phys. 1999, 111, 235–238. [Google Scholar] [CrossRef]
- Wu, H.; Desai, S.R.; Wang, L.-S. Electronic structure of small titanium clusters: Emergence and evolution of the 3d band. Phys. Rev. Lett. 1996, 76, 212–215. [Google Scholar] [CrossRef] [PubMed]
- Zhao, J.; Qiu, Q.; Wang, B.; Wang, J.; Wang, G. Geometric and electronic properties of titanium clusters studied by ultrasoft pseudopotential. Solid State Commun. 2001, 118, 157–161. [Google Scholar] [CrossRef]
- Salazar-Villanueva, M.; Hernandez Tejeda, P.H.; Pal, U.; Rivas-Silva, J.F.; Rodriquez Mora, J.L.; Ascencio, J.A. Stable TiN (n = 2–15) clusters and their geometries: DFT calculations. J. Phys. Chem. A 2006, 110, 10274–10278. [Google Scholar] [CrossRef]
- Hurtado, R.B.; Cortez-Valadez, M.; Gámez-Corrales, R.; Flores-Acosta, M. Structural and vibrational properties of gold-doped titanium clusters: A first-principles study. Comput. Theor. Chem. 2018, 1124, 32–38. [Google Scholar] [CrossRef]
- Hoffmann, R.; Howell, J.M.; Rossi, A.R. Bicapped tetrahedral, trigonal prismatic, and octahedral alternatives in main and transition group six-coordination. J. Am. Chem. Soc. 1976, 98, 2484–2492. [Google Scholar] [CrossRef]
- Hejazi, S.H.; Trevelyan, P.M.J.; Azaiez, J.; De Wit, A. Viscous fingering of a miscible reactive A + B → C interface: A linear stability analysis. J. Fluid Mech. 2010, 652, 501–528. [Google Scholar] [CrossRef]
- Smith, A.M.; Nie, S. Semiconductor Nanocrystals: Structure, Properties, and Band Gap Engineering. Acc. Chem. Res. 2010, 43, 190–200. [Google Scholar] [CrossRef] [PubMed]
- Alivisatos, A.P. Perspectives on the physical chemistry of semiconductor nanocrystals. J. Phys. Chem. 1996, 100, 13226–13239. [Google Scholar] [CrossRef]
- Mahlangu, R.; Phasha, M.J.; Chauke, H.R.; Ngoepe, P.E. Structural, elastic and electronic properties of equiatomic PtTi as potential high-temperature shape memory alloy. Intermetallics 2013, 33, 27–32. [Google Scholar] [CrossRef]
- Chauke, H.R.; Minisini, B.; Drautz, R.; Nguyen-Manh, D.; Ngoepe, P.E.; Pettifor, D.G. Theoretical investigation of the Pt3Al ground state. Intermetallics 2010, 18, 417–421. [Google Scholar] [CrossRef]
- Tshwane, D.M.; Modiba, R.; Govender, G.; Ngoepe, P.E.; Chauke, H.R. The adsorption of halogen molecules on Ti (110) surface. J. Mater. Res. 2020, 36, 592–601. [Google Scholar] [CrossRef]
- Corneliu, I.O.; Mihai, A.G. Structure and electronic properties of TiO2 nanoclusters and dye-nanocluster systems appropriate to model hybrid photovoltaic or photocatalytic applications. J. Nanomater. 2019, 357, 7–10. [Google Scholar]
- Bader, R.F.W.; Henneker, W.H. Molecular charge distributions and chemical binding. J. Chem. Phys. 1967, 46, 3361–3363. [Google Scholar] [CrossRef]
- Dutta, A.; Mondal, P. Density functional theory study of structure, electronic and magnetic properties of non-metal (Group 13) doped stable Rhn (n = 2–8) clusters and catalytic activities towards methanol activities. J. Chem. Sci. 2018, 130, 1–22. [Google Scholar] [CrossRef]
- Bautista Hernandez, A.; Cortes-Arriagada, D.; Camacho Garcia, H.; Chigo Anota, E.; Salaza Villanueva, M. Quantum molecular study on doping effect in titanium and vanadium clusters: Their application to remove some chemical species. Appl. Nanosci. 2020, 10, 37–49. [Google Scholar] [CrossRef]
Figure 1.
Comparison of the binding energies of and where M represents Pd, Ir, Ni. Plot (a) show energy comparison for , Pd & Ni doped clusters and (b) show energy comparison for and Ir doped clusters.
Figure 1.
Comparison of the binding energies of and where M represents Pd, Ir, Ni. Plot (a) show energy comparison for , Pd & Ni doped clusters and (b) show energy comparison for and Ir doped clusters.

Figure 2.
The second energy difference energies per atom for (M = Pd, Ni, Ir) and the corresponding pure clusters (N = 2−16).
Figure 2.
The second energy difference energies per atom for (M = Pd, Ni, Ir) and the corresponding pure clusters (N = 2−16).

Figure 3.
The dissociation energies per atom for (M = Pd, Ni, Ir), (N = 2−16) clusters.

Figure 4.
The electronic properties (HOMO-LUMO) of nanoclusters.

Figure 5.
The electronic properties (HOMO-LUMO) of nanoclusters.

Figure 6.
The electronic properties (HOMO-LUMO) of nanoclusters.

Figure 7.
Representation of the total density of states for Ni, Ir and Pd dopants on (a) Ti13 and (b)Ti15. This plot compares the most stable doped systems of titanium with bare titanium for N ≥ 10 nanoclusters. The Fermi energy is taken as the zero energy.
Figure 7.
Representation of the total density of states for Ni, Ir and Pd dopants on (a) Ti13 and (b)Ti15. This plot compares the most stable doped systems of titanium with bare titanium for N ≥ 10 nanoclusters. The Fermi energy is taken as the zero energy.

Figure 8.
Representation of the total density of states for (a) Ti6, (b) Ti7 and (c) Ti8 nanoclusters, where Pd, Ir & Ni doped Ti nanoclusters are more stable for N ≤ 10. The Fermi energy is taken as zero energy.
Figure 8.
Representation of the total density of states for (a) Ti6, (b) Ti7 and (c) Ti8 nanoclusters, where Pd, Ir & Ni doped Ti nanoclusters are more stable for N ≤ 10. The Fermi energy is taken as zero energy.

Figure 9.
Charge density difference for (a) Ti12Ir, (b) Ti12Ni, (c) Ti12Pd. The blue region represents accumulation while the yellow region represents electron depletion.
Figure 9.
Charge density difference for (a) Ti12Ir, (b) Ti12Ni, (c) Ti12Pd. The blue region represents accumulation while the yellow region represents electron depletion.

Figure 10.
The computed iso-surfaces of the HOMO-LUMO for Ti12M (M = Pd, Ir, Ni), where the blue, violet and maroon atoms on Ti12M iso-surfaces represents Ir, Pd and Ni respectively.
Figure 10.
The computed iso-surfaces of the HOMO-LUMO for Ti12M (M = Pd, Ir, Ni), where the blue, violet and maroon atoms on Ti12M iso-surfaces represents Ir, Pd and Ni respectively.

Disclaimer/Publisher’s Note: The statements, opinions and data contained in all publications are solely those of the individual author(s) and contributor(s) and not of MDPI and/or the editor(s). MDPI and/or the editor(s) disclaim responsibility for any injury to people or property resulting from any ideas, methods, instructions or products referred to in the content. |
© 2024 by the authors. Licensee MDPI, Basel, Switzerland. This article is an open access article distributed under the terms and conditions of the Creative Commons Attribution (CC BY) license (https://creativecommons.org/licenses/by/4.0/).
Share and Cite
MDPI and ACS Style
Phaahla, T.; Ngoepe, P.; Chauke, H. Exploring Synergistic Effect on the Stability of Ni-, Pd-, Ir-Doped TiN (N = 1–15) Nanoparticles. Alloys 2024, 3, 15-30. https://0-doi-org.brum.beds.ac.uk/10.3390/alloys3010002
AMA Style
Phaahla T, Ngoepe P, Chauke H. Exploring Synergistic Effect on the Stability of Ni-, Pd-, Ir-Doped TiN (N = 1–15) Nanoparticles. Alloys. 2024; 3(1):15-30. https://0-doi-org.brum.beds.ac.uk/10.3390/alloys3010002
Chicago/Turabian StylePhaahla, Tshegofatso, Phuti Ngoepe, and Hasani Chauke. 2024. "Exploring Synergistic Effect on the Stability of Ni-, Pd-, Ir-Doped TiN (N = 1–15) Nanoparticles" Alloys 3, no. 1: 15-30. https://0-doi-org.brum.beds.ac.uk/10.3390/alloys3010002