Article

Some Comments on the Entropy-Based Criteria for Piping

1
Ybl Miklós, Faculty of Architecture and Civil Engineering, Szent István University, Thokoly 74, Budapest 1146, Hungary
2
Geotechnical Department, Budapest University of Technology and Economics, Budapest 1111, Hungary
3
Tengizchevroil, Farnborough, Hampshire GU14 7BF, UK
4
Department of Geotechnical Engineering, Ruhr-University Bochum, Universitätsstrasse 150, 44780 Bochum, Germany
5
Department of Biological & Agricultural Engineering, Zachry Department of Civil Engineering, Water Management & Hydrological Science, Texas A&M University, 321 Scoates Hall, MS 2117, College Station, TX 77843, USA
6
School of Engineering, University of Newcastle, Callaghan 2308, Australia
*
Author to whom correspondence should be addressed.
Entropy 2015, 17(4), 2281-2303; https://0-doi-org.brum.beds.ac.uk/10.3390/e17042281
Submission received: 23 October 2014 / Revised: 8 April 2015 / Accepted: 9 April 2015 / Published: 15 April 2015

Abstract

:
This paper is an extension of previous work which characterises soil behaviours using the grading entropy diagram. The present work looks at the piping process in granular soils, by considering some new data from flood-protection dikes. The piping process is divided into three parts here: particle movement at the micro scale to segregate free water; sand boil development (which is the initiation of the pipe), and pipe growth. In the first part of the process, which occurs during the rising flood, the increase in shear stress along the dike base may cause segregation of water into micro pipes if the subsoil in the dike base is relatively loose. This occurs at the maximum dike base shear stress level (ratio of shear stress and strength) zone which is close to the toe. In the second part of the process, the shear strain increment causes a sudden, asymmetric slide and cracking of the dike leading to the localized excess pore pressure, liquefaction and the formation of a sand boil. In the third part of the process, the soil erosion initiated through the sand boil continues, and the pipe grows. The piping in the Hungarian dikes often occurs in a two-layer system; where the base layer is coarser with higher permeability and the cover layer is finer with lower permeability. The new data presented here show that the soils ejected from the sand boils are generally silty sands and sands, which are prone to both erosion (on the basis of the entropy criterion) and liquefaction. They originate from the cover layer which is basically identical to the soil used in the Dutch backward erosion experiments.

1. Introduction

There is a characteristic two-layer soil condition below many of the flood protection dikes in Hungary, in which a lower permeability, fine sandy silt cover-layer overlies a saturated, higher permeability sandy gravel base material. In several situations, these have been affected by piping [16]. It is unclear, however, if the upper layer or the base layer is washed out during dike failure.
The piping phenomena in Hungarian dikes can be classified into three categories on the basis of the speed of the process in the flood experiences of Hungary (Figure 1, [57]). In each case, the formation of sand boils, close to the toe (usually at deepest points of the surface or in a weak point of the surface such as a palaeochannel), is a common feature among piping failures. In the stretch of the Danube River between Rajka and Horany, the distance of the toe to a palaeochannel is 0–10 m in 29%, 11–50 m in 62% and 51–200 m in 9% of cases [5].
In the first category, a sand boil forms at the land-side toe. Pipe development is slow and evident from small seepages and outwash of soil. If the pipe reaches the surface of the high permeability base material, it generally stops. Otherwise, piping can be mitigated by surcharging the water level above the land-side end of the pipe, thereby decreasing the hydraulic gradient to a non-critical magnitude.
In the second category, continued outwash leads to the development of cavities or “pipes” in the soil which ultimately progress to failure. Not many of such cases are known in Hungary. Part of these pipes forms in the cover layer (probably similar to that described in the Dutch tests [810]), but another part of the pipe is likely to continue into the base layer.
In the third category, the failure is extremely quick, with collapse occurring almost at the same time as the sand boils appear adjacent to the landside toe. In one case (July 15, 1954 at Ásványráró [3,5]), a 0.5 m diameter geyser suddenly appeared at 5 m from the landside toe, throwing off the cover layer. Within 2 seconds, the pipe reached the riverside. A funnel developed at the waterline and the dike collapsed. In this case, the silty sand layer was extremely loose and thick. A similar case occurred in 1965 in Csicsó [5].
The process is still not well-understood despite several large scale tests having been conducted ([5,811]). This technical note is an extension of a previous work [12] to provide some clarification regarding the failure mechanism in cases of piping. It combines a short description of an entropy based internal stability criterion (see further details in [13]) and the description of the piping failure mechanism in Hungarian dikes, with some additional research.
In this paper, it is hypothesized that piping is the result of a more complex process where local soil densification, due to the increasing shear stress and decreasing shear resistance, and possibly even due to the shear waves caused by crack formation during lateral spreading, may play a key role in pipe formation, by ensuring kinematic conditions for the outwash. The suggested process is intimately linked to a local volume decrease in soils with void ratios greater than that at the critical state, in the vicinity of the maximum shear stress point, which is close to the dike toe. The various piping categories differ in the size of these vicinities, depending on the relative density of the soils and the shear strength of the base and cover layers. The idea that the special Hungarian two-layered subsoil conditions may result in a larger hydraulic gradient and a smaller shear resistance than expected in situations of homogeneous soils is also explored.
In previous work [12], it was proposed that the soils washed-out from beneath the dikes originate from the cover layer, on the basis of only four samples. In this paper, the idea is tested further using measured data for 20 additional washed-out soil samples. These are presented using the entropy diagram, and compared with the soils from the natural base strata at some dike failure sites. Moreover, the failure mechanism is explained by analyzing the stress and volumetric strain variations in the dike base during flooding in the Hungarian experience.
The hypothesised complex process is confirmed in this paper by analyzing the liquefaction susceptibility of materials taken from the sand boil, consideration of the hydraulic conditions of seepage with dynamic water-front effects, and analysis of a theory of lateral spreading, showing that a sudden cracking displacement with some additional dynamic effects due to the decrease in the soil friction during the movement of the soil body is likely to occur.

2. Elements of the Analysis

2.1. Review of the Grading Entropy Based Rules

2.1.1. Statistical Cells (Fractions and Elementary Cells)

Grading entropy is a measure which reflects the range and frequency of different sized particles in a soil [1316]. This is most simply determined from a mechanical sieve analysis. A cell system of particle sizes is used as the basis to apply the statistical entropy theory of a discrete distribution and the successive sieve hole diameters generally have a multiplier of two. The double statistical cell system is used, defined by an arbitrary elementary cell width, d0, and a non-uniform sized cell system (“fraction system”) defined on the pattern of the classical sieve aperture diameters. The diameter range for fraction j (j = 1, 2, 3 …, N; see Table 1) is:
2 j d 0 d > 2 j 1 d 0 ,
For granular soils, the smallest particles are caused by crushing which can produce particles not less than the size of some microns. For plastic soils, the diameters can be much smaller, however, the concept is not significantly influenced by the selection of the elementary cell width d0.

2.1.2. Space of Possible Grading Curves

The relative frequencies of the fractions xi of each grading curve satisfy the following equation:
i = j min j max = j min + N 1 x i = 1 , x i 0 , N 1
Equation (2) defines an N − 1 dimensional, closed simplex (which is the generalised N − 1 dimensional analogy of the 2 dimensional triangle or, three-dimensional tetrahedron) if the relative frequencies xi are identified with the barycentre coordinates of the simplex points. The vertices can be numbered “continuously” from jmin to jmax, and therefore, it is considered to be continuous.

2.1.3. Grading Entropy and Entropy Coordinates

The grading entropy S can be separated into the sum of two parts, comprising the base entropy So and entropy increment ΔS:
S = S o + Δ S
The first part is the base entropy, which takes into account the relative spread of particle sizes within the entire size distribution, is defined by:
S 0 = x i 0 x i S 0 i ,
In Equation (4)Soi is the grading entropy of the i-th fraction, given by:
S o i = i
The second part is the entropy increment, which accounts for the relative distribution of particles across all of the defined fractions, is defined by:
Δ S = 1 ln 2 x i 0 x i ln x i .
The grading entropy parameters defined above are strongly dependent on whether a soil is primarily coarse or fine grained: a coarse and a fine soil, with the same number of fractions present with the same relative frequencies, will have different grading entropy values. However, the grading entropy parameters can be normalised to allow the relative entropy of fine and coarse soils to be compared. The normalized base entropy, the so-called relative base entropy A, is defined as:
A = S o S o min S o max S o min ,
where So max and So min are the base entropies of the largest and the smallest fractions in the mixture, respectively. The normalized entropy increment B is defined as:
B = Δ S ln N

2.1.4. The Meaning of the Base Entropy Coordinates

Using the concept of a fraction serial number i, an abstract, normalized, mean grain diameter can be defined denoted by kmean:
k m e a n = i m e a n i min i max i min
where imean is a mean grain diameter, in terms of the serial number of the fractions:
i m e a n = i = i min i max x i i
The base entropy So is equal to the abstract, mean diameter imean, whereas the relative base entropy A is equal to the abstract, normalised, mean diameter kmean.

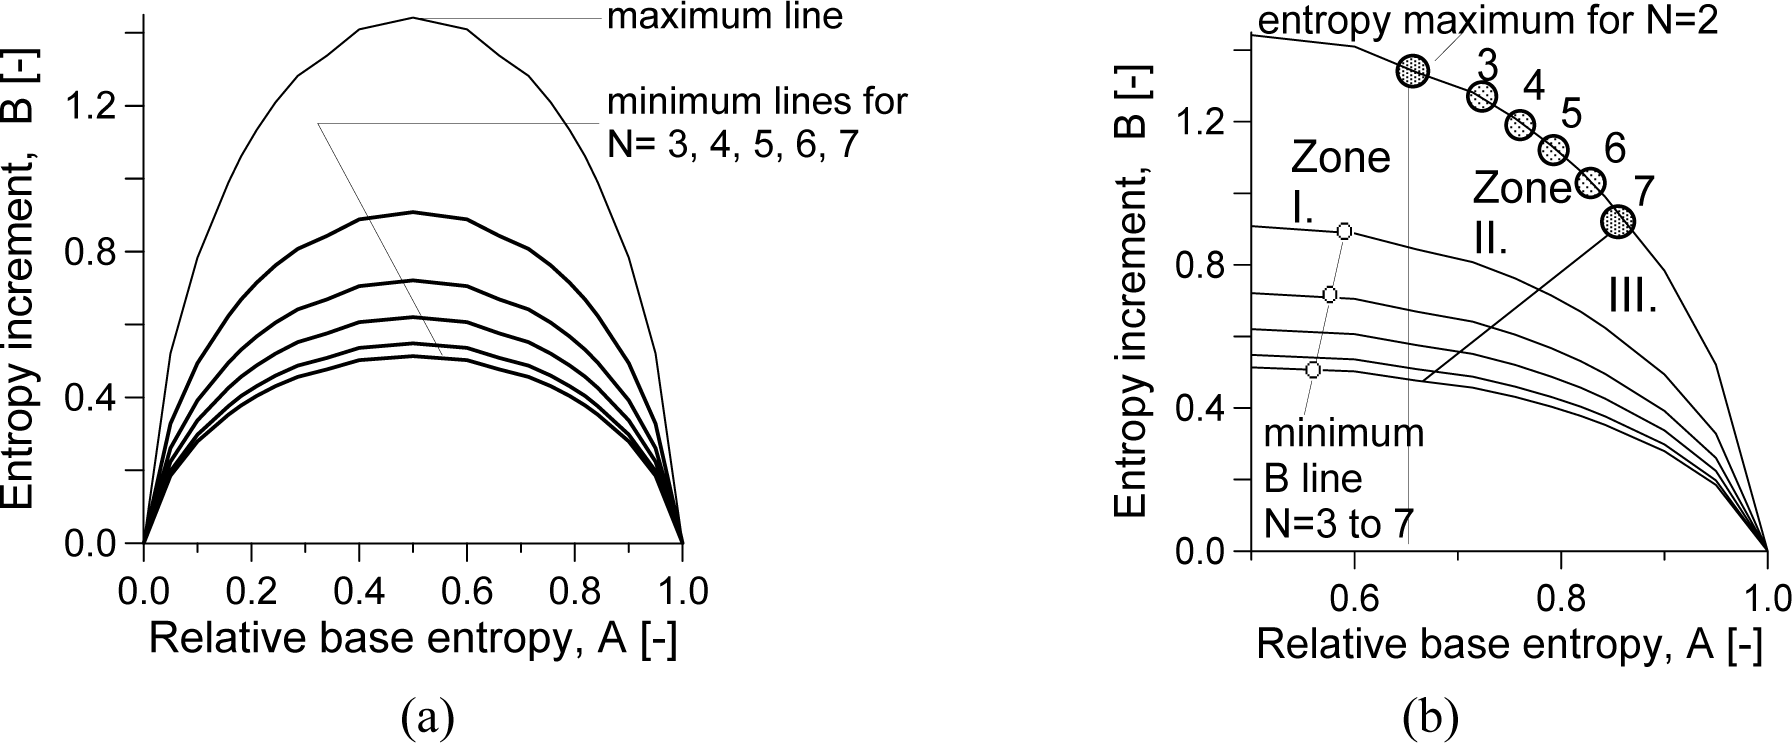
2.1.5. Entropy Diagrams

The entire information of particle size distributions can be described using either the entropy or normalised entropy parameters, and if the entropy parameters are used as coordinates, then soils with different grain size distributions can be represented and compared directly on entropy diagrams, where the base entropy is the abscissa and the entropy increment is the ordinate. As indicated by Figure 1, a map can be defined for a specified simplex ΔN,i, determined by the number of fractions N and the serial number of the smallest fraction imin: this is the normalized entropy map fn: ΔN →[A, B] (Figure 2).
This map, between the N-1 dimensional simplex and the two dimensional space of entropy coordinates, is continuous on the open simplex and can continuously be extended to the closed simplex. Therefore, the image of normalized entropy map—the normalized entropy diagram—is compact, like the simplex. It follows then that the image of compact the simplex has a maximum and a minimum value for every possible value of A.

2.1.6. Particle Migration Criterion

The particle migration criterion (Figure 2b) was elaborated on the basis of vertical water flow tests (“suffosion or wash-out tests”) made on artificial mixtures of natural soil grains [13]. In these tests, the soil is placed into a cylindrical permeameter (20 cm height and 10 cm diameter) bounded at the bottom by a sieve. The mesh would permit passage of particles smaller than 1.2 mm but retain particles larger than 1.2 mm. The downward hydraulic gradient is between 4 and 5. By characterizing the sands from the top and bottom parts of the permeameter at the end of the test, the particle movements can be detected.
Representing the results in terms of the entropy increment B and the relative base entropy A, the soil structure stability zones were identified (note only half of the symmetric diagram is shown).
These are as follows. If A < 2/3 (Zone I), the large grains do not have a structure: the coarser particles “float” in the matrix of the finer ones. The mixture is unstable and piping may occur.
If A > 2/3, the coarser particles form a skeleton and total erosion cannot occur. In Zone II, the structure of smaller and larger particles is inherently stable, and there are no particle movements: the larger particles retain the smaller particles, and the smaller particles support the larger ones. In Zone III, the fines may migrate in the presence of seepage flow (“suffosion”), but they are unable to cause collapse of the structural skeleton of coarser particles. The division curve between zones II and III connects the maximum entropy points of the mixtures with fraction number less than N. Note the shape of the line between II and III is approximate here.

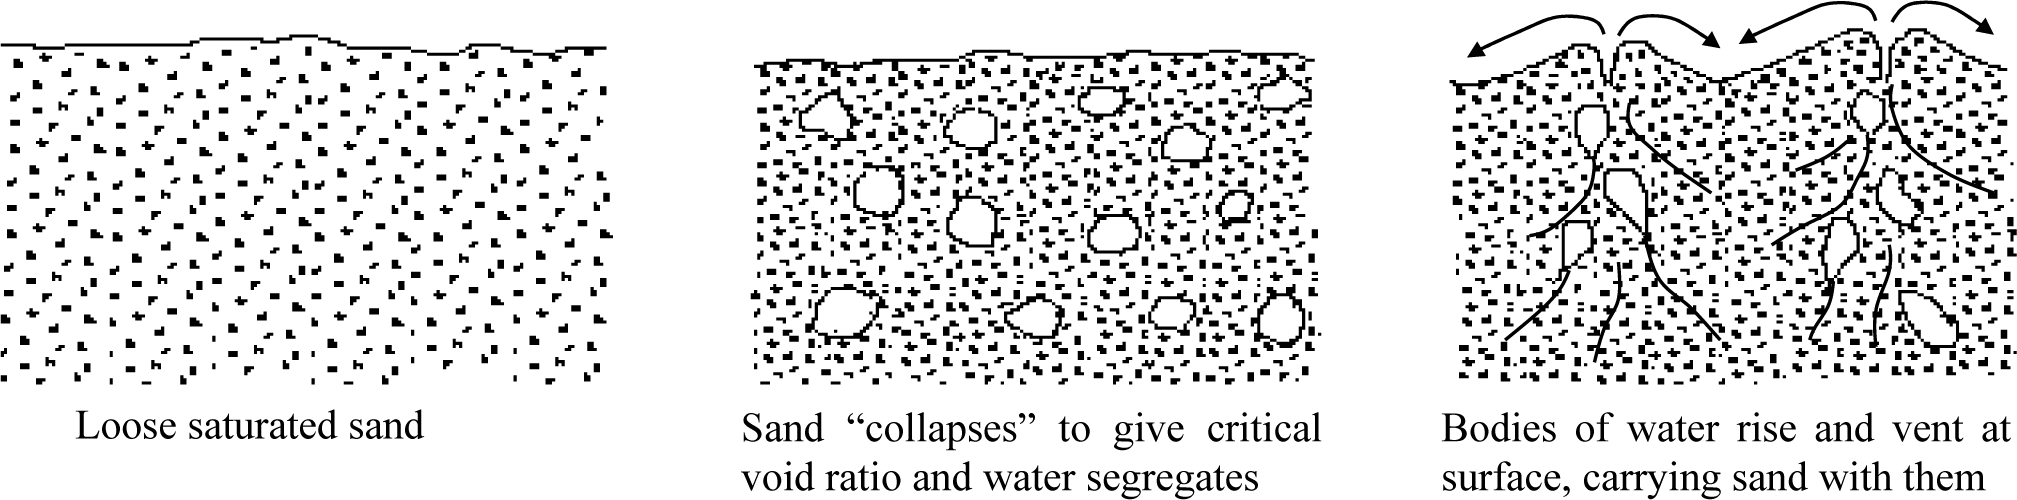
2.2. Sand Boils and Liquefaction Rules

Liquefaction is a phenomenon observed in sands and silty sands, generally in response to seismic loadings [17,18]. The rapid stress oscillations associated with seismic events generate shear stresses and the soil skeleton structure may tend to have a volume decrease, which causes an increase in excess pore water pressures in the soil, which overcome inter-granular friction and reduce the shear strength of soil.
Liquefaction is commonly associated with the formation of sand boils [1720]. These appear as small sand volcanos, indicating elevated pore pressures at depth. They arise because liquefaction in loose saturated sands at depth allows the sand grains to move around and fall into a more tightly packed arrangement, producing bodies of segregated water within the soil. The water bodies, being of lower density, then rise through the overlying soil, like magma in the earth’s crust, until they vent at the surface. In rising, the water carries some suspended sediment, which flows from the vent of the sand boil, like lava from a volcano, forming a cone around it. This is illustrated in Figure 3. A similar process takes place if fine sand (tailings) materials are exposed to centrifugation which may cause particle segregation, assemblage formation and flow channeling.
The potential for sands to liquefy can be evaluated according to the two classical liquefaction criteria of Tsuchida [21] for soils with small uniformity coefficients and soils with large uniformity coefficients, illustrated in Figure 4. Similar criteria were given by Smoltczyk [22] and by Numata, and Mori [23] for soils with small uniformity coefficient. According to their results, the ejected soils are non-plastic and of uniform grain size. Their clay content is lower than 10%, but their fines content widely ranges from 0%–100%.

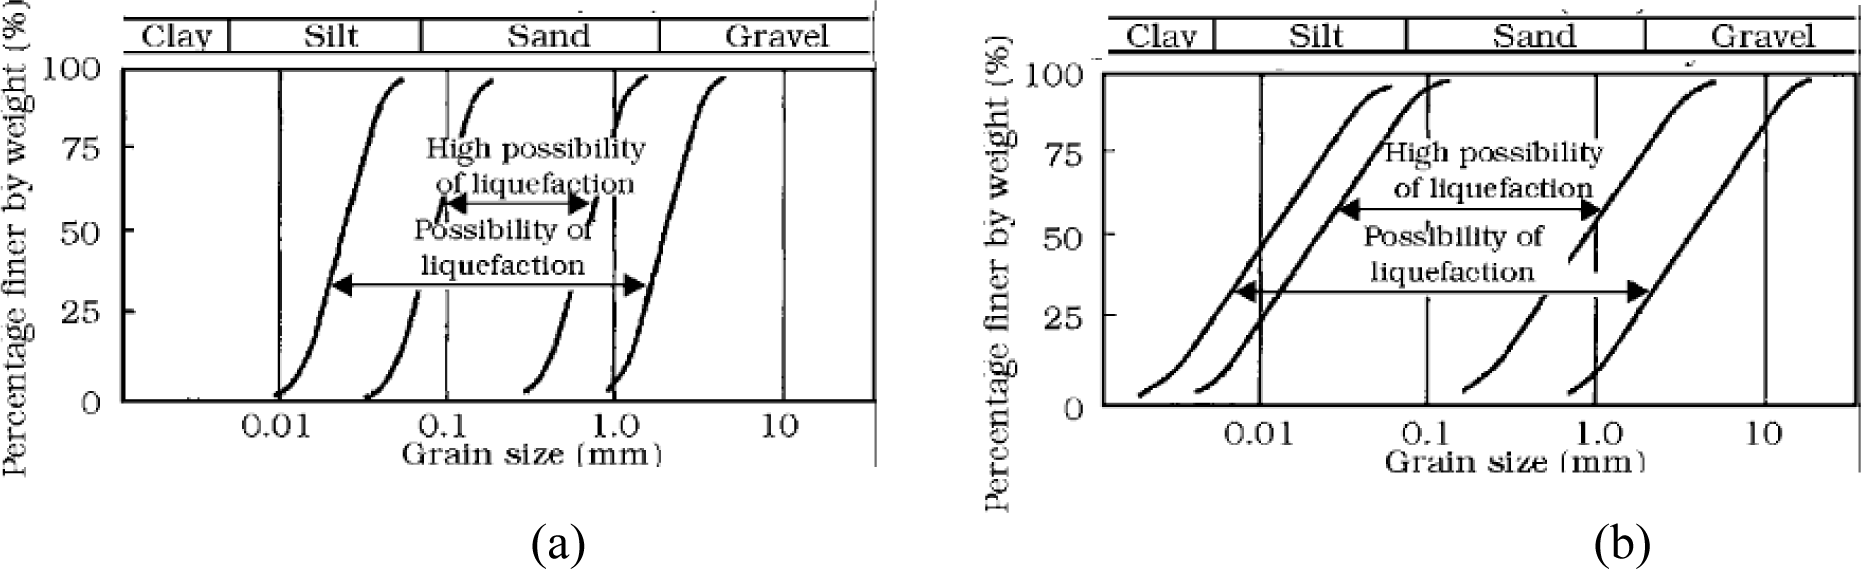
2.3. Soil Liquefaction Resistance

Liquefaction of loose, saturated sands may be caused by cyclic, dynamic or static (monotonically increasing) undrained loading. Liquefaction of an element of soil can only occur if shear stresses applied under undrained conditions are greater than or equal to those required to initiate liquefaction. The increase in shear stress required to initiate liquefaction is referred as the static liquefaction resistance of soil [17,18]. The static liquefaction resistance decreases with decreasing relative density and confining pressure, and it decreases dramatically with increasing initial shear stress level. At high initial shear stress levels, the initiation of liquefaction is observed to result from increases in shear stress under undrained conditions of only a few percent of the initial shear stress [17,18].

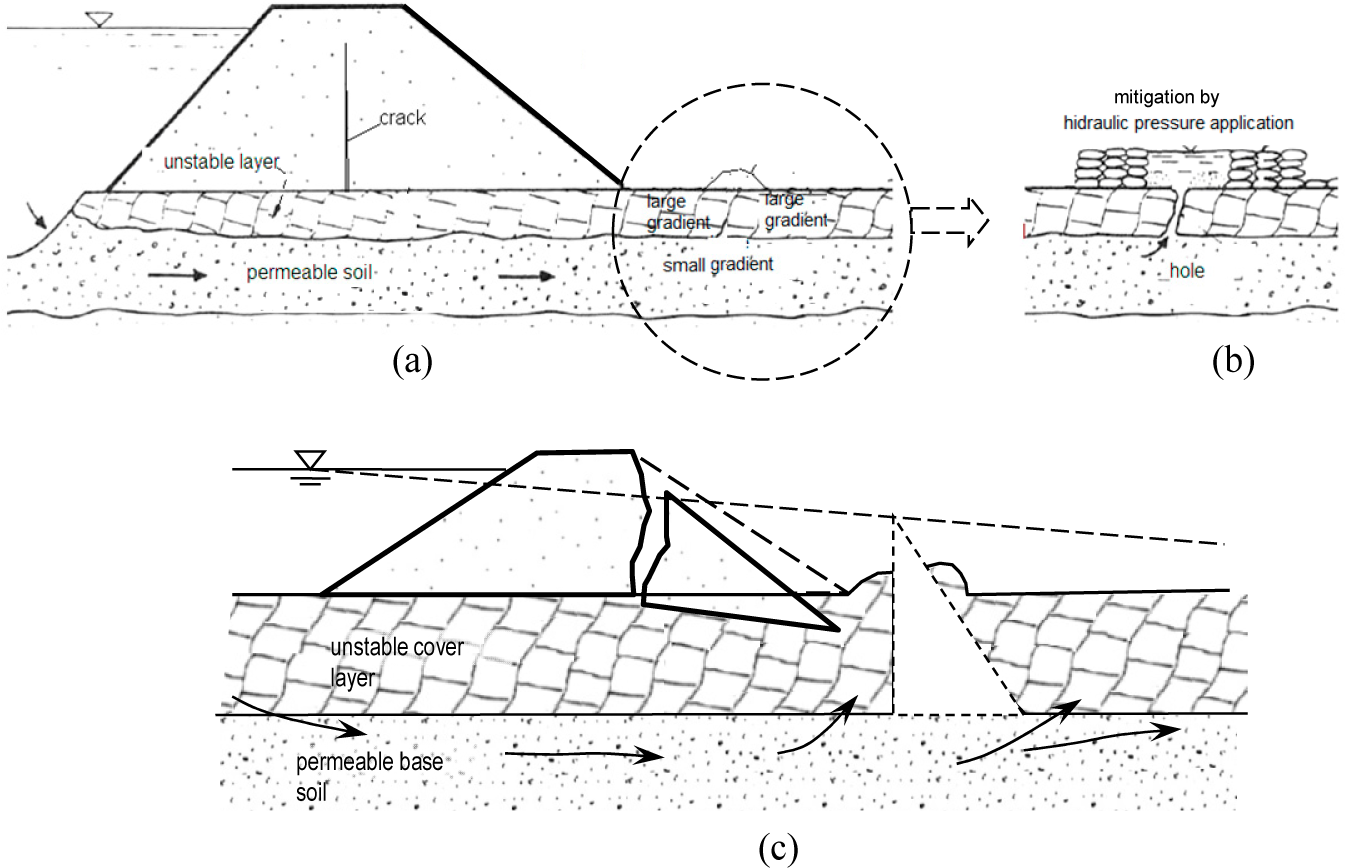
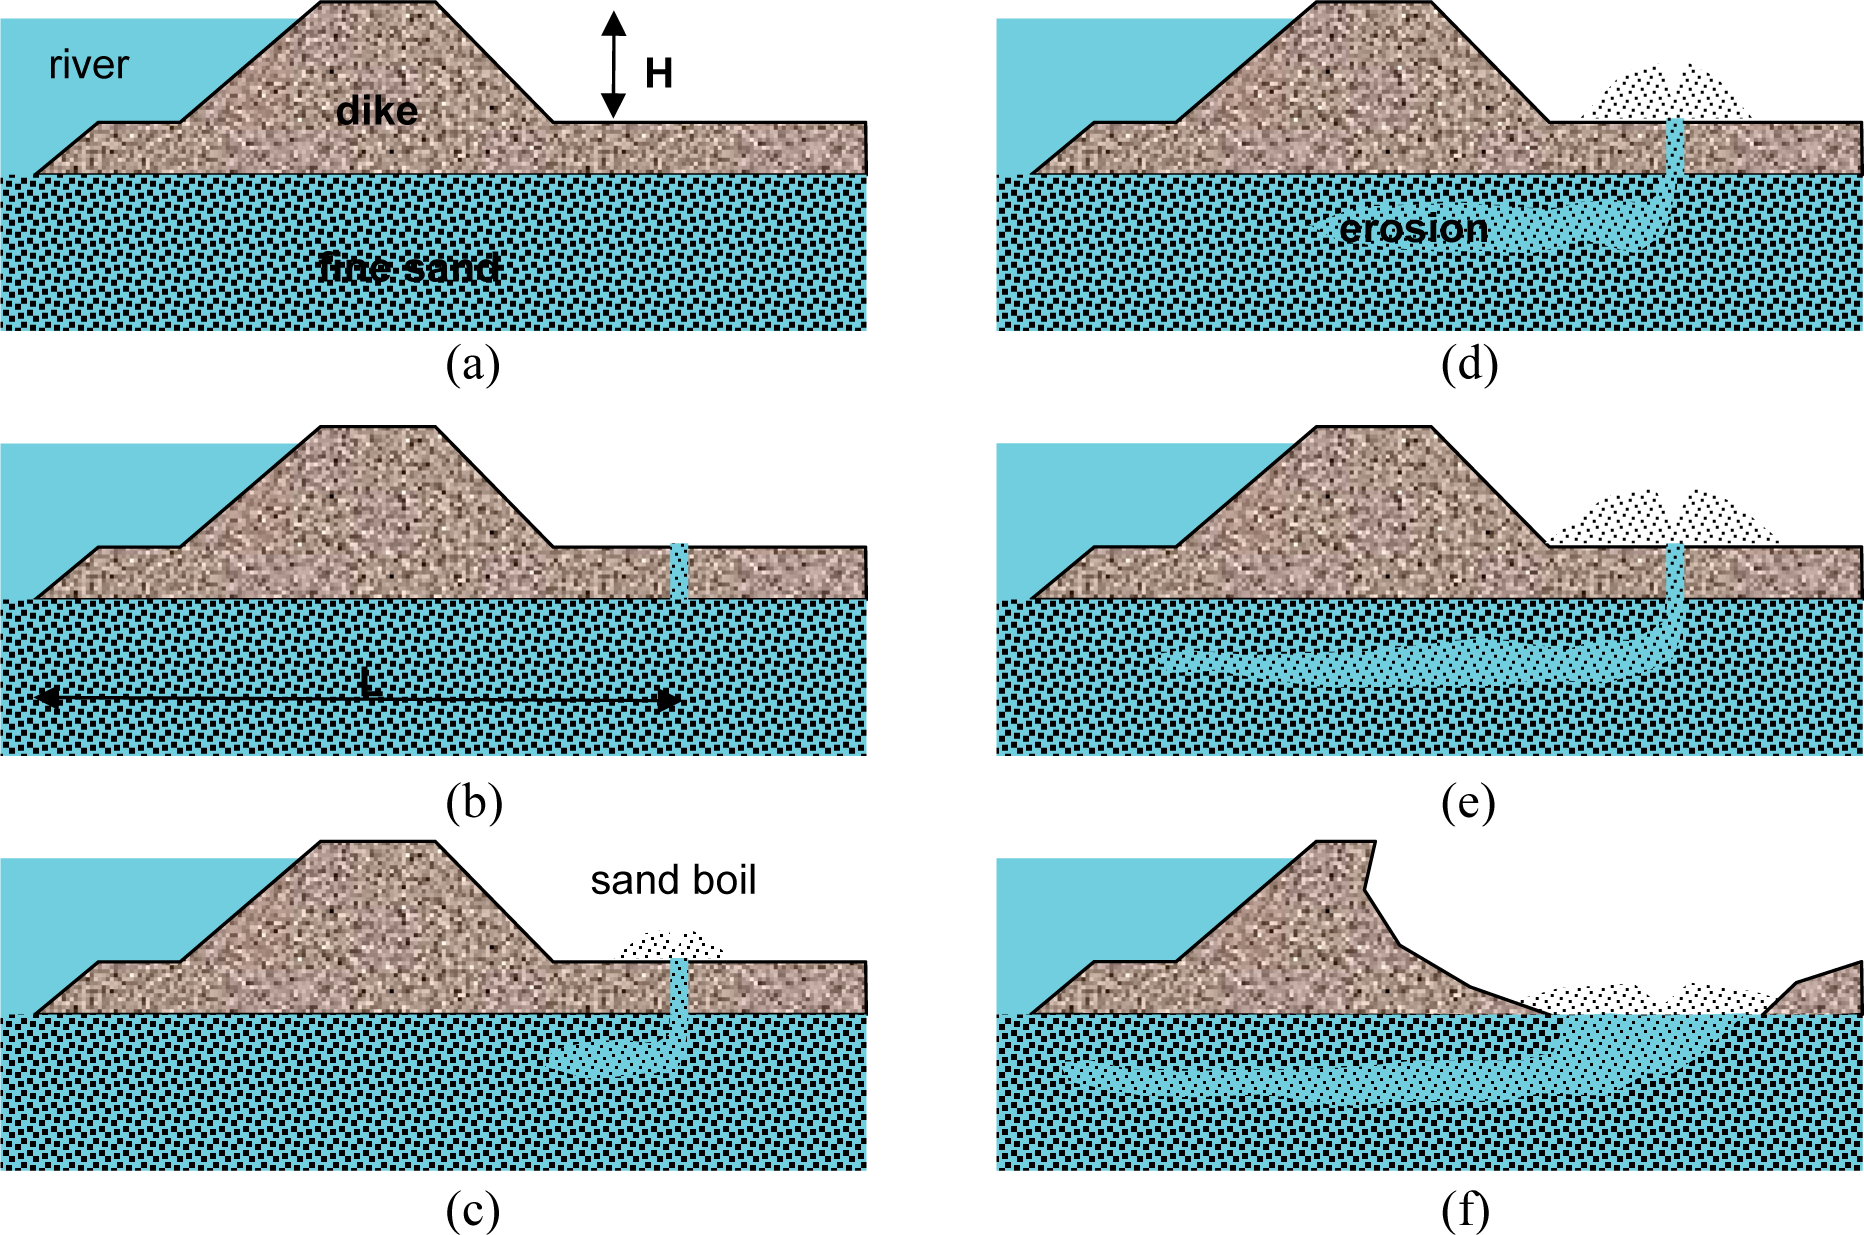
2.4. Piping by Backward Erosion

The mechanism of piping by backward erosion has generally been studied in homogeneous cover layers and has been formulated on the basis of the results of laboratory small scale or larger full-scale experiments. The findings of the Dutch experiments [810] are shown as a series of five phases in Figure 5. The phenomenon is triggered by a continuous increase in the river-side water level (Figure 5a). In the first phase (Figure 5b), seepage from the river-side to the land-side is established. In the experiments, seepage occurred as soon as a hydraulic head difference was applied. In phase 2 (Figure 5c), after increasing the hydraulic head difference, seepage appeared as boils at the landside toe, indicating that water is flowing in a concentrated path, eroding sand, probably from a localized pipe underneath the levee. The sand transport did not cease, but occurred continuously for several minutes. In phase 3, widening of the pipe was observed in all experiments (Figure 5d,e). In phase 4, failure and breakthrough occurred, accompanied by a violent flow of sand and water, mud fountains, cracks in the levee and subsidence of the levee (Figure 5f).
An important observation during phase 4 was the behavior of the overlying clay levee. Failure sometimes took place shortly after the first increase of sand transport, as the widening phase extended rapidly beneath the land-side toe of the dike, back toward the river-side. In other cases, however, it was delayed due to localized settlement of the levee, which caused the pipes to collapse and close, and then to form again. Hence, the period from the start of sand transport to failure could be as short as 20 min if the pipe remained open up to the point of failure, or as long as a few days if the widening process needed to be restarted due to incremental dike settlement.
In an earlier experimental study in Florida, it was revealed that the pipes are formed in several small tubes rather as a big pipe, the size of the tubes are in the range of the mean particle diameter [11].
On the basis of the laboratory tests of the VITUKI in Hungary [5], the piping process can be divided in two phases before the failure. In the first phase, some elementary small boils appear as water finds a path to the surface, with seeping water carrying the smaller grains. Then, a concentrated water spout or geyser appears which carries the larger grains as well, forming a crater where the carried soil is deposited. A third phase is then erosion during the failure.
Since piping failures are related to generally small hydraulic gradients (e.g. as small as 0.063, see e.g. [24,25]), the basic research on piping in Hungary had the view that developments in soil mechanics research had failed to understand the basic fundamentals of piping [5,6]. A significant advance was understanding the importance of the relative density of the subsoil. By examining the spatial occurrence of piping failures, it was found that they often coincide with palaeochannels (piping occurred within 10 m of these in 29% of cases; at 11–50 m in 62% of cases and at 51–200 m in 9% of cases, [5]). This relation is possibly explained by the fact that the channel infill is deposited by different geological processes to the surrounding floodplain. It is younger, and it has a looser state which may vary with distance from the axis of the palaeochannel.

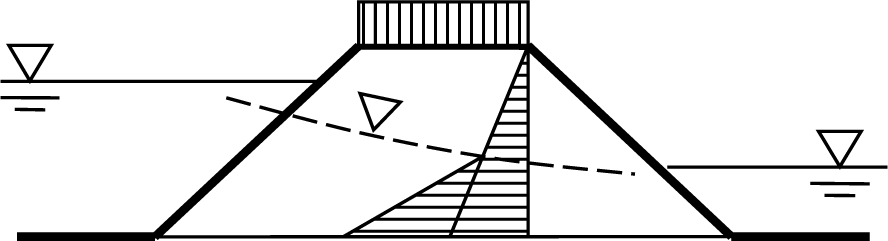
2.5. Shear Stress and Strain at the Dike Base

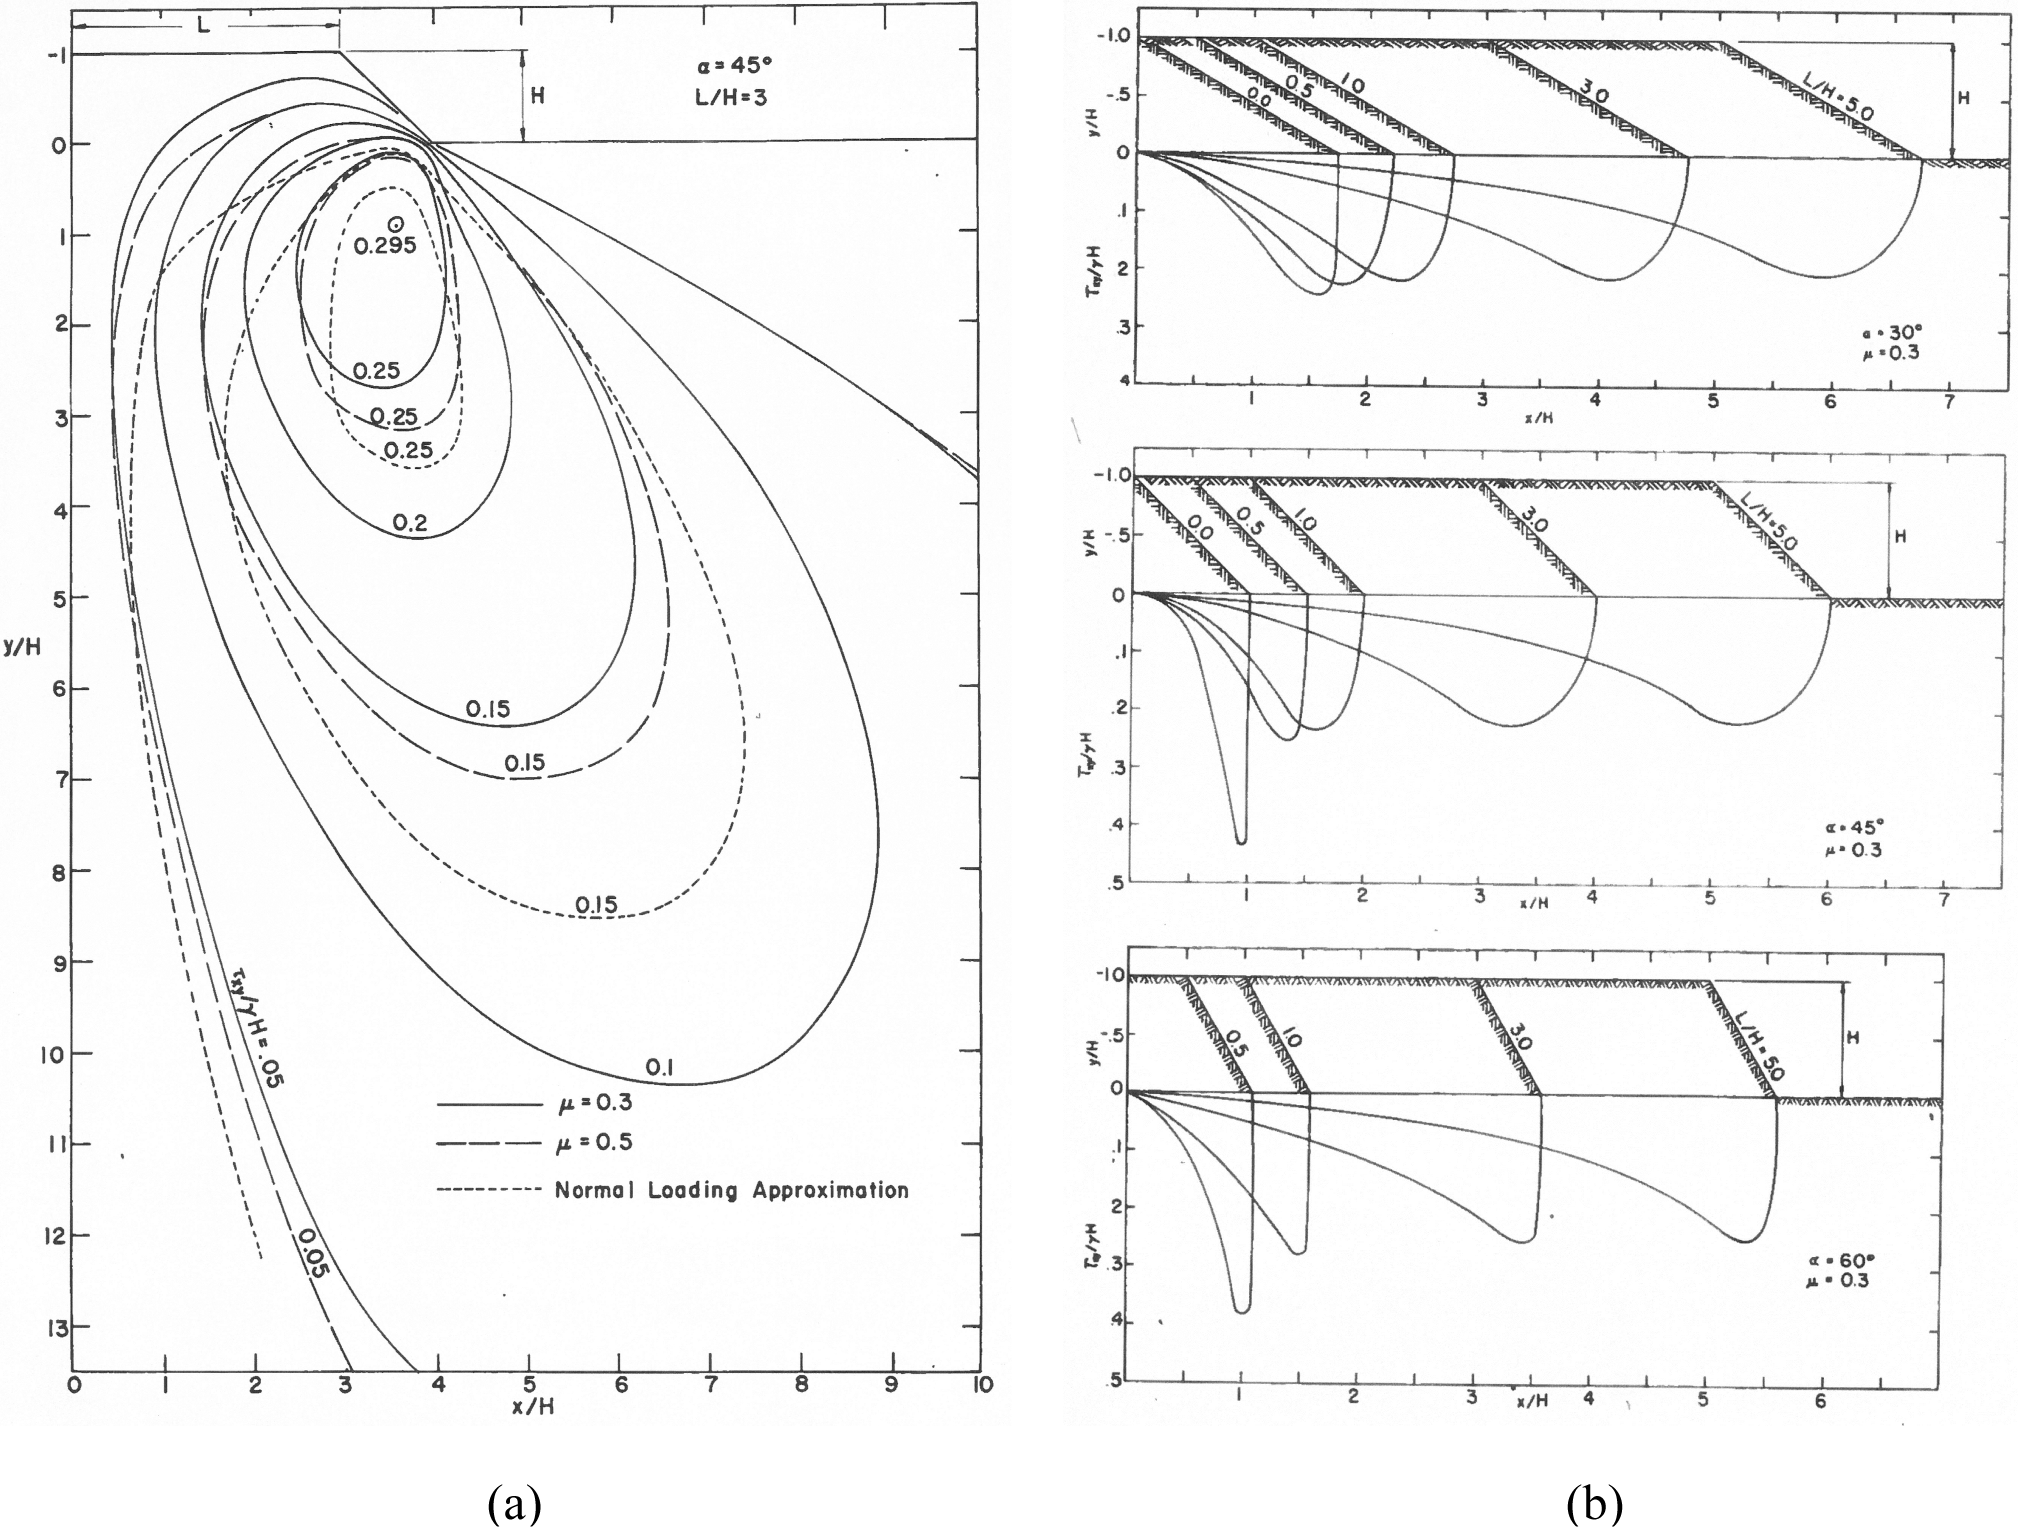
2.5.1. Approximate and Elastic Approach

It has been recognized since the work of Rendulic [26] that due to the earth pressure force beneath the axis of the dike, some horizontal shear stresses develop in the base of the dike. The shear stress was approximately computed from an equation of horizontal equilibrium, formulated from the lateral earth pressure force (which is initially at rest, but later active).
Assuming linearly varying earth pressure and water forces with the dike height, the shear stress distribution was described by a quadratic function in [27] where the maximum shear stress is acting at the mid length of the dike slope. Using a more precise linear elastic theory ([28]), it turns out that the maximum shear stress occurs close to the dike toe (see Figure 6) where the shear resistance can be very small.

2.5.2. Asymmetric Loadings

Horizontal stresses and shear stresses along the base of the dyke are almost symmetrical under normal river level conditions. However, when the river-side water level rises in a flood, asymmetric lateral stress conditions arise. As a result, the river-side shear stress decreases and the land-side shear stress increases, due to the imposition of unbalanced lateral forces (Figure 7).

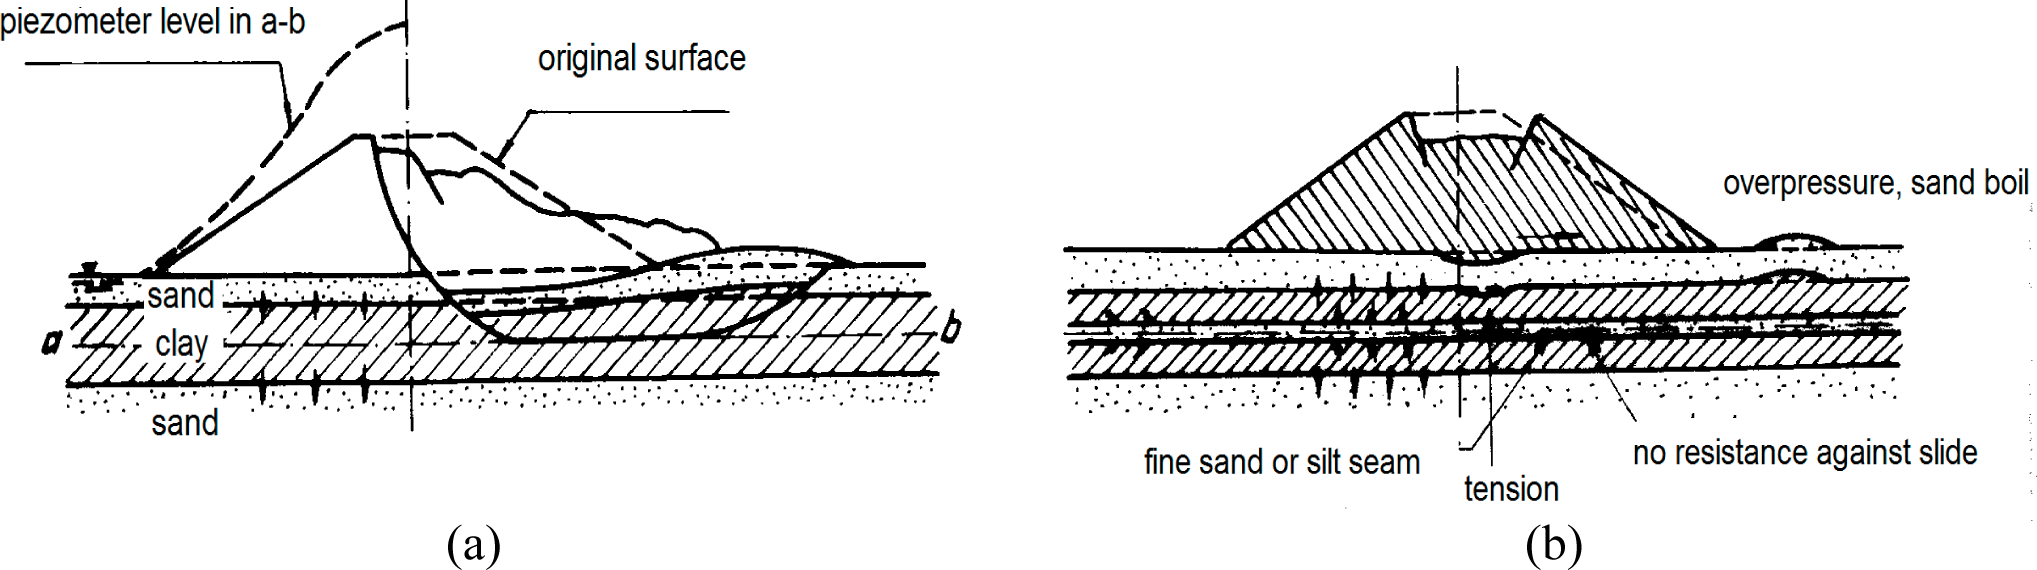
2.5.3. Dike Failures Due to Base Shear Stress

Although it is not directly related to the discussion of piping phenomena, it is important to note that the effects of shear stress in the base beneath a dike is also significant in other failure phenomena. Two reported situations are noteworthy [27,29]: the case of a soft clay or peat base and the case of an enclosed, thin silt or fine sand layer. In each case, shown in Figure 8, the shear conditions can be considered to be undrained and a sand boil can develop. In case of clay or peat (see e.g. [29]), it is well-recognized that the lateral displacements of the embankments may result in longitudinal cracking. In the case of a confined, thin silt or fine sand layer, they can even lead to complete failure [27].

2.5.4. Dynamic Effects Due to Poor Compaction

There are situations where poor compaction of the soil in the dyke itself can contribute to dynamic effects which in turn, can affect the stability of underlying soils ([3]). Such a situation is shown in Figure 9, where seepage flow through the dyke during a flood exploits voids in the compacted soil. Several phenomena may result. By flowing through saturated voids, where present, the seepage length is effectively shortened, thereby increasing the hydraulic gradient for water flowing through intact soil, leading to localized internal erosion. Localized saturation of the void walls can lead them to collapse. In other areas, where voids remain air-filled, water flow is interrupted. These irregularities in the flow conditions and soil restructuring can cause dynamic effects as a seepage front is established in a rising flood, and cause aberrations in the pore pressure conditions, which can affect the stress state in the dyke.

2.5.5. Dynamic Effects Due to the Friction Law

It is well known that the value of the static friction is larger than the dynamic friction, and that the friction law in experiments has a stick and slip nature. In rock mechanics, the phenomenon of sliding friction is understood in terms of the so-called rate- and state-dependent friction laws ([30]). These laws unify the results obtained from two types of rock experiments, being: the time dependence of static coefficient of friction; and the slip velocity dependence of the dynamic coefficient of friction. They show that the static friction increases with time (Figure 10a) and that the friction suddenly decreases with displacement (Figure 10b).
The properties of dynamic friction are the following: (i) the friction coefficient under stable sliding conditions with a constant load-point velocity depends on the logarithm of the load-point velocity; (ii) the magnitude of the instantaneous jump of the frictional coefficient depends on the change of the logarithm of the quotient of the corresponding load-point velocities; (iii) the evolution of the frictional coefficient to new value in stable sliding is also dependent on the instantaneous change of the load-point velocity; (iv) oscillation occurs in some cases (e.g., large load-point velocity, polished surfaces, thin sand interface layer between the samples [30]).
These phenomena have significance in situations where small but rapid movements allow transition from static to dynamic frictional resistance, as might occur if there is cracking within, or slippage beneath, a dike.

2.5.6. Summary of Significant Factors for Piping beneath Dikes

On the basis of the above discussions, a number of important factors can be identified which are potentially significant to the phenomenon of piping beneath Hungarian dikes.
The shear stress distribution in the base of the dike can be symmetric or asymmetric depending upon the water level on the river-side. In the normal water level condition, the distributions of the river-side and land-side shear stresses are approximately symmetric. During a flood, the river-side shear stress decreases and the land-side shear stress increases, due to the imposition of unbalanced lateral forces (Figure 8a).
The characteristic two-layer condition (Figure 1), in which a low permeability, unsaturated cover overlies a saturated, high permeability base material, is a particular feature of soils underlying dikes in Hungary. As a consequence, a larger pore water pressure can be sustained in the lower layer, and the shear strength at the dike base will decrease more significantly than in the homogeneous case.
The shear strength of the subsoil is also dependent on its relative density. Very loose deposits may occur in abandoned old meanders and these are encountered when crossed by the present-day river channel.
Excessive shear stress increase can cause sudden spreading displacements at the base of the dike due to the stick and slip nature of the frictional law. The dike may crack, even due to slight spreading. The water-front effect of seepage may have dynamic effects also and these could be exacerbated by a sudden decrease in the frictional coefficient due to sudden strains (movements) of the duke.
The liquefaction resistance decreases with decreasing relative density and confining pressure, and it decreases dramatically with increasing initial shear stress level. At high initial shear stress levels, the initiation of liquefaction is observed to result from increases in shear stress under undrained conditions of only a few percent of the initial shear stress [17,18]. The initiation of static or dynamic liquefaction is indicated by the sand boil and pipe development which may lead to erosion.

3. Data from Sites Where Piping Has Occurred

The foregoing discussions demonstrate how complex the failure mechanisms of river dikes can be. To better understand which factors are critical for dike stability, it is necessary to first understand the susceptibility of the different soils involved to the identified adverse conditions.
Galli [7] noted that dikes with piping issues seem to occur at sites which display a particular stratification consisting of a cover layer of fine sand or silt over a more permeable layer. This observation was described and validated in the previous work [12] by demonstrating that the cover layer was erodible, according to the criterion of Lőrincz [13]. This previous validation is reiterated for two typical piping sites in the next section, and then further validated by the consideration of some new data on soils that have been washed out during piping events, in the section that follows.

3.1. The Two-Layer System Properties

Piping of the slow type (the first category in section 1) was observed at several locations along the Danube River during the flood period of 1965. Piping took place in soil layers which covered sandy gravel beds. Soil layers below the dike were explored at two piping sites: at Dunakiliti and Dunafalva. These data are summarized in Table 1. At Dunakiliti, strata comprised a 0.5 m thick silt layer and a 0.5 m thick “Mo” layer, which is a non-plastic fine sand or “sand flour”). These were underlain by a sandy gravel layer. At Dunafalva, strata comprised a sequence of Mo, silt, Mo and fine sand layers with thicknesses of 0.6, 0.9, 1.3, 0.2 m, respectively, above the sandy gravel bed. Grading curves are shown in Figure 11 and entropy values are given in Table 2.
The Dunakiliti and Dunafalva cases both involve finer, unstable cover layers over more permeable generally stable layers, which led to arrangements that were prone to piping. Soils in the Dunakiliti cover layers and the Dunafalva cover layers have very similar distribution curves and they are unstable (erodible). Similarly, below these erodible soils, much coarser and more permeable soils are encountered in the river bed: the Dunakiliti deeper layer (below 1.5 m) and the Dunafalva deeper layer (below 3.0 m) are also very similar to each other, and very different from the surface layers. The base layers are generally stable with a few exceptions.

3.2. Washed Out Soil Data

The above data is augmented by more recent data for the washed-out soil materials, sampled from sites of piping events at Bölcske on the Danube river, and at Tiszasas and the Tisza right bank on the Tisza river [12]. Typical grading curves for these soils are shown in Figures 12 and 13.
From the grading curves, the washed out materials are classified as fine sands or silty sands, similar to the category of “Mo” (sand flour) in terms of the previous Hungarian Standard MSZ 14045/4-69 [31], which is a soil at the boundary between fine sand and coarse silt (from 0.02–0.1 mm). The ejected soils are basically identical to the unstable cover layer soils identified in the previous section. They have neither much cohesion nor a very large friction angle but the grains are incompressible, allowing the development of large pore water pressures upon shear loading when these soils have relatively low density values.
Figure 13 shows grading curves for the washed-out soils listed in Table A-1, with the liquefaction criteria of Tsuchida [21] superimposed. From the Tsuchida criteria, these soils are assessed to be prone to liquefaction. Further, when the entropy values for these soils are plotted on the entropy diagram showing the grading entropy criterion for soil structure stability, in Figure 14, they are shown in most cases to have an unstable structure. The finding that these soils simultaneously satisfy both piping and liquefaction criteria suggests that the piping and liquefaction can be related.
The grain size distribution curve of washed out soils (Figure 13) in each case is similar to the grading curves of the natural soils occurring in the cover layer soils encountered in the boreholes at the piping sites (Figures 11 and 12). These cover soils (silty sand and fine sand) have no cohesion, d10 values (the size for which 10% of grains are finer) within two orders of magnitude of each other and a small uniformity coefficient (coefficient of uniformity Cu < 5 in half of the cases).
Based on the results of the entropy calculations, and the position of the wash-out soils (see Appendix A) in Figure 14, with the exception of three soils that appear stable, the washed-out soils are prone to piping and are more likely to “boil” than suffose. The grading curves of the soils washed out are basically the same as those in the cover layer, and both the cover layer soils (average values; Table 2) and the wash-out soils plot amongst each other on the entropy diagram, supporting the conclusion that the cover layer is being washed out. The base layers are generally stable with a few exceptions, which were not investigated in the frame of this additional research.

4. Discussion

4.1. The Entropy Principle Applied to Soil Mechanics

The concept of grading entropy has a direct relationship to the classical entropy principle. The grading entropy of a soil, S, is a statistical entropy measure, based on two cell systems, and expressed in terms of two values: the base entropy, So, and the entropy increment, ΔS.
The So, weighted mean of the fraction entropies, is monotonically and uniquely related to the mean grain size: an increase in the mean grain diameter cause an increase in the base entropy So. The entropy increment ΔS is a measure of the disorder of the grain system, which originates from the mixing of the fractions.
The entropy principle of classical thermodynamics can be related to the directional properties of natural or spontaneous processes [32]. The second law of thermodynamics states that in any closed system, the entropy remains constant or increases in the ongoing processes. If the system is considered together with its environment, then the united system can be approximated as a closed system, and the total entropy increase principle holds, in this sense, for all of the processes in nature. Hence, the spontaneous natural process of breakdown of rocks to form particulate soils is consistent with the broader thermodynamic understanding of entropy
The application of grading entropy to describe breakage in rock particles was explored in [15]. It was shown that there is a general increase in the grading entropy (there is a monotonic increase in the entropy increment ΔS and a decrease in the base entropy So, due to the decrease in the mean grain diameter) during particle breakage (Figure 15a), as expected. It has been further shown that the grading entropy decreases when particles aggregate or agglomerate to form larger particles (Figure 15b), such as occurs in artificially facilitated processes such as lime modification of clayey soils.

4.2. The Entropy Based Internal Stability Rule

The entropy-based rule for particle migration differs from other piping rules in that it involves the whole of the grading curve data (in two values which plot on a simple diagram) instead of some limited number of grading curve points. It can be implemented numerically, without any constraint on the shape of the grading curve. At the same time, it is extremely simple to implement and it has a meaningful physical interpretation.
The relative base entropy A measures where the mean grain diameter is situated within the range of the particle diameters. It has a one-to-one relationship with the mean grain diameter and normalized grain diameter, and in this way, it can be thought of as an abstract, mean or mean normalized fraction number. It can be considered as a measure of internal stability by the simple fact that if enough large grains are available (A is equal to or larger than 2/3, the mean fraction number is close enough to the maximum fraction number), then large grains may form a skeleton.

4.3. The Mechanism of Piping

It is known from the theory of uniform filters [13,33] that the geometric condition of the formation of a channel for particle migration within the grain structure is that soil should have at least five fractions and at least three neighboring fractions are missing. This condition is clearly not met for the soils considered here, and therefore, the failures are not related to suffosion, but rather they reflect an internal erosion phenomenon: true piping. Terzaghi and Peck ([34]) showed that backwards erosion may start if points of zero effective stress occur in granular soils close to the toe. They suggested a critical hydraulic gradient of 0.8–1, however, smaller gradients may cause piping [5,24,25].
The shear stress at the base of a symmetrically loaded dike occurs almost beneath the toes. The rapid rise in water level during a flood causes an asymmetric increase in the horizontal base shear stress in the foundation of the dike, with maximum shear stress occurring at a point close to the land-side toe. At the same time, an increase in the excess pore water pressure and a decrease in the shear resistance of the base occur.
Local densification of the soils due the increasing level of shear stress (i.e., the increased shear stresses and the decreased shear resistance) occurs if the cover layer is looser than the critical density, and this may lead to micro cavities and micro channels forming through densification. The idea of small diameter pipe formation is supported by the experiments of Florida University [11] where it was revealed that pipes form as many small tubes (with a size in the range of the mean particle diameter) rather as a single, big pipe. A similar process is visualized in Figure 3.
In addition, local liquefaction may be caused by the shear waves produced by cracking of the dam body if shear strains become too large, or by other dynamic effects like the movement of the wetting front, the up-throw of the cover layer, or the dynamic effect when static friction resistance is overcome. (It is well known that the friction law in experiments has a stick and slip nature). This liquefaction allows any segregated water to rise upward, through the cover layer, to form a sand boil, which establishes a mechanism for soil ejection.
Sand boil formation in the large-scale Dutch experiments is always present [8-10]. The sand used in those experiments is similar in gradation to the cover sand layer occurring below the dikes at the piping sites in Hungary, which is erodible and prone to liquefaction. The pipe development in the large-scale experiments does not take place across the entire dike.
In regard to liquefaction, it is well-known that the liquefaction resistance decreases with decreasing relative density and confining pressure, and it decreases dramatically with increasing initial shear stress level. At high initial shear stress levels, the initiation of liquefaction is observed to result from increases in shear stress under undrained conditions of only a few percent of the initial shear stress [17,18]. These conditions are found close to the dike toe.
The possibility of liquefaction associated with piping in Hungarian river dikes during flood events was hypothesized in [13] but was not previously linked with the spreading and with the cracking of the dike. It can be noted that a non-earthquake induced liquefaction is mentioned in the case of the Aznalcóllar tailing dam failure, where the probable cause was identified as cracking and the fall of a block of embankment soil into the tailings [3538].

5. Conclusions

5.1. The Role of the Shear Stress Level in Piping

Since the work of Rendulic [26], it has been assumed that the shear stress in the dike base follows a quadratic function where the maximum shear stress acts at the mid length of the dike slope. Using a more precise linear elastic theory [28], it turns out that the maximum shear stress acts close to the dike toe. The increasing water level causes increase in the base shear stress and decrease in the base shear resistance at the land-side, close to the toe. If the soil density is less than the critical value, local densification may occur which may result in small voids or micro tubes.
The two sides of dike may move apart slightly if shear strains become too large, with sudden cracking at the axis of the dike due to the change from a state of static to dynamic frictional resistance. Local liquefaction may be caused by the shear waves produced by cracking of the dam body. This liquefaction allows any segregated water to rise upward, through the cover layer, to form a sand boil, which establishes a mechanism for soil ejection.
It is known that the liquefaction resistance decreases with decreasing relative density and confining pressure, and it decreases dramatically with increasing initial shear stress level. At high initial shear stress levels (which is the case close to the toe), the initiation of liquefaction is observed if the shear stress is increased under undrained conditions by only a few percent of the initial shear stress [17,18]. The liquefaction may cause sand boils, which initiate soil erosion and pipe development, which exploits the existing micro pipes.

5.2. The Properties of the Two Layer System

The special two-layer base arrangement of the dikes in Hungary (small permeability, unsaturated cover-layer, over a higher permeability, saturated base material) has the following properties: (i) it may result in a large upward hydraulic gradient and exacerbated pore water pressures at the land-side toe, (ii) the cover layer is prone to both piping and liquefaction, (iii) the base layer is generally stable.
The new data show that the soils ejected from the sand boils are generally silty sands and sands, prone to both erosion (on the basis of the entropy criterion) and liquefaction (on the basis of the criteria of [2123]). They originated from the cover layer, which is basically identical to the soil used in the Dutch backward erosion experiments. The base layers are generally stable.

5.3. Piping Process

The piping phenomena occurring in Hungary are complex, and are related to the unstable granular structure, the liquefaction susceptibility and the low relative density of the cover soils; the location of an increasing maximum shear stress level at the toe; a decreasing shear resistance at the toe; and possibly, to some dynamic effects like cracking of the dike.
Three phases are identified preceding failure: in the first phase, some micro-pipes are formed; in the second phase, elementary small boils are formed, with erosion of some small grains due to some liquefaction effects; then, a concentrated water spout or geyser appears which ejects the larger grains and forms a crater, around which the detached soil is deposited. If not mitigated at this point, the erosion may develop further, leading to failure.
If the relative density of the cover layer is relatively high, then liquefaction is encountered in the vicinity of the downhill toe only. It can be hypothesized that liquefaction may occur across nearly the whole cross-section and it may cause immediate failure, if the relative density, and hence the shear resistance, of the dike base is relatively very low (which is the case when dikes cross old meanders). Many aspects of the work, like the stratigraphic features of each site and the role of infilled palaeochannels in the piping phenomenon, require additional research.

Appendix A

Table A-1. Statistical size data for some of the washed-out soils.
YearRiver, bankd10CU1Soil
11998Tisza jp.0,083,25Fine sand
21998Tisza jp.0,0258,4Silty sand
31998Tisza jp.0,0364,6Silty sand
42006Duna right bank12+1500,007117,8Silty sand
52006Duna right bank41+2060,00713,9Silty sand
62006Duna right bank41+2060,0412,4Sand
72006Duna right bank41+2060,0264,3Sand
82006Duna right bank41+2060,00615,2Silty sand
92006Duna right bank79+4200,0266,5Silty sand
102006Duna right bank79+4200,01610,8Silty sand
112006Tisza right bank61+0750,0562,1Fine sand
122006Tisza right bank71+3000,0493,5Silty sand
132006Tisza left bank13+2500,1062,2Fine sand
142006Tisza left bank13+5800,0732,3Fine sand
152006Tisza left bank13+5800,0512,6Fine sand
162010Sajó left bank6+2660,00712,6Silty sand
172010Tisza, Millér0,0076,1Silty sand
182010Tisza, Millér0,00835,9Silty sand
192010Tisza, Tiszakürt0,172,2Sand
202010Tisza, Tiszakürt0,132,3Sand
1Uniformity coefficient.

Acknowledgments

This paper is the result of a research supported by the National Research Fund OTKA 1457/86 (“Complex Geotechical Investigations of River Dikes”) and the help of László Rétháti is greatly acknowledged. The support of the National Research Fund Jedlik Ányos NKFP B1 2006 08 was used (“Biodegradation Landfill Technology”).

Author Contributions

Emoke Imre and László Nagy designed research; all authors performed research; Emoke Imre, László Nagy and Stephen Fityus analyzed the data; Emoke Imre and Stephen Fityus wrote the paper. All authors have read and approved the final manuscript.

Conflicts of Interest

The authors declare no conflict of interest

References and Notes

  1. Nagy, L. The grading entropy of piping soils. Zbornik radova Gradevinskog fakukteta, Subotica 2011, 20, 33–46. [Google Scholar]
  2. Nagy, L. Buzgárból kimosott talaj szemeloszlása (in Hungarian). In Proceedings of the Mérnökgeológia Kőzetmechanika Konferencia 2011. In Mérnökgeológia-kőzetmechanika Kiskönyvtár 12; Török, Á., Vásárhelyi, B., Eds.; Magyar Mérnöki Kamara: Budapest, Hungary, 2011; ISBN 978-615-5086-04-5. pp. 105–112. [Google Scholar]
  3. Szepessy, J. Tunnel erosion and liquefaction of granular and plastic soils in river dikes. Vízügyi Közlemények 1983, 29, 23–35, in Hungarian. [Google Scholar]
  4. Imre, E.; Telekes, G. Seepage in river dikes, Proceedings of the 3rd International Conference on Unsaturated Soils, Recife, Brazil, 10–13 March 2002.
  5. Imre, E.; Rétháti, L. Complex Geotechnical Examination of River Dykes; 1991; FTV 86/86/XXIX OTKA Research Project. [Google Scholar]
  6. Imre, E. Characterization of dispersive and piping soils, Proceedings of the XI European Conference on Soil Mechanics and Foundation Engineering, Copenhagen, Denmark, 28 May–1 June 1995; pp. 49–55.
  7. Galli, L. Seepage phenomena along flood protection dams. Vízügyi Közlemények 1955, 37. [Google Scholar]
  8. Sellmeijer, H.; de la Cruz, J.L.; van Beek, V.M.; Knoeff, H. Fine-tuning of the backward erosion piping model through small-scale, medium-scale and IJkdijk experiments. Eur. J. Environ. Civil Eng. 2011, 15, 1139–1154. [Google Scholar]
  9. Erosion in Geomechanics Applied to Dams and Levees; Bonelli, S. (Ed.) Wiley-ISTE: London, UK, 2013.
  10. Van Beek, V.M.; Knoeff, H.; Sellmeijer, H. Observations on the process of backward erosion piping in small-, medium- and full-scale experiments. Eur. J. Environ. Civil Eng. 2011, 15, 1115–1137. [Google Scholar]
  11. Townsend, F.C.; Bloomquist, D.; Shiau, J-M.; Martinez, R.; Rubin, H. Evaluation of Filter Criteria and Thickness for Migrating Piping in Sands; Report for U.S. Bureau of Reclamation; Department of Civil Engineering, University of Florida: Gainesville, FL, USA, 1988. [Google Scholar]
  12. Imre, E.; Lőrincz, J.; Szendefy, J.; Trang, P.Q.; Nagy, L.; Singh, V.P.; Fityus, S. Case Studies and Benchmark Examples for the Use of Grading Entropy in Geotechnics. Entropy 2012, 14, 1079–1102. [Google Scholar]
  13. Lőrincz, J.; Imre, E.; Trang, P.Q.; Nagy, L.; Singh, V.P.; Fityus, S. The grading entropy-based criteria for structural stability of granular materials and filters. Entropy 2015. submitted for publication. [Google Scholar]
  14. Lőrincz, J. On particle migration with the help of grading entropy, Filters in Geotechnical and Hydraulic Engineering, Proceedings of the 1st International Conference “Geo-filter”, Karlsruhe, Germany, 20–22 October 1992; pp. 63–65.
  15. Lőrincz, J.; Imre, E.; Galos, M.; Trang, Q.P.; Rajkai, K.; Fityus, S.; Telekes, G. Grading Entropy Variation Due to Soil Crushing. Int. J. Geomechan. 2005, 5, 311–319. [Google Scholar]
  16. Imre, E.; Lörincz, J.; Trang, Q.P.; Fityus, S.; Pusztai, J.; Telekes, G.; Schanz, T. A general dry density law for sands. KSCE J. Civil Eng. 2009, 13, 257–272. [Google Scholar]
  17. Kramer, S.L.; Seed, H.B. Initiation of soil liquefaction under static loading conditions. J. Geotech. Eng. 1988, 114, 412–430. [Google Scholar]
  18. Kramer, S.L. Geotechnical Earthquake Engineering; Prentice-Hall, Inc.: Upper Saddle River, NJ, USA, 1996; p. 653. [Google Scholar]
  19. Bezuijen, A.; Mastbergen, D.R. Liquefaction of a sand body constructed by means of hydraulic fill, Proceedings of the 12th International Conference on Soil Mechanics and Foundation Engineering, Rio de Janeiro, Brazil, 13–18 August 1989; pp. 891–894.
  20. Azam, S.; Rima, U.S. Oil sand tailings characterisation for centrifuge dewatering. Environ. Geotech. 2014, 1, 189–196. [Google Scholar]
  21. Tsuchida, H. Prediction and Countermeasure Against the Liquefaetion in Sand Deposits; Abstract of the Seminar in the Port and Harbor Research Institute: Yokohama, Japan, 1970; pp. 3.1–3.33, in Japanese. [Google Scholar]
  22. Smoltczyk, U. Geotechnical Engineering Handbook; Wiley-VCH: Weinheim, Germany, 2003; p. 650. [Google Scholar]
  23. Numata, A.; Mori, S. Limits in the gradation curves of liquefiable soils, Proceedings of the 3th World Conference on Earthquake Engineering, Vancouver, B.C., Canada, 1–6 August 2004.
  24. Brandl, H. Geosynthetis Applications for the Mitigation of Natural Disasters, Proceedings of the 9th International Conference on Geosynthetics (IGS), Guaruja, Brazil, 23–27 May 2010.
  25. Brandl, H. Geosynthetics applications for the mitigation of natural disasters and for environmental protection. Geosynth. Int. 2011, 18, 340–390. [Google Scholar]
  26. Rendulic, L. Der Erddruck im Straßen-und Brückenbau. In Forschungsarbeiten aus dem Straßenwesen, Band 10; Volks-und Reichsverlag: Berlin, Germany, 1938; in German. [Google Scholar]
  27. Kézdi, Á. Earth Works; Tankönyvkiadó: Budapest, Hungary, 1975; in Hungarian. [Google Scholar]
  28. Perloff, W.H.; Baladi, G.Y.; Harr, M.E. Stress Distribution within and under Long Elastic Embankments: Research Report; Purdue University: West Lafayette, IN, USA, 1967. [Google Scholar]
  29. Thorburn, S.; Beevers, C. Lateral displacements of low embankments on alluvium containing thin peat layers. ICE Proc 1981, 70, 277–292. [Google Scholar]
  30. Mitsui, N.; Van, P. Thermodynamic aspects of rock friction. Acta Geodaetica et Geophysica 2014, 49, 135–146. [Google Scholar]
  31. Hungarian Standard MSZ 14045/4-69. Geotechnical tests, classification and description of the group of rocks in soil mechanical point of view. Withdrawn in 1979
  32. Martinás, K. Entropy and information. World Futures 1997, 50, 483–493. [Google Scholar]
  33. Kézdi, Á. Phase Movements in Granular Soils; Notes of Budapest University of Technology and Economics, Graduate Courses: Budapest, Hungary, 1975; in Hungarian. [Google Scholar]
  34. Terzaghi, K.; Peck, R.B. Soil Mechanics in Engineering Practice, 1st ed.; Wiley: New York, NY, USA, 1948. [Google Scholar]
  35. Alonso, E.E.; Gens, A. Aznalcóllar dam failure. Part 1: Field observations and material properties. Géotechnique 2006, 56, 165–183. [Google Scholar] [Green Version]
  36. Gens, A.; Alonso, E.E. Aznalcóllar dam failure. Part 2: Stability conditions and failure mechanism. Géotechnique 2006, 56, 185–201. [Google Scholar] [Green Version]
  37. Alonso, E.E.; Gens, A. Aznalcóllar dam failure. Part 3: Dynamics of the motion. Géotechnique 2006, 56, 203–210. [Google Scholar] [Green Version]
  38. Zabala, F.; Alonso, E.E. Progressive failure of Aznalcóllar dam using the material point method. Géotechnique 2011, 61, 795–808. [Google Scholar]
Figure 1. Piping in two-layer system (a) and (b) slow piping: (a) Sand boil with sand transport, and crack due to localized collapse, and (b) the mitigation of slow piping by hydraulic surcharging on the land-side (after [7]). (c) Fast piping on thick and loose cover layer, deposited in an old meander with arching; this process also starts with a sand boil (adapted from [3]).
Entropy 17 02281f1
Figure 2. (a) The simplified normalized entropy diagram. (b) Internal stability criterion for a seven-fraction soil in a normalized diagram: _I_ piping, _II_ stable, _III_suffosion; the boundary line between II and III is approximate [13].
Entropy 17 02281f2
Figure 3. The possible sand boil formation mechanism. The volume collapse can be caused by several reasons, e.g. due to creep or due to shear level increment, causing local densification of the soil.
Entropy 17 02281f3
Figure 4. The liquefaction criteria of Tsuchida (a) for soils with small uniformity coefficient and (b) soils with large uniformity coefficient.
Entropy 17 02281f4
Figure 5. Piping by backward erosion: model test results. The first phase with increasing flood and time: (a) Typical dike; (b) Phase 1: Seepage initiates; (c) Phase 2: Sand boil appears; (d)–(e) Phase 3: Backward erosion with channel widening; and (f) Phase 4: Failure (adapted from [810]).
Entropy 17 02281f5
Figure 6. Shear stress beneath a trapezoidal dike: (a) Contours of shear stress, τxy; (b) Distributions of shear stress, τxy/γH on the base of the embankment for varying slope and L/H ratios (from [28]).
Entropy 17 02281f6
Figure 7. The loads on a dike during a flood. The river-side shear stress decreases and the landside shear stress increases due to the horizontal force arising from the flood water (adapted from [3]).
Entropy 17 02281f7
Figure 8. The spreading type failures: (a) in the case of a soft clay layer, and; (b) in the case of a thin silt or fine sand layer (after [27]).
Entropy 17 02281f8
Figure 9. The seepage may involve dynamic effects, as water front moves around entrapped air arising from improper compaction, see e.g. [3,4].
Entropy 17 02281f9
Figure 10. The shear strain increment may involve dynamic effects, as the friction coefficient changes. (a) Static friction increases with time. (b) The friction suddenly decreases with displacement.
Entropy 17 02281f10
Figure 11. Grading curves for the Danube dike case studies. The numbers represent borehole numbers and depths with reference to Table 1. (a) Dunakiliti soils. (b) Dunafalva soils.
Entropy 17 02281f11
Figure 12. Washed-out materials from piping sites [12]. (a) Grading curves for a Danube site (Bölcske). (b) Grading curves for two Tisza sites (Tiszasas, Tisza right bank).
Entropy 17 02281f12
Figure 13. The grading curves of the washed-out soils with the linear part of the liquefaction criterion of Tsuchida (a) for large uniformity coefficient and (b) for small uniformity coefficient.
Entropy 17 02281f13
Figure 14. Comparison of the washed-out soils with the cover layer and base layer soils in the entropy diagram.
Entropy 17 02281f14
Figure 15. The entropy paths for (a) breakage (spontaneous) and (b) agglomeration (lime modification; artificial).
Entropy 17 02281f15
Table 1. Definitions of fractions and cells, where d0 is the elementary cell width.
Fraction j12324
Limitsd0 to 2 d0222 d0 to 223 d0223 d0 to 224 d0
Table 1. Stratification of Danube dike soils.
Stratification at Dunakiliti (borehole 997)Stratification at Dunafalva (borehole 993)
Soil typeLayer boundaries [m]Soil typeLayer boundaries [m]
silt0 to 0.5 mMo*0 to 0.6 m
Mo*0.5 to 1.0 mSilt0.6 to 1.3 m
sandy gravelbelow 1.0 mMo*1.3 m to 2.2 m
fine sand2.2 m to 3.0 m
sandy gravelbelow 3.0 m
*Mo refers to a fine sand soil (0.02 mm–0.1 mm), referred to as “sand flour” in previous Hungarian Standard MSZ 14045/4-69. It is a very frequent soil type in Hungary.
Table 2. Entropy data (average values) of soil layers beneath dikes at the Danube.
SiteLayerDepth [m]N [–]A [–]B [–]
DunakilitiCover–Mo0.590.501.19
DunakilitiCover–silt1.0150.450.92
DunakilitiPermeable Base1.5100.71 > 2/31.22
DunafalvaCover–Mo0.580.461.01
DunafalvaCover–silt1.080.381.34
DunafalvaCover–Mo1.590.591.05
DunafalvaCover–fine sand2.5100.561.01
DunafalvaPermeable Base3.0100.81 > 2/30.78

