1. Introduction
Depression has a clinical manifestation of low mood, anhedonia and low energy levels, cognitive impairment, sleep disorders, sexual dysfunction, and gastrointestinal diseases, amongst other symptoms [
1]. The combination of the primary and the secondary disabilities of chronic medical disease caused by depression makes it one of the most costly medical burdens in the world [
2]. Actually, WHO has predicted that depression will become the second leading cause of disability worldwide by the year 2030 [
3]. Therefore, the study of depression has received widespread attention from the whole world.
Depression involves the influence of psychological, genetic, social environment, culture, and physiology [
4]. Its etiology and pathogenesis are still unclear, and various mechanisms are still at the stage of hypothesis. Among them, the glutamate contained in the amino acid neurotransmitter hypothesis is considered to be related to the pathophysiological factors of depression [
5]. Glutamate is the major excitatory neurotransmitter in the mammalian central nervous system (CNS) [
6]. It is not only widely distributed in the CNS but also highly concentrated in the cerebral cortex, hippocampus, and striatum, in which brain regions are all closely associated with mental activity [
7]. Glutamate mediates its effects through interaction with ionic and metabotropic glutamate receptors. As a matter of fact, metabotropic glutamate receptors (mGluRs) are a family of 8 subtypes (mGluR1–mGluR8) that belong to the family of G-protein coupled receptors (GPCR) [
8]. Among all mGlu receptors, abnormal glutamatergic signaling of mGluR5 leads to a series of CNS-related diseases such as depression, schizophrenia, X-brittle syndrome, and Parkinson’s disease [
2]. Therefore, mGluR5 becomes an attractive therapeutic target.
Structurally, mGlu receptors consist of a large amino-terminal venus fly-trap (VFT) extracellular domain (encompassing the orthosteric site), a seven-transmembrane domain (7TMD), and a cysteine-rich domain (CRD) linking the two [
9]. Although several crystal structures of the VFT domain are usable for some mGluR subtypes, including mGluR1, mGluR5, mGluR3, and mGluR7, the orthosteric site has proven difficult to develop efficient subtype-selective ortho-ligands due to its highly conserved characteristic [
10]. As a result, efforts have been made to identify allosteric modulators that bind in the less conserved 7TMD [
10]. Compounds that bind to an allosteric site and do not itself activate the receptor but enhance the receptor response is called a positive allosteric modulator (PAM). Whereas, the compound that binds to allosteric sites and acts as a non-competitive antagonist is referred to as a negative allosteric modulator (NAM) [
11]. As NAMs of mGluR5 are potential drugs for the treatment of many psychiatric disorders [
8], including depression, the development of NAMs has become another fascinating area of drug research.
Based on the rapid development of molecular biology, chemical informatics, and computer science, drug development has entered a new era, and computer-aided drug design (CADD) came into being. CADD can greatly accelerate the development of new drugs and is more economical. It has, therefore, become more widely used in the pharmaceutical industry. In this study, we employed a set of CADD methods, including the establishment of a three-dimensional quantitative structure-activity relationship (3D-QSAR) model using both the comparative molecular field analysis (CoMFA) [
12] and comparative molecular similarity indices analysis (CoMSIA) [
13] methods for the study of a series of newly synthesized [
14,
15,
16] aryl benzamide NAMs of mGluR5. In addition, we also used molecular docking methods to verify the accuracy and stability of the 3D-QSAR model and then used molecular dynamics (MD) to complement the results of molecular docking. These two methods can help us better explore the possible binding conformation between antagonists and target proteins, and thus reveal the corresponding interaction mechanism. We hope that the developed 3D-QSAR model will provide theoretical guidance for the design and development of NAMs of mGluR5 as antidepressants.
2. Results
2.1. 3D-QSAR Statistical Analysis
To derive a reliable model, three alignment methods are adopted, namely, alignment-I, -II, and -III. The optimal results based on partial least squares (PLS) statistical analysis are shown in
Table 1.
In general,
> 0.50 [
17] is one of the best parameters to evaluate whether a good 3D-QSAR model is acceptable. According to statistical analysis results of PLS, in all CoMFA and CoMSIA models, both alignment-II and -III methods lead to statistically unacceptable models with
< 0.5, but alignment-I obtains a more significant statistical value (
= 0.47 and 0.70 for the optimal CoMFA and CoMSIA models, respectively). Therefore, only the optimal 3D-QSAR models obtained based on the alignment-I approach are analyzed further presently. As shown in
Table 1, the optimal CoMFA model established by using the steric and electrostatic field descriptors has a
value of 0.47, which does not meet the requirements, indicating relatively poor internal predictability. However, the optimal CoMSIA model that was constructed from space, electrostatic, hydrophobic, hydrogen bonding (H-bond) donor, and H-bond acceptor descriptors has a
value of 0.70, a high
value of 0.89, a high
value of 120.28, and a low
value of 0.22 with 10
, proving its good internal predictability. The relative contributions of steric, electrostatic, hydrophobic, H-bond donor, and H-bond acceptor fields are 14.0%, 29.1%, 34.5%, 2.5%, and 19.9%, respectively. Among them, the contribution of the hydrophobic field ranks first, indicating that the hydrophobic interaction plays a vital role in enhancing the inhibitory activity. In addition, a testing set composed of 24 compounds is used in this study to verify the robustness of the models. Generally speaking, the criterion of
and
indicates that the model has a good external prediction ability. While for the optimal CoMSIA model, it meets quite well this criterion with a high value of
and small difference of
(= 0.02), indicating its proper external prediction ability.
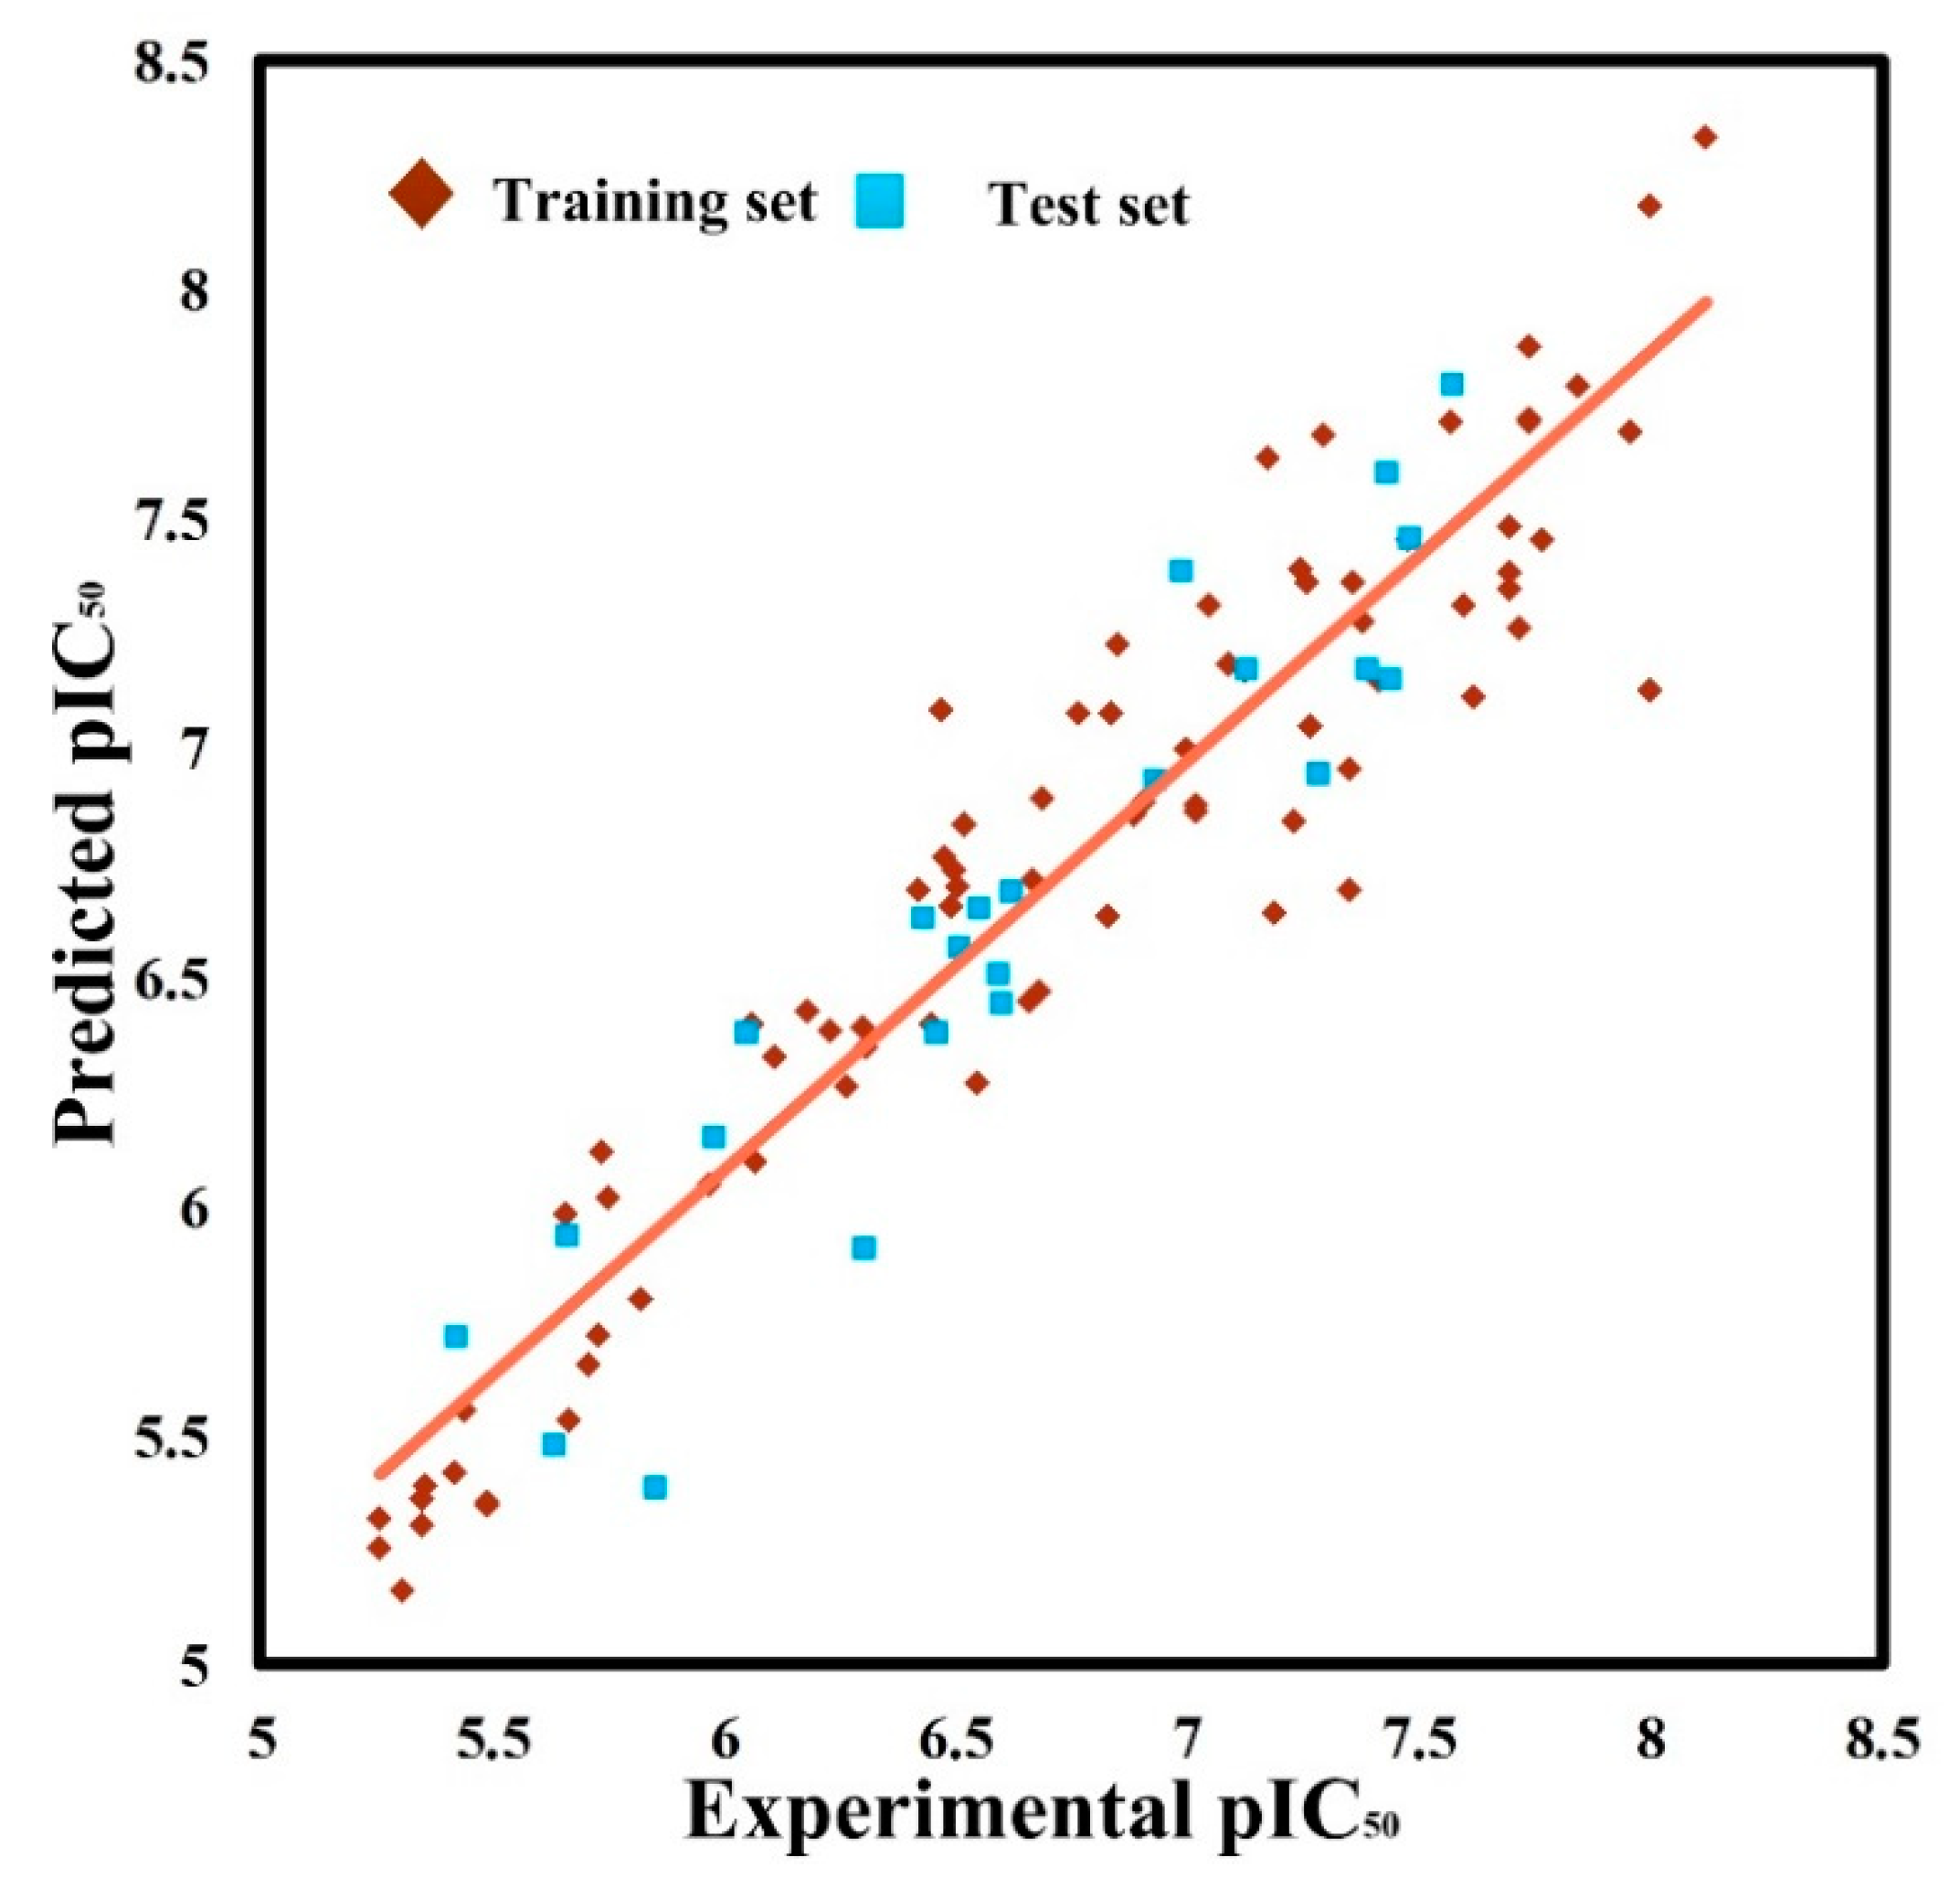
In summary, in alignment-I, the optimal CoMSIA model exhibits good internal and external prediction abilities. Its correlation with the entire dataset is given in the way of a scatterplot, as shown in
Figure 1. It can be seen that all data points are evenly distributed around the regression line, indicating a good correlation between predicted and experimental biological activity data (
).
2.2. CoMSIA Graphical Interpretation
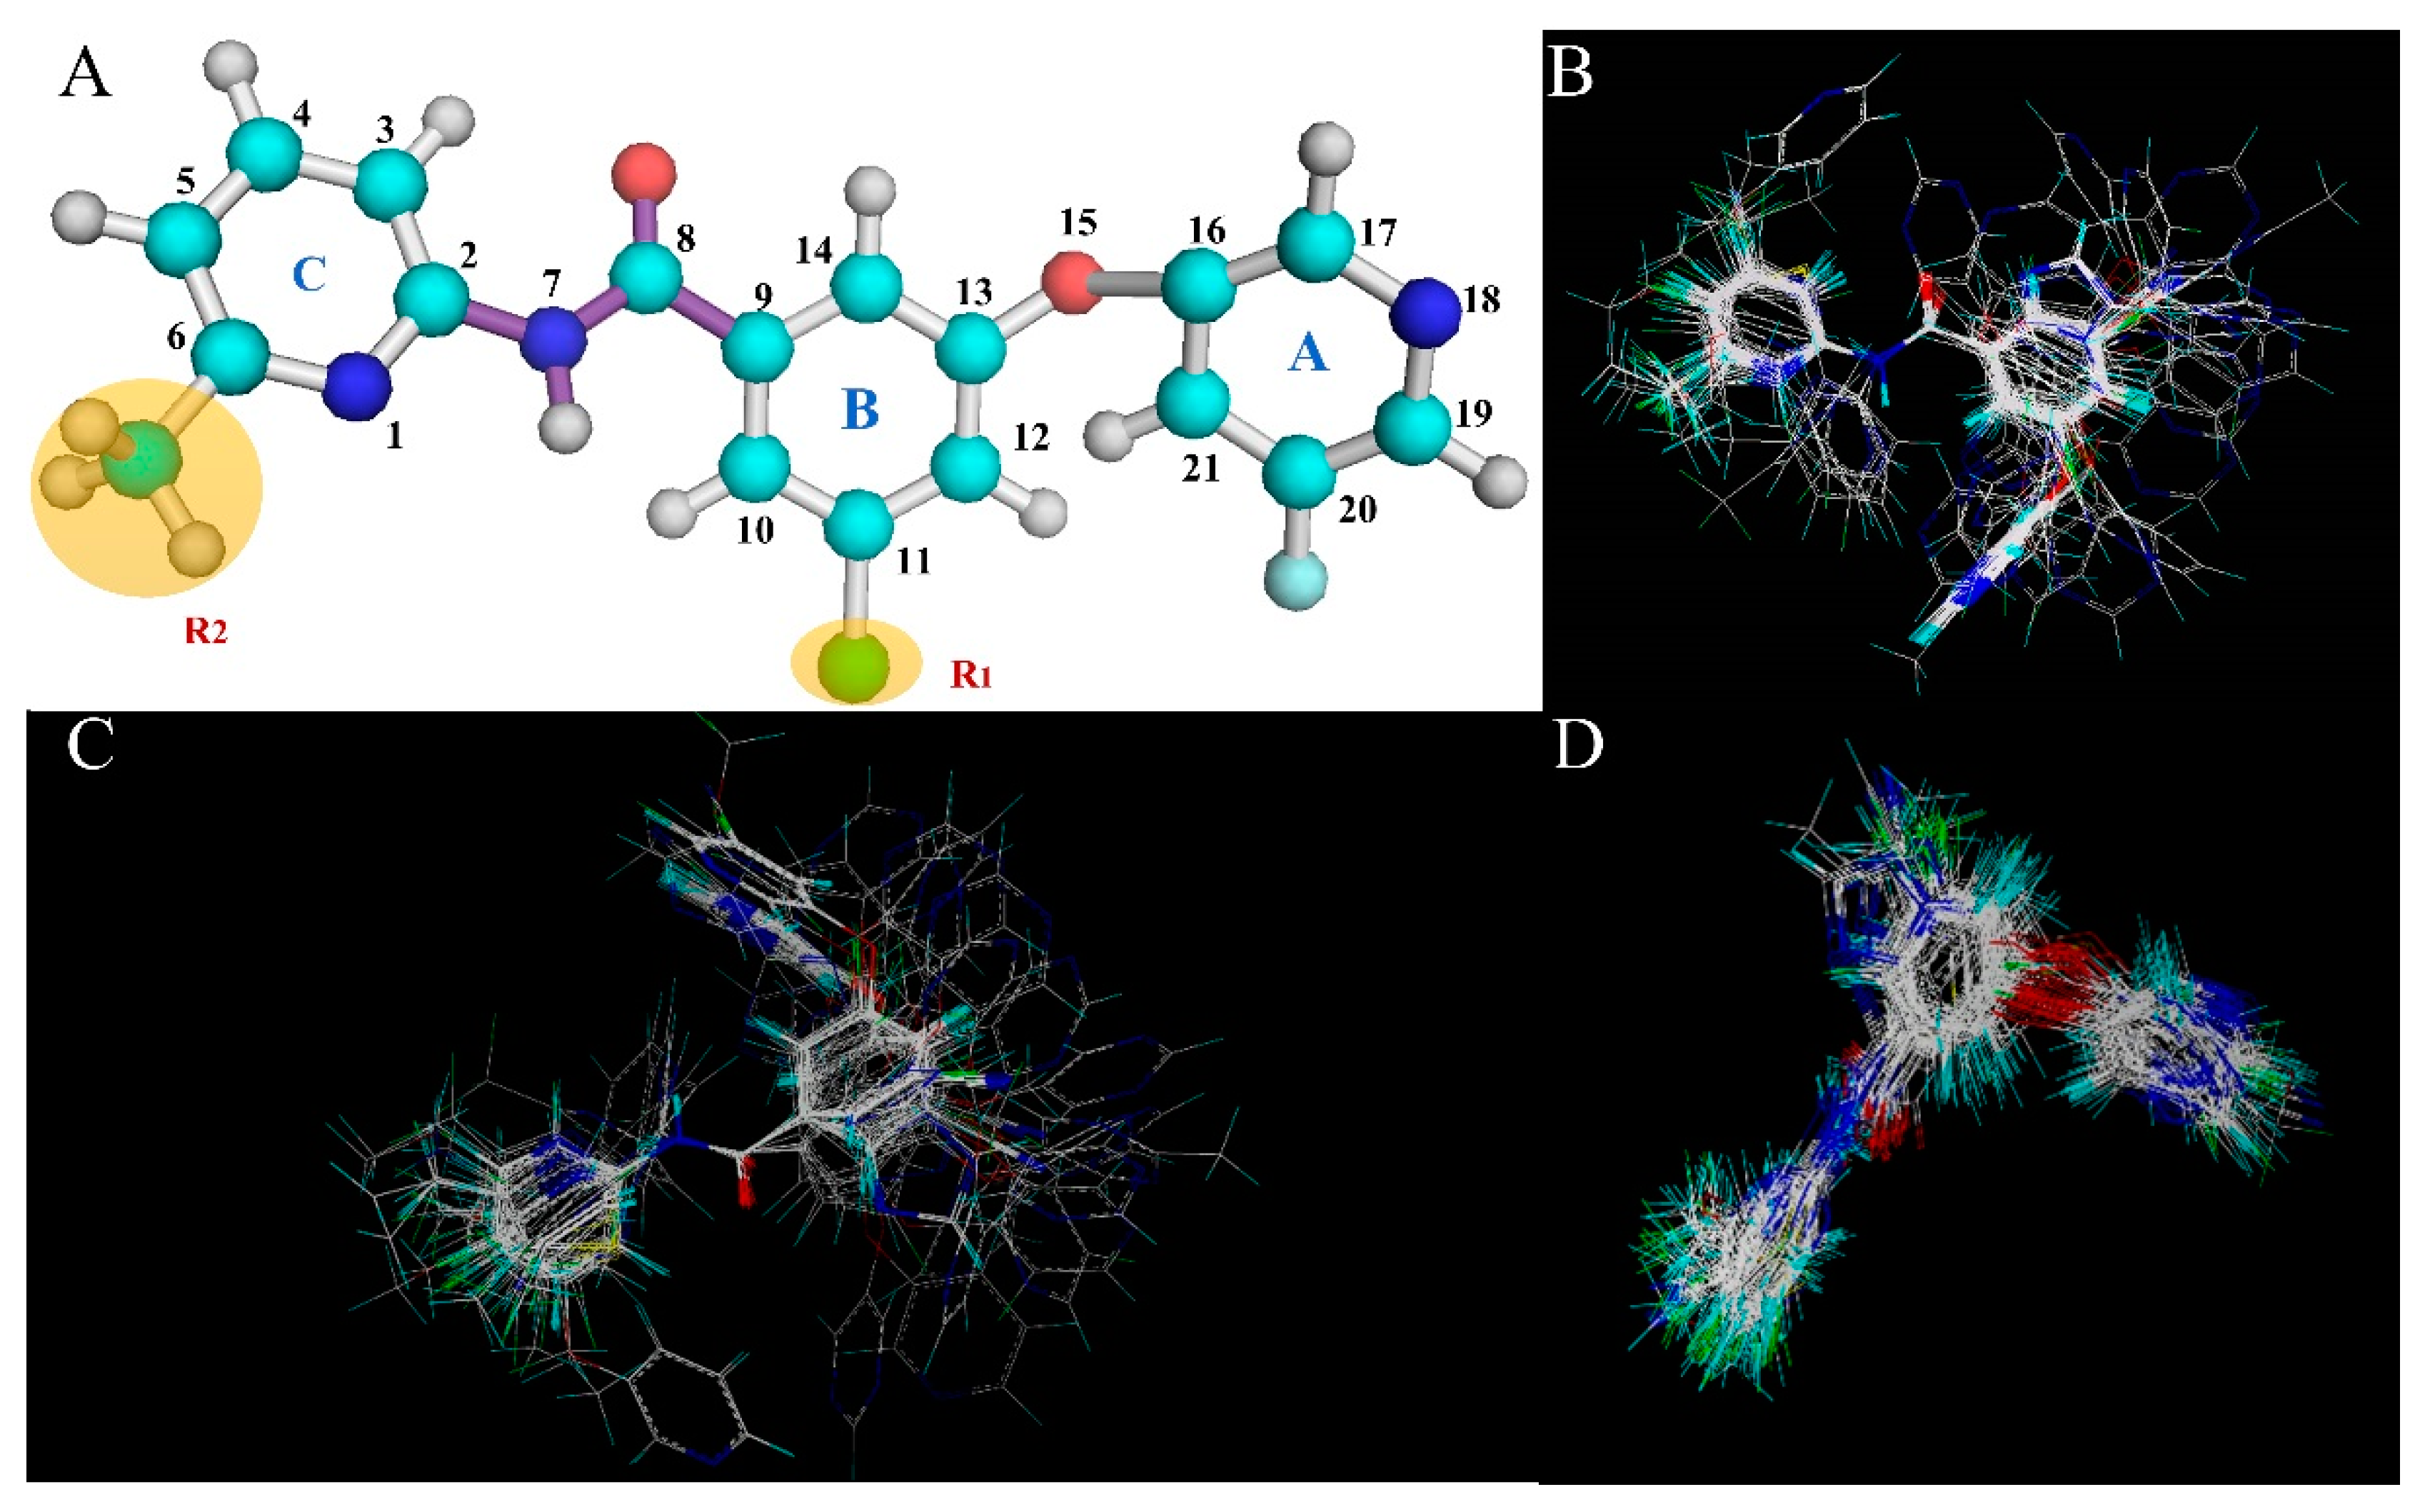
In this section, the optimal CoMSIA model is selected to construct the StDev*-Coeff contour maps for analysis of the field effects of the ligand molecules. To better illustrate and analyze the results of the Stdev*-Coeff contour maps, the most active molecule
74 from the entire dataset is superimposed with five fields (steric field, electrostatic field, hydrophobic field, H-bond donor field, H-bond acceptor field), as shown in
Figure 2.
Figure 2A shows the effect of the sterically hindered field on the molecular activity, where the green cloud indicates that the introduction of large substituents in this region will lead to the increase of the activity of the antagonist, which can be verified from the sample dataset in
Table S1 of Supplementary Material. For example, compounds
6 (
) and
8 (
) have similar structures. However, compound
6 has a greater steric hindrance than compound
8 on the substituent at position 20 of ring A, resulting in an increase in antagonistic activity. Further, the brownish-yellow cloud (20% contribution) indicates that the introduction of a sterically hindered group (i.e., a large substituent) in this region will decrease the antagonistic activity. For example, there is also a yellow cloud around ring C, which also shows that the addition of a substituent with a large steric hindrance will be detrimental to the antagonistic activity. As for molecules
41 (
) and
42 (
) as compound
42 has an extra fluorine group at position 4 of ring C than compound
41, the molecular activity is lowered.
Figure 2B depicts the influence of the electrostatic substituent on the potency of the molecules, where a positive charge group at the blue cloud (80% contribution) position or a negative charge group at the red cloud (20% contribution) position will facilitate the activity. As seen from the figure, the blue profile at the R2 substituent of ring C indicates that a positively charged group at that site shall facilitate the activity. This is consistent with the experimental results for a compound activity sequence of
35 (having fewer fluorine atoms on the R2 substituent) >
36. Whereas, a red profile is observed at positions 4 and 5 of ring C, which indicates the favor of negatively charged groups for improving the activity, for example, compound
40 with a Cl atom at position 5 (
) is more potent than compound
41 (
) with a methyl substituent in the same region. This can be explained by the existence of an electron-accepting F atom in the substituent at 4-position.
Regarding the equipotential map of the hydrophobic field (as shown in
Figure 2C), the white contours indicate the position where the hydrophilic group is favored, and the yellow outline indicates the region of the preferred hydrophobic group. From
Figure 2C, we find that there is a large yellow cloud around ring A, which means that the hydrophobic group in the vicinity is advantageous for antagonistic activity. This may explain why compound
29 (
) having more hydrophobic groups (
![Molecules 25 00406 i001]()
) at these regions exhibits higher mGluR5 antagonist activity than compound
94 (
). In addition, a large gray cloud at ring B reveals that the hydrophobic groups herein reduce the activity of the molecule. This is well illustrated by the higher activities of molecule
9 (
) (without any substituent) than molecule
10 (
) with a methyl group at the same position.
Figure 2D is an equipotential map of the hydrogen bond donor field for compound
74, where the cyan cloud represents the desired while the magenta cloud represents the undesired regions of the H-bond donor, respectively. A cyan cloud is observed covering the NH of the amide group, indicating that NH plays a significant role in donating H near ring C to form a H-bond interaction with NAMs. In addition, a large cyan cloud near ring C indicates that the presence of a hydrogen bond donor substituent will increase the antagonistic activity. This fits well with the experimental results that compound
42 (
) with a -CF
3 group at ring C is less active than compound
39 (
) without any group at the same position. Furthermore, almost no purple cloud is found in
Figure 2D, which means that unfavorable hydrogen bond donor interactions can be negligible.
Figure 2E is the equipotential map of the hydrogen bond acceptor field. The favorable and unfavorable regions of the H-bond acceptor substituent are respectively represented by the purple (80% contribution) and red (20% contribution) clouds. As seen from the figure, a purple cloud is observed below ring C, which is consistent with the N atom at the 1-position as the H-bond acceptor. In addition, a red cloud is observed near ring B suggesting that the introduction of an H-bond acceptor group in this area would adversely affect the molecule, which is in agreement with the fact that compound
23 is less potent than compound
25. The reason is that ring B of compound
23 has an F atom as a substituent, while the ring B of compound
25 has a methyl group as a substituent, respectively.
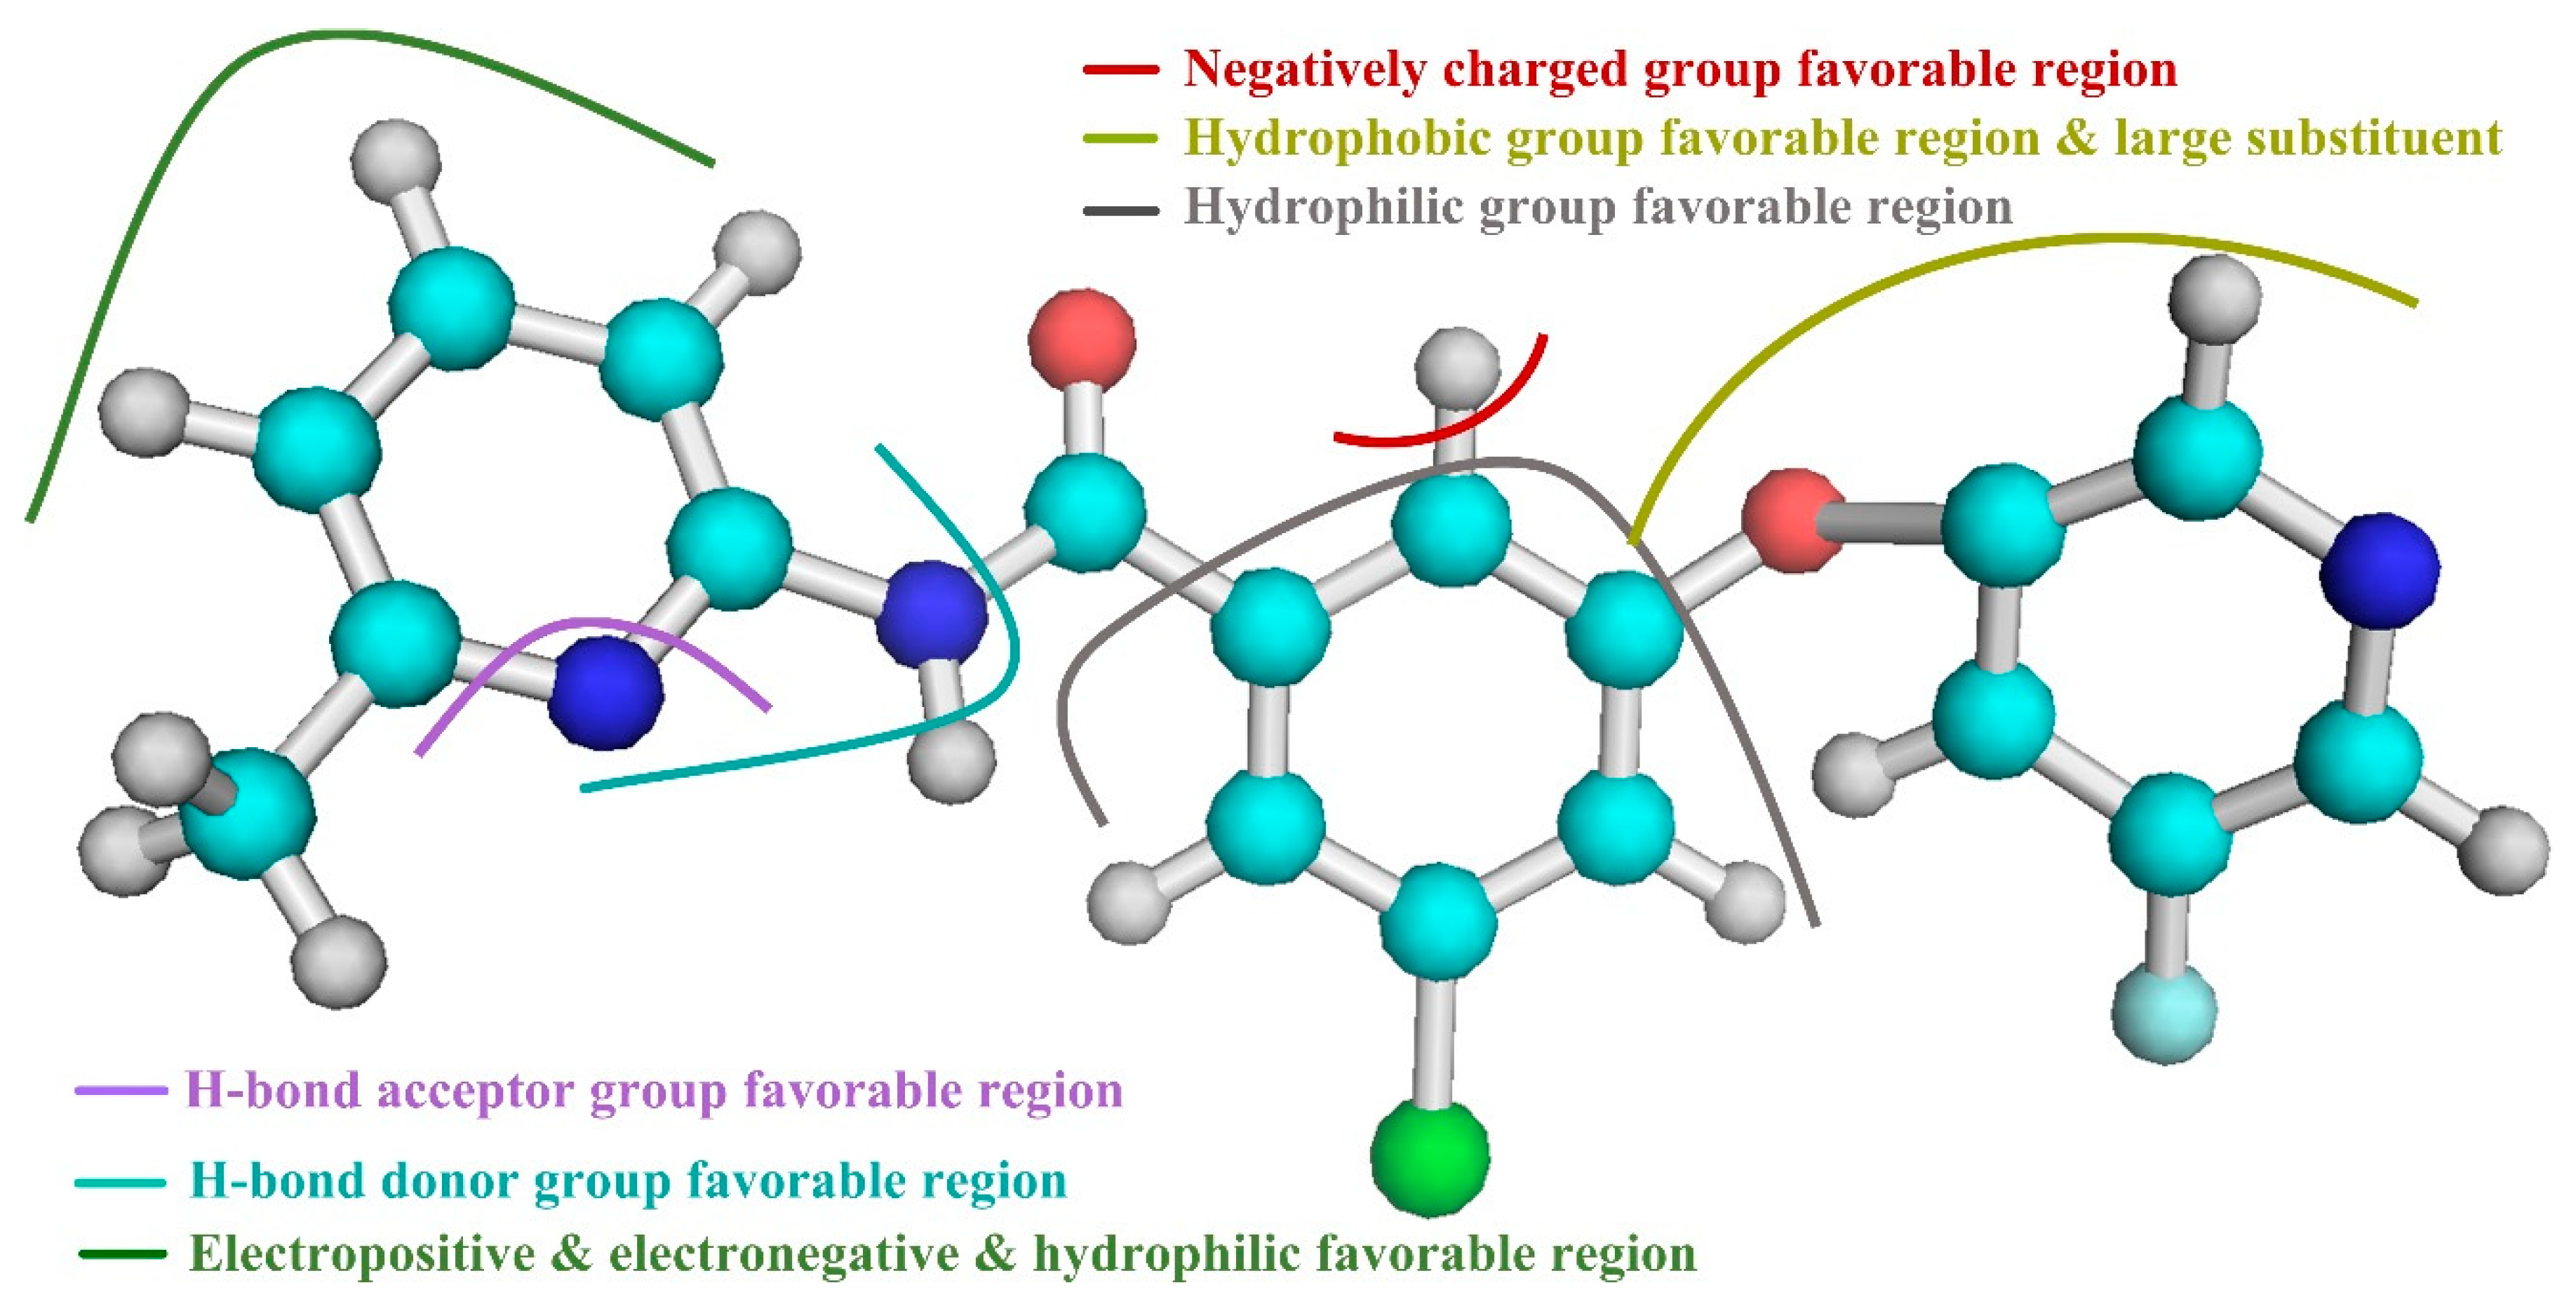
Based on the above results of the 3D-QSAR study, we are able to determine several of the structural requirements described above for observed inhibitory activity (as shown in
Figure 3):
(1) For ring A and the ether bond, the large sterically hindered group and the hydrophobic group contribute to the improvement of molecular activity.
(2) For ring B, away from the R1 substituent, the negatively charged group facilitates the increase in molecular activity. In addition, ring B is close to the R1 substituent, the hydrophilic group is beneficial to the improvement of molecular activity.
(3) For the portion of ring A away from the R2 substituent, and around the N atom of the molecular skeleton, the hydrogen bond donor group facilitates the improvement of molecular activity.
(4) For ring A near the R2 substituent, the portion adjacent to the molecular skeleton, the hydrogen bond acceptor group facilitates the improvement of molecular activity.
(5) For ring A, away from the R2 substituent and the molecular skeleton, the negatively charged group and the hydrophilic group contribute to the improvement of the molecular activity. In addition, ring A is close to the R2 substituent, the positively charged group is advantageous for the improvement of molecular activity away from the molecular skeleton.
2.3. Molecular Docking Studies
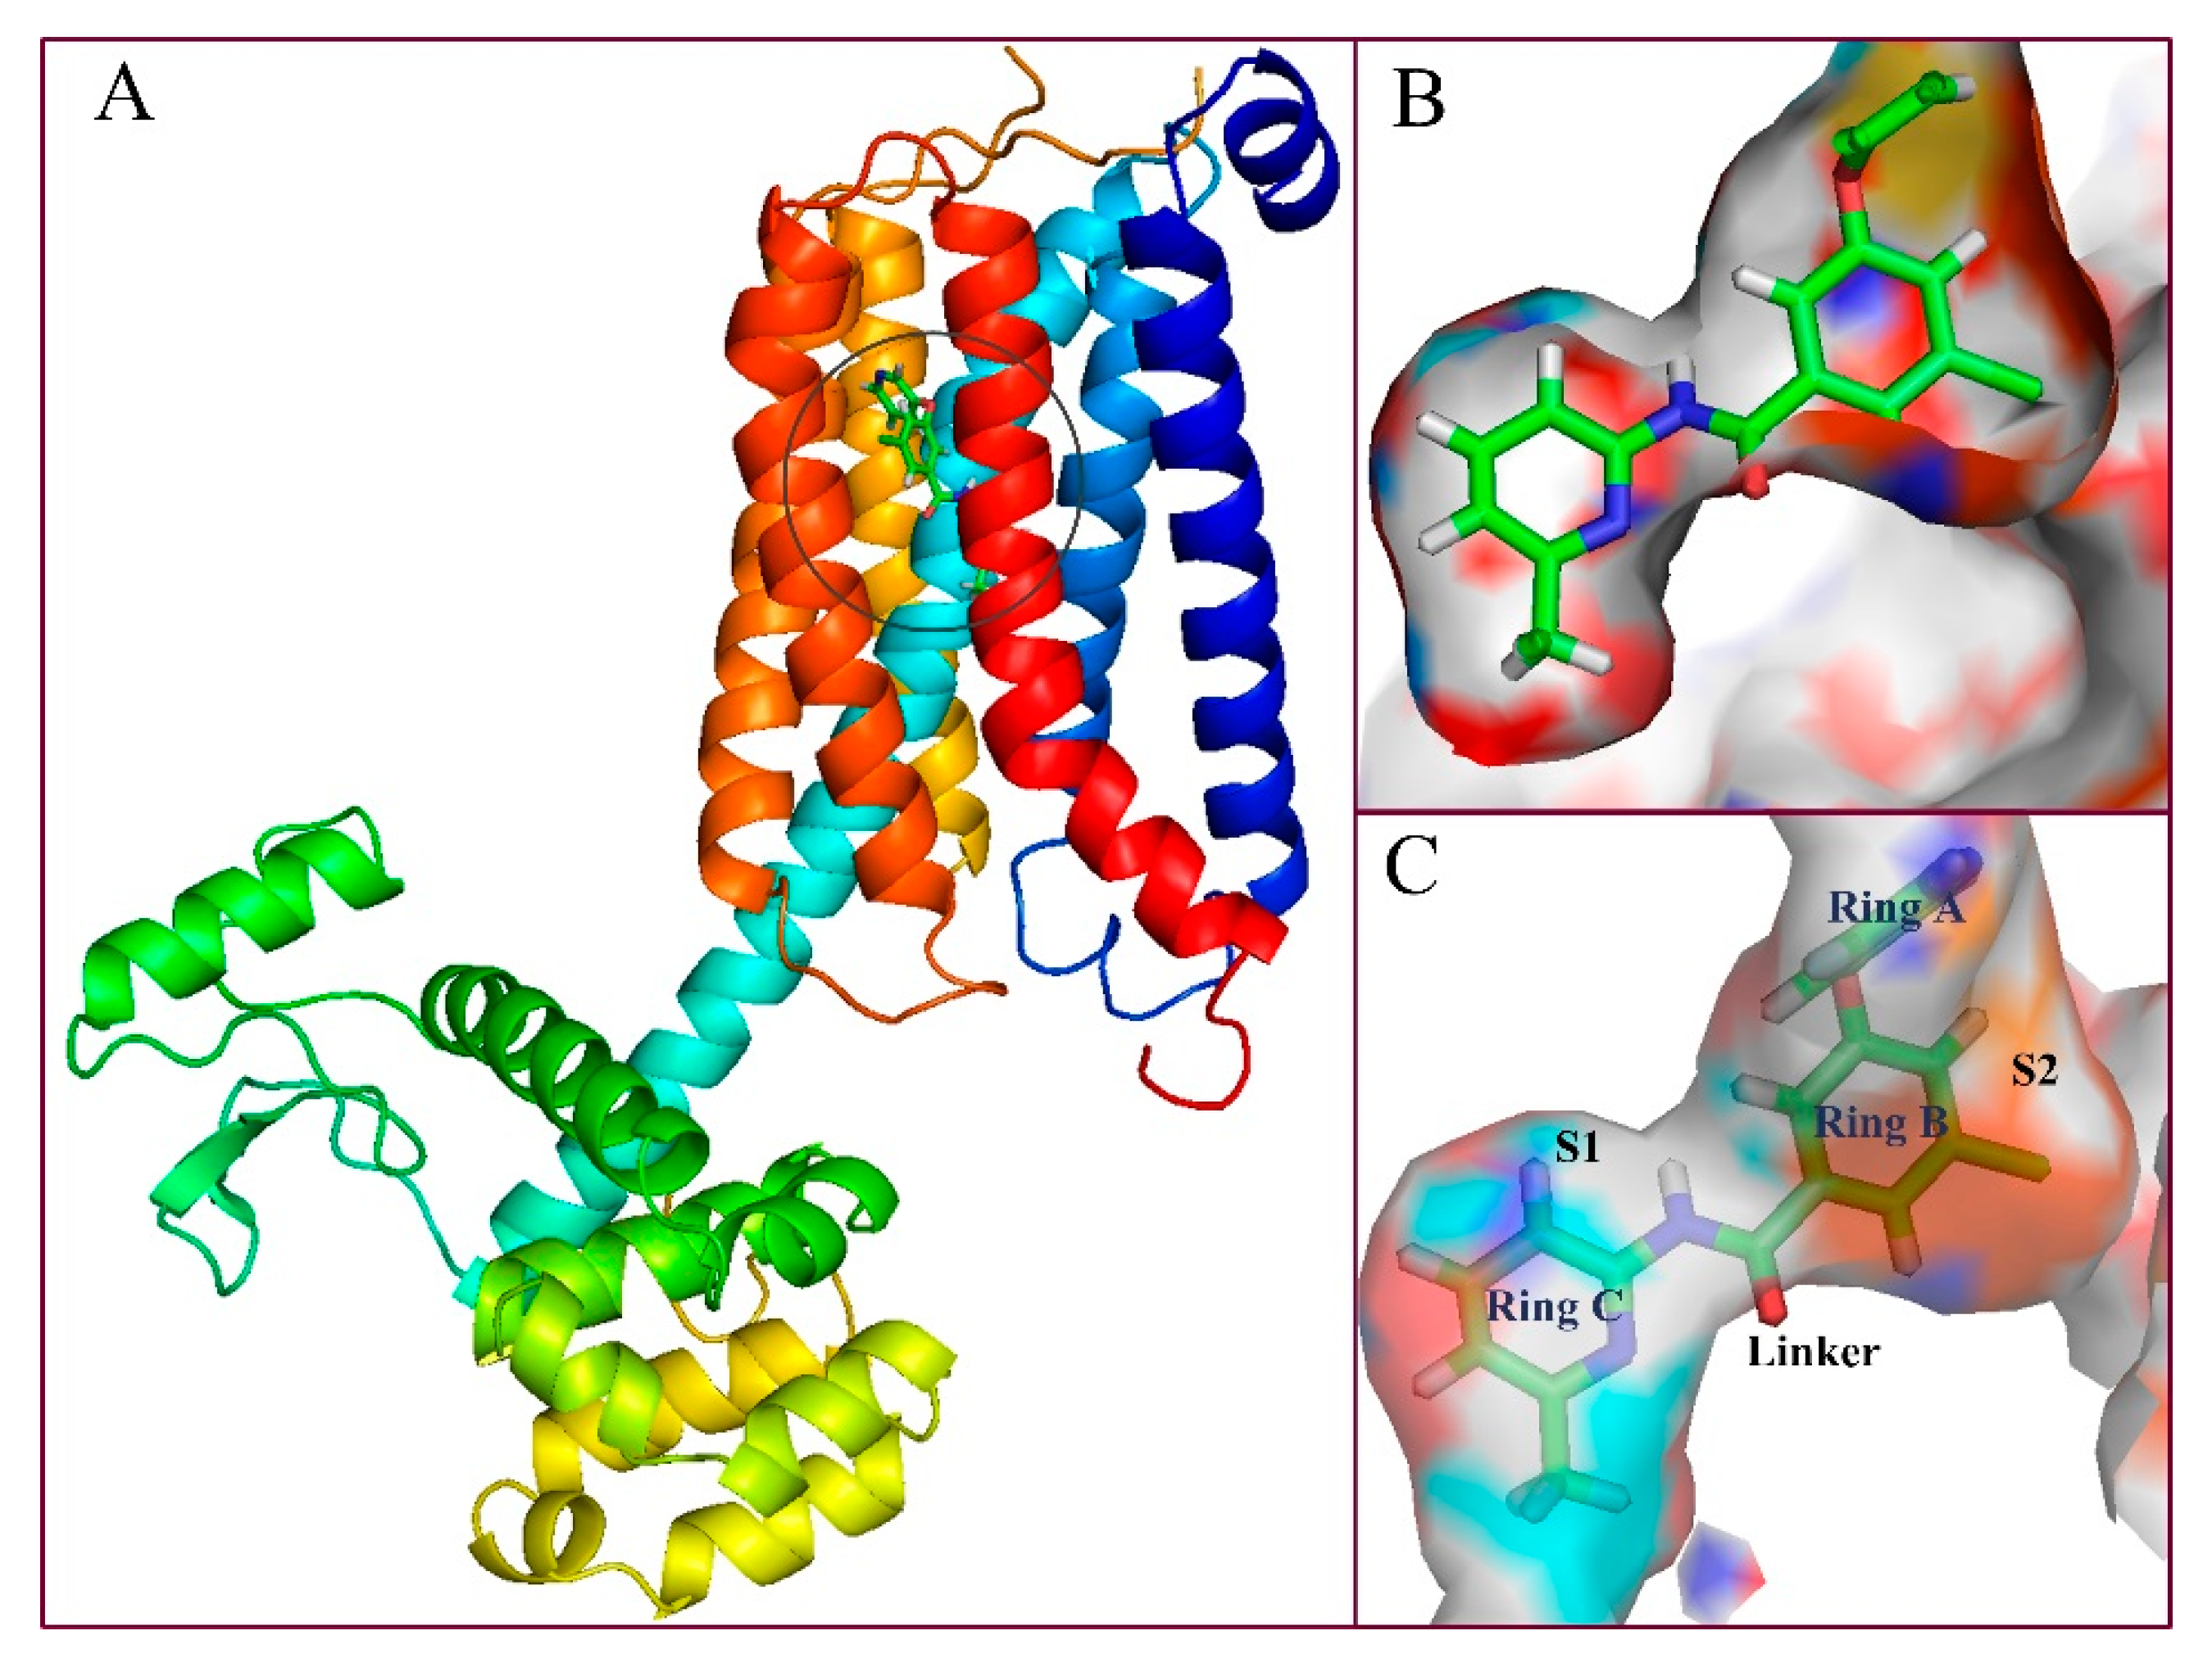
Molecular docking is based on the structure of receptor proteins and ligand small molecules, in which chemical statistics are used to simulate the three-dimensional structure of compounds and the interaction between molecules, and in this way, the binding mode between receptors and ligands may be identified. Presently, a computational docking study was performed, and the resultant binding pattern using the most active molecule
74 docked into the human mGluR5 receptor as an example is shown in
Figure 4.
As shown in
Figure 4A, the sequence of mGluR5 receptor consists essentially of 7 (TM1-TM7) transmembrane helices, in which the binding site of the ligand is embedded in the middle portion of the helical domain. In fact, the binding cavity is an almost closed space resembling a “bone” shape, which is mainly composed of two sub-pockets (represented by S1 and S2 in the present work) and an intermediate connecting region (Linker,
Figure 4B). Wherein ring C is located in sub-pocket S1, rings A and B are co-located in another sub-pocket S2, and the molecular skeleton peptide bond is located in the linker of the “bone” site. It can be clearly observed that the area of the cavity where ring C is located is relatively narrow and thus tightly confines this ring in the pocket, which is consistent with the results obtained from the previous QSAR equipotential map (
Figure 2A), where a large brownish-yellow cloud is observed around ring C, indicating that the large sterically hindered group is not conducive to the increase in activity. Comparatively, the space of sub-pocket S2 where rings A, B, and the ether bond are located is much wider, which is also consistent with the green contour present around rings A and B in
Figure 2A. Therefore, both the 3D-QSAR and docking results indicate that the large sterically hindered groups within the space of sub-pocket S2 where rings A, B, and the ether bond are located contribute to the increase of molecular activity, whereas bulky substituents around ring C disfavor the activity.
To reveal the binding conformation of the ligand and the corresponding mechanism of action, we examined the docked complex of the mGluR5 receptor in detail. As shown in
Figure 5, the binding cavity is mainly composed of 20 amino acid residues (within the 4.5 Å range of the ligand), i.e., Pro655, Tyr659, Ile625, Ile651, Ile944, Ser658, Ser654, Ser969, Ser965, Ala970, Ala973, Trp945, Phe948, Val900, Pro903, Asn907, Leu904, Gln864, Met962, and Val966. In this binding mode, three significant factors are observed, i.e., hydrophobicity, H-bond, and π–π stacking interactions, which contribute to the intimate interaction of the NAMs with the target receptor. Among the 20 amino acids, hydrophobic residues account for about 65%, which greatly facilitates the induction of the active conformation of the antagonist. In fact, sub-pocket S2 where rings A and B are located is a hydrophobic pocket consisting of 12 key amino acid residues, 9 of which are hydrophobic ones such as Trp945, Leu904, Phe948, and Ile651. The proportion of hydrophobic amino acid residues in the sub-pocket S1 is 50%. These results are also essentially in agreement with the hydrophobic contour distribution of the CoMSIA model (
Figure 2C). That is, as shown in this figure, the existence of hydrophobic groups around ring A contributes to the improvement of molecular activity. For example, compounds
74 and
59 are similar in structure. The reason why their inhibitory activities both rank among the top five (compound
74, pIC
50 = 8.13, compound
59, pIC
50 = 7.86) depends largely on the presence of a hydrophobic group at ring A. All of these findings indicate that hydrophobicity is the most critical contribution to enhancing the inhibitory activity.
Besides the hydrophobic interactions, the H-bond and π–π stacking interactions also play key roles in the binding of the aryl benzamide derivatives with the receptor. As a matter of fact, as shown in
Table 1, the total contribution of hydrogen-bond descriptors of the optimal CoMSIA model reaches 22.4%, clearly underlining the important role of this weak binding force to the potency of mGluR5 NAMs. In line with this, in present docking results (
Figure 5), five H-bonds are formed so as to consolidate the molecular conformation. The N atom on ring C forms a H-bond with the side chain of Ser969 (-N···HO-, 2.85 Å), and the linked ether group -O- form another H-bond with the side chain of Met962 (-O···HS-, 3.23 Å). Further, the O atom on peptide bond forms H-bonds with the side chain of Ser969 (-O···-OH, 2.10 Å) and Tyr945 (-O···-OH, 3.14 Å), respectively. The F atom on ring A also form an H-bond with the side chain of Asn907 (-F···-NH, 2.50 Å). This is in good agreement with the presence of large cyan and small red contours above the link chain in
Figure 2D, E). For example, among these five H-bonds, the F atom on ring A and the O atom on the ether bond as the H-bond acceptor substituents are favorable for the inhibitory activity. Furthermore, ring B forms a face-to-face π–π stacking interaction with amino acid residue Trp945, which also helps immobilize the antagonist within the protein cavity. In short, hydrogen bonding and π–π stacking interactions are essential for NAM to exert inhibitory activity.
When anchored in the pocket, molecule
74 is inserted into the transmembrane helices in an “arc”-like conformation (
Figure 5), wherein ring C and the amide group form a branch, ring A and the ether group constitute another branch, and ring B constitutes the apex of the “arc,” respectively. The vertex of the “arc” and the branch where ring A is located extend to the hydrophobic pocket, with the branch’s tip fixed by an H-bond formed with residue Asn907. The benzene ring at the apex then further anchors the “arc” by π–π stacking face to face with the residue Trp945. As to the other branch that is composed of ring C and the molecular skeleton peptide bond, it is anchored by an H-bonding interaction with residue Ser969, Tyr659.
In summary, the above hydrophobic interaction, H-bond and π–π stacking interaction play a key role in stabilizing the optimal binding conformation of ligand to mGluR5. In addition, the results of docking and 3D-QSAR models complement and validate each other, providing useful information for the rational design of more effective mGluR5 antagonists in the future.
2.4. Molecular Dynamics Studies
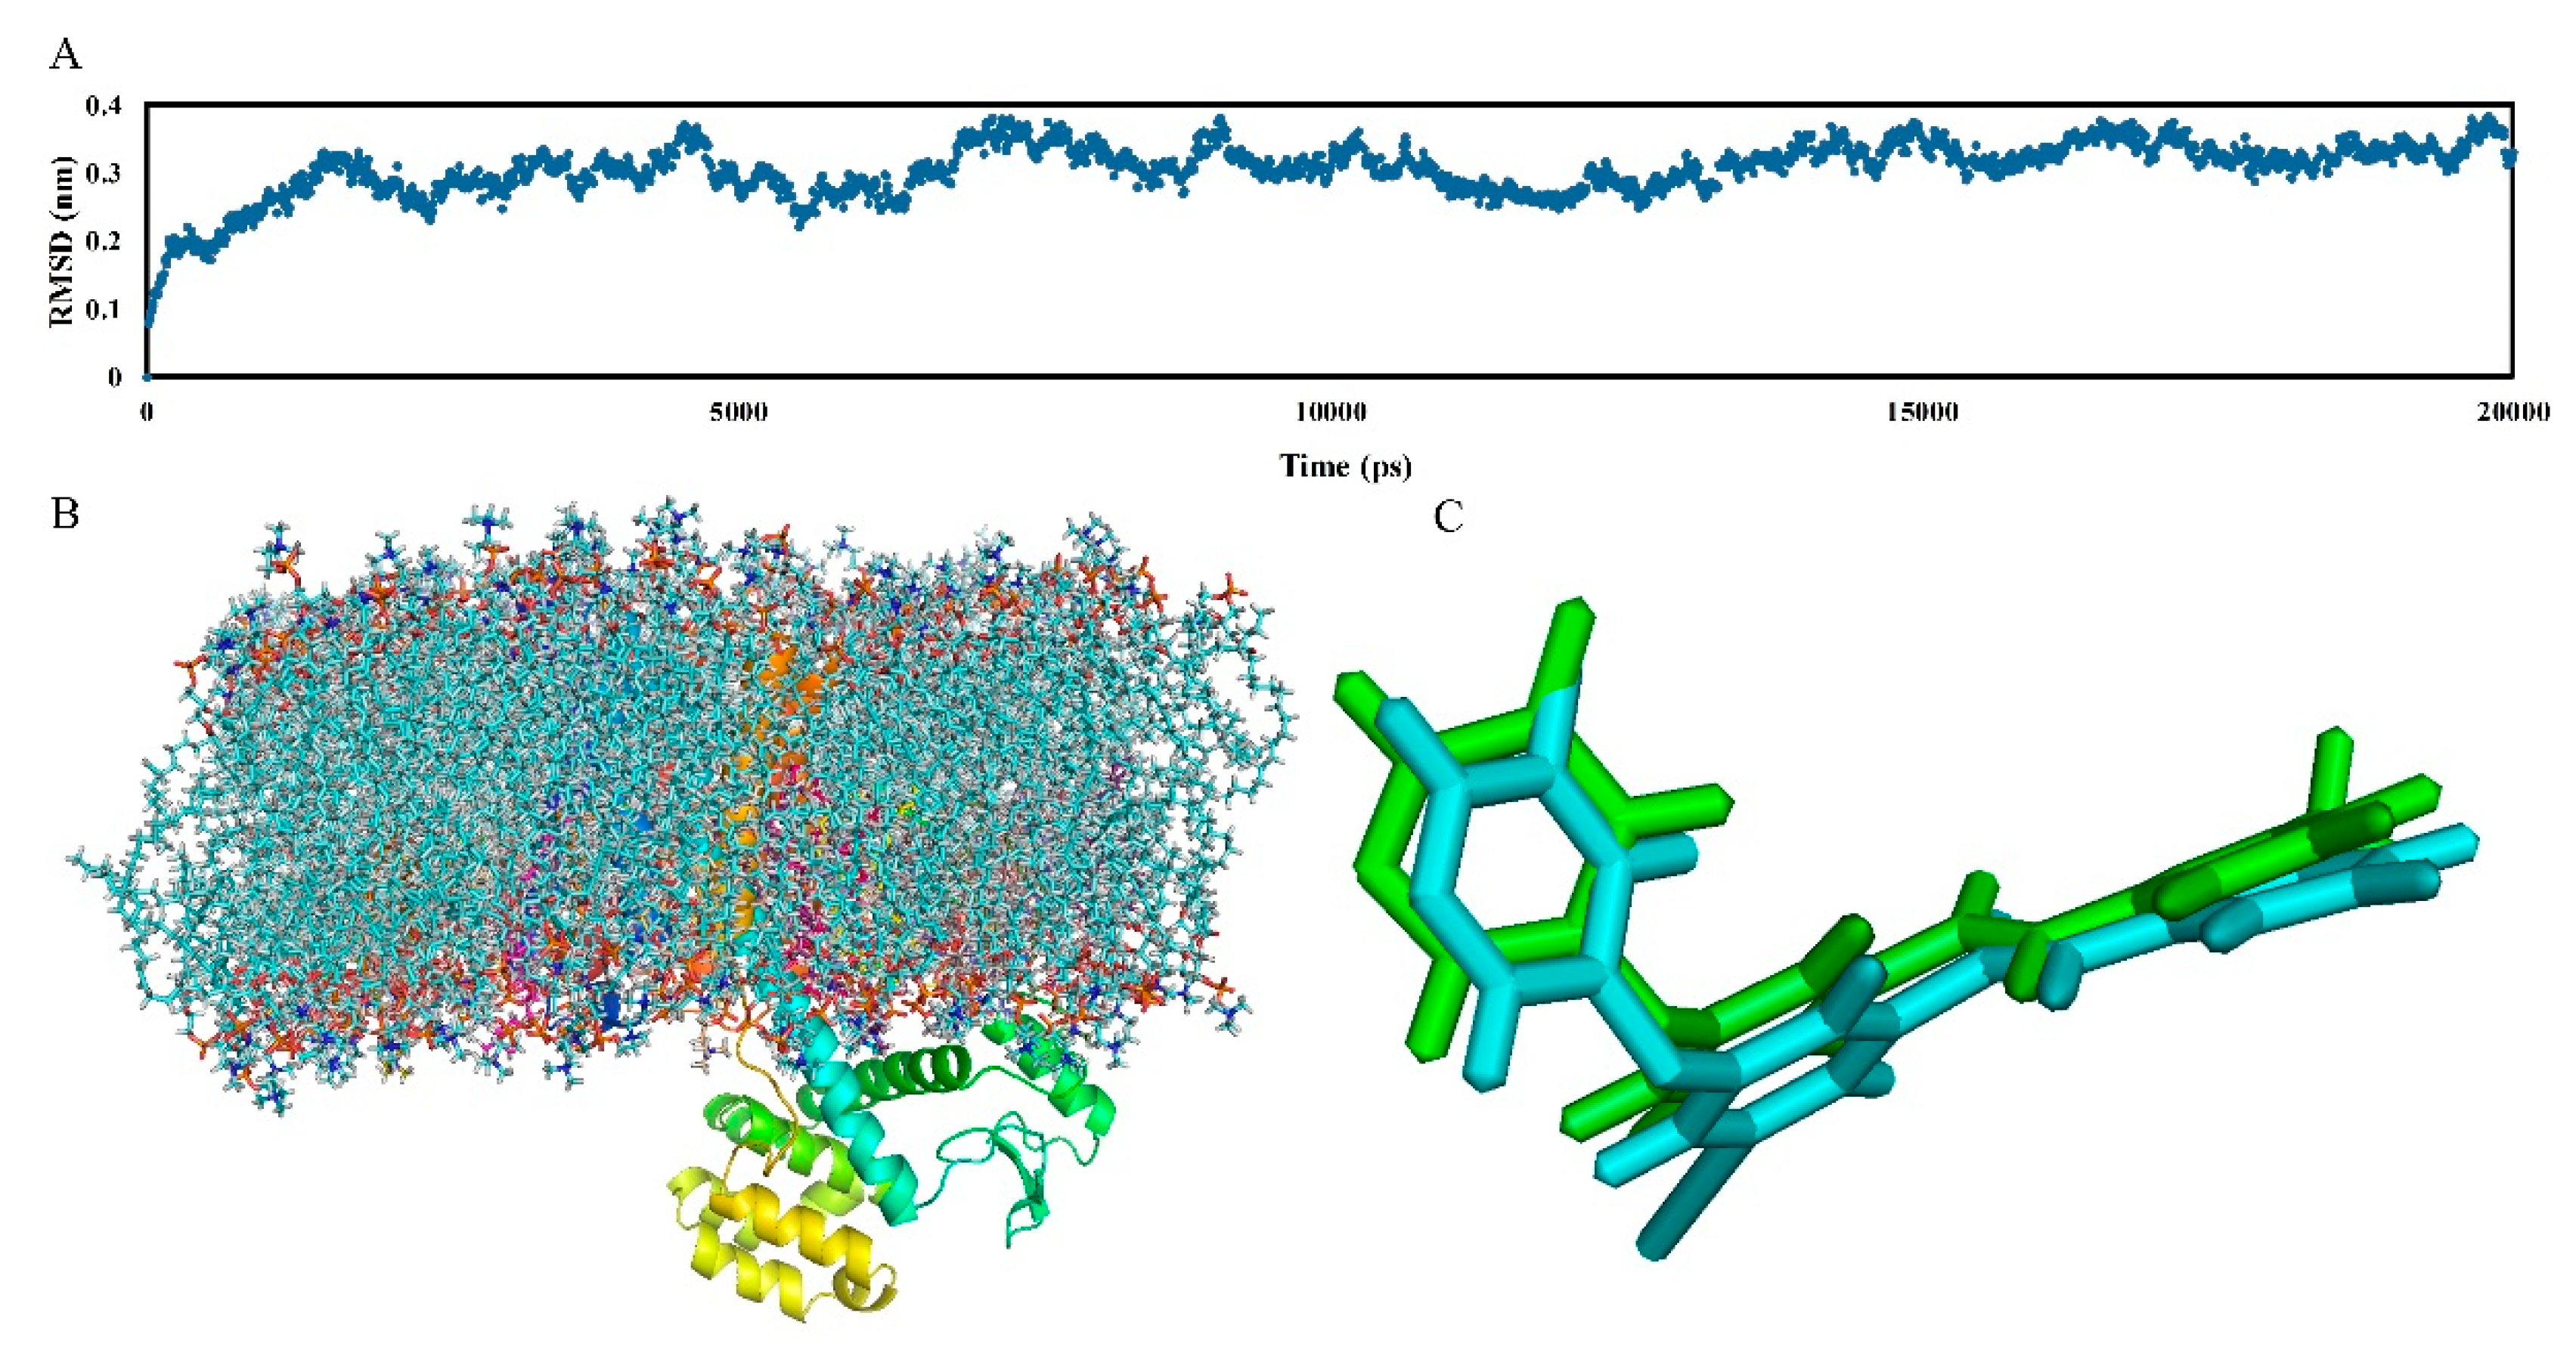
MD simulation is proof and supplements the 3D-QSAR method and molecular docking analysis, which belongs to the dynamic simulation process. It can not only effectively track and represent the dynamic behavior, but also visually displays the static graphics in the system. In this work, a 20,000 ps MD simulation was performed using the docking complex of the mGluR5 receptor as the starting molecular structure to explore dynamic images of the conformational diversity of ligand-receptor binding. Additionally, to reveal the “positional stability” of the initial complex conformation, the root mean square deviation (RMSD) of the skeletal atoms of the trajectory was calculated, which ends up with a range of 0.25 to 0.40 Å relative to the initial structure of the composite as depicted in
Figure 6A. As shown in this figure, the RMSD of the system remains around 0.35 Å after the initial 10,000 ps free balance and is relatively stable throughout the subsequent simulations, indicating a balanced conformation of the complex structure of the docking. In addition,
Figure 6C shows the structure of the protein-ligand complex in the MD simulation (blue) superimposed by the initial docking structure (green) in the last 1 ns. As shown in
Figure 6C, the structure extracted from the MD simulation agrees well with the docking model of the complex, and both of them adopt have an “arc” conformation. This also proves the rationality of our previous docking model.
Figure 7 depicts all the binding interactions observed in the last 10 ns MD simulation. As seen from this figure, the binding mode of compound
74 exhibiting in the MD model is almost the same as the docking results in terms of key amino acids and π–π stacking interactions. Specifically, the major amino acids in the docking model constituting the binding cavity are all observed in the MD simulation, including the hydrophobic amino acid residues Ile625, Ile651, Ile944, Ala973, Ala970, Pro655, Pro903, Val966, Phe948, Leu904, Trp945, and Met962, and hydrophilic amino acid residues Ser658, Ser654, Tyr659, Ser969, Ser965, and Asn907. Furthermore, basic face-to-face π–π stacking between ring B and Trp945 is also retained in the MD results.
In addition, because multiple H-bonds are observed in the results of MD simulations, to more precisely quantify H-bonds, the occurrence frequency of H-bonds in the last 10 ns is summarized in
Table 2. In the MD simulation results, though the composition of H-bonds at different times (ns) changes slightly, as seen from
Table 2, the H-bond interactions in the MD results are basically consistent with the docking results. Especially, three ammonia acid residues, i.e., Tyr659, Ser969, and Asn907, all participate in the H-bonding interactions in both the docking and MD results. Among them, Tyr659 appears most frequently in the MD results and participates in the formation of two H-bonds, i.e., the H-bond between the O atom on peptide bond and Tyr659 (-O···-OH) and the one between the N atom on ring C and Tyr659 (-O···-N), with an occurrence percentage of 90% and 30%, respectively. In these two H-bonds, the former one also appears in the docking results, indicating its essential role in stabilizing the bioactive conformation of the molecule. For Ser969, it also helps the formation of two H-bonds, which include the H-bond with the O atom on the peptide bond (-O···-OH) and the one with the N atom on ring C (-O···-N)). These two H-bonds are both observed in the docking results, proving the importance of Ser969 in the H-bonding network of mGluR5-aryl benzamide NAMs. As for Asn907, it interacts with the F atom on ring A and in this way forms a H-bond (-F···-N), which helps ring A deviate from the original linear conformation and deflect towards Asn907, thereby forming an arc conformation. It is noteworthy that a H-bond between the O atom on peptide bond and Trp945 (-N···-OH) formed in MD simulation is not observed in the docking results, which may be due to the fact that it is the average property of the ensemble of last 10 ns’ MD simulated bioactive conformations instead of the property at a specific time of the ligand-mGluR5 complex that is depicted in
Table 2. Due to the relatively high occurrence percentage (50%) of this H-bond, Trp945 may be also crucial for stabilizing the active conformation of the complex.
All the above may explain why the MD simulated structure of the protein-ligand complex overlaps well with its initial docked structure, with no major difference is observed. In summary, the conformation of the ligand remains stable at the active site of the receptor, and it still exhibits “arc” active conformation under the action of hydrophobicity, H-bond, and π–π stacking interaction.
3. Discussion
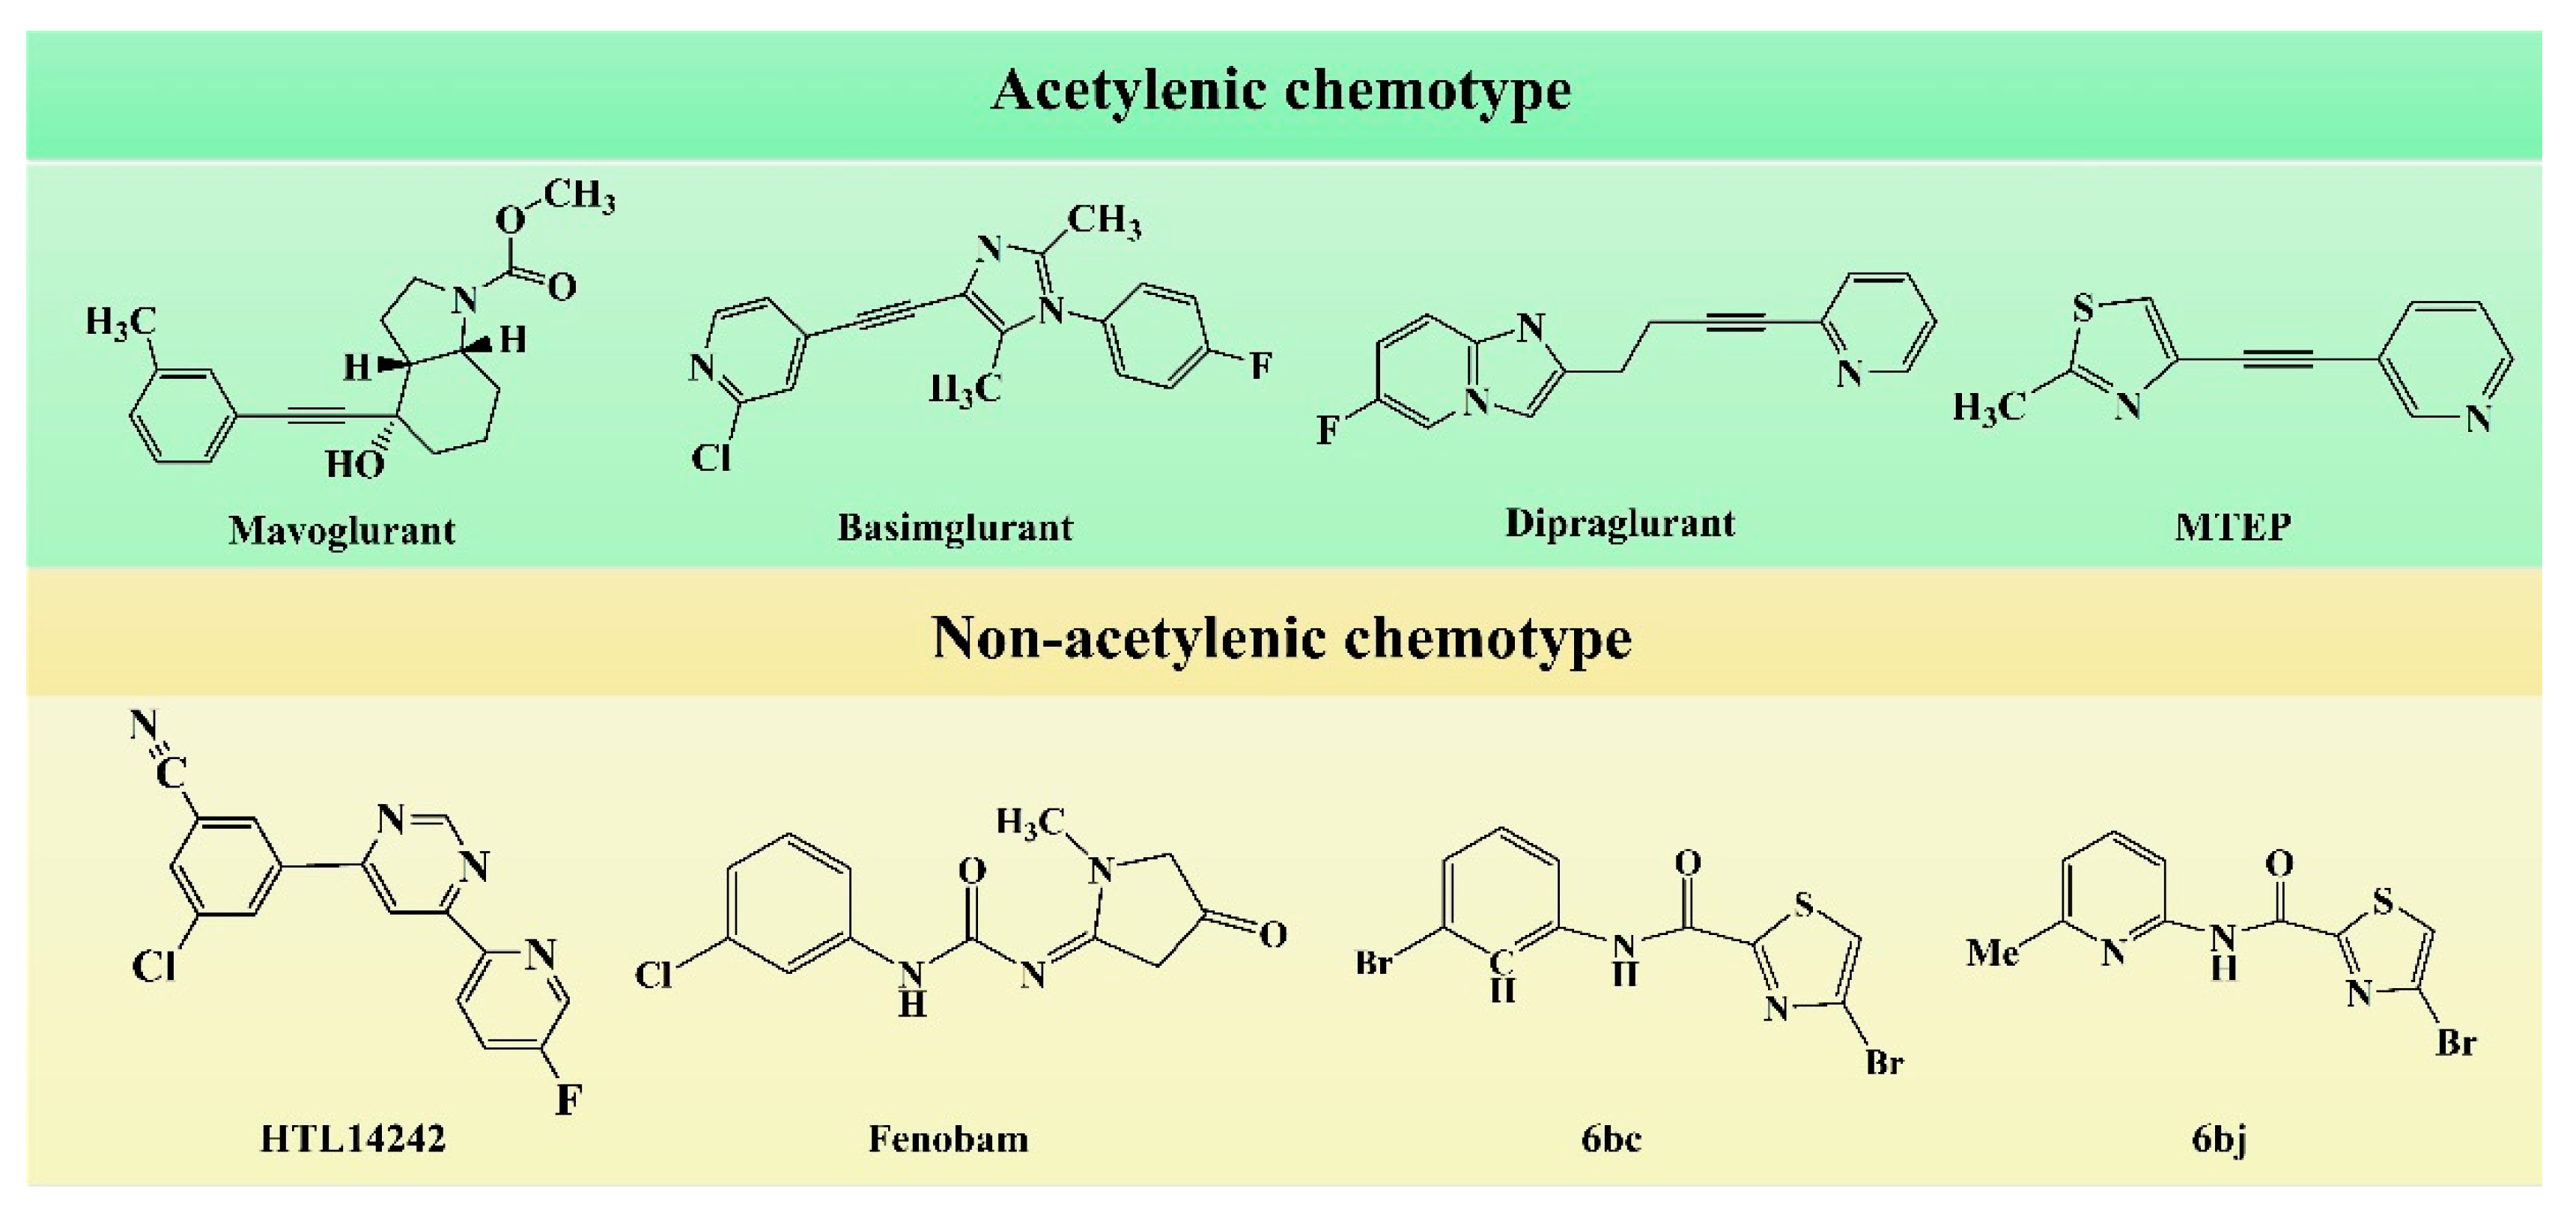
In the early development stage of mGluR5 NAMs, the alkyne subunit in antagonists is regarded as a key structural motif for the molecules to possess a high affinity to mGluR5 [
18]. However, an alkyne moiety is metabolically unstable and often cause unfavorable side effects [
18]. Therefore, two structural motifs, i.e., amide and urea functional groups, are proposed as the replacements of alkyne linkages in mGluR5 NAMs [
18]. So far, altogether eight known mGluR5 NAMs have entered and/or are about to enter clinical trials, i.e., Mavoglurant [
19,
20,
21], Basimglurant [
8,
21], MTEP [
8], HTL14242 [
20], Dipraglurant [
21], Fenobam [
21,
22], Thiazole-2-carboxamides (6bc, 6bj) [
18]. It is worth mentioning that, for a long time, the important structural information on mGluR5 NAMs was to combine mutation studies with homology modeling and/or a series of ligand analogs. The reason is that the crystal structure of mGluR5-7TM has not been available. It was not until 2014 that Andrew S. Doré [
23] obtained the crystal structure of mGluR5-7TM. As, usually, the results of homology modeling are somewhat or slightly different from the actual structures of the target proteins, to further explore the interaction features of various NAMs with mGluR5 receptor, we have summarized the docking/MD results of the above mentioned known mGluR5 NAMs (with molecular structures shown in
Figure 8) by using the crystal structure of mGluR5, which is shown in
Table 3.
Up to now, two mGluR5 receptor binding regions (the orthosteric binding region in the VFT and the allosteric binding region in the 7TM) have been reported [
24]. In fact, we find that the studies on the NAM site almost all focus on the transmembrane allosteric binding region [
8,
19,
20,
21,
22], which can be explained by the fact that the allosteric binding pocket is less conserved compared to the orthosteric binding region, thus helping the identification of selective ligands [
9]. In structure, the 8 antagonists belong to the acetylenic chemotype and non-acetylenic chemotype, as shown in
Figure 8. Despite their structural diversity, they bind to the same cavity. By comparing the key amino acids that make up the cavity in
Table 2, we find that, as a matter of fact, in the 7TMs of mGluR5 only one binding pocket (Site 1) is identified in charge of interacting with them.
Although they all binding to the same site, these NAMs exhibit different spatial conformations due to their diverse structures. For better comparison of the ligand-receptor binding modes of the antagonists, we performed molecular docking analyses on all above acetylenic and non-acetylenic molecules using PDB 6FFI as mGluR5 template (as same as the present work).
Table 4 summarizes the results of these studies. Our docking results show that these molecules do bind to the same cavity in 7TM, and this site consists of two chambers (sub-pocket S1 and sub-pocket S2) and a narrow passage connecting them. As in structure, the skeleton of all NAMs is composed of polycyclic structures, the aromatic ring of the molecules often stretches to one of these two sub-pockets. Factually, by observing our docking results, we can find that the active conformation of all molecules can be divided into two categories, namely “linear” and “arc” configuration, as shown in
Figure 9 and
Figure 10.
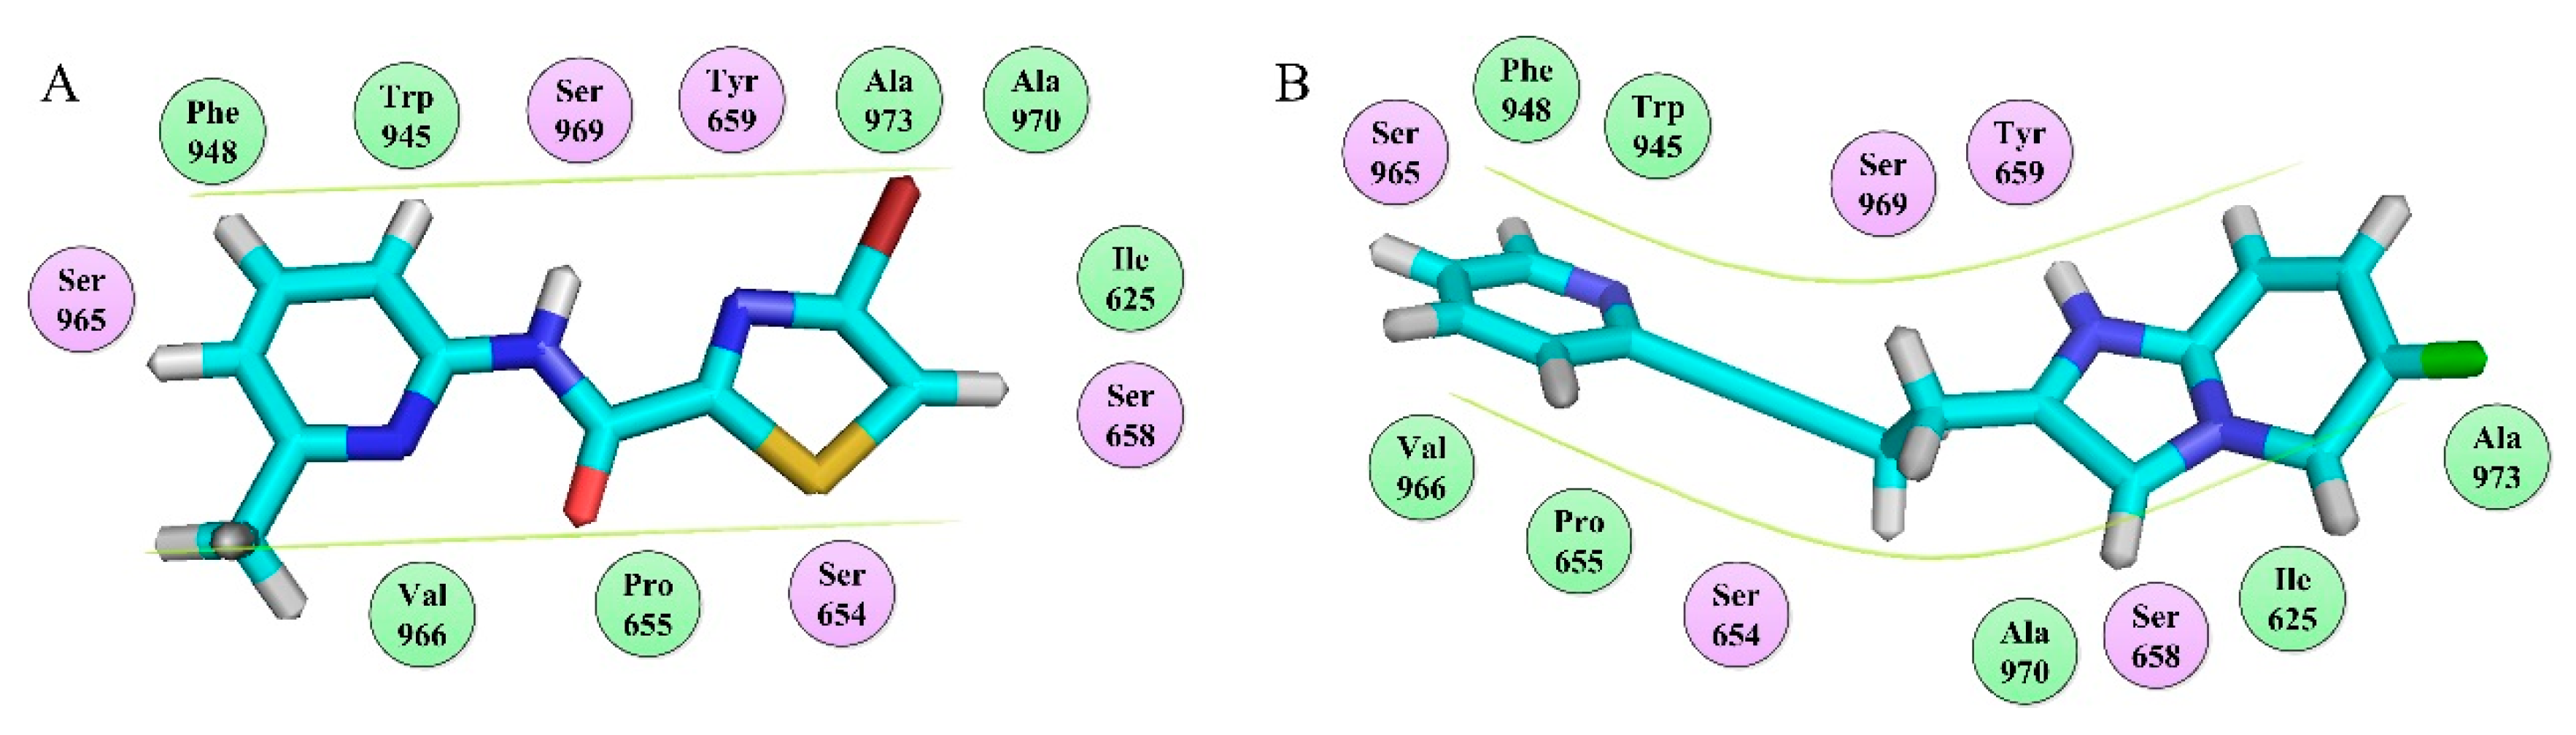
Observation of the docking results reveals that molecules thiazole-2-carboxamide (6bc), (6bj), MTEP and Fenobam are in a “linear” configuration. Takes ligand Thiazole-2-carboxamides (6bj) as an example. Its structural feature is that the body is chain-shaped, and at each end of the chain one aromatic ring is located. Each of the aromatic rings is located in a sub-pocket of the cavity. As shown in
Figure 9, in its active conformation, hydrophobic, H-bond, and π–π stacking interactions are involved, wherein hydrophobic interaction of residues Ala973, Ala970, Ile625, Ile944, and Pro655 is identified in the vicinity of the thiazole in the sub-chamber S1. Furthermore, residues Ser654, Tyr659, and Ser969 form a plurality of H-bonds (-O ···S-, 3.43 Å; -O···O-, 3.42 Å; -N···O-, 2.69 Å) with the sulfur, oxygen, and nitrogen atoms in thiazole, respectively in S1. In sub-pocket S2, π–π stacking between pyridyl rings of residue Trp945 and 6bj is observed in a face-to-face manner. Besides, hydrophobic interaction of hydrophobic residues Trp945, Leu904, Val966, and Phe948, is also identified in the vicinity of the pyridyl group in sub-pocket S2. It is the above interaction features that keep 6bj in a linear conformation. In terms of other “linear”-type mGluR5 antagonists, this characteristic is also observed. That is, the molecules are chain-like in skeleton, and there are two aromatic rings at both ends of the chain which enter the two sub-pockets of S1 and S2, respectively when binding to S1. In addition, the skeleton chain linking the two end aromatic rings is comparatively short, generally less than 4 chemical bonds. Thus, it is assumed that NAMs with the above structural characteristics may adopt linear conformations to bind stably with the mGluR5 receptor.
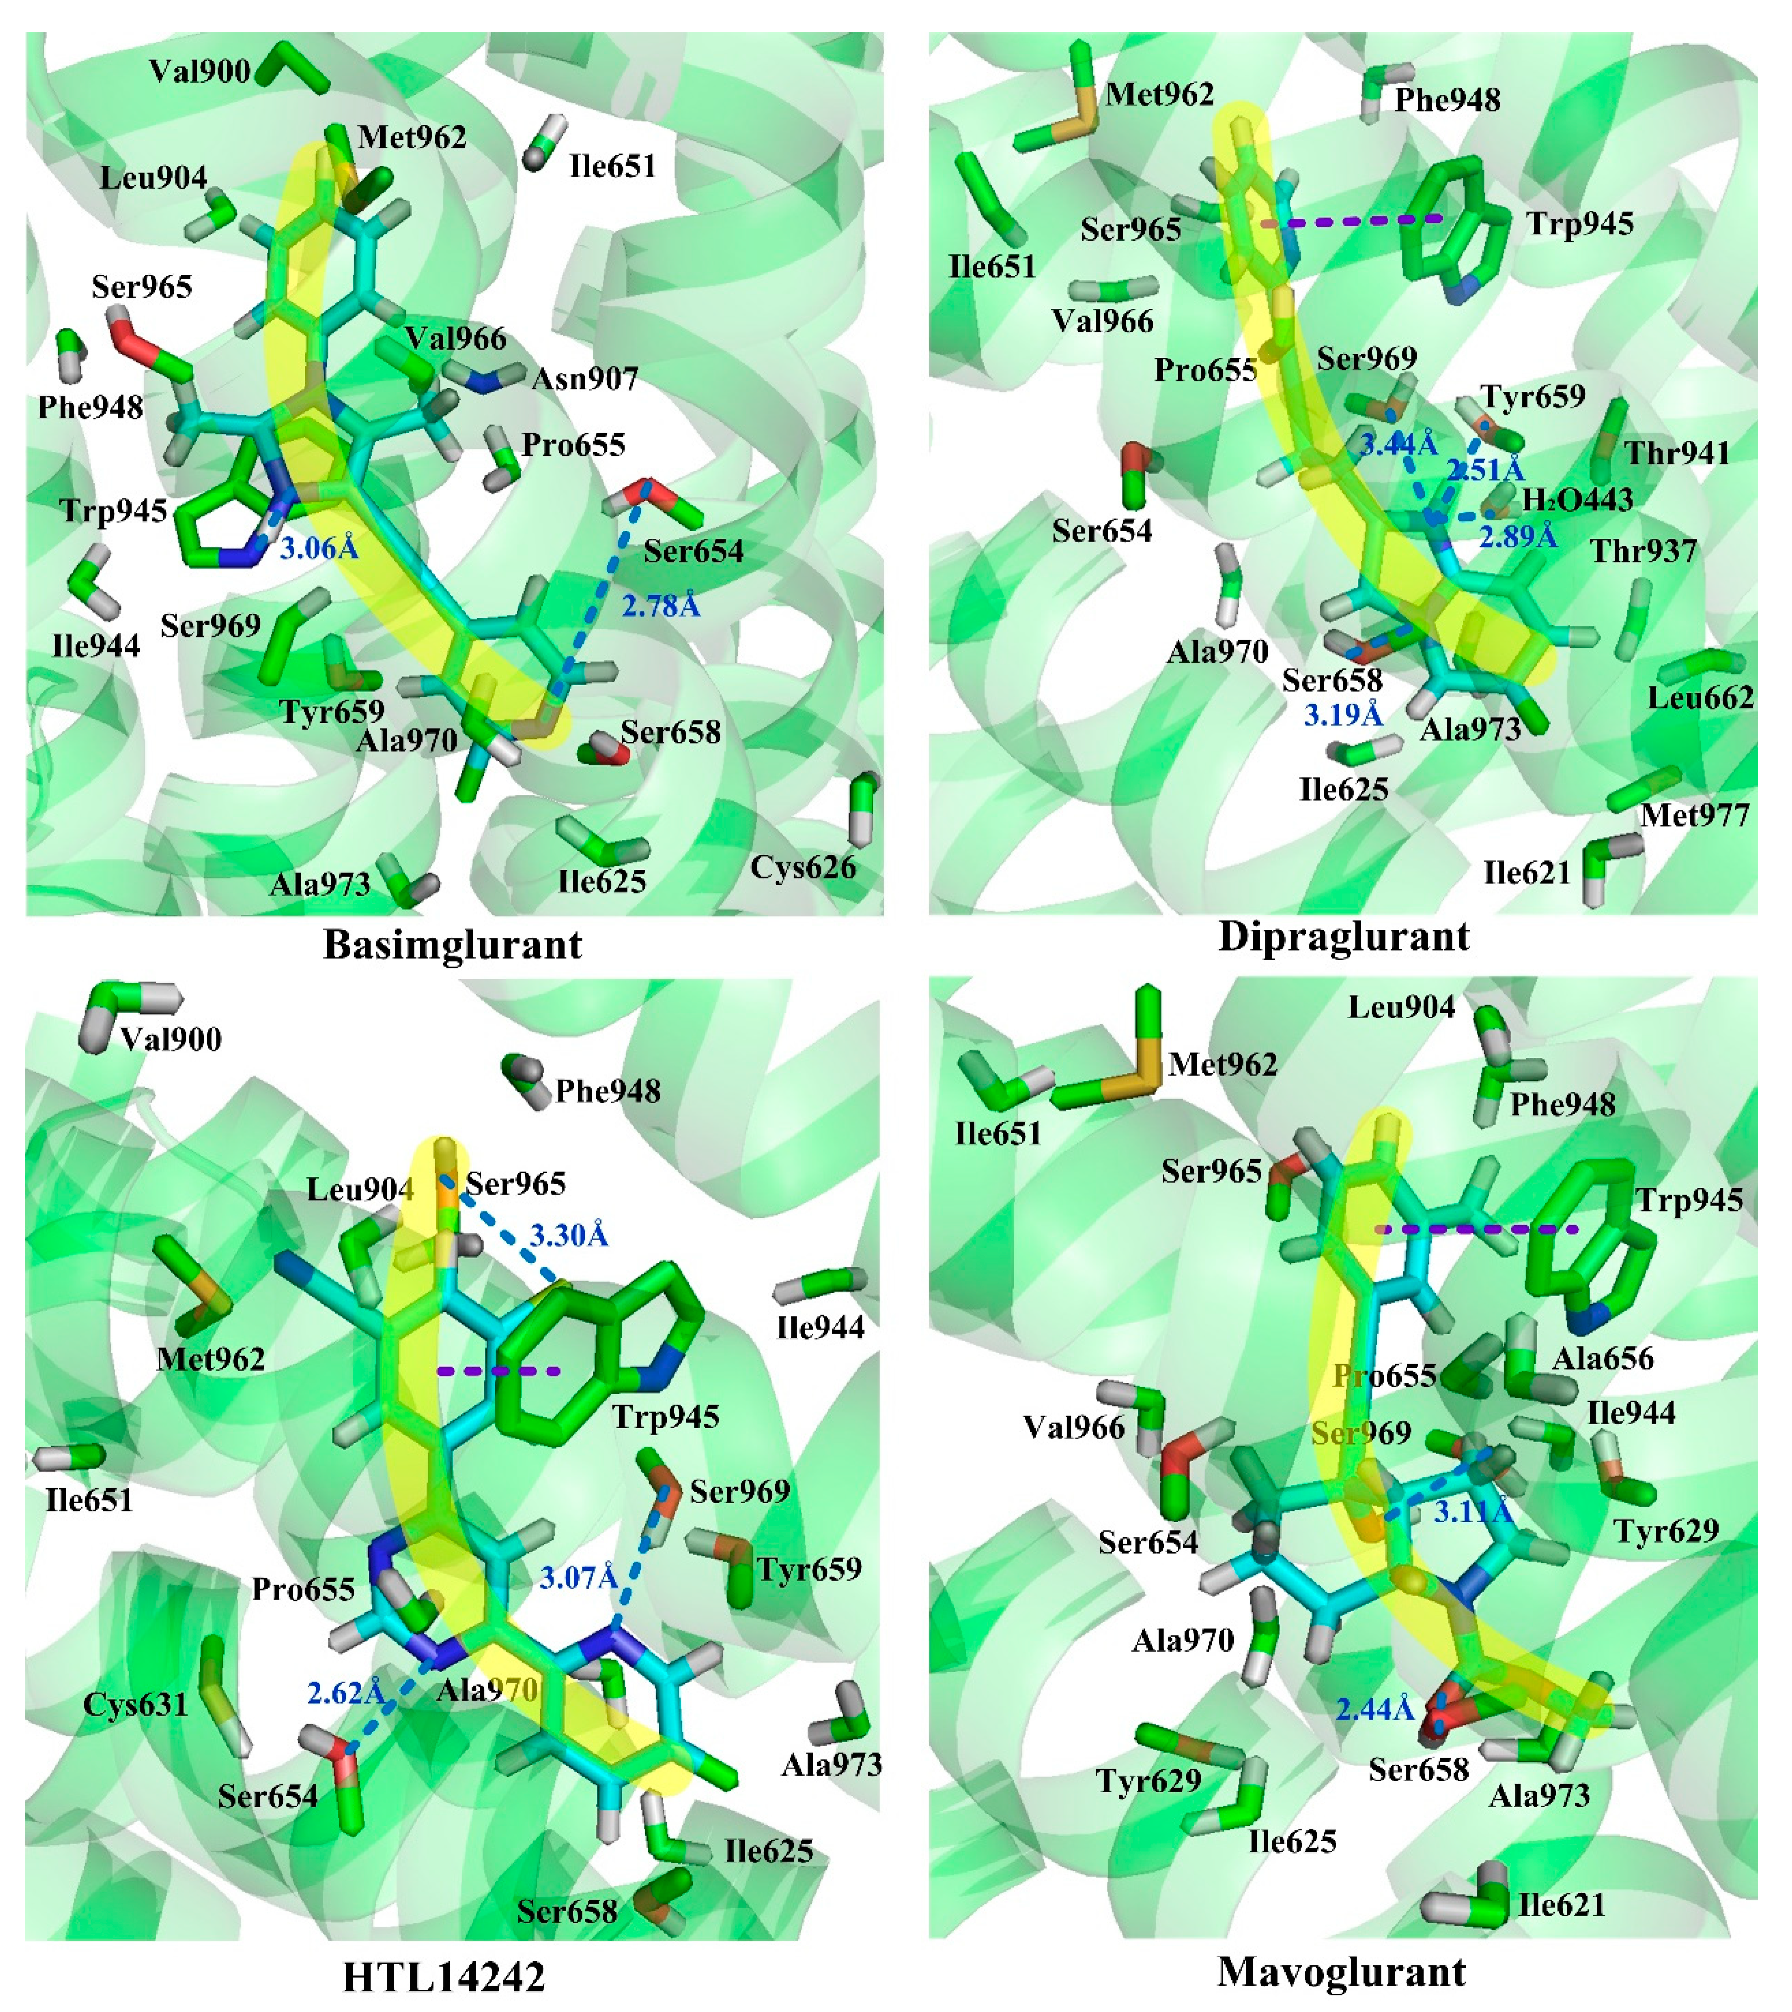
Whereas, molecules Dipalglurant, Mavoglurant, Basimglurant, HTL14242, and Compound
74 are observed in an “arc” configuration in the binding complex. In structure, actually, their skeletons are also chain-like (
Figure 10). However, unlike those NAMs with linear active conformation, not only aromatic rings exist at both ends of the chain, but also more than one aromatic ring exists at one end of the chain. In interaction forces, similar to the “linear” configuration, hydrophobic, H-bond, and π–π stacking interactions are also identified contributing to the “arc” configuration. Taking Dipalglurant as an example, where hydrophobic interactions around sub-pockets S1 and S2, and a π–π stacking interaction between the pyridyl group and residue Trp945 in a face-to-face way in S2 are all observed. The essential difference between the “linear” and “arc” configurations is that the polycyclic ring structure in the “arc” configuration provides more opportunity to form H-bond interactions. Actually, in the Dipalglurant-mGlu5 complex, four H-bonds are identified in sub-pocket S1. In addition to three H-bonds formed by the amino acid residues Ser969 (-O···NH-, 3.44 Å), Ser658 (-O···NH-, 3.19 Å), and Tyr659 (-O···N-, 2.51 Å), it also includes a H-bond formed by a water molecule (-O···OH-, 2.89 Å). For compounds Mavoglurant, Basimglurant, HTL 14,242, and Compound
74, the above characteristics are also observed. Therefore, the molecule is long-chain on the backbone and has one or more aromatic rings at each end of the long chain. The heteroatoms on the polycyclic ring can form a plurality of hydrogen bonds with the surrounding amino acid residues, and the molecule having these characteristics is “arc” conformation.
To sum up: (1) mGluR5 NAMs all bind at Site 1 (
Figure 11A) despite the different spatial conformations of the molecule. The most important residues involved in Site 1 are Tyr659, Pro655, Ser809, and Ser805. (2) This site consists of three main regions including the two chambers (sub-pocket S1 and sub-pocket S2) and a narrow passage connecting them, as shown in
Figure 11B, C. (3) The ligand-receptor binding modes are mainly stabilized by the complex interactions including hydrophobic (Pro655, Ile625, Ile651, Ala973, Ala970, Val966, Trp945, and Met962), H-bond (Ser969, Tyr659, Ser658, Ser654, Met962, Asn907) and π–π-stacking (Trp945) interactions. (4) The polycyclic binding ring determines two different molecular active conformations, namely the “linear” and “arc” docking modes, as shown in
Figure 12. (5) The aryl benzamide derivatives studied in our work also bind to Site 1 as mGluR5 NAMs, in an “arc” conformation stabilized by hydrophobic, H-bond, and π–π stacking interactions. All these findings, we hope, may be of help for providing insights for the future exploitation of novel mGluR5 NAMs with high inhibitory activities.
Evaluating a 3D-QSAR model depends not only on how well it fits the data but more importantly on how well it predicts the data. Contour maps, molecular docking, and MD simulation results provide guidance for designing domain-specific substituents on compound scaffolds that are critical for improving the inhibitory potency of mGluR5 NAMs. Therefore, presently, to further validate these conclusions, based on the structural skeleton of molecule
74 (as a template), a total of 8 novel aryl benzamide derivatives were designed and their potential activities against mGluR5 were predicted as well adopting the optimal CoMSIA model.
Table 5 summarizes the chemical structures of these molecules and their corresponding predicted activities. Unsurprisingly, all of them (NC1~NC8) present higher pIC
50 values than that of the template compound
74 (pIC
50 = 8.13), suggesting their great potential to be potent mGluR5 NAMs.
5. Conclusions
In the current work, a comprehensive computer study of a total of 106 newly synthesized mGluR5-NAMs is conducted. Using a combination of 3D-QSAR, molecular docking, and MD simulation, the relationship between the structure of these compounds and their activity, and their interaction with target proteins are explored. Our findings are summarized below:
The optimal CoMSIA model developed is statistically predictable, = 0.70, = 0.89, and = 0.87, demonstrating its significant internal and external predictive capabilities. The key structural determinants that influence the activity of mGluR5-NAM molecules based on the corresponding contour maps are identified.
Furthermore, the aryl benzamide derivatives herein exhibit an approximate “arc” conformation and bind to the Site 1 of the mGluR5 receptor. Hydrophobic, H-bond, and π–π interactions are the main interactions with the cavity.
Through our study, the binding patterns and characteristics of ligand small molecules and metabotropic glutamate receptor proteins are identified, and the mechanism of their binding is explored and interpreted, which provide guidance for the synthesis of new glutamic related neurologic diseases.

 ) at these regions exhibits higher mGluR5 antagonist activity than compound 94 (). In addition, a large gray cloud at ring B reveals that the hydrophobic groups herein reduce the activity of the molecule. This is well illustrated by the higher activities of molecule 9 () (without any substituent) than molecule 10 () with a methyl group at the same position.


