Article

Localization and Spectroscopic Analysis of the Cu(I) Binding Site in Wheat Metallothionein Ec-1

Department of Chemistry, University of Zurich, 8057 Zurich, Switzerland
*
Author to whom correspondence should be addressed.
Int. J. Mol. Sci. 2016, 17(3), 371; https://0-doi-org.brum.beds.ac.uk/10.3390/ijms17030371
Submission received: 22 February 2016 / Revised: 3 March 2016 / Accepted: 7 March 2016 / Published: 11 March 2016
(This article belongs to the Special Issue Applied Bioinorganic Chemistry and Selected Papers from 13th ISABC)

Abstract

:
The early cysteine-labeled metallothionein (MT) from Triticum aestivum (common wheat), denoted Ec-1, features two structurally well-defined domains, γ and βE, coordinating two and four Zn(II) ions, respectively. While the protein is currently assumed to function mainly in zinc homeostasis, a low amount of copper ions was also recently detected in a native Ec-1 sample. To evaluate the observed copper binding in more detail, the recombinant Zn6Ec-1 form was exposed to different amounts of Cu(I) ions and the resulting species characterized with spectroscopic methods. Data reveal that the first Cu(I) equivalent coordinates exclusively to the N-terminal γ-domain of the protein and replaces one Zn(II) ion. To analyze the ability of the γ-domain for coordination of monovalent metal ions in more detail, the γ-Ec-1 peptide fragment was incubated with increasing amounts of Cu(I) and the process monitored with UV–VIS, circular dichroism, and luminescence spectroscopy. Closely similar spectra are observed regardless if the apo- or the metal ion-loaded and, hence, pre-folded forms, were used for the titration experiments with Cu(I). The results indicate that low amounts of Cu(I) ions displace the two metal ions subsequently and stoichiometrically, despite the different coordination geometry requirements of Cu(I) and Zn(II).

Graphical Abstract

1. Introduction

Metallothioneins (MTs) are small proteins, typically consisting of up to roughly 90 amino acids, and are characterized by a high cysteine content of up to 30% [1,2]. This feature allows them to bind large numbers of metal ions with a preferentially d10 electron configuration, which are organized in metal-thiolate clusters. In vivo, MTs were shown to incorporate Zn(II), Cd(II), Cu(I), and Hg(II). This ability suggests a role of MTs in traffic and storage of essential metal ions, i.e., mainly Zn(II) and Cu(I) [3,4] in the cell, as well as participation in the detoxification of harmful metal ions, such as Cd(II) and Hg(II) [5]. Free thiolate groups in the apo-forms of MTs were shown to undergo rapid oxidation under physiological conditions, leading to the proposal of a physiological role of MTs in the scavenging of reactive oxygen and nitrogen species [6].
MTs are widely represented in all phyla of life showing a large diversity in their primary amino acid sequences, preference for metal ions, and cluster structures. According to the currently used classification system, all MTs are divided into 15 families based on sequence similarities and phylogenetic relationships [7]. The members of family 15, representing the plant MTs, are additionally separated into four subfamilies according to the observed cysteine pattern, i.e., into the MT1, MT2, MT3, and Ec or early cysteine labeled proteins, sometimes also denoted as MT4 [8]. The latter protein subfamily is the focus of the current work, specifically the Ec-1 MT of Triticum aestivum or common bread wheat. Wheat Ec-1 was the first MT identified in plants and isolated from wheat germ as a Zn(II)-containing form [9]. The observed high Zn(II) content, as well as the mRNA transcription levels that are high in the developing and dry seed but decline rapidly after seed imbibition, suggest a role in intracellular regulation of zinc levels and zinc homeostasis during wheat embryo development [10]. Ec-1 is composed of 81 amino acids and contains three consensus cysteine-rich regions separated by two cysteine free linkers (Scheme 1) [11,12].
The N-terminal cysteine-rich region (amino acids 2–25), also denoted as the γ-domain, hosts a M(II)2Cys6 cluster (PDB IDs 2L61, 2L62) [13]. The central and C-terminal cysteine-rich regions (amino acids 31–81) form the second and larger βE-domain, which encloses a Zn3Cys9 cluster, as well as a single ZnCys2His2 binding site that contains the two highly conserved histidine residues as ligands (PDB ID 2KAK) [14].
A more recent approach attempts to categorize MTs into either Zn- or Cu-thioneins based on their preference for and inducibility by mono- or divalent d10 metal ions [15]. While it was previously assumed that Cu-thioneins mainly occur in yeast, nowadays a role of plant MTs in Cu(I) metabolism including copper resistance, accumulation, and transport is also proposed based on the observed upregulation of certain MT transcripts in response to elevated copper concentrations [16,17,18,19] and growth studies using MT-deficient Arabidopsis plants [20,21]. However, the identification of the in vivo coordinated metal ions and hence the decision if a given MT is truly a Zn- or Cu-, or even a Cd-thionein or alike, is often difficult due to the challenges associated with protein isolation from native hosts.
Using the above definition, the Ec-1 protein belongs to the Zn-thioneins as it was initially purified from wheat germs as a species containing five mol-equivalents of Zn(II) [9]. In addition, recombinant expression in Escherichia coli yields a Zn6Ec-1 species that folds into a well-defined three-dimensional structure as shown by NMR spectroscopy, which further corroborates that Zn(II) is the native metal ion for this protein [13,14]. However, it is peculiar that the intracellular Zn(II) concentration is not correlated to the Ec-1 mRNA levels in the wheat embryo, i.e., transcription of Ec-1 mRNA is not induced by Zn(II), but rather by the plant growth hormone abscisic acid [10].
The here presented study was triggered by a more recent publication, in which a sample of the average composition Zn5.8±0.6Cu0.6±0.1Ec-1 was obtained from wheat germs [22]. While contamination of the sample with Cu(I) during purification cannot be completely excluded, a mixed metal species is in line with the initially-reported Zn5Ec-1 species [9]. From the latter work it is not clear if the sample was analyzed for copper ions and, hence, on a hypothetical basis, additional Cu(I) binding might have been overlooked. Indeed, simultaneous binding of both Zn(II) and Cu(I) to MTs is a known phenomenon, especially in MTs that have been isolated from their native hosts [23,24,25]. In some instances, functional significance of additional Cu(I) binding was shown. For example, the brain-specific MT3 form, also denoted as growth inhibitory factor, as well as the human MT subtype MT-2a are able to prevent copper-mediated aggregation of the amyloid beta peptides Aβ1–40 and Aβ1–42 [26,27]. In the following we will present a number of spectroscopic and analytical analyses aimed to evaluate if low amounts of Cu(I) will be coordinated to a specific-site or randomly bound. This is especially interesting in view of the unique metal ion binding sites observed in the three-dimensional structure of Ec-1: the complex arrangement, which also includes a Zn-finger like ZnCys2His2 binding site and a Zn2Cys6 cluster as known from certain yeast transcription factors [28], distinguishes Ec-1 from the majority of other MTs that show Cys-only coordination of metal ions. The functional significance of this metal ion arrangement is presently unknown, but puts a question mark to a purely homeostatic function. Investigation of Cu(I) binding to Ec-1 is performed with UV–VIS, circular dichroism, and luminescence spectroscopy, as well as limited proteolytic digestion to localize the bound Cu(I) in the γ- or βE-domain.

2. Results and Discussion

The Ec-1 protein used in this study was recombinantly produced in E. coli without an additional purification tag and purified by precipitation and size exclusion chromatography. The purity of the obtained Zn6Ec-1 form was confirmed by electrospray ionization mass spectrometry (ESI-MS, Figure S1), which shows signals for two species with and without the N-terminal methionine residue, a common feature of proteins expressed in E. coli.

2.1. Addition of One Equivalent of Cu(I) to Zn6Ec-1

Due to the higher binding affinity of Cu(I) ions to thiolates, an excess of Cu(I) ions will presumably replace most, or even all, of the coordinated Zn(II) ions in Zn6Ec-1. The question is, if the Cu(I) ions show any specificity for certain binding sites during this process. Therefore, and considering the Zn5.8±0.6Cu0.6±0.1Ec-1 form isolated from wheat germ, we started our investigation with the characterization of a Zn(II)-Ec-1 form containing up to one equivalent of Cu(I). For this, one equivalent of Cu(I) was added to a sample of Zn6Ec-1 followed by the removal of free or weakly bound metal ions with either Chelex® 100 resin, a chelator used for the removal of weakly bound transition metal ions, or by size exclusion chromatography (SEC). Subsequently, metal ion concentrations were determined with flame atomic absorption spectroscopy (F-AAS) and the protein concentration via quantification of thiol groups that are accessible for modification using the 2,2′-dithio-dipyridine (2-PDS) assay (Table S1) [29]. After Chelex® 100 treatment 0.8 equivalents of copper and 5.3 equivalents of Zn(II) were coordinated to Ec-1 indicating the replacement of approximately one Zn(II) ion by Cu(I). A very similar result is obtained after removal of unbound metal ions by SEC, i.e., 0.7 equiv. of Cu(I) and 5.0 equiv. of Zn(II). These results strongly indicate that Cu(I) substitutes bound Zn(II) instead of occupying an additional binding site. MS spectra acquired at pH 2 show that no oxidation of Cys thiolate groups occurred and, in addition, residual binding of one equiv. of Cu(I) to the Ec-1 protein can be observed (Figure S2).
To challenge the question of a potential Cu(I)-induced multimer formation, the hydrodynamic radii (rH) of Zn6Ec-1 and CuZn5Ec-1 were determined with dynamic light scattering (DLS) revealing identical values within the error limits, i.e., 1.73 ± 0.11 and 1.63 ± 0.12 nm, respectively (Figure S3). Assuming a rod-like shape of the metal-loaded proteins this corresponds to a molecular mass of around 6.5 kDa (Mcalc. 7.7 kDa, see Experimental) and hence the observed rH values are assigned to the monomeric proteins. No higher mass species are observed. Similarly, also the elution volumes of the two Ec-1 forms observed with SEC are virtually the same.

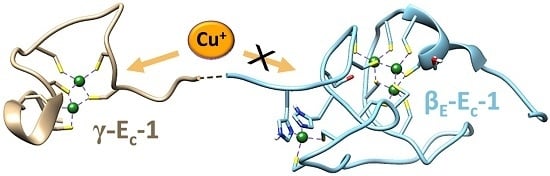
2.2. Identification of the Cu(I) Binding Domain

To identify the site of Cu(I) binding, i.e., binding to the N-terminal γ- versus the C-terminal βE-domain, limited proteolytic digestion using proteinase K was performed, followed by separation of the fragments with SEC and determination of the metal ion concentrations with F-AAS as described before [12]. Three experiments with three replicates each were performed, i.e., digestion of Zn6Ec-1 and of the protein after addition of one or two equivalents of Cu(I). In all cases the SEC chromatograms show two peaks (Figure S4) assigned to the γ- and βE-Ec-1 domains based on previous results [12] and on analysis with mass spectrometry (Figure S5). The Zn(II) and Cu(I) to protein fragment ratios for both fractions of all three protein samples are shown in Figure 1A.
In the absence of Cu(I) ions the βE-domain coordinates four and the γ-domain two Zn(II) ions as expected [11]. After addition of one equiv. of Cu(I), copper ions are exclusively detected in the fraction containing the γ-domain. This is supported by the UV spectra of the two SEC fractions (Figure 1B). While the fraction containing the βE-domain shows solely the typical features of a Zn(II)-binding MT, i.e., a shoulder of the protein backbone transitions around 230 nm assigned to S → Zn(II) charge transfer bands, the UV spectrum of the γ-Ec-1 containing fraction reveals in addition absorption features centered at 260 nm that are attributed to S → Cu(I) charge transfer transitions [30]. As observed, similarly, after addition of 1 equiv. Cu(I) to Zn6Ec-1 (see above and Table S1) the Cu(I):protein ratio for the γ-domain fraction is also lower than 1:1, i.e., only roughly 0.5:1. However, at the same time, 0.5 equiv. of Zn(II) were released and, thus, stoichiometric replacement of Zn(II) by Cu(I) took place suggesting that Cu(I) occupies the same or a very similar binding site as Zn(II). After addition of two equiv. of Cu(I) the binding specificity is lost and copper ions are now also detected in the SEC fraction containing the βE-domain.

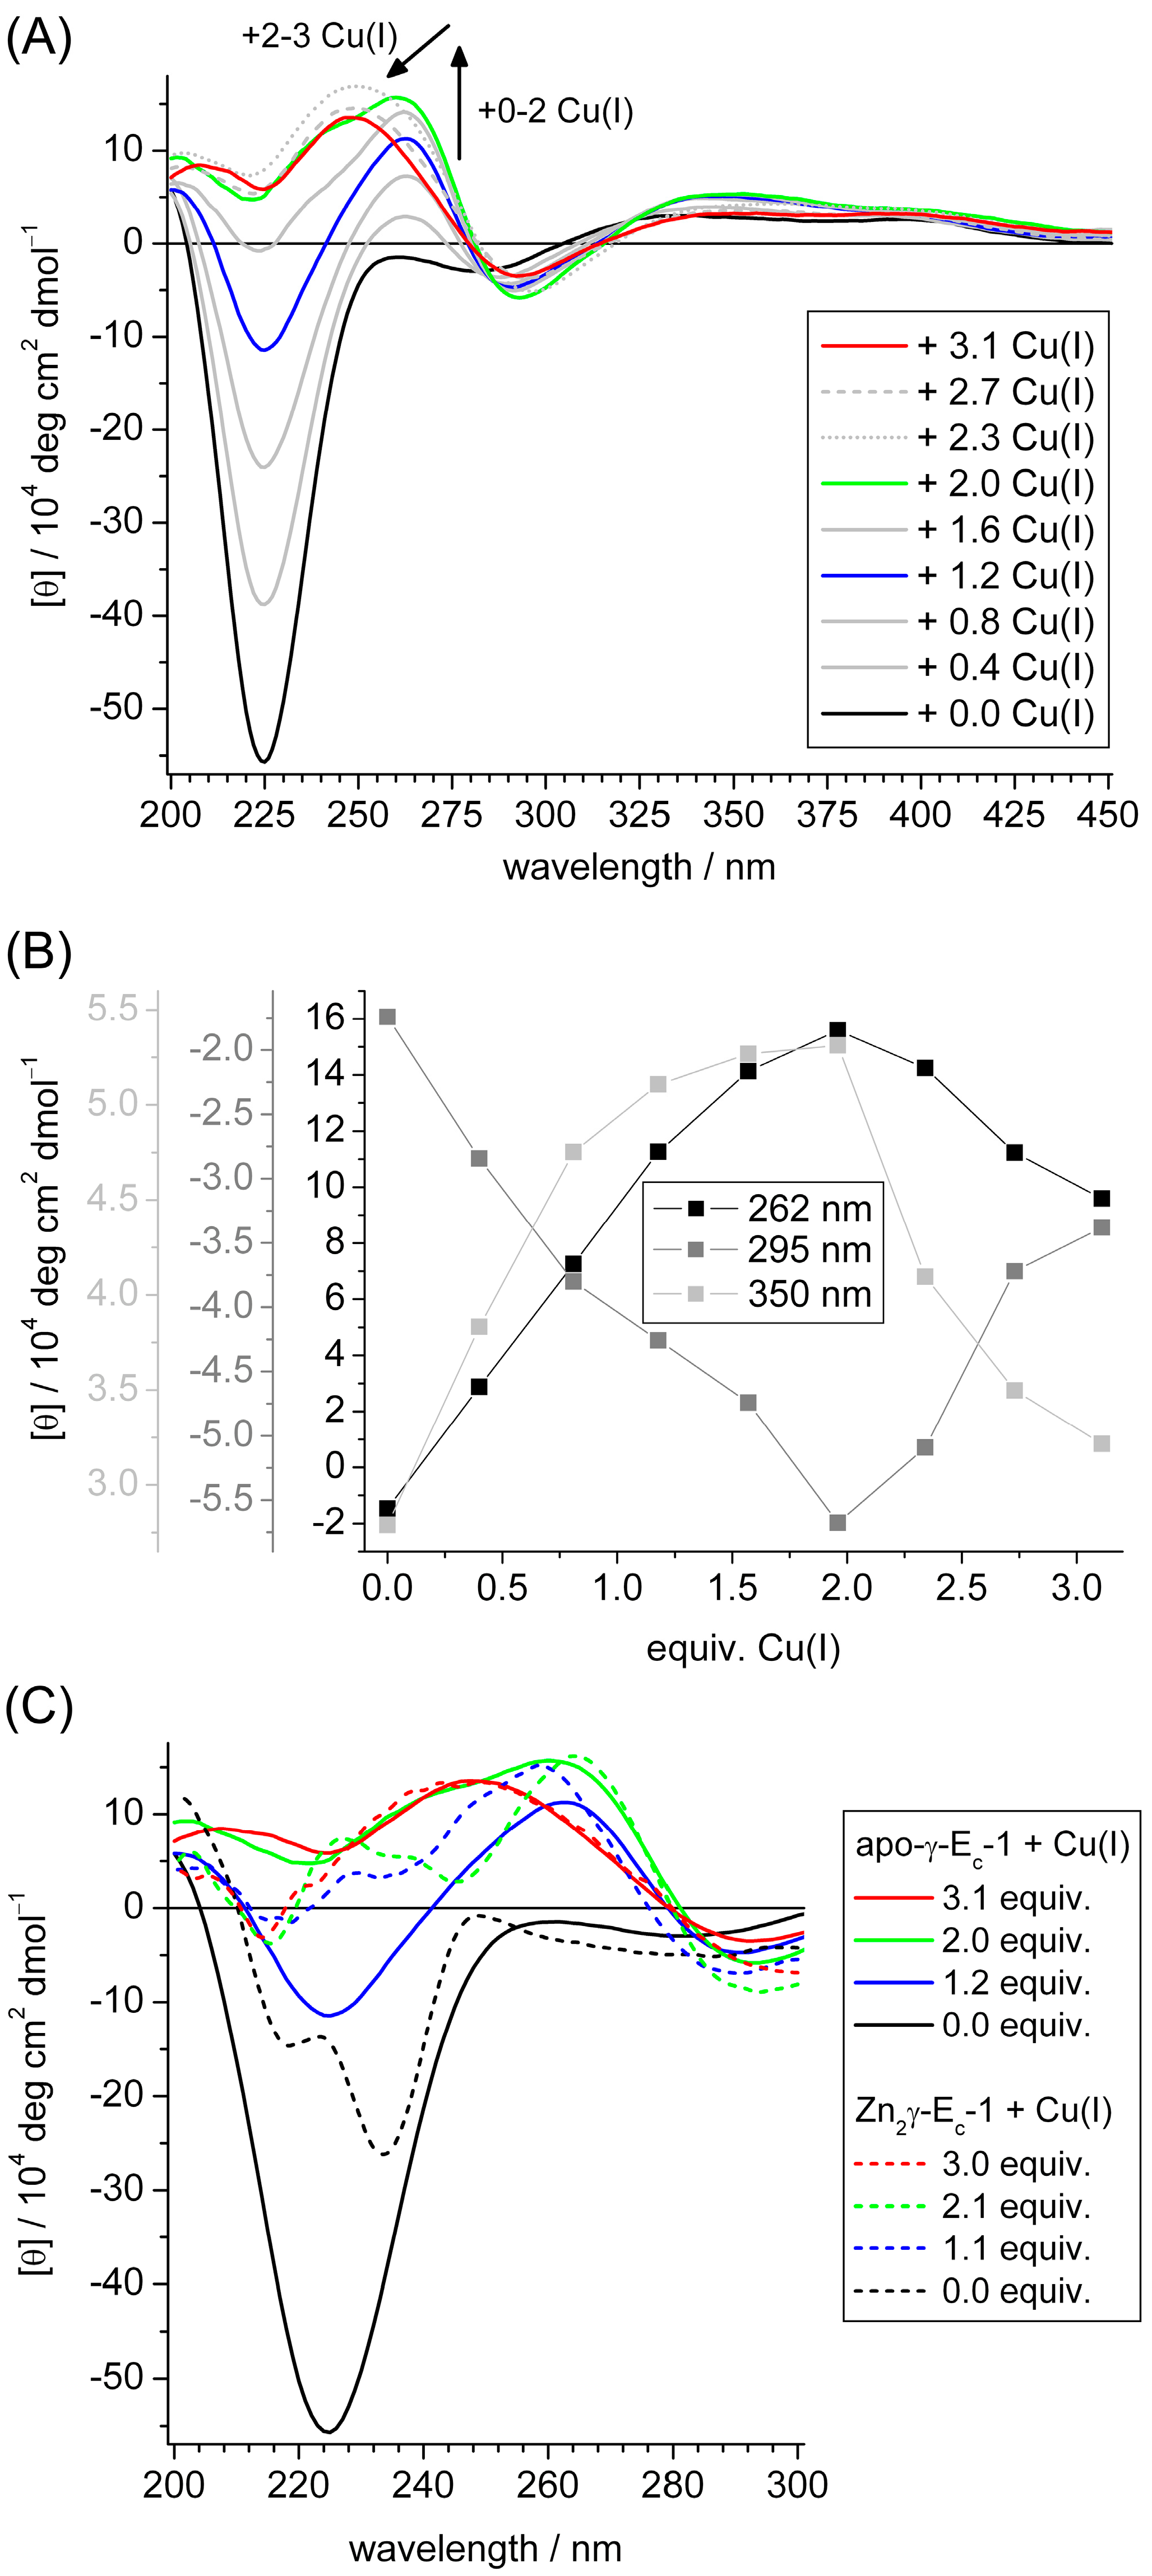
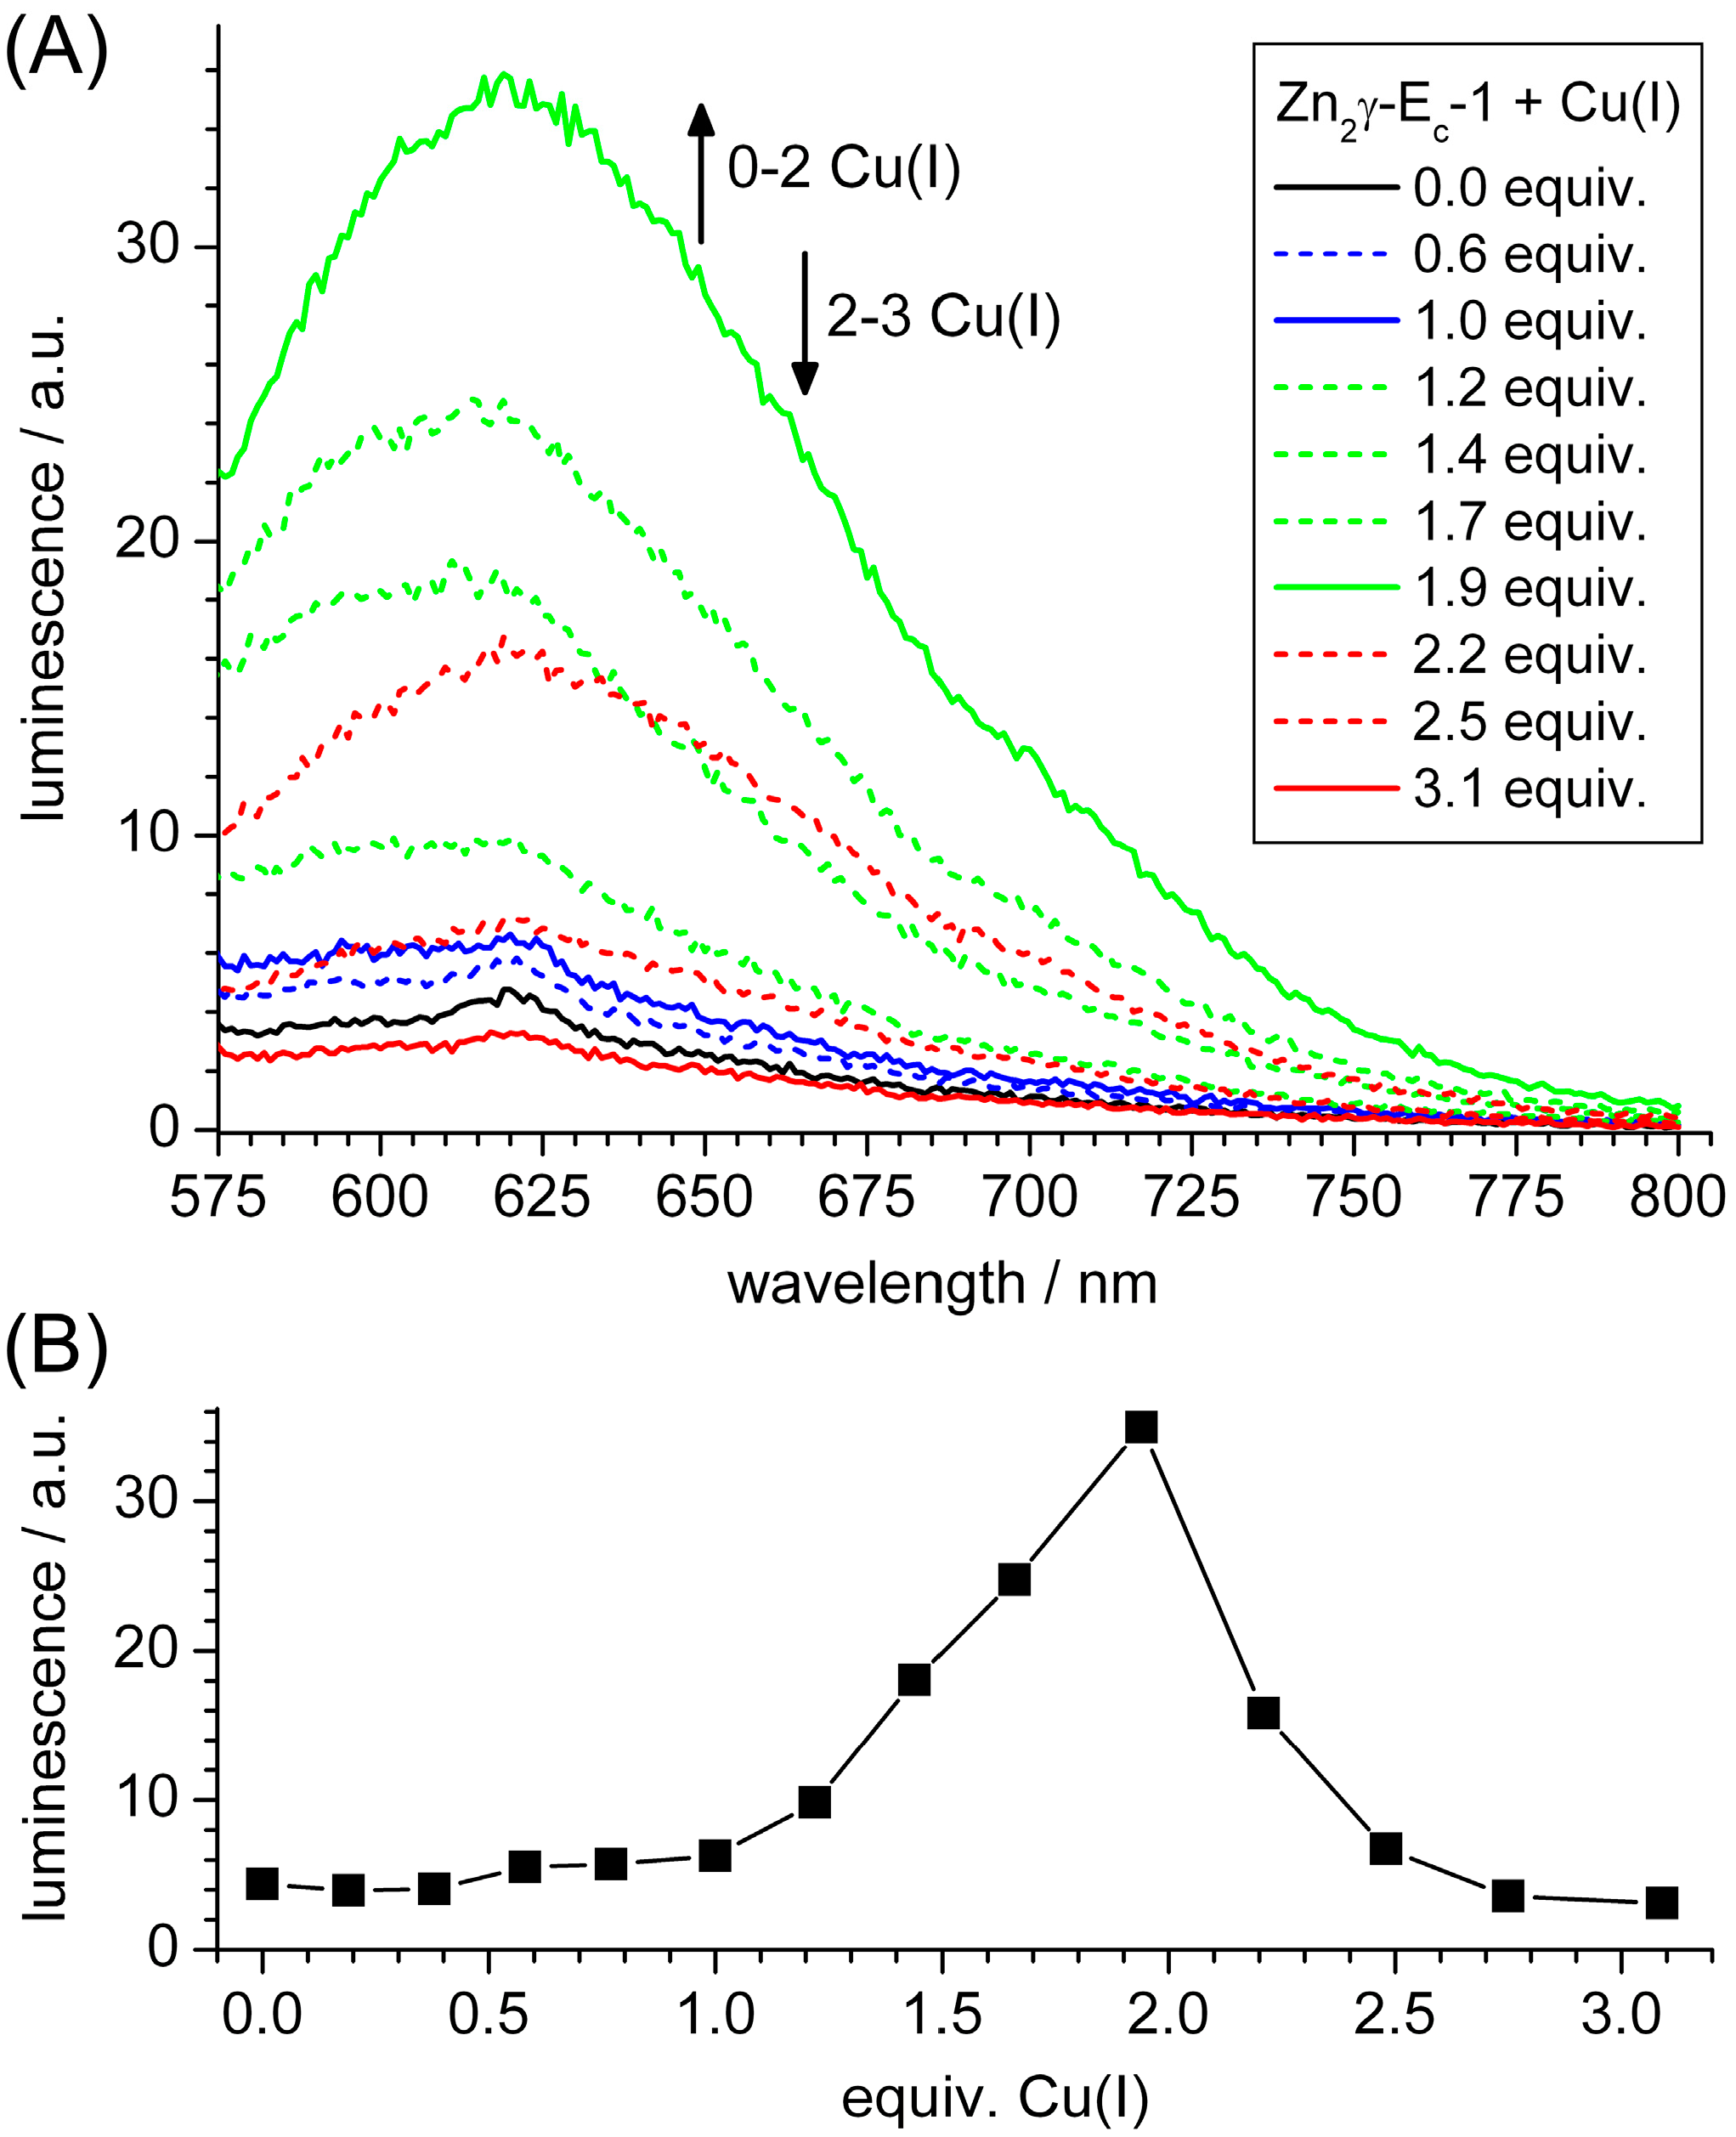
2.3. Spectroscopic Studies of Cu(I) Binding to the Separate γ-Ec-1 Domain

Stoichiometric replacement of a divalent by a monovalent metal ion is peculiar considering the different coordination modes observed for these metal ions in other MTs, i.e., tetrahedral tetrathiolate coordination for Zn(II) and linear or trigonal coordination for Cu(I) [31,32]. To evaluate coordination of monovalent Cu(I) to the N-terminal γ-Ec-1 domain in more detail, titrations were performed with the separate domain and monitored using UV, circular dichroism (CD), and luminescence spectroscopy. For this, a peptide with the sequence depicted in Scheme 2 was used, reflecting the amino acids 2–25 of the full-length protein.
Initial experiments were performed with the Zn2γ-Ec-1 form as it has a defined three-dimensional structure and, hence, pre-formed metal ion binding sites [13]. Cu(I) ions were added stepwise to this form using a solution of the [Cu(CH3CN)4]+ complex in 1%–2% acetonitrile under strictly anaerobic conditions to avoid oxidation to Cu(II).
Addition of Cu(I) ions leads to the development of a broad absorption envelope in the range between 240 and 400 nm dominated by two shoulders (Figure 2A). The prominent shoulder around 262 nm was previously assigned to S → Cu(I) charge transfer bands, while the less intense shoulder around 295 nm was related to cluster centered transitions [30]. These cluster centered transitions originate from d10–d10 overlap in a clustered structure with short Cu(I)–Cu(I) distances. The ligand to metal charge transfer (LMCT) bands centered at 262 nm show a linear increase up to the addition of approximately 2 equiv. of Cu(I) followed by a plateau. The intensity of these transitions is a direct measure for the number of Cys thiolate groups involved in Cu(I) coordination and, hence, allows an estimation of the number of ligands required for the binding of each metal ion [30,33]. Supposing that the maximum intensity at 262 nm reached upon addition of approximately 2 equiv. of Cu(I) results from the involvement of all six Cys thiolate groups of this domain in metal ion coordination, each thiolate ligand contributes approximately 4400 M−1·cm−1 to the overall molar absorptivity. Accordingly, coordination of one Cu(I) ion would require arithmetically 2.6, of two Cu(I) 6.0, and of three Cu(I) 5.8 thiolate ligands (Table 1). Involvement of, in round figures, three thiolate ligands in the coordination of the first Cu(I) ion is in agreement with a trigonal coordination sphere, as observed in the solid state structure of the Saccharomyces cerevisiae Cu8Cup1 metallothionein or in inorganic Cu(I)-thiolate model complexes [32,34]. Coordination of the second Cu(I) ion by another three thiolate ligands points to the formation of two independent metal ion binding sites with trigonal arrangements of terminally-coordinating Cys thiolate ligands each. As no additional thiolate ligands are available for the binding of the third Cu(I) ion, either transformation of originally terminal Cys thiolates to bridging ligands, recruitment of other non-Cys groups for coordination, or/and a structural rearrangement to (partial) linear dithiolate coordination must take place.
Upon addition of more than two equiv. of Cu(I) the absorption at 262 nm remains constant while it still increases in the lower energy region around 295 nm. These changes in the absorption envelope are best visualized in the difference absorption spectra, obtained by subtracting the UV spectrum of the preceding Cu(I) addition from the spectrum of the actual one. The difference spectra showing the spectral changes occurring from 0 → 1, 1 → 2, 2 → 3, and 3 → 4 equiv. of Cu(I) are depicted in Figure 2B. As mentioned above addition of the first two equiv. of Cu(I) leads to the development of a pronounced absorption band centered at 262 nm with shoulders around 236 and 300 nm. Coordination of the third equivalent is accompanied by a dramatic change: while the increase at 262 nm is nearly zero two well-resolved bands centered at 283 and 330 nm appear that fall in the range attributed to cluster centered transitions. The intensity of these transitions is a direct measure for the number of Cu(I) ions coordinated to the protein [33]. After addition of three equiv. of Cu(I) the spectral profile remains mostly constant. The changing contribution of LMCT and cluster-centered transitions, especially upon addition of 2–3 equiv. of Cu(I), is best demonstrated when plotting the ratio ε262 nm295 nm against the equiv. of Cu(I) ions added (Figure 2B, inset; the wavelength of 295 nm was selected for comparability with an analogous evaluation in the literature [30]). This ratio remains roughly constant up to the addition of approximately 1.5 equiv. of Cu(I) and it subsequently decreases up to 3 equivalents to remain constant thereafter. This feature, i.e., an increase in absorptivity of the cluster centered transitions relative to the LMCT bands up to a certain amount of Cu(I) ions, results from a change in the bound Cu(I) to Cys stoichiometry and has been taken previously as an indication for the formation of, or the rearrangement to, a Cu(I)-MT complex with a defined Cu(I)-thiolate cluster structure [33]. A cluster consisting of three Cu(I) ions and six thiolate ligands is exemplified in the literature for an inorganic coordination compound, in which the three Cu(I) ions are arranged in a triangle bridged by three thiolate ligands [34]. The trigonal planar trithiolate coordination sphere is completed by one terminally coordinating thiolate ligand each per Cu(I) ion. Such an arrangement could, in theory, also satisfy the metal to ligand stoichiometry present in a Cu3γ-Ec-1 species.
Analogous changes in band intensities are observed when instead of the Zn2γ-Ec-1 species the Cd2- or apo-γ-Ec-1 forms are titrated with Cu(I) ions (Figure S6). In both cases an increase of the absorptivity at 262 nm up to the addition of two equiv. of Cu(I) ions and a decrease of the ε262 nm295 nm ratio between roughly 1.5 and 3.0 equivalents is observed. The fact that identical results are obtained from the titration of apo-γ-Ec-1 with Cu(I) suggests that the formation of the corresponding Cu(I)-γ-Ec-1 complexes does not depend on the initial presence of a preformed cluster structure with divalent metal ions, i.e., Zn2γ-Ec-1 or Cd2γ-Ec-1.
To evaluate the structural changes induced by Cu(I) coordination further, titrations of apo-, Zn2-, and Cd2γ-Ec-1 were also followed with CD spectroscopy. For the titration of apo-γ-Ec-1 with Cu(I) evolution of extrema at (+)262 nm and (−)295 as well as in the range of (+)320–440 nm are observed (Figure 3A). These bands increase in ellipticity up to addition of two equiv. of Cu(I) and decrease, thereafter (Figure 3B). Addition of the third equiv. of Cu(I) causes a blue shift of the maximum at (+)262 nm to (+)247 nm and a broadening of the band. Hence, clearly, a structural rearrangement from the Cu2- to the Cu3-form takes place. For the titration of Zn2- and Cd2γ-Ec-1 the spectra are more complex due to significant contributions of transitions, originating from the divalent metal ion-thiolate clusters, to the observed ellipticity profile, i.e., up to approximately 275 nm for Zn2γ-Ec-1 with extrema at (−)233.5 and (+)249 nm and up to approximately 300 nm for Cd2γ-Ec-1 with extrema at (+)227, (−)241, (+)250, and (−)258 nm (Figures S7 and S8). Nevertheless, the ellipticity profiles of the species obtained after addition of two and three equiv. of Cu(I) to the Zn2- or apo-form are almost identical in the range above 260 nm (Figure 3C) indicating formation of closely-related species.
In contrast to paramagnetic Cu(II), diamagnetic Cu(I) complexes exhibit a characteristic luminescence spectrum, which is often even observed at room temperature. The spectra recorded during the titration of apo- or Zn2γ-Ec-1 with Cu(I) ions (Figure 4, Figure S9) show development of a broad band with highest intensity upon addition of two equiv. of Cu(I) followed by a decrease and complete disappearance with the addition of three equiv. of Cu(I). While the maximum of this band is initially found at 610 nm, a shift to 620 nm is observed upon addition of two or more Cu(I) ions. The position of these bands does not change with the chosen excitation wavelength, i.e., 260, 280, or 340 nm. Noticeably, the increase of the band intensity is not proportional to the amount of Cu(I) ions added (Figure 4B): up to the addition of one equiv., only a minor increase in luminescence at 610 nm is observed, followed by a steep rise up to addition of two equiv. and a steep decrease to, again, a low luminescence value with further addition to approximately 2.5 equiv. of Cu(I).
A decrease of Cu(I)-thiolate luminescence can occur by solvent quenching due to insufficient shielding by the protein ligand [35]. Accordingly, the Cu(I)-thiolate coordination sites seem to be less shielded in the species obtained after addition of one and three equiv. compared to the species formed in the presence of two equiv. of Cu(I). As it can be assumed that the first Zn(II) ion to be replaced by Cu(I) is most likely the one that is easiest accessible, especially if the exchange is kinetically driven, a rather ineffective shielding of this first Cu(I) binding site by the protein ligand compared to the second site can be easily explained. Considering the titration of apo-γ-Ec-1 with Cu(I), coordination of the first Cu(I) ion requires only three of the six free thiolate ligands. Accordingly, interchange between coordinating and free thiolate ligands can be expected, which will increase structural flexibility and, hence, the solvent exposure of the bound Cu(I) ion. The non-linear luminescence increase observed during the addition of 0–2 equiv. of Cu(I) to any of the γ-Ec-1 forms indicates the non-cooperative formation of the Cu2-species. Hence, first a Cu1-species is formed followed either by a structural rearrangement to the luminescent Cu2-species with a shielded Cu(I)-thiolate core or, alternatively, the observed high luminescence might also solely result from coordination of the second Cu(I) ion in a highly-shielded binding site.
The decreased shielding against the solvent in the Cu3- versus the Cu2-species can be explained by two factors. On the one hand, a Cu3-thiolate cluster is larger and, hence, shielding by the protein ligand might be less efficient. On the other hand, or in addition, the increased Cu(I) to Cys ratio might impose a larger steric strain on the structure to enable Cu(I)-thiolate cluster formation, causing the structure to open up to the solvent.
Non-cooperativity of Cu(I) binding, at least for low Cu(I) to protein stoichiometries, can be also deduced for the full-length Ec-1 protein. Luminescence spectra obtained before and after addition of one equiv. of Cu(I) to Zn6Ec-1 are identical, i.e., no increase of the room temperature luminescence at 610 nm is observed. Considering that the first equiv. of Cu(I) is exclusively bound to the γ-domain (Figure 1), this result strongly indicates the specific formation of a CuZn5-Ec-1 form and the absence of any Cu2Zn4Ec-1 species with two Cu(I) ions bound to the γ-domain as the latter would show strong luminescence. This is significant to note as, e.g., a 1:1 mixture of Cu2Zn4 and Zn6-species cannot be differentiated from a pure CuZn5-species solely based on the determination of metal ion-to-protein ratios.

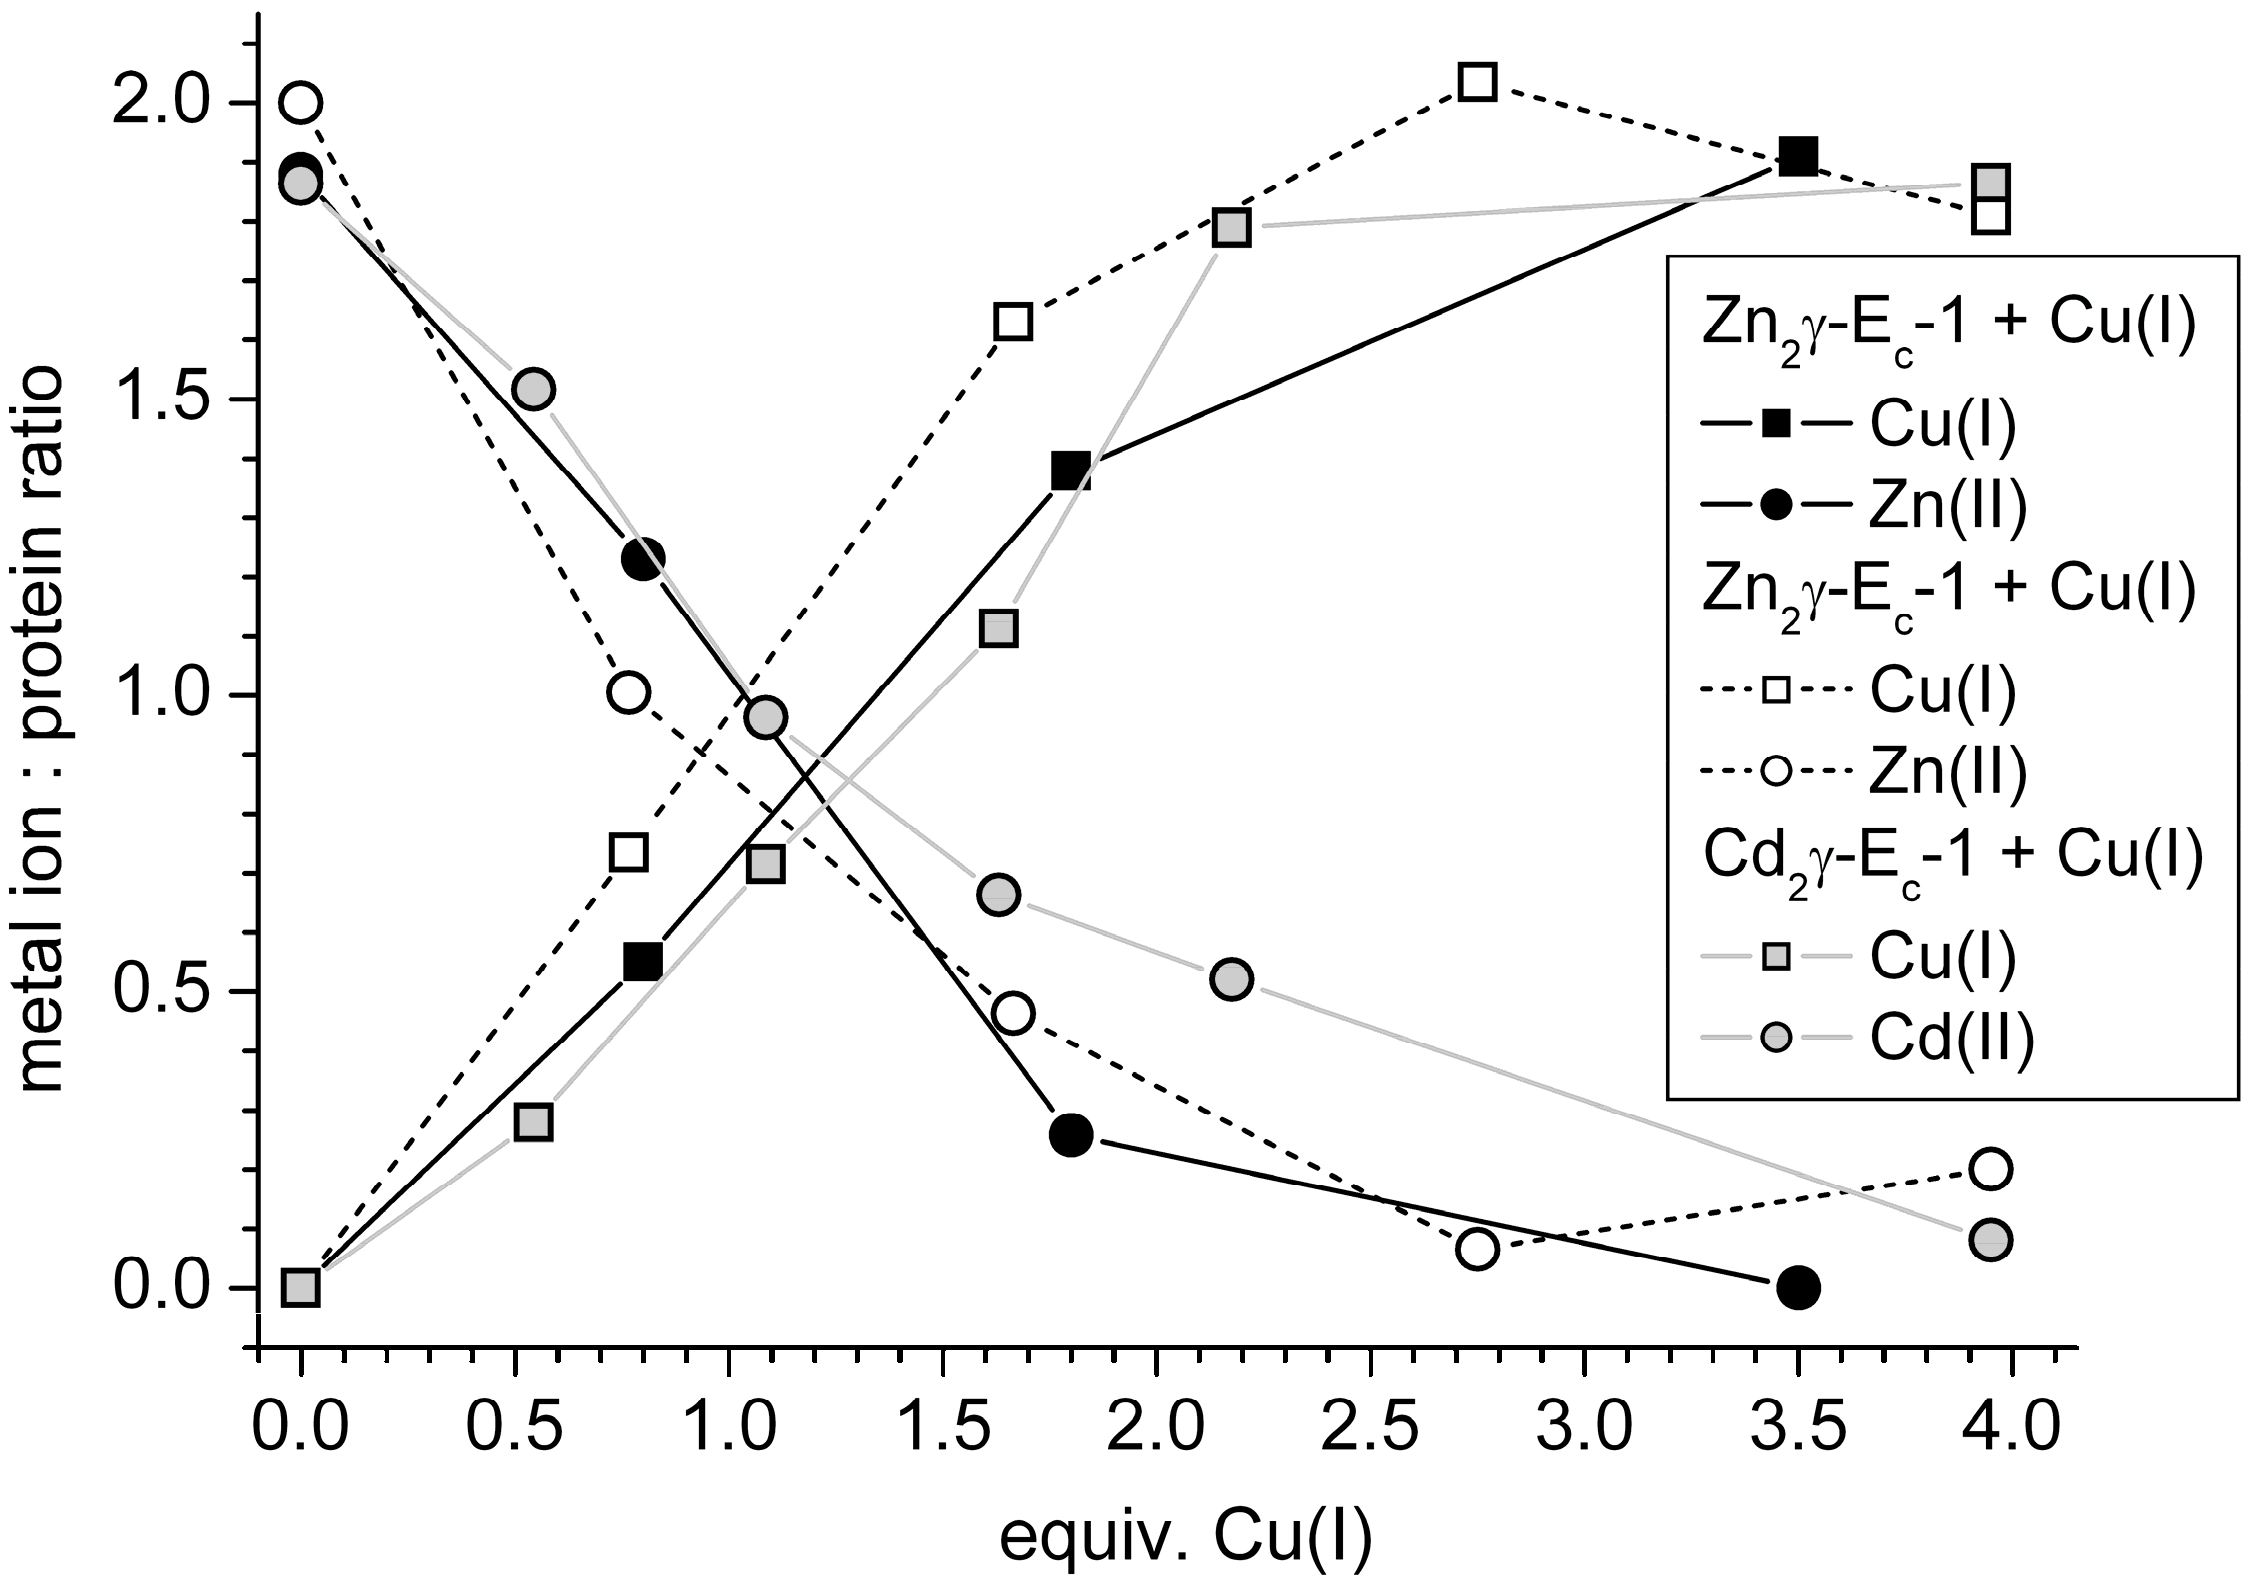
2.4. Metal Ion to Protein Stoichiometries of γ-Ec-1 Species Formed during the Titrations with Cu(I) Ions

Mass spectrometry, as a method to obtain information about the different species formed during the titrations, was not applicable as the quality of the spectra did not allow a clear differentiation between Zn(II) and Cu(I) ions due to the similarity of their masses. A possibility might be the acquisition of spectra at a pH value low enough to release all Zn(II) ions from the Cys thiolate ligands, i.e., around pH 3.5 for Zn2 γ-Ec-1 [36], but high enough to still enable Cu(I) binding, i.e., above pH 3.0 as shown for Cu(I)-substituted human MT-3 and a MT form from Candida albicans [37,38]. Nevertheless and in addition, mass spectroscopy usually does not permit a quantitative analysis of the species, in particular when differently charged forms are to be analyzed. Hence, only bulk metal ion-to-protein stoichiometries were determined here using analytical methods. For this, samples were taken after each addition of Cu(I) ions to Zn2- or Cd2γ-Ec-1, incubated with Chelex® 100 resin to remove loosely bound metal ions, and the respective metal ion content was quantified with F-AAS. The plot representing the metal ion composition of the species is depicted in Figure 5. The data show that the coordinated Zn(II) or Cd(II) ions are replaced stoichiometrically by Cu(I) ions. Additionally, a maximum ratio of two Cu(I) ions per peptide is observed, even after addition of up to four equivalents of Cu(I). Accordingly, binding of the third Cu(I) equivalent, that was observed in the UV, CD, and luminescence spectra, occurs with rather low affinity as this Cu(I) can be removed by Chelex® 100.

2.5. Biologically Relevant or an Artifact?

Clearly the question, if there is any biological role for Cu(I) binding to wheat Ec-1, is impossible to answer with the current knowledge. The expression of Ec or MT4 related genes, and also the production of the encoded proteins in response to Cu(I) ions, was never reported so far; however, it is known for a number of other MTs. For example, when protein extracts from embryos and shoots of rice seeds were germinated for six days in 200 μM Cu(II) solution a five-fold increase of MT2 production was observed compared to seedlings that were not exposed to excess Cu(II) [39]. However, no protein-to-metal contents were determined in this study and hence it is unknown if the MT2 form actually contained copper ions. A correlation between Ec protein production in vivo and Cu(I) ions was so far only suggested by yeast complementation assays, i.e., both A. thaliana Ec forms are able to complement the function of the yeast Cup1 MT leading to greater survival and higher accumulation of copper in the cell [20].
Nevertheless, despite the current assignment of wheat Ec-1 as a typical Zn-thionein, it has to be noted that the fully metal ion-loaded Zn6Ec-1 form has never been isolated from its native in vivo source so far. Therefore, the possibility of an alternative Cu(I)-containing species occurring in vivo cannot be completely ruled out, especially not in light of the results obtained here that show that the Cu(I) ion is not bound adventitiously to the protein, but rather specifically to Cys residues accompanied by replacement of a coordinated Zn(II).

3. Materials and Methods

3.1. Chemicals and Solutions

Tris and IPTG was obtained from Biosolve (Valkenswaard, Netherlands), Chelex® 100 resin from Bio-Rad (Cressier, Switzerland), Luria-Bertani (LB) media used for E. coli expression from Roth AG (Arlesheim, Switzerland), and Tritirachium album proteinase K from Qbiogene (Lucerna Chem AG, Luzern, Switzerland). All other chemicals, including metal salts, were purchased in ACS grade from Sigma-Aldrich (Buchs, Switzerland) and Fluka (Buchs, Switzerland). All solutions were degassed under vacuum, followed by saturation with nitrogen. When complete absence of oxygen was required, solutions were degassed by three freeze-thawing cycles on a vacuum line, and subsequently saturated with argon.

3.2. Protein Expression and Purification

Purification of Zn6Ec-1. For the expression of full-length Ec-1 a construct that was cloned into the pTYB2 vector (New England Biolabs, USA) was used. Insertion of a STOP codon at the protein C-terminus just prior to the C-terminal intein purification tag allows tag-less expression [11]. E. coli BL21 (DE3) cells were grown in LB medium and expression was induced at an OD value at 600 nm of 0.6 by addition of isopropyl β-d-1-thiogalactopyranoside (IPTG) to a final concentration of 1 mM in presence of 1 mM ZnCl2. After 5 h at 30 °C, cells were collected by centrifugation at 6000 g for 10 min at 4 °C. Cell lysis was performed by sonication in 1× phosphate-buffered saline (PBS), pH 8.6, containing 100 mM dithiothreitol (DTT). The cleared cell lysate obtained by centrifugation (30,000 g, 60 min, 4 °C) was titrated drop-wise and under stirring with a 10% (w/w) solution of trifluoroacetic acid (TFA) up to a final concentration of 0.75% (w/w) TFA. The formed white precipitate was removed by centrifugation (13,200 g, 2 min, 4 °C), and the supernatant was, again, treated drop-wise with 100% (w/w) TFA under rigorous stirring up to a final concentration of 4% (w/w) TFA. The mixture was centrifuged again (13,200 g, 2 min, 4 °C) and the resulting solution mixed with a ZnCl2 solution to a final concentration of 10 mM. The pH was raised to pH 3 with a 10 M NaOH solution, Tris base was added to a final concentration of 100 mM and, subsequently, again a 10 M NaOH solution was used to increase the pH to 8–9, accompanied by a color change of the previously colorless solution to reddish brown and the formation of a small amount of a brownish precipitate. After centrifugation (13,200 g, 10 min, 4 °C) the supernatant was dialyzed twice against 1 mM Tris-HCl, 1 mM ZnCl2, pH 8, using SnakeSkin® dialysis tubing (MWCO 3.5 kDa, Perbio Science, Ecublens, Switzerland) and further purified by size exclusion chromatography with a HiLoad 16/600 Superdex 75 pg column (GE Healthcare, Little Chalfont, UK) equilibrated in 10 mM Tris-HCl, 10 mM NaCl, pH 8. Zn6Ec-1 elutes as a monomer around 75 mL. Final protein yields are around 2 mg per liter of cell culture.
The γ-Ec-1 domain was recombinantly expressed as a glutathione S-transferase (GST) fusion protein using the pGEX-4T vector and purified as previously described [13]. To promote complete cleavage of the GST tag by thrombin, two additional Gly and Ser residues were added to the N-terminus of the γ-Ec-1 domain.

3.3. Proteinase K Cleavage

Typically, 0.5 mL of a 60 μM Zn6Ec-1 solution was incubated with proteinase K using a molar ratio of 50:1 in 50 mM Tris-HCl, 10 mM CaCl2, pH 8.0, at room temperature for 40 min without mixing. The digestion mixture was immediately applied to a Superdex Peptide 10/300 GL column (GE Healthcare) that was pre-equilibrated with 10 mM ammonium acetate, pH 7.5. Fractions containing cleaved protein fragments were collected for further analysis. For the analysis of Cu(I) binding, the corresponding amount of Cu(I) (see below) was added prior to proteolytic cleavage and 1% acetonitrile was added to the column buffer. Protein concentrations were determined by thiol group quantification with the 2-PDS assay assuming only five accessible Cys for the γ-domain after addition of 1 or 2 equiv. of Cu(I) based on control experiments and 10 accessible Cys for the fraction containing the βE-domain after addition of 2 equiv. of Cu(I) (see also Table S1) [29]. Metal ion concentrations were determined with F-AAS in 0.2 M HNO3 using an AA240FS spectrometer (Agilent Technologies AG, Basel, Switzerland).

3.4. Titration of γ-Ec-1 with Cu(I)

All titration experiments were performed using a septum sealed cuvette, which was filled under strictly anaerobic conditions within a glove box equipped with a palladium catalyst and filled with a 5% hydrogen/95% nitrogen gas mix (Coy Lab, Grass Lake, MI, USA). A 1 mM Cu(I) solution was prepared from [Cu(MeCN)4](BF4), which was synthesized according to the literature [40], and 2% (v/v) acetonitrile was added to stabilize the Cu(I) oxidation state. The exact concentration was determined by F-AAS and the solution further diluted prior to the experiments so that 4 µL correspond to 1 equiv. of Cu(I). This solution was transferred into a micro syringe (Hamilton, Bonaduz, Switzerland) sealed with paraffin and used to titrate 20 μM solutions of apo-, Zn2-, or Cd2γ-Ec-1 in 10 mM Tris-HCl, 10 mM NaCl, 2% acetonitrile, pH 7.5. At the end of each titration series the actual metal ion content in the cuvette was again assessed by F-AAS to exclude experimental errors.

3.5. CD Spectroscopy

All CD spectra were measured in 10 mM Tris-HCl, 10 mM NaCl, pH 7.5, on a J-715 spectropolarimeter (Jasco, Japan) at 25 °C in the range of 200–500 nm with a scanning speed of 50 nm·min−1 using three acquisitions per spectrum.

3.6. Mass Spectrometry

Samples were prepared in 10 mM ammonium acetate, pH 7.5, in 50% (V/V) acetonitrile and injected directly, or after acidification with HCl to pH 2 for analysis of the apo-forms, in a quadrupole time-of flight (TOF) Ultima API spectrometer (Waters, Elstree, UK). Scans were accumulated and further processed with the software MassLynx 3.5 (Waters, Elstree, UK). Deconvolution of mass spectra was done by applying the maximum entropy algorithm of the MassLynx tool MaxEnt1. Electrospray parameters were capillary voltage 2.8 V and cone voltage 60 V with a source temperature of 80 °C.

3.7. Luminescence Spectroscopy

Luminescence spectra in the range of 300–800 nm were collected at 293 K on a Cary Eclipse Fluorescence Spectrophotometer (Varian AG, Zug, Switzerland) using medium mode for the PMT detector voltage (600 V), an excitation slit width of 5 nm, a scan speed of 600 nm·min−1, and the three excitation wavelengths 260, 280, and 300 nm, corresponding to the observed bands in the absorption spectra. No smoothing function and post-acquisition correction was applied.

3.8. DLS Measurements

DLS measurements were performed with a DynaPro Titan instrument equipped with a temperature controlled micro sampler (Wyatt Technology Corporation, Santa Barbara, CA, USA). The measurements were performed using 50 µL of 50 µM samples at 15 °C in a buffer containing 10 mM Tris-HCl, 10 mM NaCl, 2% acetonitrile, pH 7.5, with 10 data acquisitions per measurement. Protein masses were calculated based on shape models implemented in the Dynamics® software (Wyatt Technology Corporation, Santa Barbara, CA, USA).

4. Conclusions

In view of the Zn5.8±0.6Cu0.6±0.1Ec-1 species obtained from wheat germ [22], the coordination of Cu(I) ions to different Ec-1 forms was investigated in more detail providing the following key results. (i) The first equivalent of Cu(I) is specifically bound to the N-terminal γ-Ec-1 domain with concurrent replacement of one Zn(II) ion. This Cu(I) ion is coordinated by three thiolate ligands; (ii) coordination of a second equiv. of Cu(I) is less domain-specific and accompanied by an increase of the Cu(I) content of both the γ- and the βE-domain; additional studies were conducted with the isolated γ-Ec-1 domain showing (iii) that addition of a second equiv. of Cu(I) leads to the formation of a Cu2 γ-Ec-1 species without residual Zn(II) ions and that all thiolate ligands are involved in Cu(I) coordination. The minor contribution of cluster centered transitions to the absorption spectra suggests a long Cu(I)-Cu(I) distance and consequently the absence of bridging thiolate ligands [30,33]; (iv) with three equiv. of Cu(I) a Cu3γ-Ec-1 species is observed showing cluster centered transitions both in the UV–VIS and CD spectra corroborating some sort of cluster formation. Nevertheless, the binding affinity for the third Cu(I) ion is considerably lower and the metal ion can be removed by incubation with Chelex® 100 resin; (v) the two binding sites in Cu2γ-Ec-1 are occupied sequentially and not cooperatively, as revealed by luminescence spectroscopy; and (vi) luminescence spectra of the full-length protein together with data obtained from limited proteolytic digestion experiments strongly indicate the formation of a CuZn5Ec-1 species after addition of one equiv. of Cu(I) opposed to a mixture of, e.g., Zn6Ec-1 and Cu2Zn4Ec-1 species with two Cu(I) ions coordinated to theγ-Ec-1 domain.
The results gained in this study should be considered as a direction for further studies in vivo. Analysis of the metal ion composition and alteration of Ec-1 concentration on the proteomic and transcriptional level under copper stress conditions will provide valuable insights into the role of plant MTs in response to heavy metal toxicity.

Supplementary Materials

Supplementary materials can be found at https://0-www-mdpi-com.brum.beds.ac.uk/1422-0067/17/3/371/s1.

Acknowledgments

The authors gratefully acknowledge Milan Vašák for helpful discussions, Serge Chesnov for mass spectrometry measurements, and Tiziano Romeli for help with protein purification and apo-γ-Ec-1 titrations. Financial support comes from the University of Zurich (Forschungskredit to Katsiaryna Tarasava), the Swiss National Science Foundation (Eva Freisinger), the Faculty of Natural Sciences, as well as the Department of Chemistry, University of Zurich.

Author Contributions

Katsiaryna Tarasava and Eva Freisinger conceived and designed the experiments, analyzed the data, and wrote the paper; Katsiaryna Tarasava performed the experiments; Jens Loebus developed the protocol for full-length Ec-1 purification.

Conflicts of Interest

The authors declare no conflict of interest.

Abbreviations

The following abbreviations are used in this manuscript:
2-PDS2,2′-dithio-dipyridineF-AASFlame atomic absorption spectroscopy
CDCircular dichroismLMCTLigand-to-metal charge transfer
DLSDynamic light scatteringMTMetallothionein
ESI-MSElectrospray ionization mass spectrometrySECSize exclusion chromatography

References

  1. Blindauer, C.A.; Leszczyszyn, O.I. Metallothioneins: Unparalleled diversity in structures and functions for metal ion homeostasis and more. Nat. Prod. Rep. 2010, 27, 720–741. [Google Scholar] [CrossRef] [PubMed]
  2. Vašák, M.; Meloni, G. Chemistry and biology of mammalian metallothioneins. J. Biol. Inorg. Chem. 2011, 16, 1067–1078. [Google Scholar] [CrossRef] [PubMed]
  3. Jacob, C.; Maret, W.; Vallee, B.L. Control of zinc transfer between thionein, metallothionein, and zinc proteins. Proc. Natl. Acad. Sci. USA 1998, 95, 3489–3494. [Google Scholar] [CrossRef] [PubMed]
  4. Suzuki, K.T.; Someya, A.; Komada, Y.; Ogra, Y. Roles of metallothionein in copper homeostasis: Responses to Cu-deficient diets in mice. J. Inorg. Biochem. 2002, 88, 173–182. [Google Scholar] [CrossRef]
  5. Cobbett, C.; Goldsbrough, P. Phytochelatins and metallothioneins: Roles in heavy metal detoxification and homeostasis. Annu. Rev. Plant Biol. 2002, 53, 159–182. [Google Scholar] [CrossRef] [PubMed]
  6. Anderson, R.S.; Patel, K.M.; Roesijadi, G. Oyster metallothionein as an oxyradical scavenger: Implications for hemocyte defense responses. Dev. Comp. Immunol. 1999, 23, 443–449. [Google Scholar] [CrossRef]
  7. Kojima, Y.; Binz, P.-A.; Kägi, J.H.R. Nomenclature of metallothionein: Proposal for a revision. In Metallothionein IV, 1st ed.; Klaassen, C., Ed.; Birkhäuser Verlag: Basel, Switzerland, 1999; pp. 3–6. [Google Scholar]
  8. Binz, P.-A.; Kägi, J.H.R. Metallothionein: Molecular evolution and classification. In Metallothionein IV; Klaassen, C., Ed.; Birkhäuser Verlag: Basel, Switzerland, 1999; pp. 7–13. [Google Scholar]
  9. Lane, B.G.; Kajioka, R.; Kennedy, T.D. The wheat-germ Ec protein is a zinc-containing metallothionein. Biochem. Cell Biol. 1987, 65, 1001–1005. [Google Scholar] [CrossRef]
  10. Kawashima, I.; Kennedy, T.D.; Chino, M.; Lane, B.G. Wheat Ec metallothionein genes. Like mammalian Zn2+ metallothionein genes, wheat Zn2+ metallothionein genes are conspicuously expressed during embryogenesis. Eur. J. Biochem. 1992, 209, 971–976. [Google Scholar] [CrossRef] [PubMed]
  11. Peroza, E.A.; Al Kaabi, A.; Meyer-Klaucke, W.; Wellenreuther, G.; Freisinger, E. The two distinctive metal ion binding domains of the wheat metallothionein Ec-1. J. Inorg. Biochem. 2009, 103, 342–353. [Google Scholar] [CrossRef] [PubMed]
  12. Peroza, E.A.; Freisinger, E. Metal ion binding properties of Triticum aestivum Ec-1 metallothionein: Evidence supporting two separate metal-thiolate clusters. J. Biol. Inorg. Chem. 2007, 12, 377–391. [Google Scholar] [CrossRef] [PubMed]
  13. Loebus, J.; Peroza, E.A.; Blüthgen, N.; Fox, T.; Meyer-Klaucke, W.; Zerbe, O.; Freisinger, E. Protein and metal cluster structure of the wheat metallothionein domain g-Ec-1. The second part of the puzzle. J. Biol. Inorg. Chem. 2011, 16, 683–694. [Google Scholar] [CrossRef] [PubMed]
  14. Peroza, E.A.; Schmucki, R.; Güntert, P.; Freisinger, E.; Zerbe, O. The bE-domain of the wheat Ec-1 metallothionein: A metal-binding domain with a distinctive structure. J. Mol. Biol. 2009, 387, 207–218. [Google Scholar] [CrossRef] [PubMed]
  15. Palacios, Ò.; Atrian, S.; Capdevila, M. Zn- and Cu-thioneins: A functional classification for metallothioneins? J. Biol. Inorg. Chem. 2011, 16, 991–1009. [Google Scholar] [CrossRef] [PubMed]
  16. De Miranda, J.R.; Thomas, M.A.; Thurman, D.A.; Tomsett, A.B. Metallothionein genes from the flowering plant Mimulus guttatus. FEBS Lett. 1990, 260, 277–280. [Google Scholar] [CrossRef]
  17. Fordham-Skelton, A.P.; Wilson, J.R.; Groom, Q.; Robinson, N.J. Accumulation of metallothionein transcripts in response to iron, copper and zinc: Metallothionein and metal-chelate reductase. Acta Physiol. Plant. 1997, 19, 451–457. [Google Scholar] [CrossRef]
  18. Van Hoof, N.A.L.M.; Hassinen, V.H.; Hakvoort, H.W.J.; Ballintijn, K.F.; Schat, H.; Verkleij, J.A.C.; Ernst, W.H.O.; Karenlampi, S.O.; Tervahauta, A.I. Enhanced copper tolerance in Silene vulgaris (Moench) Garcke populations from copper mines is associated with increased transcript levels of a 2b-type metallothionein gene. Plant Physiol. 2001, 126, 1519–1526. [Google Scholar] [CrossRef] [PubMed] [Green Version]
  19. Zhou, J.M.; Goldsbrough, P.B. Functional homologs of fungal metallothionein genes from Arabidopsis. Plant Cell 1994, 6, 875–884. [Google Scholar] [CrossRef] [PubMed]
  20. Guo, W.-J.; Meetam, M.; Goldsbrough, P. Examining the specific contributions of individual arabidopsis metallothioneins to copper distribution and metal tolerance. Plant Physiol. 2008, 146, 1697–1706. [Google Scholar] [CrossRef] [PubMed]
  21. Benatti, M.R.; Yookongkaew, N.; Meetam, M.; Guo, W.J.; Punyasuk, N.; AbuQamar, S.; Goldsbrough, P. Metallothionein deficiency impacts copper accumulation and redistribution in leaves and seeds of Arabidopsis. New Phytol. 2014, 202, 940–951. [Google Scholar] [CrossRef] [PubMed]
  22. Leszczyszyn, O.I.; Schmid, R.; Blindauer, C.A. Toward a property/function relationship for metallothioneins: Histidine coordination and unusual cluster composition in a zinc-metallothionein from plants. Proteins Struct. Funct. Bioinform. 2007, 68, 922–935. [Google Scholar] [CrossRef] [PubMed]
  23. Chen, P.; Onana, P.; Shaw, C.F.; Petering, D.H. Characterization of calf liver Cu, Zn-metallothionein: Naturally variable Cu and Zn stoichiometries. Biochem. J. 1996, 317, 389–394. [Google Scholar] [CrossRef] [PubMed]
  24. Uchida, Y.; Ihara, Y. The N-terminal portion of growth-inhibitory factor is sufficient for biological activity. J. Biol. Chem. 1995, 270, 3365–3369. [Google Scholar] [PubMed]
  25. Uchida, Y.; Takio, K.; Titani, K.; Ihara, Y.; Tomonaga, M. The growth inhibitory factor that is deficient in the Alzheimers-disease brain is a 68-amino acid metallothionein-like protein. Neuron 1991, 7, 337–347. [Google Scholar] [CrossRef]
  26. Chung, R.S.; Howells, C.; Eaton, E.D.; Shabala, L.; Zovo, K.; Palumaa, P.; Sillard, R.; Woodhouse, A.; Bennett, W.R.; Ray, S.; et al. The native copper- and zinc- binding protein metallothionein blocks copper-mediated Ab aggregation and toxicity in rat cortical neurons. PLoS ONE 2010, 5, e12030. [Google Scholar] [CrossRef] [PubMed]
  27. Meloni, G.; Sonois, V.; Delaine, T.; Guilloreau, L.; Gillet, A.; Teissie, J.; Faller, P.; Vasak, M. Metal swap between Zn7-metallothionein-3 and amyloid-β-Cu protects against amyloid-β toxicity. Nature Chem. Biol. 2008, 4, 366–372. [Google Scholar] [CrossRef] [PubMed] [Green Version]
  28. Marmorstein, R.; Carey, M.; Ptashne, M.; Harrison, S.C. DNA recognition by Gal4-structure of a protein DNA complex. Nature 1992, 356, 408–414. [Google Scholar] [CrossRef] [PubMed]
  29. Pedersen, A.O.; Jacobsen, J. Reactivity of the thiol-group in human and bovine albumin at pH 3–9, as measured by exchange with 2,2′-dithiodipyridine. Eur. J. Biochem. 1980, 106, 291–295. [Google Scholar] [CrossRef] [PubMed]
  30. Pountney, D.L.; Schauwecker, I.; Zarn, J.; Vašák, M. Formation of mammalian Cu8-metallothionein in vitro: Evidence for the existence of two Cu(I)4-thiolate clusters. Biochemistry 1994, 33, 9699–9705. [Google Scholar] [CrossRef] [PubMed]
  31. Braun, W.; Vašák, M.; Robbins, A.H.; Stout, C.D.; Wagner, G.; Kägi, J.H.R.; Wüthrich, K. Comparison of the NMR solution structure and the X-ray crystal-structure of rat metallothionein-2. Proc. Natl. Acad. Sci. USA 1992, 89, 10124–10128. [Google Scholar] [CrossRef] [PubMed]
  32. Calderone, V.; Dolderer, B.; Hartmann, H.J.; Echner, H.; Luchinat, C.; Del Bianco, C.; Mangani, S.; Weser, U. The crystal structure of yeast copper thionein: The solution of a long-lasting enigma. Proc. Natl. Acad. Sci. USA 2005, 102, 51–56. [Google Scholar] [CrossRef] [PubMed]
  33. Roschitzki, B.; Vašák, M. A distinct Cu4-thiolate cluster of human metallothionein-3 is located in the N-terminal domain. J. Biol. Inorg. Chem. 2002, 7, 611–616. [Google Scholar] [CrossRef] [PubMed]
  34. Pulla Rao, C.; Dorfman, J.R.; Holm, R.H. Synthesis and structural systematics of ethane-1,2-dithiolato complexes. Inorg. Chem. 1986, 25, 428–439. [Google Scholar]
  35. Dolderer, B.; Echner, H.; Beck, A.; Hartmann, H.J.; Weser, U.; Luchinat, C.; Del Bianco, C. Coordination of three and four Cu(I) to the α- and β-domain of vertebrate Zn-metallothionein-1, respectively, induces significant structural changes. FEBS J. 2007, 274, 2349–2362. [Google Scholar] [CrossRef] [PubMed]
  36. Tarasava, K.; Freisinger, E. Investigating the influence of histidine residues on the metal ion binding ability of the wheat metallothionein g-Ec-1 domain. J. Inorg. Biochem. 2015, 153, 197–203. [Google Scholar] [CrossRef] [PubMed]
  37. Oh, K.-B.; Watanabe, T.; Matsuoka, H. A novel copper-binding protein with characteristics of a metallothionein from a clinical isolate of Candida albicans. Microbiology 1999, 145, 2423–2429. [Google Scholar] [CrossRef] [PubMed]
  38. Toriumi, S.; Saito, T.; Hosokawa, T.; Takahashi, Y.; Numata, T.; Kurasaki, M. Metal binding ability of metallothionein-3 expressed in Escherichia coli. Basic Clin. Pharmacol. 2005, 96, 295–301. [Google Scholar] [CrossRef] [PubMed]
  39. Zhang, H.X.; Lian, C.L.; Shen, Z.G. Proteomic identification of small, copper-responsive proteins in germinating embryos of Oryza sativa. Ann. Bot. 2009, 103, 923–930. [Google Scholar] [CrossRef] [PubMed]
  40. Dietrich-Buchecker, C.; Sauvage, J.-P. Templated synthesis of interlocked macrocyclic ligands, the catenands. Preparation and characterization of the prototypical bis-30 membered ring system. Tetrahedron 1990, 46, 503–512. [Google Scholar] [CrossRef]
Scheme 1. Amino acid sequence of wheat Ec-1 including the N-terminal Met residue with Cys and His residues highlighted. Residues 2–25 belong to the γ-domain (gray underlined), residues 31–81 to the βE-domain (black underlined).
Ijms 17 00371 g006
Figure 1. (A) Ratios of Zn(II) (black) and Cu(I) (gray) to protein domains after limited proteolytic digestion of Zn6Ec-1 incubated with 0, 1, or 2 equiv. of Cu(I); (B) UV–VIS spectra of fractions from size exclusion chromatography (SEC) containing the γ- (solid line) or βE-Ec-1 domain (dotted line) obtained after proteinase K cleavage of the Zn6Ec-1 species which was incubated with 1 equiv. of Cu(I). The shoulder around 260 nm is assigned to the S → Cu(I) charge transfer transitions and only observed for the γ-Ec-1 domain.
Ijms 17 00371 g001
Scheme 2. Amino acid sequence of the γ-Ec-1 construct used in the study with Cys residues highlighted. The sequence is devoid of the N-terminal Met and contains two extra vector-derived GlySer residues (in parentheses, Materials and Methods). Numbering of residues corresponds to the one of the full-length sequence (see Scheme 1).
Ijms 17 00371 g007
Figure 2. Analysis of the titration of Zn2γ-Ec-1 with Cu(I) ions using UV–VIS spectroscopy. (A) Set of recorded. Dotted spectra indicate the point of constant spectral features. Inset: development of LMCT bands (262 nm) and cluster-centered transitions (295 nm); and (B) difference spectra (see text) of the titration revealing the spectral changes upon Cu(I) addition. Inset: absorptivity ratio ε262 nm295 nm to visualize the changing contribution of LMCT bands versus cluster-centered transitions.
Ijms 17 00371 g002
Figure 3. Titration of apo-γ-Ec-1 with Cu(I) ions followed by CD spectroscopy. (A) Evolution of CD spectra; (B) course of ellipticity values at or close to the wavelength of the maxima observed in the CD spectra; and (C) comparison of selected spectra from (A) with the respective spectra obtained during the titration of Zn2γ-Ec-1 with Cu(I) ions (see Figure S7).
Ijms 17 00371 g003
Figure 4. Dependence of room temperature luminescence at 600 nm after excitation at 280 nm from the amount of Cu(I) added to Zn2γ-Ec-1. (A) Luminescence spectra; and (B) plot of luminescence at 600 nm against the equiv. of Cu(I) added.
Ijms 17 00371 g004
Figure 5. Metal ion composition of γ-Ec-1 species obtained during the titration of Zn2- (two independent experiments) or Cd2Ec-1 with increasing amounts of Cu(I) ions. Loosely-bound metal ions were removed with Chelex® 100 resin, and metal ion concentrations determined with F-AAS.
Ijms 17 00371 g005
Table 1. Molar absorptivity values after addition of the specified amounts of Cu(I) ions to Zn2γ-Ec-1 and arithmetic numbers for the amount of terminal Cys thiolate ligands involved in Cu(I) coordination at each point.
+1 Cu(I)+2 Cu(I)+3 Cu(I)
ε262 nm,M−1·cm−111,52126,20825,226
number −S2.66.05.8

