Imaging Metabolically Active Fat: A Literature Review and Mechanistic Insights


Abstract
:1. Introduction
2. Anatomic Imaging
2.1. Computed Tomography
2.2. Magnetic Resonance Imaging
3. Molecular Imaging with Radiotracers
3.1. 18F-Fluorodeoxyglucose-PET
3.2. 18F-Fluoro-6-Thia-Heptadecanoic Acid (FTHA) PET
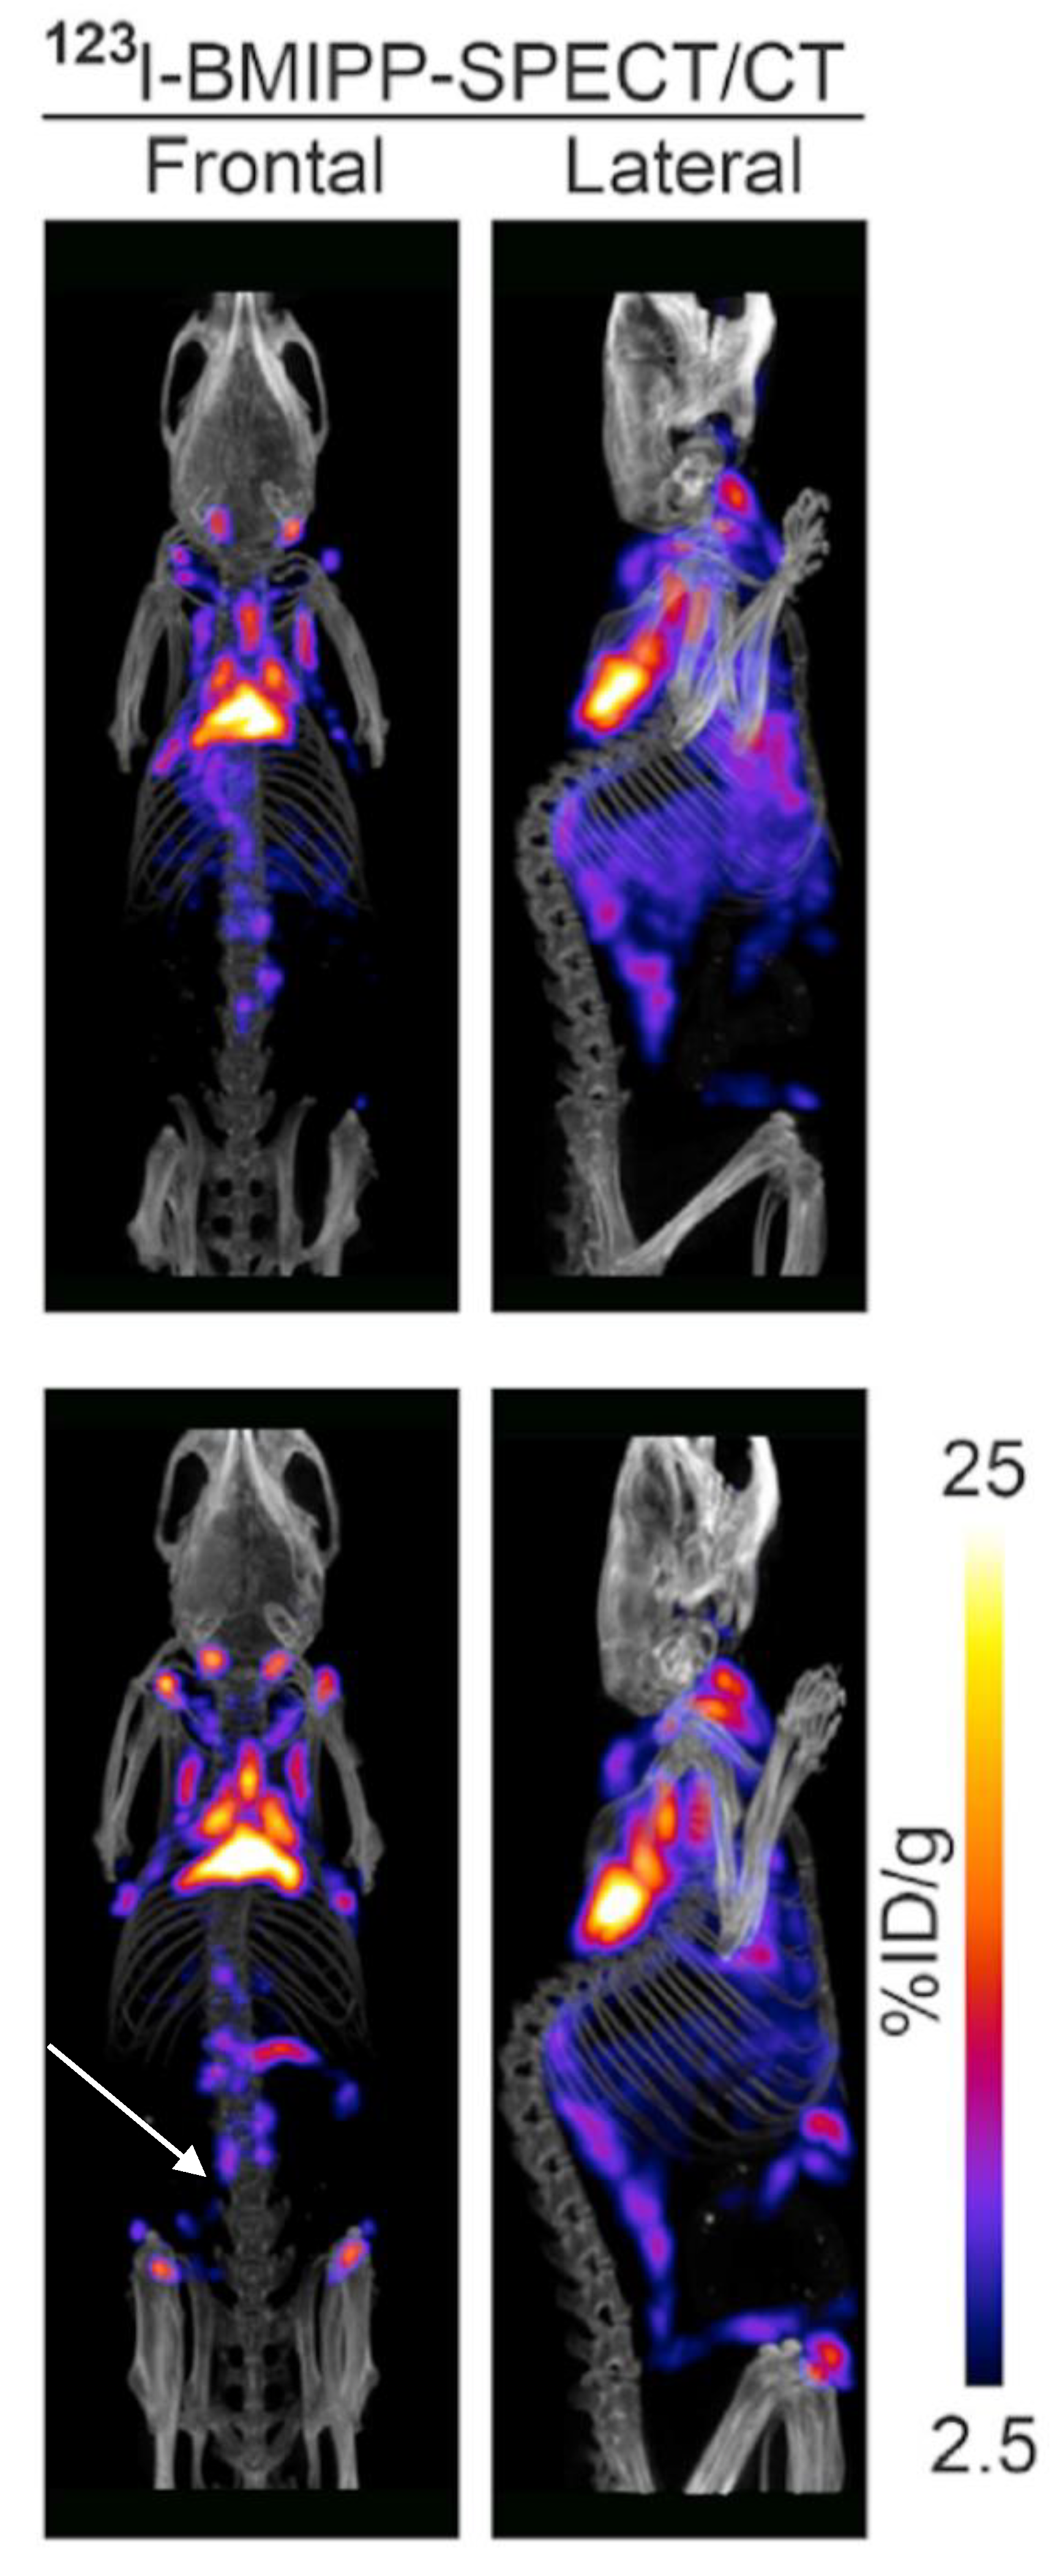
3.3. 123I-Beta-Methyl-Iodophenyl-Pentadecanoic Acid (BMIPP) Single-Photon Emission Computed Tomography (SPECT)/CT
3.4. 11C-Acetate-PET
3.5. Other Radiotracers
4. Emerging Technologies
5. Summary
6. Conclusions
Author Contributions
Funding
Acknowledgments
Conflicts of Interest
Abbreviations
| BMI | Body mass index |
| PET | Positron emission tomography |
| BAT | Brown adipose tissue |
| iBAT | Inducible brown adipose tissue |
| MRI | Magnetic resonance imaging |
| WAT | White adipose tissue |
| CT | Computed tomography |
| HU | Hounsfield unit |
| NIH | National Institutes of Health |
| BARCIST | Brown Adipose Reporting Criteria in Imaging Studies |
| SUV | Standardized uptake values |
| FTHA | Fluoro-6-thia-heptadecanoic acid |
| BMIPP | Beta-methyl-iodophenyl-pentadecanoic acid |
| SPECT | Single-photon emission computed tomography |
| MIBG | Metaiodobenzylguanidine |
| MIBI | Methoxyisobutylisonitrile |
| DNP | Dissolution dynamic nuclear polarization |
| CEUS | Contrast-enhanced ultrasound |
| MSOT | Multispectral optoacoustic tomography |
References
- Smith, K.B.; Smith, M.S. Obesity Statistics. Prim. Care 2016, 43, 121–135. [Google Scholar] [CrossRef]
- Preston, S.H.; Vierboom, Y.C.; Stokes, A. The role of obesity in exceptionally slow US mortality improvement. Proc. Natl. Acad. Sci. USA 2018, 115, 957–961. [Google Scholar] [CrossRef] [Green Version]
- Finkelstein, E.A.; Trogdon, J.G.; Cohen, J.W.; Dietz, W. Annual medical spending attributable to obesity: Payer-and service-specific estimates. Health Aff. (Millwood) 2009, 28, w822–w831. [Google Scholar] [CrossRef] [PubMed]
- Apovian, C.M.; Aronne, L.J.; Bessesen, D.H.; McDonnell, M.E.; Murad, M.H.; Pagotto, U.; Ryan, D.H.; Still, C.D.; Endocrine, S. Pharmacological management of obesity: An endocrine Society clinical practice guideline. J. Clin. Endocrinol. Metab. 2015, 100, 342–362. [Google Scholar] [CrossRef] [PubMed]
- Michael, D.J.; Donna, H.R.; Caroline, M.A.; Jamy, D.A.; Anthony, G.C.; Karen, A.D.; Frank, B.H.; Van, S.H.; John, M.J.; Robert, F.K.; et al. 2013 AHA/ACC/TOS Guideline for the Management of Overweight and Obesity in Adults. Circulation 2014, 129 (Suppl. 2), S102–S138. [Google Scholar] [Green Version]
- Khera, R.; Murad, M.H.; Chandar, A.K.; Dulai, P.S.; Wang, Z.; Prokop, L.J.; Loomba, R.; Camilleri, M.; Singh, S. Association of Pharmacological Treatments for Obesity With Weight Loss and Adverse Events: A Systematic Review and Meta-analysis. JAMA 2016, 315, 2424–2434. [Google Scholar] [CrossRef] [PubMed]
- Lidell, M.E.; Betz, M.J.; Dahlqvist Leinhard, O.; Heglind, M.; Elander, L.; Slawik, M.; Mussack, T.; Nilsson, D.; Romu, T.; Nuutila, P.; et al. Evidence for two types of brown adipose tissue in humans. Nat. Med. 2013, 19, 631–634. [Google Scholar] [CrossRef] [PubMed] [Green Version]
- Pope, M.; Budge, H.; Symonds, M.E. The developmental transition of ovine adipose tissue through early life. Acta Physiol. (Oxf) 2014, 210, 20–30. [Google Scholar] [CrossRef]
- Bahler, L.; Deelen, J.W.; Hoekstra, J.B.; Holleman, F.; Verberne, H.J. Seasonal influence on stimulated BAT activity in prospective trials: A retrospective analysis of BAT visualized on 18F-FDG PET-CTs and 123I-mIBG SPECT-CTs. J. Appl. Physiol. 2016, 120, 1418–1423. [Google Scholar] [CrossRef]
- Cypess, A.M.; Lehman, S.; Williams, G.; Tal, I.; Rodman, D.; Goldfine, A.B.; Kuo, F.C.; Palmer, E.L.; Tseng, Y.-H.; Doria, A.; et al. Identification and importance of brown adipose tissue in adult humans. N. Engl. J. Med. 2009, 360, 1509–1517. [Google Scholar] [CrossRef]
- Cypess, A.M.; Weiner, L.S.; Roberts-Toler, C.; Franquet Elía, E.; Kessler, S.H.; Kahn, P.A.; English, J.; Chatman, K.; Trauger, S.A.; Doria, A.; et al. Activation of human brown adipose tissue by a β3-adrenergic receptor agonist. Cell Metab. 2015, 21, 33–38. [Google Scholar] [CrossRef] [PubMed]
- Wu, J.; Boström, P.; Sparks, L.M.; Ye, L.; Choi, J.H.; Giang, A.-H.; Khandekar, M.; Virtanen, K.A.; Nuutila, P.; Schaart, G.; et al. Beige Adipocytes Are a Distinct Type of Thermogenic Fat Cell in Mouse and Human. Cell 2012, 150, 366–376. [Google Scholar] [CrossRef] [PubMed] [Green Version]
- Chen, K.Y.; Cypess, A.M.; Laughlin, M.R.; Haft, C.R.; Hu, H.H.; Bredella, M.A.; Enerbäck, S.; Kinahan, P.E.; Lichtenbelt, W.V.M.; Lin, F.I.; et al. Brown Adipose Reporting Criteria in Imaging STudies (BARCIST 1.0): Recommendations for Standardized FDG-PET/CT Experiments in Humans. Cell Metab. 2016, 24, 210–222. [Google Scholar] [CrossRef] [PubMed] [Green Version]
- Ouellet, V.; Routhier-Labadie, A.; Bellemare, W.; Lakhal-Chaieb, L.; Turcotte, E.; Carpentier, A.C.; Richard, D. Outdoor temperature, age, sex, body mass index, and diabetic status determine the prevalence, mass, and glucose-uptake activity of 18F-FDG-detected BAT in humans. J. Clin. Endocrinol. Metab. 2011, 96, 192–199. [Google Scholar] [CrossRef] [PubMed]
- Brendle, C.; Werner, M.K.; Schmadl, M.; la Fougère, C.; Nikolaou, K.; Stefan, N.; Pfannenberg, C. Correlation of Brown Adipose Tissue with Other Body Fat Compartments and Patient Characteristics: A Retrospective Analysis in a Large Patient Cohort Using PET/CT. Acad. Radiol. 2018, 25, 102–110. [Google Scholar] [CrossRef]
- Prodhomme, H.; Ognard, J.; Robin, P.; Alavi, Z.; Salaun, P.-Y.; Ben Salem, D. Imaging and identification of brown adipose tissue on CT scan. Clin. Physiol. Funct. Imaging 2018, 38, 186–191. [Google Scholar] [CrossRef]
- Reber, J.; Willershäuser, M.; Karlas, A.; Paul-Yuan, K.; Diot, G.; Franz, D.; Fromme, T.; Ovsepian, S.V.; Bézière, N.; Dubikovskaya, E.; et al. Non-invasive Measurement of Brown Fat Metabolism Based on Optoacoustic Imaging of Hemoglobin Gradients. Cell Metab. 2018, 27, 689–701.e4. [Google Scholar] [CrossRef] [Green Version]
- Martinez-Tellez, B.; Nahon, K.J.; Sanchez-Delgado, G.; Abreu-Vieira, G.; Llamas-Elvira, J.M.; van Velden, F.H.P.; Pereira Arias-Bouda, L.M.; Rensen, P.C.N.; Boon, M.R.; Ruiz, J.R. The impact of using BARCIST 1.0 criteria on quantification of BAT volume and activity in three independent cohorts of adults. Sci. Rep. 2018, 8, 8567. [Google Scholar] [CrossRef]
- Holstila, M.; Pesola, M.; Saari, T.; Koskensalo, K.; Raiko, J.; Borra, R.J.H.; Nuutila, P.; Parkkola, R.; Virtanen, K.A. MR signal-fat-fraction analysis and T2* weighted imaging measure BAT reliably on humans without cold exposure. Metab. Clin. Exp. 2017, 70, 23–30. [Google Scholar] [CrossRef]
- Deng, J.; Neff, L.M.; Rubert, N.C.; Zhang, B.; Shore, R.M.; Samet, J.D.; Nelson, P.C.; Landsberg, L. MRI characterization of brown adipose tissue under thermal challenges in normal weight, overweight, and obese young men. J. Magn. Reson. Imaging 2018, 47, 936–947. [Google Scholar] [CrossRef]
- Jones, T.A.; Wayte, S.C.; Reddy, N.L.; Adesanya, O.; Dimitriadis, G.K.; Barber, T.M.; Hutchinson, C.E. Identification of an optimal threshold for detecting human brown adipose tissue using receiver operating characteristic analysis of IDEAL MRI fat fraction maps. J. Magn. Reson. Imaging 2018, 51, 61–68. [Google Scholar] [CrossRef] [PubMed] [Green Version]
- Hsieh, J. Computed Tomography: Principles, Design, Artifacts, and Recent Advances, 3rd ed.; Society of Photo Optical: Bellingham, WA, USA, 2015; p. 639. [Google Scholar]
- Blake, M.A.; Singh, A.; Setty, B.N.; Slattery, J.; Kalra, M.; Maher, M.M.; Sahani, D.V.; Fischman, A.J.; Mueller, P.R. Pearls and Pitfalls in Interpretation of Abdominal and Pelvic PET-CT. Radiographics 2006, 26, 1335–1353. [Google Scholar] [CrossRef] [PubMed]
- Trattner, S.; Pearson, G.D.N.; Chin, C.; Cody, D.D.; Gupta, R.; Hess, C.P.; Kalra, M.K.; Kofler, J.M.; Krishnam, M.S.; Einstein, A.J. Standardization and optimization of CT protocols to achieve low dose. J. Am. Coll. Radiol. 2014, 11, 271–278. [Google Scholar] [CrossRef] [PubMed]
- Reddy, N.L.; Jones, T.A.; Wayte, S.C.; Adesanya, O.; Sankar, S.; Yeo, Y.C.; Tripathi, G.; McTernan, P.G.; Randeva, H.S.; Kumar, S.; et al. Identification of Brown Adipose Tissue Using MR Imaging in a Human Adult With Histological and Immunohistochemical Confirmation. J. Clin. Endocrinol. Metab. 2014, 99, E117–E121. [Google Scholar] [CrossRef] [Green Version]
- Baba, S.; Jacene, H.A.; Engles, J.M.; Honda, H.; Wahl, R.L. CT Hounsfield units of brown adipose tissue increase with activation: Preclinical and clinical studies. J. Nucl. Med. 2010, 51, 246–250. [Google Scholar] [CrossRef]
- Blondin, D.P.; Labbé, S.M.; Tingelstad, H.C.; Noll, C.; Kunach, M.; Phoenix, S.; Guérin, B.; Turcotte, E.E.; Carpentier, A.C.; Richard, D.; et al. Increased brown adipose tissue oxidative capacity in cold-acclimated humans. J. Clin. Endocrinol. Metab. 2014, 99, E438–E446. [Google Scholar] [CrossRef]
- Ouellet, V.; Labbé, S.M.; Blondin, D.P.; Phoenix, S.; Guérin, B.; Haman, F.; Turcotte, E.E.; Richard, D.; Carpentier, A.C. Brown adipose tissue oxidative metabolism contributes to energy expenditure during acute cold exposure in humans. J. Clin. Investig. 2012, 122, 545–552. [Google Scholar] [CrossRef]
- Dadson, P.; Hannukainen, J.C.; Din, M.U.; Lahesmaa, M.; Kalliokoski, K.K.; Iozzo, P.; Pihlajamäki, J.; Karlsson, H.K.; Parkkola, R.; Salminen, P.; et al. Brown adipose tissue lipid metabolism in morbid obesity: Effect of bariatric surgery-induced weight loss. Diabetes Obes. Metab. 2018, 20, 1280–1288. [Google Scholar] [CrossRef]
- Zhang, F.; Hao, G.; Shao, M.; Nham, K.; An, Y.; Wang, Q.; Zhu, Y.; Kusminski, C.M.; Hassan, G.; Gupta, R.K.; et al. An Adipose Tissue Atlas: An Image-Guided Identification of Human-like BAT and Beige Depots in Rodents. Cell Metab. 2018, 27, 252–262.e3. [Google Scholar] [CrossRef]
- Bauwens, M.; Wierts, R.; van Royen, B.; Bucerius, J.; Backes, W.; Mottaghy, F.; Brans, B. Molecular imaging of brown adipose tissue in health and disease. Eur. J. Nucl. Med. Mol. Imaging 2014, 41, 776–791. [Google Scholar] [CrossRef]
- Shimizu, I.; Aprahamian, T.; Kikuchi, R.; Shimizu, A.; Papanicolaou, K.N.; MacLauchlan, S.; Maruyama, S.; Walsh, K. Vascular rarefaction mediates whitening of brown fat in obesity. J. Clin. Investig. 2014, 124, 2099–2112. [Google Scholar] [CrossRef] [PubMed] [Green Version]
- Pooley, R.A. Fundamental Physics of MR Imaging. Radiographics 2005, 25, 1087–1099. [Google Scholar] [CrossRef] [PubMed] [Green Version]
- Stojanovska, J.; Lumeng, C.N.; Griffin, C.; Hernando, D.; Hoffmann, U.; Haft, J.W.; Kim, K.M.; Burant, C.F.; Singer, K.; Tsodikov, A.; et al. Water-fat magnetic resonance imaging quantifies relative proportions of brown and white adipose tissues: Ex-vivo experiments. J. Med. Imaging (Bellingham) 2018, 5, 024007. [Google Scholar] [CrossRef] [PubMed]
- Romu, T.; Elander, L.; Leinhard, O.D.; Lidell, M.E.; Betz, M.J.; Persson, A.; Enerbäck, S.; Borga, M. Characterization of brown adipose tissue by water-fat separated magnetic resonance imaging. J. Magn. Reson. Imaging 2015, 42, 1639–1645. [Google Scholar] [CrossRef]
- Franssens, B.T.; Eikendal, A.L.; Leiner, T.; van der Graaf, Y.; Visseren, F.L.J.; Hoogduin, J.M. Reliability and agreement of adipose tissue fat fraction measurements with water-fat MRI in patients with manifest cardiovascular disease. NMR Biomed. 2016, 29, 48–56. [Google Scholar] [CrossRef]
- Lundström, E.; Strand, R.; Forslund, A.; Bergsten, P.; Weghuber, D.; Ahlström, H.; Kullberg, J. Automated segmentation of human cervical-supraclavicular adipose tissue in magnetic resonance images. Sci. Rep. 2017, 7, 3064. [Google Scholar] [CrossRef]
- McCallister, A.; Zhang, L.; Burant, A.; Katz, L.; Branca, R.T. A pilot study on the correlation between fat fraction values and glucose uptake values in supraclavicular fat by simultaneous PET/MRI. Magn. Reson. Med. 2017, 78, 1922–1932. [Google Scholar] [CrossRef]
- Stahl, V.; Maier, F.; Freitag, M.T.; Floca, R.O.; Berger, M.C.; Umathum, R.; Berriel Diaz, M.; Herzig, S.; Weber, M.-A.; Dimitrakopoulou-Strauss, A.; et al. In vivo assessment of cold stimulation effects on the fat fraction of brown adipose tissue using DIXON MRI. J. Magn. Reson. Imaging 2017, 45, 369–380. [Google Scholar] [CrossRef]
- Koskensalo, K.; Raiko, J.; Saari, T.; Saunavaara, V.; Eskola, O.; Nuutila, P.; Saunavaara, J.; Parkkola, R.; Virtanen, K.A. Human Brown Adipose Tissue Temperature and Fat Fraction Are Related to Its Metabolic Activity. J. Clin. Endocrinol. Metab. 2017, 102, 1200–1207. [Google Scholar] [CrossRef] [Green Version]
- Gifford, A.; Towse, T.F.; Walker, R.C.; Avison, M.J.; Welch, E.B. Characterizing active and inactive brown adipose tissue in adult humans using PET-CT and MR imaging. Am. J. Physiol. Endocrinol. Metab. 2016, 311, E95–E104. [Google Scholar] [CrossRef]
- Franz, D.; Diefenbach, M.N.; Treibel, F.; Weidlich, D.; Syväri, J.; Ruschke, S.; Wu, M.; Holzapfel, C.; Drabsch, T.; Baum, T.; et al. Differentiating supraclavicular from gluteal adipose tissue based on simultaneous PDFF and T2 * mapping using a 20-echo gradient-echo acquisition. J. Magn. Reson. Imaging 2019, 50, 424–434. [Google Scholar] [CrossRef] [PubMed]
- Wood, J.C.; Enriquez, C.; Ghugre, N.; Tyzka, J.M.; Carson, S.; Nelson, M.D.; Coates, T.D. MRI R2 and R2* mapping accurately estimates hepatic iron concentration in transfusion-dependent thalassemia and sickle cell disease patients. Blood 2005, 106, 1460–1465. [Google Scholar] [CrossRef] [PubMed] [Green Version]
- Kondur, A.K.; Li, T.; Vaitkevicius, P.; Afonso, L. Quantification of Myocardial Iron Overload by Cardiovascular Magnetic Resonance Imaging T2* and Review of the Literature. Clin. Cardiol. 2009, 32, E54–E58. [Google Scholar] [CrossRef] [PubMed]
- Zingaretti, M.C.; Crosta, F.; Vitali, A.; Guerrieri, M.; Frontini, A.; Cannon, B.; Nedergaard, J.; Cinti, S. The presence of UCP1 demonstrates that metabolically active adipose tissue in the neck of adult humans truly represents brown adipose tissue. FASEB J. 2009, 23, 3113–3120. [Google Scholar] [CrossRef]
- Glover, G.H. Overview of Functional Magnetic Resonance Imaging. Neurosurg. Clin. N. Am. 2011, 22, 133–139. [Google Scholar] [CrossRef] [Green Version]
- Chen, Y.-C.I.; Cypess, A.M.; Chen, Y.-C.; Palmer, M.; Kolodny, G.; Kahn, C.R.; Kwong, K.K. Measurement of human brown adipose tissue volume and activity using anatomic MR imaging and functional MR imaging. J. Nucl. Med. 2013, 54, 1584–1587. [Google Scholar] [CrossRef]
- Kapoor, V.; McCook, B.M.; Torok, F.S. An Introduction to PET-CT Imaging. Radiographics 2004, 24, 523–543. [Google Scholar] [CrossRef]
- Labbé, S.M.; Caron, A.; Bakan, I.; Laplante, M.; Carpentier, A.C.; Lecomte, R.; Richard, D. In vivo measurement of energy substrate contribution to cold-induced brown adipose tissue thermogenesis. FASEB J. 2015, 29, 2046–2058. [Google Scholar] [CrossRef]
- Olsen, J.M.; Sato, M.; Dallner, O.S.; Sandström, A.L.; Pisani, D.F.; Chambard, J.C.; Amri, E.Z.; Hutchinson, D.S.; Bengtsson, T. Glucose uptake in brown fat cells is dependent on mTOR complex 2–promoted GLUT1 translocation. J. Cell Biol. 2014, 207, 365–374. [Google Scholar] [CrossRef]
- Cohade, C.; Osman, M.; Pannu, H.K.; Wahl, R.L. Uptake in supraclavicular area fat (USA-Fat): Description on 18F-FDG PET/CT. J. Nucl. Med. 2003, 44, 170–176. [Google Scholar]
- Hany, T.F.; Gharehpapagh, E.; Kamel, E.M.; Buck, A.; Himms-Hagen, J.; von Schulthess, G.K. Brown adipose tissue: A factor to consider in symmetrical tracer uptake in the neck and upper chest region. Eur. J. Nucl. Med. Mol. Imaging 2002, 29, 1393–1398. [Google Scholar] [CrossRef] [PubMed]
- Lee, P.; Greenfield, J.R.; Ho, K.K.Y.; Fulham, M.J. A critical appraisal of the prevalence and metabolic significance of brown adipose tissue in adult humans. Am. J. Physiol. Endocrinol. Metab. 2010, 299, E601–E606. [Google Scholar] [CrossRef] [PubMed] [Green Version]
- Blondin, D.P.; Labbé, S.M.; Turcotte, E.E.; Haman, F.; Richard, D.; Carpentier, A.C. A critical appraisal of brown adipose tissue metabolism in humans. Clin. Lipidol. 2015, 10, 259–280. [Google Scholar] [CrossRef]
- Ong, F.J.; Ahmed, B.A.; Oreskovich, S.M.; Blondin, D.P.; Haq, T.; Konyer, N.B.; Noseworthy, M.D.; Haman, F.; Carpentier, A.C.; Morrison, K.M.; et al. Recent advances in the detection of brown adipose tissue in adult humans: A review. Clin. Sci. 2018, 132, 1039–1054. [Google Scholar] [CrossRef] [PubMed]
- Steinberg, J.D.; Vogel, W.; Vegt, E. Factors influencing brown fat activation in FDG PET/CT: A retrospective analysis of 15,000+ cases. Br. J. Radiol. 2017, 90, 20170093. [Google Scholar] [CrossRef] [PubMed]
- Bos, S.A.; Gill, C.M.; Martinez-Salazar, E.L.; Torriani, M.; Bredella, M.A. Preliminary investigation of brown adipose tissue assessed by PET/CT and cancer activity. Skelet. Radiol. 2018, 48, 413–419. [Google Scholar] [CrossRef]
- Leitner, B.P.; Weiner, L.S.; Desir, M.; Kahn, P.A.; Selen, D.J.; Tsang, C.; Kolodny, G.M.; Cypess, A.M. Kinetics of human brown adipose tissue activation and deactivation. Int. J. Obes. (Lond) 2018, 43, 633–637. [Google Scholar] [CrossRef]
- Pandey, M.K.; Bansal, A.; DeGrado, T.R. Fluorine-18 labeled thia fatty acids for PET imaging of fatty acid oxidation in heart and cancer. Heart Metab. 2011, 51, 15–19. [Google Scholar]
- Labbé, S.M.; Caron, A.; Chechi, K.; Laplante, M.; Lecomte, R.; Richard, D. Metabolic activity of brown, “beige,” and white adipose tissues in response to chronic adrenergic stimulation in male mice. Am. J. Physiol. Endocrinol. Metab. 2016, 311, E260–E268. [Google Scholar] [CrossRef]
- Fujiwara, S.; Takeishi, Y.; Atsumi, H.; Takahashi, K.; Tomoike, H. Fatty acid metabolic imaging with iodine-123-BMIPP for the diagnosis of coronary artery disease. J. Nucl. Med. 1997, 38, 175–180. [Google Scholar]
- Biswas, S.K.; Sarai, M.; Hishida, H.; Ozaki, Y. 123I-BMIPP fatty acid analogue imaging is a novel diagnostic and prognostic approach following acute myocardial infarction. Singap. Med. J. 2009, 50, 943–948. [Google Scholar]
- Yoshizumi, T.; Nozaki, S.; Fukuchi, K.; Yamasaki, K.; Fukuchi, T.; Maruyama, T.; Tomiyama, Y.; Yamashita, S.; Nishimura, T.; Matsuzawa, Y. Pharmacokinetics and metabolism of 123I-BMIPP fatty acid analog in healthy and CD36-deficient subjects. J. Nucl. Med. 2000, 41, 1134–1138. [Google Scholar] [PubMed]
- Tamaki, N.; Yoshinaga, K. Novel iodinated tracers, MIBG and BMIPP, for nuclear cardiology. J. Nucl. Cardiol. 2011, 18, 135–143. [Google Scholar] [CrossRef] [PubMed]
- Richmond, C.R.; Findlay, J.S. Half-life of iodine-125. Health Phys. 1966, 12, 865. [Google Scholar]
- Lyssiotis, C.A.; Cantley, L.C. Acetate fuels the cancer engine. Cell 2014, 159, 1492–1494. [Google Scholar] [CrossRef]
- Jeon, J.Y.; Lee, M.; Whang, S.H.; Kim, J.-W.; Cho, A.; Yun, M. Regulation of Acetate Utilization by Monocarboxylate Transporter 1 (MCT1) in Hepatocellular Carcinoma (HCC). Oncol. Res. 2018, 26, 71–81. [Google Scholar] [CrossRef]
- Lewis, D.Y.; Boren, J.; Shaw, G.L.; Bielik, R.; Ramos-Montoya, A.; Larkin, T.J.; Martins, C.P.; Neal, D.E.; Soloviev, D.; Brindle, K.M. Late Imaging with [1-(11)C]Acetate Improves Detection of Tumor Fatty Acid Synthesis with PET. J. Nucl. Med. 2014, 55, 1144–1149. [Google Scholar] [CrossRef]
- Toyoda, K.; Nakano, A.; Fujibayashi, Y.; Yonekura, Y.; Ueda, T.; Lee, J.-D. Diabetes mellitus impairs myocardial oxygen metabolism even in non-infarct-related areas in patients with acute myocardial infarction. Int. J. Cardiol. 2007, 115, 297–304. [Google Scholar] [CrossRef]
- Hall, A.B.; Ziadi, M.C.; Leech, J.A.; Chen, S.-Y.; Burwash, I.G.; Renaud, J.; deKemp, R.A.; Haddad, H.; Mielniczuk, L.M.; Yoshinaga, K.; et al. Effects of short-term continuous positive airway pressure on myocardial sympathetic nerve function and energetics in patients with heart failure and obstructive sleep apnea: A randomized study. Circulation 2014, 130, 892–901. [Google Scholar] [CrossRef]
- Regula, N.; Häggman, M.; Johansson, S.; Sörensen, J. Malignant lipogenesis defined by 11C-acetate PET/CT predicts prostate cancer-specific survival in patients with biochemical relapse after prostatectomy. Eur. J. Nucl. Med. Mol. Imaging 2016, 43, 2131–2138. [Google Scholar] [CrossRef]
- Leisser, A.; Pruscha, K.; Ubl, P.; Wadsak, W.; Mayerhöfer, M.; Mitterhauser, M.; Hacker, M.; Kramer, G.; Shariat, S.; Karanikas, G.; et al. Evaluation of fatty acid synthase in prostate cancer recurrence: SUV of [(11) C]acetate PET as a prognostic marker. Prostate 2015, 75, 1760–1767. [Google Scholar] [CrossRef] [PubMed]
- Grassi, I.; Nanni, C.; Allegri, V.; Morigi, J.J.; Montini, G.C.; Castellucci, P.; Fanti, S. The clinical use of PET with 11C-acetate. Am. J. Nucl. Med. Mol. Imaging 2011, 2, 33–47. [Google Scholar] [PubMed]
- Labbe, S.M.; Caron, A.; Festuccia, W.T.; Lecomte, R.; Richard, D. Interscapular brown adipose tissue denervation does not promote the oxidative activity of inguinal white adipose tissue in male mice. Am. J. Physiol. Endocrinol. Metab. 2018, 315, E815–E824. [Google Scholar] [CrossRef] [PubMed]
- Admiraal, W.M.; Holleman, F.; Bahler, L.; Soeters, M.R.; Hoekstra, J.B.; Verberne, H.J. Combining 123I-metaiodobenzylguanidine SPECT/CT and 18F-FDG PET/CT for the assessment of brown adipose tissue activity in humans during cold exposure. J. Nucl. Med. 2013, 54, 208–212. [Google Scholar] [CrossRef] [PubMed]
- Baba, S.; Engles, J.M.; Huso, D.L.; Ishimori, T.; Wahl, R.L. Comparison of uptake of multiple clinical radiotracers into brown adipose tissue under cold-stimulated and nonstimulated conditions. J. Nucl. Med. 2007, 48, 1715–1723. [Google Scholar] [CrossRef] [PubMed]
- Muzik, O.; Mangner, T.J.; Leonard, W.R.; Kumar, A.; Granneman, J.G. Sympathetic Innervation of Cold-Activated Brown and White Fat in Lean Young Adults. J. Nucl. Med. 2017, 58, 799–806. [Google Scholar] [CrossRef]
- Cypess, A.M.; Doyle, A.N.; Sass, C.A.; Huang, T.L.; Mowschenson, P.M.; Rosen, H.N.; Tseng, Y.H.; Palmer, E.L., 3rd; Kolodny, G.M. Quantification of human and rodent brown adipose tissue function using 99mTc-methoxyisobutylisonitrile SPECT/CT and 18F-FDG PET/CT. J. Nucl. Med. 2013, 54, 1896–1901. [Google Scholar] [CrossRef]
- u Din, M.; Raiko, J.; Saari, T.; Kudomi, N.; Tolvanen, T.; Oikonen, V.; Teuho, J.; Sipila, H.T.; Savisto, N.; Parkkola, R.; et al. Human brown adipose tissue [(15)O]O2 PET imaging in the presence and absence of cold stimulus. Eur. J. Nucl. Med. Mol. Imaging 2016, 43, 1878–1886. [Google Scholar] [CrossRef]
- Lahesmaa, M.; Eriksson, O.; Gnad, T.; Oikonen, V.; Bucci, M.; Hirvonen, J.; Koskensalo, K.; Teuho, J.; Niemi, T.; Taittonen, M.; et al. Cannabinoid Type 1 Receptors Are Upregulated During Acute Activation of Brown Adipose Tissue. Diabetes 2018, 67, 1226–1236. [Google Scholar] [CrossRef] [Green Version]
- Eriksson, O.; Mikkola, K.; Espes, D.; Tuominen, L.; Virtanen, K.; Forsback, S.; Haaparanta-Solin, M.; Hietala, J.; Solin, O.; Nuutila, P. The Cannabinoid Receptor-1 Is an Imaging Biomarker of Brown Adipose Tissue. J. Nucl. Med. 2015, 56, 1937–1941. [Google Scholar] [CrossRef] [Green Version]
- Hartimath, S.V.; Khanapur, S.; Boominathan, R.; Jiang, L.; Cheng, P.; Yong, F.F.; Tan, P.W.; Robins, E.G.; Goggi, J.L. Imaging adipose tissue browning using the TSPO-18kDa tracer [18F]FEPPA. Mol. Metab. 2019, 25, 154–158. [Google Scholar] [CrossRef] [PubMed]
- Ran, C.; Albrecht, D.S.; Bredella, M.A.; Yang, J.; Liang, S.H.; Cypess, A.M.; Loggia, M.L.; Atassi, N.; Moore, A. PET Imaging of Human Brown Adipose Tissue with the TSPO Tracer [(11)C]PBR28. Mol. Imaging Biol. 2018, 20, 188–193. [Google Scholar] [CrossRef] [PubMed]
- Hettich, M.; Braun, F.; Bartholoma, M.D.; Schirmbeck, R.; Niedermann, G. High-Resolution PET Imaging with Therapeutic Antibody-based PD-1/PD-L1 Checkpoint Tracers. Theranostics 2016, 6, 1629–1640. [Google Scholar] [CrossRef] [PubMed]
- Ingram, J.R.; Dougan, M.; Rashidian, M.; Knoll, M.; Keliher, E.J.; Garrett, S.; Garforth, S.; Blomberg, O.S.; Espinosa, C.; Bhan, A.; et al. PD-L1 is an activation-independent marker of brown adipocytes. Nat. Commun. 2017, 8, 647. [Google Scholar] [CrossRef]
- Sampath, S.C.; Sampath, S.C.; Bredella, M.A.; Cypess, A.M.; Torriani, M. Imaging of Brown Adipose Tissue: State of the Art. Radiology 2016, 280, 4–19. [Google Scholar] [CrossRef] [Green Version]
- Branca, R.T.; He, T.; Zhang, L.; Floyd, C.S.; Freeman, M.; White, C.; Burant, A. Detection of brown adipose tissue and thermogenic activity in mice by hyperpolarized xenon MRI. Proc. Natl. Acad. Sci. USA 2014, 111, 18001–18006. [Google Scholar] [CrossRef] [Green Version]
- Branca, R.T.; McCallister, A.; Yuan, H.; Aghajanian, A.; Faber, J.E.; Weimer, N.; Buchanan, R.; Floyd, C.S.; Antonacci, M.; Zhang, L.; et al. Accurate quantification of brown adipose tissue mass by xenon-enhanced computed tomography. Proc. Natl. Acad. Sci. USA 2018, 115, 174–179. [Google Scholar] [CrossRef]
- Comment, A.; Merritt, M.E. Hyperpolarized magnetic resonance as a sensitive detector of metabolic function. Biochemistry 2014, 53, 7333–7357. [Google Scholar] [CrossRef]
- Park, J.M.; Spielman, D.M.; Josan, S.; Jang, T.; Merchant, M.; Hurd, R.E.; Mayer, D.; Recht, L.D. Hyperpolarized (13)C-lactate to (13)C-bicarbonate ratio as a biomarker for monitoring the acute response of anti-vascular endothelial growth factor (anti-VEGF) treatment. NMR Biomed. 2016, 29, 650–659. [Google Scholar] [CrossRef]
- Lau, A.Z.; Chen, A.P.; Gu, Y.; Ladouceur-Wodzak, M.; Nayak, K.S.; Cunningham, C.H. Noninvasive identification and assessment of functional brown adipose tissue in rodents using hyperpolarized ¹³C imaging. Int. J. Obes. (Lond) 2014, 38, 126–131. [Google Scholar] [CrossRef]
- Riis-Vestergaard, M.J.; Breining, P.; Pedersen, S.B.; Laustsen, C.; Stødkilde-Jørgensen, H.; Borghammer, P.; Jessen, N.; Richelsen, B. Evaluation of Active Brown Adipose Tissue by the Use of Hyperpolarized [1-13C]Pyruvate MRI in Mice. Int. J. Mol. Sci. 2018, 19, 9. [Google Scholar] [CrossRef] [PubMed]
- Baron, D.M.; Clerte, M.; Brouckaert, P.; Raher, M.J.; Flynn, A.W.; Zhang, H.; Carter, E.A.; Picard, M.H.; Bloch, K.D.; Buys, E.S.; et al. In vivo noninvasive characterization of brown adipose tissue blood flow by contrast ultrasound in mice. Circ. Cardiovasc. Imaging 2012, 5, 652–659. [Google Scholar] [CrossRef] [PubMed]
- Flynn, A.; Li, Q.; Panagia, M.; Abdelbaky, A.; MacNabb, M.; Samir, A.; Cypess, A.M.; Weyman, A.E.; Tawakol, A.; Scherrer-Crosbie, M. Contrast-Enhanced Ultrasound: A Novel Noninvasive, Nonionizing Method for the Detection of Brown Adipose Tissue in Humans. J. Am. Soc. Echocardiogr. 2015, 28, 1247–1254. [Google Scholar] [CrossRef] [PubMed] [Green Version]
- Ntziachristos, V.; Razansky, D. Molecular Imaging by Means of Multispectral Optoacoustic Tomography (MSOT). Chem. Rev. 2010, 110, 2783–2794. [Google Scholar] [CrossRef]
- Takx, R.A.P.; Ishai, A.; Truong, Q.A.; MacNabb, M.H.; Scherrer-Crosbie, M.; Tawakol, A. Supraclavicular Brown Adipose Tissue 18F-FDG Uptake and Cardiovascular Disease. J. Nucl. Med. 2016, 57, 1221–1225. [Google Scholar] [CrossRef] [Green Version]
- Prieto, E.; Garcia-Velloso, M.J.; Rodriguez-Fraile, M.; Moran, V.; Garcia-Garcia, B.; Guillen, F.; Morales, M.I.; Sancho, L.; Penuelas, I.; Richter, J.A.; et al. Significant dose reduction is feasible in FDG PET/CT protocols without compromising diagnostic quality. Phys. Med. 2018, 46, 134–139. [Google Scholar] [CrossRef]


| Modality | Feature | WAT Finding | BAT Finding | Radiation | References |
|---|---|---|---|---|---|
| CT | Density (HU) | ↓ | ↑ | + | 16, 22, 25–28 |
| MRI | Fat fraction | ↓ | ↑ | - | 34, 36–39 |
| MRI | Mitochondrial density (T2*/R2*) | ↑ | ↓ | - | 37, 43, 44 |
| FDG-PET/CT | SUV | ↓ | ↑ | ++ | 13, 52–57 |
| FTHA-PET/CT | Fractional uptake rate | ↓ | ↑ | ++ | 28, 48, 59 |
| BMIPP-SPECT/CT | Uptake | ↓ | ↑ | ++ | 30 |
| 11C-Acetate-PET/CT | Kmono | ↓ | ↑ | ++ | 27, 28, 48, 59 |
| 11C-Acetate-PET/CT | K2 | ↓ | ↑ | ++ | 48, 59 |
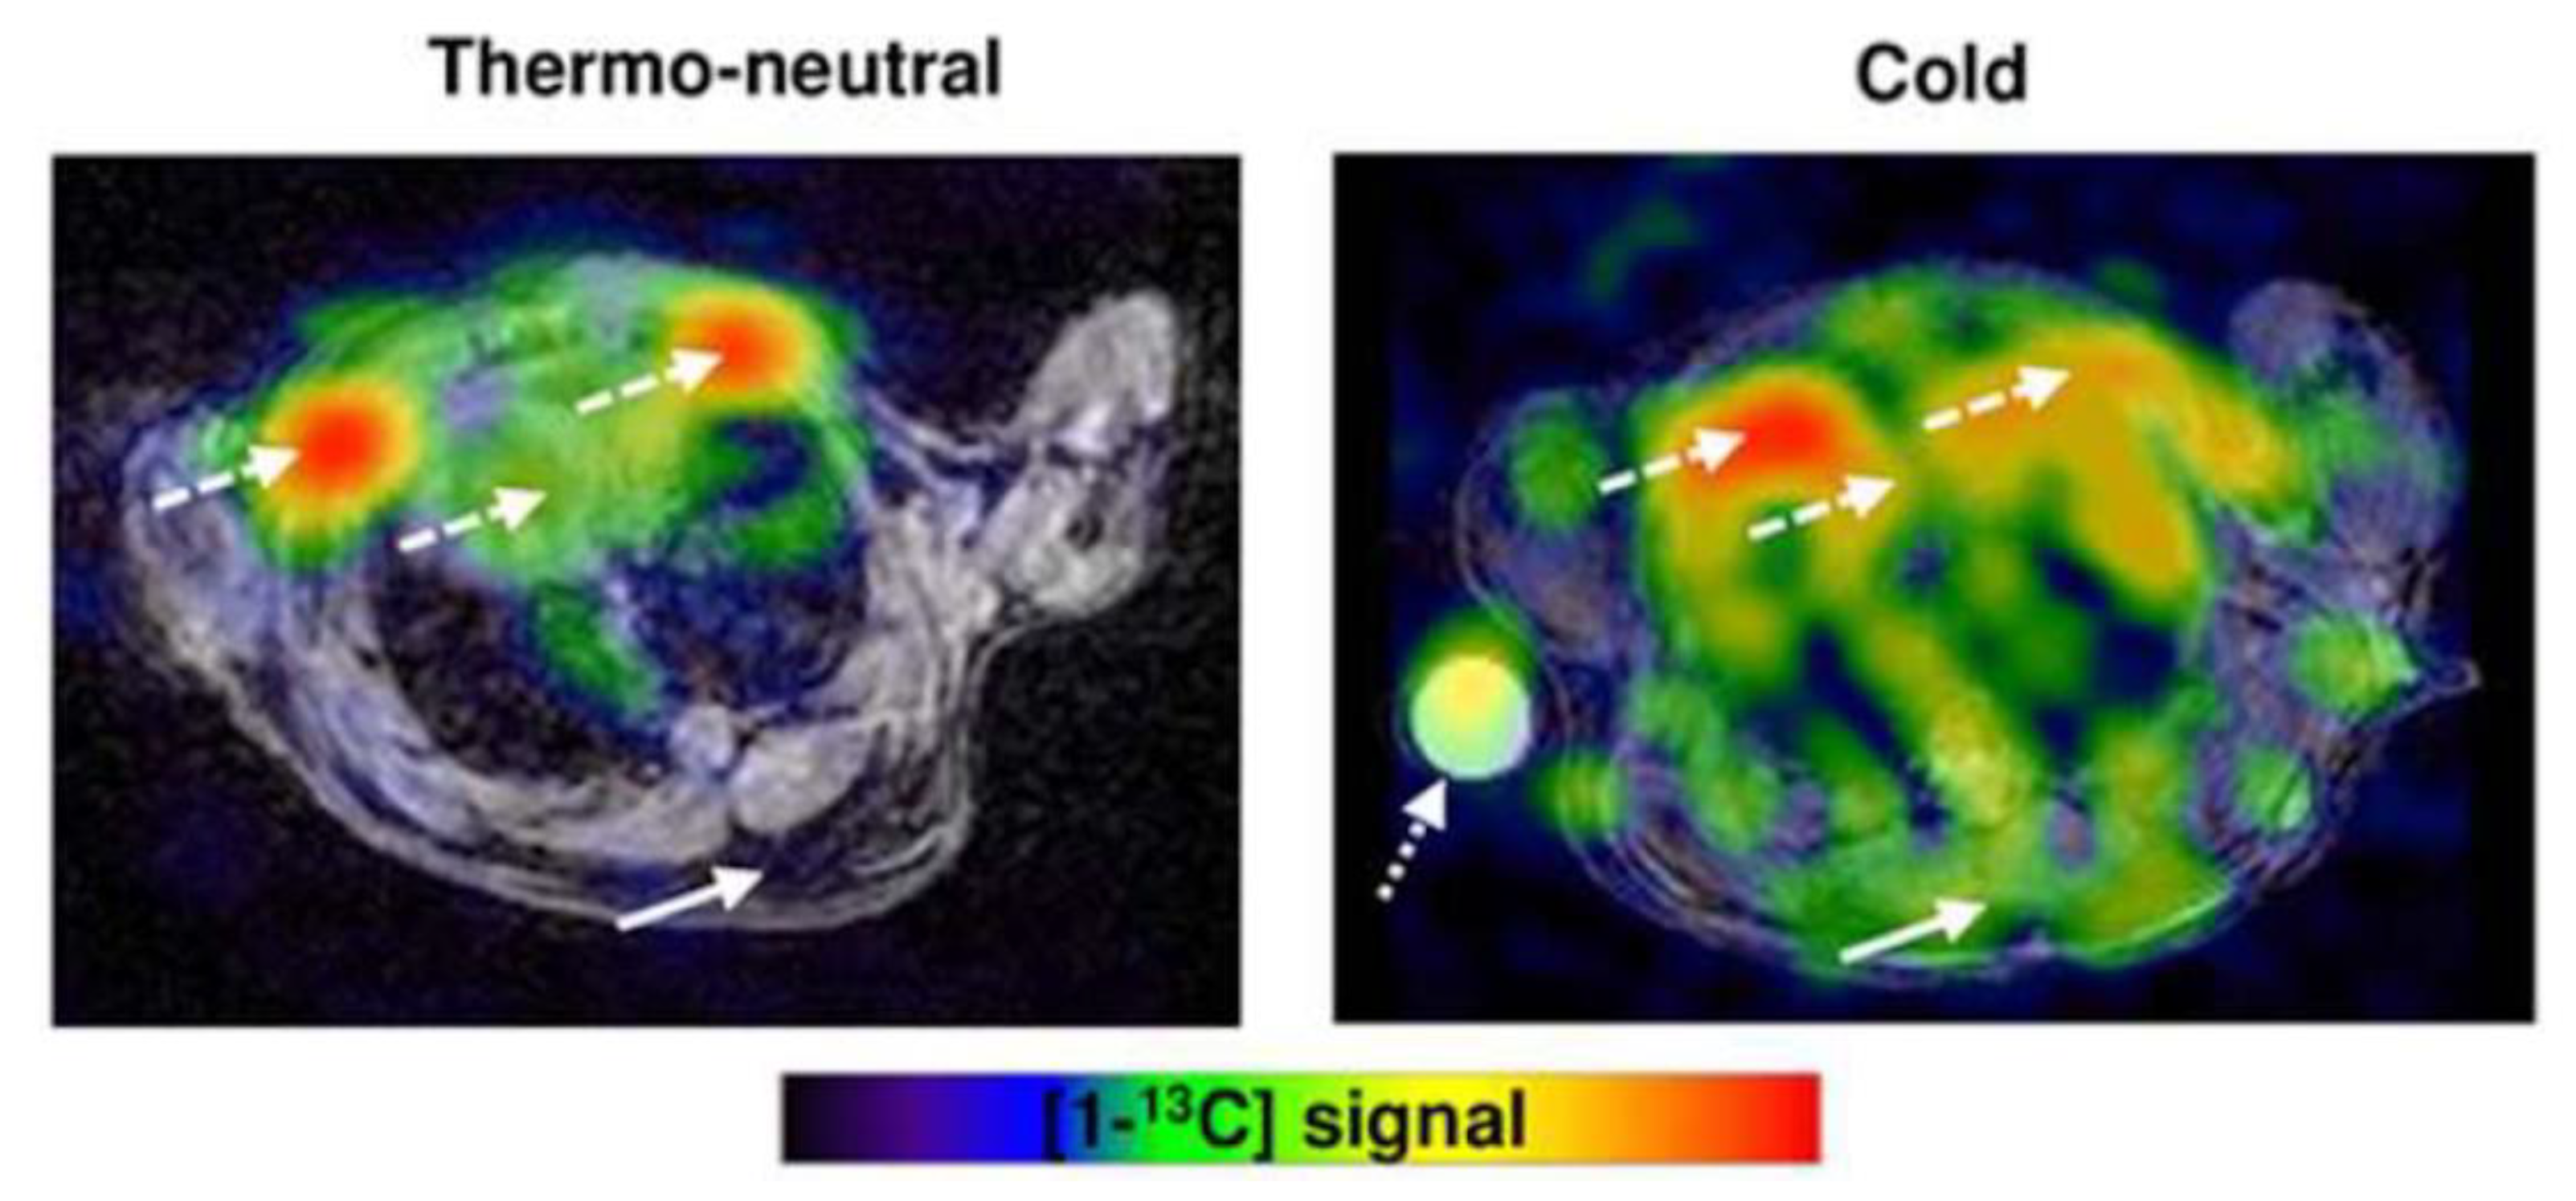
| Hyperpolarized 13C MRI | Total signal | ↓ | ↑ | - | 90, 91 |
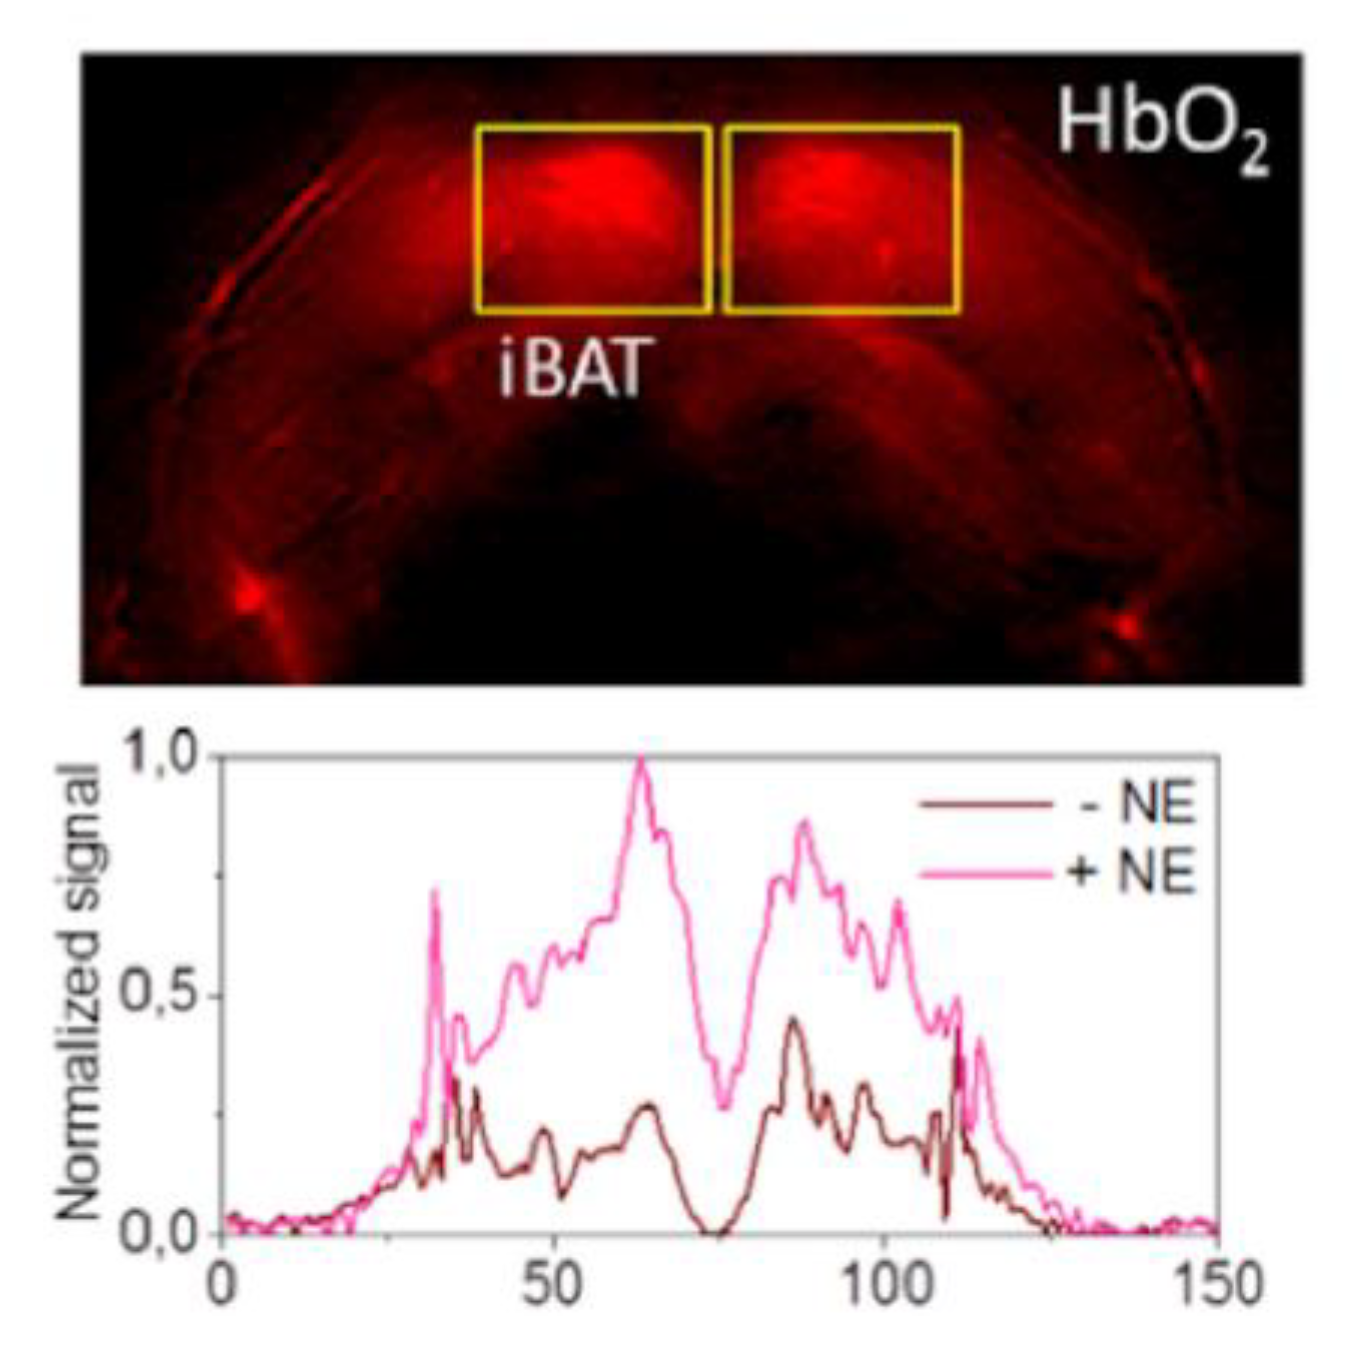
| Contrast-Enhanced Ultrasound | Blood flow | ↓ | ↑ | - | 92-93 |
© 2019 by the authors. Licensee MDPI, Basel, Switzerland. This article is an open access article distributed under the terms and conditions of the Creative Commons Attribution (CC BY) license (http://creativecommons.org/licenses/by/4.0/).
Share and Cite
Frankl, J.; Sherwood, A.; Clegg, D.J.; Scherer, P.E.; Öz, O.K. Imaging Metabolically Active Fat: A Literature Review and Mechanistic Insights. Int. J. Mol. Sci. 2019, 20, 5509. https://0-doi-org.brum.beds.ac.uk/10.3390/ijms20215509
Frankl J, Sherwood A, Clegg DJ, Scherer PE, Öz OK. Imaging Metabolically Active Fat: A Literature Review and Mechanistic Insights. International Journal of Molecular Sciences. 2019; 20(21):5509. https://0-doi-org.brum.beds.ac.uk/10.3390/ijms20215509
Chicago/Turabian StyleFrankl, Joseph, Amber Sherwood, Deborah J. Clegg, Philipp E. Scherer, and Orhan K. Öz. 2019. "Imaging Metabolically Active Fat: A Literature Review and Mechanistic Insights" International Journal of Molecular Sciences 20, no. 21: 5509. https://0-doi-org.brum.beds.ac.uk/10.3390/ijms20215509