Article

Elucidation of Novel Therapeutic Targets for Acute Myeloid Leukemias with RUNX1-RUNX1T1 Fusion

1
Department of Health Sciences and Technology, Samsung Advanced Institute for Health Science and Technology (SAIHST), Sungkyunkwan University, Seoul 06351, Korea
2
Department of Laboratory Medicine & Genetics, Samsung Medical Center, Sungkyunkwan University School of Medicine, Seoul 06351, Korea
3
Single Cell Network Research Center, Sungkyunkwan University of Medicine, Suwon 16419, Korea
4
Department of Anatomy and Cell biology, Sungkyunkwan University School of Medicine, Suwon 16419, Korea
5
Departments of Neurosurgery, Samsung Medical Center, Sungkyunkwan University School of Medicine, Seoul 06351, Korea
6
Department of Laboratory Medicine, Chonnam National University Medical School & Hospital, Gwangju 61469, Korea
7
Samsung Genome Institute, Samsung Medical Center, Seoul 06351, Korea
8
Departments of Molecular Cell Biology, Sungkyunkwan University School of Medicine, Suwon 16419, Korea
*
Authors to whom correspondence should be addressed.
These authors contributed equally to this work.
Int. J. Mol. Sci. 2019, 20(7), 1717; https://0-doi-org.brum.beds.ac.uk/10.3390/ijms20071717
Submission received: 5 March 2019 / Revised: 2 April 2019 / Accepted: 4 April 2019 / Published: 6 April 2019
(This article belongs to the Section Molecular Pathology, Diagnostics, and Therapeutics)

Abstract

:
The RUNX1-RUNX1T1 fusion is a frequent chromosomal alteration in acute myeloid leukemias (AMLs). Although RUNX1-RUNX1T1 fusion protein has pivotal roles in the development of AMLs with the fusion, RUNX1-RUNX1T1, fusion protein is difficult to target, as it lacks kinase activities. Here, we used bioinformatic tools to elucidate targetable signaling pathways in AMLs with RUNX1-RUNX1T1 fusion. After analysis of 93 AML cases from The Cancer Genome Atlas (TCGA) database, we found expression of 293 genes that correlated to the expression of the RUNX1-RUNX1T1 fusion gene. Based on these 293 genes, the cyclooxygenase (COX), vascular endothelial growth factor receptor (VEGFR), platelet-derived growth factor receptor (PDGFR), and fibroblast growth factor receptor (FGFR) pathways were predicted to be specifically activated in AMLs with RUNX1-RUNX1T1 fusion. Moreover, the in vitro proliferation of AML cells with RUNX1-RUNX1T1 fusion decreased significantly more than that of AML cells without the fusion, when the pathways were inhibited pharmacologically. The results indicate that novel targetable signaling pathways could be identified by the analysis of the gene expression features of AMLs with non-targetable genetic alterations. The elucidation of specific molecular targets for AMLs that have a specific genetic alteration would promote personalized treatment of AMLs and improve clinical outcomes.

1. Introduction

Acute myeloid leukemia (AML) with RUNX1-RUNX1T1 fusion consists of up to 5% of all AML or 10% of AML M2 subtype in the French-American-British classification [1]. The RUNX1-RUNX1T1 fusion transcript results in aberrant products that create nuclear transcriptional co-repressor complexes and suppress the expression of RUNX1 target genes [2,3,4]. Since RUNX1T1 silencing with short hairpin RNAs has shown in vitro therapeutic effects on AML cells with the RUNX1-RUNX1T1 fusion [5], RUNX1T1 overexpression has been suggested as a leukemogenesis factor. Alteration in the specificity of RUNX1 to its target sequences by the fusion might also contribute to leukemogenesis [4]. Moreover, the RUNX1-RUNX1T1 fusion is associated with the differential clinical prognosis of AML patients [6].
Specific genomic alterations not only improve our understanding of leukemogenesis mechanisms, but also are potential therapeutic targets for targeted chemotherapies. A good example would be the inhibition of enzymatic kinase activity of BCR-ABL fusion protein in chronic myeloid leukemia (CML) with imatinib (Gleevec®) [7]. However, as it is relatively difficult to prevent the RUNX1-RUNX1T1 fusion protein from mediating non-enzymatic transcriptional repression in vivo, inhibition of signaling pathways modulated in AML cells with the RUNX1-RUNX1T1 fusion cab be considered.
Herein, we utilized the RNA-sequencing (RNA-seq) data of The Cancer Genome Atlas (TCGA) [8], and compared the gene expression profile of seven RUNX1-RUNX1T1 fusion-positive AMLs with those of 86 AMLs that have normal karyotype, in order to systemically identify important cancer signalings and alternative druggable targets of the AMLs with the RUNX1-RUNX1T1 fusion. The analysis revealed specific activation of signaling pathways in the AMLs with the RUNX1-RUNX1T1 fusion, including COX, VEGF, PDGF, and FGFR1, which were pharmacologically inhibited in vitro to show the specific inhibition of the proliferation of AML cells with the RUNX1-RUNX1T1 fusion. Through in silico and in vitro validation, our study provides evidence for repurposing molecular targeting agents approved in different types of cancers or other diseases.

2. Results

2.1. Identification of RUNX1-RUNX1T1 Fusion-Positive AMLs

Seven RUNX1-RUNX1T1 fusion-positive and 86 fusion-negative (without detectable genomic structural abnormalities) AMLs were selected from 200 patients available in the Broad DAC Firehose (Figure 1).
Group-wise comparison of the clinical and pathological characteristics (Table 1) showed a difference in the mean age at diagnosis; the RUNX1-RUNX1T1 fusion-positive patients were significantly younger than the fusion-negative patients (p < 0.01). In peripheral blood analysis (Table 1), the RUNX1-RUNX1T1 fusion-positive patients had significantly lower blast counts (p < 0.01), hemoglobin measurements (p < 0.01), and platelet counts (p < 0.01) at diagnosis. Significantly lower bone marrow cellularity was also observed in the RUNX1-RUNX1T1 fusion-positive AMLs (p < 0.01, Table 1). Although it was not exclusive, the CD19 expression ratio of cancer cells was significantly higher in the AMLs with RUNX1-RUNX1T1 fusion.
These clinical and pathological features of the RUNX1-RUNX1T1 fusion-positive AMLs were well-matched with those recorded in previous reports [9,10,11,12], indicating the validity of selecting the AMLs with RUNX1-RUNX1T1 fusion in the TCGA database.

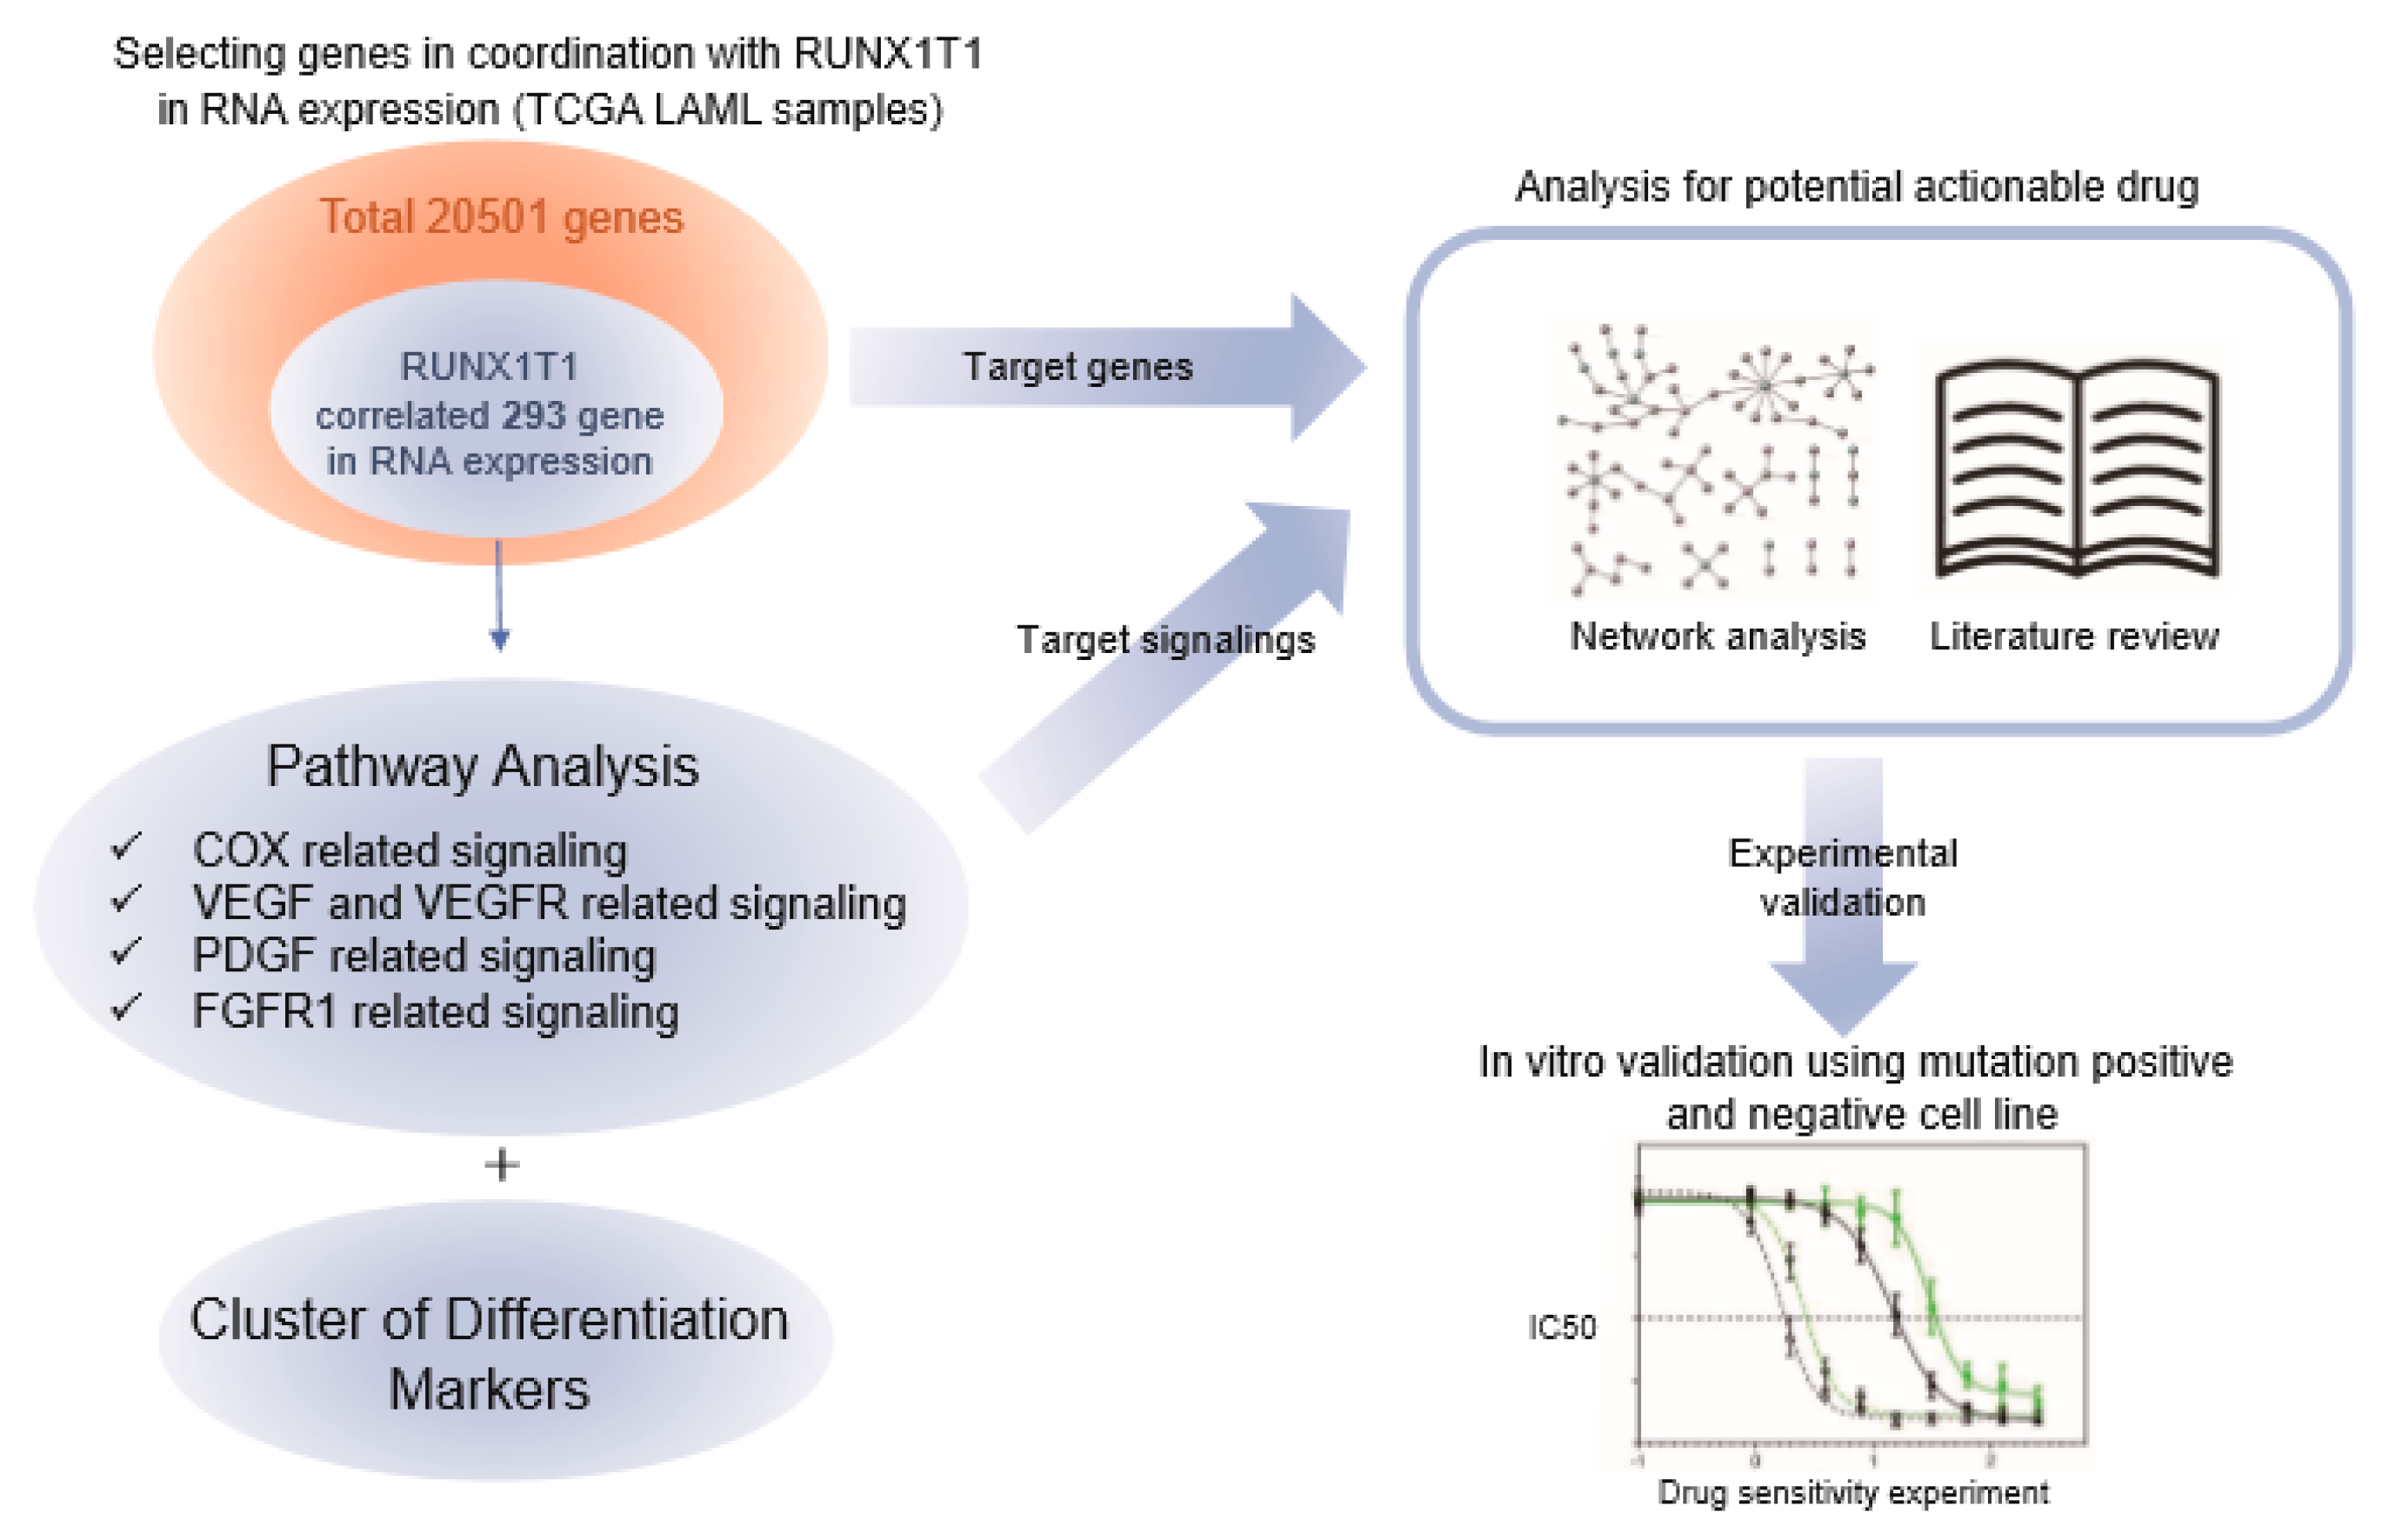
2.2. Genes and Pathways Specifically Altered in AMLs with RUNX1-RUNX1T1 Fusion

Using the transcriptome data of the 7 RUNX1-RUNX1T1 fusion-positive and 86 fusion-negative AMLs in the TCGA database, 293 genes (Figure 1 and Table S1) were identified to have expressions significantly correlated with the RUNX1-RUNX1T1 fusion transcript level. Among the 293 genes, 42 genes were cancer-related based on the predefined cancer gene list (2027 genes, http://www.bushmanlab.org/links/genelists) (Figure S1). CAV1, POU4F1, and ROBO1 were most significantly overexpressed in correlation with the RUNX1T1 expression, which is concordant with the previous report [13]. Interestingly, POU4F1 is known to be up-regulated by RUNX1-RUNX1T1 fusion, and the fusion with POU4F1 has a synergy in driving B-lymphoid gene expression in t (8:21) AML [14,15]. FGFR1, VEGFA, NBL1, TET1, IKZF2, CCND1, and MPL also showed positive correlations (Pearson R > 0.4) with RUNX1T1 in RNA levels. Although not previously shown to be directly related with cancers, several surface markers, such as CD19 and CD34, showed significant positive correlation (Pearson R > 0.5) with RUNX1T1 in RNA levels, whereas CD33 showed negative correlation (Pearson R = −0.36) (Figure S1).
Subsequently, we applied ConsensusPathDB (CPDB) to the 293 genes to elucidate the specific functional signaling pathways that are altered in the AMLs with RUNX1-RUNX1T1 fusion (Figure 1). The analysis was performed with the 4,011 curated gene sets provided by CPDB. In the over-representation analysis (ORA) of CPDB, 24 pathways showed statistical significance (q-values < 0.1) (Table 2 and Figure 2). Gene Set Enrichment Analysis (GSEA) was utilized to cross-validate the results from ORA, using CPDB. GSEA showed good normalized enrichment scores (NESs) of over 1.5 in the VEGFR1 specific signals, the PDGFRA signaling pathway, the celecoxib pathway, and the phospholipase C mediated cascade: FGFR1 (Figure S2). The GSEA results indicated that the affected pathways were cross-validated with two independent in silico pathway analysis methods.
Several genes of the 293 genes were involved in multiple pathways in the pathway analyses. Especially, VEGFA, CAV1, FGFR1, PLCG1, and PRKCD were involved in at least three pathways (Figure 3), implying their functional roles in the AMLs with RUNX1-RUNX1T1 fusion. Overall, 14 genes participated in multiple pathways (Figure 3 and Table S2).

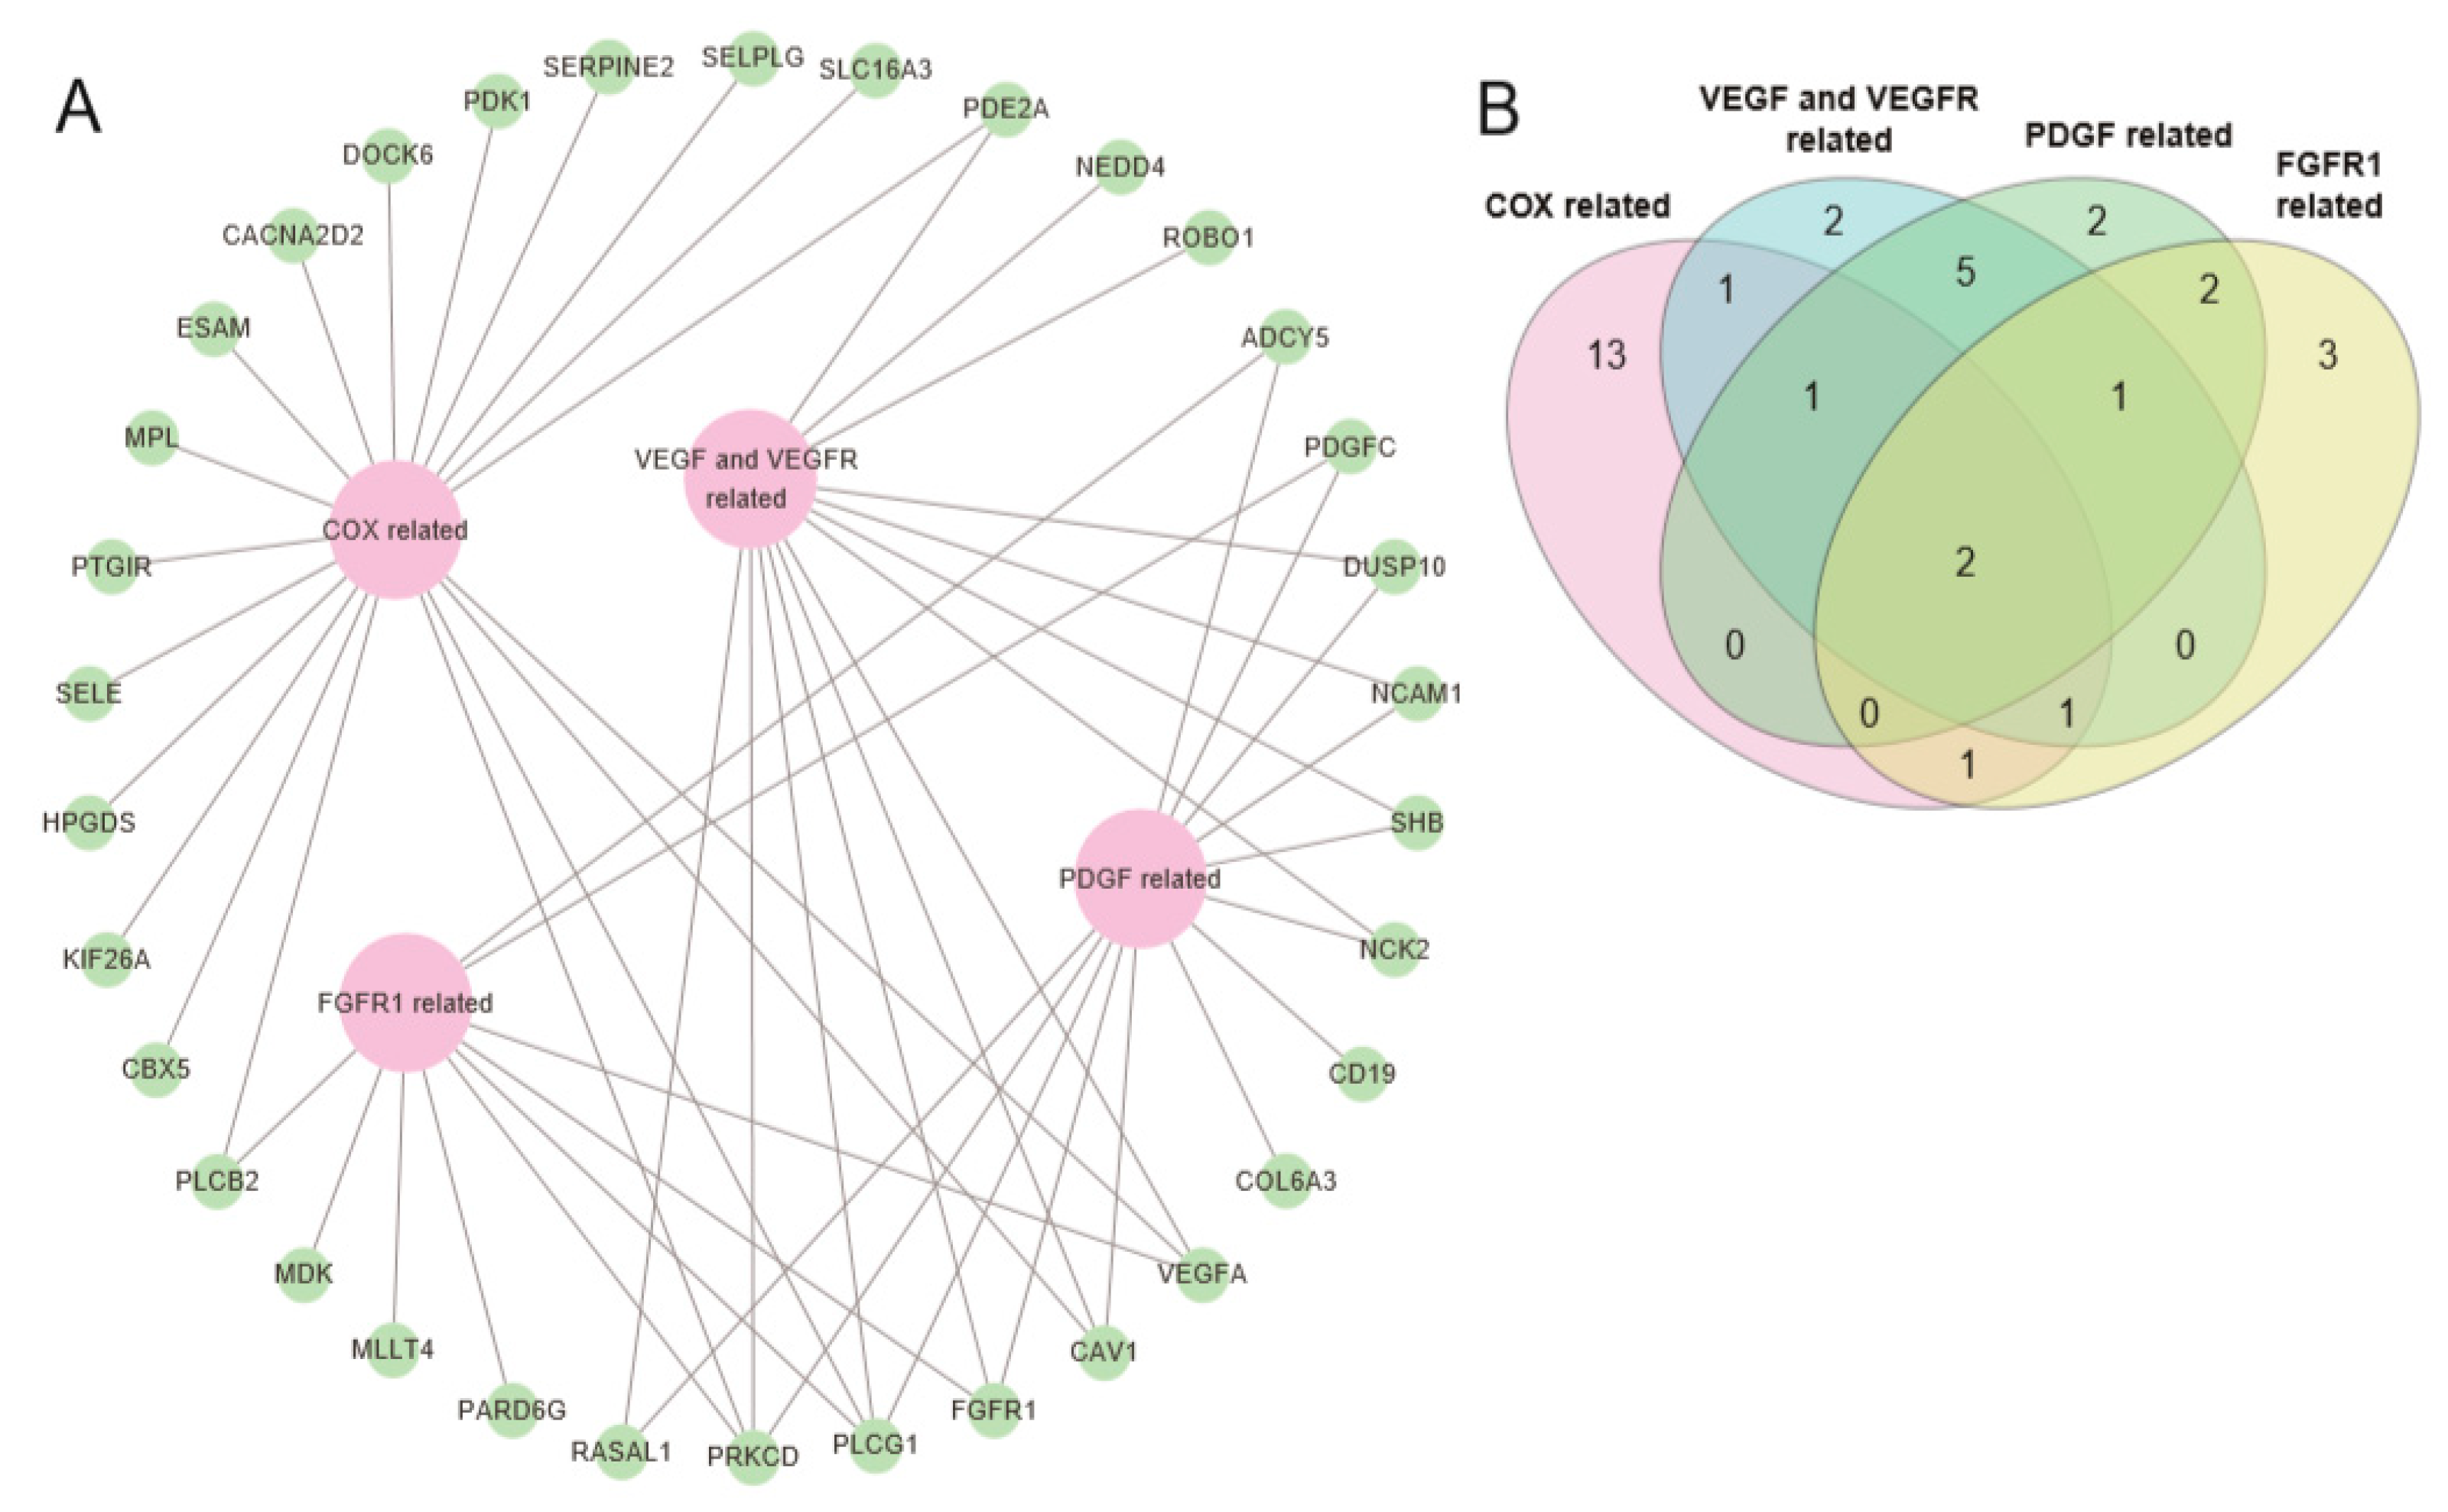
2.3. Pathway Prioritization by Targeting Possibility

From the CPDB ORA results, we identified COX-2, VEGF, PDGF, and FGFR1 pathways that can be pharmacologically targeted (Table 2). The concurrent expression of RUNX1T1 and a gene that is associated with its respective pathway are outlined in Figure 2. Overall, 34 genes were culled from the 293 genes based on their relationship with the COX-2, VEGF, PDGF, and FGFR1 pathways.
Among the 34 genes, 19 were associated with the COX-2 pathway (Figure 2). As previously suggested, RUNX1-RUNX1T1 fusion mediates leukemogenesis through the COX pathway [16]; this result thus indicates the validity of the analysis of this study.
The VEGF/VEGFR pathway has interesting features, since 4 pathways retrieved from different database sources showed q-values < 0.1 with p-values < 0.004 (Table 2). This suggests the potential for drug repositioning of the VEGF/VEGFR targeting agents from anti-angiogenic treatment in order to direct AML cell-targeting therapy, which is in concordance with previous experimental studies [17]. The PDGF and FGFR1 pathways were also interesting, since they are associated with eosinophilia [18,19]. Eosinophilia has been known to be a characteristic of AMLs with RUNX1-RUNX1T1 fusion [2]. In addition, the PDGF and FGFR1 pathways are associated with the overexpression of CD19, which is the immunophenotypic feature of RUNX1-RUNX1T1 positive AMLs [2]. Considering these pathways can be pharmacologically inhibited by multiple specific targeted agents, the results suggest novel molecular targeted therapies for AMLs with RUNX1-RUNX1T1 fusion.

2.4. Functional Validation of Signaling Pathways

Receptor tyrosine kinase (RTK) array was conducted to confirm the phosphorylation of the RTKs in the VEGF, PDGF, or FGFR1 pathways. The phosphorylation of 71 different RTKs was screened against SKNO-1 and Kasumi-1 human AML cells that have RUNX1-RUNX1T1 fusion [20,21]. THP-1 AML cells were also analyzed as a negative control, as they do not harbor the RUNX1-RUNX1T1 fusion [22]. We further analyzed the phosphorylated status of EGFRs, FGFRs, PDGFRs, and VEGFRs. EGFRs were utilized as negative controls that were not predicted in the transcriptome analyses, to be activated in AMLs with RUNX1-RUNX1T1 fusion.
As expected, the phosphorylation levels of FGFRs, PDGFRs, and VEGFRs were 3~5-fold higher than those of the EGFRs in both SKNO-1 (Figure 4A) and Kasumi-1 (Figure 4B). In particular, FGFR, PDGR, and VEGFR were highly phosphorylated in SKNO-1 (Figure 4A), whereas PDGFR and VEGFR were highly phosphorylated in Kasumi-1 (Figure 4B). In contrast, the phosphorylation level of EGFRs, FGFRs, and PDGFRs were almost the same in THP-1 (Figure 4C). Moreover, the phosphorylation level of the EGFRs of THP-1 were higher than those of SKNO-1 and Kasumi-1, while the phosphorylation levels of the FGFRs, PDGFRs, and VEGFRs of THP-1 were lower than those of SKNO-1 and Kasumi-1 (Figure 4D). These results indicate that the FGFR, PDGFR, and VEGFR signaling pathways may be specifically activated in AMLs with RUNX1-RUNX1T1 fusion.
When EGFRs, FGFRs, PDGFRs or VEGFRs were inhibited pharmacologically in vitro, pazopanib (for FGFRs), tivozanib (for VEGFRs), and imatinib (for PDGFRs) showed significantly lower IC50s in the SKNO-1 cells (Figure 5A) compared with the THP-1 cells (Figure 5C). The Kasumi-1 (Figure 5B) cells also had significantly lower IC50s in tivozanib and imatinib, compared with the THP-1 cells (Figure 5C). These results indicated that the survival of the SKNO-1 cells is specifically dependent on the activities of the FGFRs (Figure 5D), VEGFRs (Figure 5E), and PDGFRs (Figure 5F), while Kasumi-1 cells rely on the functions of VEGFRs (Figure 5E) and PDGFRs (Figure 5F). On the contrary, the IC50s of the EGFR inhibitor in the SKNO-1 (Figure 5A), Kasumi-1 (Figure 5B), and THP-1 (Figure 5C) cells did not significantly differ (Figure 5G). Moreover, the VEGR inhibitor had a lower IC50 than the FGFR and PDGFR inhibitors in SKNO-1 (Figure S3A) and the PDGFR and VEGFR inhibitors had lower IC50s than the FGFR inhibitor in Katumi-1 (Figure S3B); this is well-matched with the phosphorylation status of RTKs (Figure 4). In contrast, the effects of the FGFR, PDGFR, and VEGFR inhibitors in THP-1 did not differ compared with the EGFR inhibitors (Figure S3C) [22].

3. Discussion

In this study, we investigated cancer-related targetable pathways that are specifically regulated by the RUNX1-RUNX1T1 fusion in AMLs. The unique aspect of the pathway analysis of this study is that the gene sets for ORA were selected based on the expression correlation with the reference gene, RUNX1T1. The RUNX1T1 expression level in each RNA-seq sample might be skewed by several factors, such as its tumor purity or subclonal heterogeneity. Expression of the genes of the RUNX1T1 downstream pathways could be affected in a similar pattern. Therefore, the gene set selection based on the expressional correlation with RUNX1T1 has strong potential, since it offers gene selection while considering the extent of the altered gene expression in each sample.
Some cancer-related pathways identified in this study were well-matched with those of previous studies of RUNX1-RUNX1T1 fusion-positive AMLs. For example, we identified that COX-related pathways might be activated in AMLs with the RUNX1-RUNX1T1 fusion. Accordingly, it was reported that COX-2 inhibition could reduce the proliferation of RUNX1-RUNX1T1 fusion-positive AML cells in vitro, and in vivo [16]. PDGF-related pathways identified in this study can explain the reason why this leukemia subtype is related to eosinophilia [23] and elevated CD19 expression [24]. These concurrences and consistencies with the well-known features of AMLs with the RUNC1-RUNX1T1 rearrangement might support the validity of the analysis of this study.
Besides the COX- and PDGF-related pathways, the VEGF- and FGFR1-related pathways were also predicted to be specifically activated in AMLs with the RUNX1-RUNX1T1 fusion in this study. The signaling pathways provide novel opportunities for tailored treatments of RUNX1-RUNX1T1 fusion positive AMLs [25,26,27].
In parallel with the in silico analysis of this study, PDGFRs, FGFRs, and VEGFRs were highly phosphorylated in two types of AML cell lines with the RUNX1-RUNX1T1 fusion (SKNO-1 and Kastumi-1). In contrast, the phosphorylation levels were much lower in the THP1 AML cells that have no fusion. The activation status indicated that AMLs with the RUNX1-RUNX1T1 fusion could be more sensitive to PDGFRs, FGFRs, and VEGFRs targeting agents, which were experimentally validated in this study. Although these results are in vitro validations, and not conducted studies done on patient samples, it does shed light on new possibilities for drug reposition for AML with RUNX1-RUNX1T1.
Combinational chemotherapy is a future direction of effective treatments for various cancer types [28]. The US Food and Drug Administration (FDA) has approved several clinical trials on combinational chemotherapy for AML patients such as cytarabine/daunorubicin and PF-04449913(Glasdegib) [29]. Our results indicate that RTK pathway-targeting agents have adverse effects on the proliferation potency of RUNX1-RUNX1T1 fusion cell lines. It showed the possibility that use of RTK targeting agents in combination with the conventional chemotherapeutic drugs for AMLs, like Ara-C, might have better anti-tumor effects. However, it needs more preclinical study to validate which combination strategy is the best, as there are various possible combinations.
Currently, some molecular alterations are used for AML diagnosis, such as FLT3, NPM1, and CEBPA, several of which could be targeted since their protein products have enzymatic activities. In 2017, FLT3 inhibitors were approved to treat AML patients with FLT3-ITD mutations [30]. Despite these efforts, improvement of clinical outcome in AMLs is still limited to a small population of patients [31]. This is partially because many AML-specific genetic alterations cannot be targeted pharmacologically. Therefore, the identification of targetable molecules that are closely associated with AML-specific genetic alterations is important for advancement in the precision medicine of AMLs. The analysis strategy presented in this study might be helpful in the identification of treatment targets and in extending the indication of approved target therapy agents.
In this study, we elucidated gene sets, the expressions of which are specifically changed in AMLs with the RUNX1-RUNX1T1 fusion. Fidelity of identification was upgraded by hiring the expression correlation of candidate genes with the reference gene, RUNX1T1 in the analysis processes. Based on the gene sets, activated signaling pathways in AMLs with the RUNX1-RUNX1T1 fusion were predicted and their functional importance in treatment was validated experimentally. This analysis process could also be adopted in the discovery of molecular targets of AMLs that have no targetable genetic alteration. Further, we expect that combination therapy using the conventional drug (Ara-c) with RTK targetable drugs shows better anti-tumor effects. Despite these encouraging results, these suggestions are required to be further investigated with clinical samples to be fully validated. With future studies possibly validating these results, it can also provoke clinical trials for personalized treatments of AMLs.

4. Materials and Methods

4.1. Data Acquisition and Inclusion Criteria

Gene level 3(RSEM) mRNA expression for The Cancer Genome Atlas (TCGA) Acute Myeloid Leukemia (AML) study was downloaded from the Broad GDAC Firehose. Clinical information, obtained from the same site, includes chromosome analysis, fluorescence in situ hybridization (FISH) results, immunophenotyping results and other clinical features. Using the results of chromosome analysis and FISH studies, we identified seven samples with RUNX1-RUNX1T1 fusion, which were cross-checked with elevated RUNX1T1 expression level. For the controls, 100 samples with normal karyotype were selected. After filtering 14 samples without RNA expression data, 86 samples were used as controls.

4.2. Over-Representation Pathway Analysis and Gene Set Enrichment Analysis

RNA expression data from each TCGA AML sample were merged into a two-dimensional matrix. Each column of the matrix represents the patient and each row represents each gene name. The RNA expression values were described as normalized read counts. To obtain the genes that are correlated in RNA expression with the reference gene (RUNX1T1) in 93 samples, a Pearson correlation test and Spearman correlation test were performed for each gene. Genes with R > 0.3 in both Pearson and Spearman correlation tests were selected, and 294 genes were finally selected as genes closely correlated with RUNX1T1 in RNA expression. With the 294 genes, over-representation analysis (ORA) was performed using ConsensusPathDB (CPDB, http://consensuspathdb.org/) according to current protocols [32]. In this analysis, 4011 pathways, curated from multiple sources including INOH [33], NetPath [34], Reactome [35], HumanCyc [36], KEGG [37], Wikipathways [38], SMPDB [39], PharmGKB [40], EHMN [41] and, Signalink [42] were used.
Gene Set Enrichment Analysis (GSEA) [43] was performed to crosscheck the ORA result. The GSEA analysis software (version 2.2.3) was downloaded from the Broad Institute website (http://www.broadinstitute.org/gsea/index.jsp). The curated gene set provided by CPDB was also downloaded and modified for GSEA analysis.

4.3. Network Analysis for Potential Actionable Drugs and Target Genes

To analyze and visualize the relationship between therapeutic agents and their target genes, the expressions of which were specifically altered in the AMLs with RUNX1-RUNX1T1 fusion, Cytoscape version 3.5.1 was used [44]. Knowledge-based databases including CIViC [45] and CancerSCAN [46] were used for the analysis.

4.4. Statistical Analysis and Visualization

To select genes that correlate well with RUNX1T1 in RNA expression, the Pearson correlation test and Spearman correlation test were used. To visualize the RNA expression heat map with the related pathways, the R package of the ComplexHeatmap was used [47]. All statistical analysis and visualization were performed based on the open software R version 3.4.3 [48]. We applied a p-value of < 0.05 for statistical relevance, and a q-value of < 0.1 for false detection rate (FDR) control.

4.5. Cell Culture

AML cell lines with t(8;21) chromosome translocation (Kasumi-1 and SKNO-1) were used. Kasumi-1 was obtained from American Type Culture Collection (ATCC, CRL-274) and cultured in RPMI1640 media (Gibco, Waltham, MA) supplemented with 20% fetal bovine serum (FBS). SKNO-1 was obtained from the JCRB cell bank (Osaka, Japan, JCRB 1170) and cultured in RPMI1640 supplemented with 10% FBS and 10ng/mL recombinant human granulocyte-macrophage colony-stimulating factor (GM-CSF) (Peprotech, Rocky Hill, NJ). THP-1 was obtained from the Korean Cell Line Bank (Seoul, South Korea, 40202) and cultured in RPMI 1640 media supplemented with 0.05mM 2-mercaptoethanol (Gibco) and 10% FBS.

4.6. Receptor Tyrosine Kinase (RTK) Phosphorylation Array

Cells were cultured with their growth media in 75T flasks. Pellets were prepared upon ~80% confluence. A lysis buffer containing a protease and phosphatase inhibitor cocktail (AAH-PRTK-1, RayBiotech, GA) was used to separate the protein from the pellets. Protein concentration was determined by the bicinchoninic acid (BCA) assay (Pierce, Rockford, IL, USA). 700µg protein was reacted with a receptor tyrosine kinase (RTK) phosphorylation array (AAH-PRTK-1) according to the manufacturer’s protocol. Spots on the array were analyzed by ImageJ software(National Institutes of Health, Maryland, USA).

4.7. Drug Sensitivity Test

The cells were seeded in 384-well plates at a density of 500 cells per well in triplicate for each treatment. The drugs panel consisted of 61 anti-cancer agents (Selleckchem, TX, USA) targeting oncogenic signals. Two hours after plating, the cells were treated with the drugs in a seven-point serial dilution for 6 days at 37 °C in a 5% CO2 humidified incubator. Cell viability was analyzed using an ATP-monitoring system based on firefly luciferase (ATPLit 1step, PerkinElmer, MA, USA). Dimethyl sulfoxide (DMSO) was included as a negative control in each plate. Controls were used for the calculation of relative cell viability for each plate, and normalization was performed on a per-plate basis. Dose-response curve (DRC) fitting was performed using GraphPad Prism 5 (GraphPad) and evaluated by measuring the half maximal inhibitory concentration (IC50) of the DRC. After normalization, the best-fit lines were determined, and the IC50 value of each curve was calculated using GraphPad Prism, ignoring the regions defined by fewer than two peaks.

Supplementary Materials

Supplementary materials can be found at https://0-www-mdpi-com.brum.beds.ac.uk/1422-0067/20/7/1717/s1. Figure S1. Heatmap of cancer-related and other miscellaneous genes with altered expression correlating to RUNX1T1 expression. Figure S2. Enrichment score and ranked list metric value plot on VEGF-VEGFR, PDGF, COX, and FGFR1 related pathways. Figure S3. Bar graphs represent IC50 values of SKNO-1 (A), Kasumi-1 (B), and THP-1 (C) cells for each inhibitor. * p < 0.05, ** p < 0.01. Table S1. 293 genes whose expressions are significantly correlated with that of RUNX1T1 genes whose expressions are significantly correlated with that of RUNX1T1. Table S2. Genes involved in multiple pathways and literature related to role in cancer/carcinogenesis.

Author Contributions

Conceptualization, S.C., K.M.J. and W.-Y.P.; Formal analysis, J.W.Y., Y.K.B., H.K., H.-J.K., D.-H.N. and S.-H.K.; Investigation, J.W.Y., Y.K.B. and S.Y.C.; Project administration, S.C., K.M.J. and W.-Y.P.; Writing—original draft, J.W.Y., Y.K.B., S.C. and K.M.J.; Writing—review & editing, S.C., K.M.J. and W.-Y.P.

Acknowledgments

This work was supported by the National Research Foundation of Korea(NRF) Grant funded by the Korean Government(MSIP) (grant numbers NRF-2016R1A5A2945889, NRF-2017R1A2B2005704 and NRF-2018R1C1B5084962).

Conflicts of Interest

The authors declare no conflict of interest.

Abbreviation

AMLacute myeloid leukemia
CMLchronic myeloid leukemia
TCGAThe Cancer Genome Atlas
FISHfluorescence in situ hybridization
ORAover-representation analysis
CPDBConsensusPathDB
GSEAGene Set Enrichment Analysis
FDRfalse detection rate
FBSfetal bovine serum
GM-CSFgranulocyte-macrophage colony-stimulating factor
BCAbicinchoninic acid
RTKreceptor tyrosine kinase
DMSODimethyl sulfoxide
DRCDose-response curve
IC50half maximal inhibitory concentration

References

  1. International classification of rodent tumours. Part I--The rat. 4. Haematopoietic system. IARC Sci. Publ. 1993, 1–27.
  2. Downing, J.R. The AML1-ETO chimaeric transcription factor in acute myeloid leukaemia: Biology and clinical significance. Br. J. Haematol. 1999, 106, 296–308. [Google Scholar] [CrossRef]
  3. Licht, J.D. AML1 and the AML1-ETO fusion protein in the pathogenesis of t(8;21) AML. Oncogene 2001, 20, 5660–5679. [Google Scholar] [CrossRef] [PubMed] [Green Version]
  4. Peterson, L.F.; Zhang, D.E. The 8;21 translocation in leukemogenesis. Oncogene 2004, 23, 4255–4262. [Google Scholar] [CrossRef] [PubMed] [Green Version]
  5. Spirin, P.V.; Lebedev, T.D.; Orlova, N.N.; Gornostaeva, A.S.; Prokofjeva, M.M.; Nikitenko, N.A.; Dmitriev, S.E.; Buzdin, A.A.; Borisov, N.M.; Aliper, A.M.; et al. Silencing AML1-ETO gene expression leads to simultaneous activation of both pro-apoptotic and proliferation signaling. Leukemia 2014, 28, 2222–2228. [Google Scholar] [CrossRef]
  6. Krauth, M.T.; Eder, C.; Alpermann, T.; Bacher, U.; Nadarajah, N.; Kern, W.; Haferlach, C.; Haferlach, T.; Schnittger, S. High number of additional genetic lesions in acute myeloid leukemia with t(8;21)/RUNX1-RUNX1T1: Frequency and impact on clinical outcome. Leukemia 2014, 28, 1449–1458. [Google Scholar] [CrossRef] [PubMed]
  7. Druker, B.J.; Talpaz, M.; Resta, D.J.; Peng, B.; Buchdunger, E.; Ford, J.M.; Lydon, N.B.; Kantarjian, H.; Capdeville, R.; Ohno-Jones, S.; et al. Efficacy and safety of a specific inhibitor of the BCR-ABL tyrosine kinase in chronic myeloid leukemia. N. Engl. J. Med. 2001, 344, 1031–1037. [Google Scholar] [CrossRef]
  8. Cancer Genome Atlas Research Network; Ley, T.J.; Miller, C.; Ding, L.; Raphael, B.J.; Mungall, A.J.; Robertson, A.; Hoadley, K.; Triche, T.J., Jr.; Laird, P.W.; et al. Genomic and epigenomic landscapes of adult de novo acute myeloid leukemia. N. Engl. J. Med. 2013, 368, 2059–2074. [Google Scholar] [CrossRef]
  9. Andrieu, V.; Radford-Weiss, I.; Troussard, X.; Chane, C.; Valensi, F.; Guesnu, M.; Haddad, E.; Viguier, F.; Dreyfus, F.; Varet, B.; et al. Molecular detection of t(8;21)/AML1-ETO in AML M1/M2: Correlation with cytogenetics, morphology and immunophenotype. Br. J. Haematol. 1996, 92, 855–865. [Google Scholar] [CrossRef] [PubMed]
  10. Francis, J.; Dharmadhikari, A.V.; Sait, S.N.; Deeb, G.; Wallace, P.K.; Thompson, J.E.; Wang, E.S.; Wetzler, M. CD19 expression in acute leukemia is not restricted to the cytogenetically aberrant populations. Leuk Lymphoma 2013, 54, 1517–1520. [Google Scholar] [CrossRef]
  11. Johnson, R.C.; Ma, L.; Cherry, A.M.; Arber, D.A.; George, T.I. B-cell transcription factor expression and immunoglobulin gene rearrangement frequency in acute myeloid leukemia with t(8;21)(q22;q22). Am. J. Clin. Pathol. 2013, 140, 355–362. [Google Scholar] [CrossRef] [PubMed]
  12. Ball, E.D.; Davis, R.B.; Griffin, J.D.; Mayer, R.J.; Davey, F.R.; Arthur, D.C.; Wurster-Hill, D.; Noll, W.; Elghetany, M.T.; Allen, S.L.; et al. Prognostic value of lymphocyte surface markers in acute myeloid leukemia. Blood 1991, 77, 2242–2250. [Google Scholar] [PubMed]
  13. Fortier, J.M.; Payton, J.E.; Cahan, P.; Ley, T.J.; Walter, M.J.; Graubert, T.A. POU4F1 is associated with t(8;21) acute myeloid leukemia and contributes directly to its unique transcriptional signature. Leukemia 2010, 24, 950–957. [Google Scholar] [CrossRef] [Green Version]
  14. Dunne, J.; Gascoyne, D.M.; Lister, T.A.; Brady, H.J.; Heidenreich, O.; Young, B.D. AML1/ETO proteins control POU4F1/BRN3A expression and function in t(8;21) acute myeloid leukemia. Cancer Res. 2010, 70, 3985–3995. [Google Scholar] [CrossRef] [PubMed]
  15. Dunne, J.; Mannari, D.; Farzaneh, T.; Gessner, A.; van Delft, F.W.; Heidenreich, O.; Young, B.D.; Gascoyne, D.M. AML1/ETO and POU4F1 synergy drives B-lymphoid gene expression typical of t(8;21) acute myeloid leukemia. Leukemia 2012, 26, 1131–1135. [Google Scholar] [CrossRef]
  16. Zhang, Y.; Wang, J.; Wheat, J.; Chen, X.; Jin, S.; Sadrzadeh, H.; Fathi, A.T.; Peterson, R.T.; Kung, A.L.; Sweetser, D.A.; et al. AML1-ETO mediates hematopoietic self-renewal and leukemogenesis through a COX/beta-catenin signaling pathway. Blood 2013, 121, 4906–4916. [Google Scholar] [CrossRef]
  17. Ter Elst, A.; Ma, B.; Scherpen, F.J.; de Jonge, H.J.; Douwes, J.; Wierenga, A.T.; Schuringa, J.J.; Kamps, W.A.; de Bont, E.S. Repression of vascular endothelial growth factor expression by the runt-related transcription factor 1 in acute myeloid leukemia. Cancer Res. 2011, 71, 2761–2771. [Google Scholar] [CrossRef]
  18. Lierman, E.; Cools, J. Recent breakthroughs in the understanding and management of chronic eosinophilic leukemia. Expert Rev. Anticancer. Ther. 2009, 9, 1295–1304. [Google Scholar] [CrossRef]
  19. Demoulin, J.B.; Essaghir, A. PDGF receptor signaling networks in normal and cancer cells. Cytokine Growth Factor Rev. 2014, 25, 273–283. [Google Scholar] [CrossRef]
  20. Asou, H.; Tashiro, S.; Hamamoto, K.; Otsuji, A.; Kita, K.; Kamada, N. Establishment of a human acute myeloid leukemia cell line (Kasumi-1) with 8;21 chromosome translocation. Blood 1991, 77, 2031–2036. [Google Scholar] [PubMed]
  21. Matozaki, S.; Nakagawa, T.; Kawaguchi, R.; Aozaki, R.; Tsutsumi, M.; Murayama, T.; Koizumi, T.; Nishimura, R.; Isobe, T.; Chihara, K. Establishment of a myeloid leukaemic cell line (SKNO-1) from a patient with t(8;21) who acquired monosomy 17 during disease progression. Br. J. Haematol. 1995, 89, 805–811. [Google Scholar] [CrossRef]
  22. Tsuchiya, S.; Yamabe, M.; Yamaguchi, Y.; Kobayashi, Y.; Konno, T.; Tada, K. Establishment and characterization of a human acute monocytic leukemia cell line (THP-1). Int. J. Cancer 1980, 26, 171–176. [Google Scholar] [CrossRef]
  23. Demoulin, J.B.; Montano-Almendras, C.P. Platelet-derived growth factors and their receptors in normal and malignant hematopoiesis. Am. J. Blood Res. 2012, 2, 44–56. [Google Scholar]
  24. Kita, K.; Nakase, K.; Miwa, H.; Masuya, M.; Nishii, K.; Morita, N.; Takakura, N.; Otsuji, A.; Shirakawa, S.; Ueda, T.; et al. Phenotypical characteristics of acute myelocytic leukemia associated with the t(8;21)(q22;q22) chromosomal abnormality: Frequent expression of immature B-cell antigen CD19 together with stem cell antigen CD34. Blood 1992, 80, 470–477. [Google Scholar] [PubMed]
  25. Touat, M.; Ileana, E.; Postel-Vinay, S.; Andre, F.; Soria, J.C. Targeting FGFR Signaling in Cancer. Clin. Cancer Res. 2015, 21, 2684–2694. [Google Scholar] [CrossRef] [PubMed] [Green Version]
  26. Sherr, C.J. A New Cell-Cycle Target in Cancer - Inhibiting Cyclin D-Dependent Kinases 4 and 6. N. Engl. J. Med. 2016, 375, 1920–1923. [Google Scholar] [CrossRef] [PubMed]
  27. Rodriguez-Ariza, A.; Lopez-Pedrera, C.; Aranda, E.; Barbarroja, N. VEGF targeted therapy in acute myeloid leukemia. Crit. Rev. Oncol. Hematol. 2011, 80, 241–256. [Google Scholar] [CrossRef] [PubMed]
  28. Bayat Mokhtari, R.; Homayouni, T.S.; Baluch, N.; Morgatskaya, E.; Kumar, S.; Das, B.; Yeger, H. Combination therapy in combating cancer. Oncotarget 2017, 8, 38022–38043. [Google Scholar] [CrossRef] [PubMed] [Green Version]
  29. Cortes, J.E.; Douglas Smith, B.; Wang, E.S.; Merchant, A.; Oehler, V.G.; Arellano, M.; DeAngelo, D.J.; Pollyea, D.A.; Sekeres, M.A.; Robak, T.; et al. Glasdegib in combination with cytarabine and daunorubicin in patients with AML or high-risk MDS: Phase 2 study results. Am. J. Hematol. 2018, 93, 1301–1310. [Google Scholar] [CrossRef] [PubMed]
  30. Larrosa-Garcia, M.; Baer, M.R. FLT3 Inhibitors in Acute Myeloid Leukemia: Current Status and Future Directions. Mol. Cancer Ther. 2017, 16, 991–1001. [Google Scholar] [CrossRef]
  31. Lai, C.; Karp, J.E.; Hourigan, C.S. Precision medicine for acute myeloid leukemia. Expert Rev. Hematol. 2016, 9, 1–3. [Google Scholar] [CrossRef] [PubMed]
  32. Herwig, R.; Hardt, C.; Lienhard, M.; Kamburov, A. Analyzing and interpreting genome data at the network level with ConsensusPathDB. Nat. Protoc. 2016, 11, 1889–1907. [Google Scholar] [CrossRef]
  33. Yamamoto, S.; Sakai, N.; Nakamura, H.; Fukagawa, H.; Fukuda, K.; Takagi, T. INOH: Ontology-based highly structured database of signal transduction pathways. Database (Oxford) 2011, 2011, bar052. [Google Scholar] [CrossRef]
  34. Kandasamy, K.; Mohan, S.S.; Raju, R.; Keerthikumar, S.; Kumar, G.S.; Venugopal, A.K.; Telikicherla, D.; Navarro, J.D.; Mathivanan, S.; Pecquet, C.; et al. NetPath: A public resource of curated signal transduction pathways. Genome Biol. 2010, 11, R3. [Google Scholar] [CrossRef]
  35. Fabregat, A.; Sidiropoulos, K.; Garapati, P.; Gillespie, M.; Hausmann, K.; Haw, R.; Jassal, B.; Jupe, S.; Korninger, F.; McKay, S.; et al. The Reactome pathway Knowledgebase. Nucleic Acids Res. 2016, 44, D481–D487. [Google Scholar] [CrossRef]
  36. Caspi, R.; Billington, R.; Ferrer, L.; Foerster, H.; Fulcher, C.A.; Keseler, I.M.; Kothari, A.; Krummenacker, M.; Latendresse, M.; Mueller, L.A.; et al. The MetaCyc database of metabolic pathways and enzymes and the BioCyc collection of pathway/genome databases. Nucleic Acids Res. 2016, 44, D471–D480. [Google Scholar] [CrossRef]
  37. Kanehisa, M.; Furumichi, M.; Tanabe, M.; Sato, Y.; Morishima, K. KEGG: New perspectives on genomes, pathways, diseases and drugs. Nucleic Acids Res. 2017, 45, D353–D361. [Google Scholar] [CrossRef]
  38. Kutmon, M.; Riutta, A.; Nunes, N.; Hanspers, K.; Willighagen, E.L.; Bohler, A.; Melius, J.; Waagmeester, A.; Sinha, S.R.; Miller, R.; et al. WikiPathways: Capturing the full diversity of pathway knowledge. Nucleic Acids Res. 2016, 44, D488–D494. [Google Scholar] [CrossRef] [PubMed]
  39. Jewison, T.; Su, Y.; Disfany, F.M.; Liang, Y.; Knox, C.; Maciejewski, A.; Poelzer, J.; Huynh, J.; Zhou, Y.; Arndt, D.; et al. SMPDB 2.0: Big improvements to the Small Molecule Pathway Database. Nucleic Acids Res. 2014, 42, D478–D484. [Google Scholar] [CrossRef] [PubMed]
  40. Hewett, M.; Oliver, D.E.; Rubin, D.L.; Easton, K.L.; Stuart, J.M.; Altman, R.B.; Klein, T.E. PharmGKB: The Pharmacogenetics Knowledge Base. Nucleic Acids Res. 2002, 30, 163–165. [Google Scholar] [CrossRef] [PubMed]
  41. Hao, T.; Ma, H.W.; Zhao, X.M.; Goryanin, I. Compartmentalization of the Edinburgh Human Metabolic Network. BMC Bioinformatics 2010, 11, 393. [Google Scholar] [CrossRef]
  42. Fazekas, D.; Koltai, M.; Turei, D.; Modos, D.; Palfy, M.; Dul, Z.; Zsakai, L.; Szalay-Beko, M.; Lenti, K.; Farkas, I.J.; et al. SignaLink 2—a signaling pathway resource with multi-layered regulatory networks. BMC Syst. Biol. 2013, 7, 7. [Google Scholar] [CrossRef] [PubMed]
  43. Subramanian, A.; Tamayo, P.; Mootha, V.K.; Mukherjee, S.; Ebert, B.L.; Gillette, M.A.; Paulovich, A.; Pomeroy, S.L.; Golub, T.R.; Lander, E.S.; et al. Gene set enrichment analysis: A knowledge-based approach for interpreting genome-wide expression profiles. Proc. Natl. Acad. Sci. USA 2005, 102, 15545–15550. [Google Scholar] [CrossRef] [PubMed] [Green Version]
  44. Shannon, P.; Markiel, A.; Ozier, O.; Baliga, N.S.; Wang, J.T.; Ramage, D.; Amin, N.; Schwikowski, B.; Ideker, T. Cytoscape: A software environment for integrated models of biomolecular interaction networks. Genome Res. 2003, 13, 2498–2504. [Google Scholar] [CrossRef] [PubMed]
  45. Griffith, M.; Spies, N.C.; Krysiak, K.; McMichael, J.F.; Coffman, A.C.; Danos, A.M.; Ainscough, B.J.; Ramirez, C.A.; Rieke, D.T.; Kujan, L.; et al. CIViC is a community knowledgebase for expert crowdsourcing the clinical interpretation of variants in cancer. Nat. Genet. 2017, 49, 170–174. [Google Scholar] [CrossRef] [PubMed] [Green Version]
  46. Shin, H.T.; Choi, Y.L.; Yun, J.W.; Kim, N.K.D.; Kim, S.Y.; Jeon, H.J.; Nam, J.Y.; Lee, C.; Ryu, D.; Kim, S.C.; et al. Prevalence and detection of low-allele-fraction variants in clinical cancer samples. Nat. Commun. 2017, 8, 1377. [Google Scholar] [CrossRef] [Green Version]
  47. Gu, Z.; Eils, R.; Schlesner, M. Complex heatmaps reveal patterns and correlations in multidimensional genomic data. Bioinformatics 2016, 32, 2847–2849. [Google Scholar] [CrossRef]
  48. R Developement Core Team. R: A Language and Environment for Statistical Computing. 2016. Available online: http://www.R-project.org (accessed on 30 November 2017).
Figure 1. Overall scheme of this study. Transcriptome data of 200 acute myeloid leukemias (AMLs). Patients were retrieved from the Broad GDAC Firehose database. Correlated expressions with RUNX1T1 were observed in 293 genes (upper right, red circle). Over-representation analysis results highlighted the alteration of COX, VEGF/VEGFR, PDGF, and FGFR1 related signaling pathways in sync with RUNX1T1 expression (mid to lower right, blue circles). Analysis of potential drug reposition was performed (upper left), results of which were validated with in vitro experiment with AML cell lines (lower left).
Ijms 20 01717 g001
Figure 2. Heat Map of genes with altered expression correlating to RUNX1T1 expression. Genes relevant to the COX, VEGF-vascular endothelial growth factor receptor (VEGFR), PDGF, and FGFR1 related pathways were found to be altered in AMLs with RUNX1-RUNX1T1 fusion, among a total of 293 genes with over- or under-expression, compared to normal karyotype AML patients. Pathways with q value < 0.1 were selected and merged based on the pathway ontology.
Ijms 20 01717 g002
Figure 3. Schema of genes involved in multiple pathways. (A) Genes relevant to cyclooxygenase (COX), VEGF-VEGFR, PDGF, and FGFR1 related pathways are shown, and some of the genes are related to more than one pathway. (B) Venn diagram of the number of genes participating in each pathway. PRKCD and PLCG1 participated in all four pathways.
Ijms 20 01717 g003
Figure 4. Phosphorylation status of various tyrosine kinase receptors in SKNO-1 (A), Kasumi-1 (B), and THP-1 (C) cells. Red circles indicate EGFR, FGFR, platelet-derived growth factor receptor (PDGFR), and VEGFR spots. (D) Bar graphs compare the levels of phosphorylation of EGFRs, fibroblast growth factor receptors (FGFRs), PDGFRs, and VEGFRs of the three cell lines. The three of membrane images are edited for removing background at the same level using ImageJ software.
Ijms 20 01717 g004
Figure 5. Drug response curves for leukemia cell lines. Various concentrations of pazopanib HCl, tivozanib, Imatinib, and gefitinib were treated with SKNO-1 (A), Kasumi-1 (B), and THP-1 (C) cells to inhibit the activities of FGFR, VEGFR, PDGFR, and EGFR, respectively. (DG) Bar graphs compare the IC50 values of three cell lines for each inhibitor. ** p < 0.01.
Ijms 20 01717 g005
Table 1. Clinical and pathological characteristics of RUNX1-RUNX1T1 fusion-positive AMLs and AMLs with normal karyotype.
RUNX1-RUNX1T1 Fusion Positive (n = 7)Normal Karyotype (n = 86)Statistical Difference
(U Test, Fisher’s Test)
Age at Diagnosis (Mean, SD)44.6 ± 15.954.8 ± 16.90.001
Gender (male/total)3/742/861
Event of death3/759/860.217
ImmunophenotypeCD194/43/28< 0.001
CD333/472/770.269
CD347/742/630.094
CD452/210/101
CD562/27/330.061
CD1177/773/731
HLA-DR6/644/520.581
NSE0/532/780.151
TdT1/21/41
Peripheral blood (median)Blast67.0%71.5%0.002
Hb (g/dL)9.39.70.004
Platelet (/µL)40K50.8K0.002
Bone marrow cellularity (median)70%88.3%0.001
FAB classificationM005
M1222
M2520
M301
M4021
M5015
M600
M701
§FLT3 mutation1/723/680.675
SD: Standard deviation; FAB: French-American-British; § FLT3: FMS-like tyrosine kinase 3.
Table 2. 24 pathways that are identified in the over-representation analysis (ORA) using CPDB-providing curated pathways (n = 2286).
Pathway NameSet SizeCandidates Containedp-valueq-valuePathway
Source
Members_Input_OverlapPotential Target Drug for Pathway
Signaling events mediated by VEGFR1 and VEGFR2687 (10.3%)0.000030.0161PIDNCK2; NEDD4; PRKCD; PLCG1; VEGFA; SHB; CAV1VEGF/VEGFR inhibitors
(bevacizumab, pazopanib)
Axon guidance45917 (3.7%)0.000110.0214ReactomeITGA9; ARHGEF12; NCK2; ROBO1; CRMP1; PLCG1; DUSP10; NRCAM; SHB; VEGFA; RASAL1; RHGAP39; COL6A3; LAMC1; PITPNA; NCAM1; FGFR1
HuR stabilizes mRNA83 (37.5%)0.0001210.0214ReactomeTNFSF13; ELAVL1; PRKCD
Developmental Biology58619 (3.3%)0.0002450.0325ReactomeITGA9; ARHGEF12; NCK2; ROBO1; CRMP1; PLCG1; NCAM1; NRCAM; SHB; VEGFA; TDGF1; RASAL1; ARHGAP39; COL6A3; LAMC1; PITPNA; DUSP10; CTNNA2; FGFR1
Celecoxib Pathway, Pharmacodynamics585 (8.6%)0.0009840.077PharmGKBCACNA2D2; PDK1; VEGFA; HPGDS; PTGIRCOX-2 inhibitors
(celecoxib)
Role of second messengers in netrin-1 signaling42 (50.0%)0.001020.077ReactomePLCG1; PITPNA
Angiogenesis overview615 (8.2%)0.001240.077WikipathwaysROBO1; PLCG1; VEGFA; SHB; FGFR1VEGF/VEGFR inhibitors
(bevacizumab, pazopanib)
Focal adhesion - Homo sapiens (human)2079 (4.3%)0.00170.077KEGGITGA9; PDGFC; ITGB4; CCND1; VEGFA; COL6A3; LAMC1; PARVG; CAV1
Beta1 integrin cell surface interactions665 (7.6%)0.001760.077PIDITGA9; COL6A3; LAMC1; VEGFA; MDK
S1P1 pathway193 (15.8%)0.001880.077PIDPLCB2; VEGFA; PLCG1
Cell surface interactions at the vascular wall1016 (6.0%)0.002070.077ReactomeSELE; SLC16A3; SELPLG; PLCG1; ESAM; CAV1
Signaling by PDGF30111 (3.7%)0.00210.077ReactomeADCY5; PDGFC; NCK2; PRKCD; DUSP10; PLCG1; RASAL1; COL6A3; CD19; NCAM1; FGFR1PDGFR inhibitors
(imatinib, ponatinib, sunitinib)
Hemostasis49315 (3.0%)0.002160.077ReactomeSELE; SLC16A3; DOCK6; KIF26A; PLCG1; PTGIR; MPL; VEGFA; ESAM; SELPLG; CBX5; PDE2A; PRKCD; SERPINE2; CAV1
actions of nitric oxide in the heart424 (9.5%)0.002220.077BioCartaPLCG1; PDE2A; VEGFA; CAV1
Thyroxine
(Thyroid Hormone) Production
62 (33.3%)0.002510.077WikipathwaysTPO; TRH
Extracellular matrix organization26410 (3.8%)0.002560.077ReactomeITGA9; BMP4; ITGB4; HSPG2; COL14A1; FBLN2; COL6A3; LAMC1; NCAM1; FBLN5
VEGFA-VEGFR2 Pathway26610 (3.8%)0.002710.077ReactomeNCK2; PRKCD; NCAM1; RASAL1; PLCG1; VEGFA; SHB; CAV1; DUSP10; FGFR1VEGF/VEGFR inhibitors
(bevacizumab, pazopanib)
Cell adhesion molecules (CAMs) - Homo sapiens (human)1427 (4.9%)0.002750.077KEGGITGA9; NRCAM; SELE; CD34; SELPLG; ESAM; NCAM1
Signal transduction by L1223 (13.6%)0.00290.077ReactomeITGA9; NCAM1; FGFR1
PDGFR-alpha signaling pathway223 (13.6%)0.00290.077PIDPLCG1; SHB; CAV1PDGFR inhibitors
(imatinib, ponatinib, sunitinib)
Proton Pump Inhibitor Pathway, Pharmacodynamics464 (8.7%)0.003110.0774PharmGKBADCY5; PLCB2; PLCG1; AKAP2
Laminin interactions233 (13.0%)0.00330.0774ReactomeHSPG2; ITGB4; LAMC1
Signaling by VEGF27410 (3.7%)0.003350.0774ReactomeNCK2; PRKCD; NCAM1; RASAL1; PLCG1; VEGFA; SHB; CAV1; DUSP10; FGFR1VEGF/VEGFR inhibitors
(bevacizumab, pazopanib)
Phospholipase C-mediated cascade: FGFR1494 (8.2%)0.003920.0866ReactomeADCY5; PLCG1; PRKCD; FGFR1FGFR1 inhibitors
(dovitinib, ponatinib)

