Gadolinium Complexes as Contrast Agent for Cellular NMR Spectroscopy

Institute for Protein Research, Osaka University, 3-2 Yamadaoka, Suita, Osaka 565-0871, Japan
*
Author to whom correspondence should be addressed.
Int. J. Mol. Sci. 2020, 21(11), 4042; https://0-doi-org.brum.beds.ac.uk/10.3390/ijms21114042
Submission received: 6 May 2020
/
Revised: 27 May 2020
/
Accepted: 3 June 2020
/
Published: 5 June 2020
(This article belongs to the Special Issue Selected Papers from the 8th Asia-Pacific NMR Symposium (APNMR): Recent Advances in NMR Spectroscopy)
Abstract
:Aqua Gd3+ and Gd-DOTA (gadolinium-1,4,7,10-tetraazacyclododecane-1,4,7,10-tetraacete) complexes were studied as a contrast agent in cellular NMR (nuclear magnetic resonance) spectroscopy for distinguishing between intracellular and extracellular spaces. The contrast agents for this purpose should provide strong paramagnetic relaxation enhancement and localize in the extracellular space without disturbing biological functions. Cell membrane permeability to Gd complexes was evaluated from the concentrations of gadolinium complexes in the inside and outside of E. coli cells measured by the 1H-NMR relaxation. The site-specific binding of the complexes to E. coli cells was also analyzed by high-resolution solid-state 13C-NMR. The aqua Gd3+ complex did not enhance T1 relaxation in proportion to the amount of added Gd3+. This Gd3+ concentration dependence and the 13C-NMR indicated that its strong cytotoxicity should be due to the binding of the paramagnetic ions to cellular components especially at the lipid membranes. In contrast, Gd-DOTA stayed in the solution states and enhanced relaxation in proportion to the added amount. This agent exhibited strong T1 contrast between the intra- and extracellular spaces by a factor of ten at high concentrations under which the cells were viable over a long experimental time of days. These properties make Gd-DOTA suitable for selectively contrasting the living cellular space in NMR spectroscopy primarily owing to its weak interaction with cellular components.

1. Introduction
Paramagnetic relaxation enhancement (PRE) is the acceleration of nuclear spin relaxation by magnetic interactions with unpaired electron spins. Since the magnetic interaction depends on the distance between nuclear and electron spins, this effect provides the structural information for proteins and intermolecular interactions [1,2,3,4]. For instance, measurement of PRE is one standard method in NMR (nuclear magnetic resonance) spectroscopy for probing the location of peptides embedded in lipid bilayer membranes [5,6,7,8]. The lanthanide metal ion Gd3+ has the largest number of unpaired electrons in all transition metal ions, so it should provide the strongest PRE in biological systems. Because of its isotropic g tensor, Gd3+ ions do not alter the resonance frequencies by pseudo contact shift. The PRE effect of the Gd3+ ion is commonly utilized in MRI as a contrast agent for clinical analysis [9,10,11,12]. The Gd3+ ions used in MRI have to be sealed as a stable complex [12,13], otherwise Gd3+ could strongly influence biological processes. For example, since the radius of Gd3+ is close to that of Ca2+, Gd3+ disturbs the functions of Ca2+ binding enzymes [14,15,16,17]. The gadolinium-1,4,7,10-tetraazacyclododecane-1,4,7,10-tetraacete complex, Gd-DOTA, is one of Gd chelate complexes used clinically because of its high stability in the environment of human organs [17,18]. Although some gadolinium complexes including Gd-DOTA complex have been proven to be safe for humans, it has been reported that these complexes could be internalized into human cells [19,20,21,22,23].
Emerging cellular NMR spectroscopy draws much attention in structural biology because it elucidates the structure and function of macromolecules directly in native cellular environments [24,25,26,27,28]. Nevertheless, several informative NMR spectroscopic methods are still not applied to cellular NMR. For example, there is still no information on the application of PRE to distance measurements in cells, while it is often applied to NMR spectroscopy of biological macromolecules [1,29,30]. To make use of PRE in NMR for obtaining cellular and biomolecular information, the paramagnetic agent has to be harmless and its distribution in the cellular sample should be known for the analysis. The Gd-DOTA complex is one candidate paramagnetic agent owing to its low toxicity. In this study, we employed aqua Gd3+ complex, i.e., [Gd(H2O)8]3+, and Gd-DOTA complexes as paramagnetic agents to locate molecules in Escherichia coli cells which were selected as a model cell system [31]. We measured the distribution of Gd complexes in the E. coli cellular solution from the longitudinal relaxation process of water proton magnetization and evaluated the permeability of the cell membranes to these complexes. We also verified the different interactions of Gd-DOTA complex and aqua Gd3+ complex with cellular components in living E. coli cells by high-resolution solid-state 13C-NMR spectroscopy, and examined the cytotoxicity of these complexes quantitatively.
2. Results
2.1. NMR Spectra of E. coli Sample in Absense of Gadolinium Complex
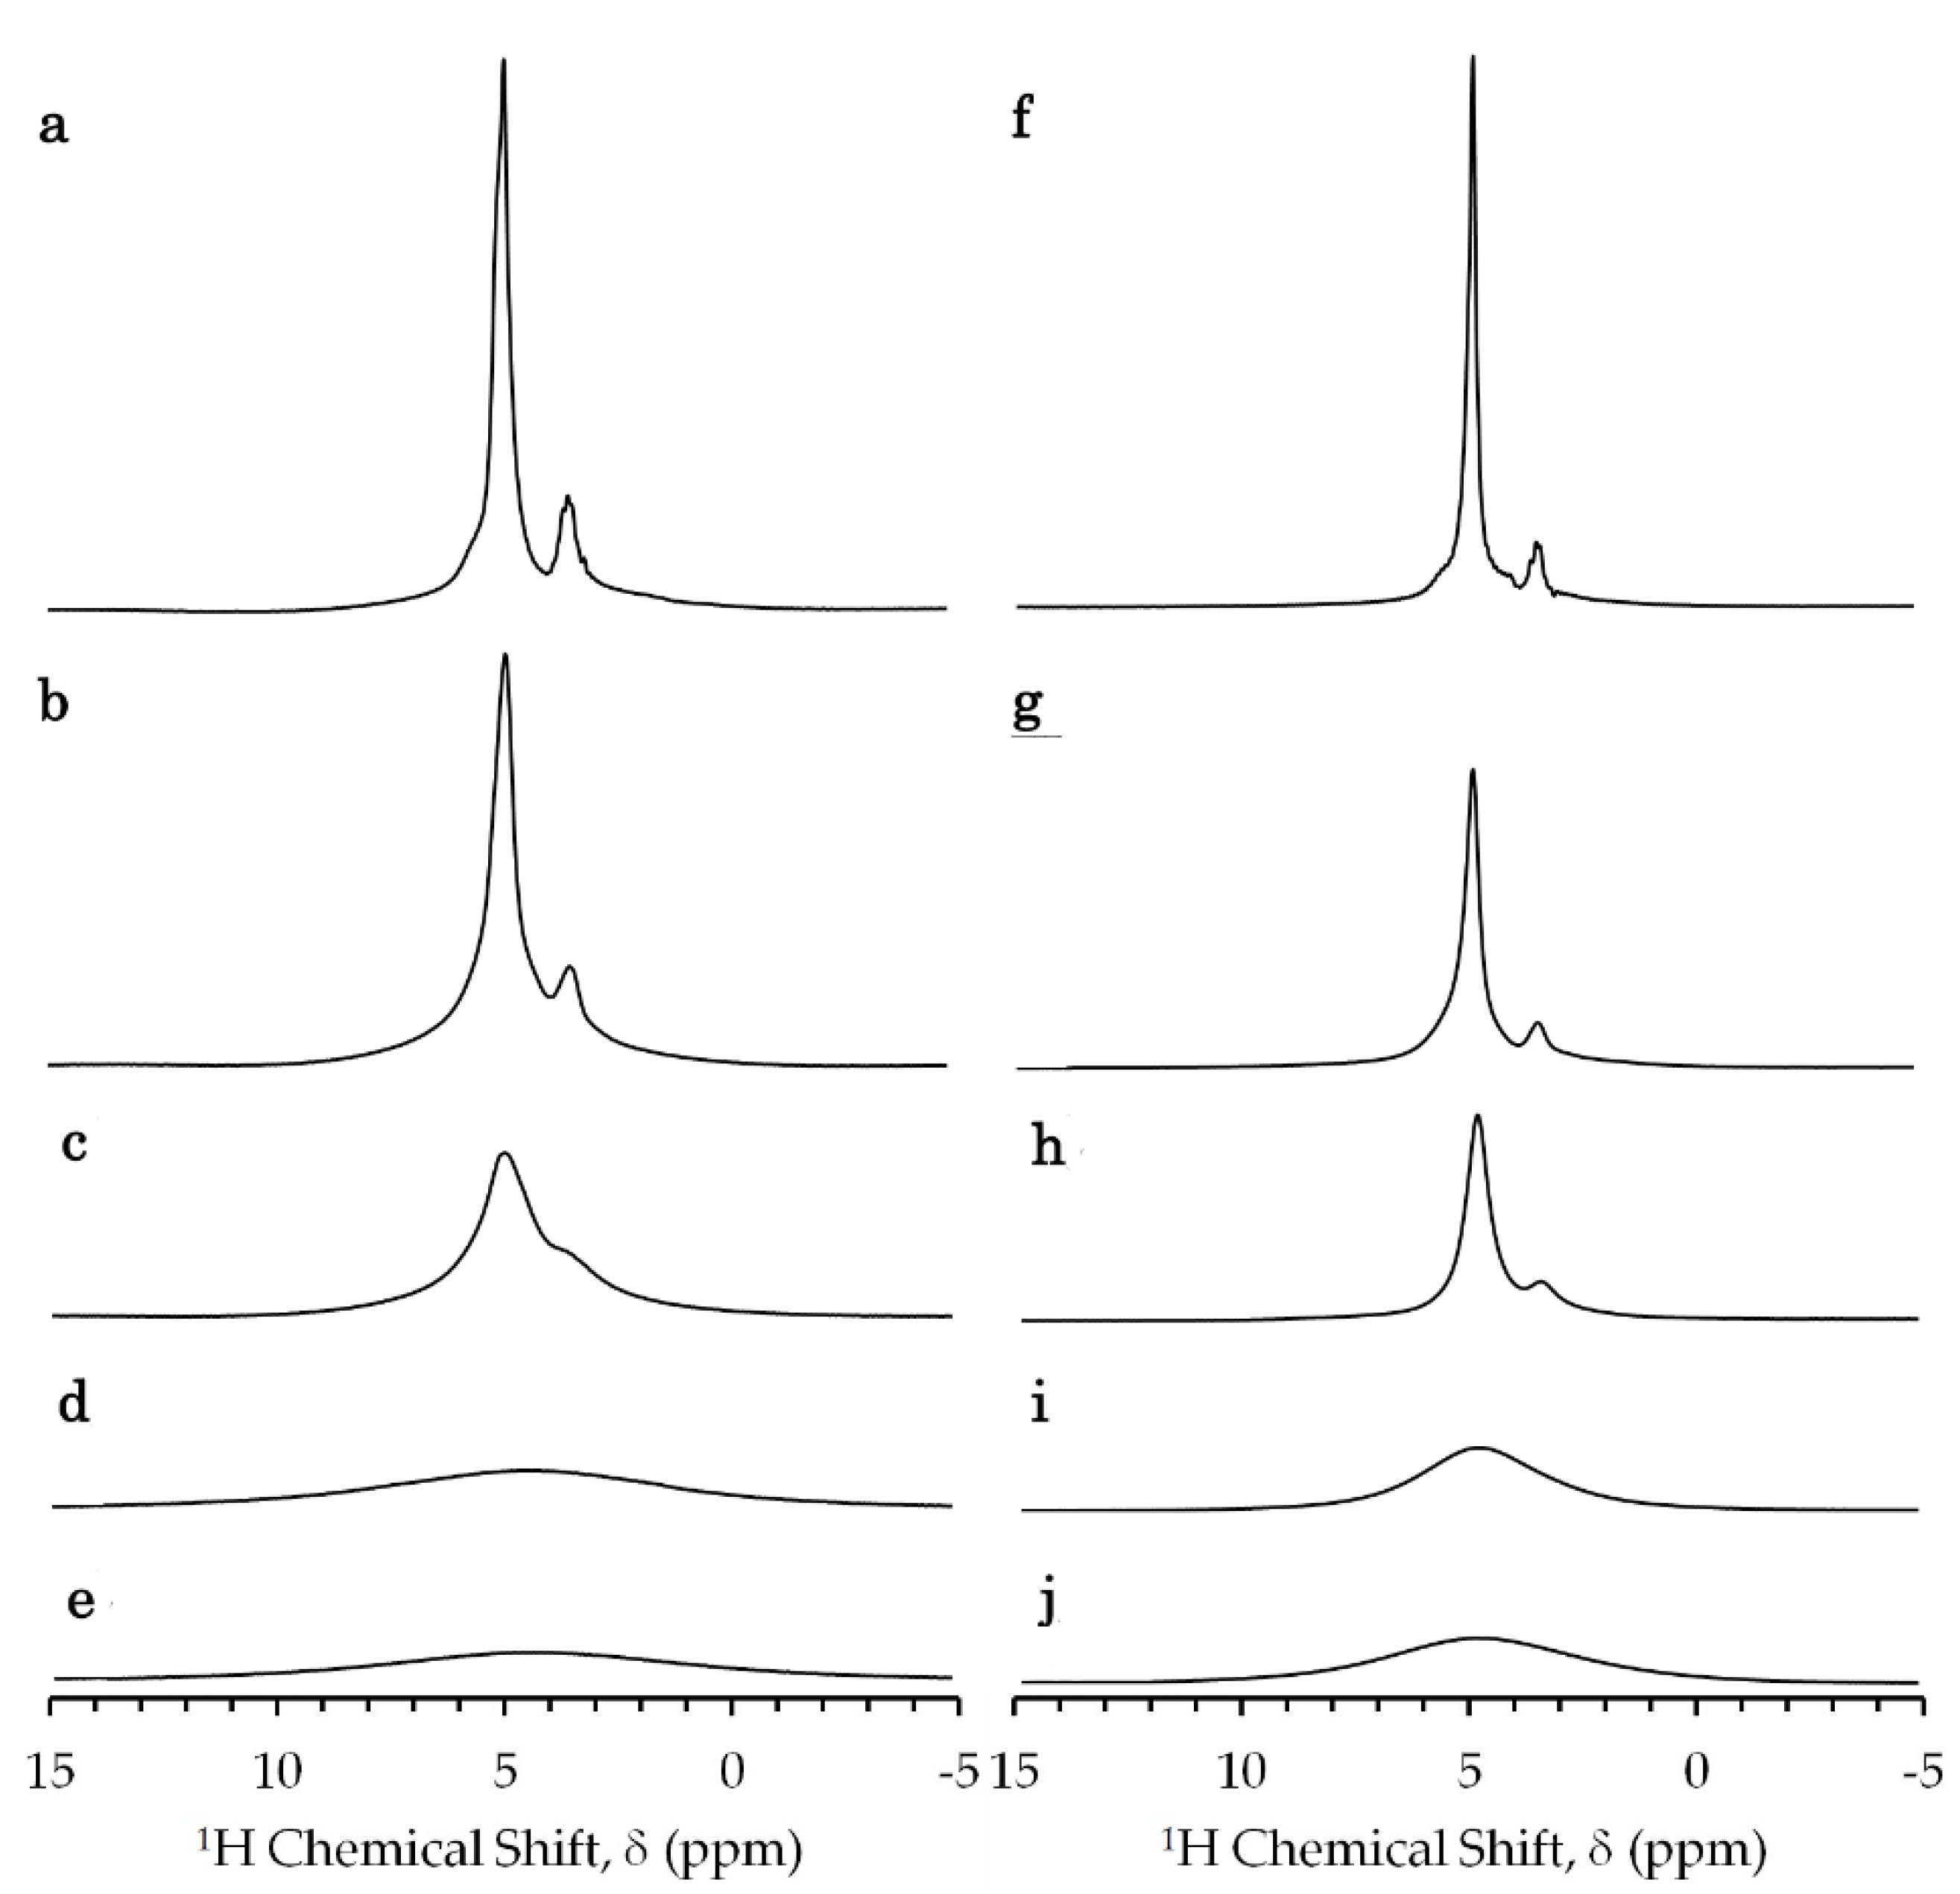
The 1H NMR spectra of glycerol-E. coli mixtures showed a strong peak of the hydroxyl proton of water and glycerol (Figure 1) as water accounts for about 70% of the sample (Supplementary Materials S1) [32]. The sample preparation of glycerol-E. coli mixtures is given in Section 4.3. The exchange rate of the water proton with the hydroxyl proton of glycerol was much faster than the relaxation rate 1/T1 of this peak. The smaller peak next to the hydroxyl peak was interpreted as the methine and methylene protons of glycerol. The peaks of the other cellular components did not appear significant because of the large chemical shift dispersion of those components and the lower concentrations in comparison to water and glycerol. The strong 1H–1H dipolar interactions in the large rigid cellular components should cause their resonances to be broadened. The reduction in signal height at higher Gd concentrations should be due to paramagnetic relaxation and dielectric loss.
The proton T1 relaxation components with the rate of 0.887 ± 0.035 and 1.51 ± 0.31 s−1 were assigned to the extracellular and intracellular water, respectively, for the reasons as follows. The intracellular T1 was calculated on the basis of the cellular water model by Persson and Halle [33,34]. In this model, the correlation time (τc) of the first water hydration layer surrounding the cellular macromolecules is 15 times longer than τc of the bulk water. The intracellular water other than the first layer should have the same τc as the bulk water. The experimental intracellular T1 relaxation rate revealed τc of 5.36 and 83.6 ps with the viscosity η of 1.76 and 27.4 mPa.s for the bulk and first water hydration layer, respectively, as detailed in Supplementary Materials S2 and S3. The obtained τc of the intracellular bulk water, 5.36 ps, agrees with τc predicted from empirical parameters for the bulk water, 5.26 ps (Supplementary Materials S3). This agreement supports the assignment of the relaxation component with R1 = 1/T1 of 1.51 s−1 to the intracellular water. Figure S1 also supports the analysis.
To approximate the concentration of extracellular glycerol from R1, we measured R1 of water proton in a reference glycerol solution of 20% v/v. The experimental R1 of this glycerol solution of 0.98 s−1 was converted to η of 3.09 mPa.s and τc of 9.43 ps. The R1 of the extracellular water of the sample gave η of 2.64 mPa.s and τc of 8.06 ps. The extracellular water η of the sample relative to η of the reference glycerol solution indicated the extracellular glycerol concentration of about 18%. This concentration agrees with the concentration of glycerol in the extracellular solution of 16.9–22.7% v/v obtained from the added amount of glycerol under the assumption that the glycerol did not penetrate into the cytoplasm (Supplementary Materials S3). This agreement also supports the idea that the relaxation component with R1 of 0.887 s−1 should be assigned to the extracellular water.
2.2. PRE for Gadolinium Solutions
The E. coli sample in the presence of aqua Gd3+ and Gd-DOTA solutions provided similar 1H-NMR spectra (Figure 1). The methine and methylene peaks broadened and disappeared due to the transverse PRE with the increase in the gadolinium concentration of the solutions which were prepared by the procedure given in Section 4.3.
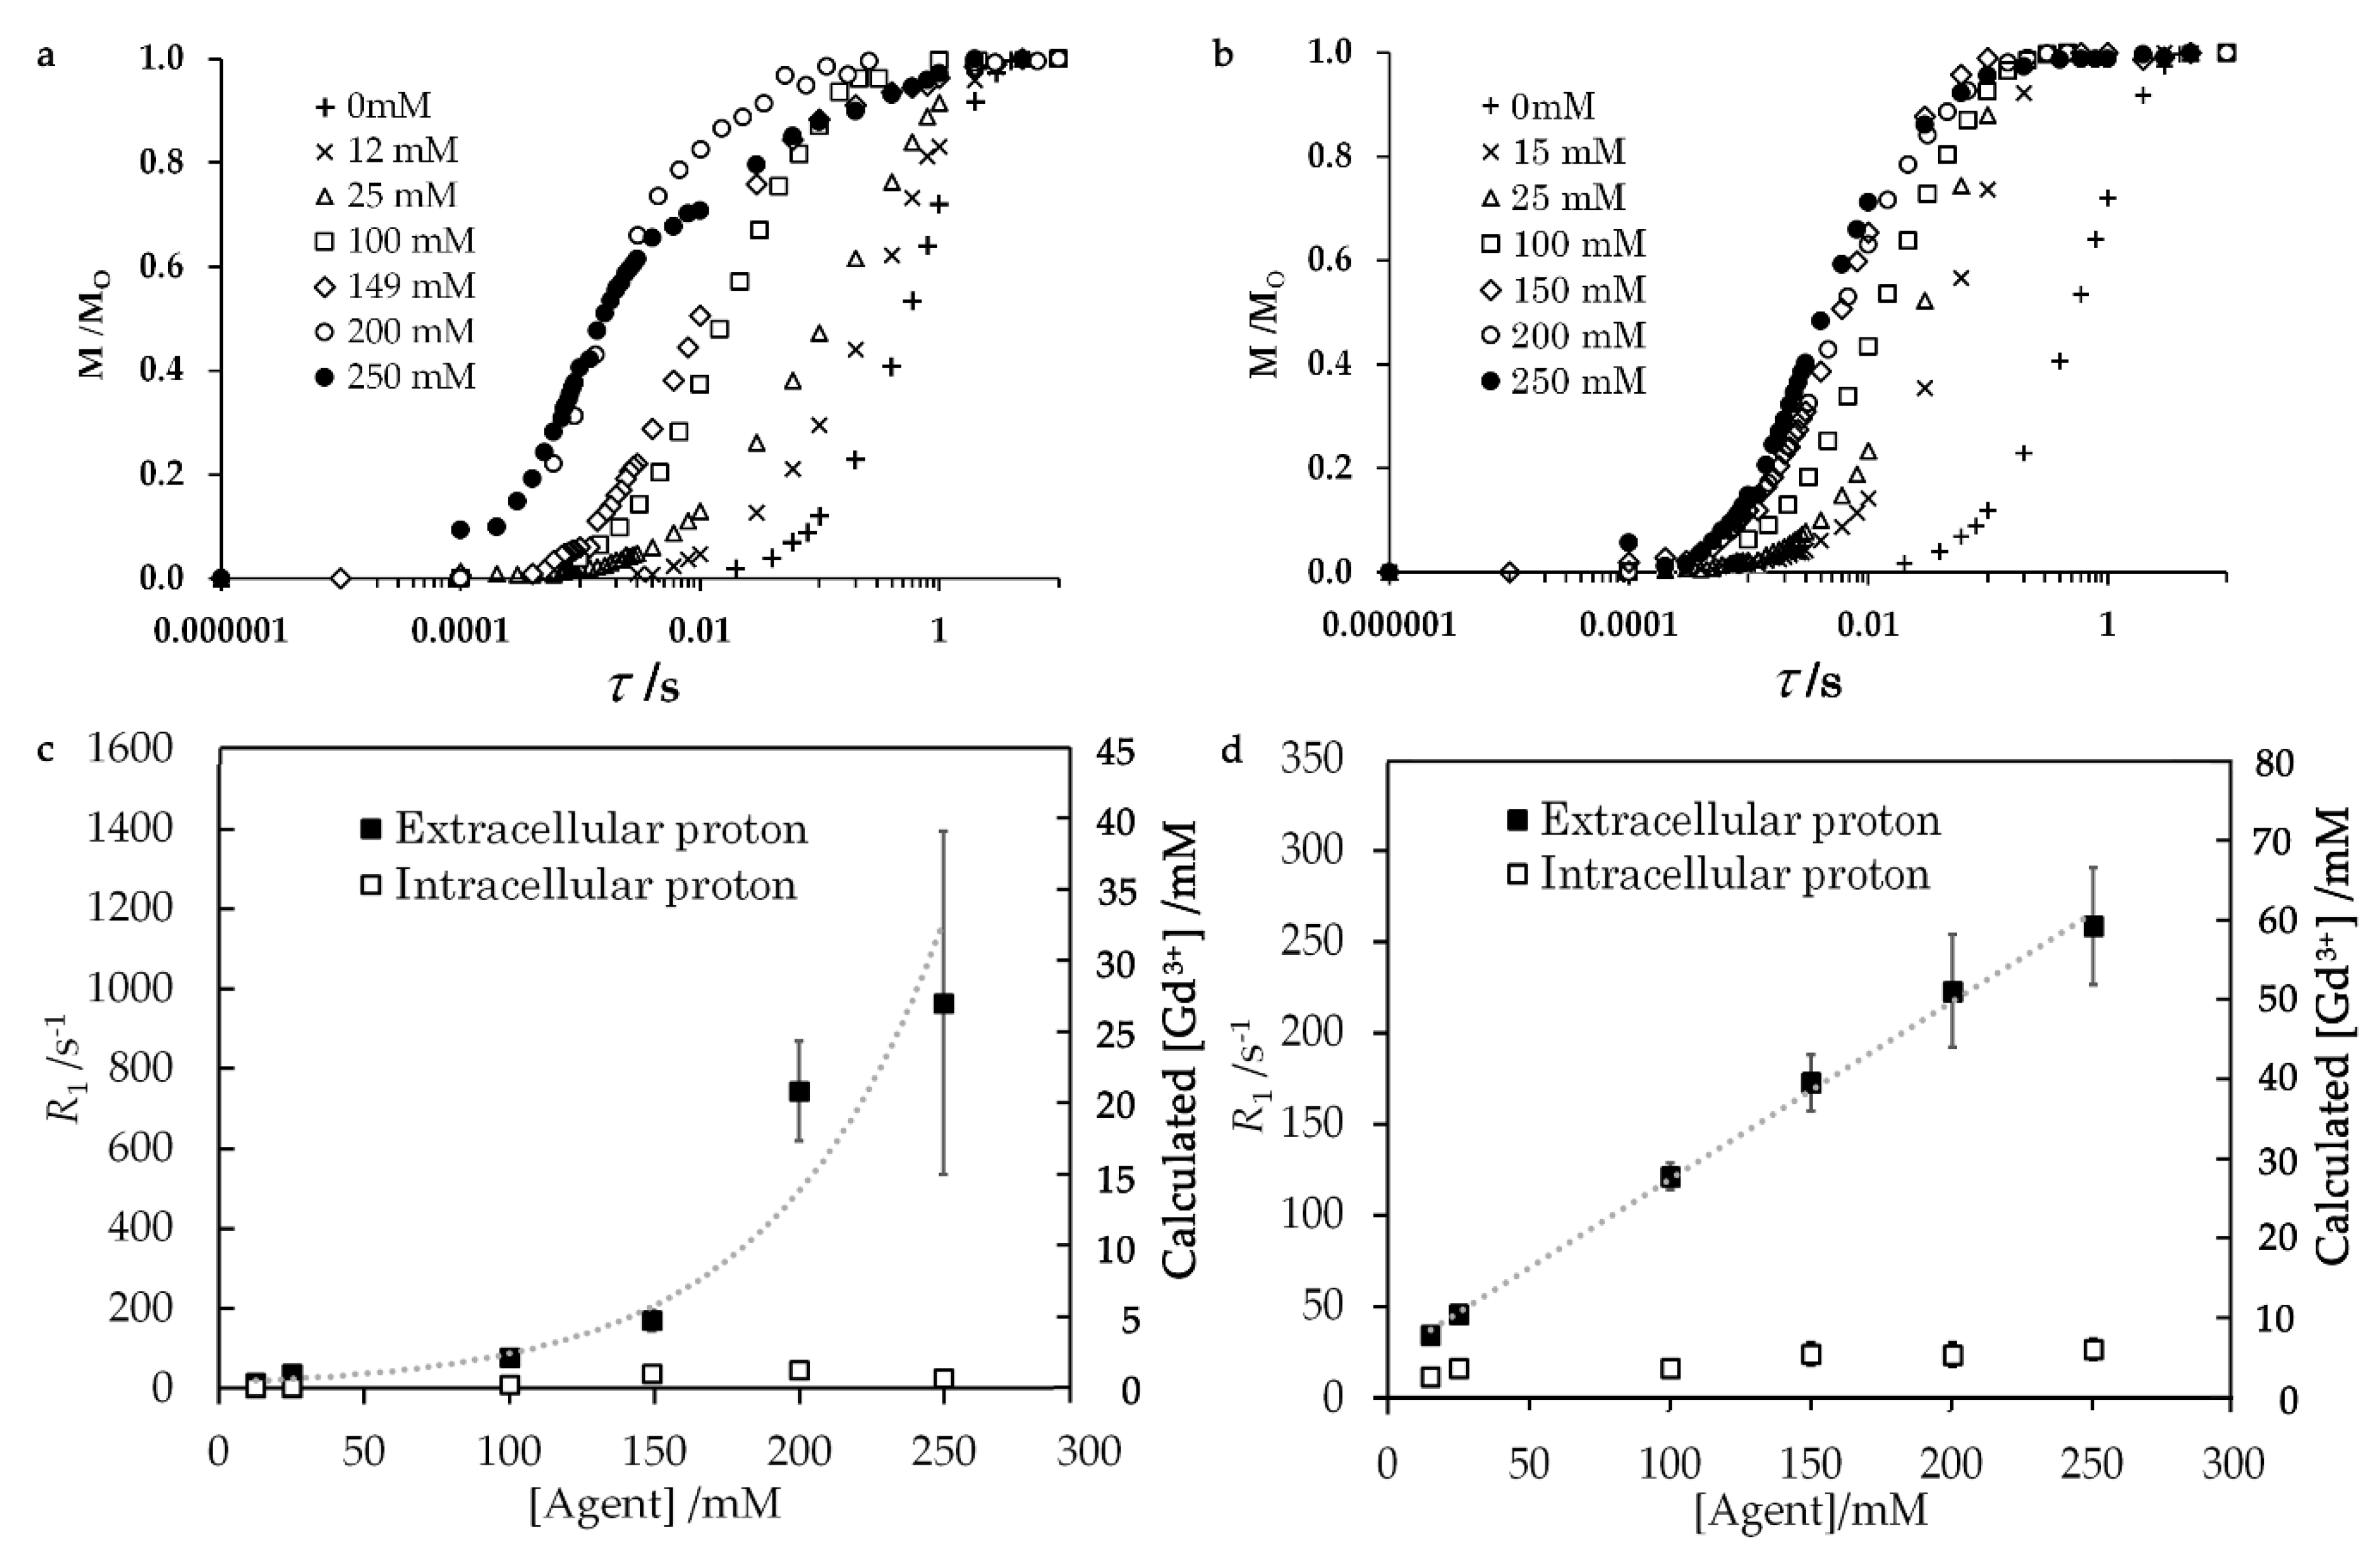
The water proton T1 relaxation rates increased with the concentration of added Gd solutions (Figure 2 and Table 1). The experimental details are given in Section 4.4. The extracellular and intracellular water resonances were distinguished by the difference in R1. The T1 relaxation curves in Figure 2a,b were fitted with multi-exponential buildup functions as described in Section 4.4 and Supplementary Materials S4 with Figure S2. The concentrations of Gd complex in the extracellular and intracellular parts in Figure 2c,d were calculated from the relaxivities of Gd complexes. These relaxivities were calculated from viscosities which were obtained from the experimental E. coli samples in the absence of the Gd complex. The relaxivities of aqua Gd3+ complex for the extracellular and intracellular solutions were 34.5 and 25.4 s−1 mM−1 and those of Gd-DOTA complex were 4.81 and 3.50 s−1 mM−1, respectively. These relaxivities were calculated using the Gd3+ proton distance of 3.2 Å as given in Section 4.1 and Supplementary Materials S5 and S6. Figure S3 and Table S1 show that the calculated relaxivity gave a Gd3+ concentration in a solution with accuracy of about 4%. Although the relaxivity of the aqua Gd3+ complex for extracellular water was only about 1.4-fold higher than that for intracellular water, the T1 relaxation rate of extracellular water was three times faster than the intracellular water T1 relaxation rate at every addition of Gd complex solution with different Gd concentrations. This result explains that the concentration of the extracellular aqua Gd3+ concentration was significantly higher than the intracellular concentration. The extracellular T1 relaxation rate non-linearly increased with the concentration of added aqua Gd3+ solution, as shown in Figure 2c.
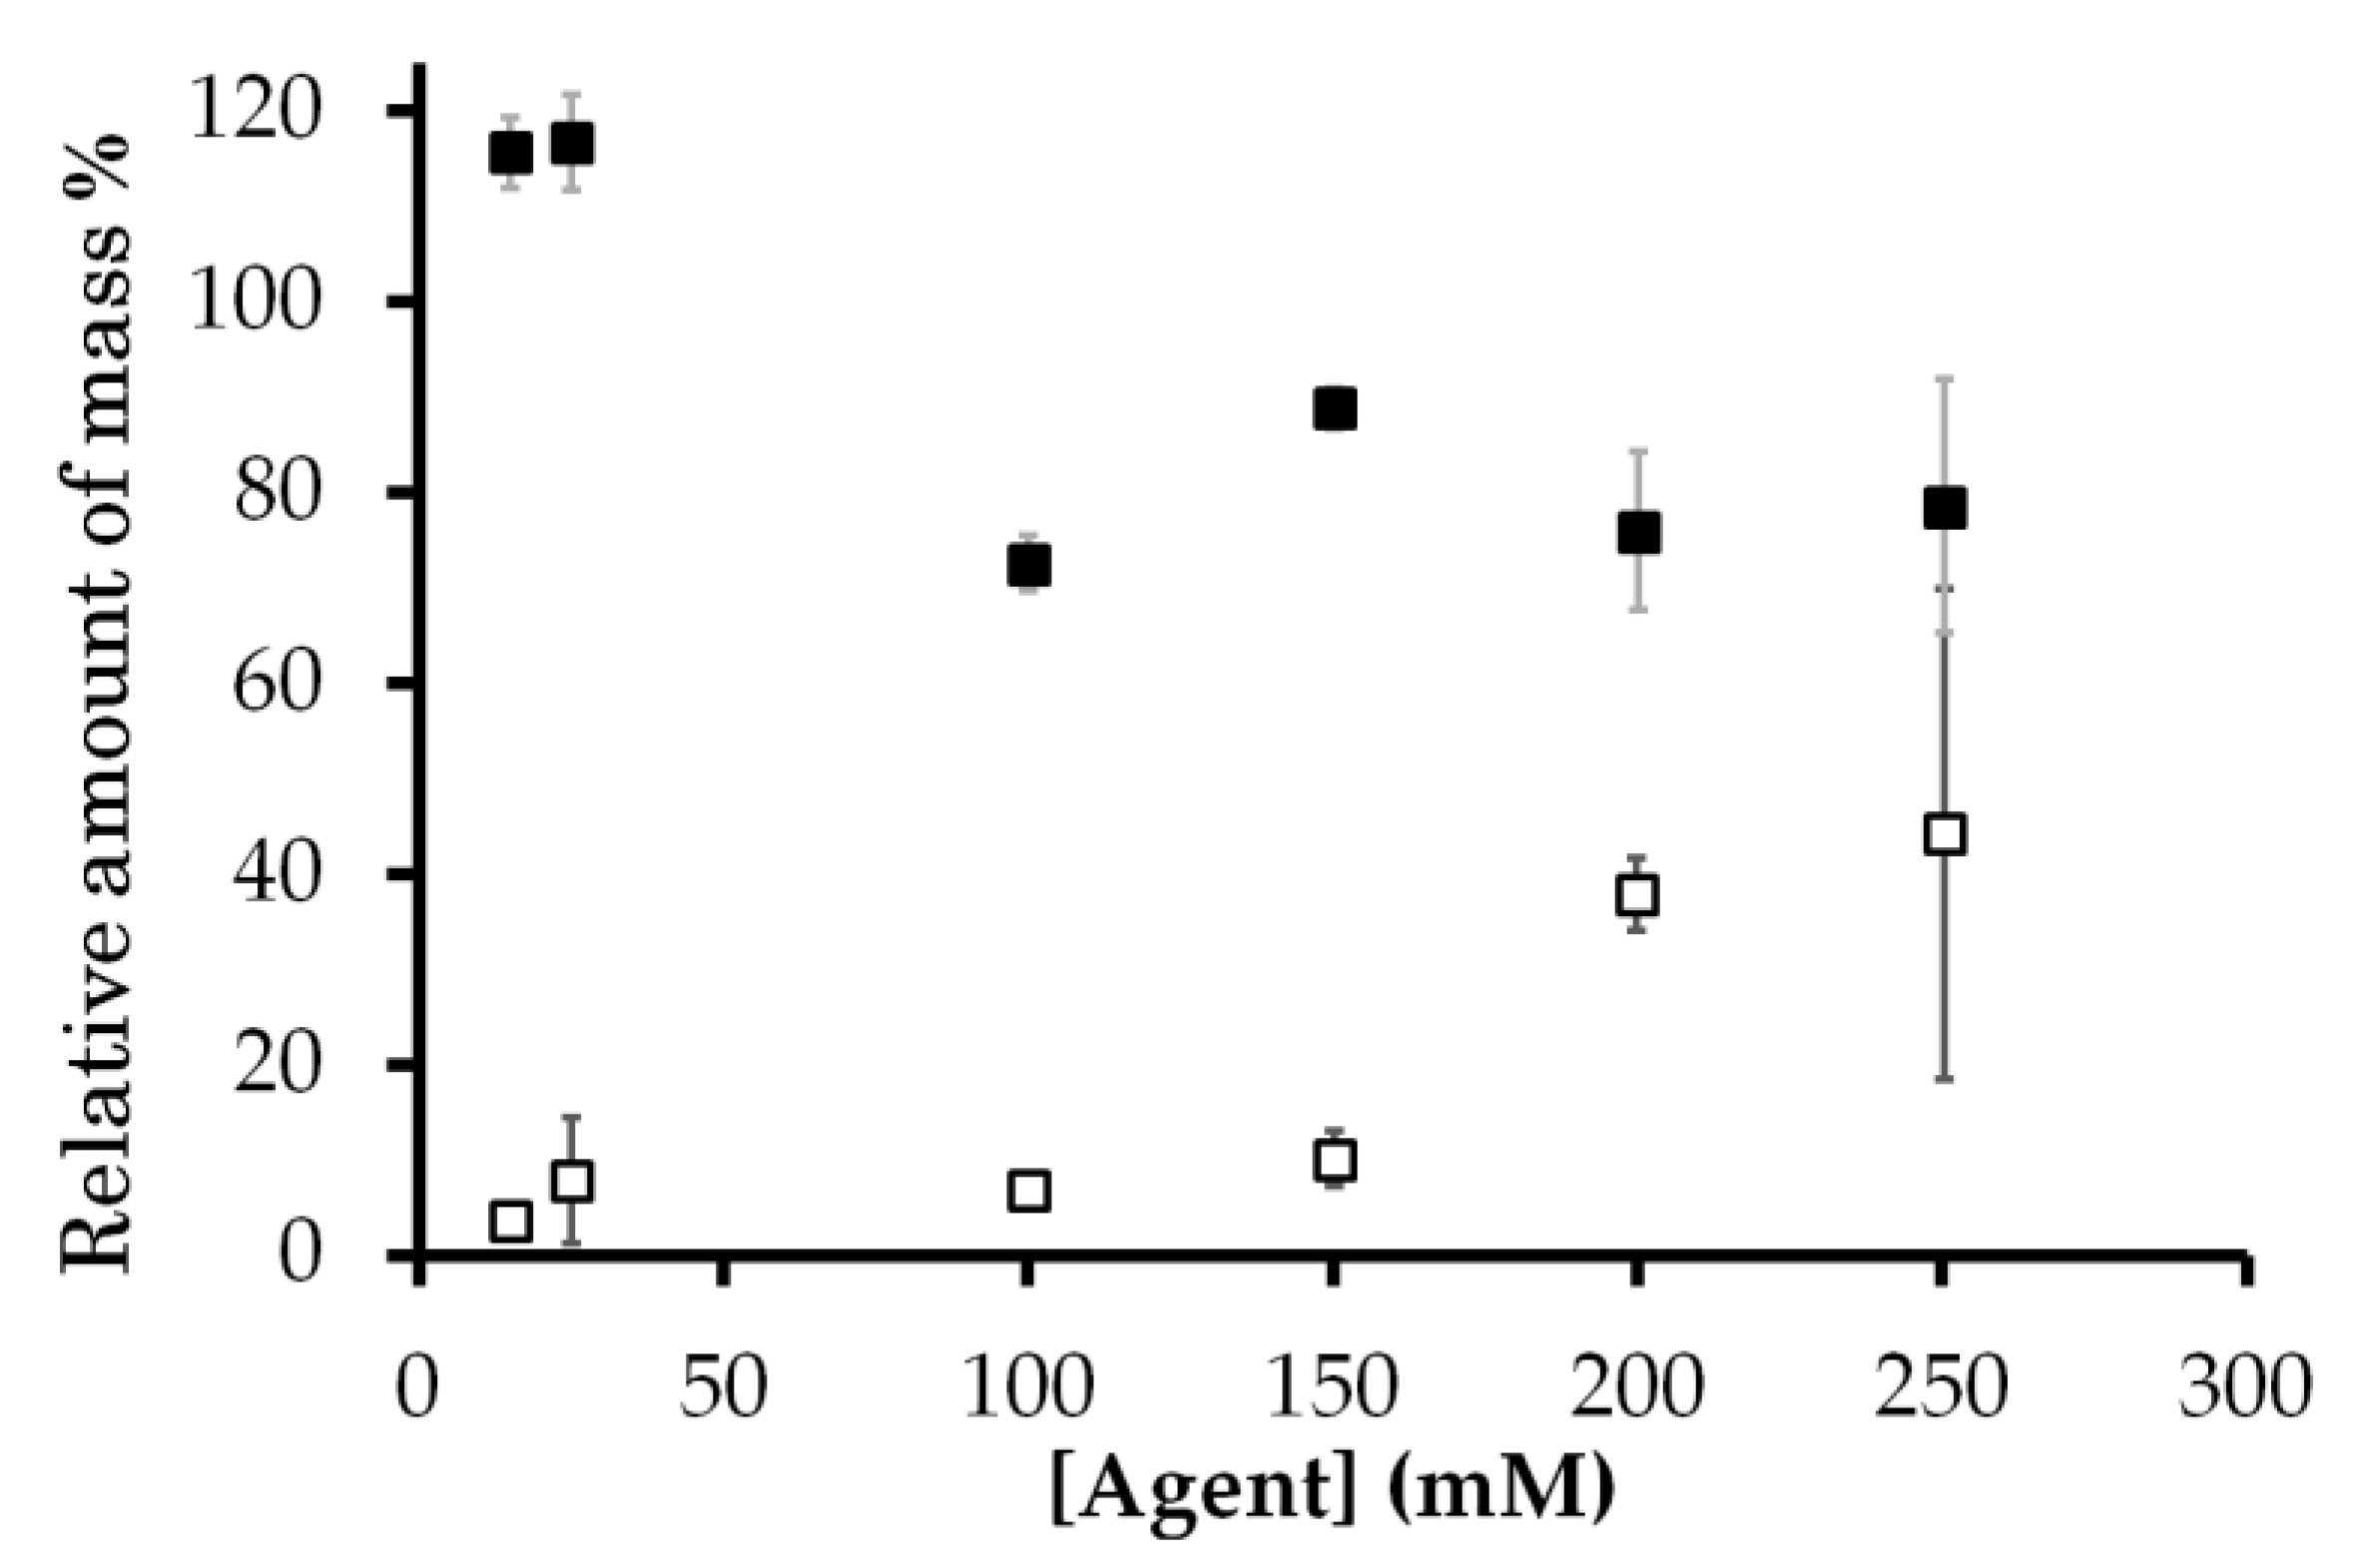
The amount of Gd3+ was calculated from the intracellular and extracellular proton relaxation rates R1. This amount relative to the total amount of Gd3+ added as solution with the known aqua Gd3+ and Gd-DOTA concentrations is shown in Figure 3. This figure shows that the cellular Gd amount obtained from the relaxivity was equal to or less than the Gd amount added to the samples, which confirms the validity of the Gd concentration obtained from the relaxivity. The relative Gd3+ amount was much lower than 100% only for aqua Gd3+. The reduction of this amount, the capability of Gd3+ for PRE, indicates that the exchangeable water molecules were prevented from accessing the unpaired electrons in Gd3+. Thus, the Gd amount gives the information for the interaction of Gd with cellular components.
In contrast to the T1 relaxation rate for aqua Gd3+, the T1 relaxation rate for the extracellular proton of the sample containing Gd-DOTA increased linearly in proportion to the added concentration (Figure 2d). The amount of Gd-DOTA recalculated from T1 relaxation rates relative to the known amount of Gd-DOTA was about 76–116% (Figure 3). Therefore, these T1 relaxation rates indicate that Gd-DOTA was stable and dissolved in the E. coli mixture.
2.3. High-Resolution Solid-State 13C NMR Spectra
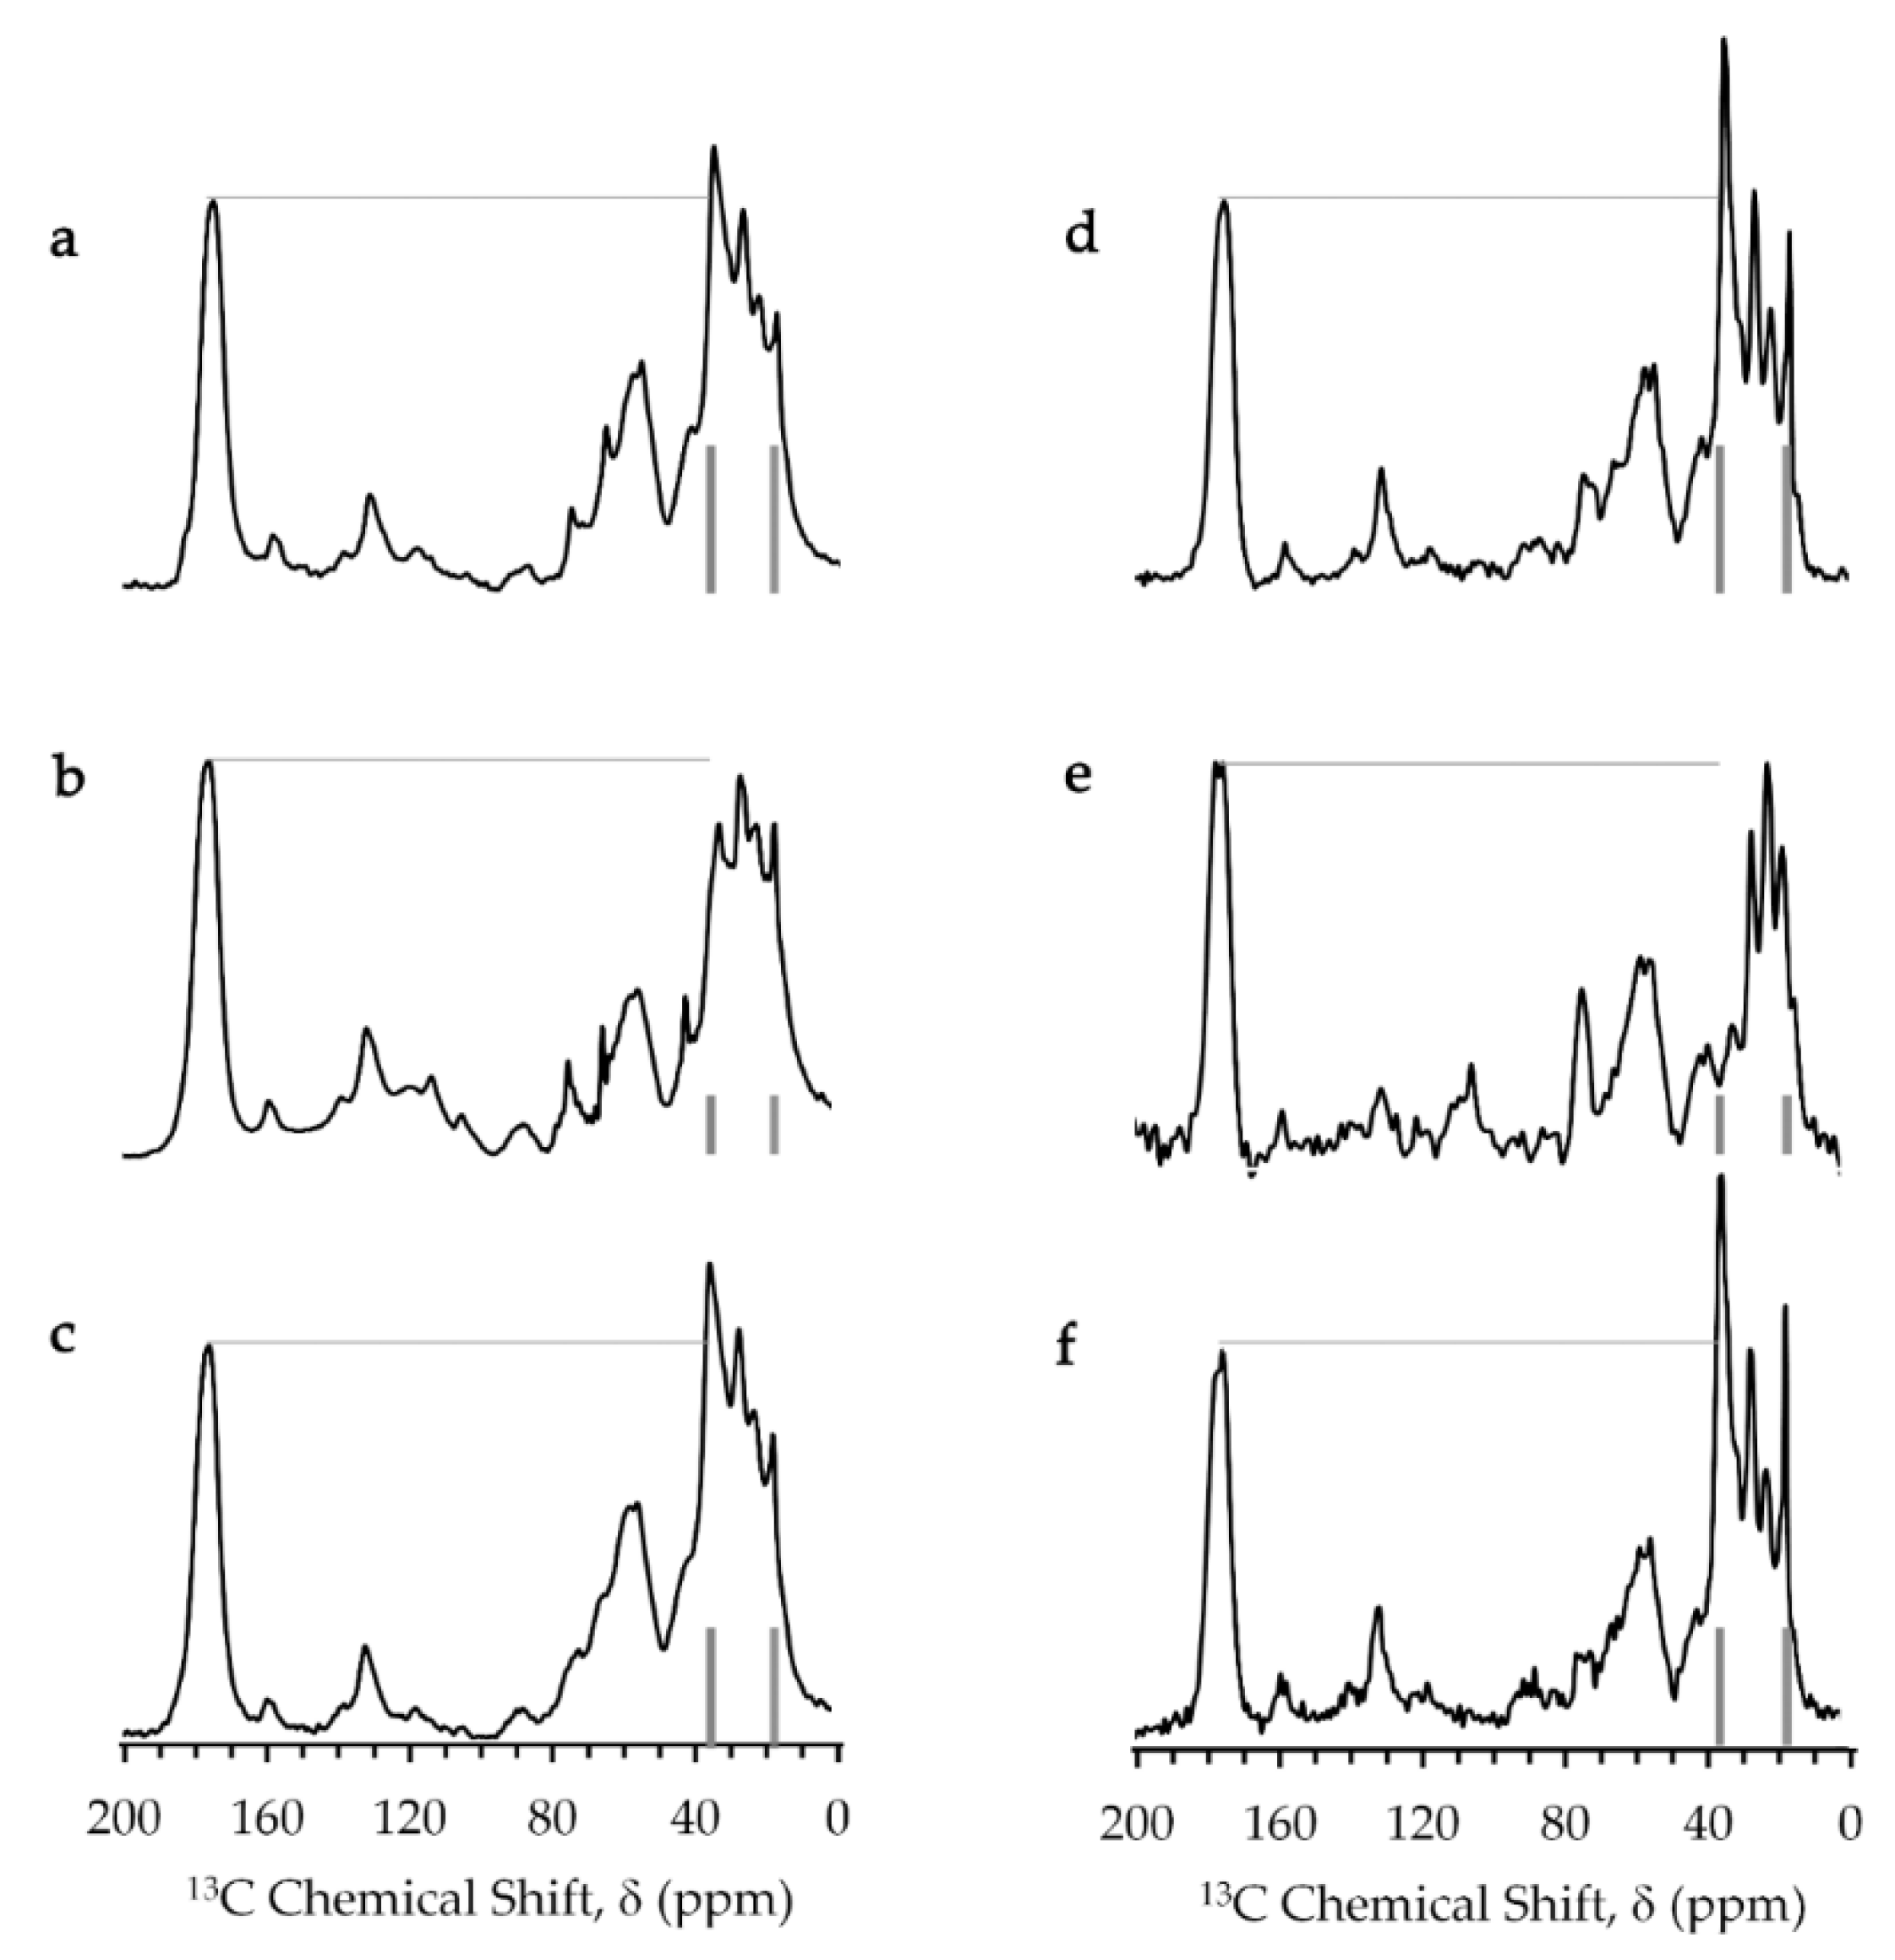
The single pulse and CPMAS (cross polarization magic-angle spinning) experiments give solid-state 13C-NMR spectra for all the static and mobile parts and those for only static parts of the E. coli cell samples, respectively. Experimental details are given in Section 4.5. The single pulse and CPMAS experiments provided similar spectra for the E. coli samples in absence of paramagnetic agents at a temperature of 218 K (Figure 4c,f). Therefore, all the cellular components were in a static state at this low experimental temperature.
The magic-angle spinning solid-state 13C-NMR spectra of the E. coli mixture in presence of Gd-DOTA complex were similar to those in absence of Gd complexes. However, the E. coli sample containing the aqua Gd3+ complex provided the spectra exhibiting an obvious reduction in height for the peak at 35.5 ppm which was assigned to the methylene carbon in the acyl chains of membrane lipids [35]. This resonance had the highest signal intensity in the spectra of the sample containing Gd-DOTA and the gadolinium-free sample because E. coli cells have a high lipid composition of 9% [31]. This strong peak was suppressed only in the spectra of the E. coli sample containing aqua Gd3+ due to transverse PRE effect of Gd3+. PRE gives information on the distance between the Gd3+ ions and cellular components. The reduction of this peak indicates that Gd3+ formed complexes with phospholipids in the cell membranes [36,37]. The paramagnetic fields of Gd3+ should reduce more than half of the signal of lipid methylene carbons which locate approximately within a radius of 1 nm of Gd3+ ions [38,39]. The peak of the methyl carbon of the lipid at 16.8 ppm [40,41,42] was not much suppressed by this PRE effect because methyl carbons were about 2 nm away from Gd3+ ions in the interface region of the bilayer membranes. The Gd3+ concentration in cytosol would not have been sufficient to suppress the 13C resonance of proteins whose carbonyl and Cα signals appeared at 175 and 60 ppm.
2.4. Viability of E. coli Cells and Magnetic Relxation during the Experiments
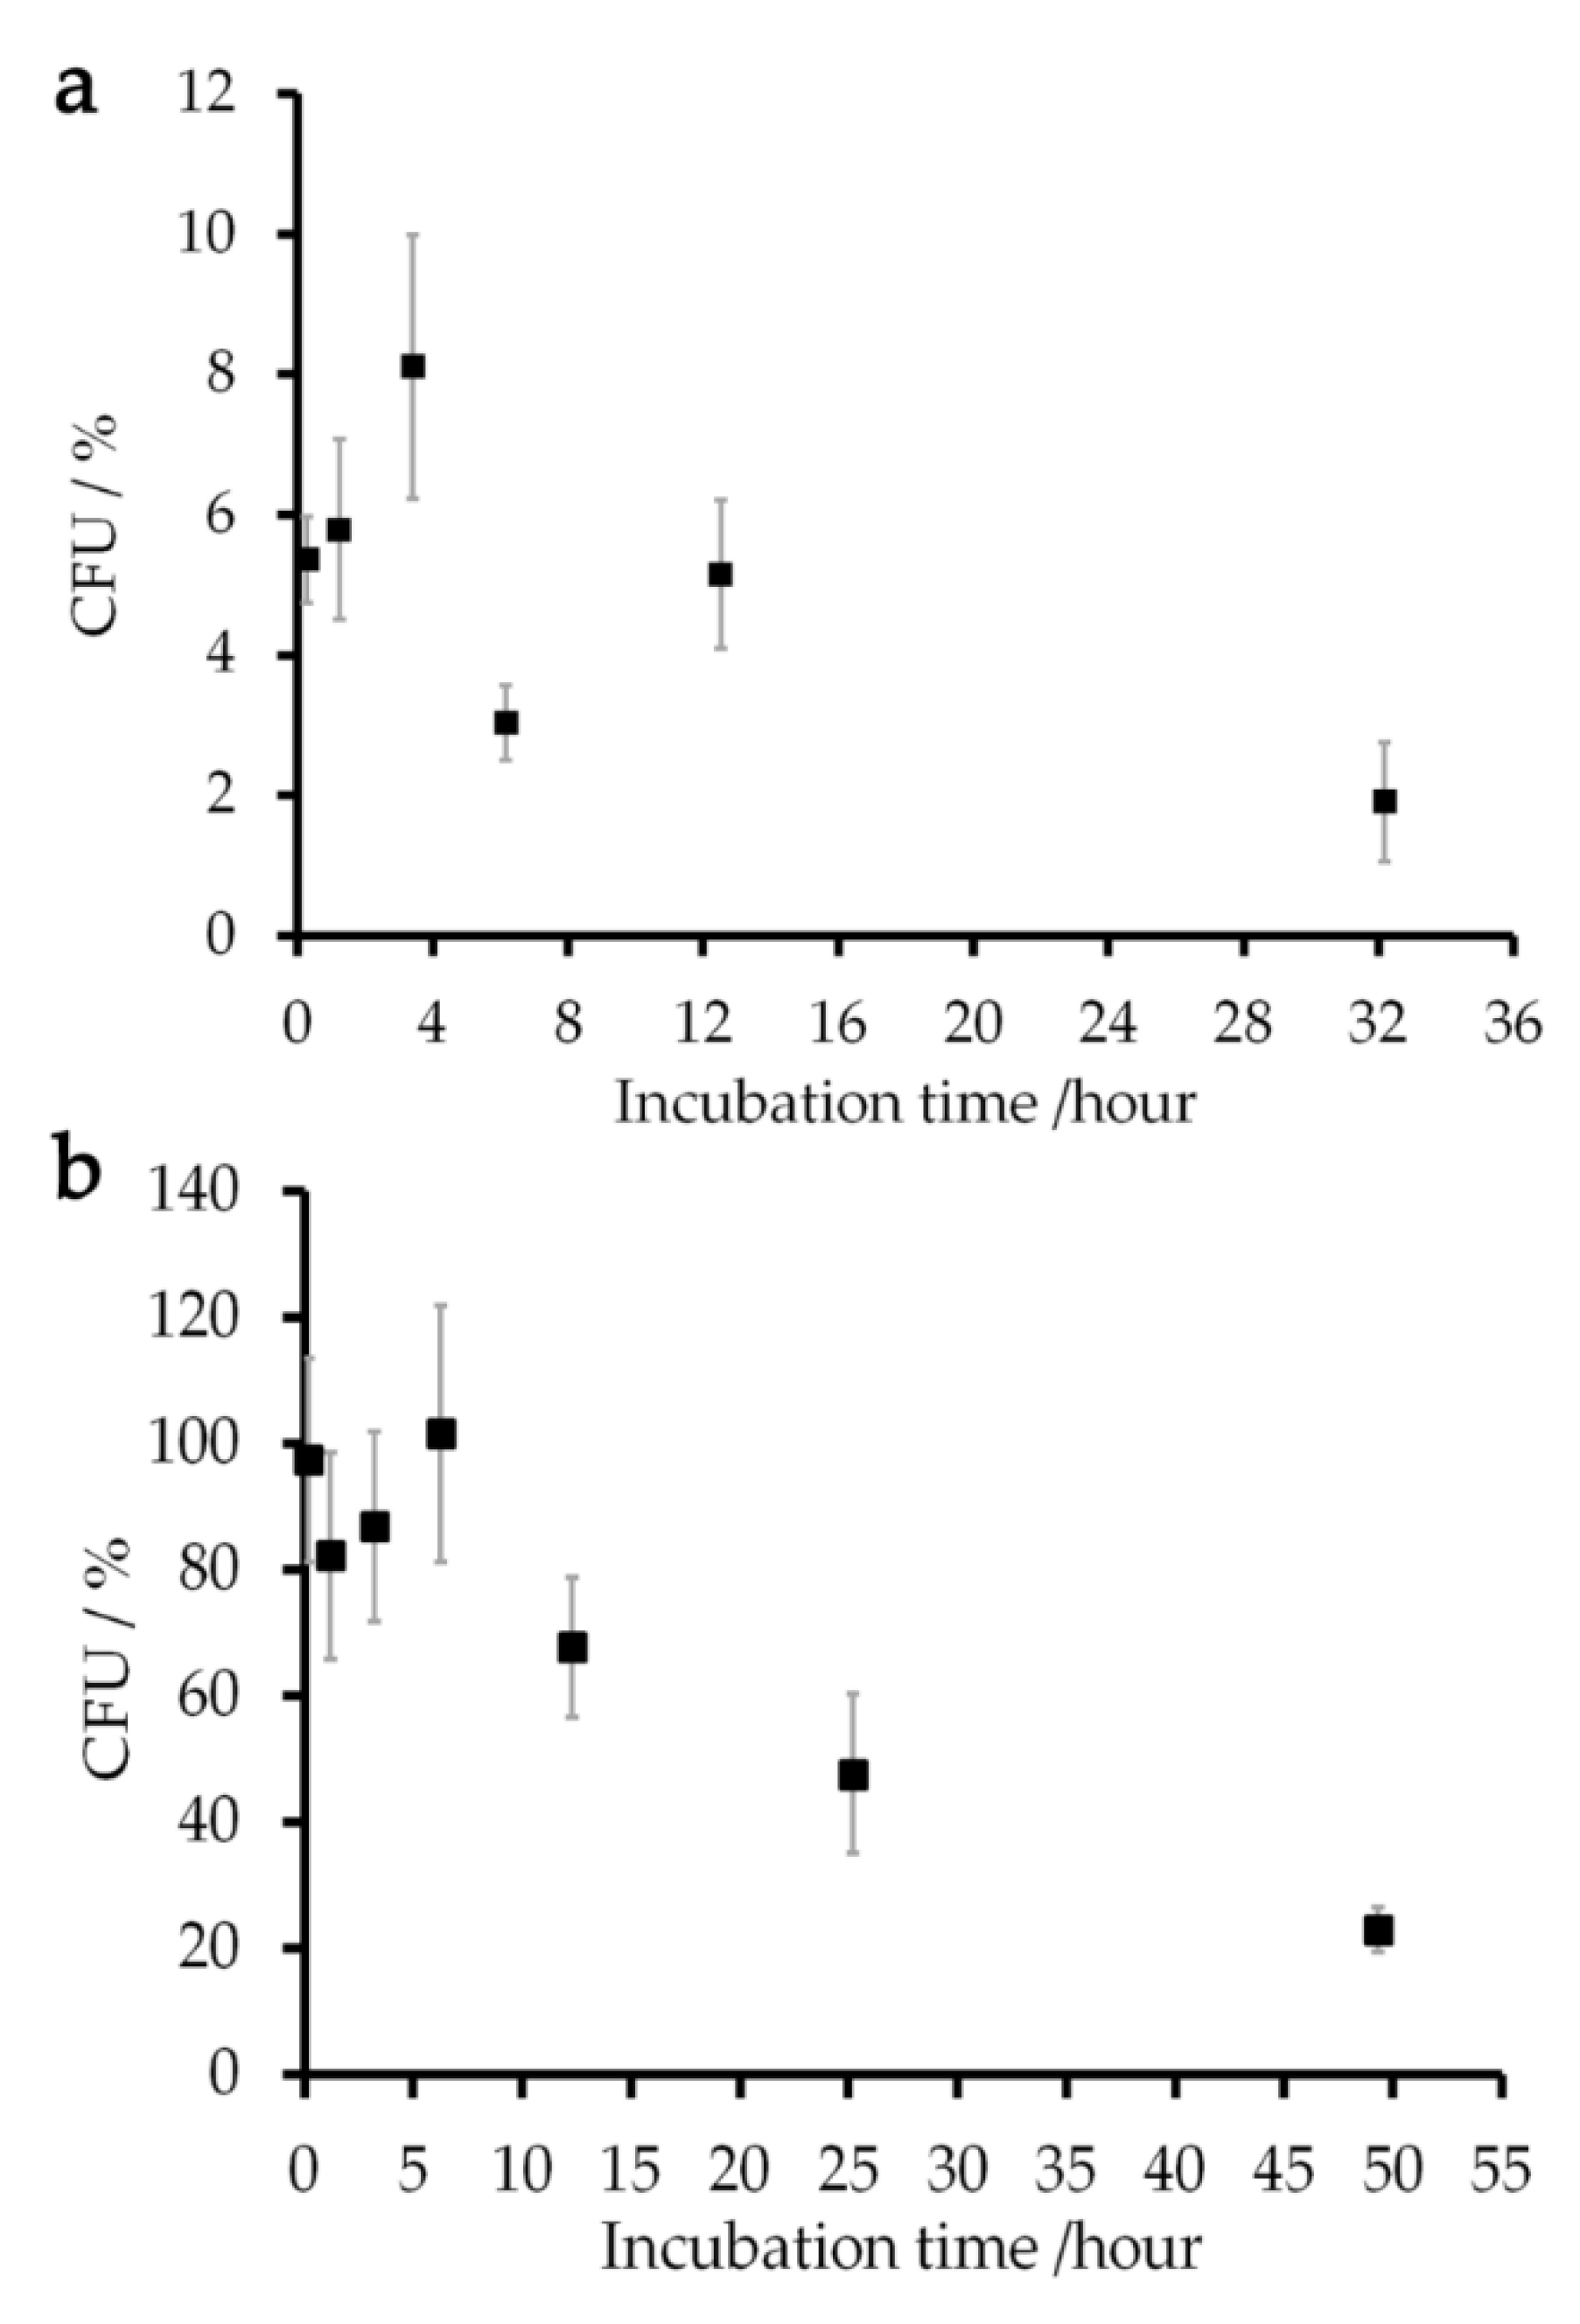
The viability of E. coli cells in the sample mixed with a 150 mM Gd-DOTA solution was examined by measuring their ability to form a new colony on an LB (Lysogeny Broth) plate or colony-forming unit (CFU) [43]. Since the samples mixed with 250 mM Gd solutions gave low reproducible results, the viability test was conducted using a concentration of Gd solutions at 150 mM which was close to the native salt concentration in cellular environment [44,45]. Experimental details are given in Section 4.6. The normalized CFU presented that around 90% of the cells were still alive in the Gd-DOTA solution for three hours (Figure 5). This value decreased exponentially with a time constant of 36 h. The NMR experiments for measuring R1 of the cells were completed within 40 min. Therefore, the experiments provided the T1 relaxation rates for the samples in which more than 90% of cells retained the colony-forming ability. The E. coli samples incubated in 149 mM aqua Gd3+ solution showed a CFU less than 10% after the incubation for 10 min. This figure also shows the cell viability during a series of T1 measurements which took almost ten hours.
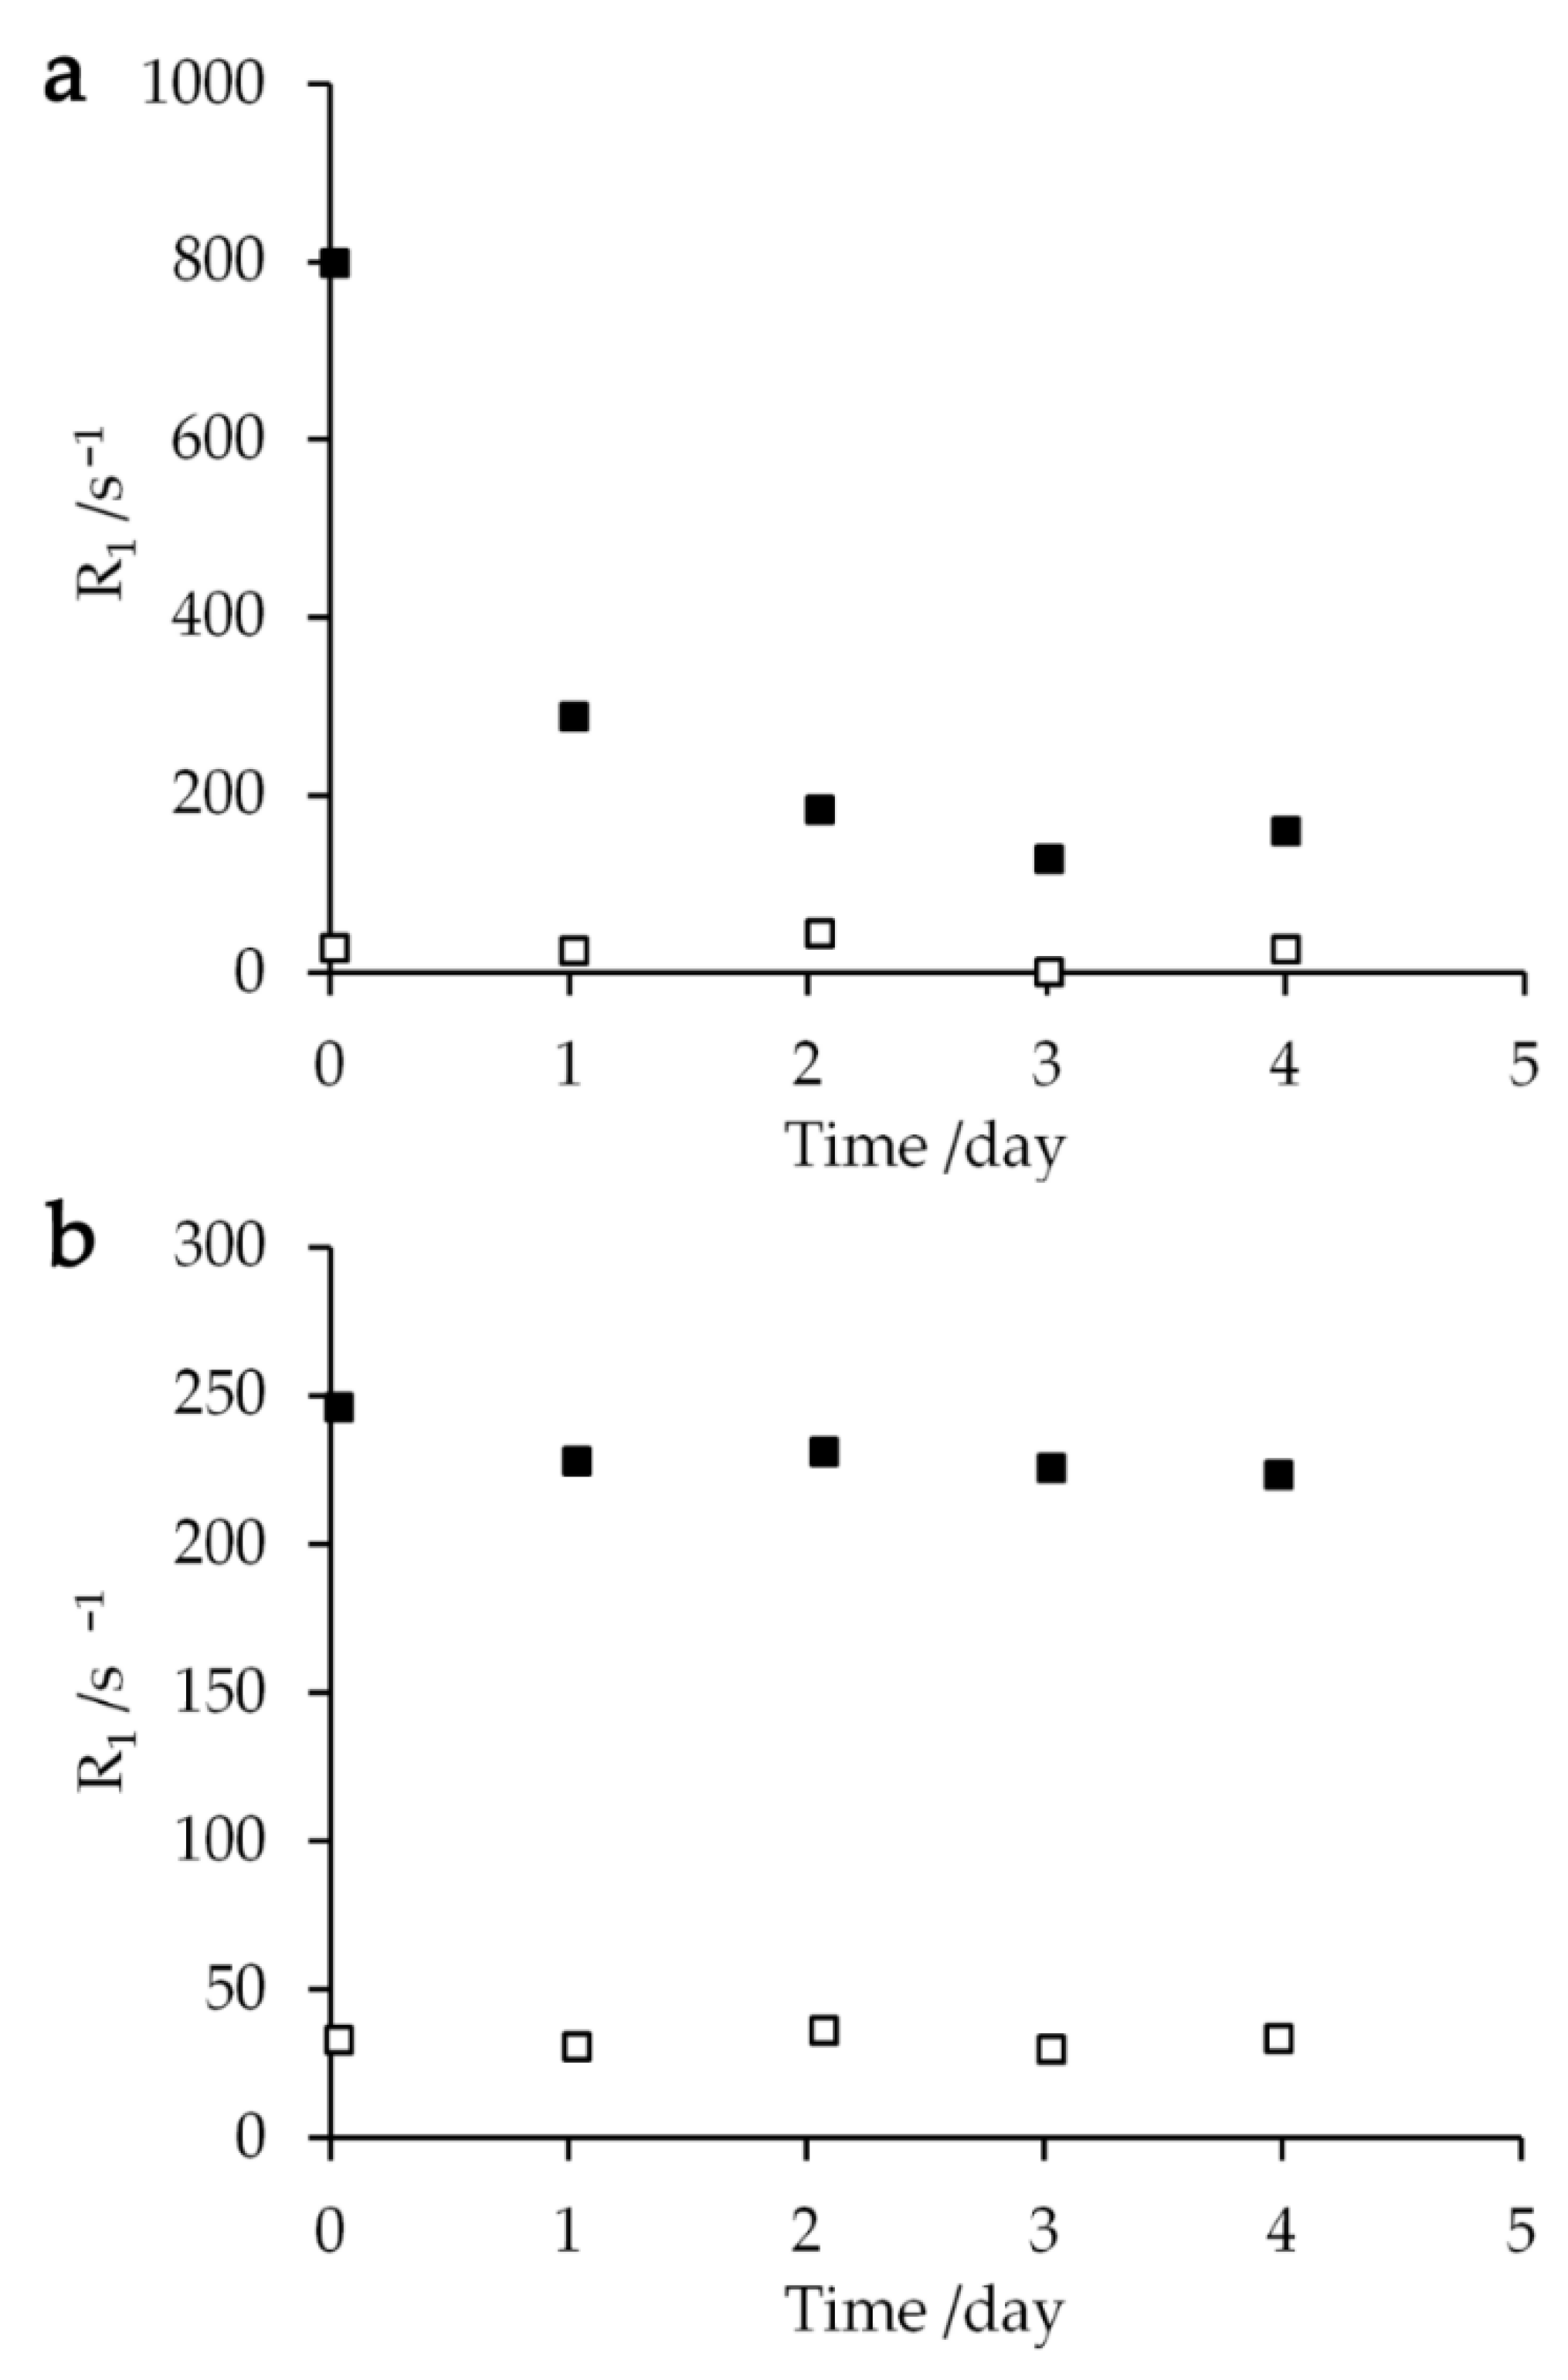
Relaxation rates R1 of the sample mixed with 250 mM aqua Gd3+ solution were measured repeatedly over several days in order to examine their dependence on the time elapsed after mixing the cell sample with the Gd solution. The extracellular relaxation rate R1 exponentially declined with a time constant of 1.09 ± 0.44 day (Figure 6a). Since the intracellular T1 relaxation rate and the amplitudes of extracellular and intracellular proton changed by less than 10%, the reduction of extracellular T1 relaxation rate should not occur due to the permeation of aqua Gd3+ complex into the cytoplasm or the cell lysis. Therefore, this decrease should reflect the complexation of Gd3+ ions with the cellular components. In contrast, the E. coli sample mixed with 250 mM Gd-DOTA solution showed that the intracellular and extracellular T1 relaxation rates did not change by more than 10% during the experiments for four days (Figure 6b). The slow reduction of the T1 relaxation rate can be interpreted as the initial part of an exponential decrease with a time constant of 41.7 ± 6.1 day. Thus, Gd-DOTA is better than aqua Gd3+ in that Gd-DOTA provides the stable PRE effect on the resonance of the cell samples for a longer period of time. We can obtain the information for the cell lysis and membrane permeability to Gd compounds as discussed in Section 3.2 and Section 3.3. The time constants longer than a day also show that Gd3+ and Gd-DOTA concentration-dependent NMR spectra in Figure 1 and R1 in Figure 2 were the same as those obtained immediately after the entry of Gd3+ and Gd-DOTA.
3. Discussion
3.1. Dependence of 1H-NMR Relaxation Rates R1 on Gd Complex Concentration
The relaxation rate R1 for the signal at around 4.7 ppm can be influenced by protons other than water protons such as methylene and methine protons in glycerol. However, those glycerol protons should have a small effect on the averaged T1 relaxation rate, less than by about 20%. This is because the T1 relaxation rates of methylene and methine protons were slower than that for water protons, e.g., R1 for CH2/CH and water protons were 66 and 200 s−1, respectively, in a water–glycerol mixture at the Gd-DOTA concentration of 12 mM. Moreover, the glycerol proton content relative to water protons in our cell sample was less than about 20%. The broadening of all the peaks in the spectra in Figure 2b,d indicates that the resonances of methylene and methine protons experienced PRE similarly to the water peak. The PRE effect on all protons also decreases the discrepancy between the T1 relaxation rate of the water proton and the averaged T1 relaxation rate. It is worthwhile to note that the T1 relaxation rate of the extracellular proton was about ten-fold faster than that of the intracellular proton at the addition of 150 mM Gd-DOTA solution. This T1 relaxation difference is much larger than the effect of methylene and methane protons on the measured T1 relaxation rate. Therefore, the difference in the T1 relaxation rate especially at high concentrations of Gd can be used for distinguishing between extra- and intracellular parts of the sample.
3.2. Interaction of Gd Complexes with the Cells and Cytotoxicity
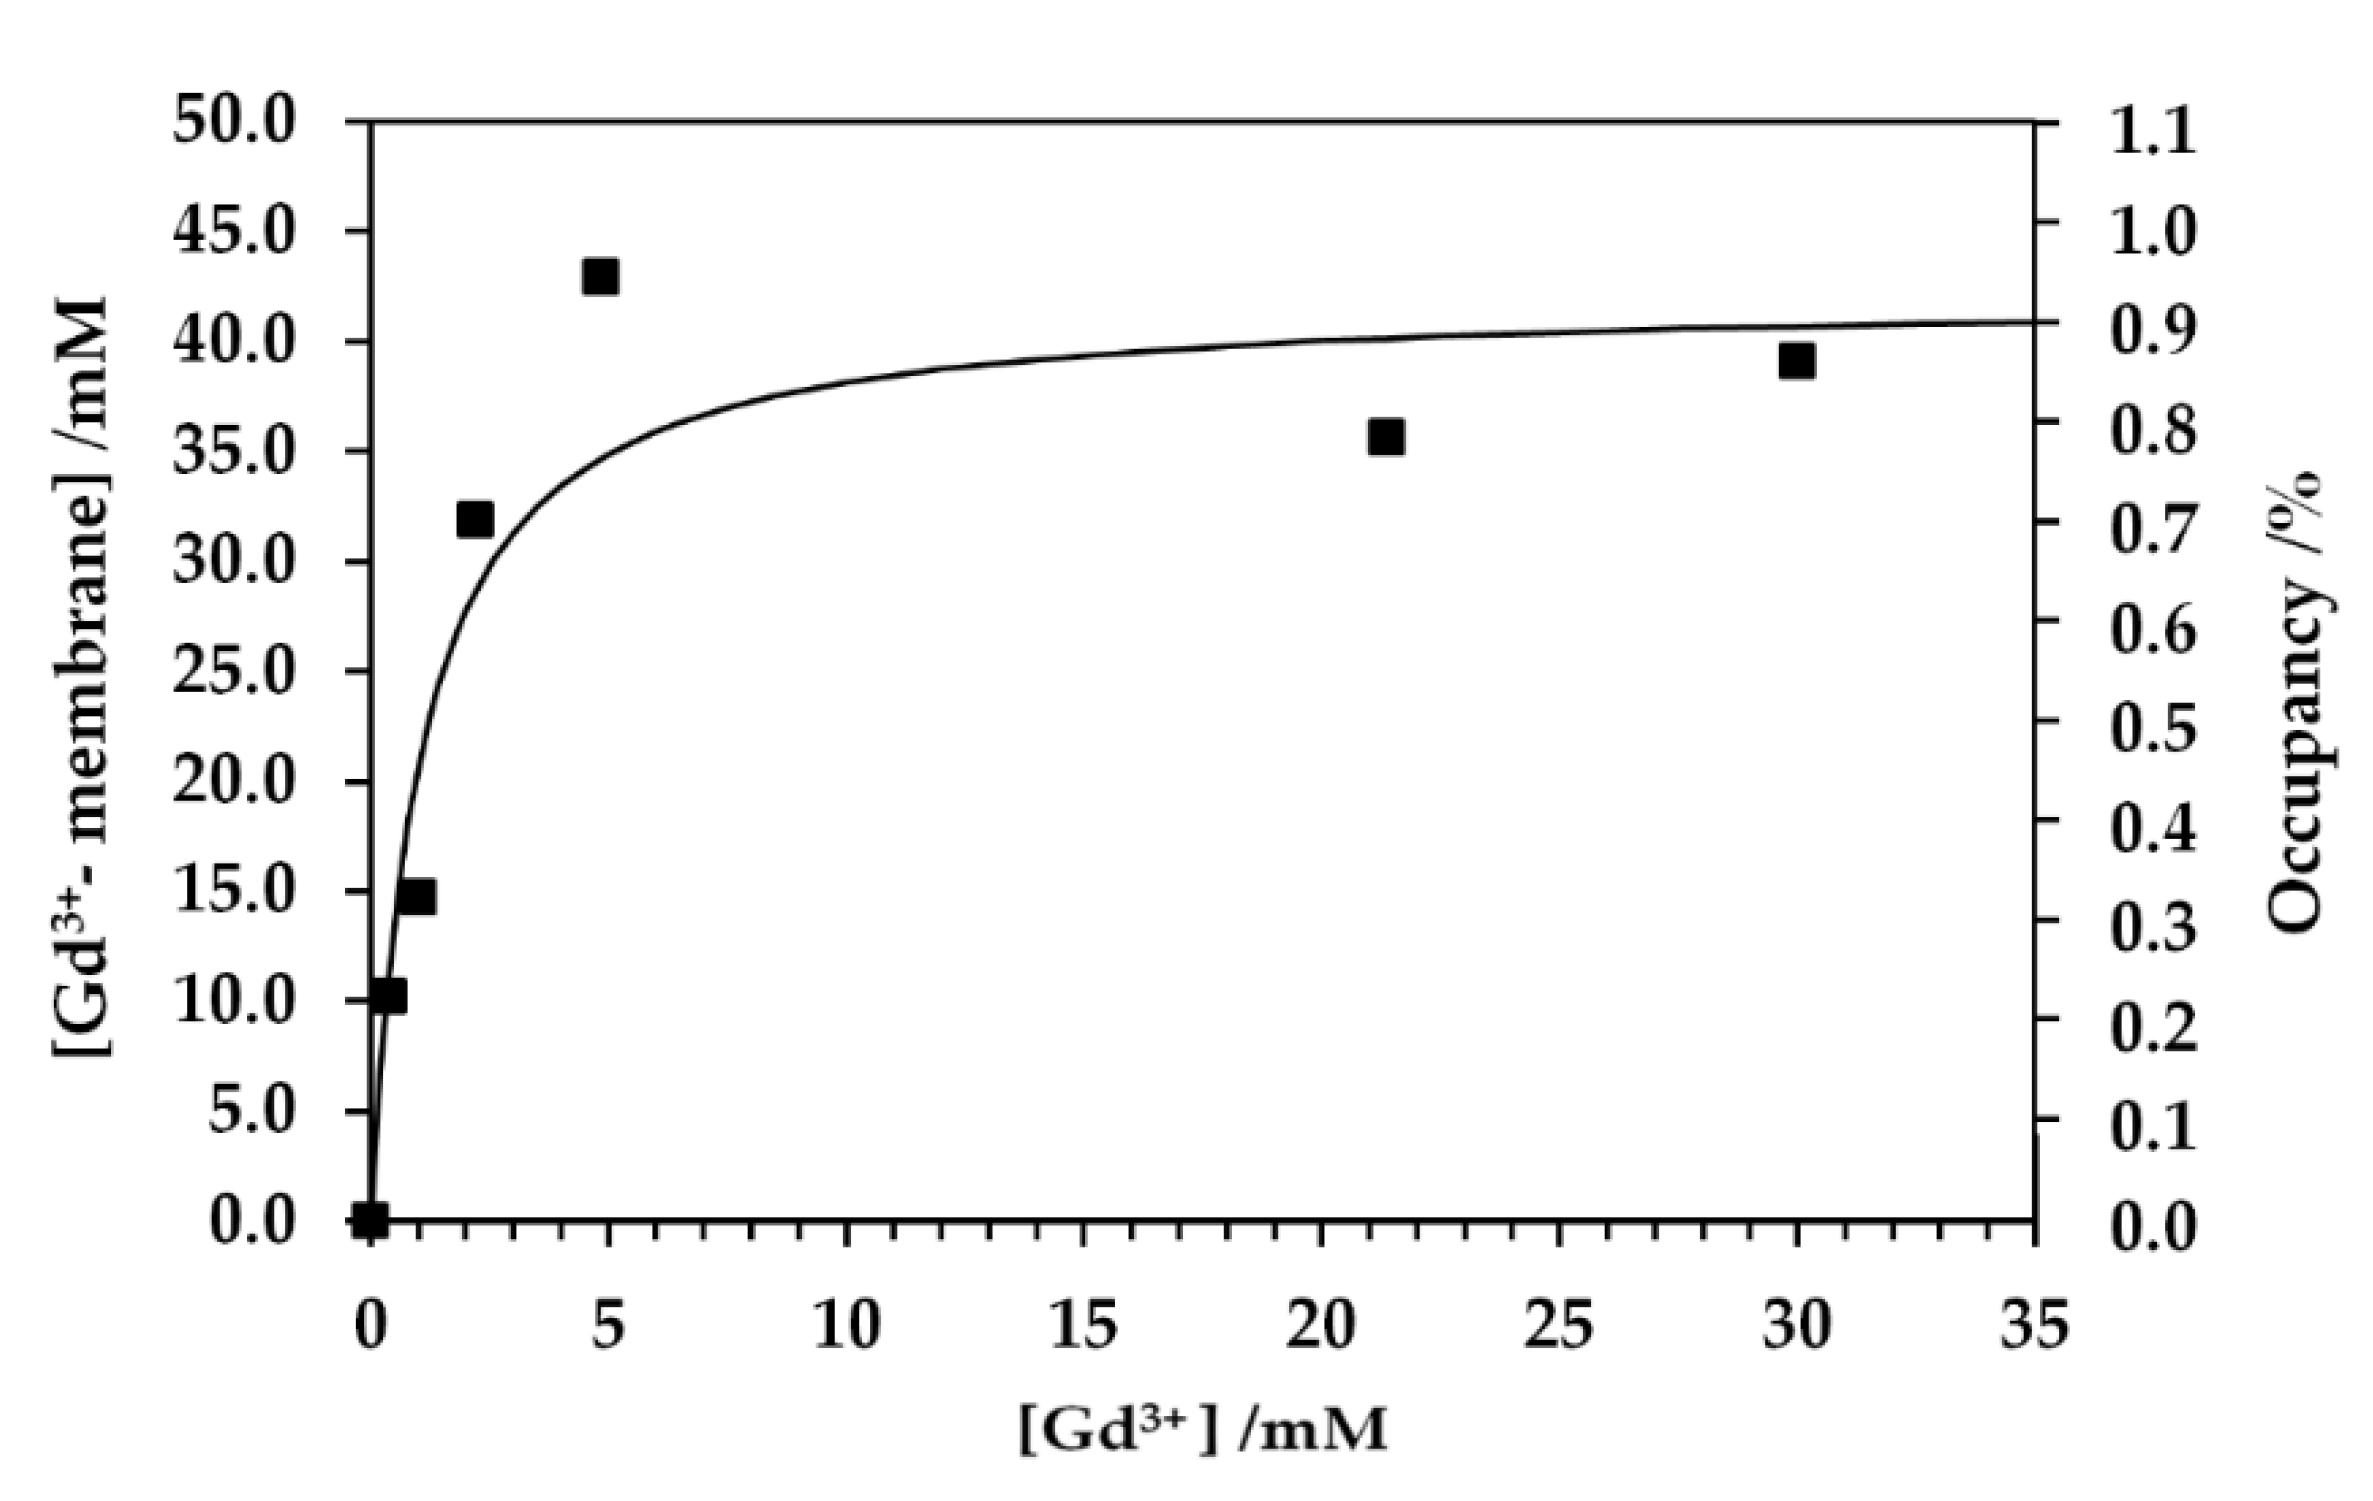
The weak PRE effect as observed in the T1 relaxation rate for the aqua Gd3+ titration NMR experiments of the cell sample was due to the binding of Gd3+ to cellular components, especially in anionic groups in lipids and macromolecules [36,37]. The Gd complex formation with cellular components sequesters the Gd3+ ion from bulk exchangeable water molecules and suppresses the PRE effect on the bulk water. The T1 relaxation rates in the aqua Gd3+ titration experiments were significantly low at the concentration for the addition of Gd3+ solution less than 150 mM (Figure 2c and Figure 3). This titration experiment provided a dissociation constant Kd of 1.0 mM for the Gd–cell component complex and the total binding site concentration of 42 mM (Figure 7). All the experimental data for Kd measurement were obtained from the T1 measurements given in Figure 2c,d and Figure 3. In this analysis, the number of the Gd–cell complex was obtained by subtracting the number of Gd3+ ions in the extracellular solution from the total number added to the sample. The Gd3+ ions should be transported to the periplasmic space through the porin channels in the outer membranes. Under the assumption that Gd3+ bound to the membranes in the cell surface and the periplasm, the amount of total binding sites calculated from the titrations was converted to the surface area of lipid membrane per binding Gd3+ ion of about 0.4 nm2. This amount was calculated using the number of the cells, the cell surface area and extracellular volume. The area of lipid membrane per binding Gd3+ ion of 0.4 nm2 is close to the area per lipid molecule of 0.6 nm2 [31,46]. Since only about a quarter of phospholipids in E. coli are known to have negative charges [47], Gd3+ ions would bind to not only anionic head groups of phospholipids [36,37] but also phosphates of neutral lipids and negatively charged biomolecules in the membranes and periplasm. The 13C-NMR spectra supported the interaction mode of Gd3+ with E. coli cells (Figure 4). The spectra show that the PRE effect of Gd3+ specifically suppressed the intensity of the lipid methylene 13CH2 peak by about 80%.
Note that the addition of 149 or 250 mM aqua Gd3+ solution to the cell sample caused cell aggregation and difficulty in pipetting the sample. Similar phenomena did not occur when Gd-DOTA solution was added to the cell sample. Such macroscopic difference in the cell aggregation is possibly related to the electric charge state altered by Gd3+ ions binding to the cell membranes.
The strong cytotoxicity of aqua Gd3+ as observed in the low CFU would be due to the binding of this ion to phospholipids which disrupts the interaction of the cell membranes with functional proteins by changing the electrostatic properties. Although the Gd3+ ions interacted mainly with anionic head groups of the membrane lipids, a part of the Gd3+ ions should have bound to proteins. Their binding to cellular proteins should alter the protein–ligand and protein–protein interactions by electrostatic forces. Such modification of biomolecular interactions should damage the cellular functions for metabolism and proliferation. Note that this toxicity did not directly correlate with the cell lysis because the R1 did not exhibit an increase in Gd3+ concentration in the intracellular part.
In contrast to aqua Gd3+, Gd-DOTA was stable in the samples, and its metal center did not bind strongly with components of E. coli cell. Therefore, Gd-DOTA could keep its Gd3+ ion accessible to water molecules. This stability caused Gd-DOTA to increase the T1 relaxation rate of water proton more efficiently than aqua Gd3+, although the number of water molecules in the coordination sphere of the Gd-DOTA complex was only one, while that of the aqua Gd3+ complex was eight.
The toxicities of Gd-DOTA and aqua Gd3+ complexes were also studied by other research groups. The toxicity of aqua Gd3+ complex is well known [14]. Similarly to our experimental results, Fuma et al. reported that the population of E. coli DH5α cells in culture medium suddenly decreased when the cell sample was exposed to 3 mM aqua Gd3+ solution [48]. Even though Gd-DOTA is a stable complex used as a contrast agent for MRI, an animal test showed that this complex accumulated in animal cells. Taupitz et al. found that the Gd-DOTA complex released its Gd3+ ion under an in vivo environment through transchelation with glycosaminoglycan [49].
On the basis of the data in our study, the stable Gd complex e.g., Gd-DOTA complex, is an appropriate paramagnetic agent for NMR spectroscopy of the living cells. A typical extracellular concentration of 40 mM did not damage E. coli cells. The concentration is close to the natural concentration of salt in E. coli cells [44,45]. Even this concentration is one order higher than the safety clinical dose for an MRI study and more than 80% of E. coli cells were alive for three hours under this condition. E. coli cells should be alive in our solution NMR experiments because the NMR experiment was finished within about one hour. It should be noted that the decrease of extracellular T1 relaxation rate of E. coli cells containing Gd-DOTA complex with time constant 41.7 days (Figure 6) is considerably slower than the death rate (Figure 5) of the cells with time constant 1.5 days. Therefore, the inactive cells in terms of proliferation should have an intact form in the membrane permeability to small molecules within a few days after the addition of Gd-DOTA.
3.3. Water Exchange Across the Cell Membranes and Its Effect on Water 1H T1 Relaxation
The T1 relaxation curves were fitted with a double exponential equation to analyze the T1 relaxation rate on the assumption that the water exchange between the intracellular and extracellular spaces was slower than the T1 relaxation rate. This assumption has been shown to explain the PRE effect on cellular water [50,51,52]. Without Gd complexes, T1 relaxation components with R1 = 0.9 and 1.5 s−1 were obtained. To distinguish the two T1 relaxation components, exchange rate kex should not be greater than 2 s−1 [50,51,52,53]. This rate corresponded with a relaxographic study of a yeast suspension at 298 K, which suggested a slow water exchange rate across the membrane of 1.49 s−1 [54]. Taking account of the temperature-dependence of kex [55], the kex of the cell sample at 273 K was lower than 1.49 s−1. Under the presence of Gd complexes, R1 >> 2 s−1 ≥ kex, so that kex can be neglected particularly at high Gd concentrations. This negligence is confirmed by the observation of two T1 relaxation components differing by a factor of 10 in the R1 as shown in Figure 2c,d. The Gd complex concentrations were computed from the PRE effect obtained by subtracting R1 measured in the absence of Gd complexes from R1 in the presence of Gd complexes. Therefore, kex was suppressed in the calculation of the concentrations.
3.4. Cell Membrane Permeability to Gd Complexes
The stable and non-stable Gd complexes such as Gd-DOTA and aqua Gd3+ complexes are respectively known to penetrate into eukaryotic cells in a similar level [20,21,22]. Our study also showed the permeability of cell membranes of E. coli to those Gd complexes. The concentrations of Gd-DOTA and aqua Gd3+ were about 4 and 1 mM, respectively, in the cells irrespective of the concentrations in the extracellular space. The ratio of the extracellular to intracellular gadolinium complex concentrations increased with the extracellular concentration. Therefore, we can clearly distinguish between the extracellular and intracellular water resonances from the T1 relaxation time.
4. Materials and Methods
4.1. Data Analysis for the Longitudinal 1H Relaxation Rate R1 at High Magnetic Fields
We focus on effects of gadolinium paramagnetic agents on the longitudinal relaxation time T1 of water protons. In an aqueous solution containing a paramagnetic agent under high magnetic fields, the dipole–dipole interactions between unpaired electron and proton spins mainly causes the T1 relaxation [56,57]. The relaxation time T1m due to the dipolar coupling with the unpaired electron spin depends on the total correlation time and the proton–electron distance r as expressed by the Solomon–Bloembergen–Morgan equation [58,59,60]:
where γi and ωi are, respectively, the gyromagnetic ratio and Larmor frequency for electron i = e and proton i = H. S is the spin quantum number of the paramagnetic ion; τr and T1e are rotational correlation time and electron spin relaxation time of the paramagnetic complex, respectively; and τm is the water residency time during which a water molecule resides in the coordination sphere of the complex. The relaxivity R1p, the T1 relaxation rate of the sample enhanced by 1 unit in the concentration of the paramagnetic agent, can be calculated as a function of T1m and τm [58,59,60,61]:
where q is the number of water molecules in the inner coordination sphere of the complex. This relaxivity can also be expressed with the concentration of the paramagnetic ion as
where and are the relaxation rates of the samples with and without the paramagnetic agent, respectively.
Under magnetic fields higher than 3 T, the effect of T1e on the T1 relaxation rate of the water proton is known to be neglected [62,63]. At 298 K, T1e calculated from parameters reported [45,64,65] is approximately 1.35 × 10⁻⁷ and 2.01 × 10⁻⁶ s for aqua Gd3+ and Gd-DOTA complexes respectively. The time constant for the rotational diffusion is much shorter than that for the exchange between the inner sphere and the outer sphere of gadolinium complexes as (, ) = (2.9 × 10⁻¹¹ s, 1.2 × 10⁻⁹ s) and (9.0 × 10⁻¹¹ s, 2.0 × 10⁻⁷ s) at 298 K for aqua Gd3+ and Gd-DOTA complexes, respectively [65,66]. Because << << T1e, Equation (2) is expressed as 1/ ≈ 1/ by neglecting and T1e. The relaxivity of this solution in Equation (3) can be approximated by replacing T1m + with T1m.
4.2. Aqua Gd3+ and Gd-DOTA Solutions
The solutions with aqua Gd3+ and Gd-DOTA complexes were prepared by dissolving GdCl3·6H2O (Wako Pure Chemical Ind., Osaka, Japan) and Gd-DOTA (BOC Sci., Shirley, NY, USA) in Milli-Q water (Merckmillipore, Darmstadt, Hessen, Germany), respectively.
4.3. E. coli Samples
BL21 StarTM (DE3) E. coli cells were grown in 120 mL of 20 g/l LB medium containing 50 μg/mL ampicilin at 37 °C until OD600 = 0.7–0.8. The culture was harvested by centrifuging at 2000 g for 20 min at 4 °C. The suspension was then washed with 0.14 M NaCl solution and centrifuged at 3300 g for 15 min at 4 °C. The suspension was washed again with 0.14 M NaCl solution and centrifuged at 3300 g for 5 min at 4 °C. The suspension was afterward mixed with 99.0% (mass/mass) glycerol (Wako Pure Chemical Ind., Osaka, Japan) so that the glycerol concentration was 20% w/w before adding aqua Gd3+ and Gd-DOTA solutions. Escherichia coli cells uniformly labeled with 13C used for 13C-NMR experiments were prepared similarly, but the LB medium was replaced with M9 medium containing [U-13C] glucose, 14NH4Cl, nucleosides and 50 μg/mL ampicilin. Solutions with 10 μL of aqua Gd3+ at 0, 12, 25, 100, 149, 200, 250 mM and those of Gd-DOTA at 15, 25, 100, 150, 200, 250 mM were added to 40 μL of glycerol-E. coli mixtures 20 min before NMR experiments.
4.4. Relaxation Measurement of the 1H Longitudinal Magnetization
A 20 μL glycerol-E.coli sample containing Gd was transferred into a glass tube (NORELL, Morganton, NC, USA) cut to fit in a magic-angle spinning (MAS) solid-state NMR probe for a 4.0 mm rotor. This tube was capped with Parafilm. The T1 relaxation of proton magnetization was measured with a saturation pulse train followed by an excitation pulse at 273 K on an ECAII NMR spectrometer (JEOL Ltd., Akishima, Tokyo, Japan) equipped with a Balun probe (Varian, Palo Alto, LA, USA) at the 1H resonance frequency of 700 MHz. The RF amplitude for the pulses was 50 kHz, and the relaxation delay was 7s. The measurement was finished within 40 min after mixing the cell sample with a Gd solution. The samples were kept at 277 K in a refrigerator for the measurement of R1, i.e., 1/T1, as a function of the elapsed time after the sample preparation.
The buildup curves of the integral area of signal intensity were fitted to the double exponential relaxation equation for T1 as
where the subscripts ‘ex’ and ‘in’ stand for extracellular and intracellular parts, respectively.
4.5. Solid-State 13C-NMR Experiments
Three samples different in composition were prepared by mixing 80 μL of 13C-labeled E.coli-glycerol solutions with 20 μL of 140 mM NaCl, 149 mM aqua Gd3+ or 150 mM Gd-DOTA solutions. The samples were transferred into a 4.0 mm MAS rotor and frozen rapidly in liquid nitrogen. The 13C-NMR signals at the resonance frequency 125 MHz were acquired under 1H decoupling via a single 13C 90˚ pulse or a 1H 90˚ pulse followed by a cross polarization (CP) period with a contact time of 2 ms. These experiments were performed on the NMR spectrometer equipped with a T3 triple-resonance probe at 218 K and the relaxation delay of 7 s under MAS at the frequency of 12 kHz.
4.6. Viability of E. coli Cells
Samples with 80 μL of living E. coli-glycerol were mixed with 20 μL of 150 mM Gd-DOTA or 149 mM aqua Gd3+ solutions. The samples were kept at 0 °C in an ice bath before serial dilution. After incubation, the E. coli samples were diluted in 140 mM NaCl solution. The diluted E. coli samples were then cultured on an LB agar plate at 37 °C. The number of colonies were counted. A 40 μL sample of living E. coli-glycerol was also mixed with 10 μL of 150 mM NaCl solution as a control. This sample was diluted rapidly after mixing and cultured on an LB plate. The number of colonies on an LB plate of the sample containing Gd was normalized by the number of colonies of the control E. coli sample.
5. Conclusions
Gadolinium complexes enhanced the longitudinal relaxation rate R1 of extracellular water protons, selectively owing to the low permeability of cell membranes to the agents and the low water exchange rate across the membranes. The R1 of the extracellular part was more than ten times faster than the intracellular R1, which allowed discrimination between extra- and intracellular parts. The 1H-NMR relaxation for T1 provided the concentrations of gadolinium complexes in the inside and outside of E. coli cells, which revealed the cell membrane permeability to Gd complexes. The PRE effect in solid-state 13C-NMR indicated that aqua Gd3+ bound to lipid membranes strongly but Gd-DOTA did not. This binding with a dissociation constant of 1 mM should be the cause for the cytotoxicity of aqua Gd3+ stronger than that of Gd-DOTA. The results of the molecular interaction studies confirmed that Gd-DOTA was more suitable than aqua Gd3+ as an R1 contrast agent for cellular localization study by NMR spectroscopy. It had lower cytotoxicity even at higher concentrations around 30 mM which enhanced R1 for the extracellular space selectively, and it exhibited a strong PRE effect through the exchange of ligand water with bulk water by staying in the solution phase for a period longer than four days.
Supplementary Materials
Supplementary materials can be found at https://0-www-mdpi-com.brum.beds.ac.uk/1422-0067/21/11/4042/s1. Supplementary Material S1. Amount of glycerol and water in E. coli samples; Supplementary Material S2. T1 of water proton in absence of paramagnetic agent; Supplementary Material S3. T1 of water proton in cell samples; Supplementary Material S4. Relaxation buildup curves fitted with multi-exponential functions; Supplementary Material S5. Validation of parameters for estimating the relaxivity; Supplementary Material S6. Relaxivity of Gd solutions in E. coli cell samples. References [67,68,69,70,71,72,73,74] are cited in the supplementary materials.
Author Contributions
Conceptualization, N.S. and T.F.; methodology, N.S. and A.E.; software, N.S.; validation, N.S., A.E. and T.F.; formal analysis, N.S.; investigation, N.S. and A.E.; resources, N.S.; data curation, N.S. and A.E.; writing—original draft preparation, N.S.; writing—review and editing, T.F.; visualization, N.S.; supervision, T.F.; project administration, T.F.; funding acquisition, T.F. All authors have read and agreed to the published version of the manuscript.
Funding
This work was partly supported by JSPS KAKENHI Grant 26291029.
Conflicts of Interest
The authors declare no conflict of interest.
Abbreviations
| Gd-DOTA | Gadolinium-1,4,7,10-tetraazacyclododecane-1,4,7,10-tetraacete complex |
| NMR | Nuclear Magnetic Resonance |
| MRI | Magnetic Resonance Imaging |
| R1 | Longitudinal relaxation rate |
| T1 | Longitudinal relaxation time |
| R1p | Longitudinal relaxivity |
| PRE | Paramagnetic Relaxation Enhancement |
| CPMAS | Cross Polarization Magic-Angle Spinning |
| CFU | Colony-forming unit |
References
- Bertini, I.; Luchinat, C.; Parigi, G.; Ravera, E. NMR of Paramagnetic Molecules, Applications to Metallobiomolecules and Models, 2nd ed.; Elsevier: Amsterdam, The Netherlands, 2017; pp. 277–312. [Google Scholar]
- Pell, A.J.; Pintacuda, G.; Grey, C.P. Paramagnetic NMR in solution and the solid state. Prog. Nucl. Magn. Reson. Spectrosc. 2018, 111, 1–271. [Google Scholar] [CrossRef]
- Koehler, J.; Meiler, J. Expanding the utility of NMR restraints with paramagnetic compounds: Background and practical aspects. Prog. Nucl. Magn. Reson. Spectrosc. 2011, 59, 360–389. [Google Scholar] [CrossRef] [PubMed] [Green Version]
- Guan, J.-Y.; Keizers, P.H.; Liu, W.-M.; Lohr, F.; Skinner, S.; Heeneman, E.A.; Schwalbe, H.; Ubbink, M.; Siegal, G. Small-molecule binding sites on proteins established by paramagnetic NMR spectroscopy. J. Am. Chem. Soc. 2013, 135, 5859–5868. [Google Scholar] [CrossRef]
- Maltsev, S.; Hudson, S.M.; Sahu, I.D.; Liu, L.; Lorigan, G.A. Solid-state NMR 31P paramagnetic relaxation enhancement membrane protein immersion depth measurements. J. Phys. Chem. B 2014, 118, 4370–4377. [Google Scholar] [CrossRef]
- Su, Y.; Mani, R.; Hong, M. Asymmetric insertion of membrane proteins in lipid bilayers by solid-state NMR paramagnetic relaxation enhancement: A cell-penetrating peptide example. J. Am. Chem. Soc. 2008, 130, 8856–8864. [Google Scholar] [CrossRef] [Green Version]
- Respondek, M.; Madl, T.; Göbl, C.; Golser, R.; Zangger, K. Mapping the orientation of helices in micelle-bound peptides by paramagnetic relaxation waves. J. Am. Chem. Soc. 2007, 129, 5228–5234. [Google Scholar] [CrossRef] [PubMed]
- Luchinat, C.; Parigi, G.; Ravera, E.; Rinaldelli, M. Solid-state NMR crystallography through paramagnetic restraints. J. Am. Chem. Soc. 2012, 134, 5006–5009. [Google Scholar] [CrossRef] [PubMed]
- Rotz, M.W.; Culver, K.S.B.; Parigi, G.; MacRenaris, K.W.; Luchinat, C.; Odom, T.W.; Meade, T.J. High relaxivity Gd(III)–DNA gold nanostars: Investigation of shape effects on proton relaxation. ACS Nano 2015, 9, 3385–3396. [Google Scholar] [CrossRef] [PubMed] [Green Version]
- Gianolio, E.; Porto, S.; Napolitano, R.; Baroni, S.; Giovenzana, G.B.; Aime, S. Relaxometric investigations and MRI evaluation of a liposome-loaded pH-responsive Gadolinium(III) complex. Inorg. Chem. 2012, 51, 7210–7217. [Google Scholar] [CrossRef]
- Morrow, J.R.; Tóth, É. Next-generation magnetic resonance imaging contrast agents. Inorg. Chem. 2017, 56, 6029–6034. [Google Scholar] [CrossRef] [Green Version]
- Boros, E.; Gale, E.M.; Caravan, P. MR imaging probes: Design and applications. Dalton Trans. 2015, 44, 4804–4818. [Google Scholar] [CrossRef] [PubMed]
- De Leon-Rodriguez, L.M.; Martins, A.F.; Pinho, M.; Rofsky, N.M.; Sherry, A.D. Basic MR relaxation mechanisms and contrast agent design. J. Magn. Reson. Imaging 2015, 42, 545–565. [Google Scholar] [CrossRef] [PubMed] [Green Version]
- Sherry, A.D.; Caravan, P.; Lenkinski, R. Primer on gadolinium chemistry. J. Magn. Reson. Imaging 2009, 30, 1240–1248. [Google Scholar] [CrossRef] [PubMed] [Green Version]
- Hanana, H.; Turcotte, P.; André, C.; Gagnon, C.; Gagné, F. Comparative study of the effects of gadolinium chloride and gadolinium—Based magnetic resonance imaging contrast agent on freshwater mussel, Dreissena polymorpha. Chemosphere 2017, 181, 197–207. [Google Scholar] [CrossRef]
- Ariyani, W.; Khairinisa, M.A.; Perrotta, G.; Manto, M.; Koibuchi, N. The effects of gadolinium-based contrast agents on the cerebellum: From basic research to neurological practice and from pregnancy to adulthood. Cerebellum 2017, 17, 247–251. [Google Scholar] [CrossRef] [Green Version]
- Dai, L.; Jones, C.M.; Chan, W.T.K.; Pham, T.A.; Ling, X.; Gale, E.M.; Rotile, N.J.; Tai, W.C.-S.; Anderson, C.J.; Caravan, P.; et al. Chiral DOTA chelators as an improved platform for biomedical imaging and therapy applications. Nat. Commun. 2018, 9, 857. [Google Scholar] [CrossRef] [Green Version]
- Granata, V.; Cascella, M.; Fusco, R.; Dell’Aprovitola, N.; Catalano, O.; Filice, S.; Schiavone, V.; Izzo, F.; Cuomo, A.; Petrillo, A. Immediate adverse reactions to gadolinium-based MR contrast media: A retrospective analysis on 10,608 examinations. Biomed. Res. Int. 2016, 2016, 1–6. [Google Scholar] [CrossRef]
- Ramalho, J.; Semelka, R.C.; Ramalho, M.; Nunes, R.H.; Alobaidy, M.; Castillo, M. Gadolinium-based contrast agent accumulation and toxicity: An update. Am. J. Neuroradiol. 2015, 37, 1192–1198. [Google Scholar] [CrossRef] [Green Version]
- Cabella, C.; Crich, S.G.; Corpillo, D.; Barge, A.; Ghirelli, C.; Bruno, E.; Lorusso, V.; Uggeri, F.; Aime, S. Cellular labeling with Gd(III) chelates: Only high thermodynamic stabilities prevent the cells acting as ‘sponges’ of Gd3+ ions. Contrast Media Mol. Imaging 2006, 1, 23–29. [Google Scholar] [CrossRef] [Green Version]
- Crich, S.G.; Biancone, L.; Cantaluppi, V.; Duò, D.; Esposito, G.; Russo, S.; Camussi, G.; Aime, S. Improved route for the visualization of stem cells labeled with a Gd-/Eu-chelate as dual (MRI and fluorescence) agent. Magn. Reson. Med. 2004, 51, 938–944. [Google Scholar] [CrossRef]
- Modo, M.; Mellodew, K.; Cash, D.; Fraser, S.E.; Meade, T.J.; Price, J.R.; Williams, S.C. Mapping transplanted stem cell migration after a stroke: A serial, in vivo magnetic resonance imaging study. NeuroImage 2004, 21, 311–317. [Google Scholar] [CrossRef] [PubMed]
- Vuu, K.; Xie, J.; McDonald, M.A.; Bernardo, M.; Hunter, F.; Zhang, Y.; Li, K.; Bednarski, M.; Guccione, S. Gadolinium-rhodamine nanoparticles for cell labeling and tracking via magnetic resonance and optical imaging. Bioconjugate Chem. 2005, 16, 995–999. [Google Scholar] [CrossRef] [PubMed]
- Luchinat, E.; Banci, L. In-cell NMR in human cells: Direct protein expression allows structural studies of protein folding and maturation. Acc. Chem. Res. 2018, 51, 1550–1557. [Google Scholar] [CrossRef]
- Sakakibara, D.; Sasaki, A.; Ikeya, T.; Hamatsu, J.; Hanashima, T.; Mishima, M.; Yoshimasu, M.; Hayashi, N.; Mikawa, T.; Wälchli, M.; et al. Protein structure determination in living cells by in-cell NMR spectroscopy. Nature 2009, 458, 102–105. [Google Scholar] [CrossRef]
- Rahman, S.; Byun, Y.; Hassan, I.; Kim, J.; Kumar, V. Towards understanding cellular structure biology: In-cell NMR. Biochim. Biophys. Acta 2017, 1865, 547–557. [Google Scholar] [CrossRef]
- Lippens, G.; Cahoreau, E.; Millard, P.; Charlier, C.; Lopez, J.M.; Hanoulle, X.; Portais, J.-C. In-cell NMR: From metabolites to macromolecules. Analyst 2018, 143, 620–629. [Google Scholar] [CrossRef] [PubMed]
- Luchinat, E.; Banci, L. In-cell NMR: A topical review. IUCrJ 2017, 4, 108–118. [Google Scholar] [CrossRef] [PubMed] [Green Version]
- Liebau, J.; Mäler, L. Immersion depths of lipid carbons in bicelles measured by paramagnetic relaxation enhancement. J. Phys. Chem. B 2017, 121, 7660–7670. [Google Scholar] [CrossRef]
- Wang, S.; Gopinath, T.; Veglia, G. Application of paramagnetic relaxation enhancements to accelerate the acquisition of 2D and 3D solid-state NMR spectra of orientedmembrane proteins. Methods 2018, 138–139, 54–61. [Google Scholar] [CrossRef]
- Phillips, R.; Kondev, J.; Theriot, J.; Garcia, H.G.; Orme, N. Physical Biology of the Cell, 2nd ed.; Garland Science: New York, NY, USA, 2012; pp. 3–85. [Google Scholar]
- Sundararaj, S.; Guo, A.; Habibi-Nazhad, B.; Rouani, M.; Stothard, P.; Ellison, M.; Wishart, D.S. The CyberCell Database (CCDB): A comprehensive, self-updating, relational database to coordinate and facilitate in silico modeling of Escherichia coli. Nucleic Acids Res. 2004, 32, D293–D295. [Google Scholar] [CrossRef] [Green Version]
- Persson, E.; Halle, B. Cell water dynamics on multiple time scales. Proc. Natl. Acad. Sci. USA 2008, 105, 6266–6271. [Google Scholar] [CrossRef] [PubMed] [Green Version]
- Qvist, J.; Persson, E.; Mattea, C.; Halle, B. Time scales of water dynamics at biological interfaces: Peptides, proteins and cells. Faraday Discuss. 2009, 141, 131–144. [Google Scholar] [CrossRef] [PubMed]
- Renault, M.A.M.; Pawsey, S.; Bos, M.P.; Koers, E.; Nand, D.; Boxtel, R.T.; Rosay, M.; Tommassen, J.; Maas, W.E.; Baldus, M.; et al. Solid-state NMR spectroscopy on cellular preparations enhanced by dynamic nuclear polarization. Angew. Chem. Int. Ed. 2012, 51, 2998–3001. [Google Scholar] [CrossRef] [PubMed]
- van Dalen, A.; de Kruijff, B. The role of lipids in membrane insertion and translocation of bacterial proteins. Biochim. Biophys. Acta 2004, 1694, 97–109. [Google Scholar] [CrossRef] [PubMed]
- Silhavy, T.J.; Kahne, D.; Walker, S. The bacterial cell envelope. Cold Spring Harb. Perspect. Biol. 2010, 2. [Google Scholar] [CrossRef] [PubMed]
- Blumberg, W.E. Nuclear spin-lattice relaxation caused by paramagnetic impurities. Phys. Rev. 1960, 119, 79–84. [Google Scholar] [CrossRef]
- Nadaud, P.S.; Helmus, J.J.; Kall, S.L.; Jaroniec, C.P. Paramagnetic ions enable tuning of nuclear relaxation rates and provide long-range structural restraints in solid-state NMR of proteins. J. Am. Chem. Soc. 2009, 131, 8108–8120. [Google Scholar] [CrossRef] [PubMed]
- Sanders, C. Solid state 13C NMR of unlabeled phosphatidylcholine bilayers: Spectral assignments and measurement of carbon-phosphorus dipolar couplings and 13C chemical shift anisotropies. Biophys. J. 1993, 64, 171–181. [Google Scholar] [CrossRef] [Green Version]
- Laage, S.; Tao, Y.; McDermott, A.E. Cardiolipin interaction with subunit c of ATP synthase: Solid-state NMR characterization. Biochim. Biophys. Acta 2014, 1848, 260–265. [Google Scholar] [CrossRef] [PubMed] [Green Version]
- Boettcher, J.M.; Davis-Harrison, R.L.; Clay, M.C.; Nieuwkoop, A.J.; Ohkubo, Y.Z.; Tajkhorshid, E.; Morrissey, J.H.; Rienstra, C.M. Atomic view of calcium-induced clustering of phosphatidylserine in mixed lipid bilayers. Biochemistry 2011, 50, 2264–2273. [Google Scholar] [CrossRef] [PubMed] [Green Version]
- Bryant, J.E.; LeComte, J.T.J.; Lee, A.L.; Young, G.B.; Pielak, G.J. Protein dynamics in living cells. Biochemistry 2005, 44, 9275–9279. [Google Scholar] [CrossRef] [PubMed]
- Jucker, B.A.; Harms, H.; Zehnder, A.J. Adhesion of the positively charged bacterium Stenotrophomonas (Xanthomonas) maltophilia 70401 to glass and Teflon. J. Bacteriol. 1996, 178, 5472–5479. [Google Scholar] [CrossRef] [PubMed] [Green Version]
- Otto, K.; Elwing, H.; Hermansson, M. Effect of ionic strength on initial interactions of Escherichia coli with surfaces, studied on-line by a novel quartz crystal microbalance technique. J. Bacteriol. 1999, 181, 5210–5218. [Google Scholar] [CrossRef] [PubMed] [Green Version]
- Nagle, J.F.; Nagle, J.F. Lipid bilayer structure. Curr. Opin. Struct. Biol. 2000, 10, 474–480. [Google Scholar] [CrossRef] [Green Version]
- Sahoo, B.R.; Maruyama, K.; Edula, J.R.; Tougan, T.; Lin, Y.; Lee, Y.-H.; Horii, T.; Fujiwara, T. Mechanistic and structural basis of bioengineered bovine Cathelicidin-5 with optimized therapeutic activity. Sci. Rep. 2017, 7, 44781. [Google Scholar] [CrossRef] [Green Version]
- Fuma, S.; Takeda, H.; Miyamoto, K.; Yanagisawa, K.; Inoue, Y.; Ishii, N.; Sugai, K.; Ishii, C.; Kawabata, Z. Ecological evaluation of gadolinium toxicity compared with other heavy metals using an aquatic microcosm. Bull. Environ. Contam. Toxicol. 2001, 66, 231–238. [Google Scholar] [CrossRef]
- Ishiguchi, T.; Takahashi, S. Safety of gadoterate meglumine (Gd-DOTA) as a contrast agent for magnetic resonance imaging: Results of a post-marketing surveillance study in Japan. Drugs R D 2010, 10, 133–145. [Google Scholar] [CrossRef] [PubMed]
- Hazlewood, C.F.; Chang, D.C.; Nichols, B.L.; Woessner, N.E. Nuclear magnetic resonance transverse relaxation times of water protons in skeletal muscle. Biophys. J. 1974, 14, 583–606. [Google Scholar] [CrossRef] [Green Version]
- Donahue, K.M.; Weisskoff, R.M.; Chesler, D.A.; Kwong, K.K.; Bogdanov, A.A.; Mandeville, J.B.; Rosen, B.R. Improving MR quantification of regional blood volume with intravascularT1 contrast agents: Accuracy, precision, and water exchange. Magn. Reson. Med. 1996, 36, 858–867. [Google Scholar] [CrossRef] [PubMed]
- Fick, A. On liquid diffusion. J. Membr. Sci. 1995, 100, 33–38. [Google Scholar] [CrossRef]
- Donahue, K.M.; Weisskoff, R.M.; Burstein, D. Water diffusion and exchange as they influence contrast enhancement. J. Magn. Reson. Imaging 1997, 7, 102–110. [Google Scholar] [CrossRef] [PubMed]
- Labadie, C.; Lee, J.; Vetek, G.; Springer, C. Relaxographic Imaging. J. Magn. Reson. Ser. B 1994, 105, 99–112. [Google Scholar] [CrossRef] [PubMed]
- Aslund, I.; Nowacka, I.A.; Nilsson, M.; Topgaard, D.; Hürlimann, M.D.; Song, Y.Q.; Fantazzini, P.; Bortolotti, V. Molecular exchange between intra- and extracellular compartments in a cell suspension. AIP Conf. Proc. 2008, 1081, 79–82. [Google Scholar]
- Iwahara, J.; Schwieters, C.D.; Clore, G.M. Ensemble approach for NMR structure refinement against1H paramagnetic relaxation enhancement data arising from a flexible paramagnetic group attached to a macromolecule. J. Am. Chem. Soc. 2004, 126, 5879–5896. [Google Scholar] [CrossRef] [PubMed]
- Iwahara, J.; Tang, C.; Clore, G.M. Practical aspects of 1H transverse paramagnetic relaxation enhancement measurements on macromolecules. J. Magn. Reson. 2006, 184, 185–195. [Google Scholar] [CrossRef] [PubMed] [Green Version]
- Yazyev, O.V.; Helm, L.; Malkin, V.G.; Malkina, O.L. Quantum chemical investigation of hyperfine coupling constants on first coordination sphere water molecule of Gadolinium(III) aqua complexes. J. Phys. Chem. A 2005, 109, 10997–11005. [Google Scholar] [CrossRef] [PubMed]
- Luz, Z.; Meiboom, S. Proton relaxation in dilute solutions of Cobalt(II) and Nickel(II) ions in methanol and the rate of methanol exchange of the solvation sphere. J. Chem. Phys. 1964, 40, 2686. [Google Scholar] [CrossRef]
- Swift, T.J.; Connick, R.E. NMR-relaxation mechanisms of O 17 in aqueous solutions of paramagnetic cations and the lifetime of water molecules in the first coordination sphere. J. Chem. Phys. 1962, 37, 307–320. [Google Scholar] [CrossRef] [Green Version]
- Caravan, P. Strategies for increasing the sensitivity of gadolinium based MRI contrast agents. Chem. Soc. Rev. 2006, 35, 512–523. [Google Scholar] [CrossRef]
- Benmelouka, M.; Borel, A.; Moriggi, L.; Helm, L.; Merbach, A.E. Design of Gd(III)-based magnetic resonance imaging contrast agents: Static and transient zero-field splitting contributions to the electronic relaxation and their impact on relaxivity. J. Phys. Chem. B 2007, 111, 832–840. [Google Scholar] [CrossRef]
- Banci, L.; Bertini, I.; Luchinat, C. 1H NMRD studies of solutions of paramagnetic metal ions in ethyleneglycol. Inorg. Chim. Acta 1985, 100, 173–181. [Google Scholar] [CrossRef]
- Taupitz, M.; Stolzenburg, N.; Ebert, M.; Schnorr, J.; Hauptmann, R.; Kratz, H.; Hamm, B.; Wagner, S. Gadolinium-containing magnetic resonance contrast media: Investigation on the possible transchelation of Gd3+to the glycosaminoglycan heparin. Contrast Media Mol. Imaging 2012, 8, 108–116. [Google Scholar] [CrossRef] [PubMed]
- Micskei, K.; Powell, D.H.; Helm, L.; Brücher, E.; Merbach, A.E. Water exchange on [Gd(H2O)8]3+ and [Gd(PDTA)(H2O)] in aqueous solution: A variable-pressure, -temperature and -magnetic field17O NMR study. Magn. Reson. Chem. 1993, 31, 1011–1020. [Google Scholar] [CrossRef]
- Powell, D.; González, G.; Tissières, V.; Micskei, K.; Brücher, E.; Helm, L.; Merbach, A. Gd3+ chelates of interest in magnetic resonance imaging (MRI): Studies using 17O NMR and EPR at several magnetic fields. J. Alloy. Compd. 1994, 207, 20–24. [Google Scholar] [CrossRef]
- Hindman, J.C. Relaxation processes in water. A study of the proton spin-lattice relaxation time. J. Chem. Phys. 1973, 59, 1517. [Google Scholar] [CrossRef]
- Morokuma, K. Molecular orbital studies of hydrogen bonds: Dimeric H2O with the slater minimal basis set. J. Chem. Phys. 1970, 52, 1301. [Google Scholar] [CrossRef]
- Fogel’Son, R.L.; Likhachev, E.R. Temperature dependence of viscosity. Tech. Phys. 2001, 46, 1056–1059. [Google Scholar] [CrossRef]
- Baldwin, W.W.; Myer, R.; Powell, N.; Anderson, E.; Koch, A.L. Buoyant density of Escherichia coli is determined solely by the osmolarity of the culture medium. Arch. Microbiol. 1995, 164, 155–157. [Google Scholar] [CrossRef]
- Doerrler, W.T. Density gradient enrichment of escherichia coli conditional msbA mutants. Appl. Environ. Microbiol. 2007, 73, 7992–7996. [Google Scholar] [CrossRef] [Green Version]
- Vishnevskaya, G.P.; Frolova, E.N.; Gataullin, A.M.; Gumerov, F.M.; Fakhrutdinov, A.R. Structural transformations and phase transitions in aqueous solutions of gadolinium nitrate in the course of freezing. Phys. Solid State 2003, 45, 1322–1326. [Google Scholar] [CrossRef]
- Koenig, S.H.; Epstein, M. Ambiguities in the interpretation of proton magnetic relaxation data in water solutions of Gd3+ ions. J. Chem. Phys. 1975, 63, 2279. [Google Scholar] [CrossRef]
- Tei, L.; Baranyai, Z.; Gaino, L.; Forgács, A.; Vágner, A.; Botta, M. Thermodynamic stability, kinetic inertness and relaxometric properties of monoamide derivatives of lanthanide(iii) DOTA complexes. Dalton Trans. 2015, 44, 5467–5478. [Google Scholar] [CrossRef] [PubMed] [Green Version]
Figure 1.
1H-NMR spectra of E. coli sample mixed with (a–e) aqua Gd3+ and (f–j) Gd-DOTA (gadolinium-1,4,7,10-tetraazacyclododecane-1,4,7,10-tetraacete complex) obtained by a single pulse Fourier transformation method at a 1H resonance frequency of 700 MHz and temperature of 273 K. Samples of 10 μL of (a) 0, (b) 12, (c) 25, (d) 149 and (e) 250 mM aqua Gd3+ solutions and 10 μL of (f) 0, (g) 15, (h) 25, (i) 150, and (j) 250 mM Gd-DOTA solutions were added to 40 μL of glycerol-E. coli. A constant receiver gain and a constant scaling factor for the Y-axis were used.

Figure 2.
(a,b) Relaxation curves of the proton polarization for T1, (c,d) T1 relaxation rate and cellular Gd complex concentration estimated from the relaxivities of Gd complex. The samples were 40 μL of E. coli-glycerol mixtures to which (a,c) 10 μL of aqua Gd3+ or (b,d) Gd-DOTA solutions were added. The left vertical axes on panels c and d are scaled by the relaxivities of Gd complexes for the extracellular water only. Thus, the intracellular T1 relaxation rate is 73% of the values on these axes. The τ for the horizontal axis (a,b) gives the delay after the saturation pulse. Error bars were obtained from the deviation of experimental values from the best fit double exponential functions.

Figure 3.
Amount of mass of Gd3+ ion in the sample calculated from T1 relaxation rate relative to the known amount of aqua Gd3+ (open square) and Gd-DOTA (closed square) added to the sample. The horizontal axis is the concentration of 10 μL Gd complex solutions added to the cell mixture. Error bars in Figure 3 were derived from those in Figure 2.

Figure 4.
Solid-state 13C-NMR spectra obtained by CPMAS (cross polarization magic-angle spinning, right column) and single 90˚ pulse (left column) experiments for E. coli samples containing (a,d) NaCl, (b,e) aqua Gd3+ and (c,f) Gd-DOTA solutions. Carbonyl peak height and resonances for methyl carbon (16.8 ppm) and methylene carbon (35.5 ppm) of membrane lipids are marked by lines to guide the eye.

Figure 5.
Percentages of CFU (colony-forming unit) of E. coli cells incubated in (a) 149 mM aqua Gd3+ and (b) 150 mM Gd-DOTA solutions relative to that of the sample incubated in a 150 mM NaCl solution are shown by closed squares. The error bars give the standard deviations of the results of two independent samples.

Figure 6.
Extracellular (closed square) and intracellular (open square) relaxation rates R1 plotted against the time after mixing 10 μL of (a) 250 mM aqua Gd3+ or (b) 250 mM Gd-DOTA solutions with a 40 μL glycerol- E. coli sample at 273 K.
Figure 6.
Extracellular (closed square) and intracellular (open square) relaxation rates R1 plotted against the time after mixing 10 μL of (a) 250 mM aqua Gd3+ or (b) 250 mM Gd-DOTA solutions with a 40 μL glycerol- E. coli sample at 273 K.

Figure 7.
Concentration of Gd3+ ion binding with membrane of E. coli cells, [Gd3+- membrane], and the fractional occupancy of the binding site on cell membrane Y as a function of concentration of extracellular Gd3+ ion [Gd3+] are shown by closed squares. Experimental results were fitted to the function [Gd3+- membrane] = S ([Gd3+]/Kd)/(1+([Gd3+]/Kd)) where S is the concentration of total binding site S = [free cell membrane] + [Gd3+- membrane]. The percent occupancy is calculated from [Gd3+- membrane] × 100/S.


Table 1.
Intracellular and extracellular T1 relaxation rates and amplitudes of 40 μL of glycerol-E. coli- sample to which 10 μL Gd-DOTA or aqua gadolinium solution was added.
Table 1.
Intracellular and extracellular T1 relaxation rates and amplitudes of 40 μL of glycerol-E. coli- sample to which 10 μL Gd-DOTA or aqua gadolinium solution was added.
| Agent | [Agent] | Intracellular Solution | Extracellular Solution | ||
|---|---|---|---|---|---|
| (mM) | R1 (s−1) | Amplitude (%) | R1 (s−1) | Amplitude (%) | |
| 0 | 1.5 ± 0.3 | 32 ± 25 | 0.89 ± 0.03 | 68 ± 25 | |
| 15 | 12 ± 0 | 84 ± 1 | 34 ± 1 | 16 ± 1 | |
| 25 | 16 ± 0 | 63 ± 5 | 45 ± 1 | 37 ± 5 | |
| Gd-DOTA | 100 | 16 ± 3 | 44 ± 0 | 121 ± 7 | 56 ± 0 |
| 150 | 34 ± 6 | 32 ± 4 | 182 ± 15 | 68 ± 4 | |
| 200 | 24 ± 7 | 35 ± 3 | 223 ± 30 | 65 ± 3 | |
| 250 | 26 ± 6 | 27 ± 1 | 259 ± 32 | 73 ± 1 | |
| 12 | 1.7 ± 0.2 | 75 ± 3 | 14 ± 3 | 25 ± 3 | |
| 25 | 3.6 ± 2.3 | 65 ± 10 | 36 ± 21 | 35 ± 10 | |
| [Gd(H2O)8]3+ | 100 | 10 ± 1 | 38 ± 3 | 77 ± 2 | 62 ± 3 |
| 149 | 37 ± 11 | 44 ± 16 | 170 ± 26 | 55 ± 16 | |
| 200 | 47 ± 21 | 26 ± 6 | 744 ± 124 | 74 ± 6 | |
| 250 | 25 ± 7 | 25 ± 3 | 965 ± 429 | 75 ± 3 | |
© 2020 by the authors. Licensee MDPI, Basel, Switzerland. This article is an open access article distributed under the terms and conditions of the Creative Commons Attribution (CC BY) license (http://creativecommons.org/licenses/by/4.0/).
Share and Cite
MDPI and ACS Style
Sakol, N.; Egawa, A.; Fujiwara, T. Gadolinium Complexes as Contrast Agent for Cellular NMR Spectroscopy. Int. J. Mol. Sci. 2020, 21, 4042. https://0-doi-org.brum.beds.ac.uk/10.3390/ijms21114042
AMA Style
Sakol N, Egawa A, Fujiwara T. Gadolinium Complexes as Contrast Agent for Cellular NMR Spectroscopy. International Journal of Molecular Sciences. 2020; 21(11):4042. https://0-doi-org.brum.beds.ac.uk/10.3390/ijms21114042
Chicago/Turabian StyleSakol, Nat, Ayako Egawa, and Toshimichi Fujiwara. 2020. "Gadolinium Complexes as Contrast Agent for Cellular NMR Spectroscopy" International Journal of Molecular Sciences 21, no. 11: 4042. https://0-doi-org.brum.beds.ac.uk/10.3390/ijms21114042
Note that from the first issue of 2016, this journal uses article numbers instead of page numbers. See further details here.