RAP-011 Rescues the Disease Phenotype in a Cellular Model of Congenital Dyserythropoietic Anemia Type II by Inhibiting the SMAD2-3 Pathway

 , and
, and 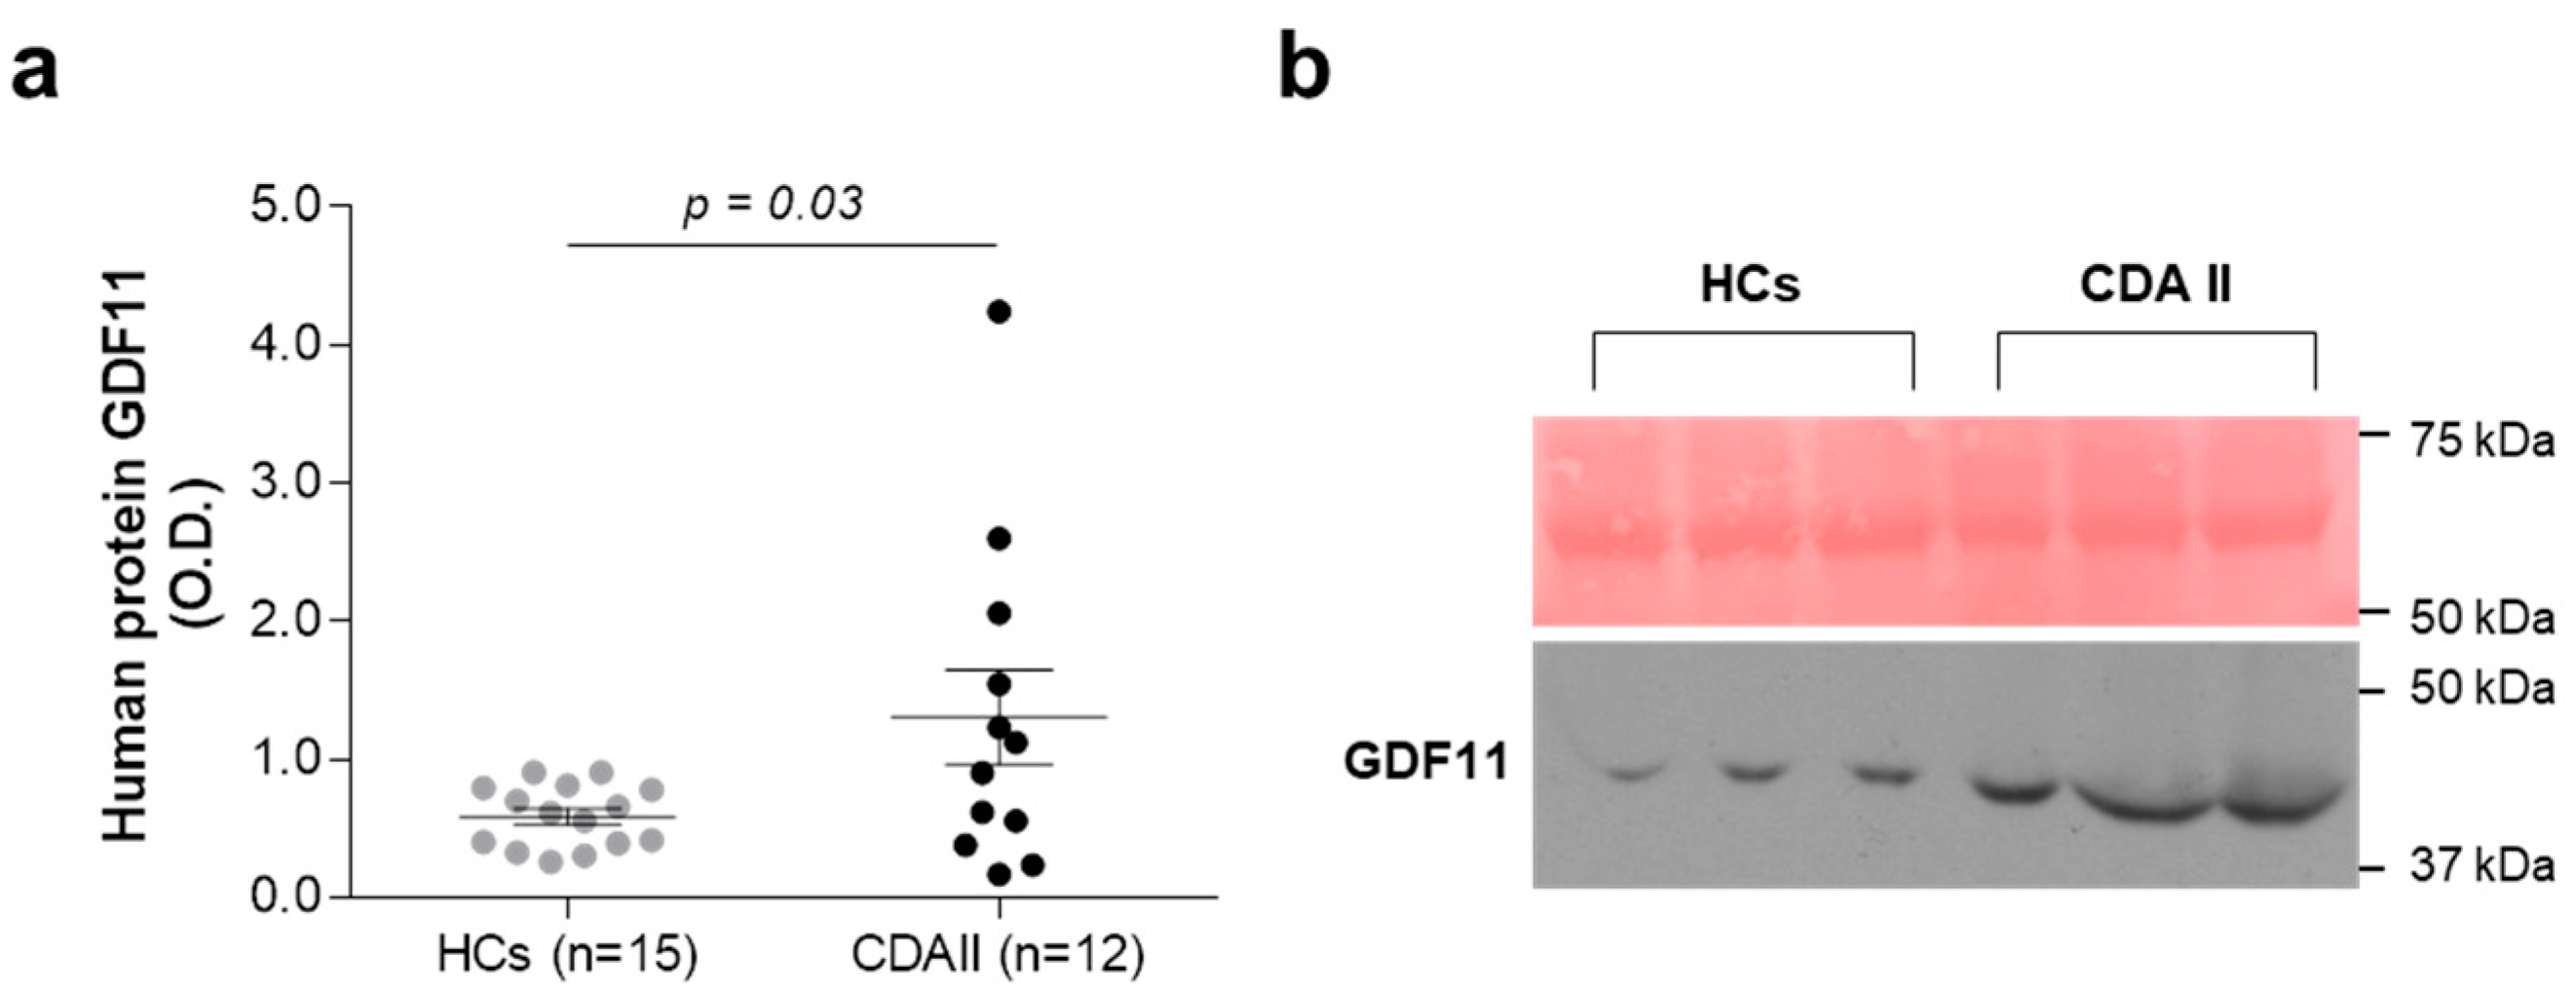
Abstract
:1. Introduction
2. Results
2.1. Ex Vivo and In Vitro Quantitative Evaluation of GDF11
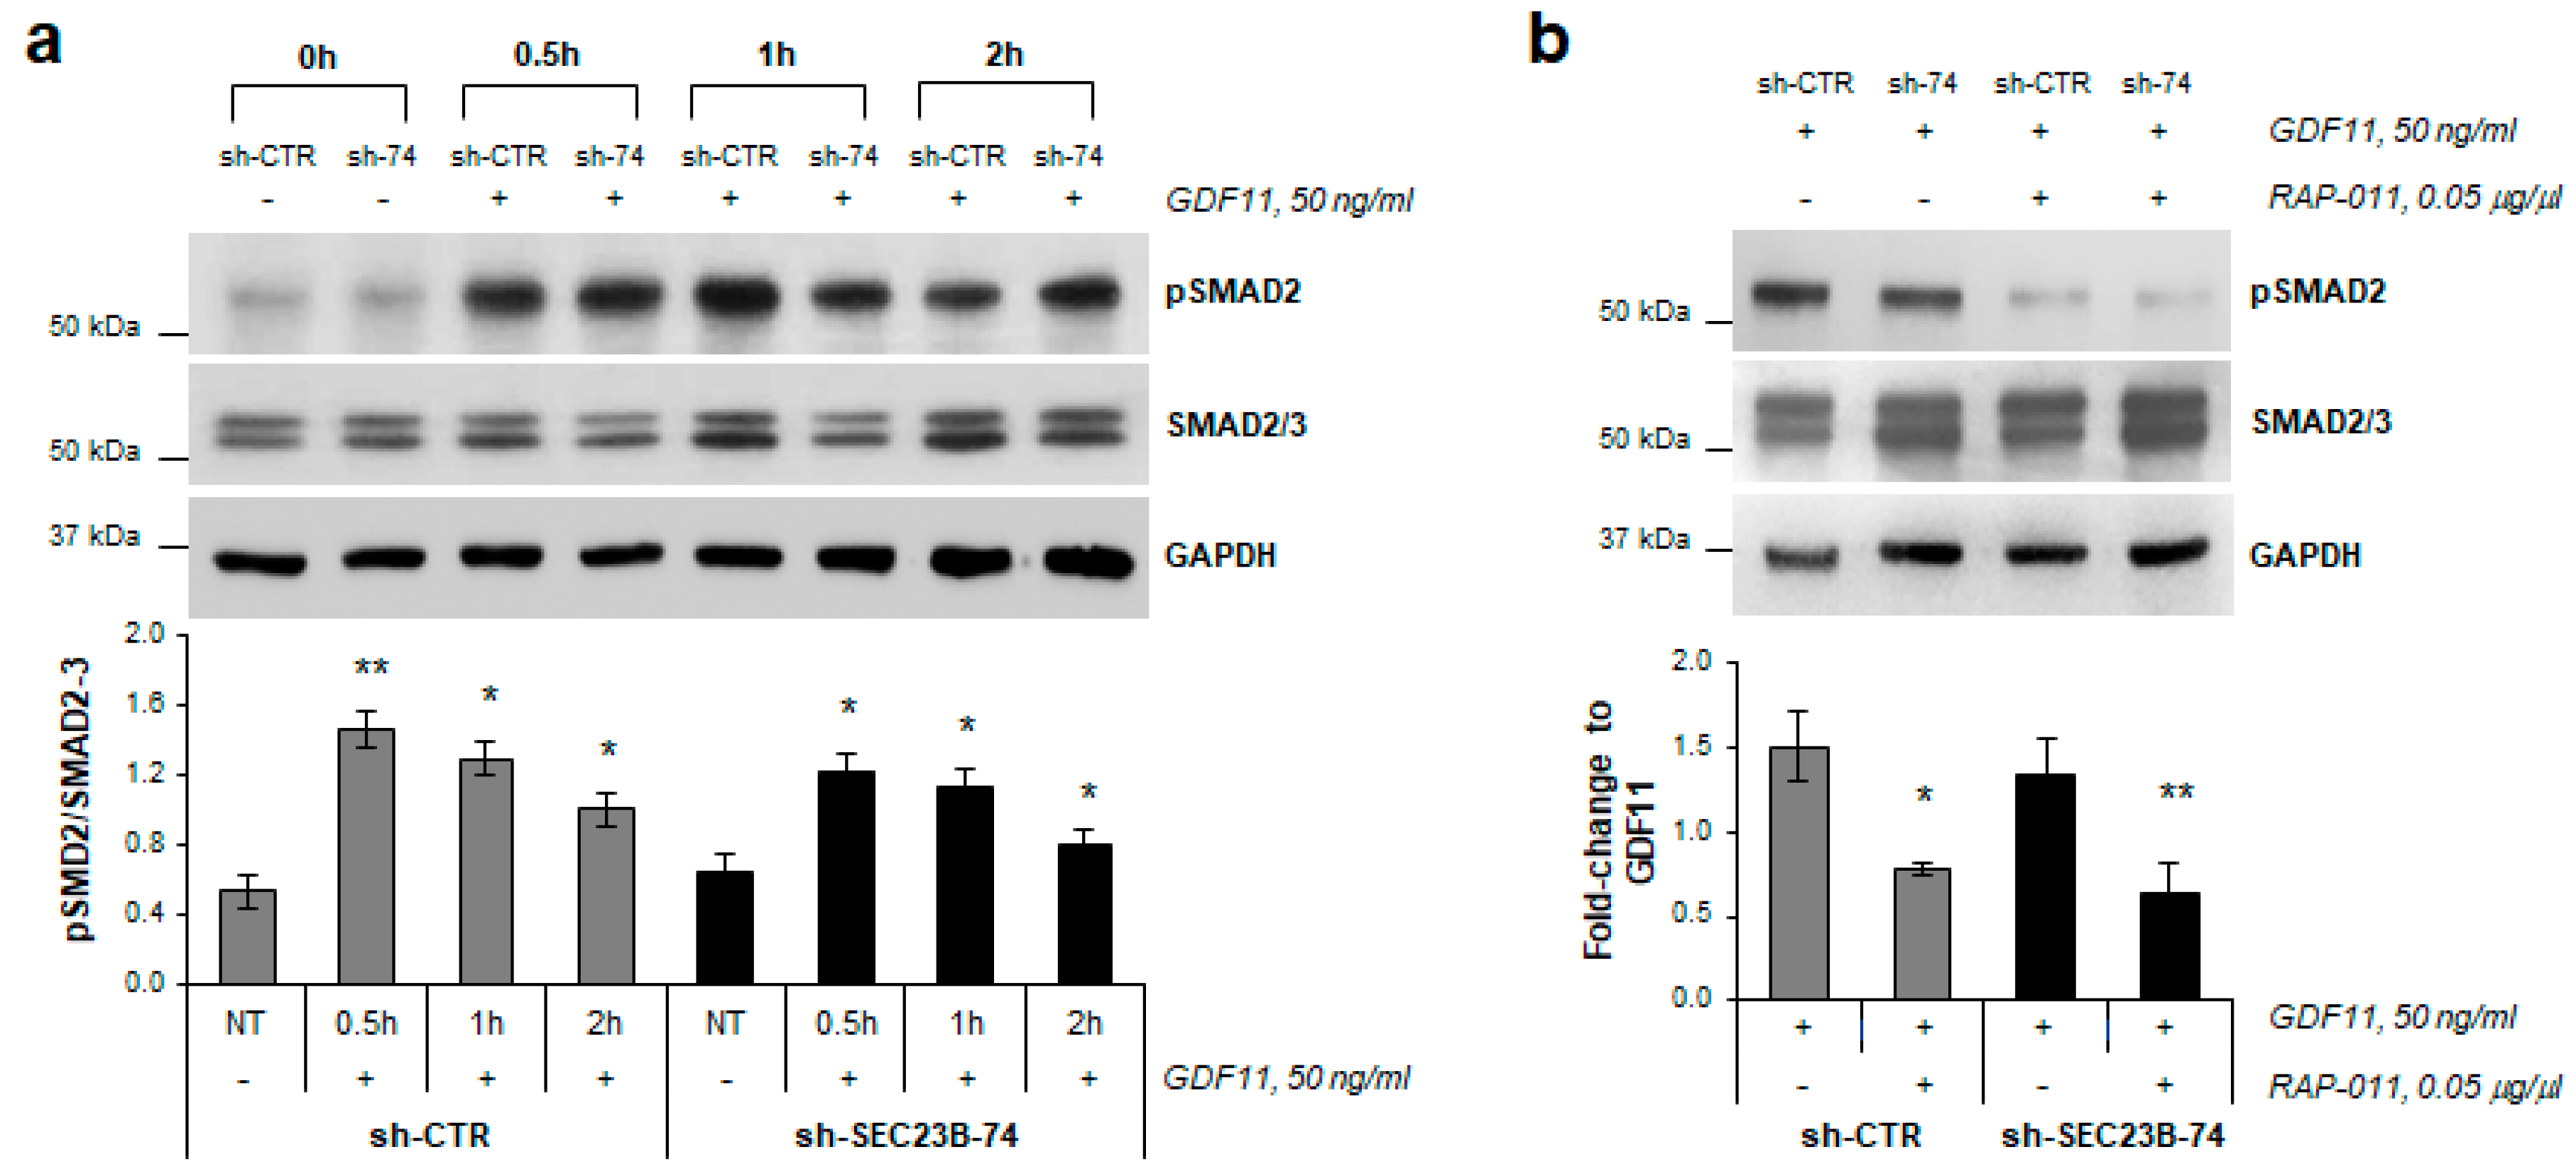
2.2. SMAD2 Protein Phosphorylation is Inhibited by RAP-011
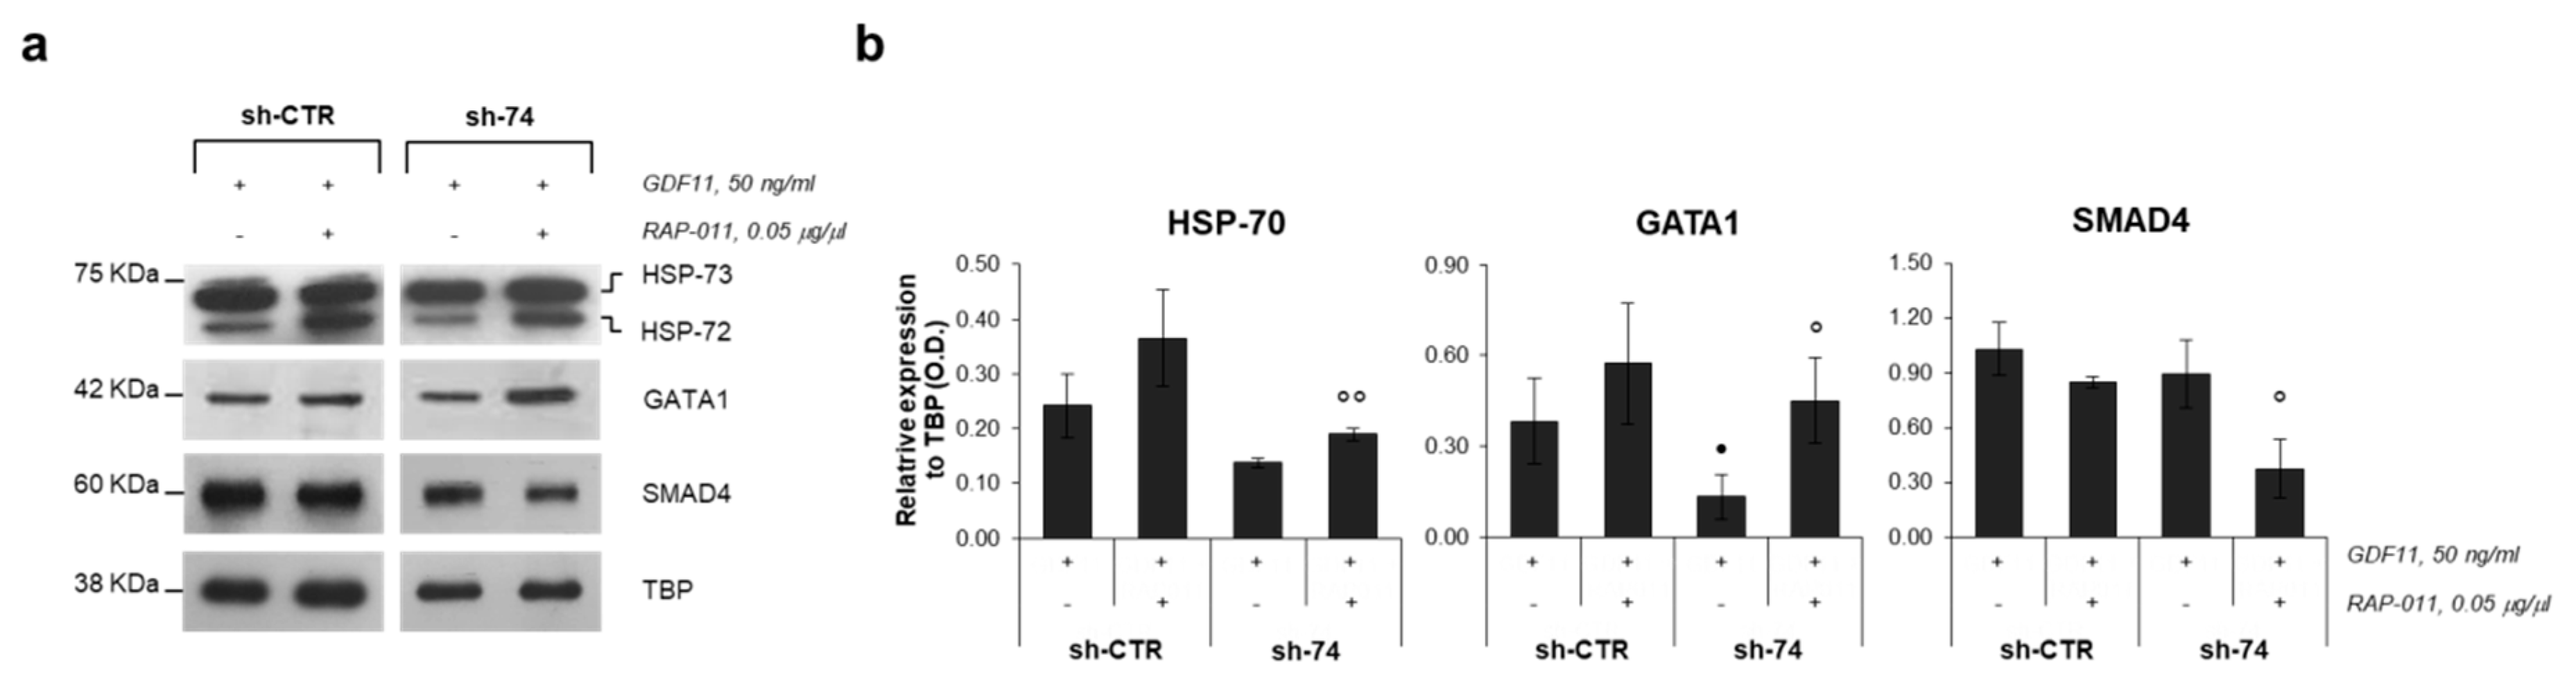
2.3. RAP-011 Treatment Induces Nuclear Translocation of the Transcription Factor GATA1
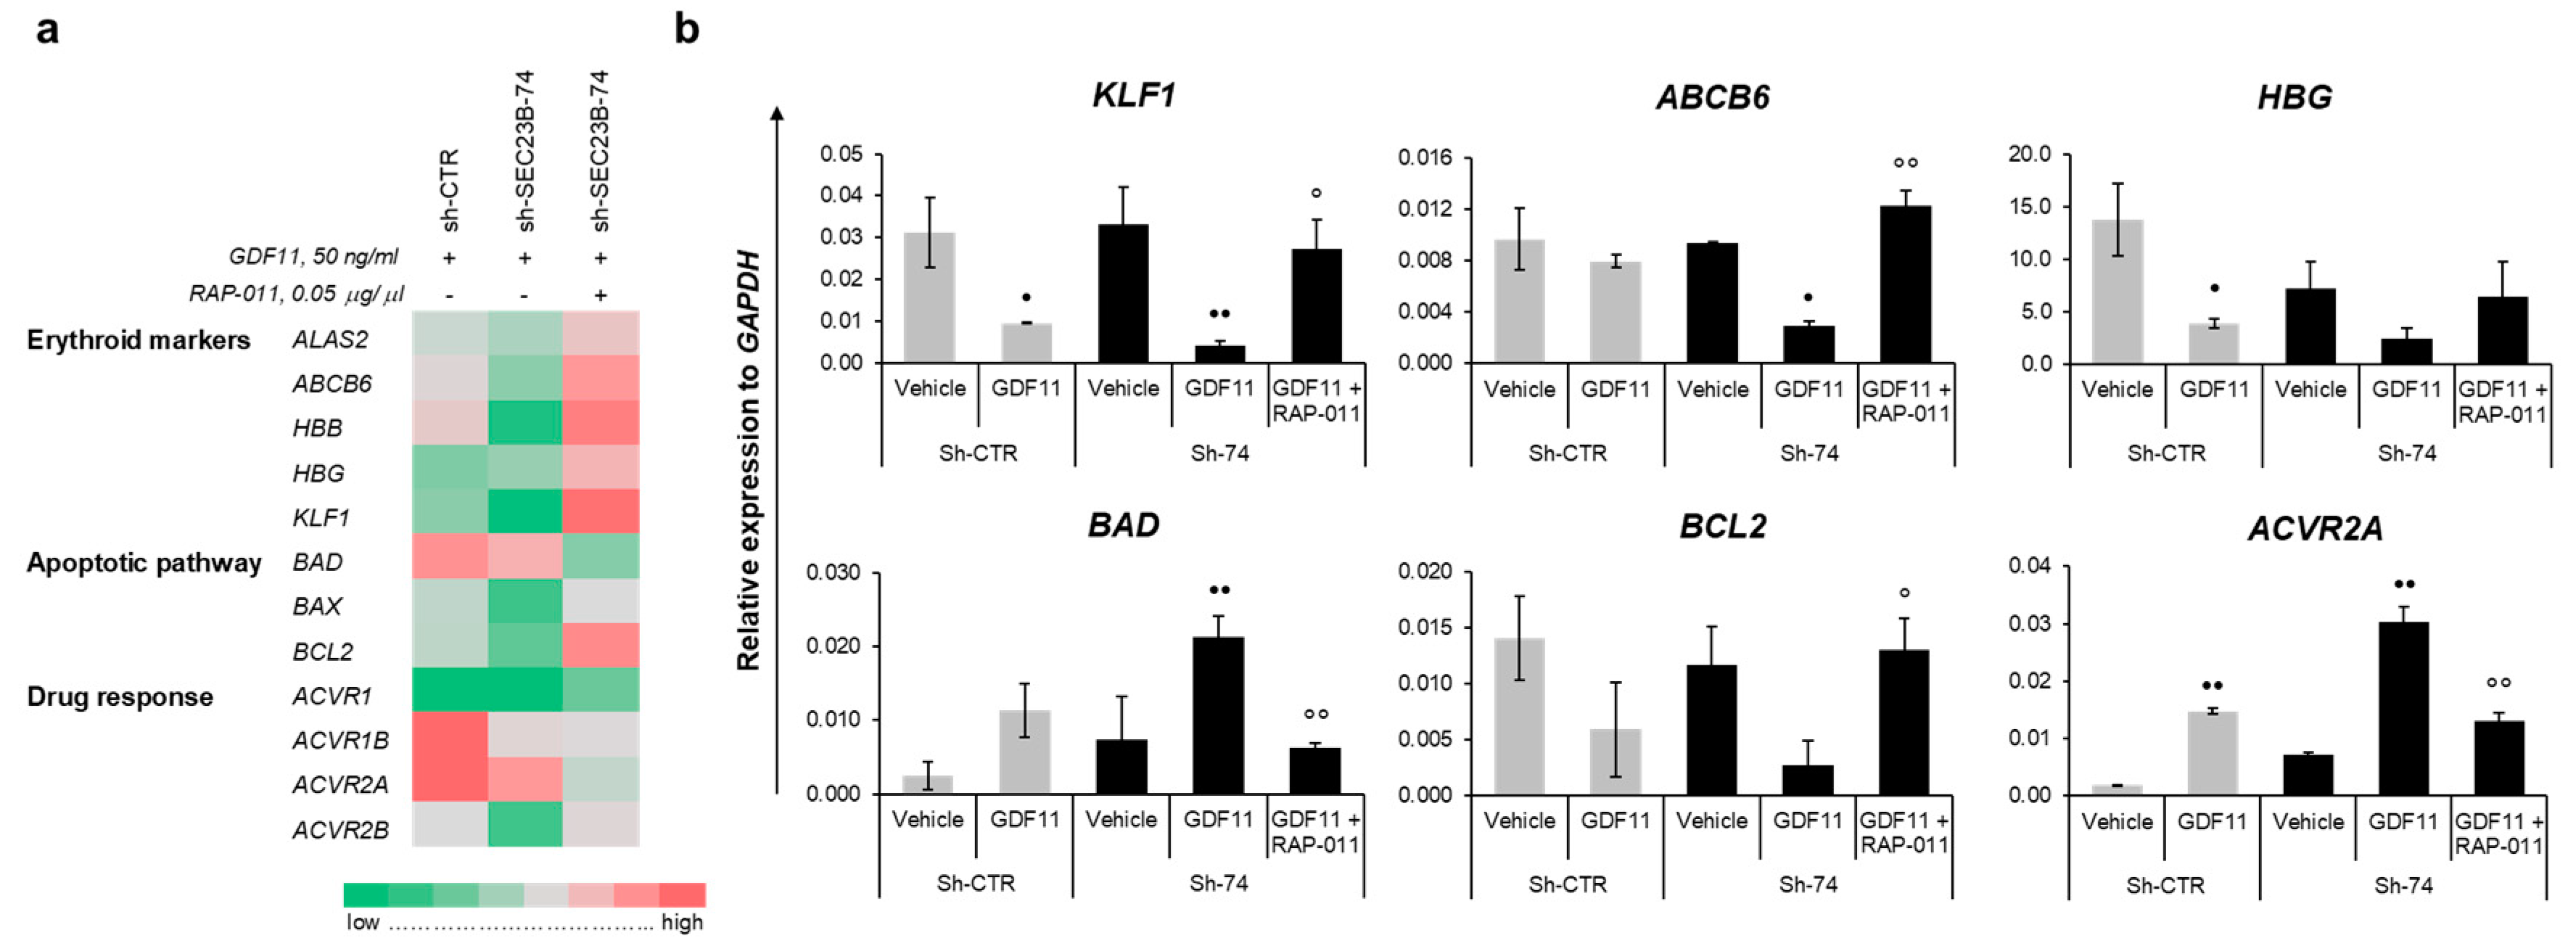
2.4. GATA1 Nuclear Translocation Promoted by RAP-011 Restores Gene Expression of Erythroid Markers
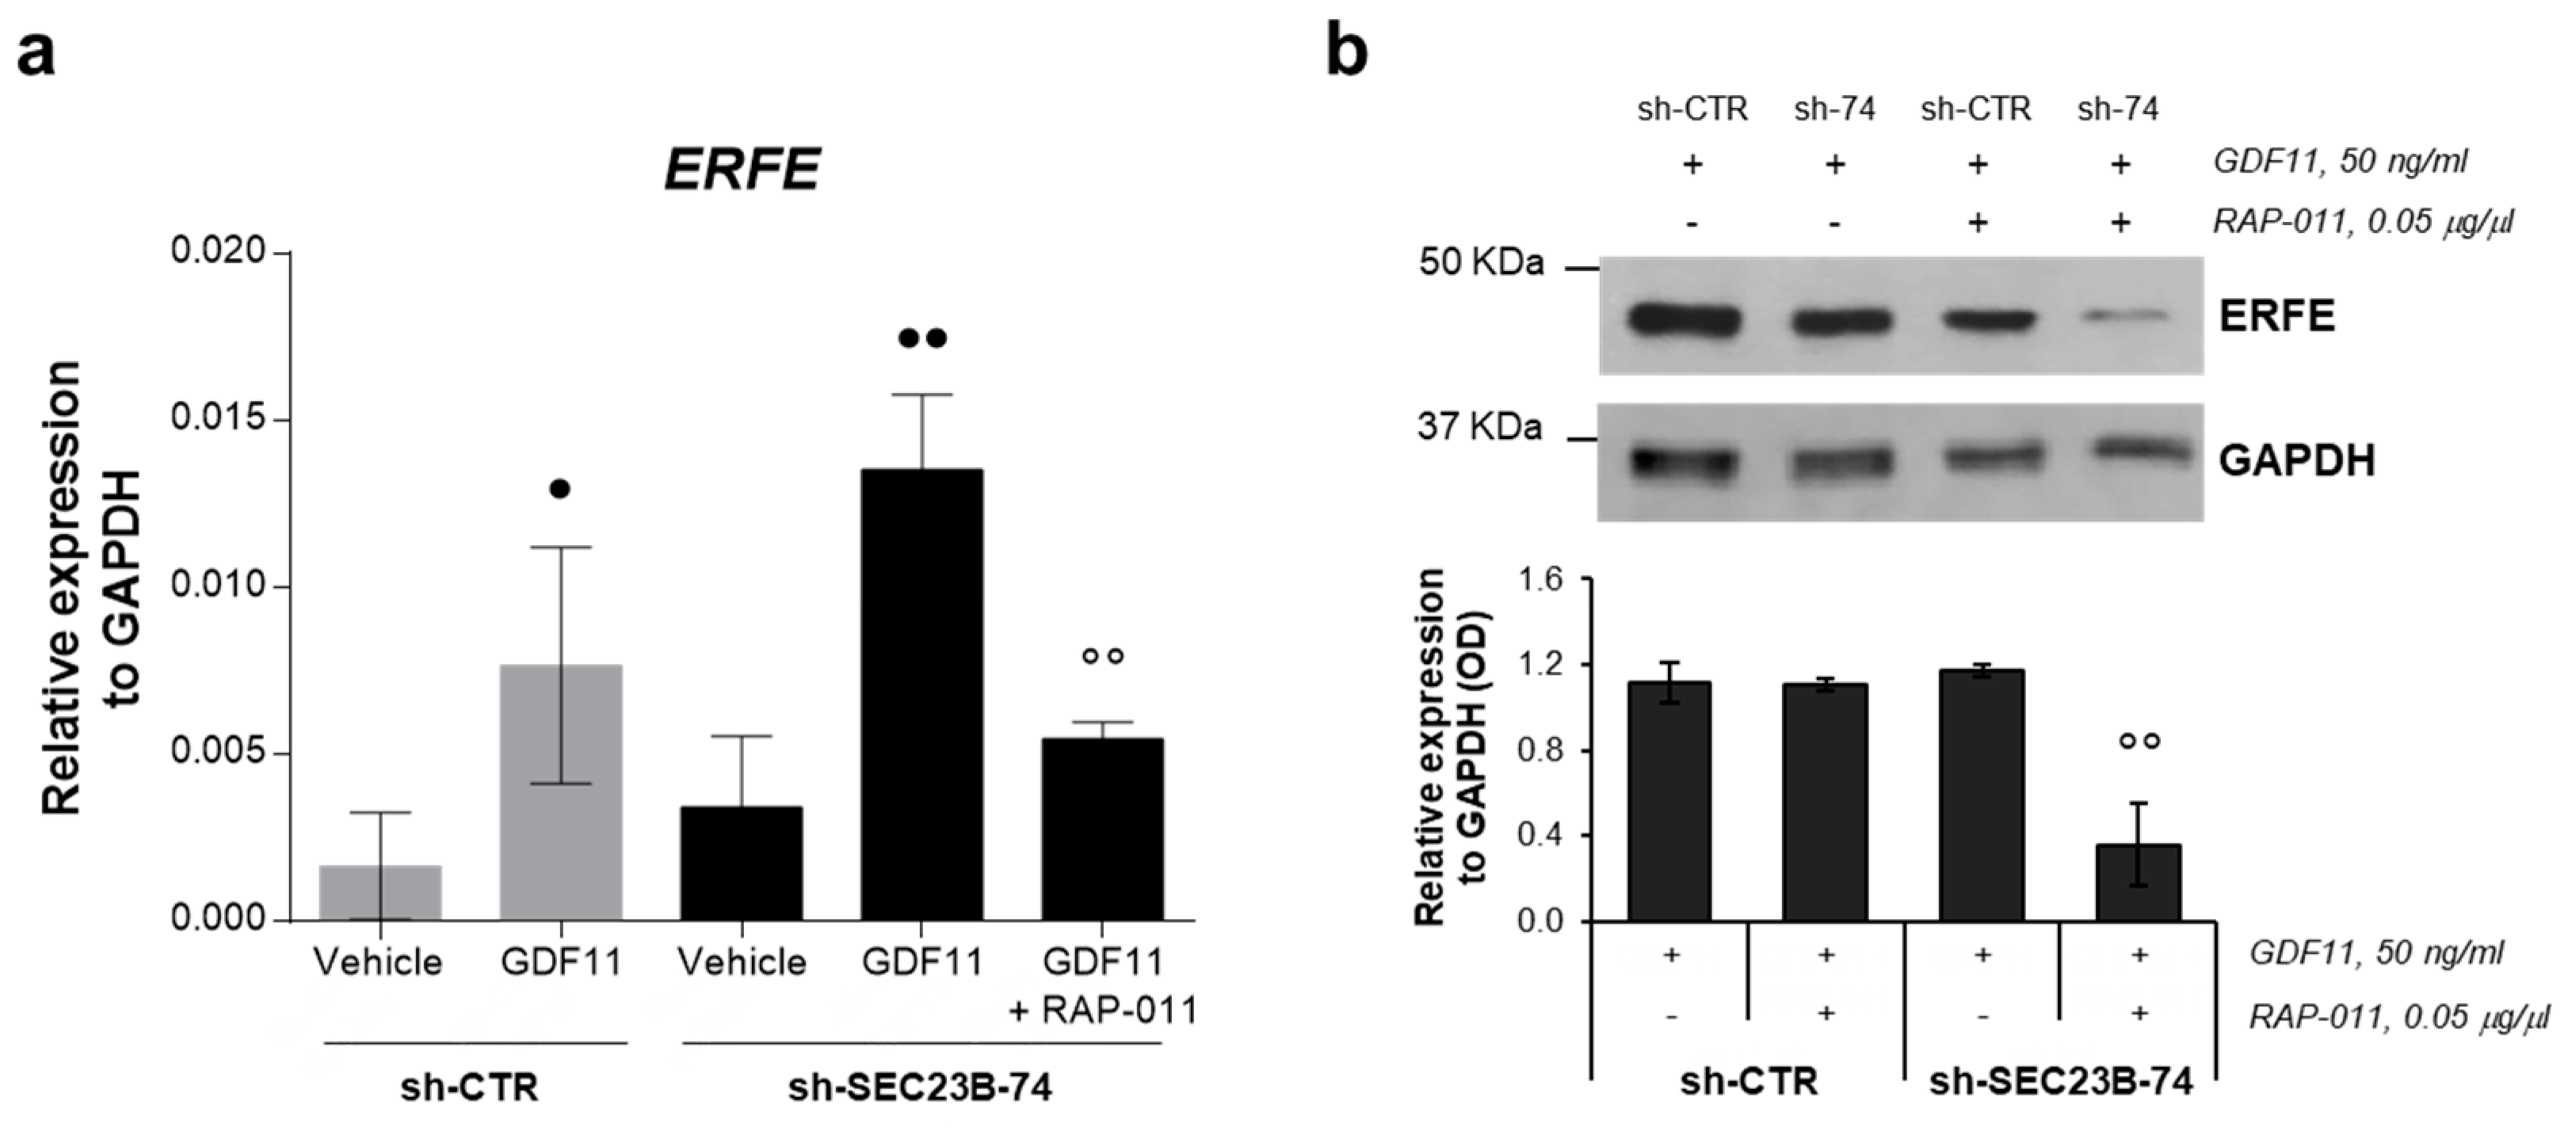
2.5. RAP-011 Treatment Impairs Erythroferrone Expression
3. Discussion
4. Materials and Methods
4.1. Patients
4.2. Production of Lentiviral Particles and Infection of the K562 Cell Line
4.3. Cell Culture and RAP-011 Treatment
4.4. Gene Expression Analysis
4.4.1. RNA Isolation and Reverse Transcription.
4.4.2. Quantitative Real-Time PCR Analysis.
4.5. Protein Expression Analysis
4.5.1. Cell Extracts
4.5.2. Secreted Proteins
4.6. Subcellular Fractionation
4.7. Statistical Analysis
Supplementary Materials
Author Contributions
Funding
Acknowledgments
Conflicts of Interest
Abbreviations
| CDA II | Congenital Dyserythropoietic Anemia type II |
| GDF11 | Growth Differentiation Factor 11 |
| CDAs | Congenital dyserythropoietic anemias |
| ERFE | Erythroferrone |
| TGF-β | Transforming Growth Factor beta |
| GDFs | Growth Differentiation Factors |
| BMPs | Bone Morphogenetic Proteins |
| ActR | Activin Receptors |
| HCs | Healthy Controls |
| CTR | Control |
| NT | Non-treated |
| Hbb | Hemoglobin subunit beta |
References
- Iolascon, A.; Andolfo , I.; Russo, R. Congenital Dyserythropoietic Anemias. Blood 2020. [Google Scholar] [CrossRef]
- Schwarz, K.; Iolascon, A.; Verissimo, F.; Trede, N.S.; Horsley, W.; Chen, W.; Paw, B.H.; Hopfner, K.-P.; Holzmann, K.; Russo, R.; et al. Mutations affecting the secretory COPII coat component SEC23B cause congenital dyserythropoietic anemia type II. Nat. Genet. 2009, 41, 936–940. [Google Scholar] [CrossRef] [PubMed]
- Russo, R.; Esposito, M.R.; Iolascon, A. Inherited hematological disorders due to defects in coat protein (COP)II complex. Am. J. Hematol. 2012, 88, 135–140. [Google Scholar] [CrossRef] [PubMed]
- Russo, R.; Gambale, A.; Langella, C.; Andolfo, I.; Unal, S.; Iolascon, A. Retrospective cohort study of 205 cases with congenital dyserythropoietic anemia type II: Definition of clinical and molecular spectrum and identification of new diagnostic scores. Am. J. Hematol. 2014, 89, E169–E175. [Google Scholar] [CrossRef] [PubMed]
- Russo, R.; Andolfo, I.; Manna, F.; De Rosa, G.; De Falco, L.; Gambale, A.; Bruno, M.; Mattè, A.; Ricchi, P.; Girelli, M.; et al. Increased levels of ERFE-encoding FAM132B in patients with congenital dyserythropoietic anemia type II. Blood 2016, 128, 1899–1902. [Google Scholar] [CrossRef] [Green Version]
- Kautz, L.; Jung, G.; Nemeth, E.; Ganz, T. Erythroferrone contributes to recovery from anemia of inflammation. Blood 2014, 124, 2569–2574. [Google Scholar] [CrossRef] [Green Version]
- Dussiot, M.; Maciel, T.; Fricot, A.; Chartier, C.; Negre, O.; Veiga, J.; Grapton, D.; Paubelle, E.; Payen, E.; Beuzard, Y.; et al. An activin receptor IIA ligand trap corrects ineffective erythropoiesis in beta-thalassemia. Nat. Med. 2014, 20, 398–407. [Google Scholar] [CrossRef]
- Guerra, A.; Oikonomidou, P.R.; Sinha, S.; Zhang, J.; Presti, V.L.; Hamilton, C.R.; Breda, L.; Casu, C.; La, P.; Martins, A.C.; et al. Lack of Gdf11 does not improve anemia or prevent the activity of RAP-536 in a mouse model of beta-thalassemia. Blood 2019, 134, 568–572. [Google Scholar] [CrossRef]
- Unal, S.; Russo, R.; Gümrük, F.; Kuşkonmaz, B.; Çetin, M.; Sayli, T.; Tavil, B.; Langella, C.; Iolascon, A.; Uckan-Cetinkaya, D. Successful hematopoietic stem cell transplantation in a patient with congenital dyserythropoietic anemia type II. Pediatr. Transplant. 2014, 18, E130–E133. [Google Scholar] [CrossRef]
- Uygun, V.; Russo, R.; Karasu, G.; Daloğlu, H.; Iolascon, A.; Yeşilipek, A. Hematopoietic Stem Cell Transplantation in Congenital Dyserythropetic Anemia Type II. J. Pediatr. Hematol. Oncol. 2020, 42, e507–e510. [Google Scholar] [CrossRef]
- Ruckle, J.; Jacobs, M.; Kramer, W.; E Pearsall, A.; Kumar, R.; Underwood, K.W.; Seehra, J.; Yang, Y.; Condon, C.H.; Sherman, M.L. Single-Dose, Randomized, Double-Blind, Placebo-Controlled Study of ACE-011 (ActRIIA-IgG1) in Postmenopausal Women. J. Bone Miner. Res. 2009, 24, 744–752. [Google Scholar] [CrossRef] [PubMed]
- Suragani, R.N.; Cadena, S.M.; Cawley, S.M.; Sako, D.; Mitchell, D.; Li, R.; Davies, M.V.; Alexander, M.J.; Devine, M.; Loveday, K.S.; et al. Transforming growth factor-beta superfamily ligand trap ACE-536 corrects anemia by promoting late-stage erythropoiesis. Nat. Med. 2014, 20, 408–414. [Google Scholar] [CrossRef] [PubMed]
- E Ear, J.; Huang, H.; Wilson, T.; Tehrani, Z.; Lindgren, A.; Sung, V.; Laadem, A.; Daniel, T.O.; Chopra, R.; Lin, S. RAP-011 improves erythropoiesis in zebrafish model of Diamond-Blackfan anemia through antagonizing lefty1. Blood 2015, 126, 880–890. [Google Scholar] [CrossRef] [PubMed] [Green Version]
- Iancu-Rubin, C.; Mosoyan, G.; Wang, J.; Kraus, T.; Sung, V.; Hoffman, R. Stromal cell-mediated inhibition of erythropoiesis can be attenuated by Sotatercept (ACE-011), an activin receptor type II ligand trap. Exp. Hematol. 2013, 41, 155–166.e17. [Google Scholar] [CrossRef] [PubMed]
- Langdon, J.M.; Barkataki, S.; Berger, A.E.; Cheadle, C.; Xue, Q.-L.; Sung, V.; Roy, C.N. RAP-011, an activin receptor ligand trap, increases hemoglobin concentration in hepcidin transgenic mice. Am. J. Hematol. 2014, 90, 8–14. [Google Scholar] [CrossRef] [Green Version]
- Raje, N.; Vallet, S. Sotatercept, a soluble activin receptor type 2A IgG-Fc fusion protein for the treatment of anemia and bone loss. Curr. Opin. Mol. Ther. 2010, 12, 586–597. [Google Scholar]
- Ulirsch, J.C.; Lacy, J.N.; An, X.; Mohandas, N.; Mikkelsen, T.S.; Sankaran, V.G. Altered Chromatin Occupancy of Master Regulators Underlies Evolutionary Divergence in the Transcriptional Landscape of Erythroid Differentiation. PLoS Genet. 2014, 10, e1004890. [Google Scholar] [CrossRef] [Green Version]
- Cappellini, M.D.; Porter, J.; Origa, R.; Forni, G.L.; Voskaridou, E.; Galactéros, F.; Taher, A.T.; Arlet, J.B.; Ribeil, J.-A.; Garbowski, M.; et al. Sotatercept, a novel transforming growth factor beta ligand trap, improves anemia in beta-thalassemia: A phase II, open-label, dose-finding study. Haematologica 2019, 104, 477–484. [Google Scholar] [CrossRef]
- Khoriaty, R.; Vasievich, M.P.; Jones, M.; Everett, L.; Chase, J.; Tao, J.; Siemieniak, D.; Zhang, B.; Maillard, I.; Ginsburg, D. Absence of a Red Blood Cell Phenotype in Mice with Hematopoietic Deficiency of SEC23B. Mol. Cell. Biol. 2014, 34, 3721–3734. [Google Scholar] [CrossRef] [Green Version]
- Arlet, J.B.; Ribeil, J.-A.; Guillem, F.; Negre, O.; Hazoume, A.; Marcion, G.; Beuzard, Y.; Dussiot, M.; Moura, I.C.; Demarest, S.; et al. HSP70 sequestration by free alpha-globin promotes ineffective erythropoiesis in beta-thalassaemia. Nature 2014, 514, 242–246. [Google Scholar] [CrossRef]
- Lucarelli, P.; Schilling, M.; Kreutz, C.; Vlasov, A.; Boehm, M.E.; Iwamoto, N.; Steiert, B.; Lattermann, S.; Wäsch, M.; Stepath, M.; et al. Resolving the Combinatorial Complexity of Smad Protein Complex Formation and Its Link to Gene Expression. Cell Syst. 2018, 6, 75–89.e11. [Google Scholar] [CrossRef] [PubMed] [Green Version]
- Russo, R.; Esposito, M.R.; Asci, R.; Gambale, A.; Perrotta, S.; Ramenghi, U.; Forni, G.L.; Uygun, V.; Delaunay, J.; Iolascon, A. Mutational spectrum in congenital dyserythropoietic anemia type II: Identification of 19 novel variants in SEC23B gene. Am. J. Hematol. 2010, 85, 915–920. [Google Scholar] [CrossRef] [PubMed] [Green Version]
- Russo, R.; Gambale, A.; Esposito, M.R.; Serra, M.L.; Troiano, A.; De Maggio, I.; Capasso, M.; Luzzatto, L.; Delaunay, J.; Tamary, H.; et al. Two founder mutations in the SEC23B gene account for the relatively high frequency of CDA II in the Italian population. Am. J. Hematol. 2011, 86, 727–732. [Google Scholar] [CrossRef] [PubMed] [Green Version]
- Russo, R.; Marra, R.; Andolfo, I.; De Rosa, G.; Rosato, B.E.; Manna, F.; Gambale, A.; Raia, M.; Unal, S.; Barella, S.; et al. Characterization of Two Cases of Congenital Dyserythropoietic Anemia Type I Shed Light on the Uncharacterized C15orf41 Protein. Front. Physiol. 2019, 10, 621. [Google Scholar] [CrossRef] [PubMed] [Green Version]
- Russo, R.; Langella, C.; Esposito, M.R.; Gambale, A.; Vitiello, F.; Vallefuoco, F.; Ek, T.; Yang, E.; Iolascon, A. Hypomorphic mutations of SEC23B gene account for mild phenotypes of congenital dyserythropoietic anemia type II. Blood Cells Mol. Dis. 2013, 51, 17–21. [Google Scholar] [CrossRef] [Green Version]
- Russo, R.; Andolfo, I.; Gambale, A.; De Rosa, G.; Manna, F.; Arillo, A.; Wandroo, F.; Bisconte, M.G.; Iolascon, A. GATA1 erythroid-specific regulation of SEC23B expression and its implication in the pathogenesis of congenital dyserythropoietic anemia type II. Haematologica 2017, 102, e371–e374. [Google Scholar] [CrossRef] [Green Version]
- Schreiber, E.; Harshman, K.; Kemler, I.; Malipiero, U.; Schaffner, W.; Fontana, A. Astrocytes and glioblastoma cells express novel octamer-DNA binding proteins distinct from the ubiquitous Oct-1 and B cell type Oct-2 proteins. Nucleic Acids Res. 1990, 18, 5495–5503. [Google Scholar] [CrossRef] [Green Version]


© 2020 by the authors. Licensee MDPI, Basel, Switzerland. This article is an open access article distributed under the terms and conditions of the Creative Commons Attribution (CC BY) license (http://creativecommons.org/licenses/by/4.0/).
Share and Cite
De Rosa, G.; Andolfo, I.; Marra, R.; Manna, F.; Rosato, B.E.; Iolascon, A.; Russo, R. RAP-011 Rescues the Disease Phenotype in a Cellular Model of Congenital Dyserythropoietic Anemia Type II by Inhibiting the SMAD2-3 Pathway. Int. J. Mol. Sci. 2020, 21, 5577. https://0-doi-org.brum.beds.ac.uk/10.3390/ijms21155577
De Rosa G, Andolfo I, Marra R, Manna F, Rosato BE, Iolascon A, Russo R. RAP-011 Rescues the Disease Phenotype in a Cellular Model of Congenital Dyserythropoietic Anemia Type II by Inhibiting the SMAD2-3 Pathway. International Journal of Molecular Sciences. 2020; 21(15):5577. https://0-doi-org.brum.beds.ac.uk/10.3390/ijms21155577
Chicago/Turabian StyleDe Rosa, Gianluca, Immacolata Andolfo, Roberta Marra, Francesco Manna, Barbara Eleni Rosato, Achille Iolascon, and Roberta Russo. 2020. "RAP-011 Rescues the Disease Phenotype in a Cellular Model of Congenital Dyserythropoietic Anemia Type II by Inhibiting the SMAD2-3 Pathway" International Journal of Molecular Sciences 21, no. 15: 5577. https://0-doi-org.brum.beds.ac.uk/10.3390/ijms21155577