1. Introduction
Papillary thyroid carcinoma (PTC) is the most common type of thyroid cancer (85%–90%) [
1]. The 10-year survival rate in PTC after treatment is higher than 90% [
2]. However, regional or distant metastatic recurrences occur in up to 10% of cases [
3]. The current clinical difficulty is in properly identifying PTC cancer. Ultrasound diagnosis depends on the experience and knowledge of the examiner. Fine needle aspiration biopsy (FNAB) also has limitations, as it is quite challenging to take a biopsy from a small nodule [
4]. Furthermore, FNAB diagnosis is doubtful in up to 20% of cases and then thyroid surgery is still needed to confirm malignancy [
5].
It is important to differentiate PTC from benign thyroid nodule early enough to avoid an advanced disease course. Therefore, non-invasive biomarkers of PTC are needed [
6]. The European Thyroid Association recommends investigating
BRAF, RET/PTC, PAX8/PPARG, RAS mutations,
TERT promotor and
TP53 in case of uncertainty about further clinical action depending on Bethesda classes [
6]. Further miRNA investigations are encouraged in the same guidelines, as these molecules demonstrate a potential value in PTC diagnostics and follow up [
6].
miRNAs are endogenous non-coding RNA molecules (19–25 nucleotides in length) identified as post-transcriptional negative regulators of gene expression by attaching to the 3′ untranslated region of target mRNAs in the cytoplasm [
7,
8]. miRNAs have been shown to be involved in fundamental biological processes, including metabolism, cell life cycles, tissue differentiation, embryogenesis and organogenesis functions such as cell proliferation and apoptosis, proving their relevance as regulators for oncogenes and tumor suppressor genes [
7,
9]. Extensive efforts have been made in determining miRNA expression changes in different diseases and cancer types [
10]. Tissue and bioliquid (e.g., plasma, serum) miRNA is highly stable [
11]. The fact that specific miRNAs are released from tissues into the circulation with the development of disease encourages further studies on the detection of non-invasive biomarkers [
11]. Functions of circulating miRNAs are being investigated and hormone-like activity of circulating miRNAs at long distances has been recognized in recent years [
12]. However, identification of specific roles of circulating miRNAs, understanding their implication in specific pathways and finding the most sensitive and specific miRNAs is still challenging [
13].
It is already known that miR-146b, miR-21, miR-221, miR-222, miR-181b are dysregulated in PTC. These molecules showed potential as biomarkers in PTC tissue and plasma/serum studies [
14,
15,
16,
17,
18,
19,
20,
21,
22,
23]. It was also demonstrated that downregulation of miR-181b inhibits proliferation and promotes apoptosis in thyroid cancer TPC1 cells, making this miRNA a possible target for PTC treatment [
24]. Moreover, miR-181b was also found to be upregulated in PTC tissue samples [
25]. miR-21 was found to be overexpressed in PTC compared to healthy thyroid tissue [
20], as well as in recurrent PTC compared to non-recurrent PTC [
18,
20]. This miRNA has diagnostic value in head and neck cancer as it is released into the bloodstream [
26]. miRNA-21 promotes cell proliferation and invasion via the VHL/PI3K/AKT pathway [
27]. miRNA-222 and miRNA-221 also have potential to become biomarkers of PTC. The putative targets for miRNA-222 and -221 are the p27/kip1 and p57/kip2 genes, which affect cell cycle regulation and cancer inhibition [
28]. Increased expression of these miRNAs results in downregulation of these genes, which reduces genome instability and cell proliferation [
28]. The many effects of miR-146b seen in PTC cells may indicate the significance of this regulatory molecule in the diagnosis and prognosis of PTC [
29]. miR-146b was found to increase cell proliferation activity and inhibit cell cycle arrest by downregulating SMAD4 [
30]. Moreover, it promotes migration, invasion and epithelial-to-mesenchymal transition by downregulating ZNRF3 [
31] and increases cell proliferation by downregulating IRAK1 [
32].
The aim of our study was to analyze the expression of five miRNA molecules (miR-21; miR-221; miR-222; miR-146b; miR-181b) in plasma samples and evaluate the differences in patients with PTC, benign nodules and healthy controls to identify the potential biomarkers of PTC for non-invasive diagnostics.
3. Discussion
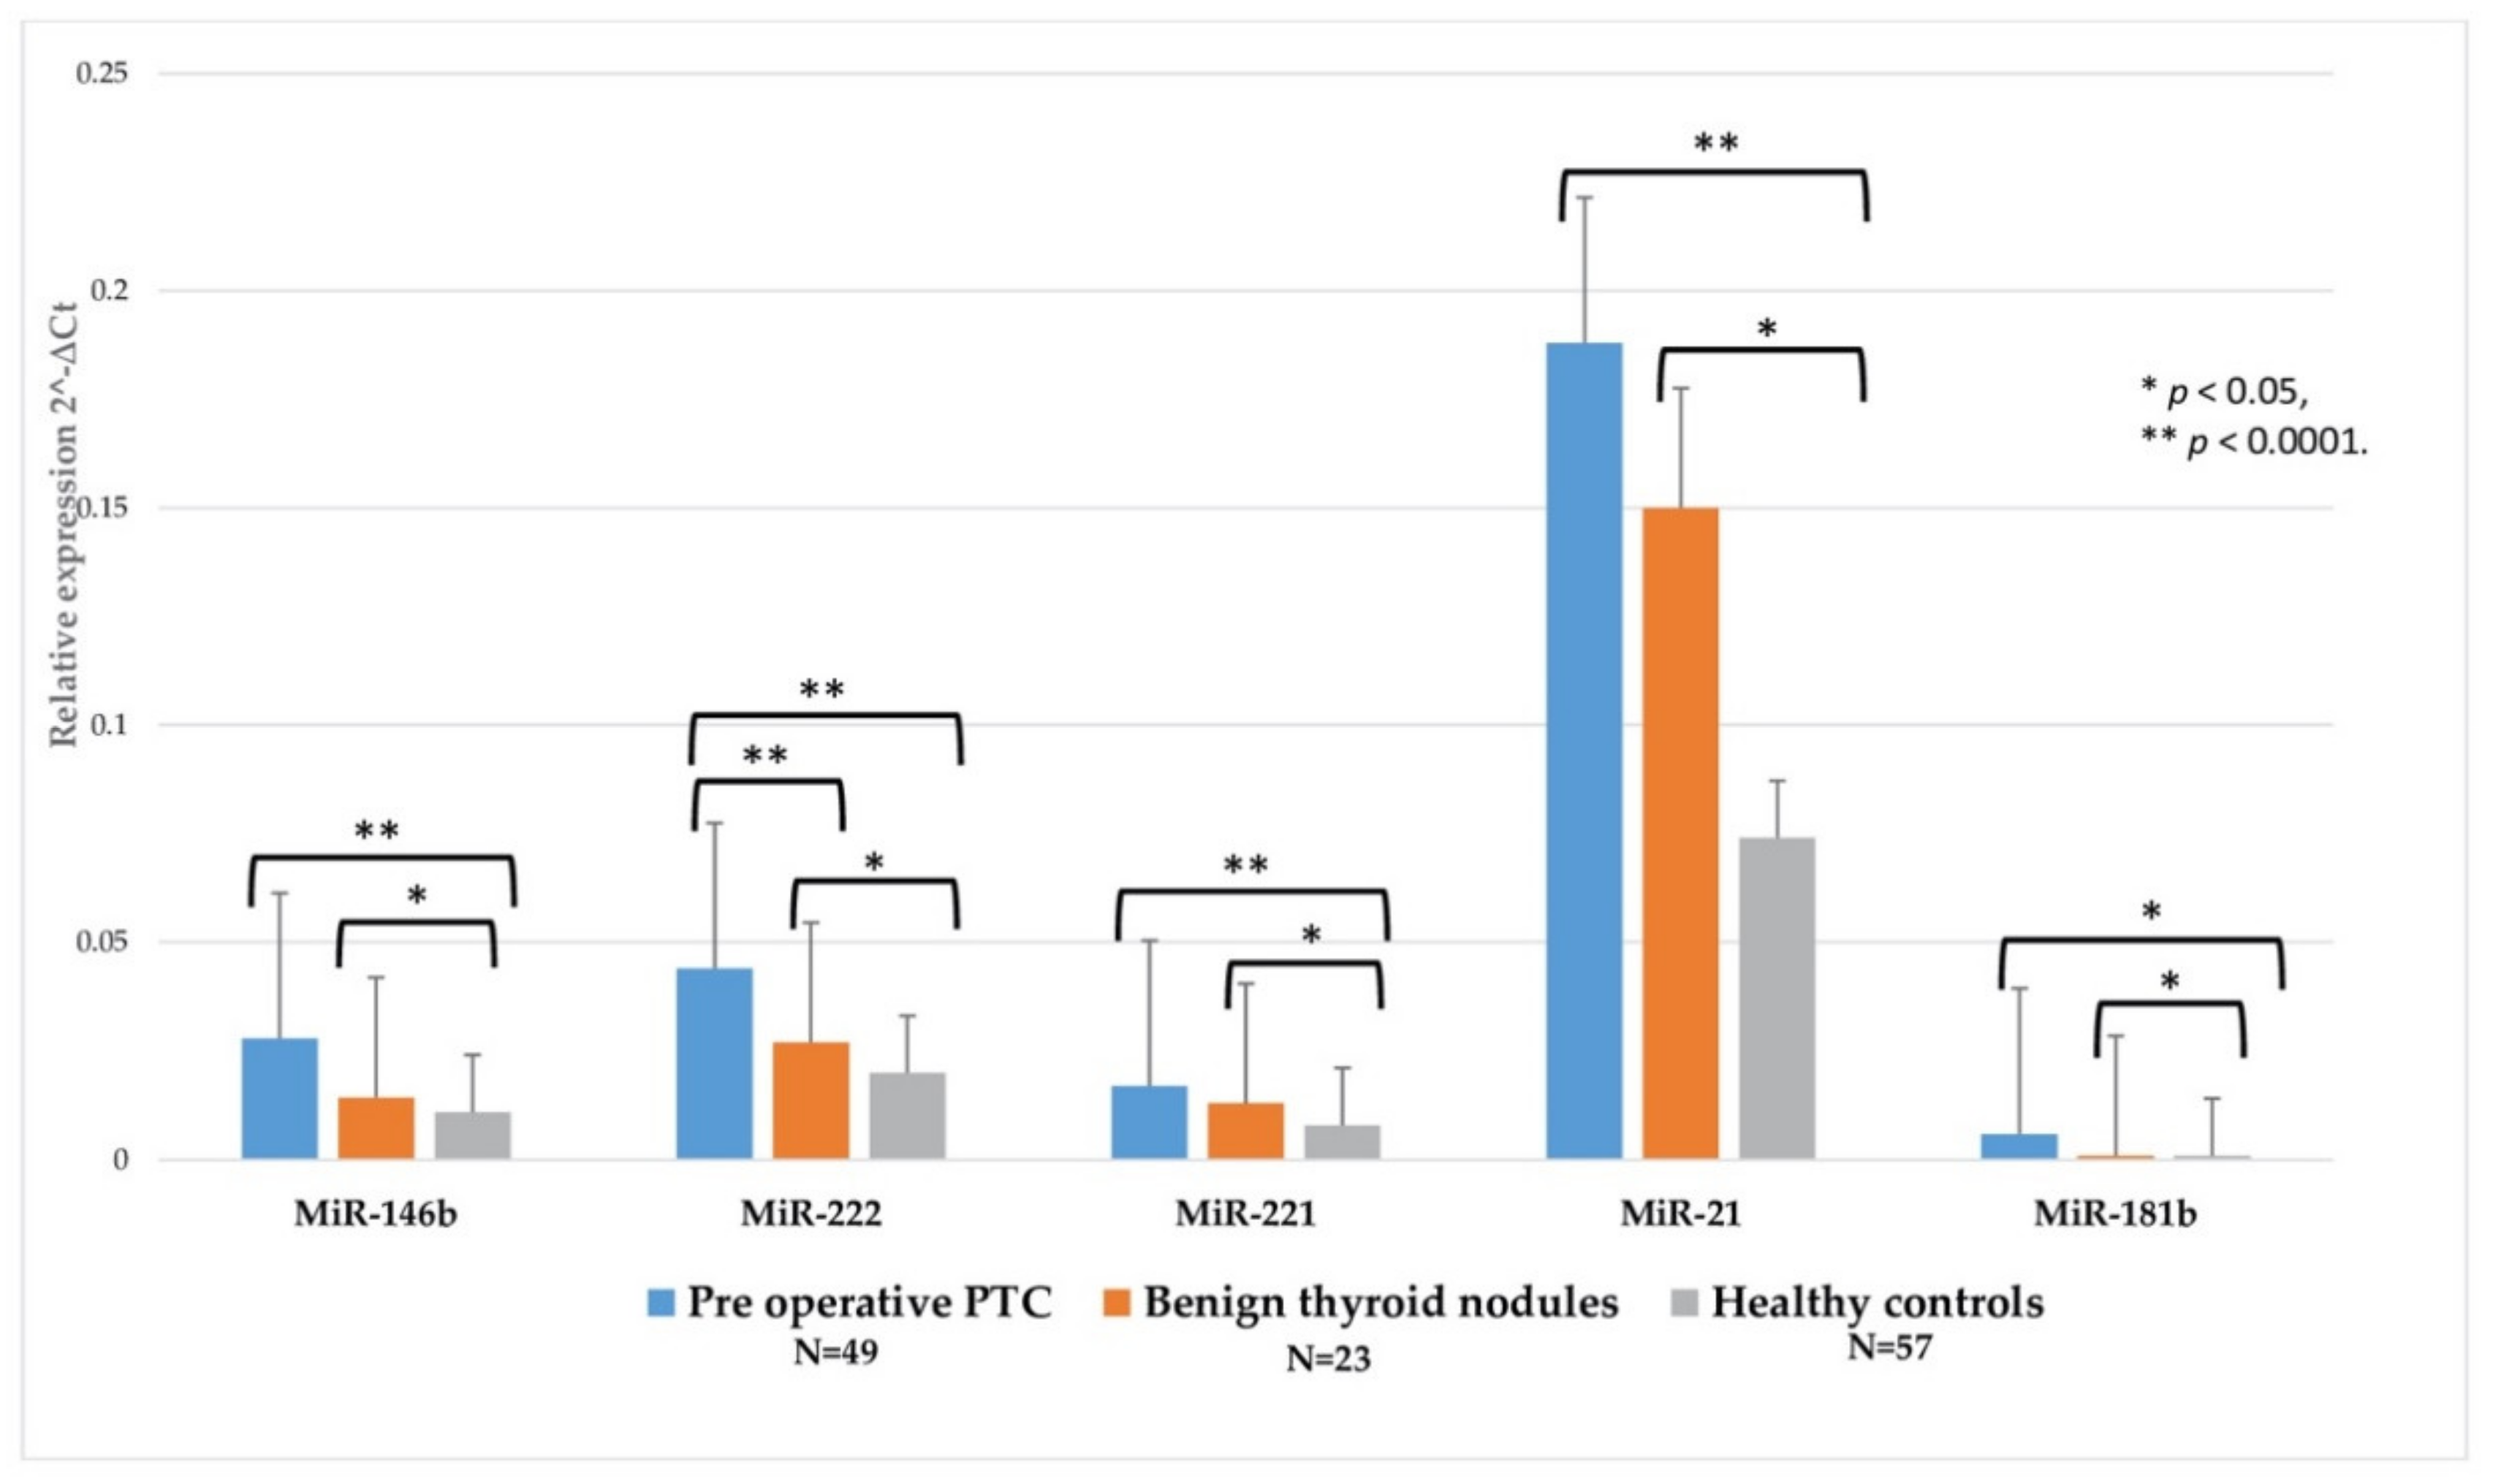
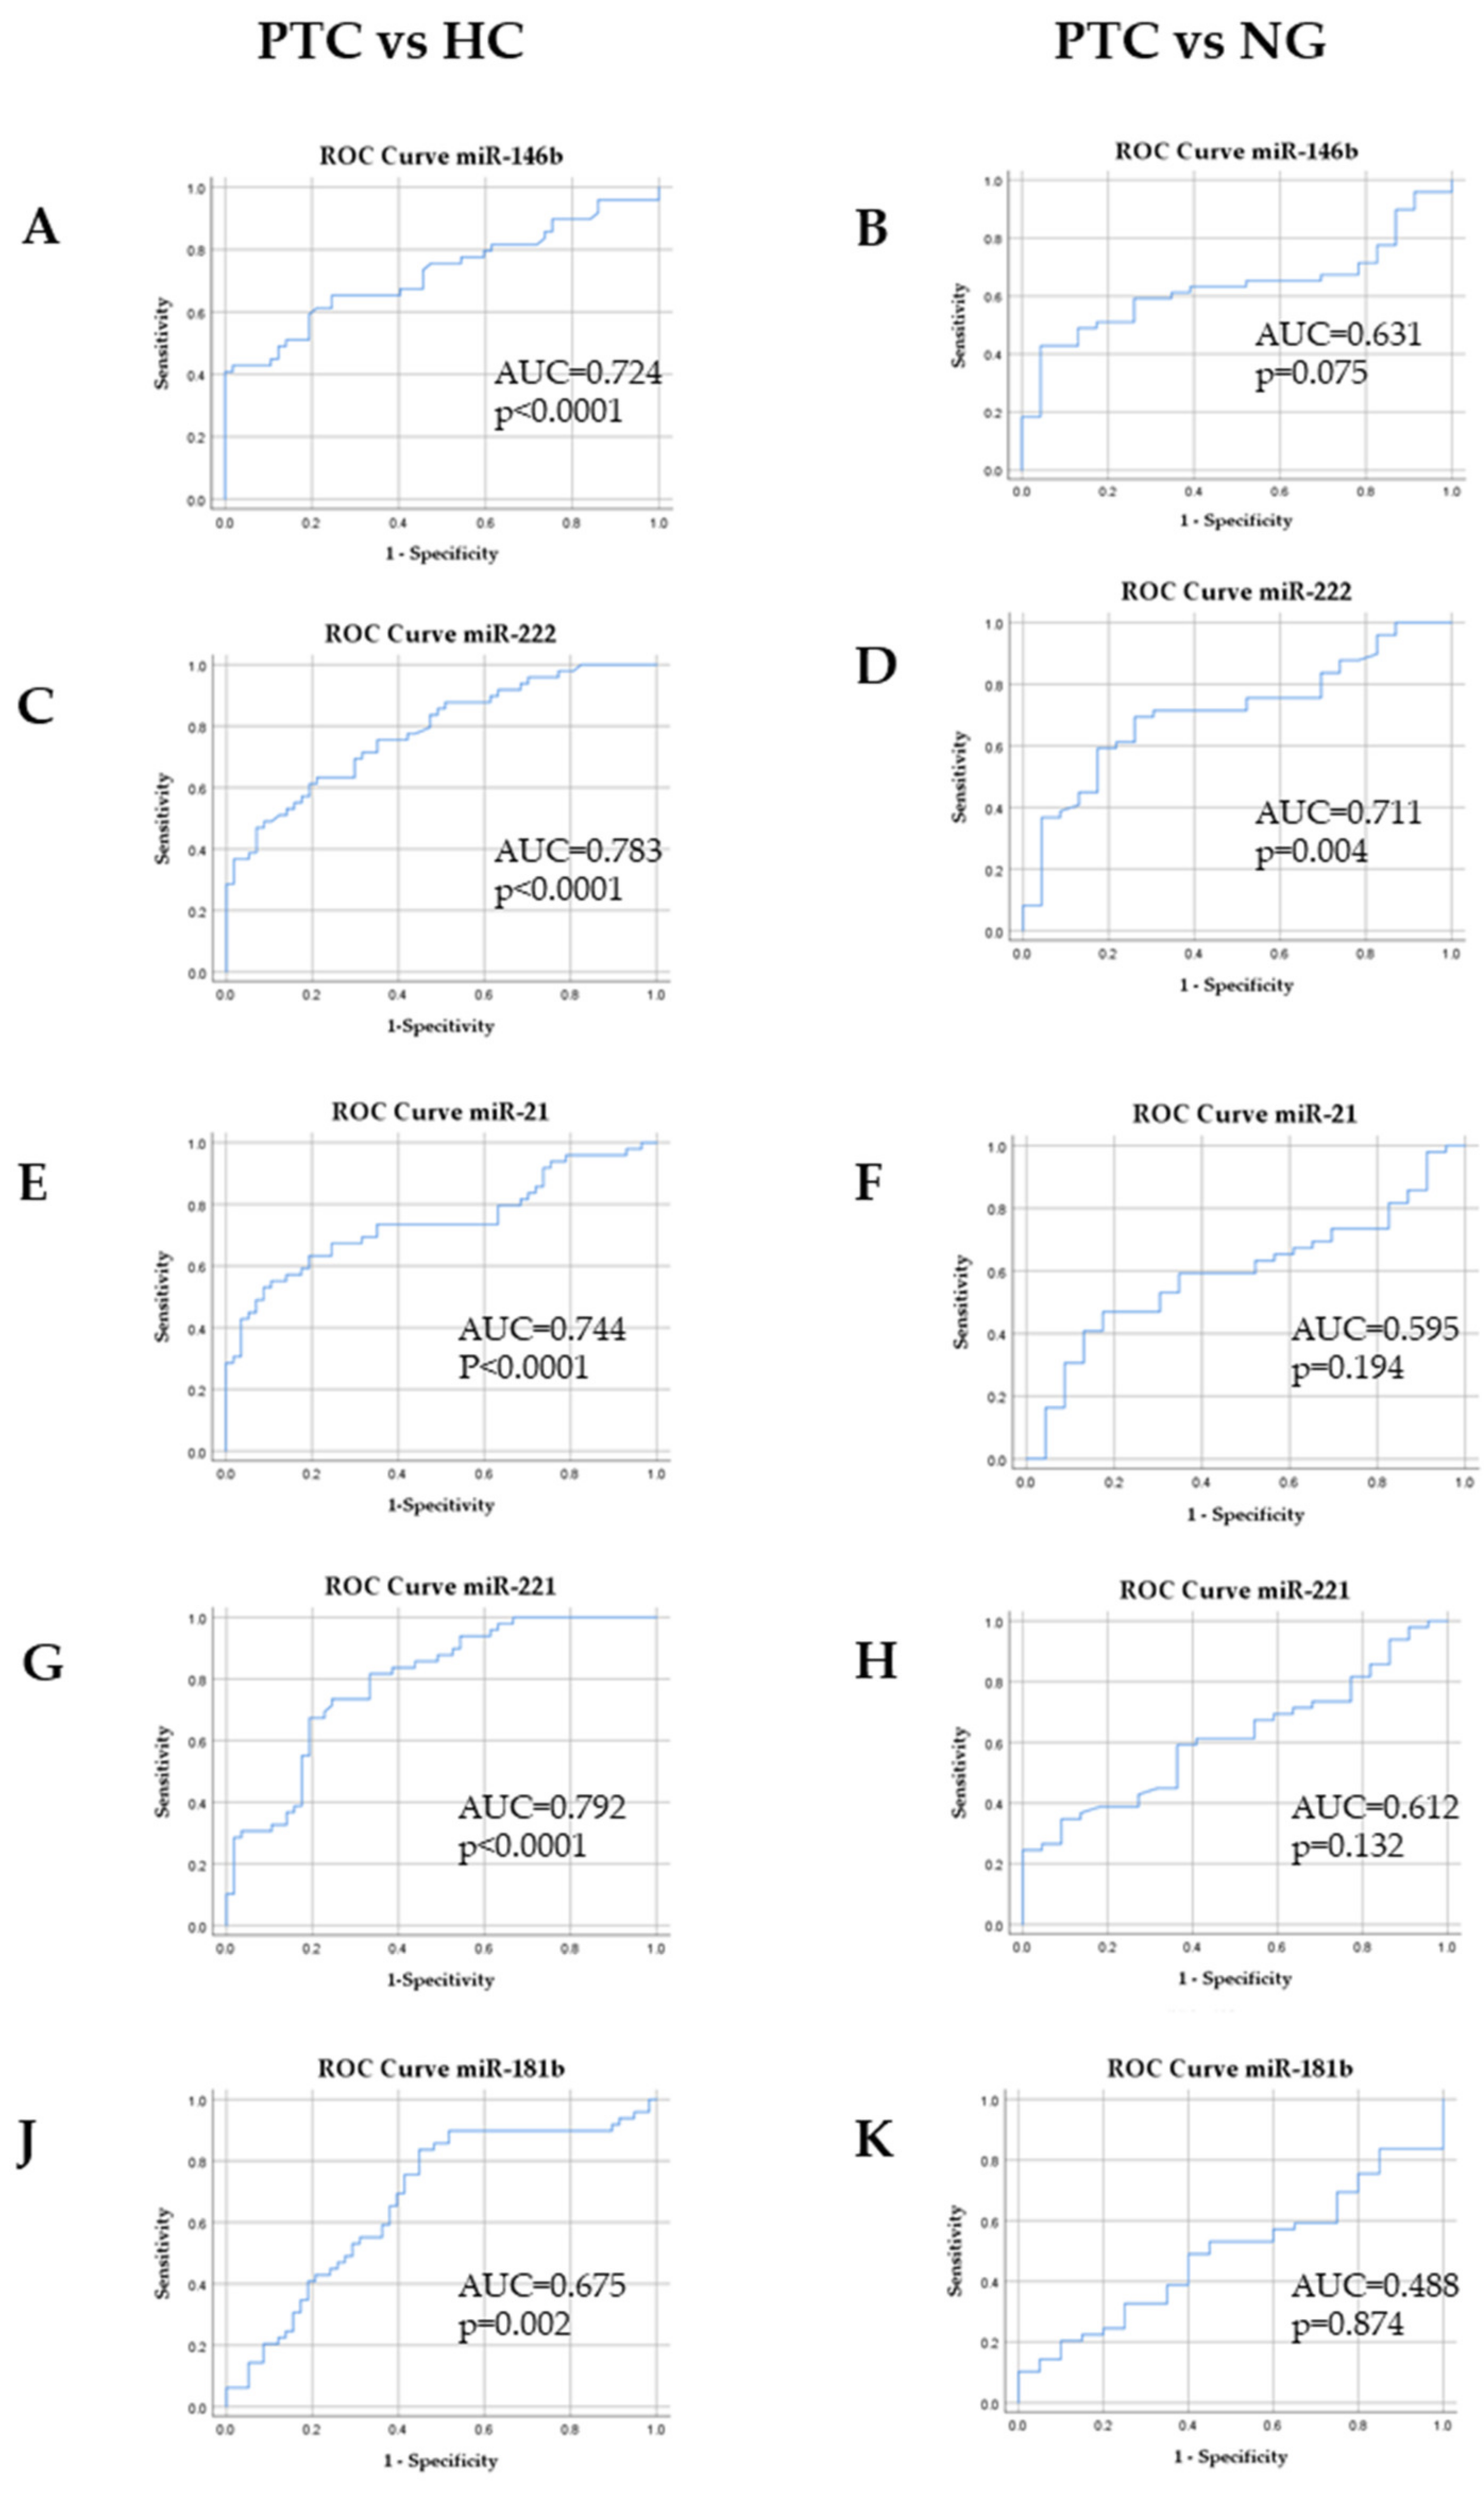
In this study, we investigated five miRNAs (miR-146b, miR-21, miR-221, miR-222, miR-181b) as possible non-invasive biomarkers for PTC. We compared their expression profiles in plasma samples of PTC, NG and HC study groups and analyzed their relation to the clinicopathologic characteristics of PTC. We determined a significant overexpression of miR-146, miR-221, miR-222, miR-21 and miR-181b in PTC plasma samples compared to HC. However, only miR-222 showed a significant difference between PTC and NG study groups. In addition, miR-222 expression was associated with PTC multifocality. ROC analyses indicated that all five miRNAs had statistically significant expression changes that could differentiate PTC patients from healthy controls. Moreover, ROC analysis revealed that miR-222 is a possible plasma-derived diagnostic biomarker for distinguishing PTC from NG.
Tumor-derived miRNAs are released into the circulation [
34]; therefore, specific types of circulating miRNAs from each organ may have a diagnostic and prognostic role in different types of cancer [
35,
36,
37,
38]. Circulating miRNAs have been demonstrated to have an impact on cell–cell communication in tumor biology [
39]. The expression of circulating miRNAs is usually evaluated in the plasma or serum [
11]. Coagulation may affect the spectrum of extracellular miRNA in the blood [
40,
41]. We chose to analyze miRNA expression in plasma samples because this bioliquid is prevented from clotting [
40,
41]. Certain studies have already shown changes in circulating miRNA expression in PTC patients [
42,
43,
44]. Our findings suggest that these five miRNAs are overexpressed in PTC and spread from PTC cells to the bloodstream at detectable levels.
Previous studies have demonstrated that miR-146b, miR-221 and miR-222 are the most consistently overexpressed miRNAs in PTC tissue [
14,
22,
45,
46]. Moreover, studies that explored miR-146b, miR-222 and miR-221 expression in plasma samples showed their consistent upregulation in PTC compared to the HC group [
22,
40]. To our best knowledge, miR-181b and miR-21 have not been investigated in plasma as possible biomarkers of PTC, although they have been found to be overexpressed in PTC tissue samples [
14,
18,
25]. Furthermore, miR-21 was analyzed in serum samples and showed potential to become a diagnostic and prognostic marker of PTC [
42,
43]. We found a significant overexpression of plasma miR-222 in PTC compared to NG. Previous studies also revealed an increase in miR-222 expression in PTC tissue samples as well as plasma samples. M.Rezaei et al. [
44] analyzed miR-222, miR-146a and miR-181a in PTC and NG plasma samples and demonstrated an overexpression of these three miRNAs in the PTC group. Higher expression levels of miR-222 were also observed in PTC patient compared to NG patient serum samples [
16]. However, caution must be taken when comparing miRNA data obtained from different sample types [
47]. Our findings show that plasma expression of miR-221, miR-21, miR-146b and miR-181b was not statistically significant in PTC compared to NG, although previous studies have shown the potential diagnostic value of miR-146b [
40].
If surgery is chosen for patients with thyroid cancer < 1 cm without extrathyroidal extension and cN0, the initial surgical procedure should be a thyroid lobectomy, unless there are clear indications to remove the contralateral lobe. For patients with thyroid cancer > 1 cm and < 4 cm without extrathyroidal extension and without clinical evidence of any lymph node metastases (cN0), the initial surgical procedure can be either a bilateral procedure (near total or total thyroidectomy) or a unilateral procedure (lobectomy). Thyroid lobectomy alone may be sufficient initial treatment for low-risk papillary and follicular carcinomas. For patients with thyroid cancer > 4 cm or with gross extrathyroidal extension (clinical T4) or clinically apparent metastatic disease in nodes (clinical N1) or distant sites (clinical M1), the initial surgical procedure should include a near-total or total thyroidectomy [
48]. In our study, plasma levels of five miRNAs were measured in 37 PTC patients before and after surgery (30 patients underwent total thyroidectomy, 7 underwent hemi thyroidectomy). We checked if plasma miRNA expression also decreased in the absence of the tumor. The expression levels of miR-221, miR-21, miR-181b and miR-146b were significantly lower after total thyroidectomy compared with the samples before surgery. This suggests that miR-221, miR-21, miR-181b and miR-146b may have prognostic potential in PTC. Only miR-21 showed a significant reduction in its plasma levels after hemi thyroidectomy in PTC patients. This indicates that the prognostic potential of miR-221, miR-222, miR-146b and miR-181b after hemi thyroidectomy is doubtful since no significant decline is observed 4–6 weeks after surgery. Our observations differ from other studies that investigated the levels of specific circulating miRNAs as a marker to monitor the postoperative PTC progression. Reductions of 2.7–fold and 5.1–fold were observed in the plasma levels of miR-222 and miR-146b, respectively, after total thyroidectomy [
22]. Zhang et al. evaluated the levels of miR-222, miR-221 and miR-146b via subsequent RT-qPCR during varied postoperative periods in the same patients [
16]. The levels of miR-222, miR-221 and miR-146b rapidly decreased 1 month after surgery compared with their preoperative levels in the PTC group. There was no difference in the miR-222, miR-221 and miR-146b expression levels for patients with PTC undergoing hemi thyroidectomy or total thyroidectomy prior and after surgery [
16]. Further studies of plasma miRNA expression after surgery with more subjects and a longer follow-up period would reveal prognostic value of these miRNAs to PTC patients.
As there is a clear association between miRNA expression and the clinicopathological features of PTC [
20,
49,
50,
51,
52], our study revealed higher expression of miR-222 in plasma samples of patients with multifocal PTC. In a previous investigation of PTC tissues, associations of miR-221 [
16], miR-146b [
53], miR-146a [
48] overexpression with PTC multifocality were found. Zhang Y. et al. analyzed the levels of circulating miR-222 in relation to PTC multifocality but no significant differences were found [
16].
In our study, ROC curves were used to evaluate the diagnostic value of differently expressed miRNAs in PTC, HC and NG groups, which indicated that all five miRNAs showed statistically significant plasma expression changes that were able to differentiate PTC patients from healthy controls. Moreover, ROC curve analysis confirmed that plasma miR-222 might be a reliable marker in discriminating PTC from NG (AUC = 0.711 (95%CI 0.587–0.834),
p = 0.004). ROC analysis was not used in previous studies that analyzed miRNA expression levels in the plasma of PTC, NG and/or HC. However, plasma miR-146b (AUC = 0.649 (95%CI 0.521–1.77)) was shown to be helpful to discriminate benign thyroid lesions from PTC in a study by Lee at al. [
40]. Zhang Y et al. [
16] proposed using circulating serum miR-222, miR-221 and miR-146b expression as a possible panel for distinguishing PTC from NG (AUC = 0.903 (95%CI 0.85–0.955)). However, the cohorts of these studies were small and therefore further investigations with a larger sample size are required.
For the first time we provided information about plasma expression of miRNA-21 and miRNA-181b in PTC patients. Furthermore, miRNA-222 plasma expression was found to be a promising diagnostic marker of PTC. Moreover, our findings suggest that plasma miRNA expression does not change significantly after hemi thyroidectomy and it therefore might be a useful prognostic marker after total thyroidectomy only. It should be noted that we evaluated expression of plasma miRNAs 4–6 weeks after surgery. Longer observational studies might reveal different results. Similar to previous studies, a limitation of our study is the small sample size. Therefore, it is difficult to make firm conclusions and further investigations are needed to confirm our results.
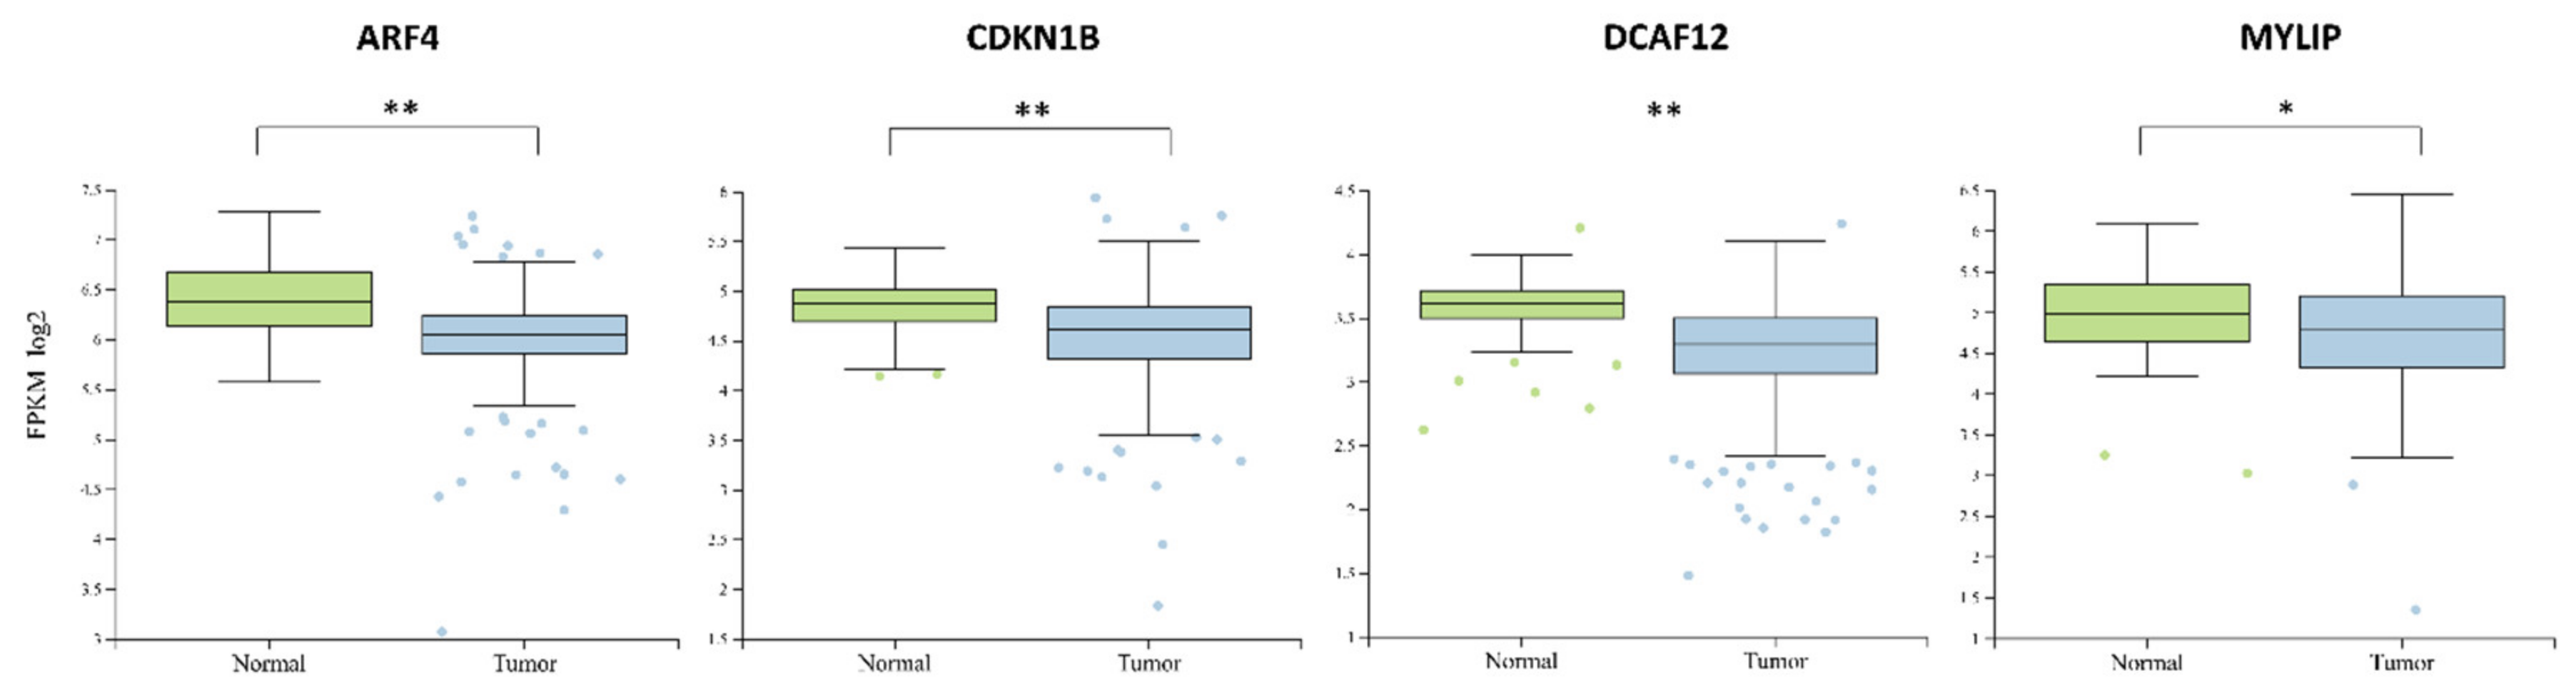
Target prediction analysis indicated four major miR-222 mRNA targets—
ARF4,
DCAF12,
CDKN1B,
MYLIP. Downregulation of
ARF4 in thyroid cancer results in inefficiency to accumulate radioiodine due to disrupted trafficking of sodium iodide symporter to the plasma membrane [
54]. Interestingly,
ARF4 is described as an oncogene by promoting breast cancer cell migration and metastasis to the lungs [
55,
56]. Also,
ARF4 is reported to be upregulated in Epithelial ovarian cancer as well as in other major cancer tissues [
57,
58]. The combined downregulation of
ARF4 and upregulation of miR-222 might indicate its diagnostic specificity in thyroid cancer.
DCAF12 is mostly upregulated in various cancers tissues compared to normal ones and only in the adrenal gland, bone, testis and thyroid cancers it is downregulated [
58]. This indicates the diagnostic potential of
DCAF12 and miR-222 joint expression evaluation in thyroid cancer.
CDKN1B is associated with cell cycle regulation by regulating its division. Disruption of
CDKN1B has been reported to evoke tumorigenesis by increased cell proliferation and loss of function [
59]. The downregulation of
MYLIP is associated with increased tumor migration and metastasis in breast cancer cells [
60]. Also, the inhibition of
MYLIP downregulation by
TUSC8 resulted in suppressed metastasis showing the important role of
MYLIP in cancer [
61].
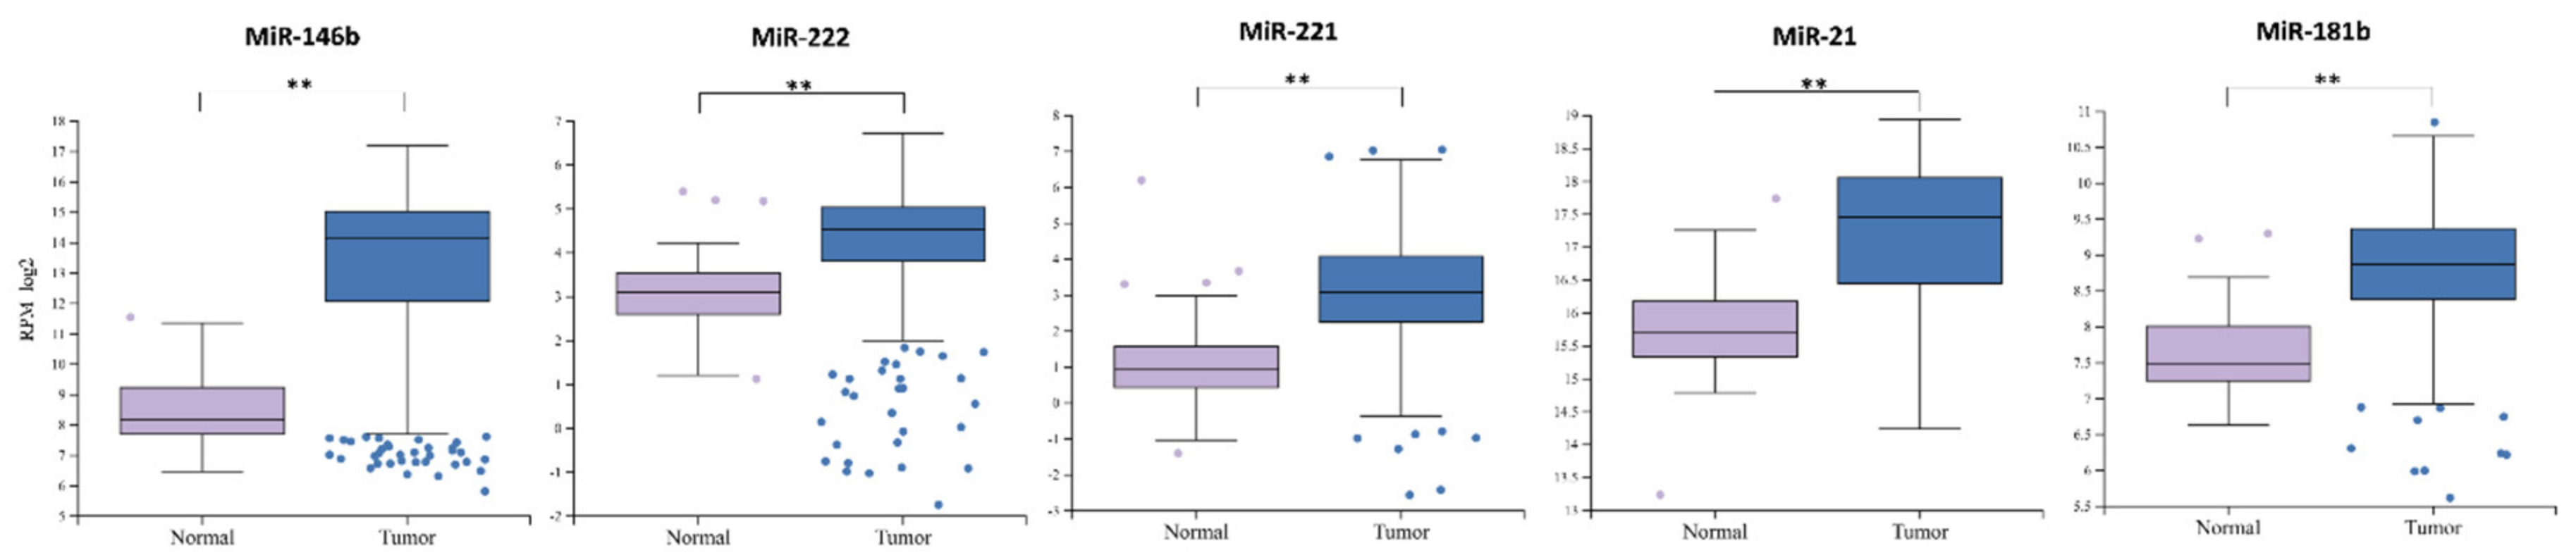
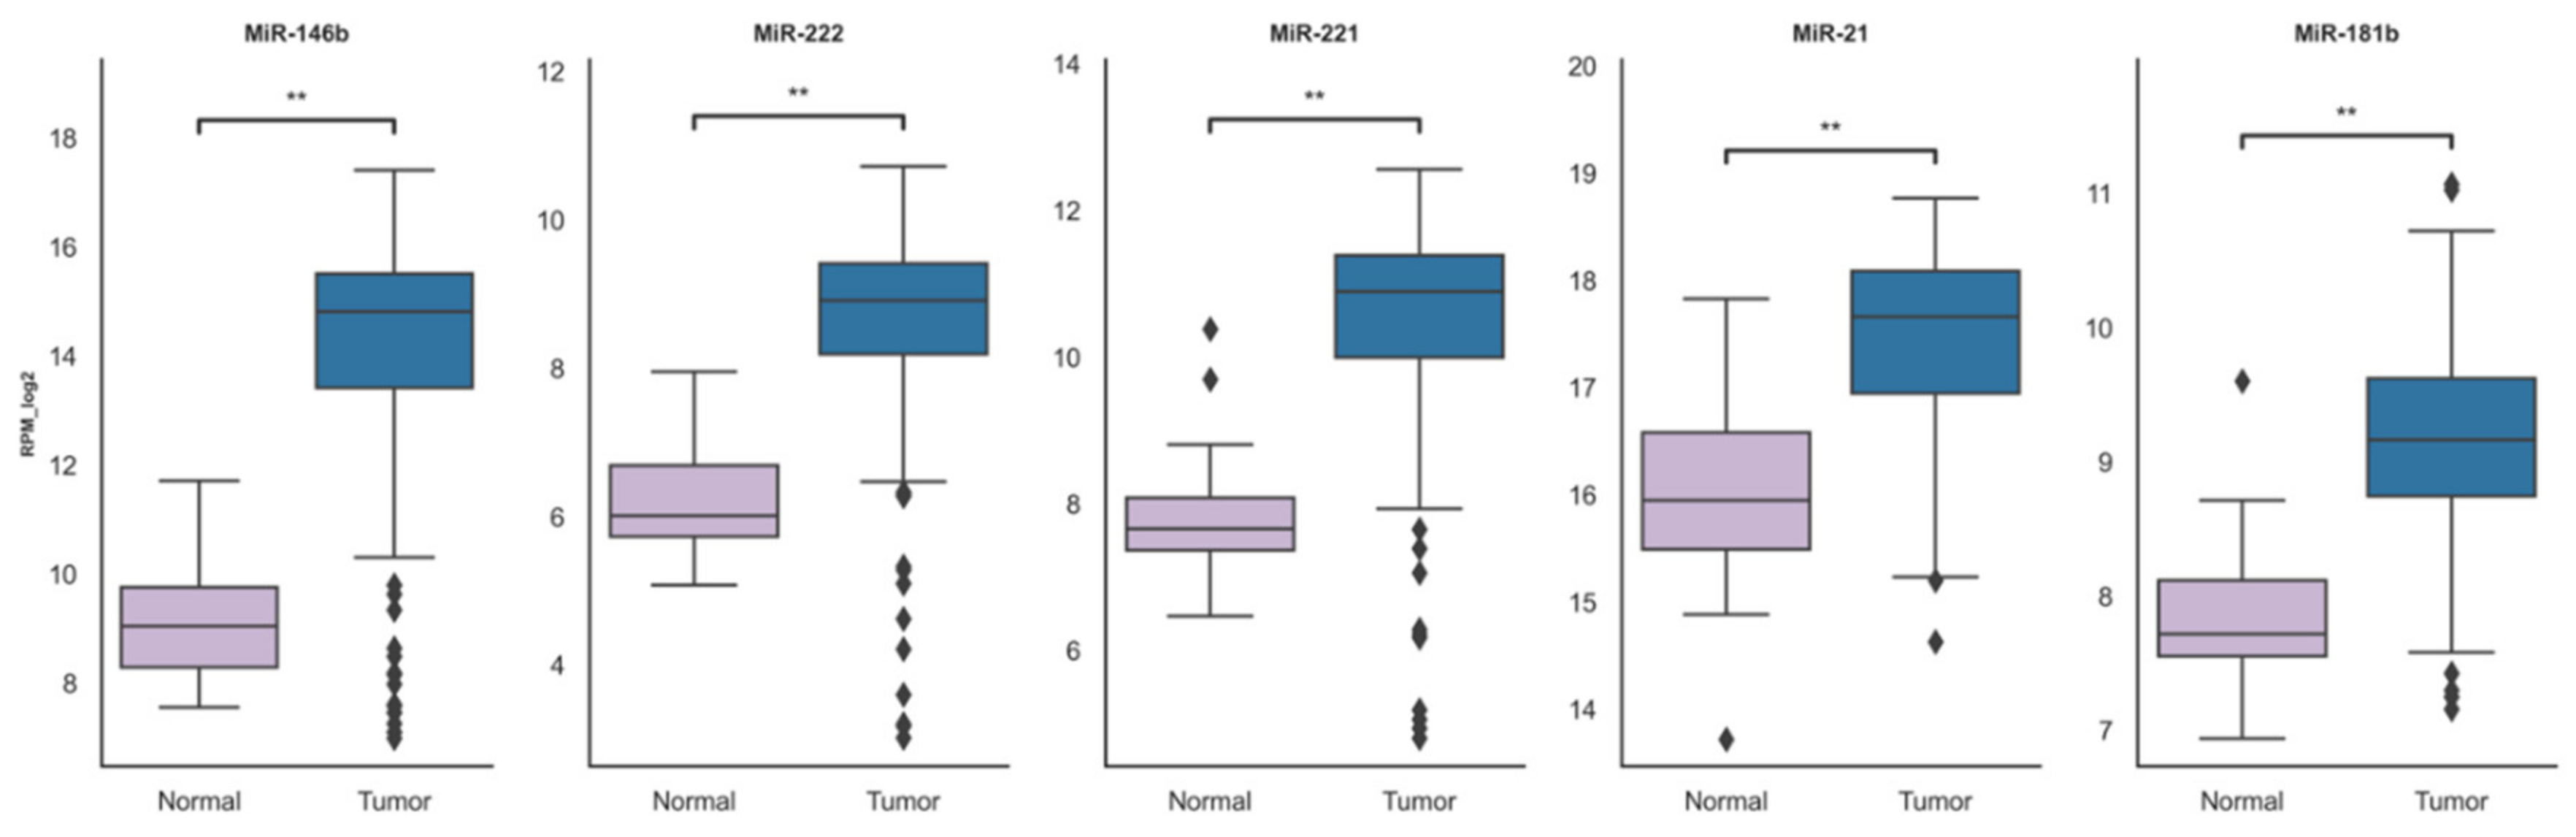
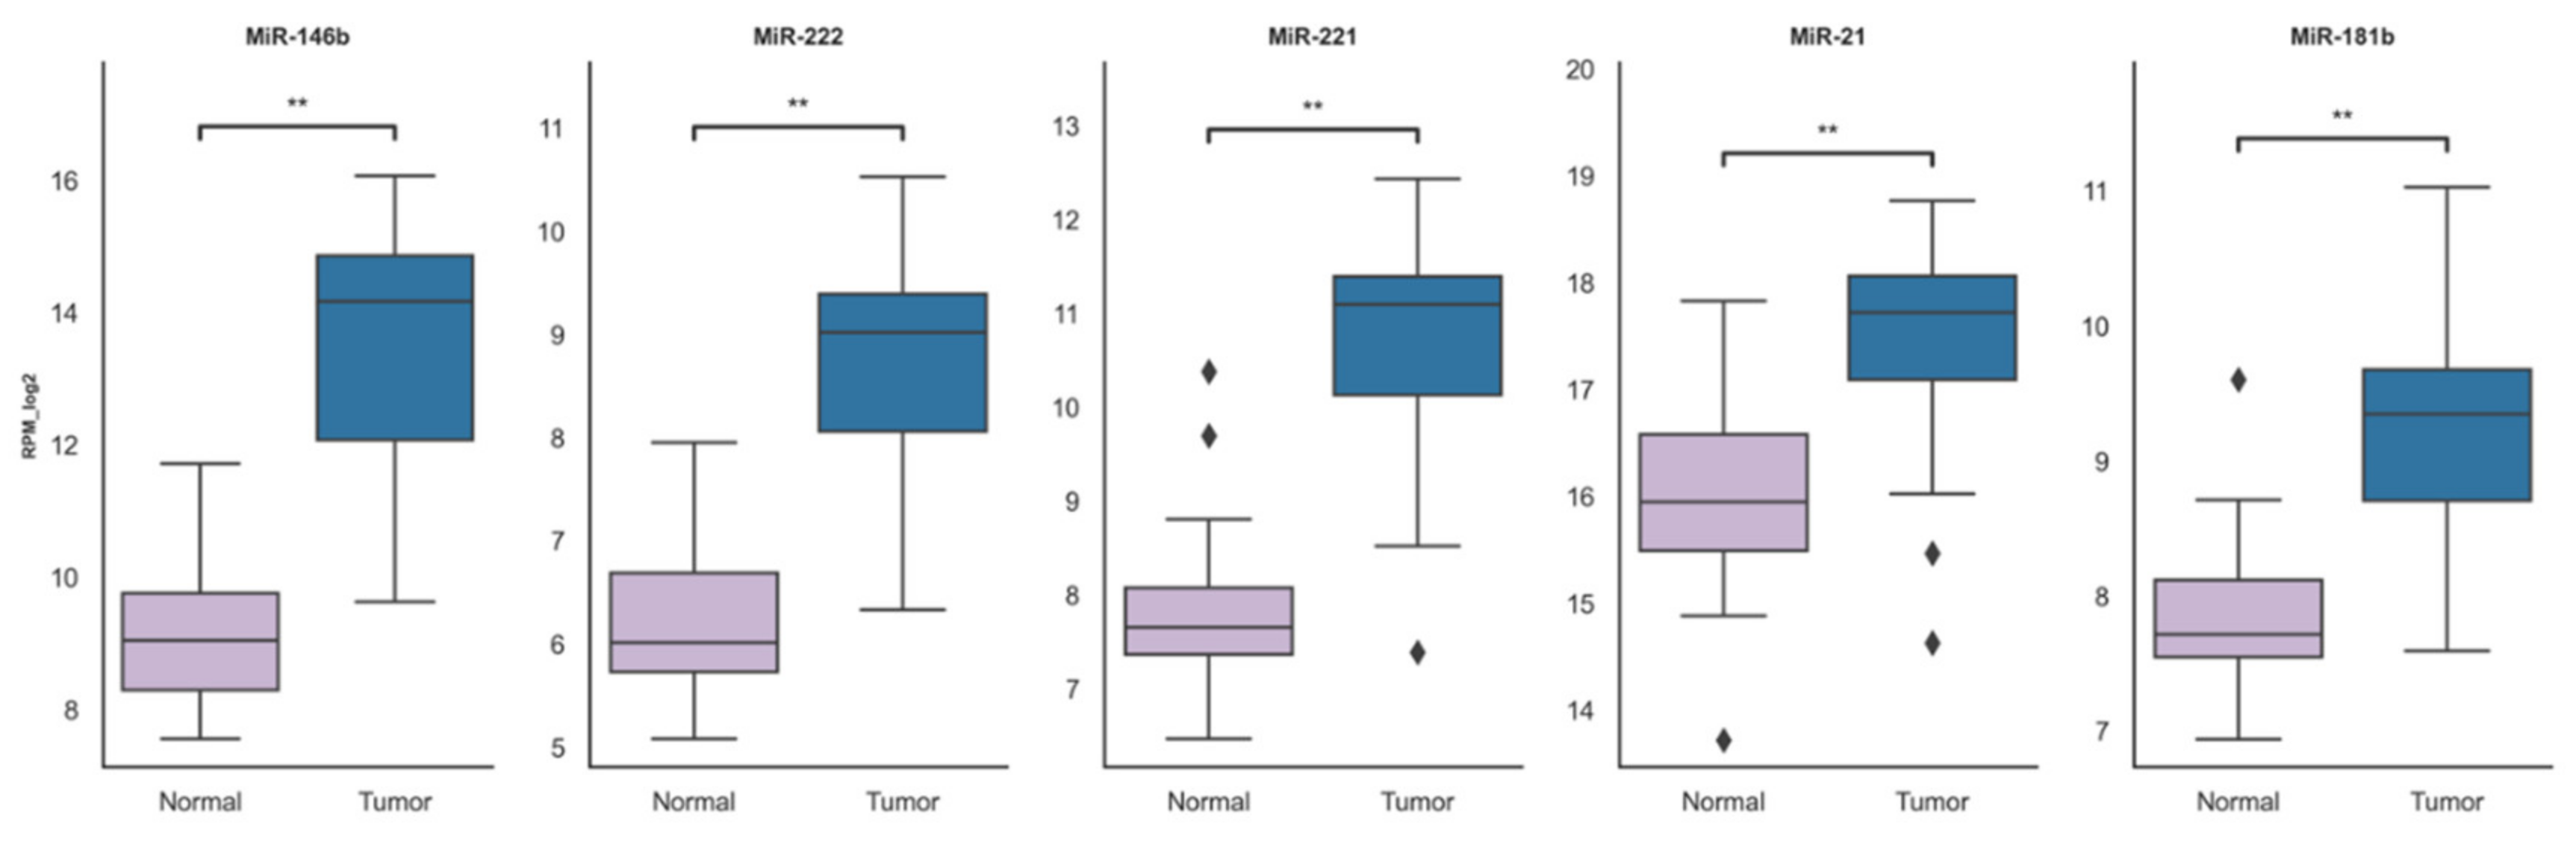
The upregulation of miR-146b, miR-222, miR-221, miR-21 and miR-181b were consistent in both the TCGA-THCA dataset and our research cohort. These findings suggest an oncogenic role of these miRNAs in thyroid cancer. As miR-222, miR-181b, miR-146b, miR-21 and miR-222 are overexpressed in PTC tissue, our findings suggest that they circulate in a highly stable, cell-free form in plasma. Our study demonstrated overexpression of these five plasma miRNAs in the PTC group compared to healthy controls, while only miR-222 showed a significant difference between PTC and NG groups and an association with multifocality. Further studies with larger sample sizes are necessary to confirm its relevance as a biomarker for non-invasive diagnostics and prognosis of PTC.

 ,
, 


