Effects of Early Life Stress on Bone Homeostasis in Mice and Humans

 , , , , , and
Abstract
:1. Introduction
2. Results
2.1. Mouse Study
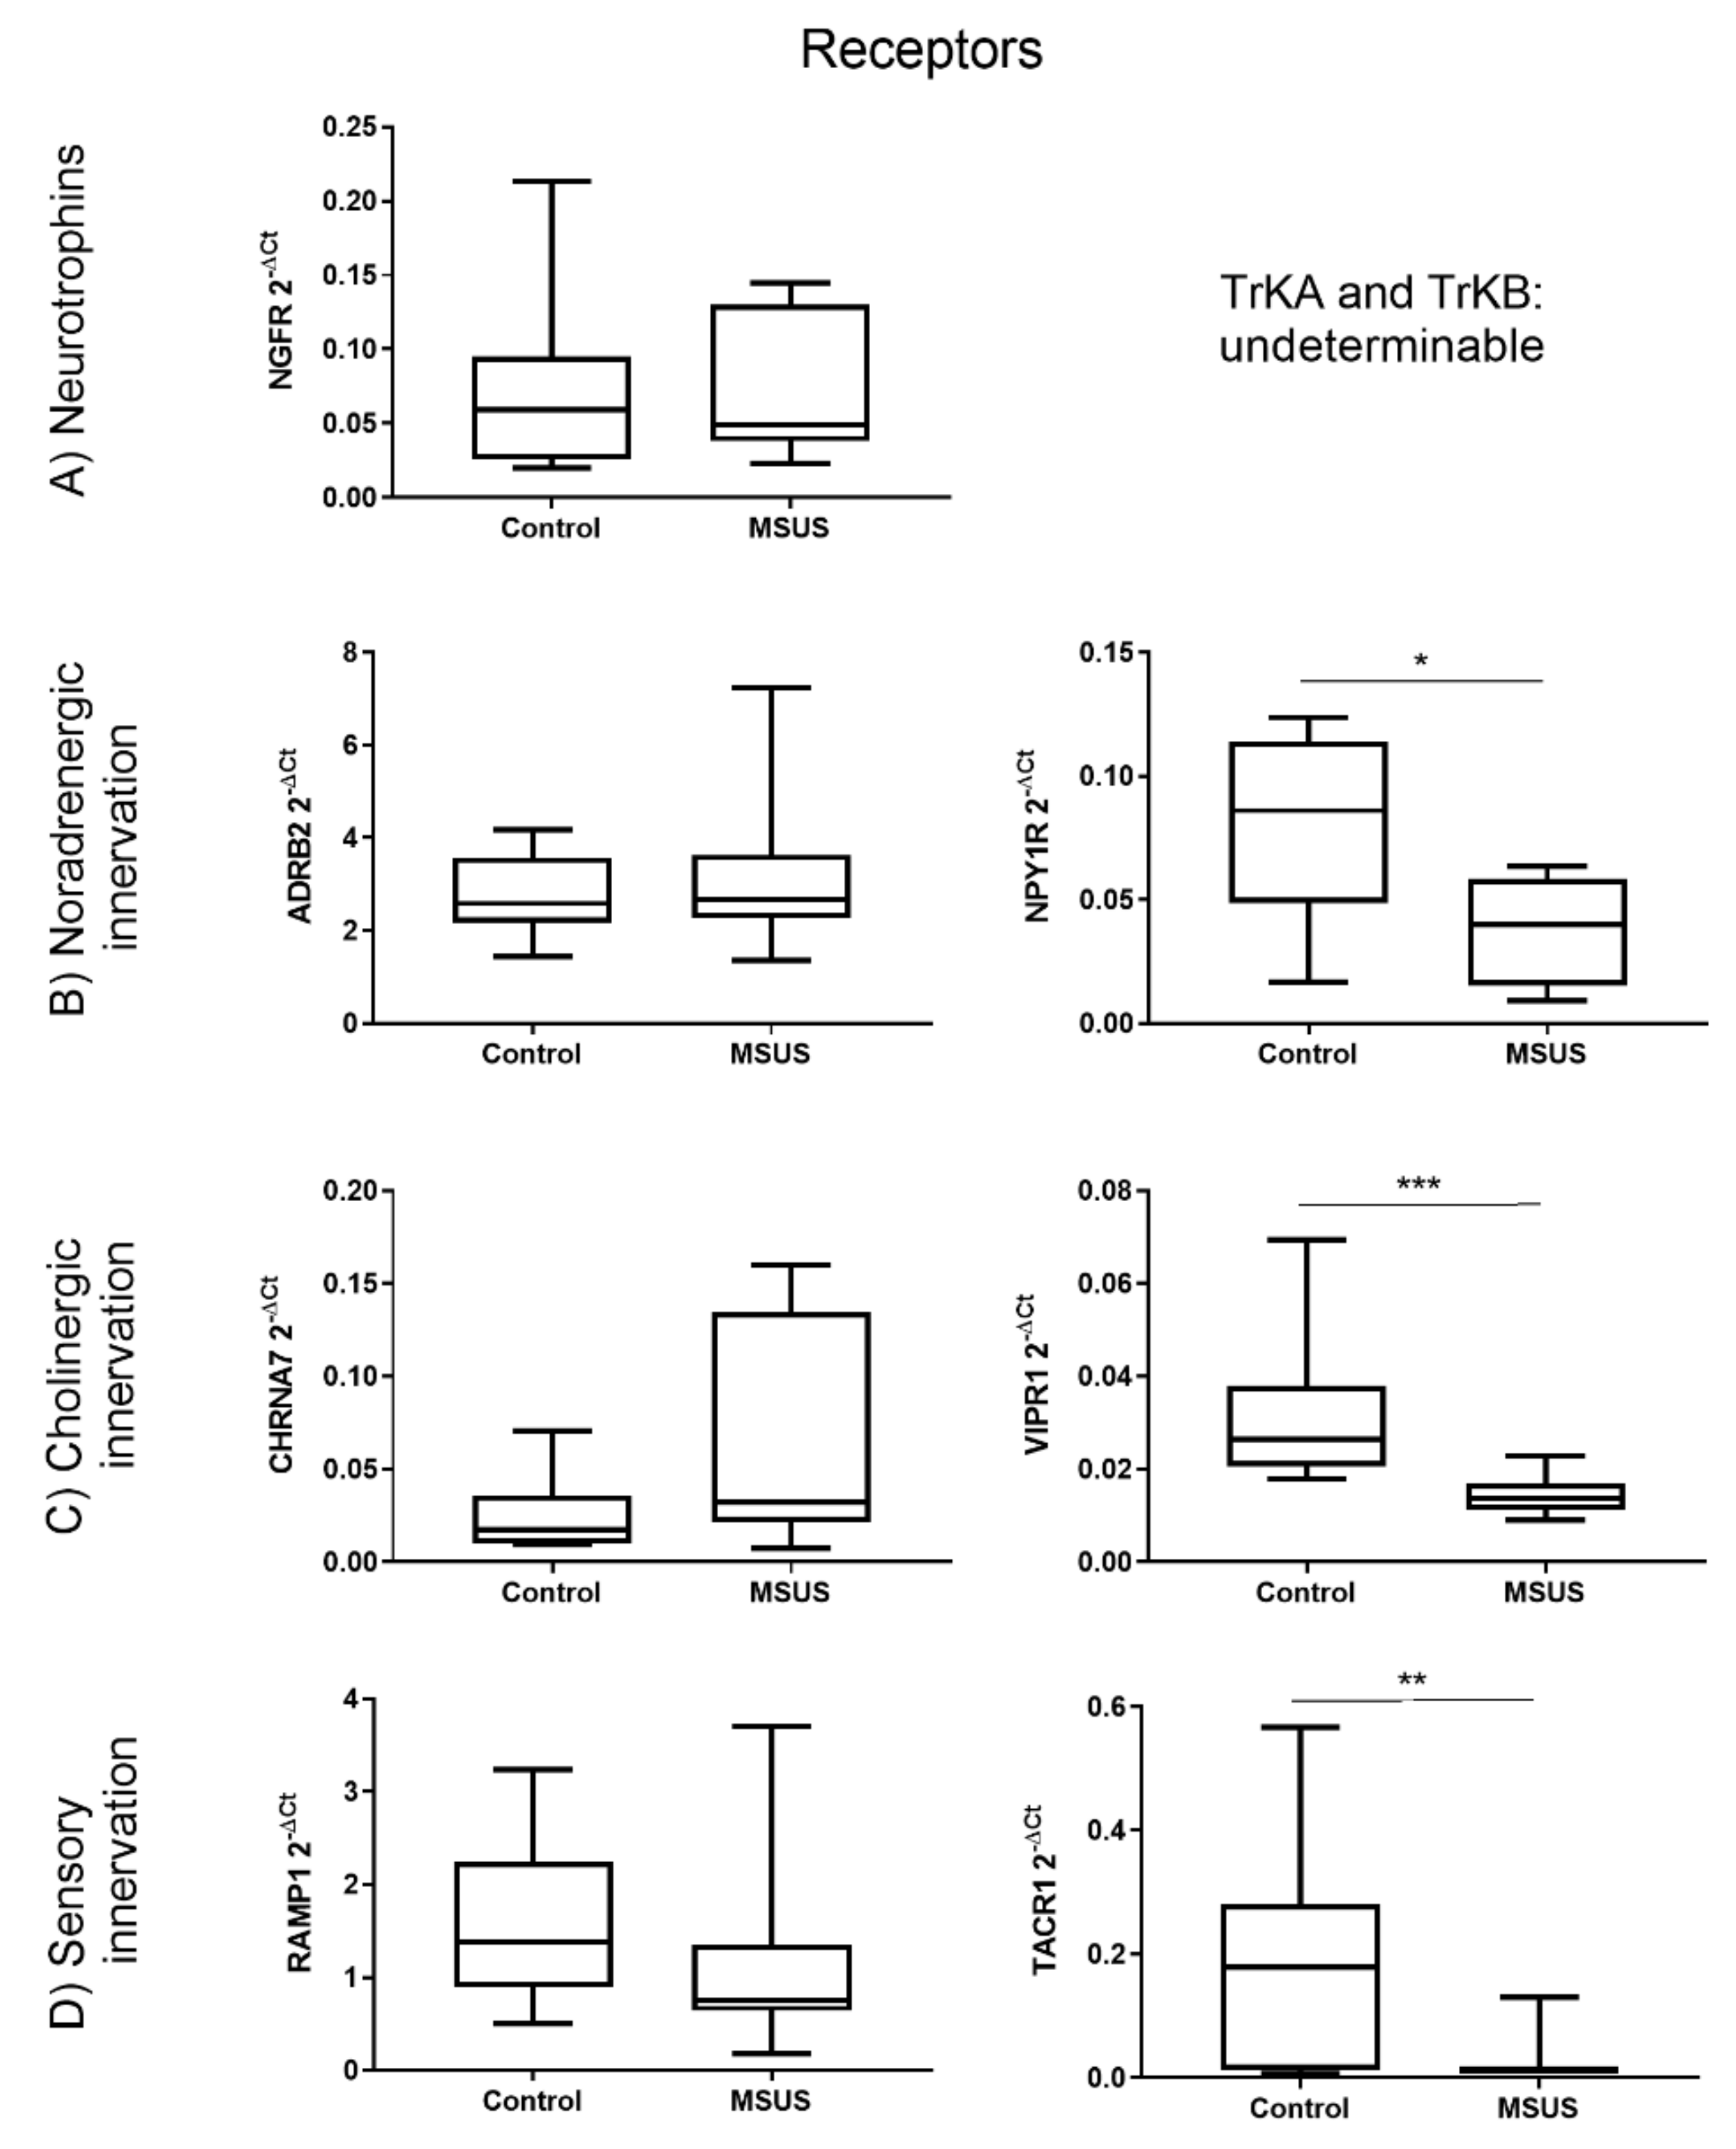
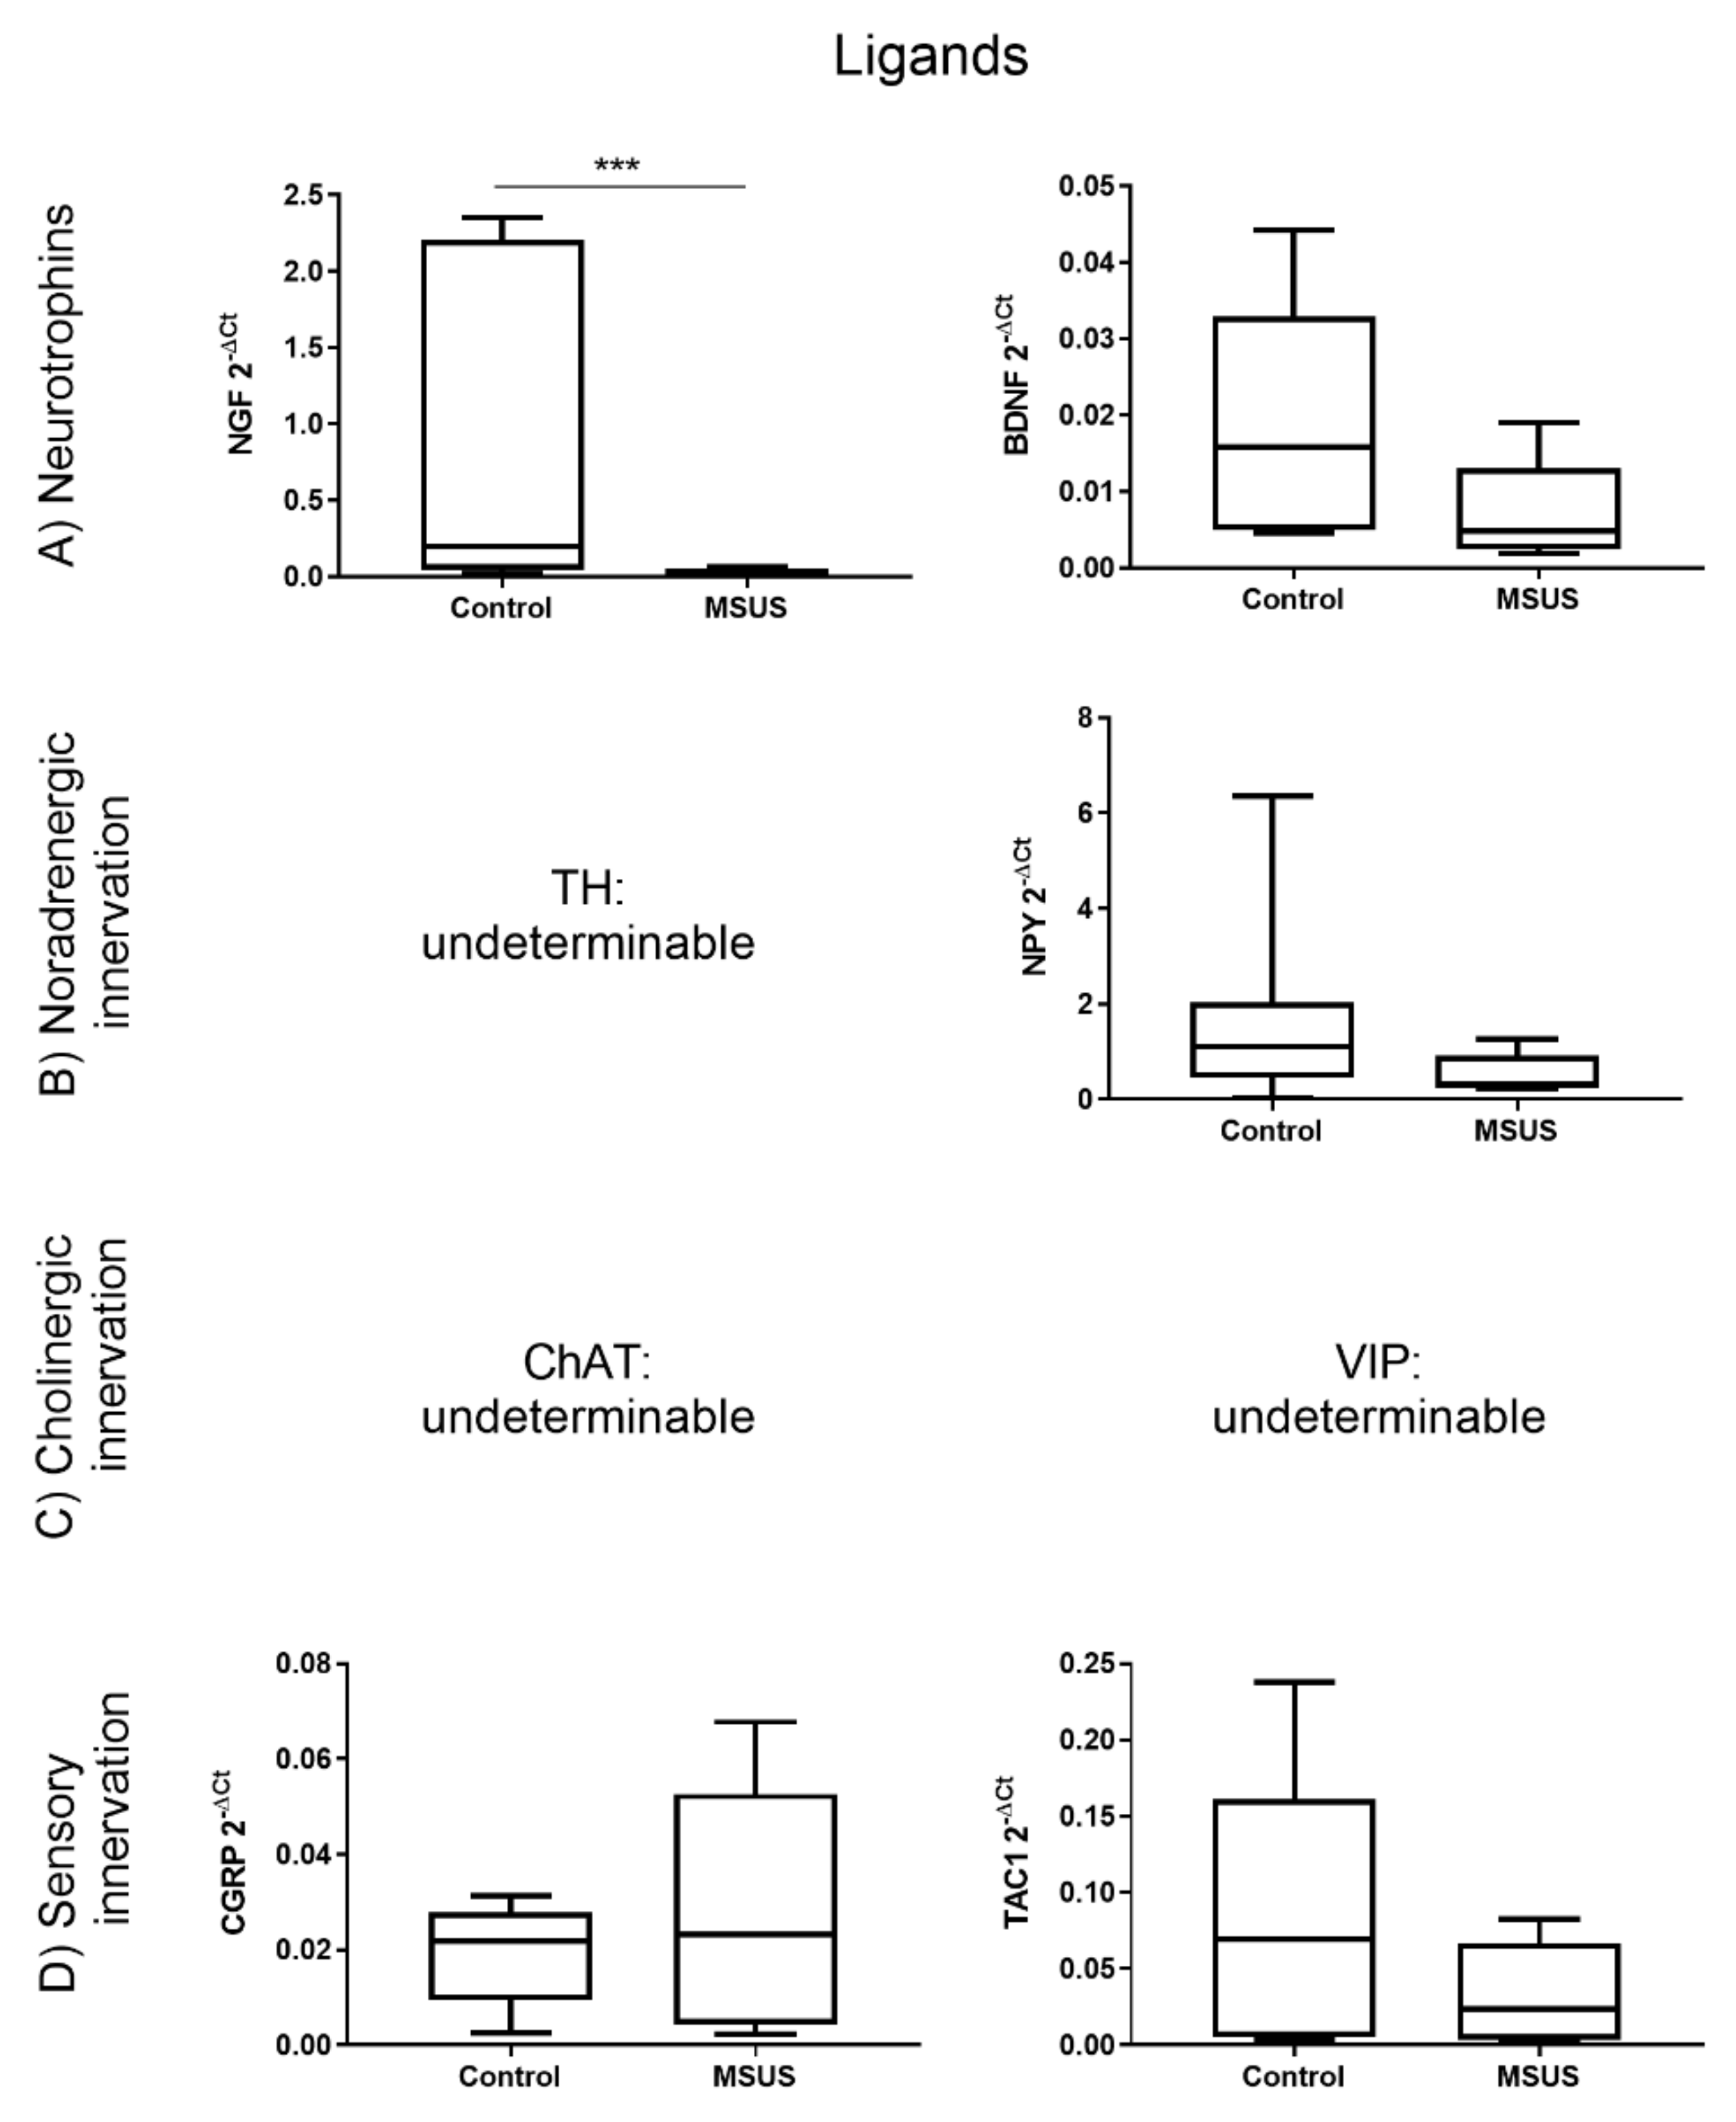
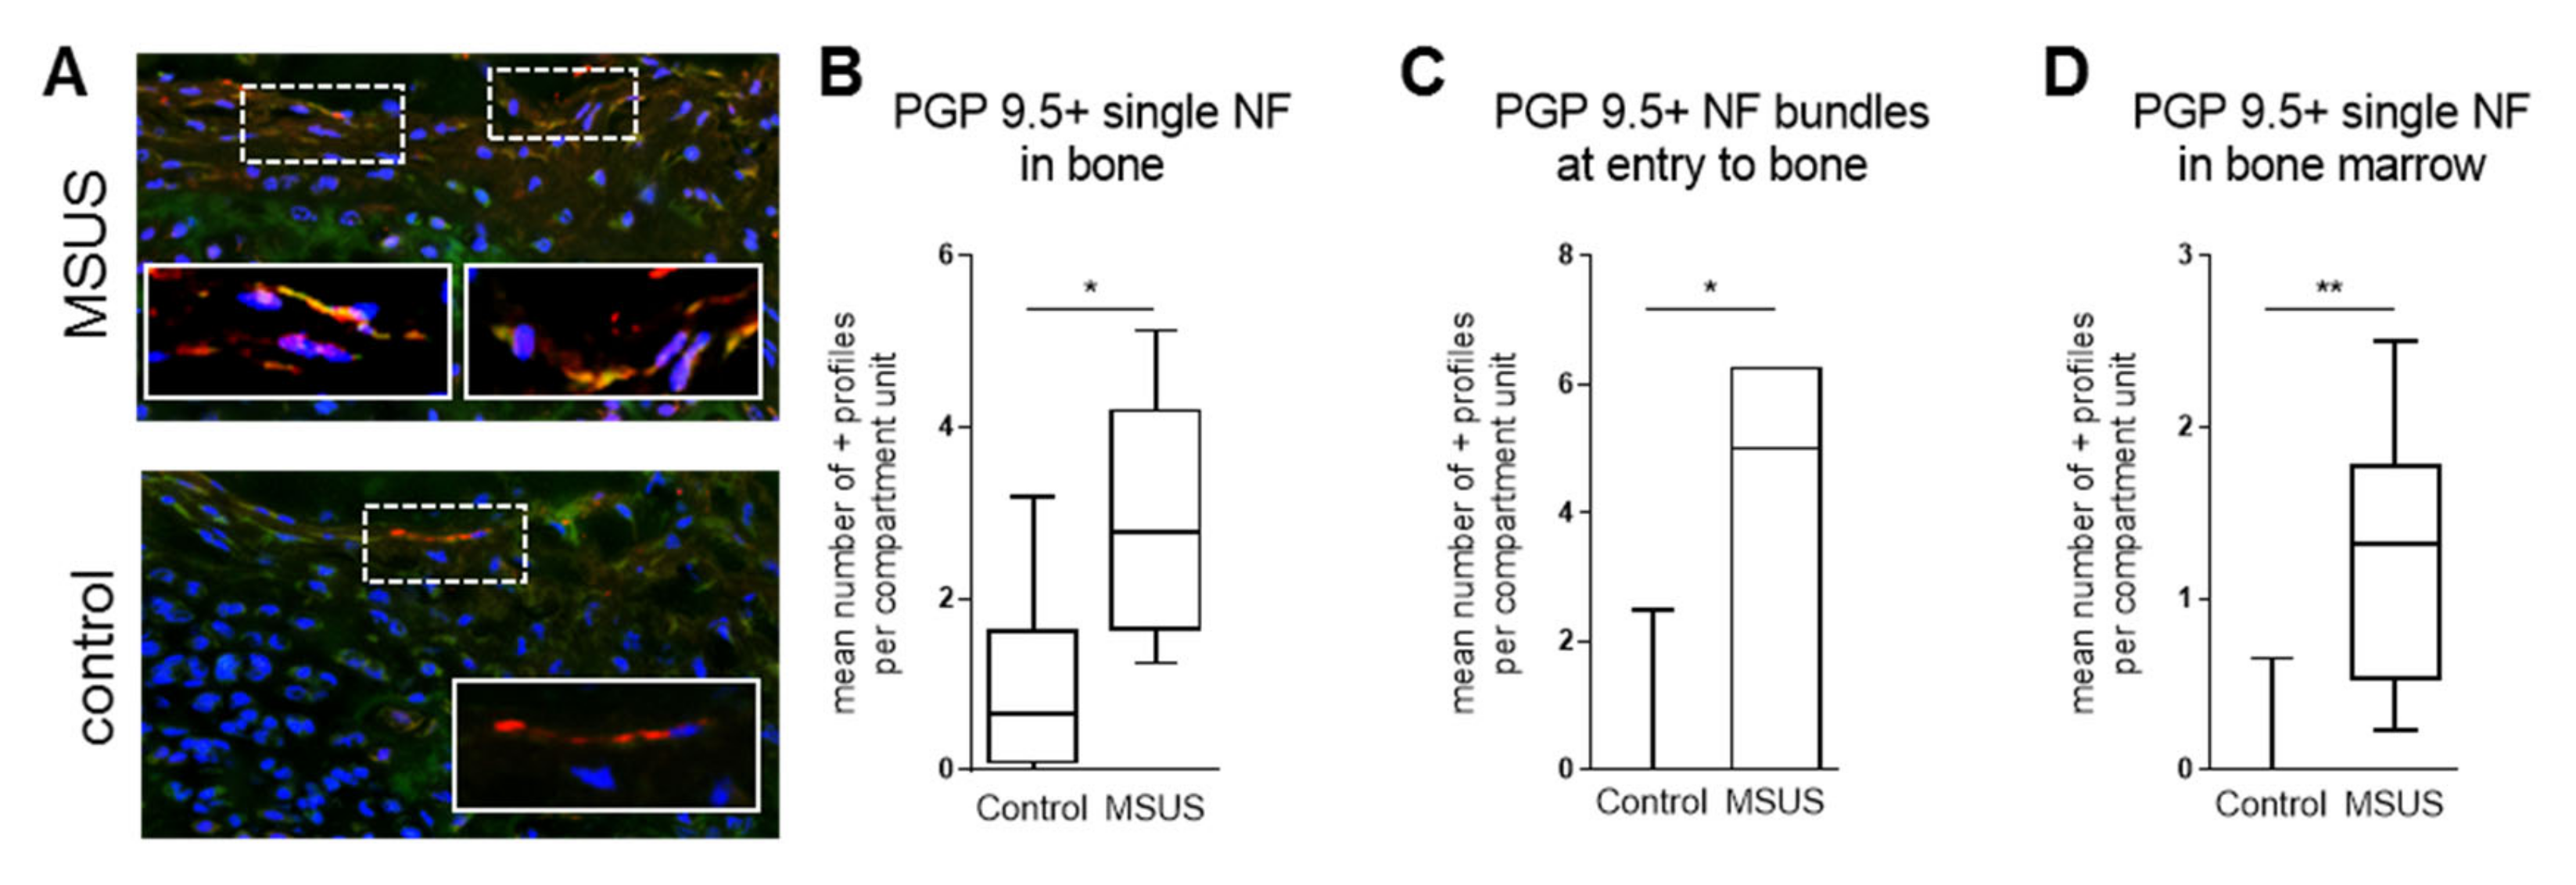
2.1.1. Bone innervation and Neuronal Mediators
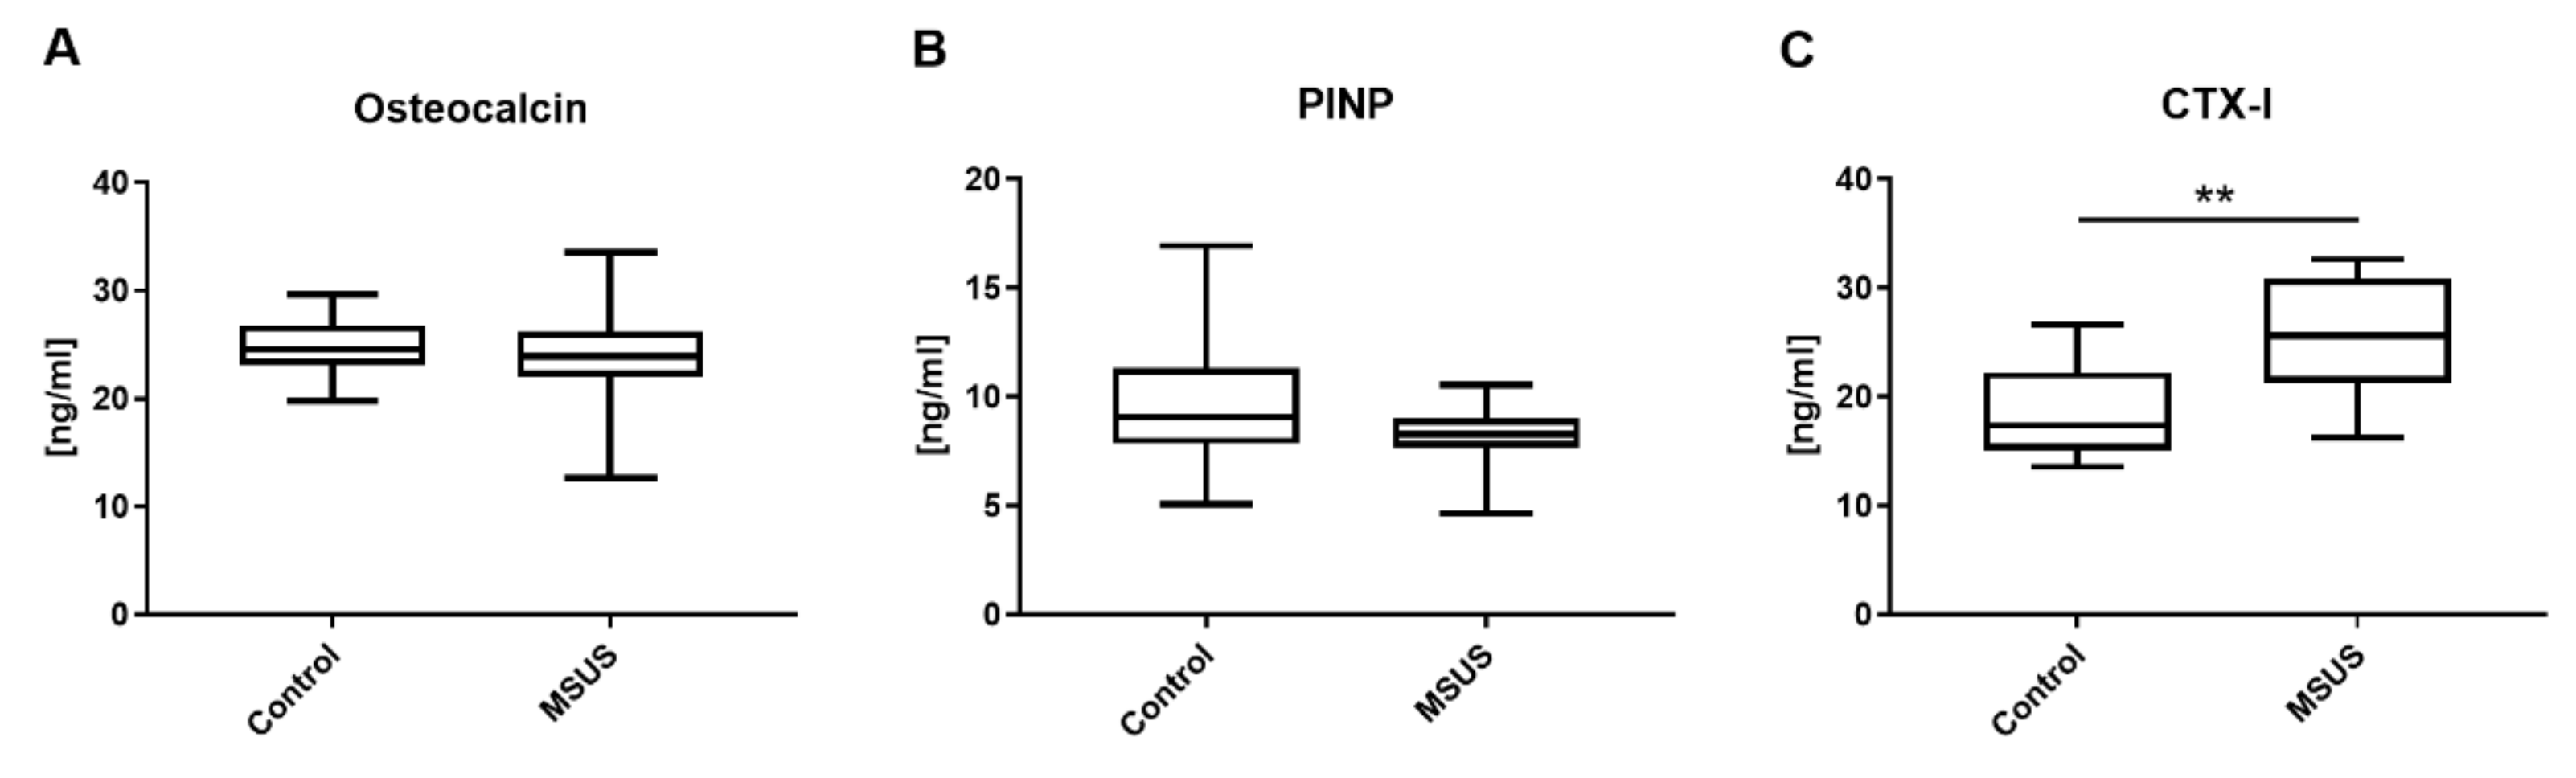
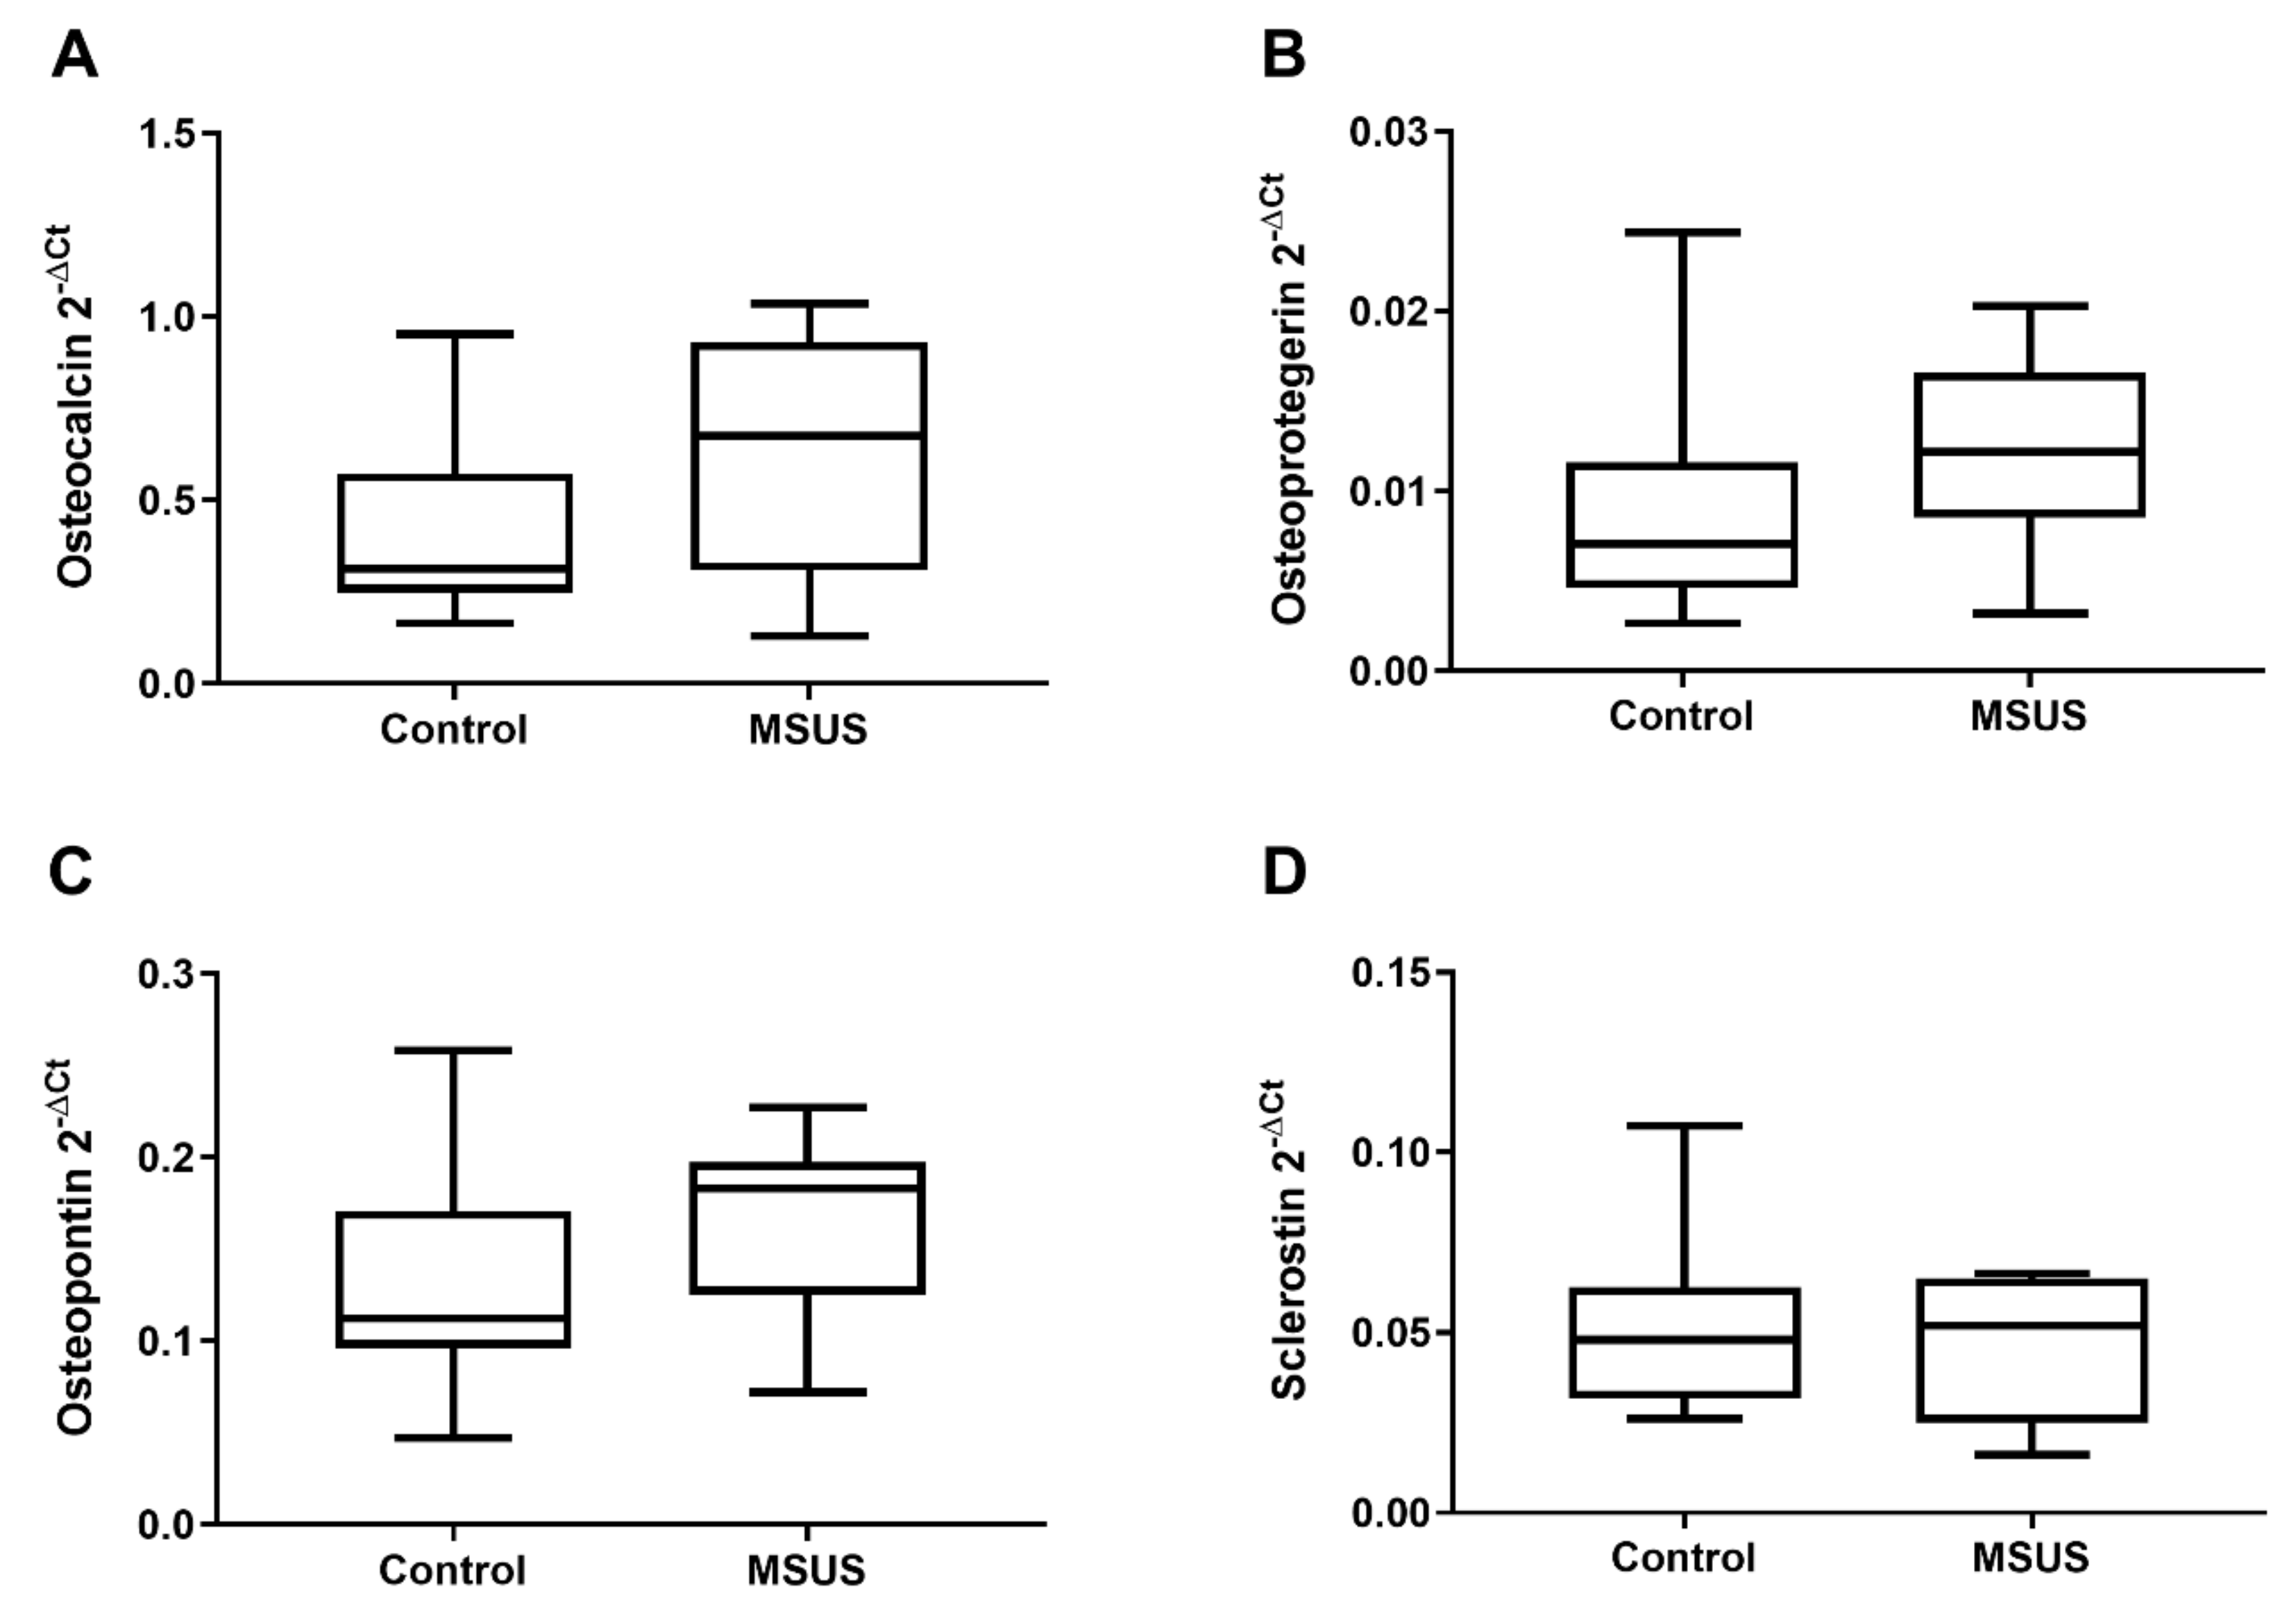
2.1.2. Bone Metabolic Parameters
2.1.3. Bone Microarchitecture
2.2. Human Study
2.2.1. Descriptive Results
2.2.2. Bone Metabolic Parameters
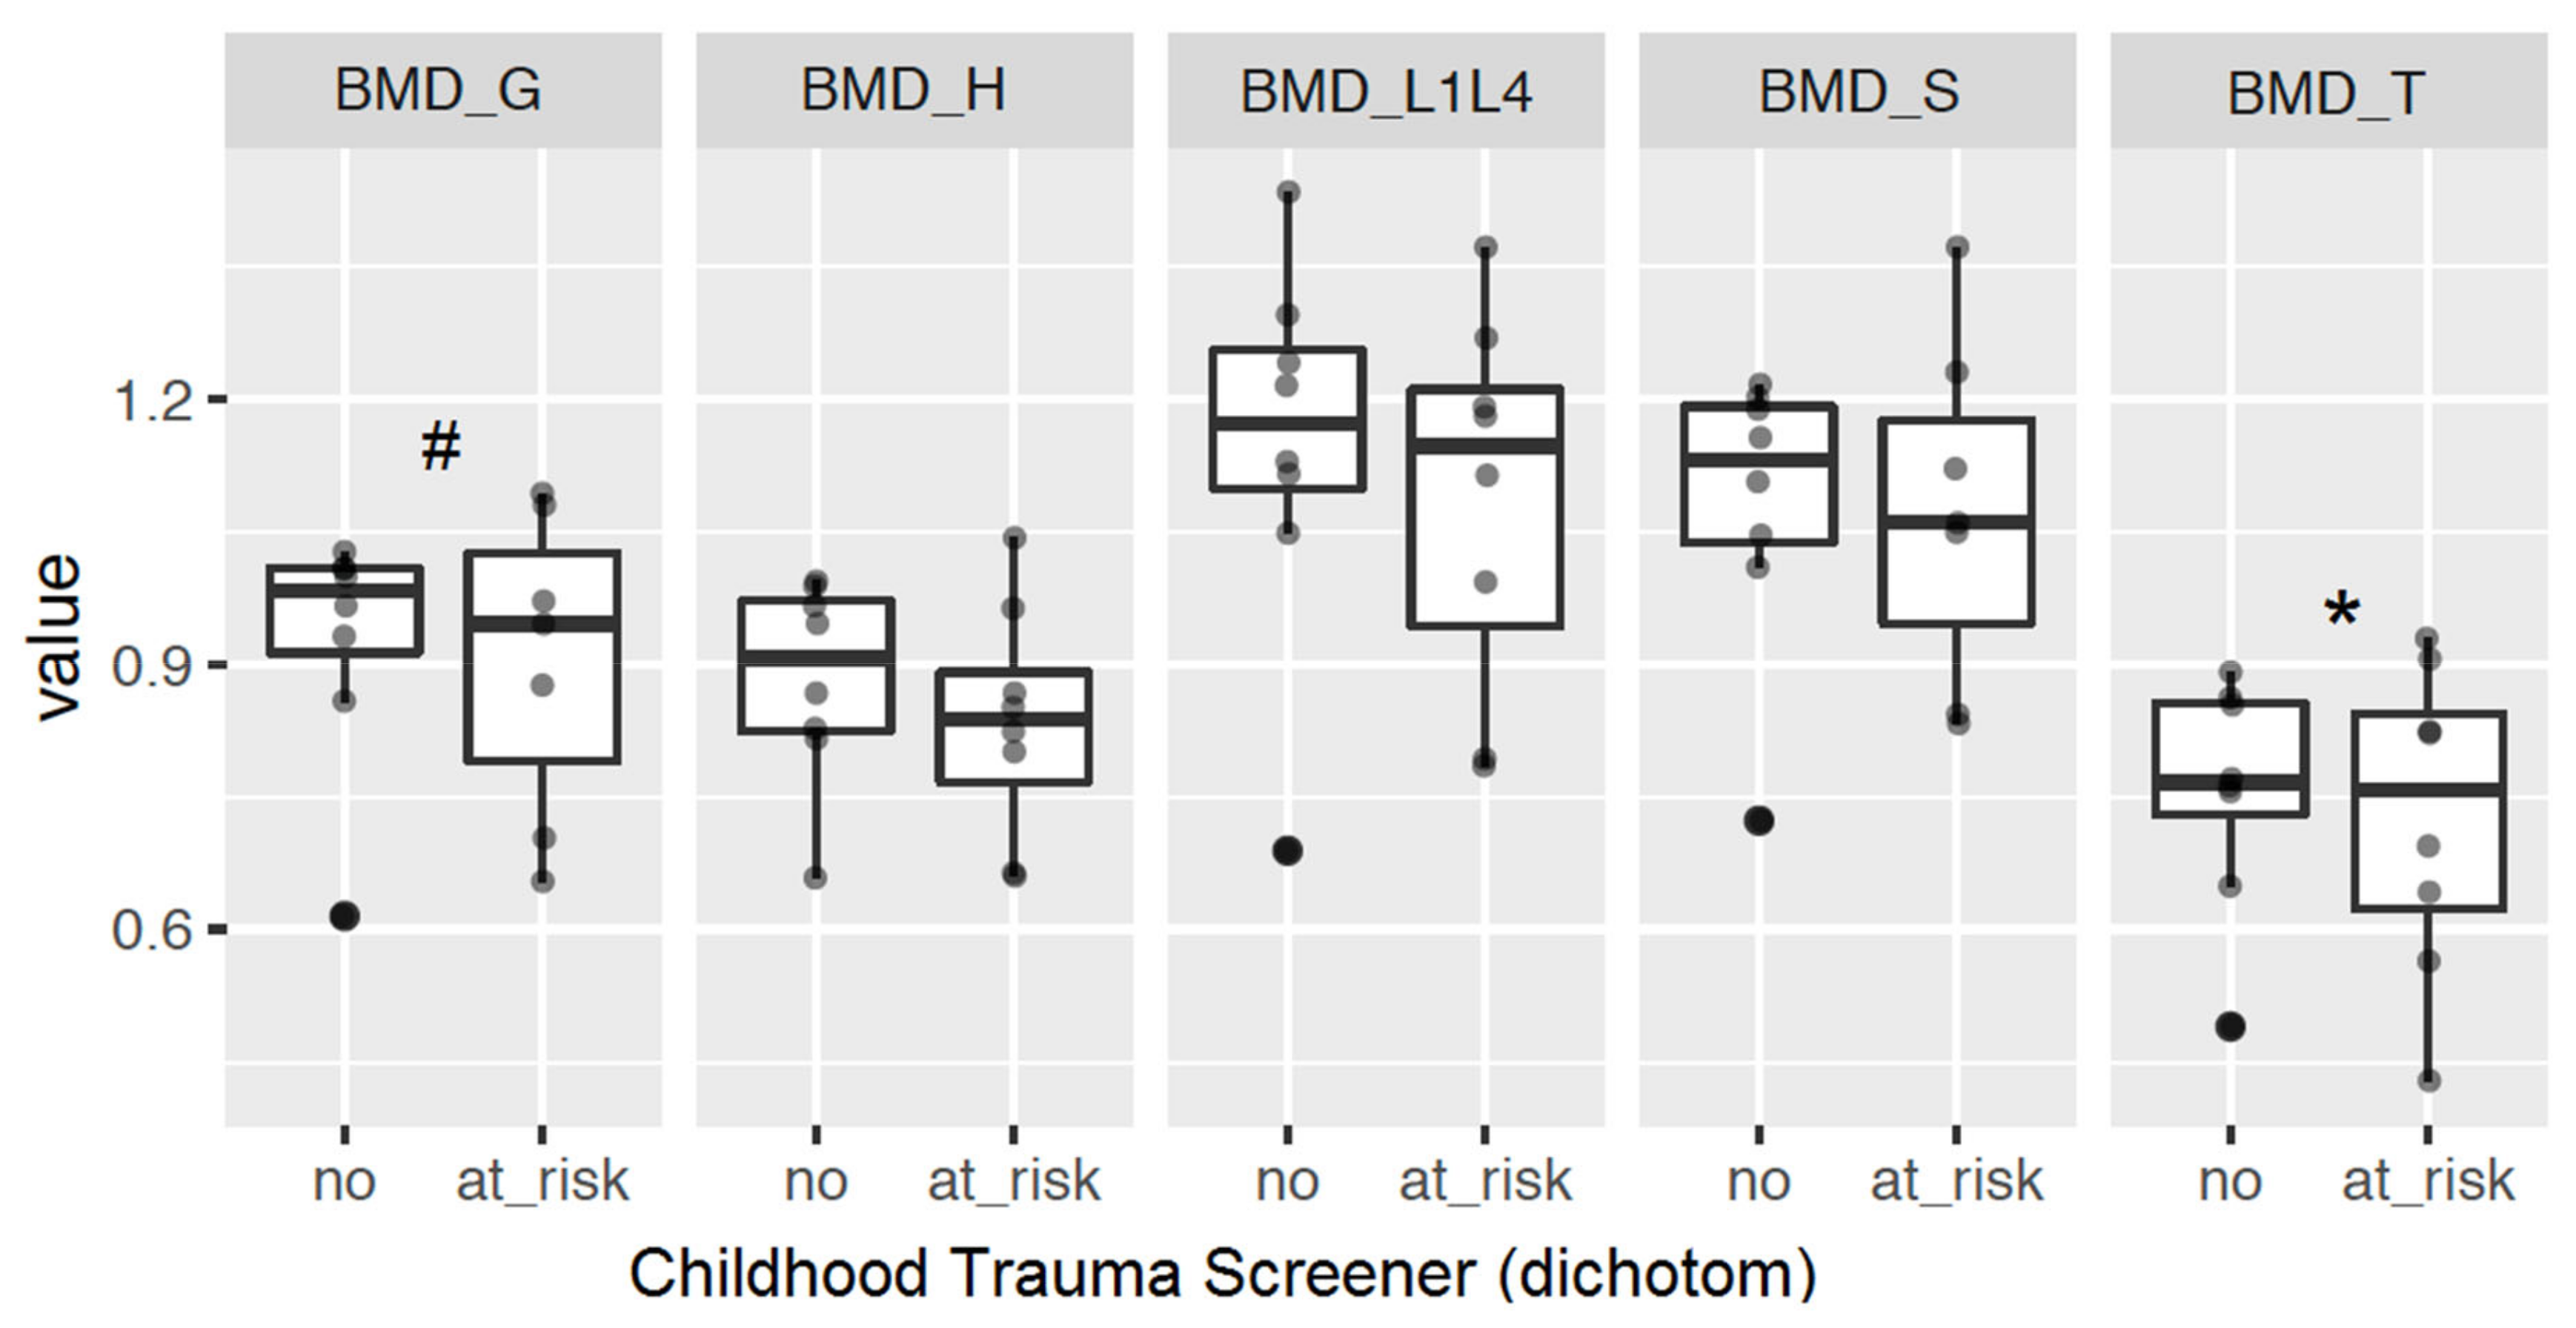
2.2.3. Bone Mineral Density
3. Discussion
4. Materials and Methods
4.1. Mouse Study
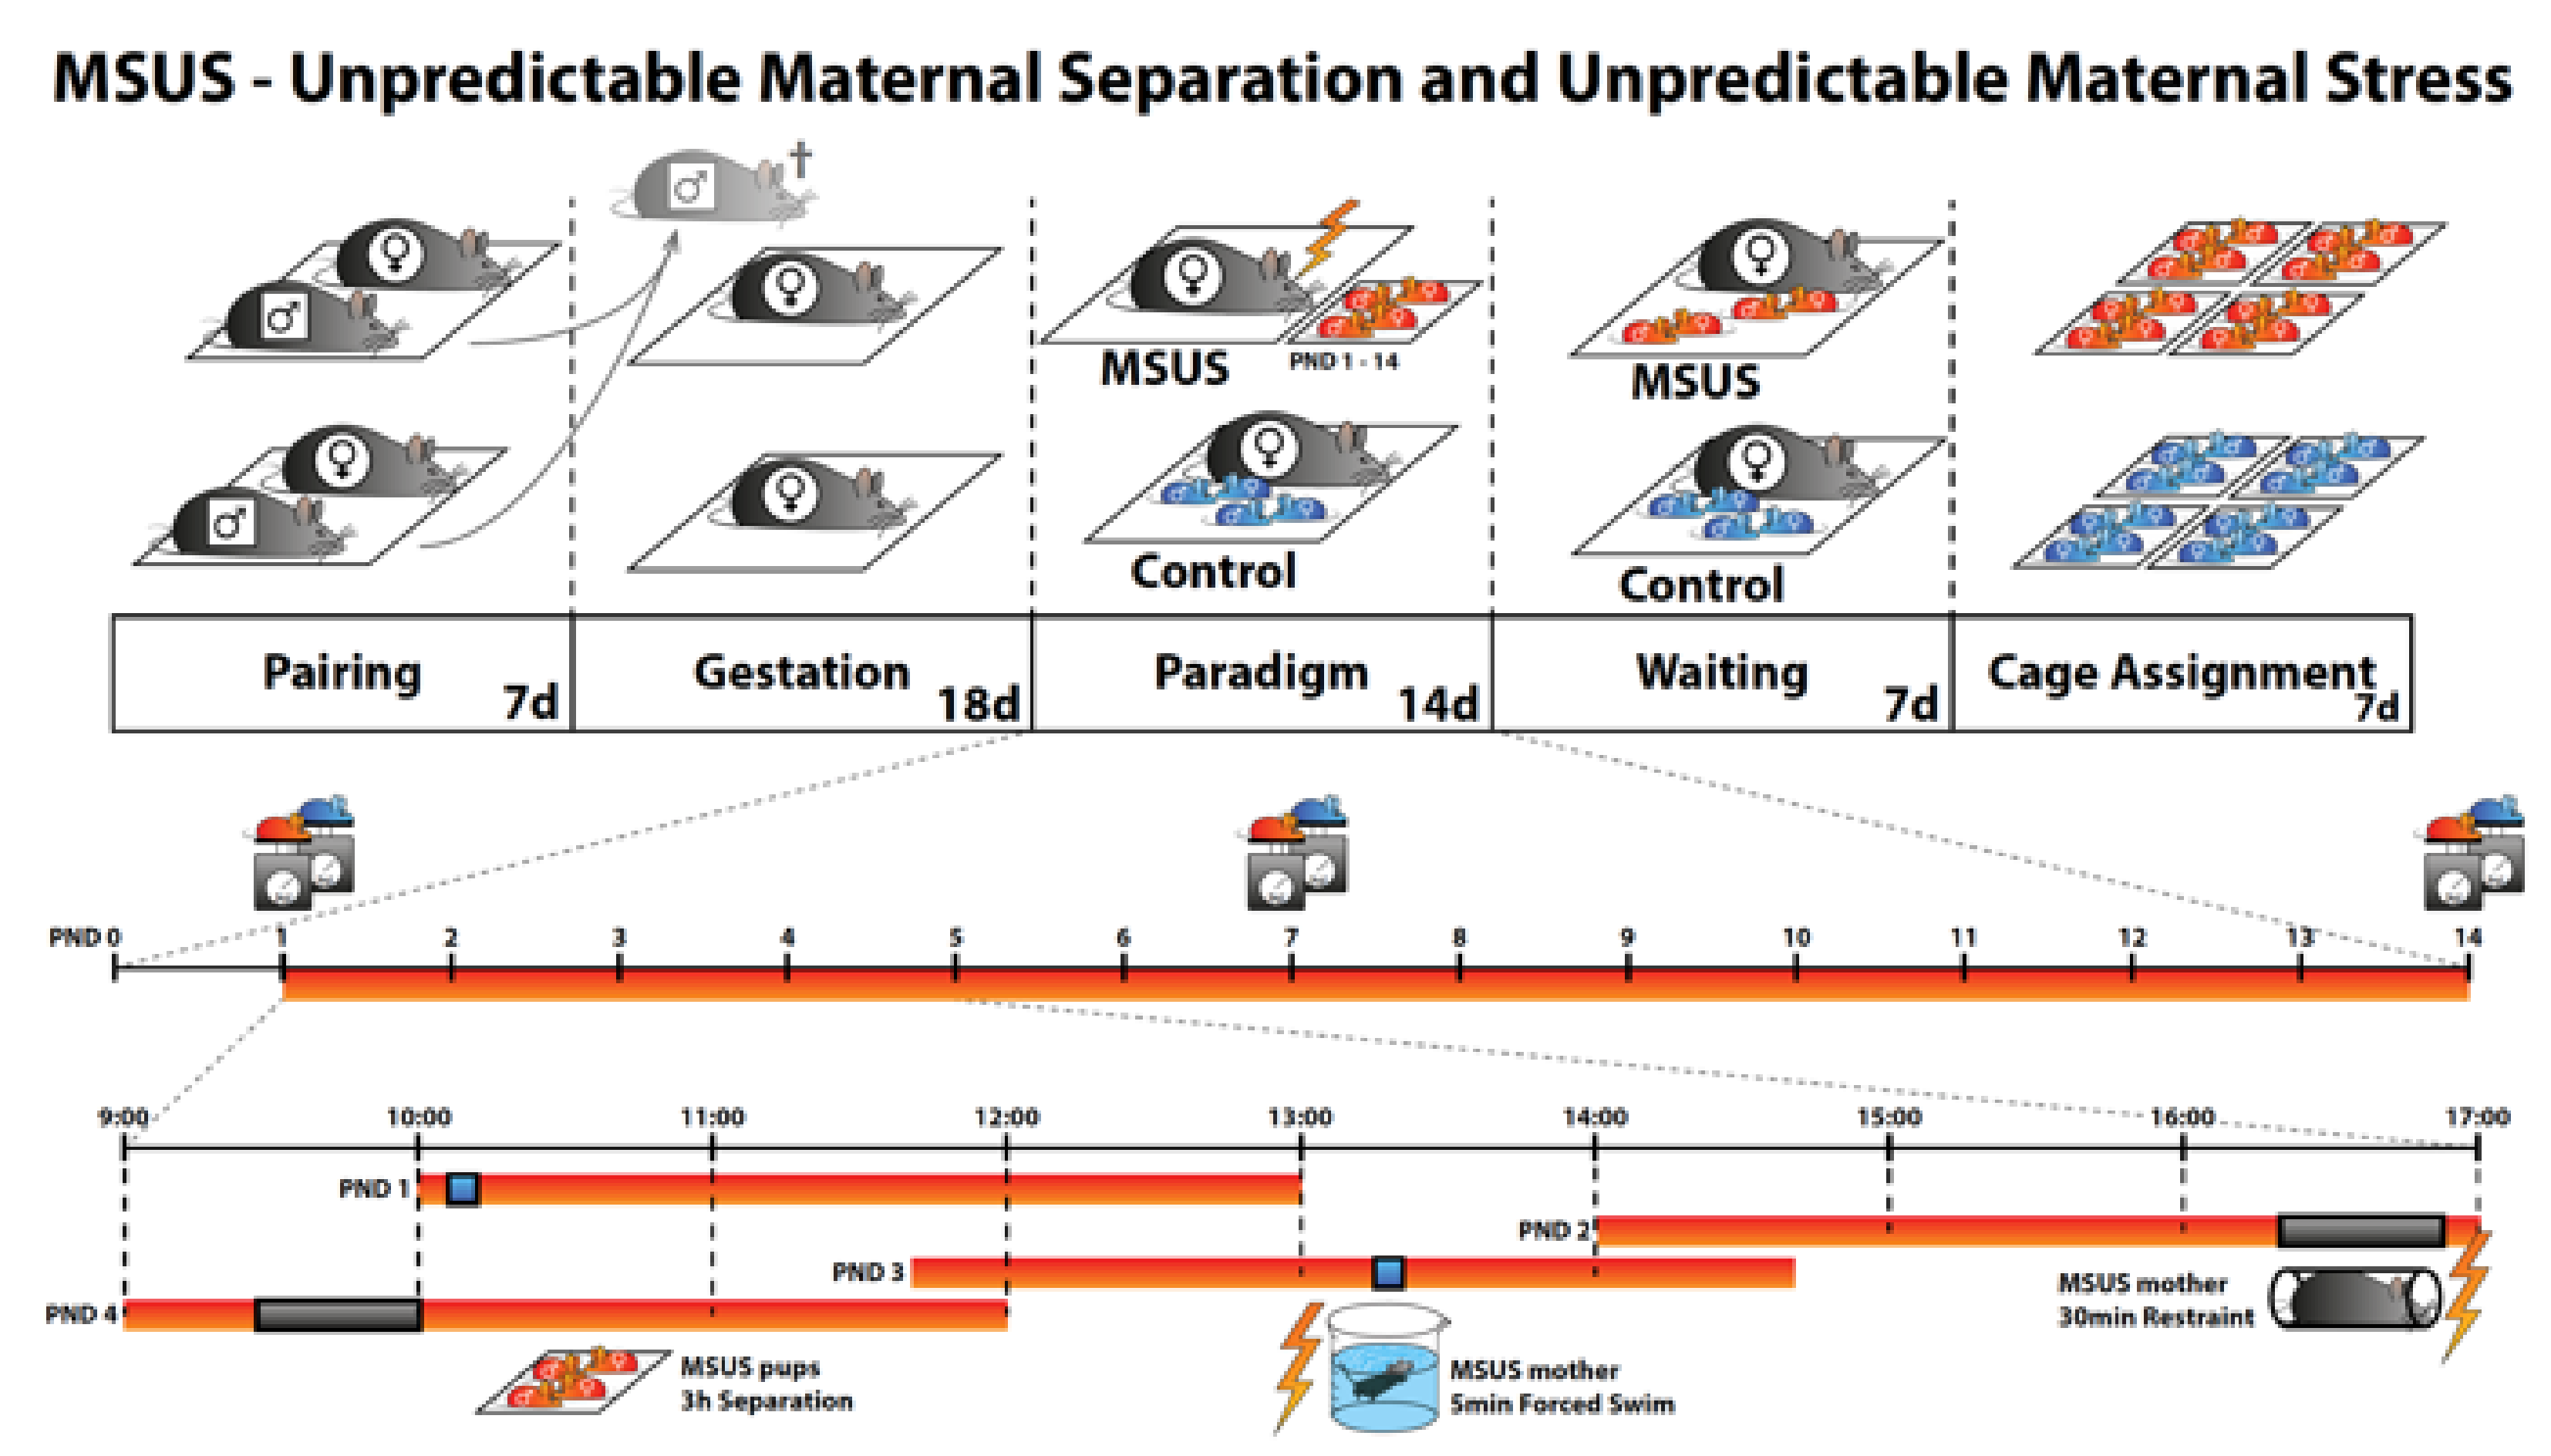
4.1.1. Animal Model
4.1.2. Collection of Serum Samples
4.1.3. Collection of Bone Samples
4.1.4. Histomorphometry of Neuronal Markers
4.1.5. qPCR for Gene Expression in Bone Samples
4.1.6. ELISA of Serum Samples
4.1.7. µCT of Bone Samples
4.2. Human Study
4.2.1. Participants
4.2.2. Study Procedure
4.2.3. Psychometric Measures
4.2.4. Serum Bone Marker Measurement
4.2.5. DXA Measurement
4.3. Statistical Analysis
Supplementary Materials
Author Contributions
Funding
Acknowledgments
Conflicts of Interest
Abbreviations
| ADRB2 | adrenoceptor beta 2 |
| ANCOVA | analysis of covariance |
| AVD | apparent volume density |
| BDI-II | Beck Depression Inventory Revision |
| BDNF | brain derived neurotrophic factor |
| BMD | bone mineral density |
| BMD_G | bone mineral density general |
| BMD_H | bone mineral density collum femoris |
| BMD_L1L4 | bone mineral density lumbar vertebralis bodies 1–4 |
| BMD_S | bone mineral density corpus femoris |
| BMD_T | bone mineral density trochanter major |
| BV | bone volume |
| BS | specific bone surface |
| CGRP | calcitonin gene related peptide |
| ChAT | choline acetyltransferase |
| CHRNA7 | cholinergic receptor nicotinic alpha 7 subunit |
| CTQ | Childhood Trauma Questionnaire |
| CTS | Childhood Trauma Screener |
| CTX-I | c-terminal telopeptide of type I collagen |
| Ct.Ar | cortical area fraction |
| Ct.Th | cortical thickness |
| DAPI | 4′,6-diamidino-2-phenylindole |
| dCt | delta Ct |
| DEPREHA | [Der Einfluss unterschiedlicher Behandlungs-settings auf den Therapieerfolg bei Patienten mit depressiven Erkrankungen in der Rehabilitation] |
| DXA | dual energy X-ray absorptiometry |
| ECLIA | electrochemiluminescence immunoassays |
| ECM | extracellular matrix |
| ELISA | enzyme-linked immunosorbent assay |
| FITC | fluorescein isothiocyanate |
| GAP 43 | growth associated protein 43 |
| HPA | hypothalamic pituitary adrenal |
| ICD-10 | International Classification of Diseases Version 10 |
| IgG1 | immunoglobulin G |
| ILE | Inventory of Stressful Life Events |
| ILE child | Inventory of Stressful Life Events; life events during childhood ≤12 years |
| μCT | micro-computed tomography |
| M | mean |
| MV | marrow volume |
| MSUS | maternal separation and unpredictable stress |
| mRNA | messenger ribonucleic acid |
| NF | nerve fibers |
| NGF | nerve growth factor |
| NPY | neuropeptide Y |
| NPYR1 | neuropeptide Y receptor 1 |
| OC | osteocalcin |
| qPCR | quantitative polymerase chain reaction |
| PBSPGP 9.5 | phosphate buffered salineprotein gene product 9.5 |
| PINP | procollagen type 1 N-terminal propeptide |
| PND | postnatal day |
| RAMP1 | receptor activity modifying protein 1 |
| SAM | senescence-accelerated mouse |
| SD | standard deviation |
| SP | substance P |
| TAC1 | tachykinin 1 |
| TACR1 | tachykinin receptor 1 |
| Tb.N | trabecular number |
| Tb.Sp | trabecular spacing |
| Tb.Th | trabecular thickness |
| TH | tyrosine hydroxylase |
| TRKA | tropomyosin receptor kinase A |
| Tt.Ar | total area |
| TRKB | tropomyosin receptor kinase B |
| TV | total volume |
| VIP | vasoactive intestinal peptide |
| VIPR1 | vasoactive intestinal peptide receptor 1 |
References
- Wippert, P.M.; Rector, M.; Kuhn, G.; Wuertz-Kozak, K. Stress and Alterations in Bones: An interdisciplinary Perspective. Front. Endocrinol. 2017, 8, 96. [Google Scholar] [CrossRef] [Green Version]
- Grassel, S. The role of peripheral nerve fibers and their neurotransmitters in cartilage and bone physiology and pathophysiology. Arthritis Res. Ther. 2014, 16, 485. [Google Scholar] [CrossRef] [PubMed] [Green Version]
- Mattia, C.; Coluzzi, F.; Celidonio, L.; Vellucci, R. Bone pain mechanism in osteoporosis: A narrative review. Clin. Cases Miner. Bone Metab. 2016, 13, 97–100. [Google Scholar] [CrossRef]
- McEwen, B.S.; Nasca, C.; Gray, J.D. Stress effects on neuronal structure: Hippocampus, amygdala, and prefrontal cortex. Neuropsychopharmacology 2016, 41, 3–23. [Google Scholar] [CrossRef] [PubMed] [Green Version]
- Wippert, P.M.; Block, A.; Mansuy, I.M.; Peters, E.M.J.; Rose, M.; Rapp, M.A.; Huppertz, A.; Wuertz-Kozak, K. Alterations in bone homeostasis and microstructure related to depression and allostatic load. Psychother. Psychosom. 2019, 88, 383–385. [Google Scholar] [CrossRef]
- Asada, K.; Obata, K.; Horiguchi, K.; Takaki, M. Age-related changes in afferent responses in sensory neurons to mechanical stimulation of osteoblasts in coculture system. Am. J. Physiol. Cell Physiol. 2012, 302, C757–C765. [Google Scholar] [CrossRef] [Green Version]
- Takahashi, N.; Matsuda, Y.; Sato, K.; de Jong, P.R.; Bertin, S.; Tabeta, K.; Yamazaki, K. Neuronal TRPV1 activation regulates alveolar bone resorption by suppressing osteoclastogenesis via CGRP. Sci. Rep. 2016, 6, 29294. [Google Scholar] [CrossRef]
- Mach, D.B.; Rogers, S.D.; Sabino, M.C.; Luger, N.M.; Schwei, M.J.; Pomonis, J.D.; Keyser, C.P.; Clohisy, D.R.; Adams, D.J.; O’Leary, P.; et al. Origins of skeletal pain: Sensory and sympathetic innervation of the mouse femur. Neuroscience 2002, 113, 155–166. [Google Scholar] [CrossRef]
- Chartier, S.R.; Mitchell, S.A.T.; Majuta, L.A.; Mantyh, P.W. The changing sensory and sympathetic innervation of the young, adult and aging mouse femur. Neuroscience 2018, 387, 178–190. [Google Scholar] [CrossRef] [PubMed]
- Alves, C.J.; Alencastre, I.S.; Neto, E.; Ribas, J.; Ferreira, S.; Vasconcelos, D.M.; Sousa, D.M.; Summavielle, T.; Lamghari, M. Bone injury and repair trigger central and peripheral NPY neuronal pathways. PLoS ONE 2016, 11, e0165465. [Google Scholar] [CrossRef] [Green Version]
- Jiao, K.; Niu, L.; Xu, X.; Liu, Y.; Li, X.; Tay, F.R.; Wang, M. Norepinephrine Regulates Condylar Bone Loss via Comorbid Factors. J. Dent Res. 2015, 94, 813–820. [Google Scholar] [CrossRef] [PubMed]
- Yirmiya, R.; Goshen, I.; Bajayo, A.; Kreisel, T.; Feldman, S.; Tam, J.; Trembovier, V.; Csernus, V.; Shohami, E.; Bab, I. Depression induces bone loss through stimulation of the sympathetic nervous system. Proc. Natl. Acad. Sci. USA 2006, 103, 16876–16881. [Google Scholar] [CrossRef] [PubMed] [Green Version]
- Furuzawa, M.; Chen, H.Y.; Fujiwara, S.; Yamada, K.; Kubo, K. Chewing ameliorates chronic mild stress-induced bone loss in senescence-accelerated mouse (SAMP8), a murine model of senile osteoporosis. Exp. Gerontol. 2014, 55, 12–18. [Google Scholar] [CrossRef] [PubMed]
- Tomlinson, R.E.; Li, Z.; Zhang, Q.; Goh, B.C.; Li, Z.; Thorek, D.L.J.; Rajbhandari, L.; Brushart, T.M.; Minichiello, L.; Zhou, F.; et al. NGF-TrkA signaling by sensory nerves coordinates the vascularization and ossification of developing endochondral bone. Cell Rep. 2016, 16, 2723–2735. [Google Scholar] [CrossRef] [Green Version]
- Chen, W.H.; Mao, C.Q.; Zhuo, L.L.; Ong, J.L. Beta-nerve growth factor promotes neurogenesis and angiogenesis during the repair of bone defects. Neural Regen. Res. 2015, 10, 1159–1165. [Google Scholar] [CrossRef]
- Zhuang, Y.F.; Li, J. Serum EGF and NGF levels of patients with brain injury and limb fracture. Asian Pac. J. Trop. Med. 2013, 6, 383–386. [Google Scholar] [CrossRef] [Green Version]
- Sabsovich, I.; Wei, T.; Guo, T.Z.; Zhao, R.; Shi, X.; Li, X.; Yeomans, D.C.; Klyukinov, M.; Kingery, W.S.; Clark, J.D. Effect of anti-NGF antibodies in a rat tibia fracture model of complex regional pain syndrome type I. Pain 2008, 138, 47–60. [Google Scholar] [CrossRef] [Green Version]
- Guo, T.Z.; Wei, T.P.; Shi, X.Y.; Li, W.W.; Hou, S.Y.; Wang, L.P.; Tsujikawa, K.; Rice, K.C.; Cheng, K.J.; Clark, D.J.; et al. Neuropeptide deficient mice have attenuated nociceptive, vascular, and inflammatory changes in a tibia fracture model of complex regional pain syndrome. Mol. Pain 2012, 8, 85. [Google Scholar] [CrossRef] [Green Version]
- Sang, X.G.; Wang, Z.Y.; Cheng, L.; Liu, Y.H.; Li, Y.G.; Qin, T.; Di, K. Analysis of the mechanism by which nerve growth factor promotes callus formation in mice with tibial fracture. Exp. Ther. Med. 2017, 13, 1376–1380. [Google Scholar] [CrossRef] [Green Version]
- Grills, B.L.; Schuijers, J.A.; Ward, A.R. Topical application of nerve growth factor improves fracture healing in rats. J. Orthop. Res. 1997, 15, 235–242. [Google Scholar] [CrossRef]
- Hemingway, F.; Taylor, R.; Knowles, H.J.; Athanasou, N.A. RANKL-independent human osteoclast formation with APRIL, BAFF, NGF, IGF I and IGF II. Bone 2011, 48, 938–944. [Google Scholar] [CrossRef] [PubMed]
- Camerino, C.; Conte, E.; Caloiero, R.; Fonzino, A.; Carratu, M.; Lograno, M.D.; Tricarico, D. Evaluation of Short and Long Term Cold Stress Challenge of Nerve Grow Factor, Brain-Derived Neurotrophic Factor, Osteocalcin and Oxytocin mRNA Expression in BAT, Brain, Bone and Reproductive Tissue of Male Mice Using Real-Time PCR and Linear Correlation Analysis. Front. Physiol. 2017, 8, 1101. [Google Scholar] [CrossRef] [PubMed] [Green Version]
- Liu, Q.; Lei, L.; Yu, T.; Jiang, T.; Kang, Y. Effect of Brain-Derived Neurotrophic Factor on the Neurogenesis and Osteogenesis in Bone Engineering. Tissue Eng. Part A 2018, 24, 1283–1292. [Google Scholar] [CrossRef] [PubMed]
- Yang, M.; Lu, B.J.; Duan, Y.Y.; Chen, X.F.; Ma, J.G.; Guo, Y. Genetics association study and functional analysis on osteoporosis susceptibility gene BDNF. Yi Chuan 2017, 39, 726–736. [Google Scholar] [CrossRef] [PubMed]
- Kauschke, V.; Gebert, A.; Calin, M.; Eckert, J.; Scheich, S.; Heiss, C.; Lips, K.S. Effects of new beta-type Ti-40Nb implant materials, brain-derived neurotrophic factor, acetylcholine and nicotine on human mesenchymal stem cells of osteoporotic and non osteoporotic donors. PLoS ONE 2018, 13, e0193468. [Google Scholar] [CrossRef] [PubMed]
- Camerino, C.; Conte, E.; Cannone, M.; Caloiero, R.; Fonzino, A.; Tricarico, D. Nerve Growth Factor, Brain-Derived Neurotrophic Factor and Osteocalcin Gene Relationship in Energy Regulation, Bone Homeostasis and Reproductive Organs Analyzed by mRNA Quantitative Evaluation and Linear Correlation Analysis. Front. Physiol. 2016, 7, 456. [Google Scholar] [CrossRef] [PubMed] [Green Version]
- Picard, M.; Juster, R.P.; McEwen, B.S. Mitochondrial allostatic load puts the “gluc” back in glucocorticoids. Nat. Rev. Endocrinol. 2014, 10, 303–310. [Google Scholar] [CrossRef]
- Picard, M.; McEwen, B.S. Psychological Stress and Mitochondria: A Conceptual Framework. Psychosom. Med. 2018, 80, 126–140. [Google Scholar] [CrossRef]
- Kelly, R.R.; McDonald, L.T.; Jensen, N.R.; Sidles, S.J.; LaRue, A.C. Impacts of Psychological Stress on Osteoporosis: Clinical Implications and Treatment Interactions. Front. Psychiatry 2019, 10, 200. [Google Scholar] [CrossRef]
- Lee, S.H.; Mastronardi, C.A.; Li, R.W.; Paz-Filho, G.; Dutcher, E.G.; Lewis, M.D.; Vincent, A.D.; Smith, P.N.; Bornstein, S.R.; Licinio, J.; et al. Short-term antidepressant treatment has long-lasting effects, and reverses stress-induced decreases in bone features in rats. Transl. Psychiatry 2019, 9, 10. [Google Scholar] [CrossRef] [Green Version]
- He, J.-Y.; Zheng, X.-F.; Jiang, L.-S. Autonomic control of bone formation: Its clinical relevance. Handb. Clin. Neurol. 2013, 117, 161–171. [Google Scholar] [CrossRef]
- Schiavone, S.; Morgese, M.G.; Mhillaj, E.; Bove, M.; De Giorgi, A.; Cantatore, F.P.; Camerino, C.; Tucci, P.; Maffulli, N.; Cuomo, V.; et al. Chronic Psychosocial Stress Impairs Bone Homeostasis: A Study in the Social Isolation Reared Rat. Front. Pharmacol. 2016, 7, 152. [Google Scholar] [CrossRef] [PubMed]
- Huang, W.S.; Hsu, J.W.; Huang, K.L.; Bai, Y.M.; Su, T.P.; Li, C.T.; Lin, W.C.; Chen, T.J.; Tsai, S.J.; Liou, Y.J.; et al. Post-traumatic stress disorder and risk of osteoporosis: A nationwide longitudinal study. Stress Health 2018, 34, 440–445. [Google Scholar] [CrossRef] [PubMed]
- Gershon, A.; Sudheimer, K.; Tirouvanziam, R.; Williams, L.M.; O’Hara, R. The long-term impact of early adversity on late-life psychiatric disorders. Curr. Psychiatry Rep. 2013, 15, 352. [Google Scholar] [CrossRef] [PubMed]
- Raymond, C.; Marin, M.F.; Majeur, D.; Lupien, S. Early child adversity and psychopathology in adulthood: HPA axis and cognitive dysregulations as potential mechanisms. Prog. Neuropsychopharmacol. Biol. Psychiatry 2018, 85, 152–160. [Google Scholar] [CrossRef] [PubMed]
- Shonkoff, J.P.; Boyce, W.T.; McEwen, B.S. Neuroscience, molecular biology, and the childhood roots of health disparities: Building a new framework for health promotion and disease prevention. JAMA 2009, 301, 2252–2259. [Google Scholar] [CrossRef] [PubMed]
- Falgares, G.; Marchetti, D.; Manna, G.; Musso, P.; Oasi, O.; Kopala-Sibley, D.C.; De Santis, S.; Verrocchio, M.C. Childhood Maltreatment, Pathological Personality Dimensions, and Suicide Risk in Young Adults. Front. Psychol. 2018, 9, 806. [Google Scholar] [CrossRef]
- Lindert, J.; von Ehrenstein, O.S.; Grashow, R.; Gal, G.; Braehler, E.; Weisskopf, M.G. Sexual and physical abuse in childhood is associated with depression and anxiety over the life course: Systematic review and meta-analysis. Int. J. Public Health 2014, 59, 359–372. [Google Scholar] [CrossRef]
- Infurna, M.R.; Reichl, C.; Parzer, P.; Schimmenti, A.; Bifulco, A.; Kaess, M. Associations between depression and specific childhood experiences of abuse and neglect: A meta-analysis. J. Affect Disord. 2016, 190, 47–55. [Google Scholar] [CrossRef]
- Nanni, V.; Uher, R.; Danese, A. Childhood Maltreatment Predicts Unfavorable Course of Illness and Treatment Outcome in Depression: A Meta-Analysis. Am. J. Psychiat. 2012, 169, 141–151. [Google Scholar] [CrossRef] [Green Version]
- Mezuk, B.; Eaton, W.W.; Golden, S.H. Depression and osteoporosis: Epidemiology and potential mediating pathways. Osteoporos. Int. 2008, 19, 1–12. [Google Scholar] [CrossRef] [PubMed] [Green Version]
- Cizza, G.; Primma, S.; Coyle, M.; Gourgiotis, L.; Csako, G. Depression and Osteoporosis: A Research Synthesis with Meta-Analysis. Horm. Metab. Res. 2010, 42, 467–482. [Google Scholar] [CrossRef] [PubMed] [Green Version]
- Azuma, K.; Adachi, Y.; Hayashi, H.; Kubo, K.Y. Chronic Psychological Stress as a Risk Factor of Osteoporosis. J. UOEH 2015, 37, 245–253. [Google Scholar] [CrossRef] [PubMed]
- Williams, L.J.; Pasco, J.A.; Jackson, H.; Kiropoulos, L.; Stuart, A.L.; Jacka, F.N.; Berk, M. Depression as a risk factor for fracture in women: A 10 year longitudinal study. J. Affect Disord. 2016, 192, 34–40. [Google Scholar] [CrossRef]
- Furlan, P.M.; Ten Have, T.; Cary, M.; Zemel, B.; Wehrli, F.; Katz, I.R.; Gettes, D.R.; Evans, D.L. The role of stress-induced cortisol in the relationship between depression and decreased bone mineral density. Biol. Psychiatry 2005, 57, 911–917. [Google Scholar] [CrossRef]
- Stults-Kolehmainen, M.A.; Sinha, R. The effects of stress on physical activity and exercise. Sports Med. 2014, 44, 81–121. [Google Scholar] [CrossRef]
- Yau, Y.H.; Potenza, M.N. Stress and eating behaviors. Miner. Endocrinol. 2013, 38, 255–267. [Google Scholar]
- Franklin, T.B.; Russig, H.; Weiss, I.C.; Graff, J.; Linder, N.; Michalon, A.; Vizi, S.; Mansuy, I.M. Epigenetic Transmission of the Impact of Early Stress Across Generations. Biol. Psychiatry 2010, 68, 408–415. [Google Scholar] [CrossRef]
- Schmidt, M.V. Molecular mechanisms of early life stress--lessons from mouse models. Neurosci. Biobehav. Rev. 2010, 34, 845–852. [Google Scholar] [CrossRef]
- McGowan, P.O.; Szyf, M. The epigenetics of social adversity in early life: Implications for mental health outcomes. Neurobiol. Dis. 2010, 39, 66–72. [Google Scholar] [CrossRef]
- Bohacek, J.; Mansuy, I.M. Epigenetic inheritance of disease and disease risk. Neuropsychopharmacology 2013, 38, 220–236. [Google Scholar] [CrossRef] [PubMed] [Green Version]
- Gapp, K.; Jawaid, A.; Sarkies, P.; Bohacek, J.; Pelczar, P.; Prados, J.; Farinelli, L.; Miska, E.; Mansuy, I.M. Implication of sperm RNAs in transgenerational inheritance of the effects of early trauma in mice. Nat. Neurosci. 2014, 17, 667–669. [Google Scholar] [CrossRef] [PubMed] [Green Version]
- Baldock, P.A.; Lin, S.; Zhang, L.; Karl, T.; Shi, Y.; Driessler, F.; Zengin, A.; Hormer, B.; Lee, N.J.; Wong, I.P.L.; et al. Neuropeptide Y Attenuates Stress-Induced Bone Loss Through Suppression of Noradrenaline Circuits. J. Bone Miner. Res. 2014, 29, 2238–2249. [Google Scholar] [CrossRef] [PubMed]
- Ballica, R.; Valentijn, K.; Khachatryan, A.; Guerder, S.; Kapadia, S.; Gundberg, C.; Gilligan, J.; Flavell, R.A.; Vignery, A. Targeted expression of calcitonin gene-related peptide to osteoblasts increases bone density in mice. J. Bone Miner. Res. 1999, 14, 1067–1074. [Google Scholar] [CrossRef]
- Rommel, F.R.; Raghavan, B.; Paddenberg, R.; Kummer, W.; Tumala, S.; Lochnit, G.; Gieler, U.; Peters, E.M. Suitability of Nicotinic Acetylcholine Receptor alpha7 and Muscarinic Acetylcholine Receptor 3 Antibodies for Immune Detection: Evaluation in Murine Skin. J. Histochem. Cytochem. 2015, 63, 329–339. [Google Scholar] [CrossRef]
- Sousa, D.M.; McDonald, M.M.; Mikulec, K.; Peacock, L.; Herzog, H.; Lamghari, M.; Little, D.G.; Baldock, P.A. Neuropeptide Y modulates fracture healing through Y1 receptor signaling. J. Orthop. Res. 2013, 31, 1570–1578. [Google Scholar] [CrossRef]
- Teixeira, L.; Sousa, D.M.; Nunes, A.F.; Sousa, M.M.; Herzog, H.; Lamghari, M. NPY Revealed as a Critical Modulator of Osteoblast Function In Vitro: New Insights Into the Role of Y1 and Y2 Receptors. J. Cell Biochem. 2009, 107, 908–916. [Google Scholar] [CrossRef]
- Tang, P.; Duan, C.G.; Wang, Z.; Wang, C.M.; Meng, G.L.; Lin, K.F.; Yang, Q.; Yuan, Z. NPY and CGRP Inhibitor Influence on ERK Pathway and Macrophage Aggregation during Fracture Healing. Cell Physiol. Biochem. 2017, 41, 1457–1467. [Google Scholar] [CrossRef]
- Igwe, J.C.; Jiag, X.; Paic, F.; Ma, L.; Adams, D.J.; Baldock, P.A.; Pilbeam, C.C.; Kalajzic, I. Neuropeptide Y Is Expressed by Osteocytes and Can Inhibit Osteoblastic Activity. J. Cell Biochem. 2009, 108, 621–630. [Google Scholar] [CrossRef] [Green Version]
- Allison, S.J.; Baldock, P.A.; Enriquez, R.F.; Lin, E.J.; During, M.; Gardiner, E.M.; Eisman, J.A.; Sainsbury, A.; Herzog, H. Critical Interplay Between Neuropeptide Y and Sex Steroid Pathways in Bone and Adipose Tissue Homeostasis. J. Bone Miner. Res. 2009, 24, 294–304. [Google Scholar] [CrossRef]
- Sousa, D.M.; Baldock, P.A.; Enriquez, R.F.; Zhang, L.; Sainsbury, A.; Lamghari, M.; Herzog, H. Neuropeptide Y Y1 receptor antagonism increases bone mass in mice. Bone 2012, 51, 8–16. [Google Scholar] [CrossRef] [PubMed] [Green Version]
- Ma, W.H.; Liu, Y.J.; Wang, W.; Zhang, Y.Z. Neuropeptide Y, substance P, and human bone morphogenetic protein 2 stimulate human osteoblast osteogenic activity by enhancing gap junction intercellular communication. Braz. J. Med. Biol. Res. 2015, 48, 299–307. [Google Scholar] [CrossRef] [PubMed] [Green Version]
- Long, H.; Ahmed, M.; Ackermann, P.; Stark, A.; Li, J.A. Neuropeptide Y innervation during fracture healing and remodeling. Acta Orthop. 2010, 81, 639–646. [Google Scholar] [CrossRef] [PubMed]
- Cherruau, M.; Morvan, F.O.; Schirar, A.; Saffar, J.L. Chemical sympathectomy-induced changes in TH-, VIP-, and CGRP-immunoreactive fibers in the rat mandible periosteum: Influence on bone resorption. J. Cell Physiol. 2003, 194, 341–348. [Google Scholar] [CrossRef]
- Lundberg, P.; Lundgren, I.; Mukohyama, H.; Lehenkari, P.P.; Horton, M.A.; Lerner, U.H. Vasoactive intestinal peptide (VIP)/pituitary adenylate cyclase-activating peptide receptor subtypes in mouse calvarial osteoblasts: Presence of VIP-2 receptors and differentiation-induced expression of VIP-1 receptors. Endocrinology 2001, 142, 339–347. [Google Scholar] [CrossRef]
- Ransjo, M.; Lie, A.; Mukohyama, H.; Lundberg, P.; Lerner, U.H. Microisolated mouse osteoclasts express VIP-1 and PACAP receptors. Biochem. Biophs. Res. Commun. 2000, 274, 400–404. [Google Scholar] [CrossRef]
- Nagata, A.; Tanaka, T.; Minezawa, A.; Poyurovsky, M.; Mayama, T.; Suzuki, S.; Hashimoto, N.; Yoshida, T.; Suyama, K.; Miyata, A.; et al. cAMP Activation by PACAP/VIP Stimulates IL-6 Release and Inhibits Osteoblastic Differentiation Through VPAC2 Receptor in Osteoblastic MC3T3 Cells. J. Cell Physiol. 2009, 221, 75–83. [Google Scholar] [CrossRef]
- Persson, E.; Lerner, U.H. The Neuropeptide VIP Regulates the Expression of Osteoclastogenic Factors in Osteoblasts. J. Cell Biochem. 2011, 112, 3732–3741. [Google Scholar] [CrossRef]
- Wei, T.P.; Li, W.W.; Guo, T.Z.; Zhao, R.; Wang, L.P.; Clark, D.J.; Oaklander, A.L.; Schmelz, M.; Kingery, W.S. Post-junctional facilitation of Substance P signaling in a tibia fracture rat model of complex regional pain syndrome type I. Pain 2009, 144, 278–286. [Google Scholar] [CrossRef] [Green Version]
- Aoki, M.; Tamai, K.; Saotome, K. Substance P-Related and Calcitonin-Gene-Related Peptide-Immunofluorescent Nerves in the Repair of Experimental Bone Defects. Int. Orthop. 1994, 18, 317–324. [Google Scholar] [CrossRef]
- Goto, T.; Yamaza, T.; Kido, M.A.; Tanaka, T. Light- and electron-microscopic study of the distribution of axons containing substance P and the localization of neurokinin-1 receptor in bone. Cell Tissue Res. 1998, 293, 87–93. [Google Scholar] [CrossRef] [PubMed]
- Wang, L.P.; Zhao, R.; Shi, X.Y.; Wei, T.P.; Halloran, B.P.; Clark, D.J.; Jacobs, C.R.; Kingery, W.S. Substance P stimulates bone marrow stromal cell osteogenic activity, osteoclast differentiation, and resorption activity in vitro. Bone 2009, 45, 309–320. [Google Scholar] [CrossRef] [PubMed] [Green Version]
- Mori, T.; Ogata, T.; Okumura, H.; Shibata, T.; Nakamura, Y.; Kataoka, K. Substance p regulates the function of rabbit cultured osteoclast; Increase of intracellular free calcium concentration and enhancement of bone resorption. Biochem. Biophys. Res. Commun. 1999, 262, 418–422. [Google Scholar] [CrossRef]
- Sohn, S.J. Substance P upregulates osteoclastogenesis by activating nuclear factor kappa B in osteoclast precursors. Acta Oto-Laryngol. 2005, 125, 130–133. [Google Scholar] [CrossRef]
- Matayoshi, T.; Goto, T.; Fukuhara, E.; Takano, H.; Kobayashi, S.; Takahashi, T. Neuropeptide substance P stimulates the formation of osteoclasts via synovial fibroblastic cells. Biochem. Biophys. Res. Commun. 2005, 327, 756–764. [Google Scholar] [CrossRef] [PubMed]
- Adamus, M.A.; Dabrowski, Z.J. Effect of the neuropeptide substance P on the rat bone marrow-derived osteogenic cells in vitro. J. Cell Biochem. 2001, 81, 499–506. [Google Scholar] [CrossRef]
- Liu, H.J.; Yan, H.; Yan, J.; Li, H.; Chen, L.; Han, L.R.; Yang, X.F. Substance P Promotes the Proliferation, but Inhibits Differentiation and Mineralization of Osteoblasts from Rats with Spinal Cord Injury via RANKL/OPG System. PLoS ONE 2016, 11, e0165063. [Google Scholar] [CrossRef]
- Shih, C.; Bernard, G.W. Neurogenic substance P stimulates osteogenesis in vitro. Peptides 1997, 18, 323–326. [Google Scholar] [CrossRef]
- Goto, T.; Nakao, K.; Gunjigake, K.K.; Kido, M.A.; Kobayashi, S.; Tanaka, T. Substance P stimulates late-stage rat osteoblastic bone formation through neurokinin-1 receptors. Neuropeptides 2007, 41, 25–31. [Google Scholar] [CrossRef]
- Kook, Y.A.; Lee, S.K.; Son, D.H.; Kim, Y.; Kang, K.H.; Cho, J.H.; Kim, S.C.; Kim, Y.S.; Lee, H.J.; Lee, S.K.; et al. Effects of substance P on osteoblastic differentiation and heme oxygenase-1 in human periodontal ligament cells. Cell Biol. Int. 2009, 33, 424–428. [Google Scholar] [CrossRef]
- Azuma, H.; Kido, J.; Ikedo, D.; Kataoka, M.; Nagata, T. Substance P enhances the inhibition of osteoblastic cell differentiation induced by lipopolysaccharide from Porphyromonas gingivalis. J. Periodontol. 2004, 75, 974–981. [Google Scholar] [CrossRef] [PubMed]
- Kingery, W.S.; Offley, S.C.; Guo, T.Z.; Davies, M.F.; Clark, J.D.; Jacobs, C.R. A substance P receptor (NK1) antagonist enhances the widespread osteoporotic effects of sciatic nerve section. Bone 2003, 33, 927–936. [Google Scholar] [CrossRef]
- Zheng, X.F.; Zhao, E.D.; He, J.Y.; Zhang, Y.H.; Jiang, S.D.; Jiang, L.S. Inhibition of substance P signaling aggravates the bone loss in ovariectomy-induced osteoporosis. Prog. Biophys. Mol. Biol. 2016, 122, 112–121. [Google Scholar] [CrossRef] [PubMed]
- Ding, W.G.; Zhang, Z.M.; Zhang, Y.H.; Jiang, S.D.; Jiang, L.S.; Dai, L.Y. Changes of substance P during fracture healing in ovariectomized mice. Regul. Pept. 2010, 159, 28–34. [Google Scholar] [CrossRef] [PubMed]
- Lerner, U.H.; Persson, E. Osteotropic effects by the neuropeptides calcitonin gene-related peptide, substance P and vasoactive intestinal peptide. J. Musculoskelet. Neuronal Interact. 2008, 8, 154–165. [Google Scholar] [PubMed]
- Terreni, A.; Pezzati, P. Biochemical markers in the follow-up of the osteoporotic patients. Clin Cases Miner. Bone Metab. 2012, 9, 80–84. [Google Scholar] [PubMed]
- Vasikaran, S.; Eastell, R.; Bruyere, O.; Foldes, A.J.; Garnero, P.; Griesmacher, A.; McClung, M.; Morris, H.A.; Silverman, S.; Trenti, T.; et al. Markers of bone turnover for the prediction of fracture risk and monitoring of osteoporosis treatment: A need for international reference standards. Osteoporos. Int. 2011, 22, 391–420. [Google Scholar] [CrossRef]
- Yoshimura, N.; Muraki, S.; Oka, H.; Kawaguchi, H.; Nakamura, K.; Akune, T. Biochemical markers of bone turnover as predictors of osteoporosis and osteoporotic fractures in men and women: 10-year follow-up of the Taiji cohort. Mod. Rheumatol. 2011, 21, 608–620. [Google Scholar] [CrossRef]
- Garnero, P.; Sornay-Rendu, E.; Claustrat, B.; Delmas, P.D. Biochemical markers of bone turnover, endogenous hormones and the risk of fractures in postmenopausal women: The OFELY study. J. Bone Miner. Res. 2000, 15, 1526–1536. [Google Scholar] [CrossRef]
- Blue, M.E.; Boskey, A.L.; Doty, S.B.; Fedarko, N.S.; Hossain, M.A.; Shapiro, J.R. Osteoblast function and bone histomorphometry in a murine model of Rett syndrome. Bone 2015, 76, 23–30. [Google Scholar] [CrossRef]
- Eastell, R.; Barton, I.; Hannon, R.A.; Chines, A.; Garnero, P.; Delmas, P.D. Relationship of early changes in bone resorption to the reduction in fracture risk with risedronate. J. Bone Miner. Res. 2003, 18, 1051–1056. [Google Scholar] [CrossRef] [PubMed]
- Callewaert, F.; Venken, K.; Kopchick, J.J.; Torcasio, A.; van Lenthe, G.H.; Boonen, S.; Vanderschueren, D. Sexual dimorphism in cortical bone size and strength but not density is determined by independent and time-specific actions of sex steroids and IGF-1: Evidence from pubertal mouse models. J. Bone Miner. Res. 2010, 25, 617–626. [Google Scholar] [CrossRef] [PubMed]
- Goel, N.; Bale, T.L. Sex differences in the serotonergic influence on the hypothalamic-pituitary-adrenal stress axis. Endocrinology 2010, 151, 1784–1794. [Google Scholar] [CrossRef] [PubMed]
- Takeda, T.; Hosokawa, M.; Higuchi, K. Senescence-accelerated mouse (SAM): A novel murine model of accelerated senescence. J. Am. Geriatr. Soc. 1991, 39, 911–919. [Google Scholar] [CrossRef]
- Paccione, M.F.; Warren, S.M.; Spector, J.A.; Greenwald, J.A.; Bouletreau, P.J.; Longaker, M.T. A mouse model of mandibular osteotomy healing. J. Craniofac. Surg. 2001, 12, 444–450. [Google Scholar] [CrossRef]
- Dang, R.; Guo, Y.Y.; Zhang, K.; Jiang, P.; Zhao, M.G. Predictable chronic mild stress promotes recovery from LPS-induced depression. Mol. Brain 2019, 12, 42. [Google Scholar] [CrossRef]
- Heim, C.; Mletzko, T.; Purselle, D.; Musselman, D.L.; Nemeroff, C.B. The dexamethasone/corticotropin-releasing factor test in men with major depression: Role of childhood trauma. Biol. Psychiatry 2008, 63, 398–405. [Google Scholar] [CrossRef]
- Heim, C.; Shugart, M.; Craighead, W.E.; Nemeroff, C.B. Neurobiological and psychiatric consequences of child abuse and neglect. Dev. Psychobiol. 2010, 52, 671–690. [Google Scholar] [CrossRef] [PubMed]
- Saveanu, R.V.; Nemeroff, C.B. Etiology of Depression: Genetic and Environmental Factors. Psychiatry Clin. N. Am. 2012, 35, 51. [Google Scholar] [CrossRef]
- Picard, M.; McEwen, B.S.; Epel, E.S.; Sandi, C. An energetic view of stress: Focus on mitochondria. Front. Neuroendocrinol. 2018, 49, 72–85. [Google Scholar] [CrossRef]
- Sophocleous, A.; Idris, A.I. Rodent models of osteoporosis. Bonekey Rep. 2014, 3, 614. [Google Scholar] [CrossRef] [PubMed] [Green Version]
- Halloran, B.P.; Ferguson, V.L.; Simske, S.J.; Burghardt, A.; Venton, L.L.; Majumdar, S. Changes in bone structure and mass with advancing age in the male C57BL/6J mouse. J. Bone Miner. Res. 2002, 17, 1044–1050. [Google Scholar] [CrossRef] [PubMed]
- Bohacek, J.; Manuella, F.; Roszkowski, M.; Mansuy, I.M. Hippocampal gene expression induced by cold swim stress depends on sex and handling. Psychoneuroendocrinology 2015, 52, 1–12. [Google Scholar] [CrossRef] [PubMed]
- Hendrix, S.; Picker, B.; Liezmann, C.; Peters, E.M. Skin and hair follicle innervation in experimental models: A guide for the exact and reproducible evaluation of neuronal plasticity. Exp. Dermatol. 2008, 17, 214–227. [Google Scholar] [CrossRef]
- Kohler, T.; Beyeler, M.; Webster, D.; Muller, R. Compartmental bone morphometry in the mouse femur: Reproducibility and resolution dependence of microtomographic measurements. Calcif. Tissue Int. 2005, 77, 281–290. [Google Scholar] [CrossRef]
- Bouxsein, M.L.; Boyd, S.K.; Christiansen, B.A.; Guldberg, R.E.; Jepsen, K.J.; Muller, R. Guidelines for Assessment of Bone Microstructure in Rodents Using Micro-Computed Tomography. J. Bone Miner. Res. 2010, 25, 1468–1486. [Google Scholar] [CrossRef]
- Glaesmer, H.; Schulz, A.; Häuser, W.; Freyberger, H.J.; Brähler, E.; Grabe, H.-J. Der Childhood Trauma Screener (CTS)–Entwicklung und Validierung von Schwellenwerten zur Klassifikation [The Childhood Trauma Screener (CTS)–Development and Validation of Cut-Off-Scores for Classificatory Diagnostics]. Psychiatr. Praxis 2013, 40, 220–226. [Google Scholar] [CrossRef]
- Wingenfeld, K.; Spitzer, C.; Mensebach, C.; Grabe, H.J.; Hill, A.; Gast, U.; Schlosser, N.; Höpp, H.; Beblo, T.; Driessen, M. Die deutsche Version des Childhood Trauma Questionnaire (CTQ): Erste Befunde zu den psychometrischen Kennwerten [The German version of the Childhood Trauma Questionnaire (CTQ): Preliminary psychometric properties]. Psychother. Psychosom. Med. Psychol. 2010, 60, 442–450. [Google Scholar] [CrossRef]
- Bernstein, D.; Fink, L. Childhood Trauma Questionnaire (CTQ): A Retrospective Self-Report Questionnaire and Manual; The Psychological Corporation: San Antonio, TX, USA, 1998. [Google Scholar]
- Grabe, H.J.; Schulz, A.; Schmidt, C.O.; Appel, K.; Driessen, M.; Wingenfeld, K.; Barnow, S.; Spitzer, C.; John, U.; Berger, K.; et al. A brief instrument for the assessment of childhood abuse and neglect: The childhood trauma screener (CTS). Psychiatr. Prax. 2012, 39, 109–115. [Google Scholar] [CrossRef]
- Siegrist, J.; Geyer, S. ILE–Inventar zur Erfassung lebensverändernder Ereignisse. In Diagnostische Verfahren in der Psychotherapie; Hogrefe: Göttingen, Germany, 2016; Volume 1, pp. 211–213. [Google Scholar]
- Beck, A.T.; Steer, R.A.; Brown, G.K. Manual for the Beck Depression Inventory-II.; The Psychological Corporation: San Antonio, TX, USA, 1996. [Google Scholar]
- Wintjen, L.; Petermann, F. Beck-Depressions-Inventar Revision (BDI-II). Z. Psychiatr. Psych. Psychother. 2010, 58, 243–245. [Google Scholar] [CrossRef]
- Muche, R.; Lanzinger, S.; Rau, M. Medizinische Statistik Mit R und Excel; Springer: Berlin, Germany, 2011. [Google Scholar]
- R Core Team. R Foundation for Statistical Computing; R Foundation for Statistical Computing: Vienna, Austria, 2014. [Google Scholar]


| N | Age | Depression (BDI-II Score) | Weight | Sex | Antidepressant Use | Early Life Stress | |||||||||
|---|---|---|---|---|---|---|---|---|---|---|---|---|---|---|---|
| ILE child c | CTS d | ||||||||||||||
| M | (SD) | M | (SD) | M | (SD) | N (Female) | (%) | N(Yes) | (%) | N (Yes) | (%) | N (Yes) | (%) | ||
| Sample of bone metabolic parameters a | 145 | 47.9 | (10.1) | 24.0 | (10.1) | 78.1 | (17.4) | 118 | (81.4) | 100 | (69.0) | 128 | (88.3) | 47 | (32.4) |
| ↳ life events during childhood (ILE child) | 128 | 48.1 | (10.1) | 24.0 | (10.0) | 78.2 | (17.3) | 104 | (81.3) | 86 | (67.2) | ||||
| ↳ childhood maltreatment (CTS) | 47 | 47.9 | (10.4) | 24.6 | (10.7) | 75.8 | (17.3) | 35 | (74.5) | 32 | (68.1) | ||||
| DXA sample b | 17 | 51.9 | (6.6) | 23.7 | (11.7) | 74.3 | (17.5) | 12 | (70.6) | 13 | (76.5) | 15 | (88.2) | 17 | (100.0) |
| ↳ life events during childhood (ILE child) | 15 | 52.2 | (7.0) | 24.9 | (12.2) | 71.2 | (16.3) | 11 | (73.3) | 11 | (73.3) | ||||
| ↳ childhood maltreatment (CTS) | 17 | 51.9 | (6.6) | 23.7 | (11.7) | 74.3 | (17.5) | 12 | (70.6) | 13 | (76.5) | ||||
| P1NP | OC | CTX-I | |||||||||||||
| b | 95%CI | p | b | 95%CI | p | b | 95%CI | p | |||||||
| CTSa | 9.27 | −1.43; 19.97 | 0.10 # | 2.87 | −0.56; 6.30 | 0.11 | 0.10 | 0.01; 0.18 | 0.05 * | ||||||
| CTS abuse | 11.42 | 1.86; 20.99 | 0.03 * | 2.51 | −0.65; 5.67 | 0.13 | 0.06 | 0.02; 0.14 | 0.16 | ||||||
| CTS neglect | −6.26 | −16.45; 3.93 | 0.24 | 0.32 | −3.63; 2.98 | 0.85 | 0.03 | −0.06; 0.12 | 0.50 | ||||||
| ILE childb | 8.37 | 0.71; 16.03 | 0.04 * | 2.28 | −0.10; 4.65 | 0.06 # | 0.06 | −0.01; 0.11 | 0.06 # | ||||||
| BMD_ L1L4c | BMD_T | BMD_S | BMD_G | BMD_H | |||||||||||
| b | 95%CI | p | b | 95%CI | p | b | 95%CI | p | b | 95%CI | p | b | 95%CI | p | |
| CTS | −0.07 | −0.23; 0.08 | 0.40 | −0.09 | −0.22; 0.04 | 0.20 | −0.09 | −0.25; 0.08 | 0.33 | −0.10 | −0.23; 0.03 | 0.17 | −0.10 | −0.22; 0.02 | 0.12 |
| CTS abuse | −0.07 | −0.26, 0.12 | 0.48 | −0.15 | −0.28; −0.02 | 0.05 * | −0.13 | −0.32, 0.06 | 0.22 | −0.15 | −0.29, −0.01 | 0.07 # | −0.12 | −0.26, 0.01 | 0.10 |
| CTS neglect | −0.06 | −0.21, 0.10 | 0.51 | −0.06 | −0.20, 0.07 | 0.39 | −0.07 | −0.24, 0.10 | 0.45 | −0.07 | −0.21, 0.07 | 0.38 | −0.03 | −0.16, 0.10 | 0.68 |
| ILE child | −0.18 | −0.46, 0.10 | 0.25 | −0.26 | −0.44, −0.07 | 0.03 * | −0.18 | −0.48, 0.11 | 0.26 | −0.22 | −0.43, −0.01 | 0.08 # | −0.17 | −0.36, 0.03 | 0.14 |
© 2020 by the authors. Licensee MDPI, Basel, Switzerland. This article is an open access article distributed under the terms and conditions of the Creative Commons Attribution (CC BY) license (http://creativecommons.org/licenses/by/4.0/).
Share and Cite
Wuertz-Kozak, K.; Roszkowski, M.; Cambria, E.; Block, A.; Kuhn, G.A.; Abele, T.; Hitzl, W.; Drießlein, D.; Müller, R.; Rapp, M.A.; et al. Effects of Early Life Stress on Bone Homeostasis in Mice and Humans. Int. J. Mol. Sci. 2020, 21, 6634. https://0-doi-org.brum.beds.ac.uk/10.3390/ijms21186634
Wuertz-Kozak K, Roszkowski M, Cambria E, Block A, Kuhn GA, Abele T, Hitzl W, Drießlein D, Müller R, Rapp MA, et al. Effects of Early Life Stress on Bone Homeostasis in Mice and Humans. International Journal of Molecular Sciences. 2020; 21(18):6634. https://0-doi-org.brum.beds.ac.uk/10.3390/ijms21186634
Chicago/Turabian StyleWuertz-Kozak, Karin, Martin Roszkowski, Elena Cambria, Andrea Block, Gisela A. Kuhn, Thea Abele, Wolfgang Hitzl, David Drießlein, Ralph Müller, Michael A. Rapp, and et al. 2020. "Effects of Early Life Stress on Bone Homeostasis in Mice and Humans" International Journal of Molecular Sciences 21, no. 18: 6634. https://0-doi-org.brum.beds.ac.uk/10.3390/ijms21186634