Super-Resolution Live Cell Microscopy of Membrane-Proximal Fluorophores


Abstract
:1. Introduction
2. Results
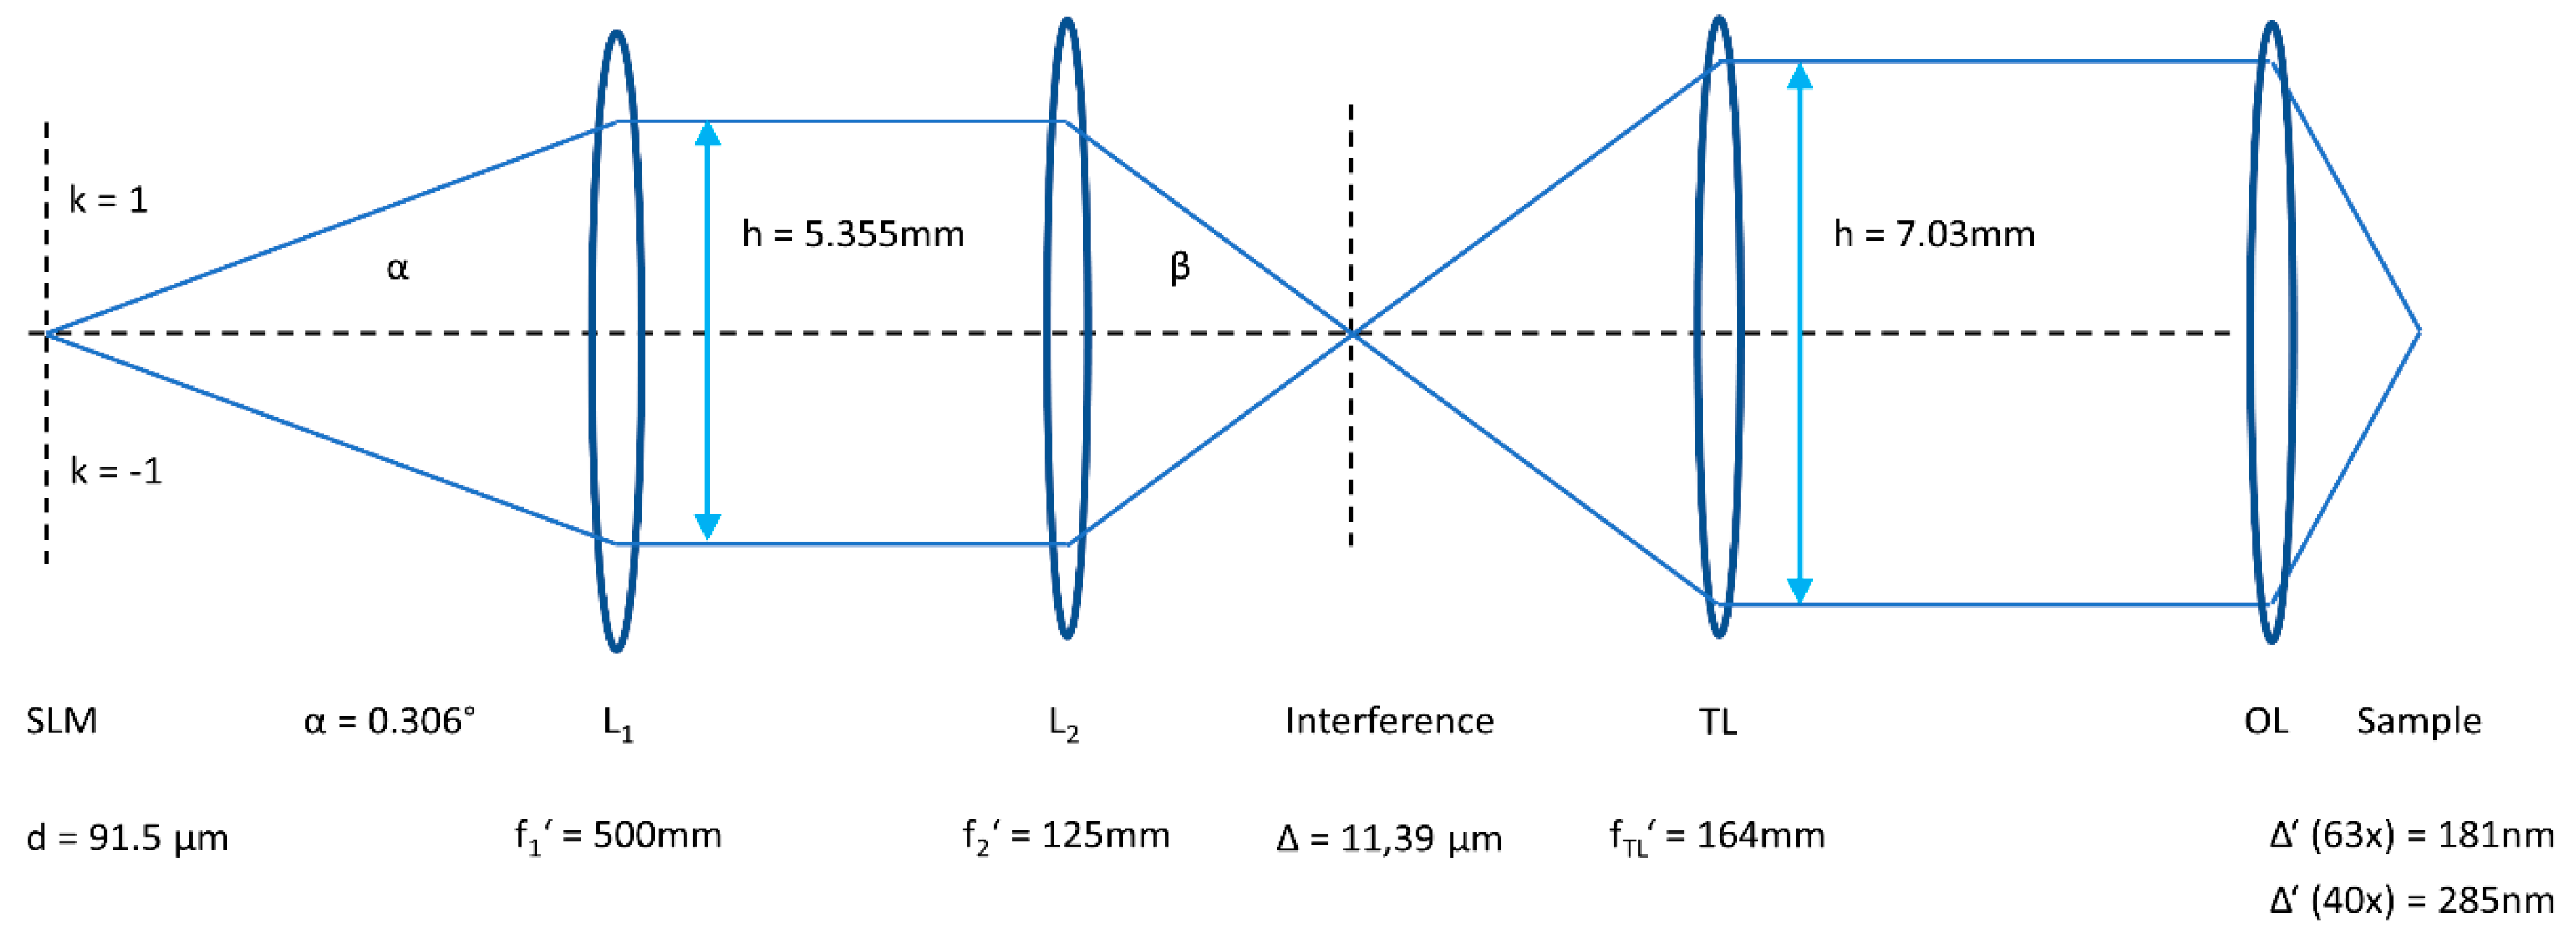
2.1. Microscopy Setup
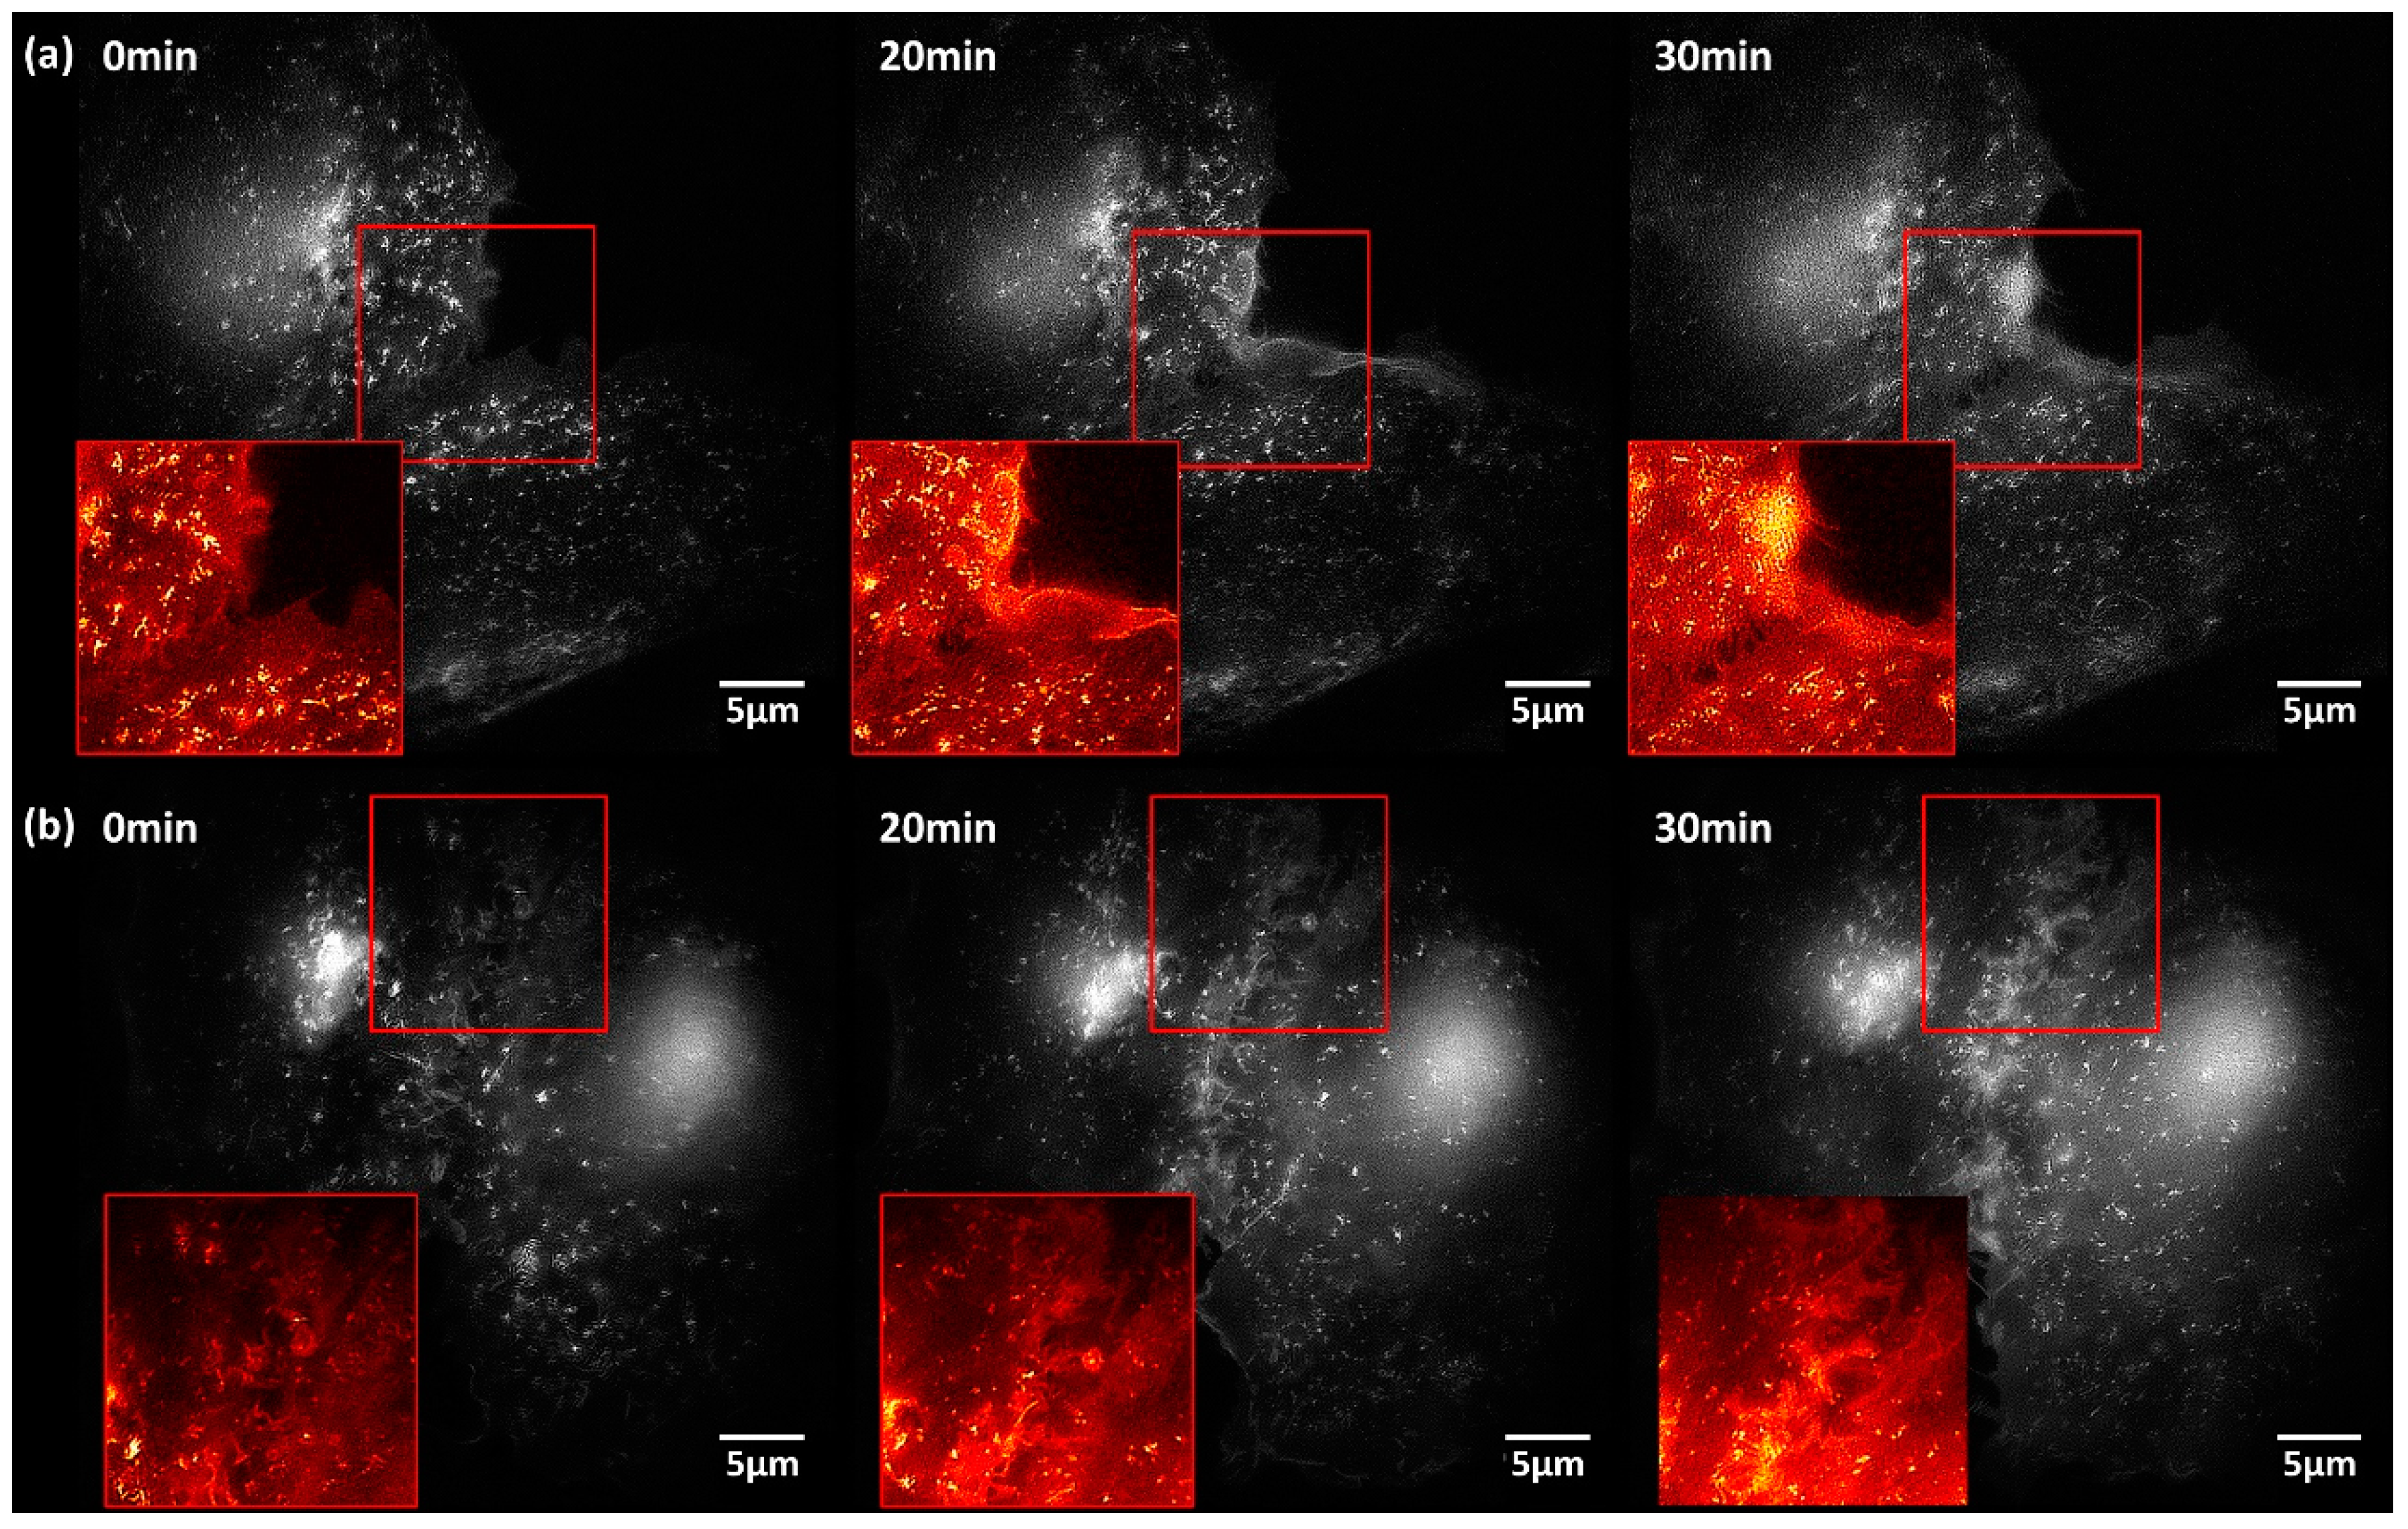
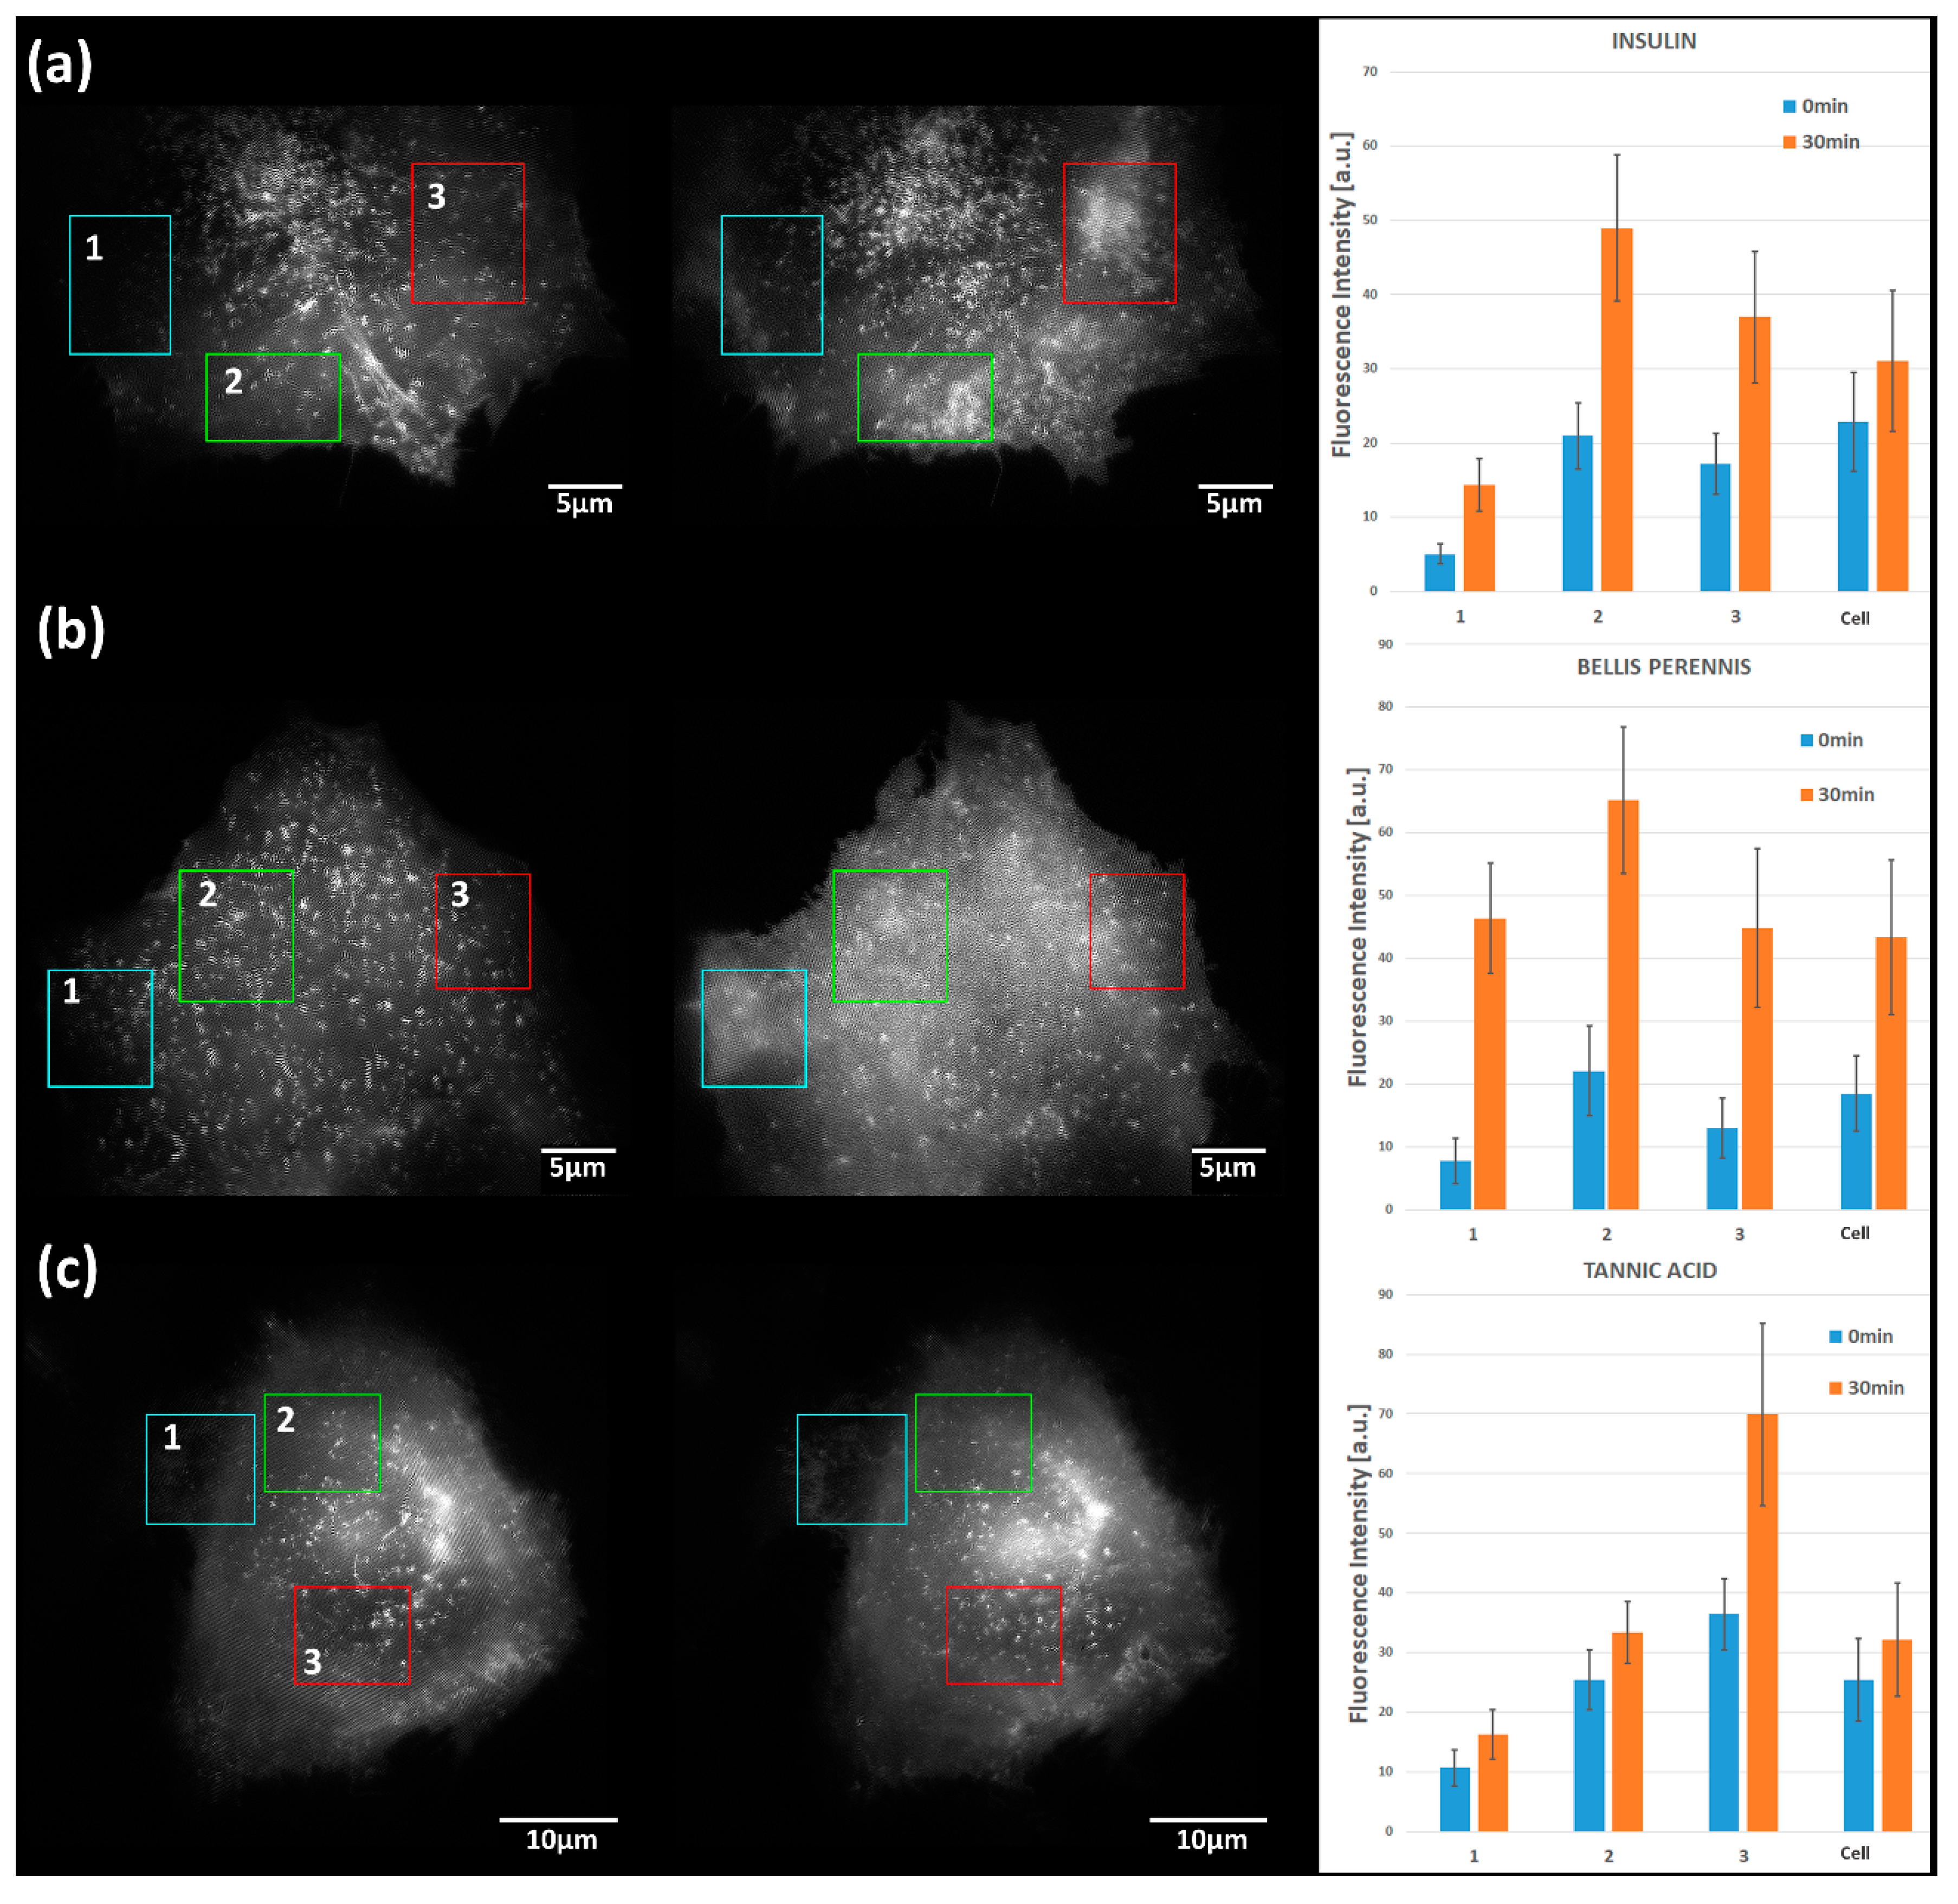
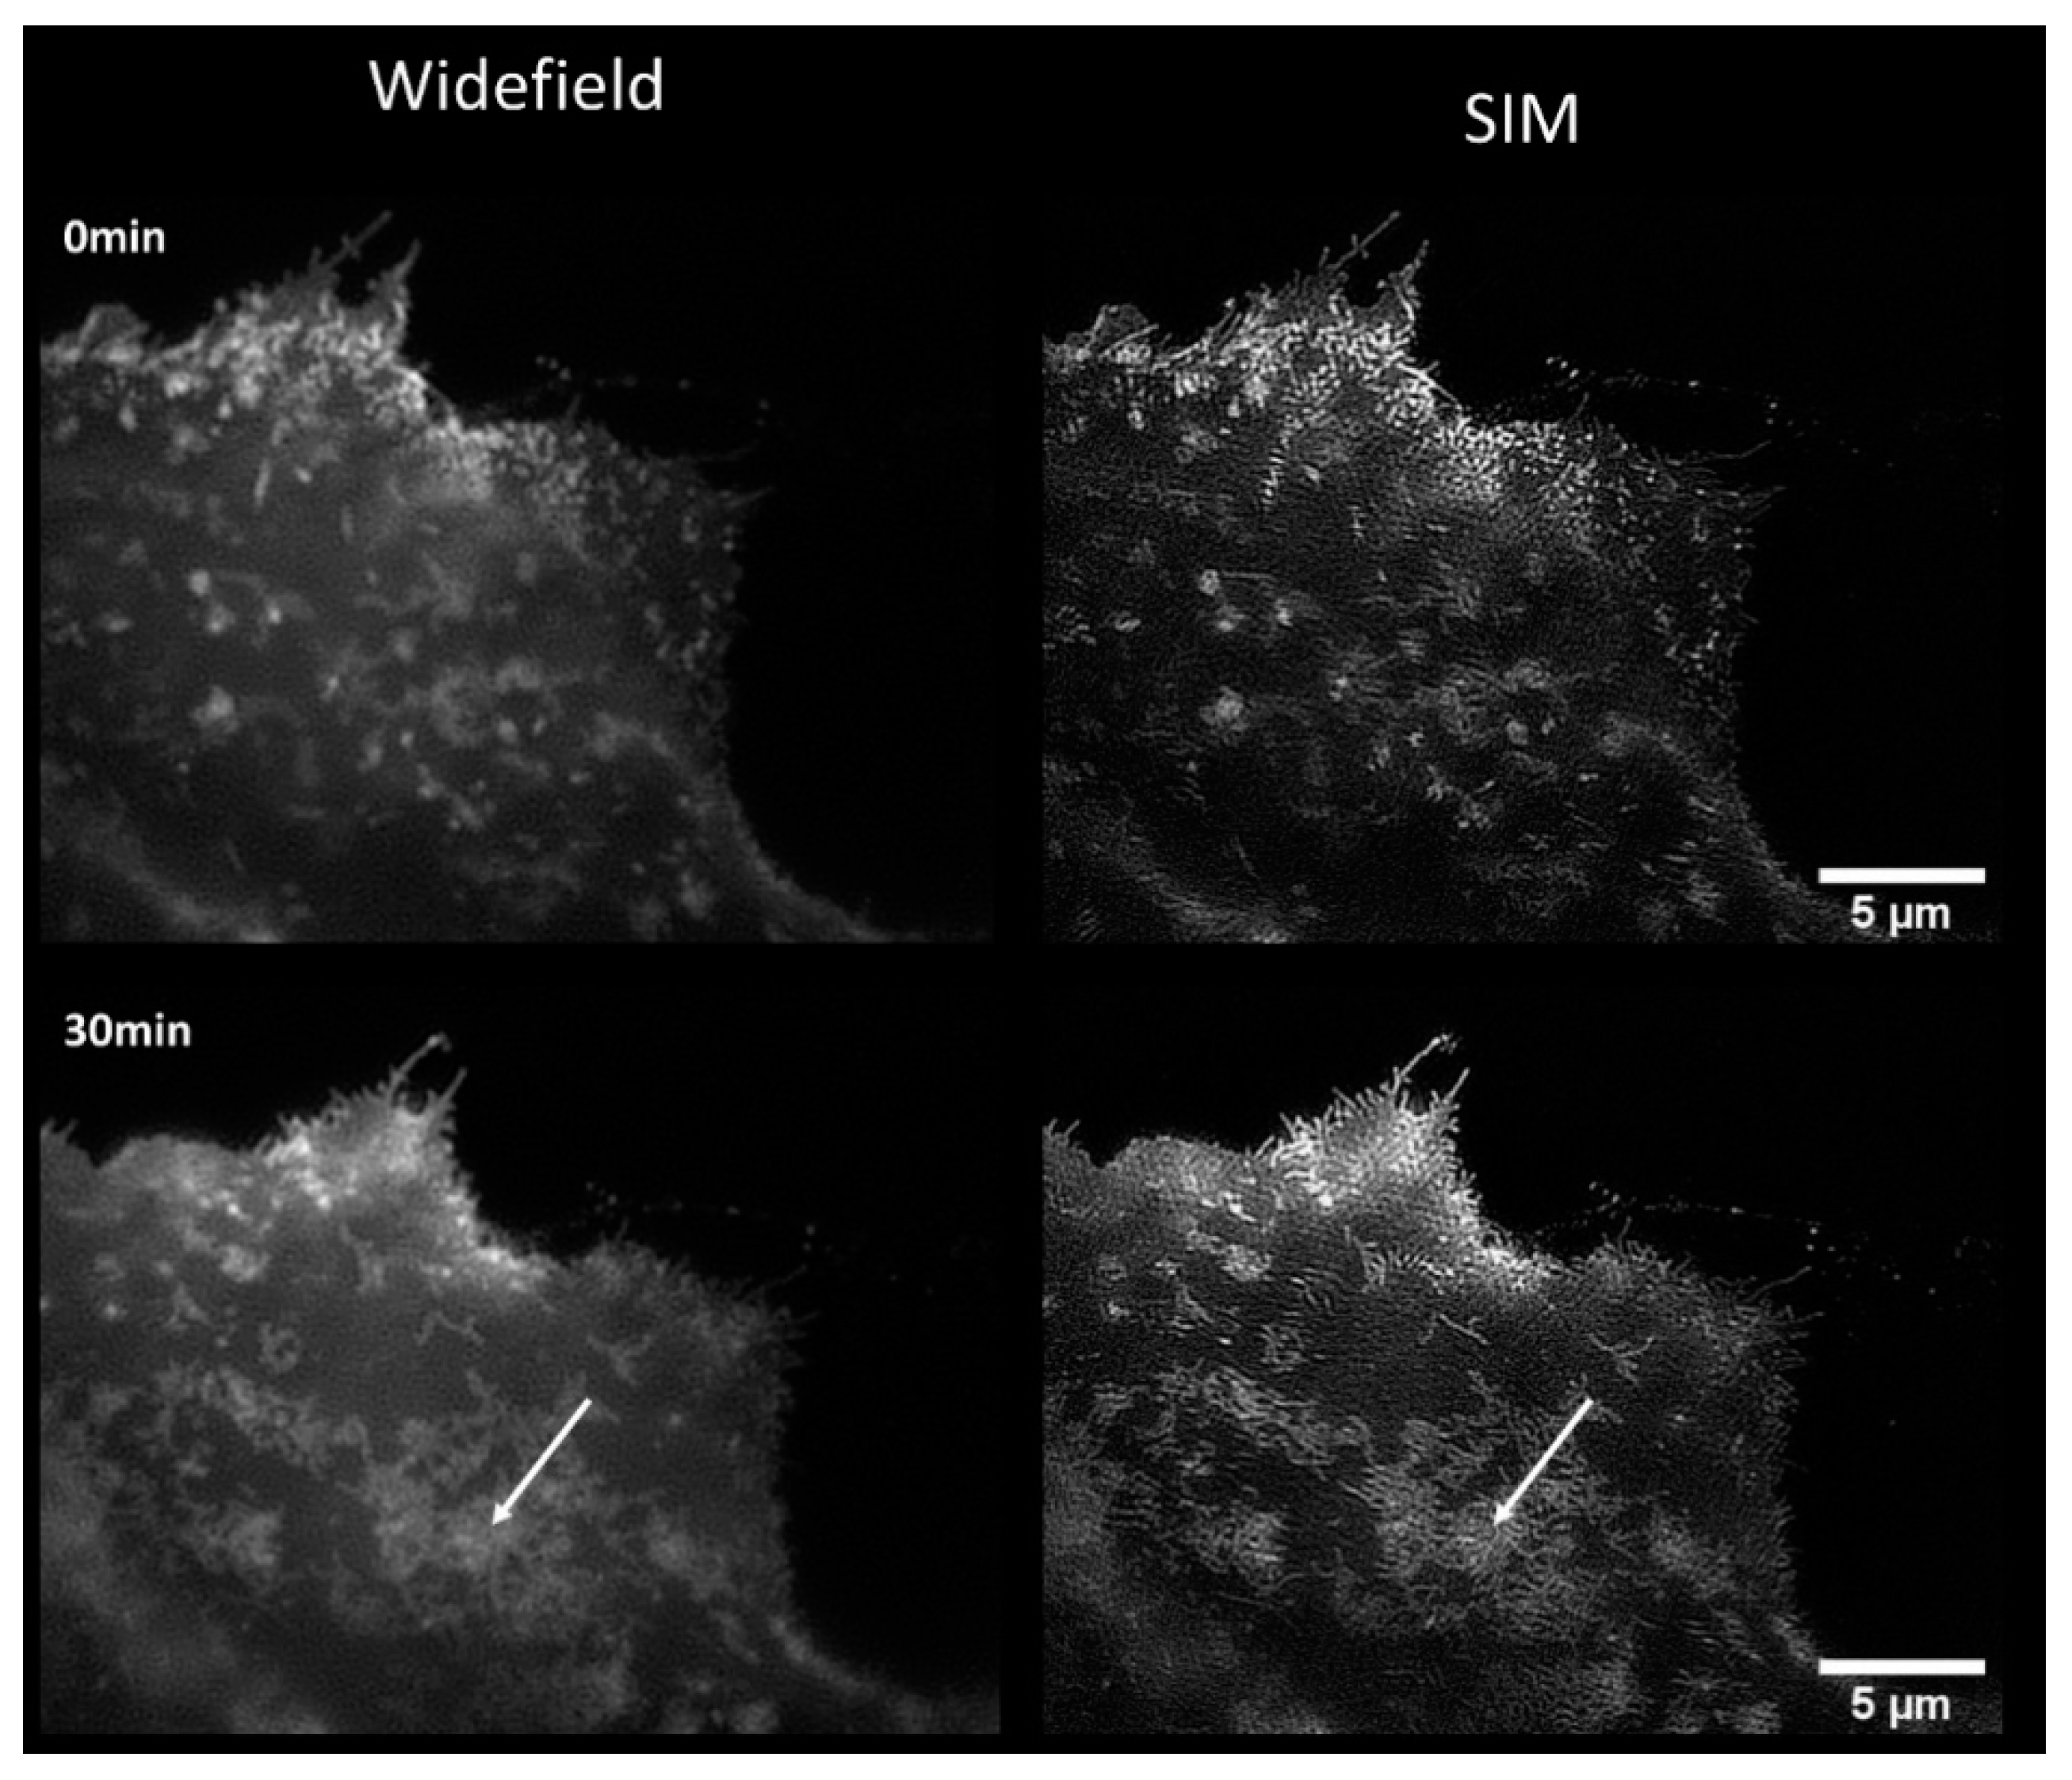
2.2. Translocation of GLUT4 to the Plasma Membrane
3. Discussion
4. Materials and Methods
4.1. Reagents
4.2. Cell Culture
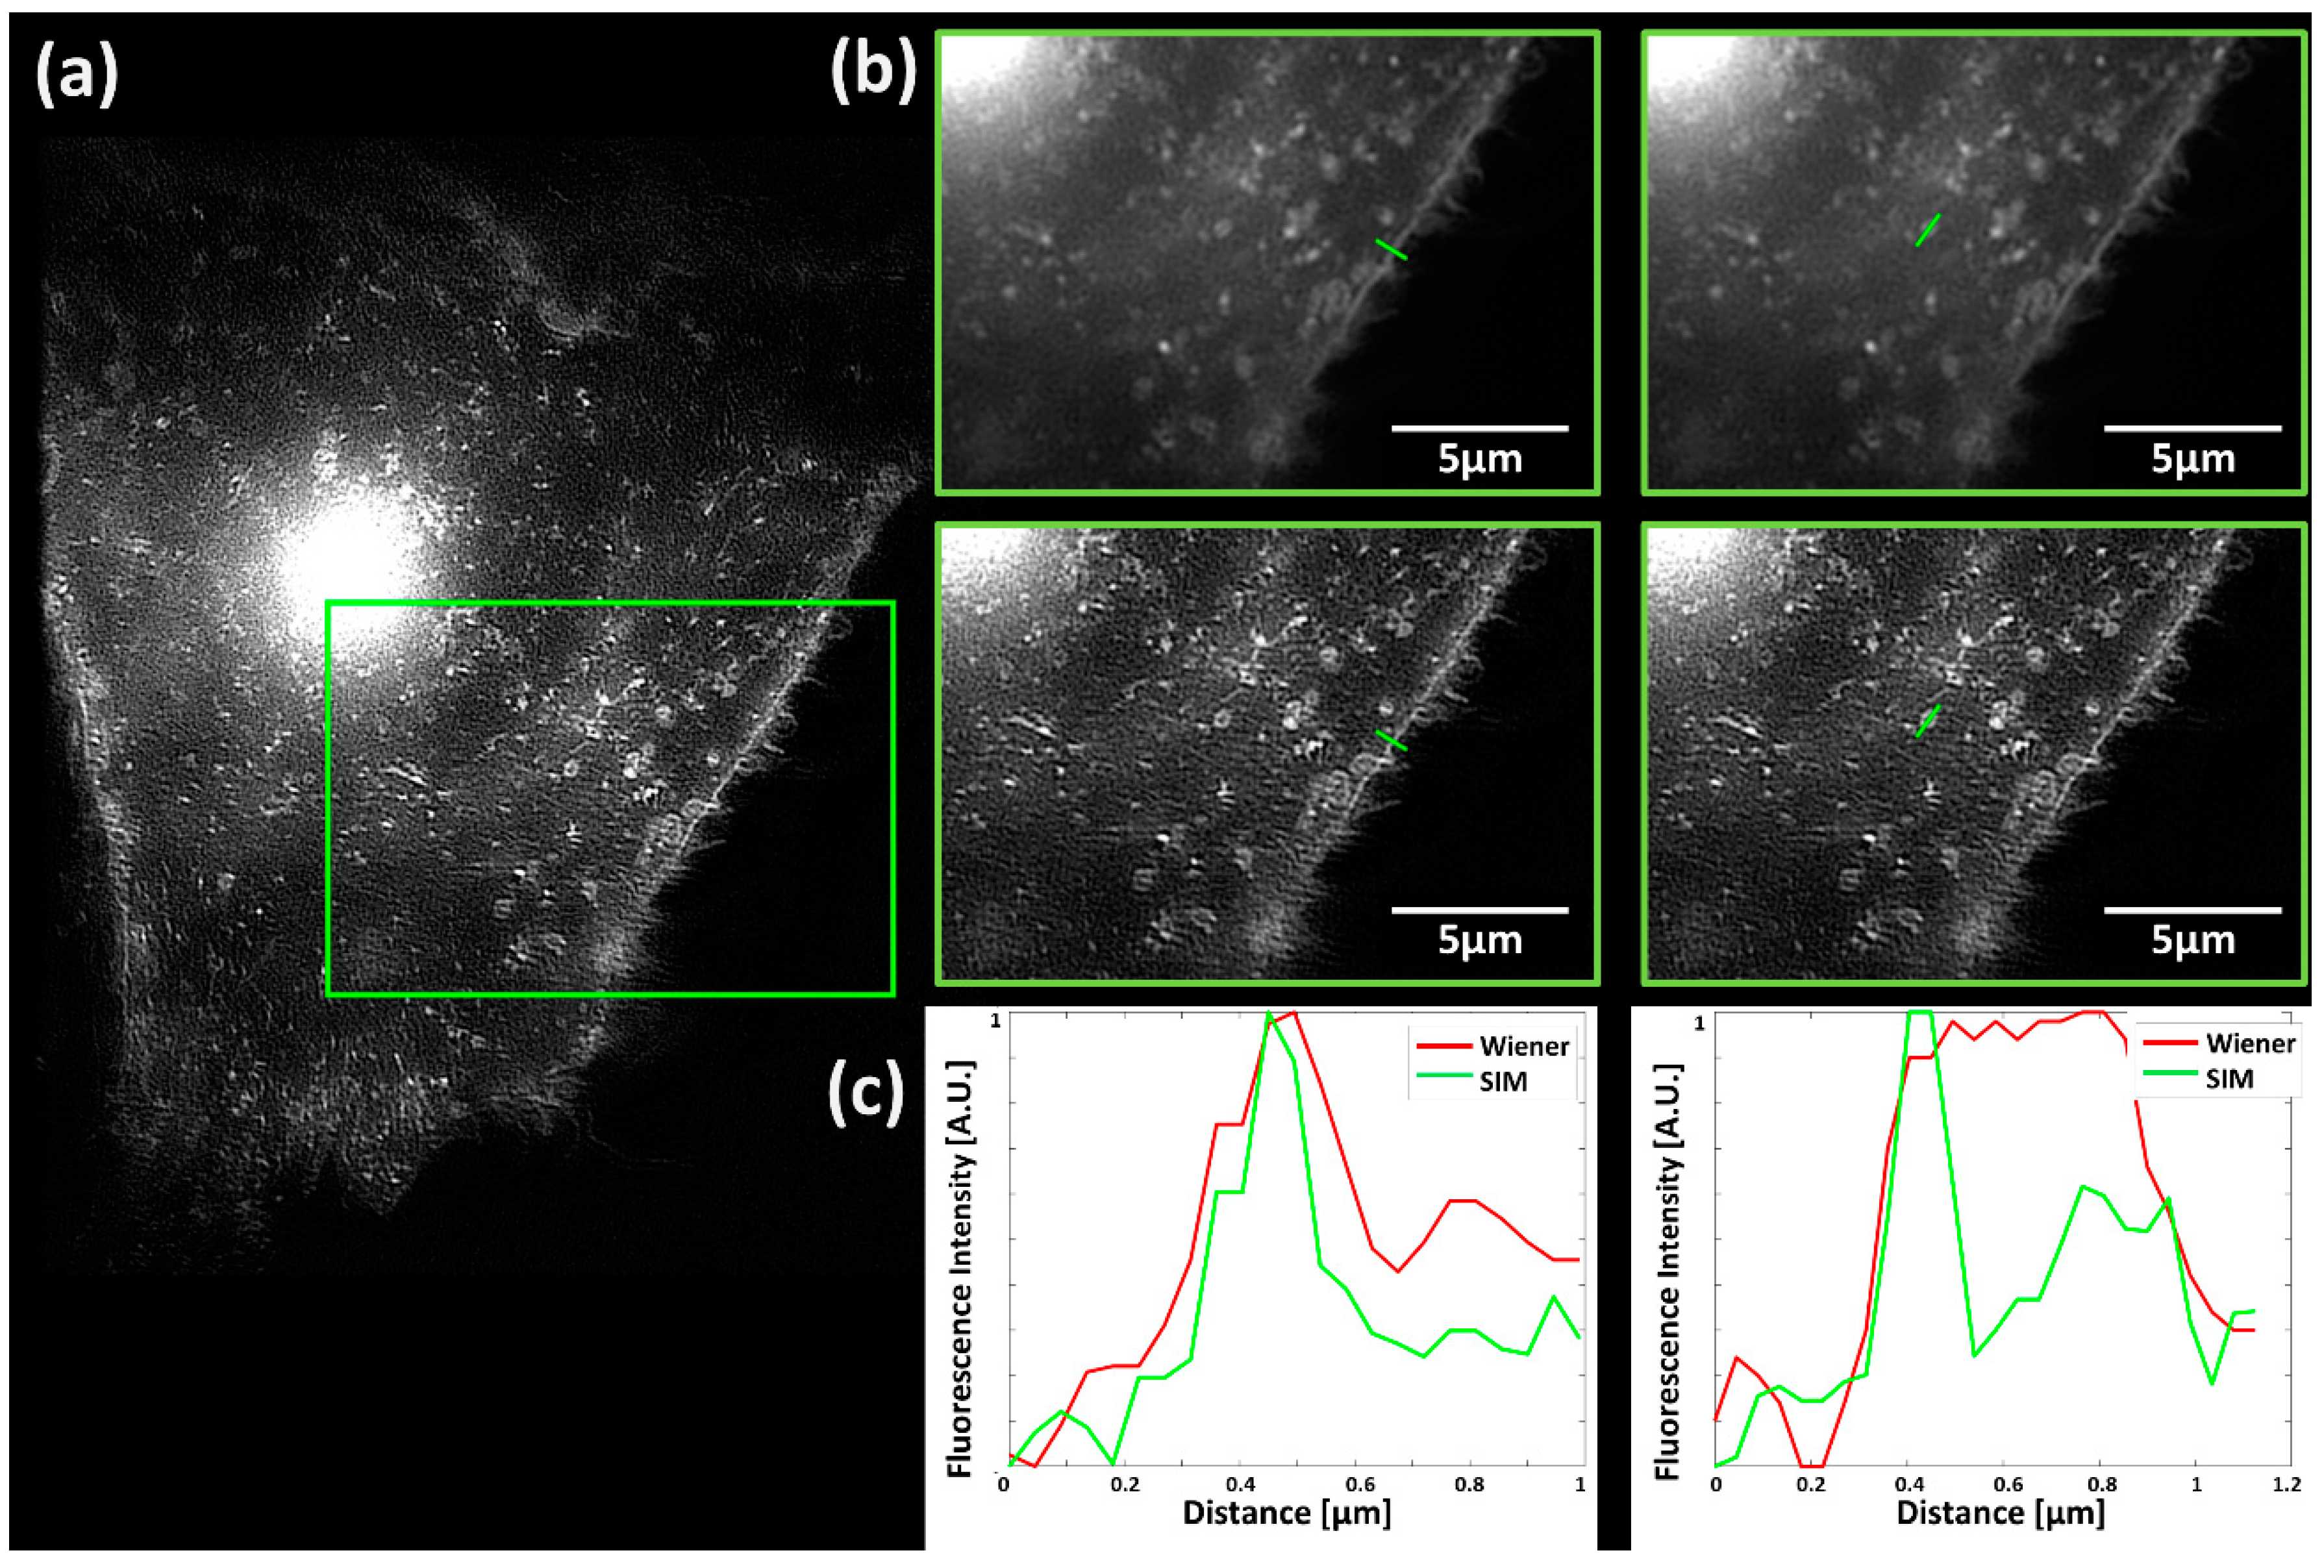
4.3. SIM/TIRF-SIM
Supplementary Materials
Author Contributions
Funding
Acknowledgments
Conflicts of Interest
Abbreviations
| CHO | Chinese Hamster Ovary |
| GLUT4 | Glucose Transporter 4 |
| GLUT 2 | Glucose Transporter 2 |
| PALM | Photoactivation Localization Microscopy |
| SIM | Structured Illumination Microscopy |
| SLM | Spatial Light Modulator |
| STED | Stimulated Emission Depletion Microscopy |
| STORM | Stochastic Optical Reconstruction Microscopy |
| TIRF | Total Internal Reflection Fluorescence |
References
- Betzig, E.; Patterson, G.H.; Sougrat, R.; Lindwasser, O.W.; Olenych, S.; Bonifacino, J.S.; Davidson, M.W.; Lippincott-Schwartz, J.; Hess, H.F. Imaging intracellular fluorescent proteins at nanometer resolution. Science 2006, 313, 1642–1645. [Google Scholar] [CrossRef] [Green Version]
- Rust, M.J.; Bates, M.; Zhuang, X. Sub-diffraction-limit imaging by stochastic optical reconstruction microscopy (STORM). Nat. Methods 2006, 3, 793–796. [Google Scholar] [CrossRef] [Green Version]
- Cremer, C.; Masters, B.R. Resolution enhancement techniques in microscopy. Eur. Phys. J. H 2013, 38, 281–344. [Google Scholar] [CrossRef] [Green Version]
- Hell, S.W.; Wichmann, J. Breaking the diffraction resolution limit by stimulated emission: Stimulated-emission-depletion fluorescence microscopy. Opt. Lett. 1994, 19, 780–782. [Google Scholar] [CrossRef]
- Balzarotti, F.; Eilers1, Y.; Gwosch, K.C.; Gynnå, A.H.; Westphal, V.; Stefani, F.D.; Elf, J.; Hell, S.W. Nanometer resolution imaging and tracking of fluorescent molecules with minimal photon fluxes. Science 2017, 345, 606–612. [Google Scholar] [CrossRef] [Green Version]
- Heintzmann, R.; Cremer, C. Laterally modulated excitation microscopy: Improvement of resolution by using a diffraction grating. In Optical Biopsies and Microscopic Techniques III; International Society for Optics and Photonics: Bellington, WA, USA, 1999; pp. 185–196. [Google Scholar]
- Gustafsson, M.G.L.; Shao, L.; Carlton, P.M.; Wang, C.J.R.; Golubovskaya, I.N.; Cande, W.Z.; Agard, D.A.; Sedat, J.W. Three-dimensional resolution doubling in wide-field fluorescence microscopy by structured illumination. Biophys. J. 2008, 94, 4957–4970. [Google Scholar] [CrossRef] [Green Version]
- Gustafsson, M.G.L. Surpassing the lateral resolution limit by a factor of two using structured illumination microscopy. J. Microsc. 2000, 198, 82–87. [Google Scholar] [CrossRef] [Green Version]
- Förster, R.; Lu-Walther, H.-W.; Jost, A.; Kielhorn, M.; Wicker, K.; Heintzmann, R. Simple structured illumination microscope setup with high acquisition speed by using a spatial light modulator. Opt. Express 2014, 22, 20663–20677. [Google Scholar] [CrossRef]
- Chen, Y.; Cao, R.; Liu, W.; Zhu, D.; Zhang, Z.; Kuang, C.; Liu, X. Widefield and total internal reflection fluorescent structured illumination microscopy with scanning galvo mirrors. J. Biomed. Opt. 2018, 23, 1–9. [Google Scholar] [CrossRef] [Green Version]
- Schneckenburger, H.; Richter, V.; Wagner, M. Live-cell optical microscopy with limited light doses. Spie Spotlight Ser. 2018. [Google Scholar] [CrossRef]
- Müller, M.; Mönkemöller, V.; Hennig, S.; Hübner, W.; Huser, T. Open-source image reconstruction of super-resolution structured illumination microscopy data in ImageJ. Nat. Commun. 2016, 7, 10980. [Google Scholar] [CrossRef] [Green Version]
- Axelrod, D. Cell-substrate contacts illuminated by total internal reflection fluorescence. J. Cell Biol. 1981, 89, 141–145. [Google Scholar] [CrossRef] [Green Version]
- Schneckenburger, H. Total internal reflection fluorescence microscopy: Technical innovations and novel applications. Curr. Opin. Biotechnol. 2005, 16, 13–18. [Google Scholar] [CrossRef]
- Axelrod, D. Selective imaging of surface fluorescence with very high aperture microscope objectives. J. Biomed. Opt. 2001, 6, 6–13. [Google Scholar] [CrossRef]
- Chung, E.; Kim, D.; So, P.T. Extended resolution wide-field optical imaging: Objective-launched standing-wave total internal reflection fluorescence microscopy. Opt. Lett. 2006, 31, 945. [Google Scholar] [CrossRef]
- Chung, E.; Kim, D.; Cui, Y.; Kim, Y.H.; So, P.T. Two-dimensional standing wave total internal reflection fluorescence microscopy: Superresolution imaging of single molecular and biological specimens. Biophys. J. 2007, 93, 1747–1757. [Google Scholar] [CrossRef] [Green Version]
- Brunstein, M.; Wicker, K.; Hérault, K.; Heintzmann, R.; Oheim, M. Full-field dual-color 100-nm super-resolution imaging reveals organization and dynamics of mitochondrial and ER networks. Opt. Express. 2013, 21, 26162–26173. [Google Scholar] [CrossRef]
- Young, L.J.; Ströhl, F.; Kaminski, C.F. A Guide to Structured Illumination TIRF Microscopy at high speed with multiple colors. J. Vis. Exp. 2016, 111, e53988. [Google Scholar] [CrossRef]
- Guo, M.; Chandris, P.; Giannini, J.P.; Trexler, A.J.; Fischer, R.; Chen, J.; Vishwasrao, H.D.; Rey-Suarez, I.; Wu, Y.; Wu, X.; et al. Single-shot super-resolution total internal reflection fluorescence microscopy. Nat. Methods 2018, 15, 425–428. [Google Scholar] [CrossRef]
- Richter, V.; Piper, M.; Wagner, M.; Schneckenburger, H. Increasing resolution in live cell microscopy by Structured Illumination (SIM). Appl. Sci. 2019, 9, 1188. [Google Scholar] [CrossRef] [Green Version]
- Pessin, J.E.; Saltiel, A.R. Signaling pathways in insulin action: Molecular targets of insulin resistance. J. Clin. Investig. 2000, 106, 165–169. [Google Scholar] [CrossRef] [Green Version]
- Kahn, S.E.; Hull, R.L.; Utzschneider, K.M. Mechanisms linking obesity to insulin resistance and type 2 diabetes. Nature 2006, 444, 840–846. [Google Scholar] [CrossRef]
- Klip, A. The many ways to regulate glucose transporter 4. Appl. Physiol. Nutr. Metab. 2009, 34, 481–487. [Google Scholar] [CrossRef]
- Bryant, N.J.; Govers, R.; James, D.E. Regulated transport of the glucose transporter GLUT4. Nat. Rev. Mol. Cell. Biol. 2002, 3, 267–277. [Google Scholar] [CrossRef]
- Stockli, J.; Fazakerley, D.J.; James, D.E. GLUT4 exocytosis. J. Cell Sci. 2011, 124, 4147–4159. [Google Scholar] [CrossRef] [Green Version]
- Lanzerstorfer, P.; Stadlbauer, V.; Chtcheglova, L.A.; Haselgrübler, R.; Borgmann, D.; Wruss, J.; Hinterdorfer, P.; Schröder, K.; Winkler, S.M.; Höglinger, O.; et al. Identification of novel insulin mimetic drugs by quantitative total internal reflection fluorescence (TIRF) microscopy. Br. J. Pharmacol. 2014, 171, 5237–5251. [Google Scholar] [CrossRef] [Green Version]
- Stadlbauer, V.; Haselgrübler, R.; Lanzerstorfer, P.; Plochberger, B.; Borgmann, D.; Jacak, J.; Winkler, S.M.; Schröder, K.; Höglinger, O.; Weghuber, J. Biomolecular characterization of putative antidiabetic herbal extracts. PLoS ONE 2016, 11, e0148109. [Google Scholar] [CrossRef]
- Sun, Y.; Jaldin-Fincati, J.; Liu, Z.; Bilan, P.J.; Klip, A. A complex of Rab13 with MICAL-L2 and α-actinin-4 is essential for insulin-dependent GLUT4 exocytosis. Mol. Biol. Cell 2016, 27, 75–89. [Google Scholar] [CrossRef]
- Camus, S.M.; Camus, M.D.; Figueras-Novoa, C.; Boncompain, G.; Sadacca, L.A.; Esk, C.; Bigot, A.; Gould, G.W.; Kioumourtzoglou, D.; Perez, F.; et al. CHC22 clathrin mediates traffic from early secretory compartments for human GLUT4 pathway biogenesis. J. Cell Biol. 2020, 219, e201812135. [Google Scholar] [CrossRef] [Green Version]
- Knudsen, J.R.; Steenberg, D.E.; Hingst, J.R.; Hodgson, L.R.; Henriquez-Olguin, C.; Li, Z.; Kiens, B.; Richter, E.A.; Wojtaszewski, J.F.P.; Verkade, P.; et al. Prior exercise in humans redistributes intramuscular GLUT4 and enhances insulin-stimulated sarcolemmal and endosomal GLUT4 translocation. Mol. Metab. 2020, 39, 100998. [Google Scholar] [CrossRef]
- Hatakeyama, H.; Kanzaki, M. Heterotypic endosomal fusion as an initial trigger for insulin-induced glucose transporter 4 (GLUT4) translocation in skeletal muscle. J. Physiol. 2017, 595, 5603–5621. [Google Scholar] [CrossRef] [PubMed] [Green Version]
- Gao, L.; Chen, J.; Gao, J.; Wang, H.; Xiong, W. Super-resolution microscopy reveals the insulin-resistance regulated reorganization of GLUT4 on plasma membranes. J. Cell Sci. 2017, 130, 396–405. [Google Scholar] [CrossRef] [PubMed] [Green Version]
- Lizunov, V.A.; Stenkula, K.; Troy, A.; Cushman, S.W.; Zimmerberg, J. Insulin Regulates Glut4 Confinement in Plasma Membrane Clusters in Adipose Cells. PLoS ONE 2013, 8, e57559. [Google Scholar] [CrossRef] [PubMed] [Green Version]
- Fujita, H.; Hatakeyama, H.; Watanabe, T.M.; Sato, M.; Higuchi, H.; Kanzaki, M. Identification of three distinct functional sites of insulin-mediated GLUT4 trafficking in adipocytes using quantitative single molecule imaging. Mol. Biol. Cell 2010, 21, 2721–2731. [Google Scholar] [CrossRef] [PubMed] [Green Version]
- Haselgrübler, R.; Stadtbauer, V.; Stübl, F.; Schwarzinger, B.; Rudzionyte, I.; Himmelsbach, M.; Iken, M.; Weghuber, J. Insulin Mimetic Properties of Extracts Prepared from Bellis perennis. Molecules 2018, 23, 2605. [Google Scholar] [CrossRef] [PubMed] [Green Version]
- Thorens, B. GLUT2, glucose sensing and glucose homeostasis. Diabetologia 2015, 58, 221–232. [Google Scholar] [CrossRef] [PubMed] [Green Version]
- Cohen, M.; Kitsberg, D.; Tsykin, S.; Shulman, M.; Aroeti, B.; Nahmias, Y. Live imaging of GLUT2 glucose-dependent trafficking and its inhibition in polarized epithelial cysts. Open Biol. 2014, 4, 140091. [Google Scholar] [CrossRef] [Green Version]


© 2020 by the authors. Licensee MDPI, Basel, Switzerland. This article is an open access article distributed under the terms and conditions of the Creative Commons Attribution (CC BY) license (http://creativecommons.org/licenses/by/4.0/).
Share and Cite
Richter, V.; Lanzerstorfer, P.; Weghuber, J.; Schneckenburger, H. Super-Resolution Live Cell Microscopy of Membrane-Proximal Fluorophores. Int. J. Mol. Sci. 2020, 21, 7099. https://0-doi-org.brum.beds.ac.uk/10.3390/ijms21197099
Richter V, Lanzerstorfer P, Weghuber J, Schneckenburger H. Super-Resolution Live Cell Microscopy of Membrane-Proximal Fluorophores. International Journal of Molecular Sciences. 2020; 21(19):7099. https://0-doi-org.brum.beds.ac.uk/10.3390/ijms21197099
Chicago/Turabian StyleRichter, Verena, Peter Lanzerstorfer, Julian Weghuber, and Herbert Schneckenburger. 2020. "Super-Resolution Live Cell Microscopy of Membrane-Proximal Fluorophores" International Journal of Molecular Sciences 21, no. 19: 7099. https://0-doi-org.brum.beds.ac.uk/10.3390/ijms21197099