A Comparative Transcriptome Analysis, Conserved Regulatory Elements and Associated Transcription Factors Related to Accumulation of Fusariotoxins in Grain of Rye (Secale cereale L.) Hybrids

 , , ,
, , ,
Abstract
:
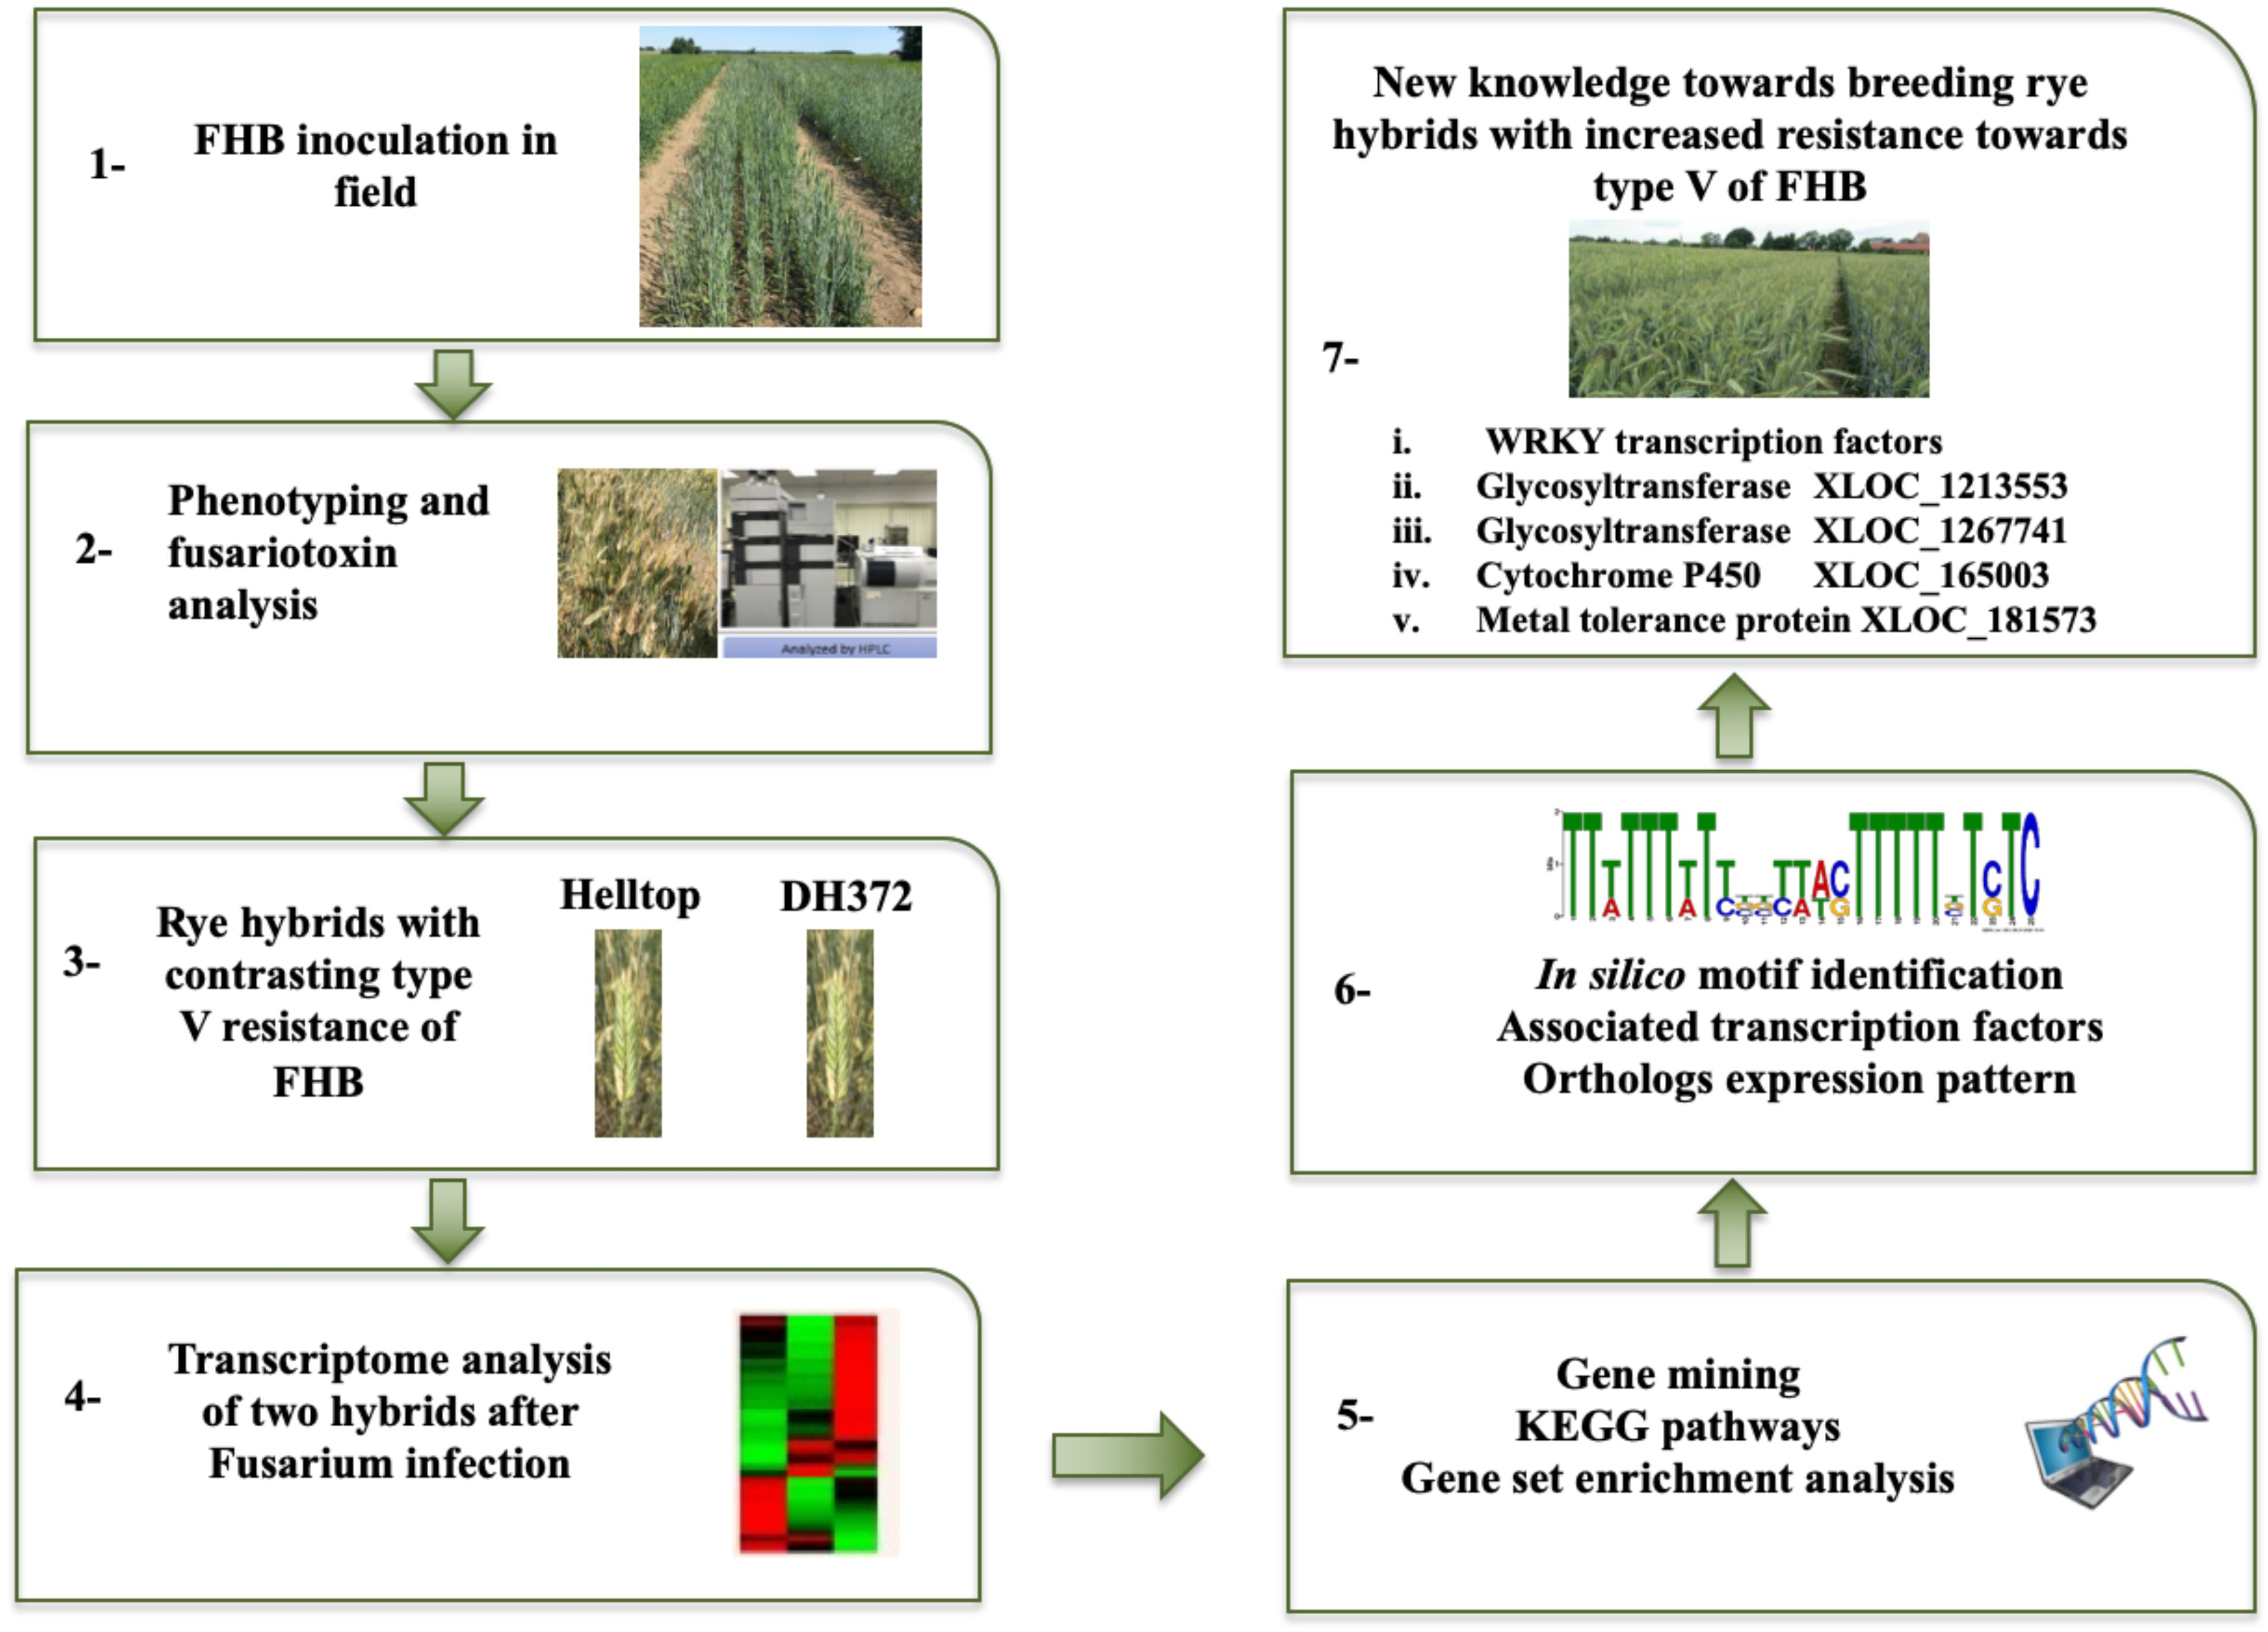
1. Introduction
2. Results
2.1. Disease Severity and Mycotoxin Analysis
2.2. Differential Gene Expression Analysis in Different Treatments
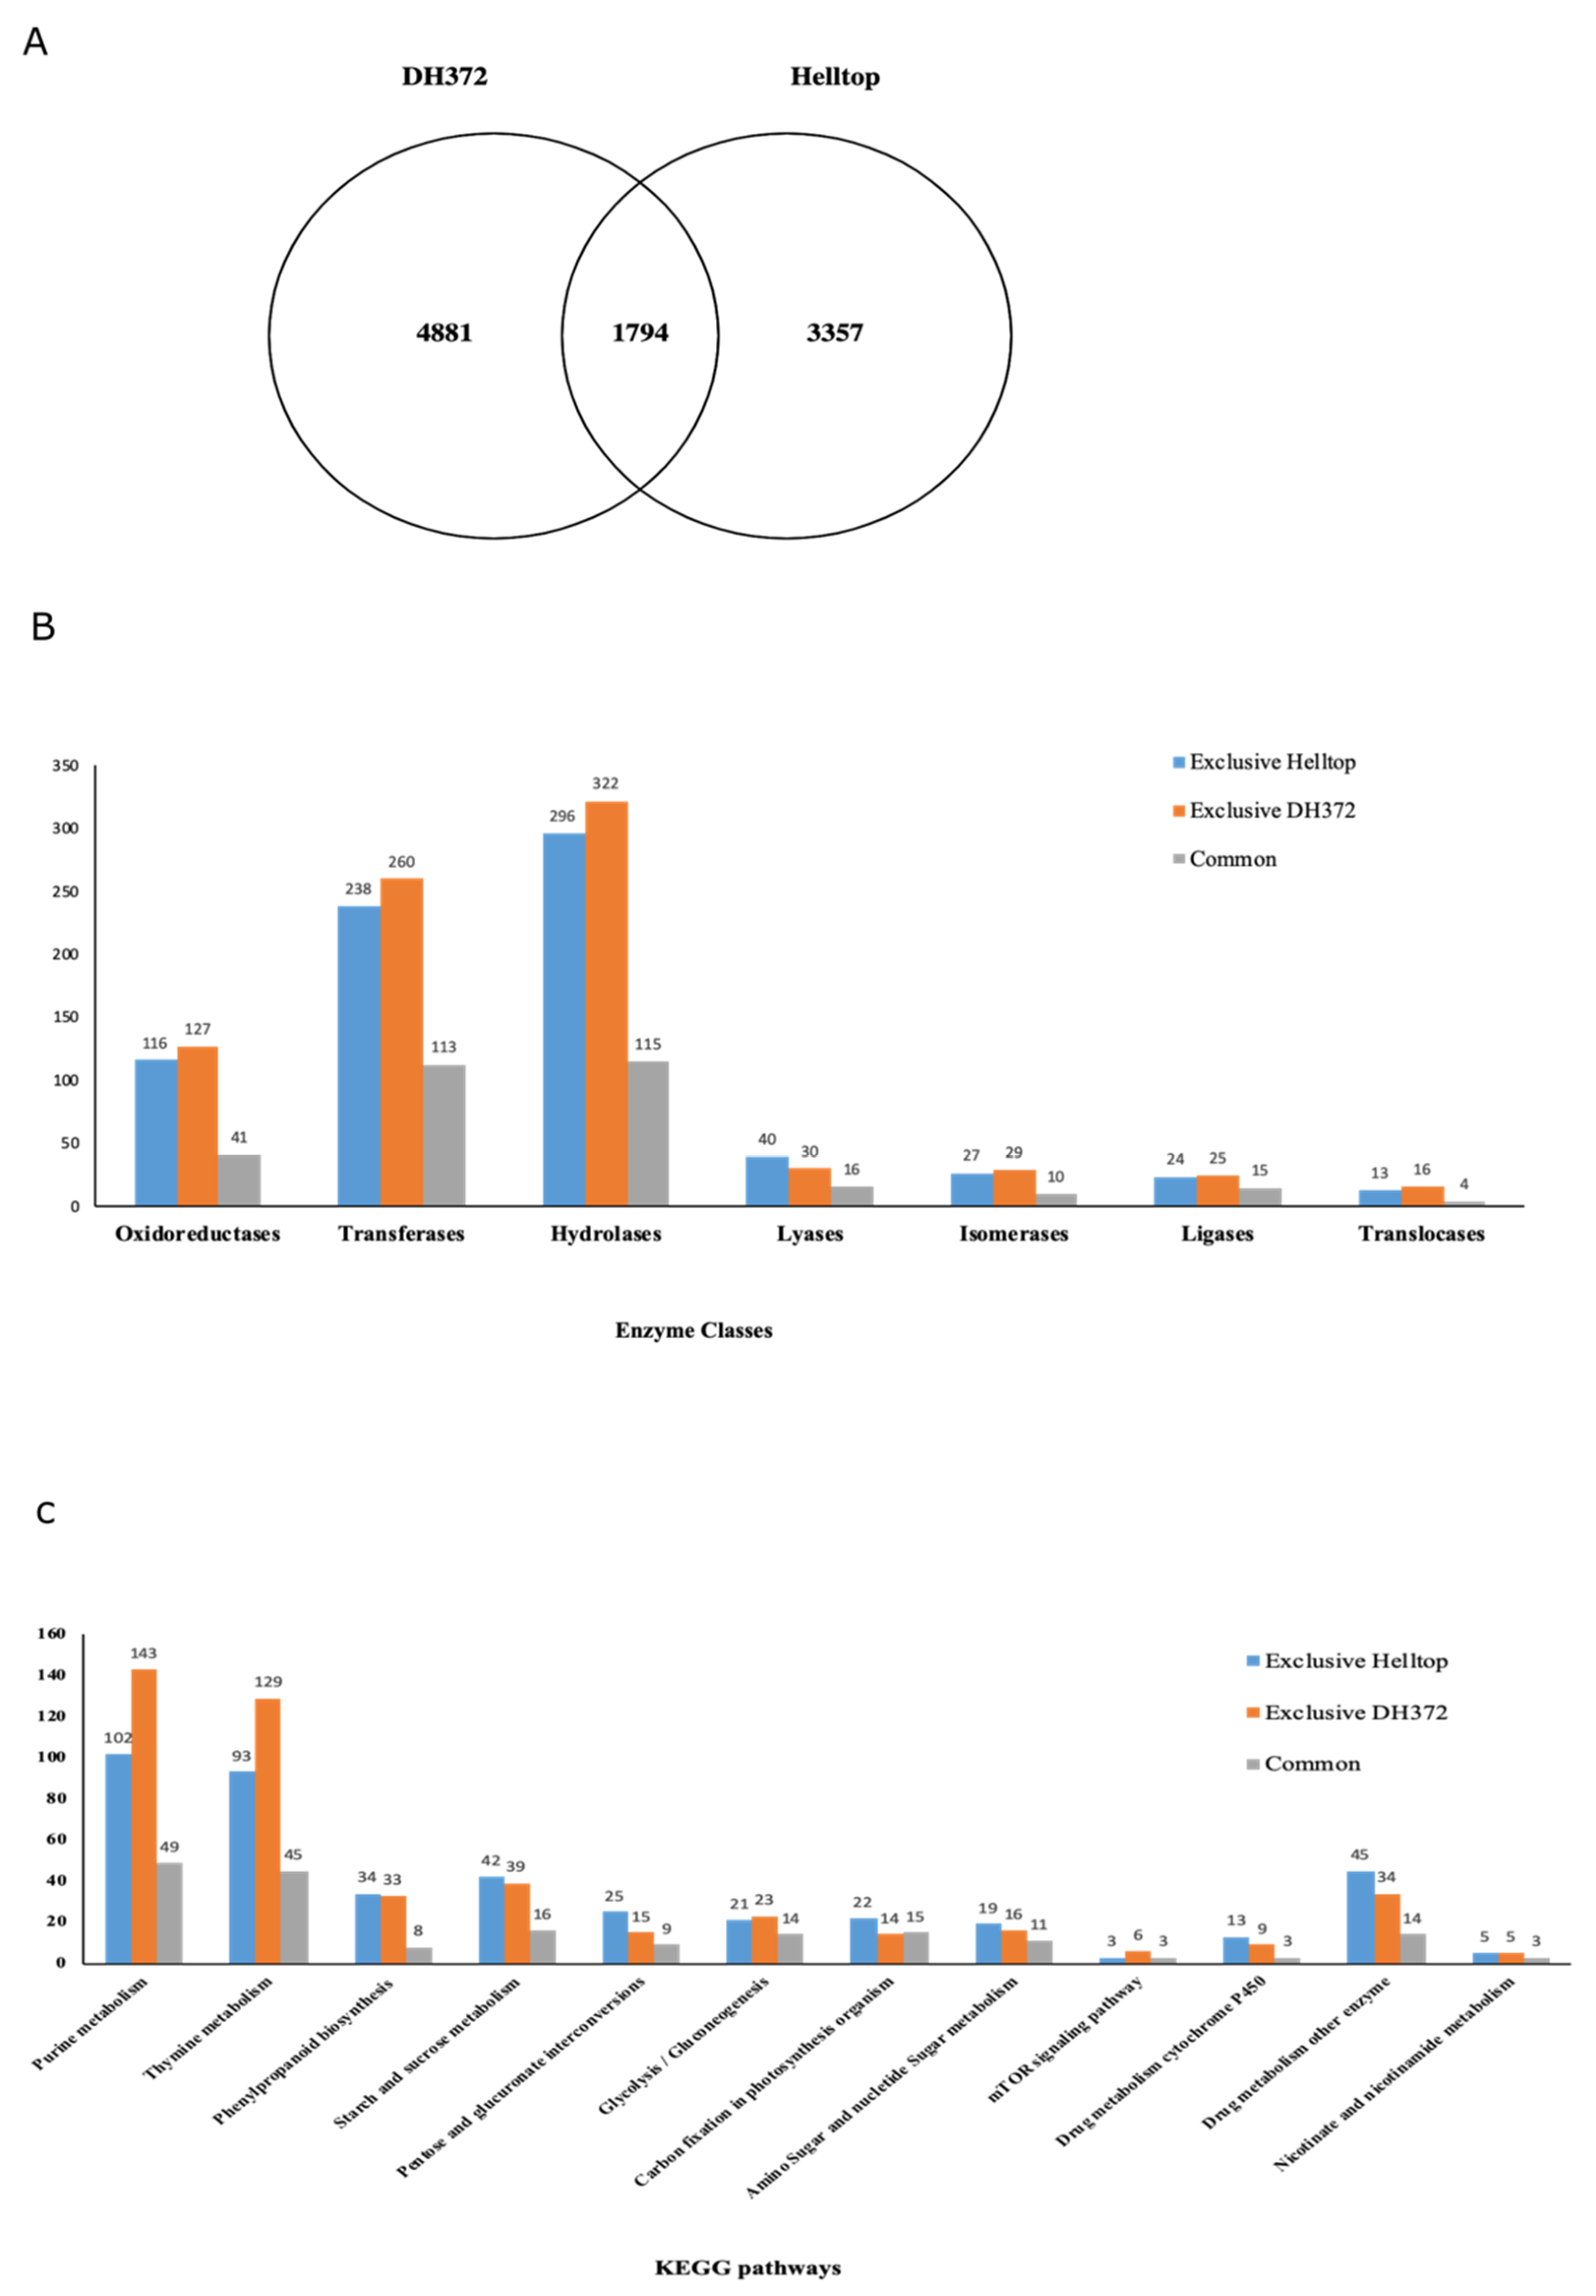
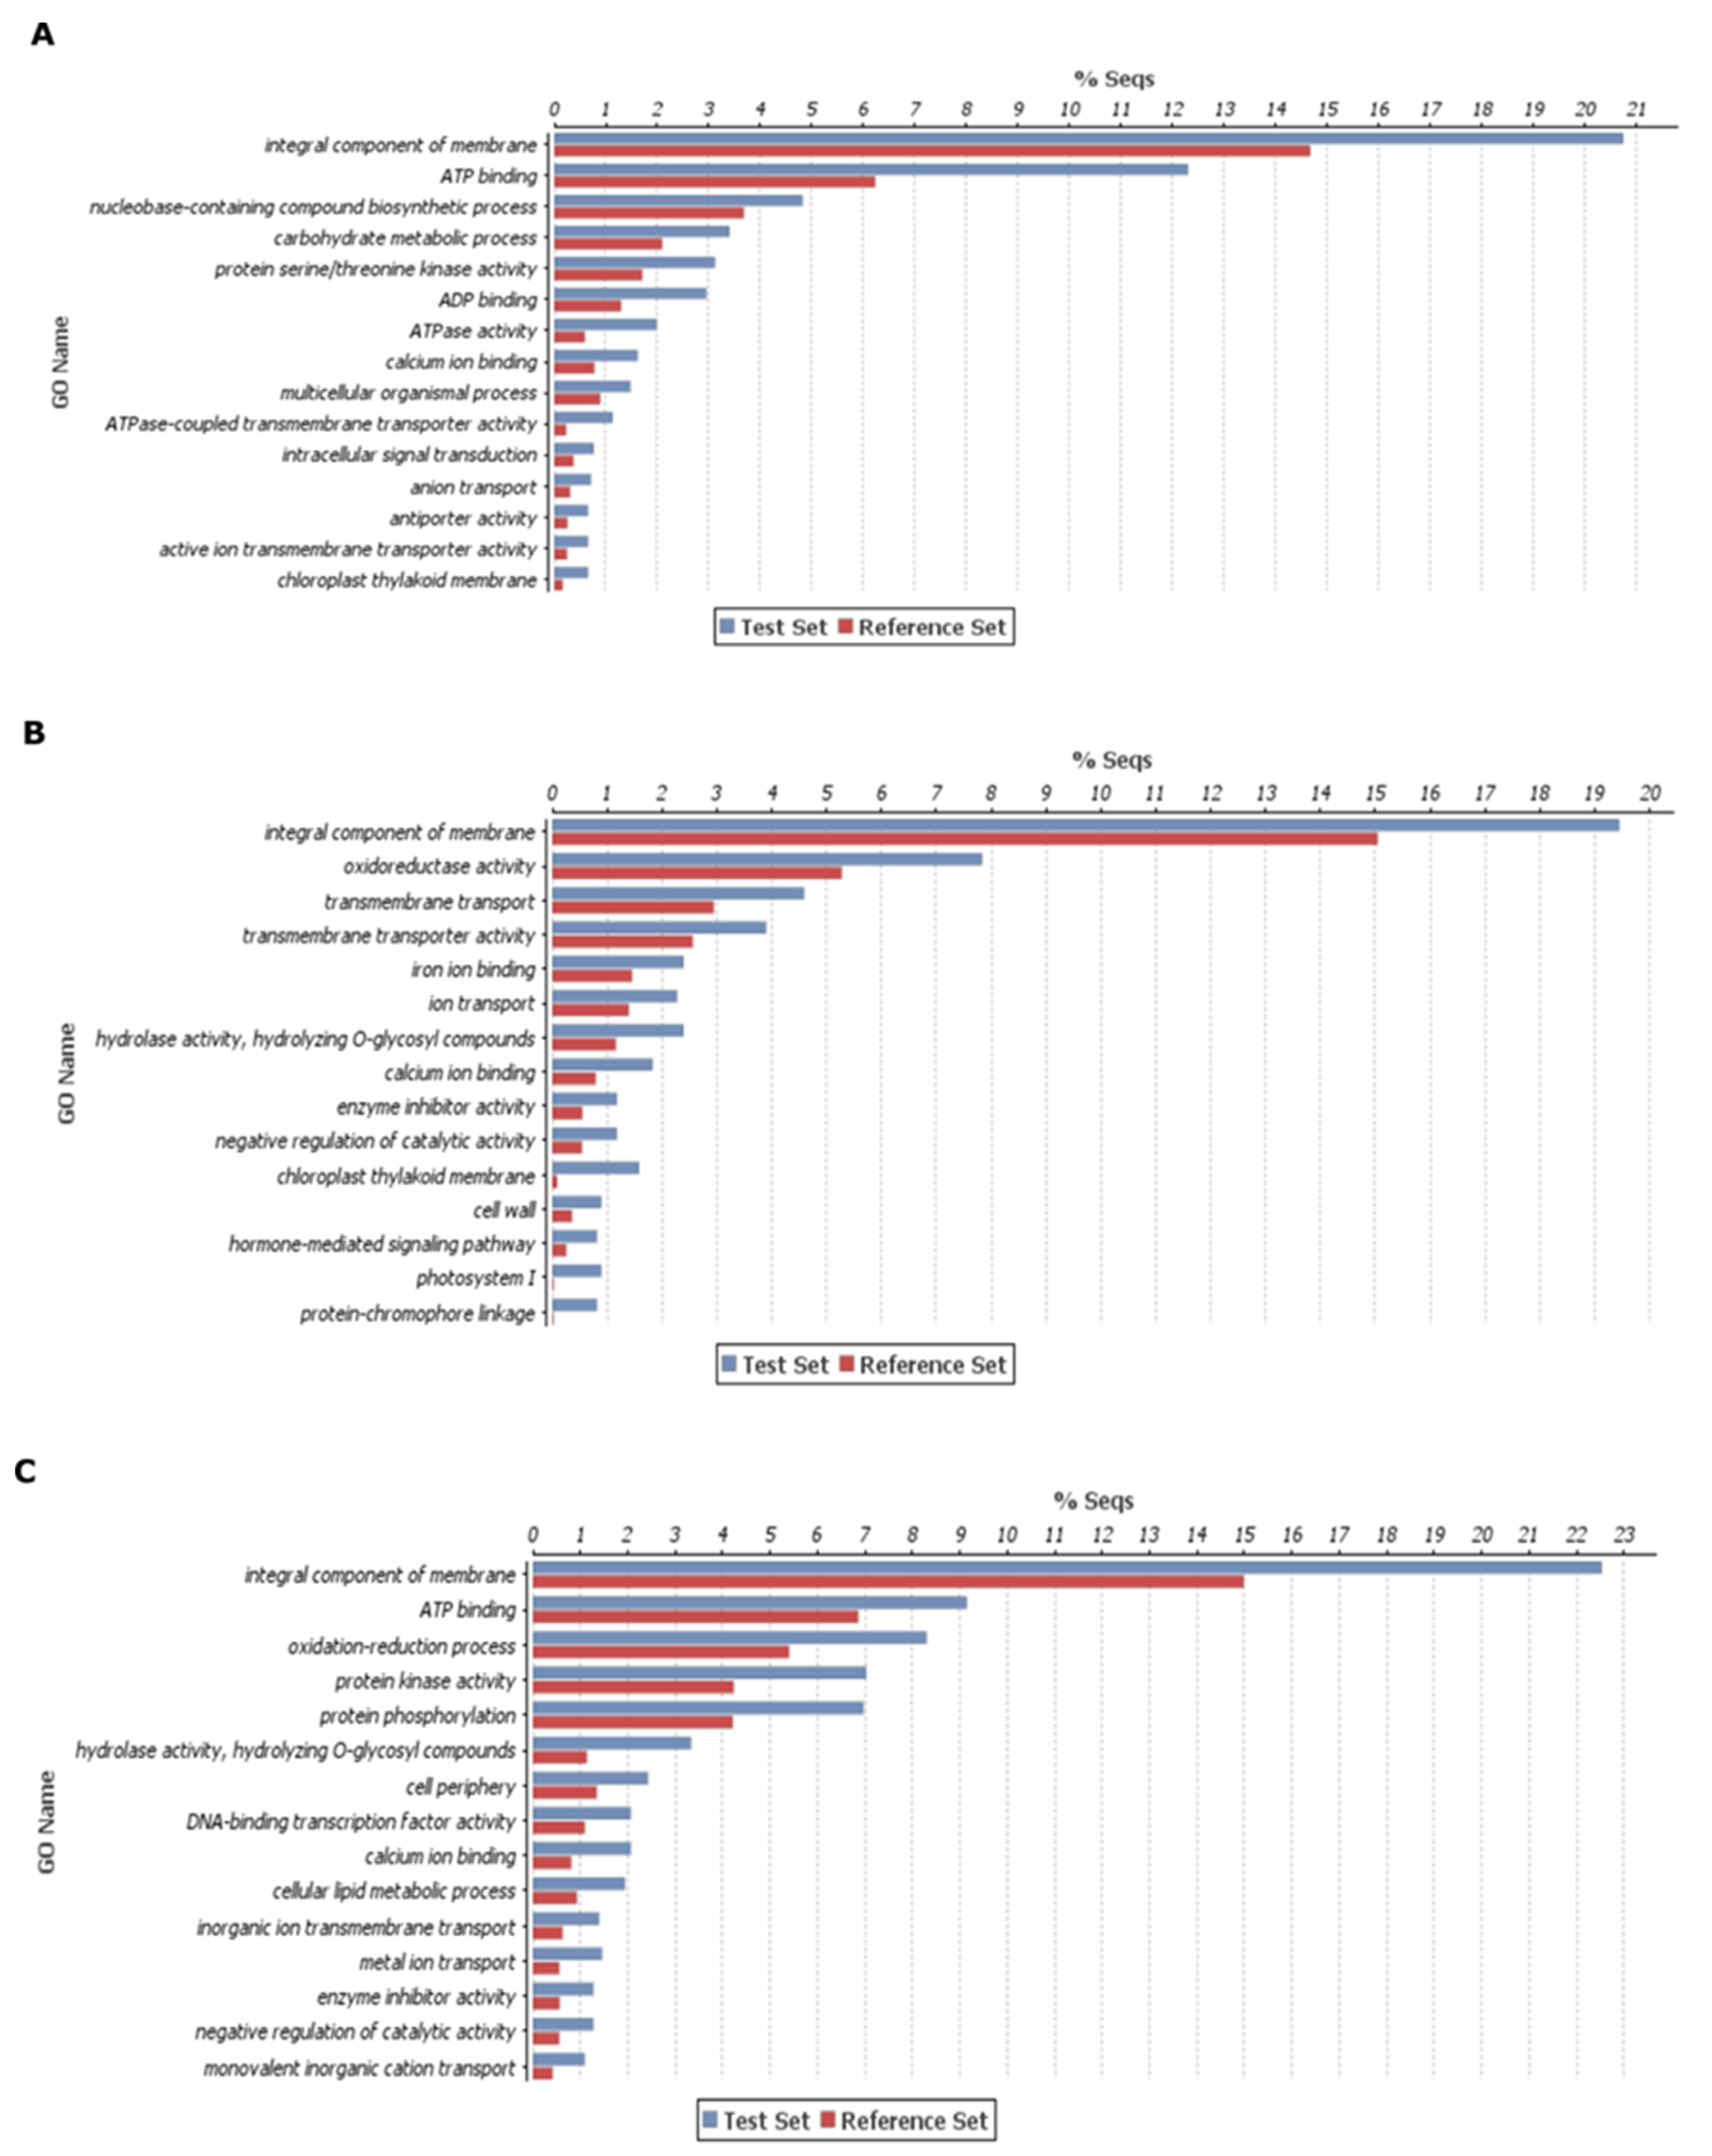
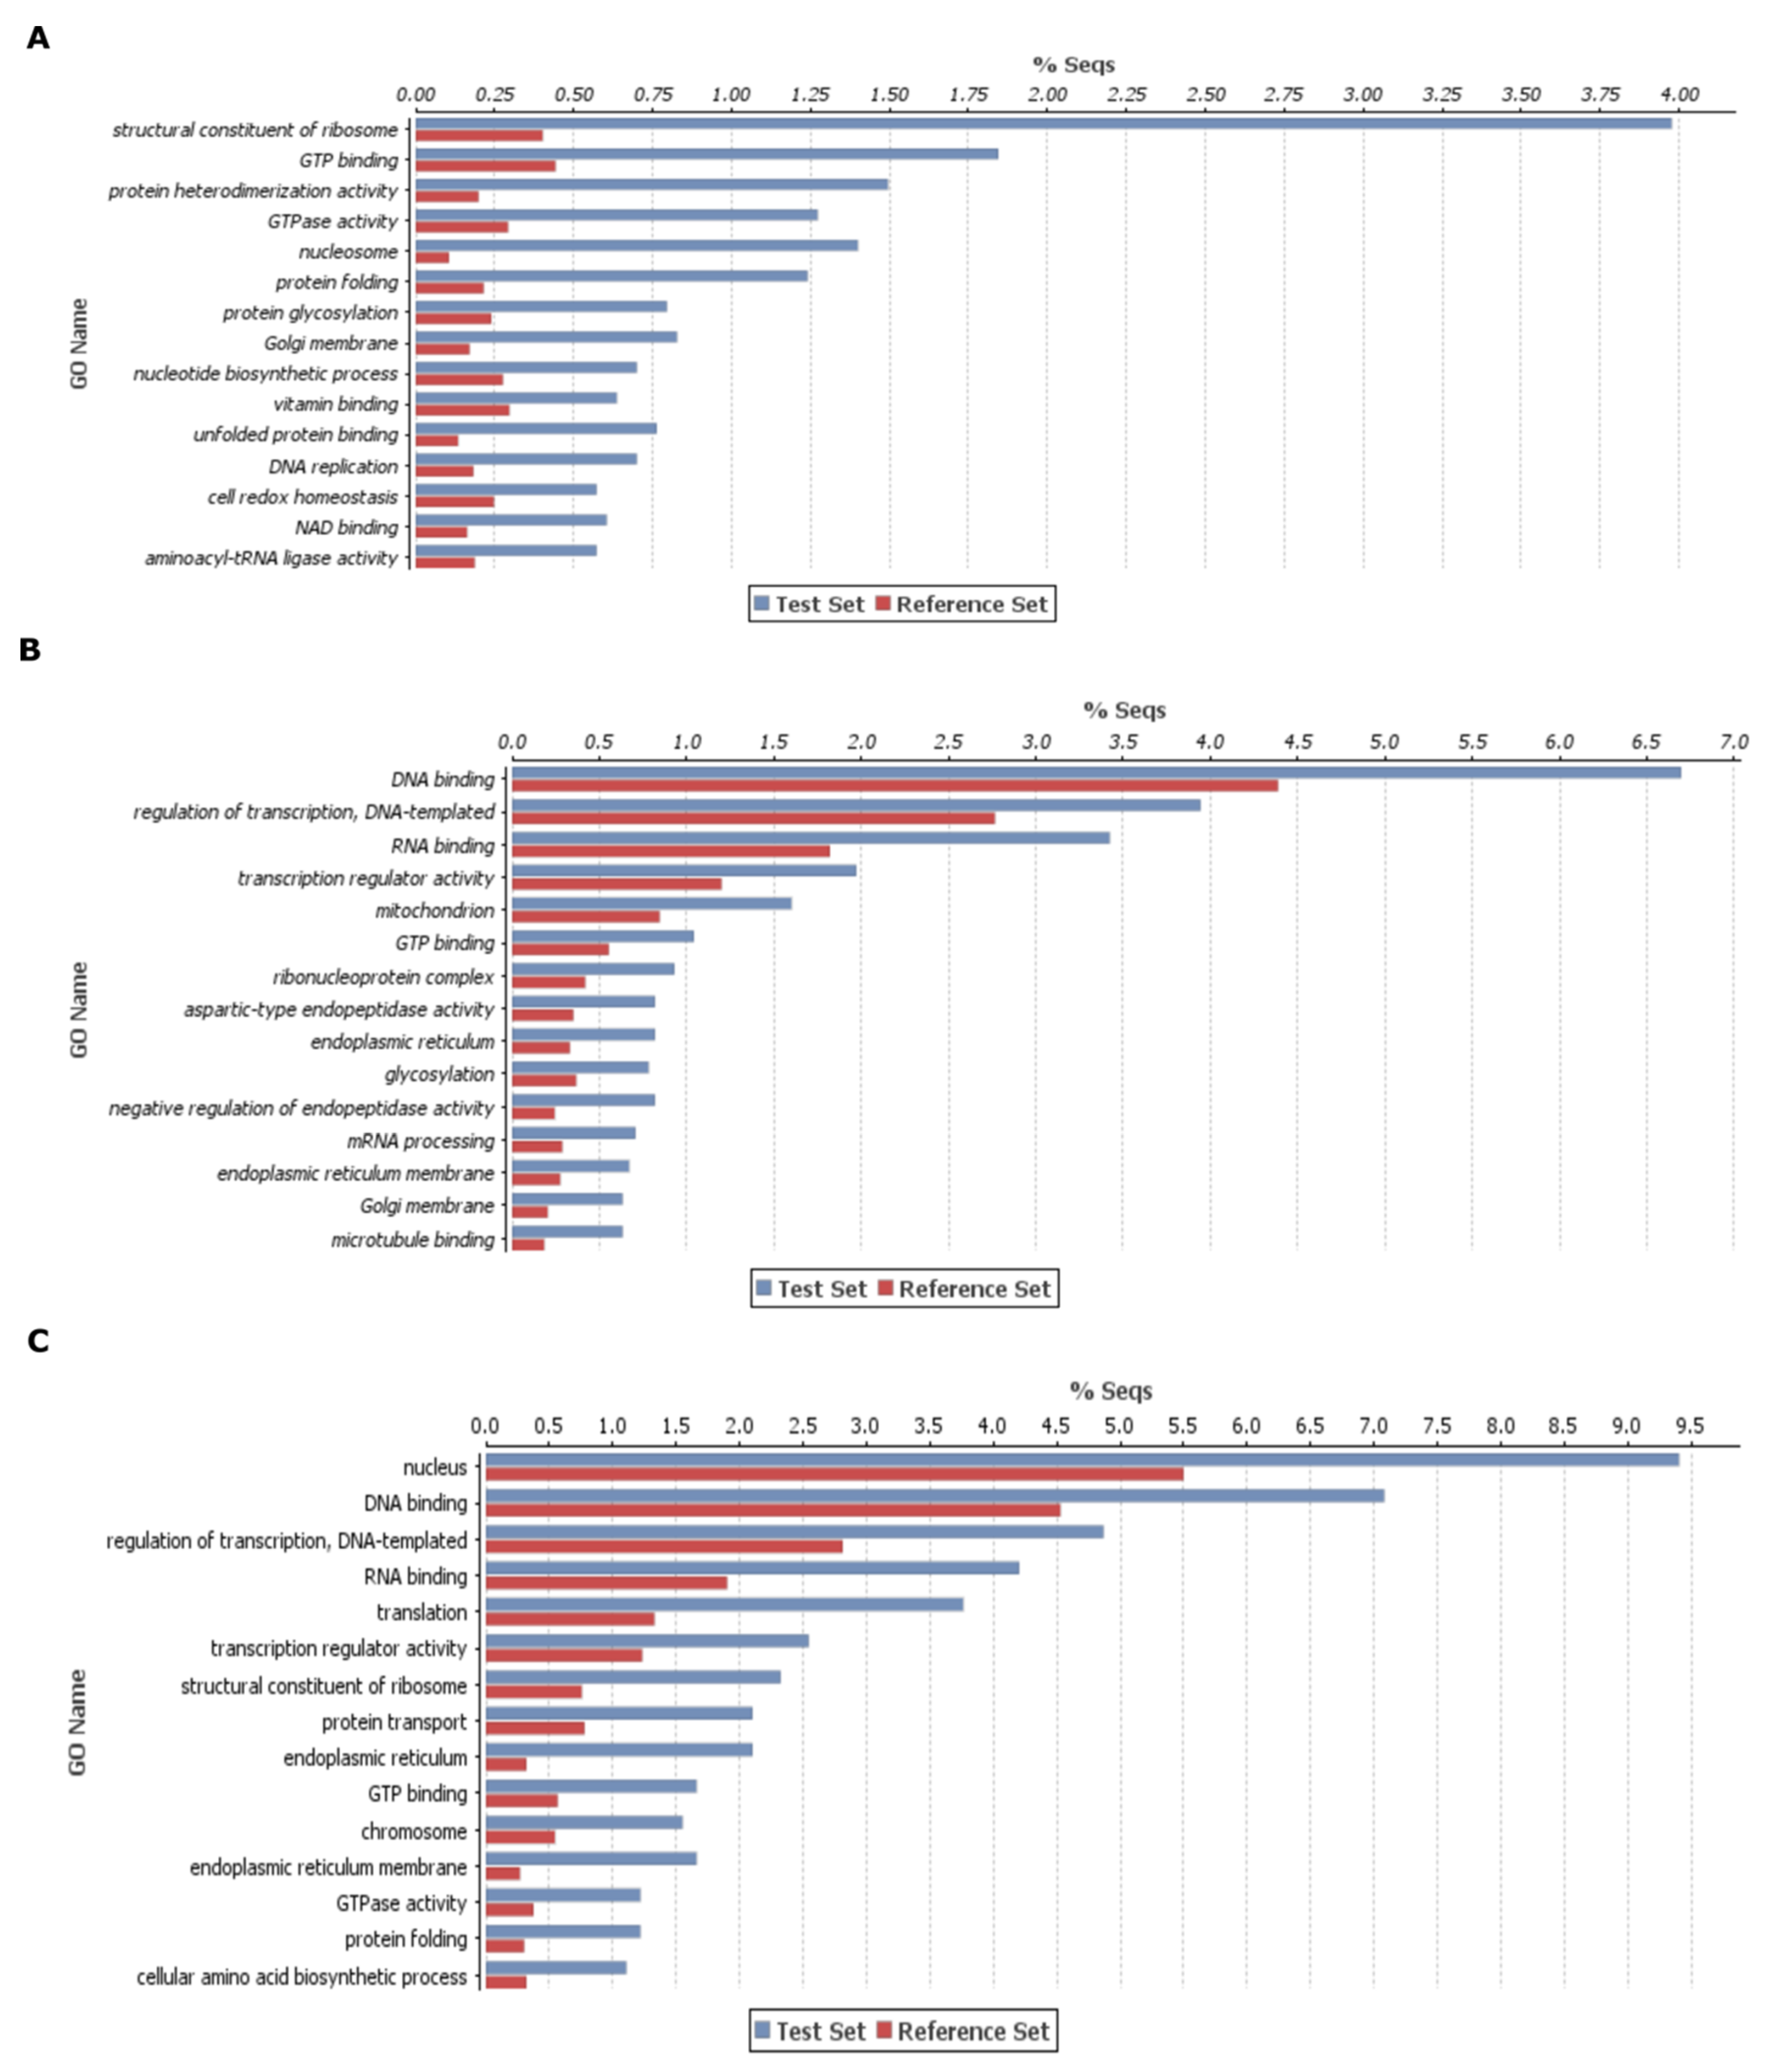
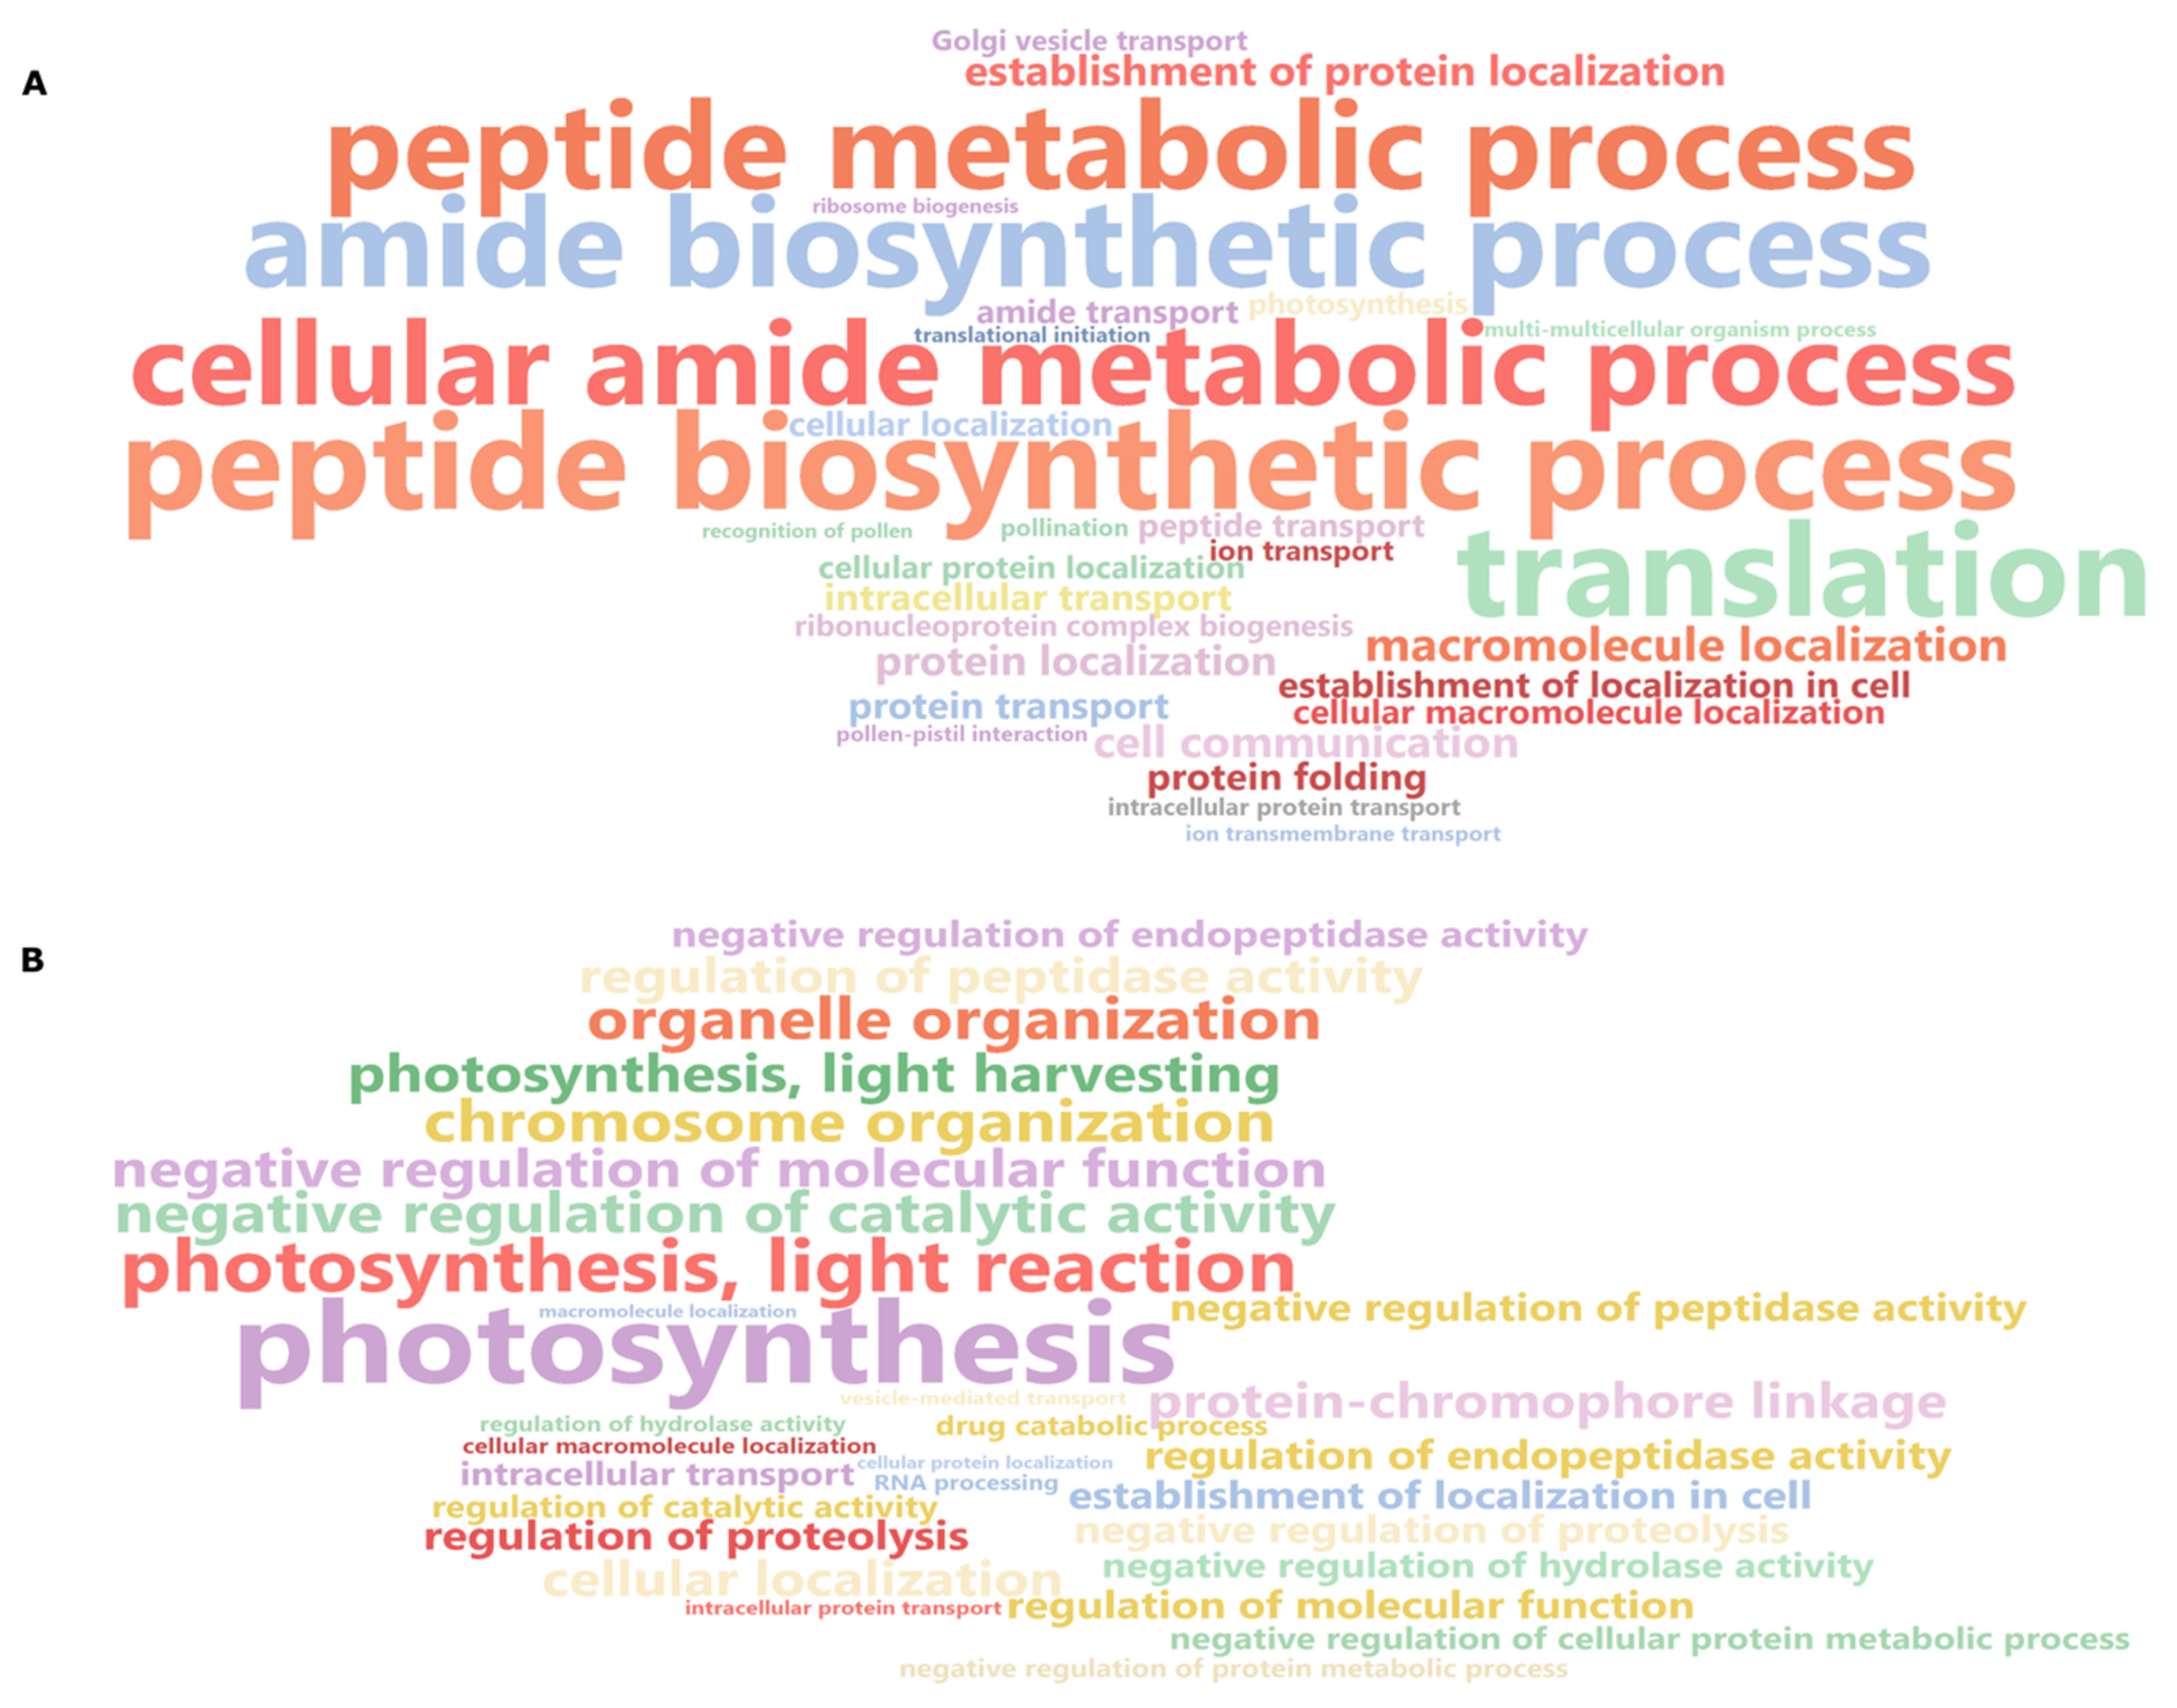
2.3. Enzyme Classes, KEGG, and Gene Enrichment Analysis of DEGs
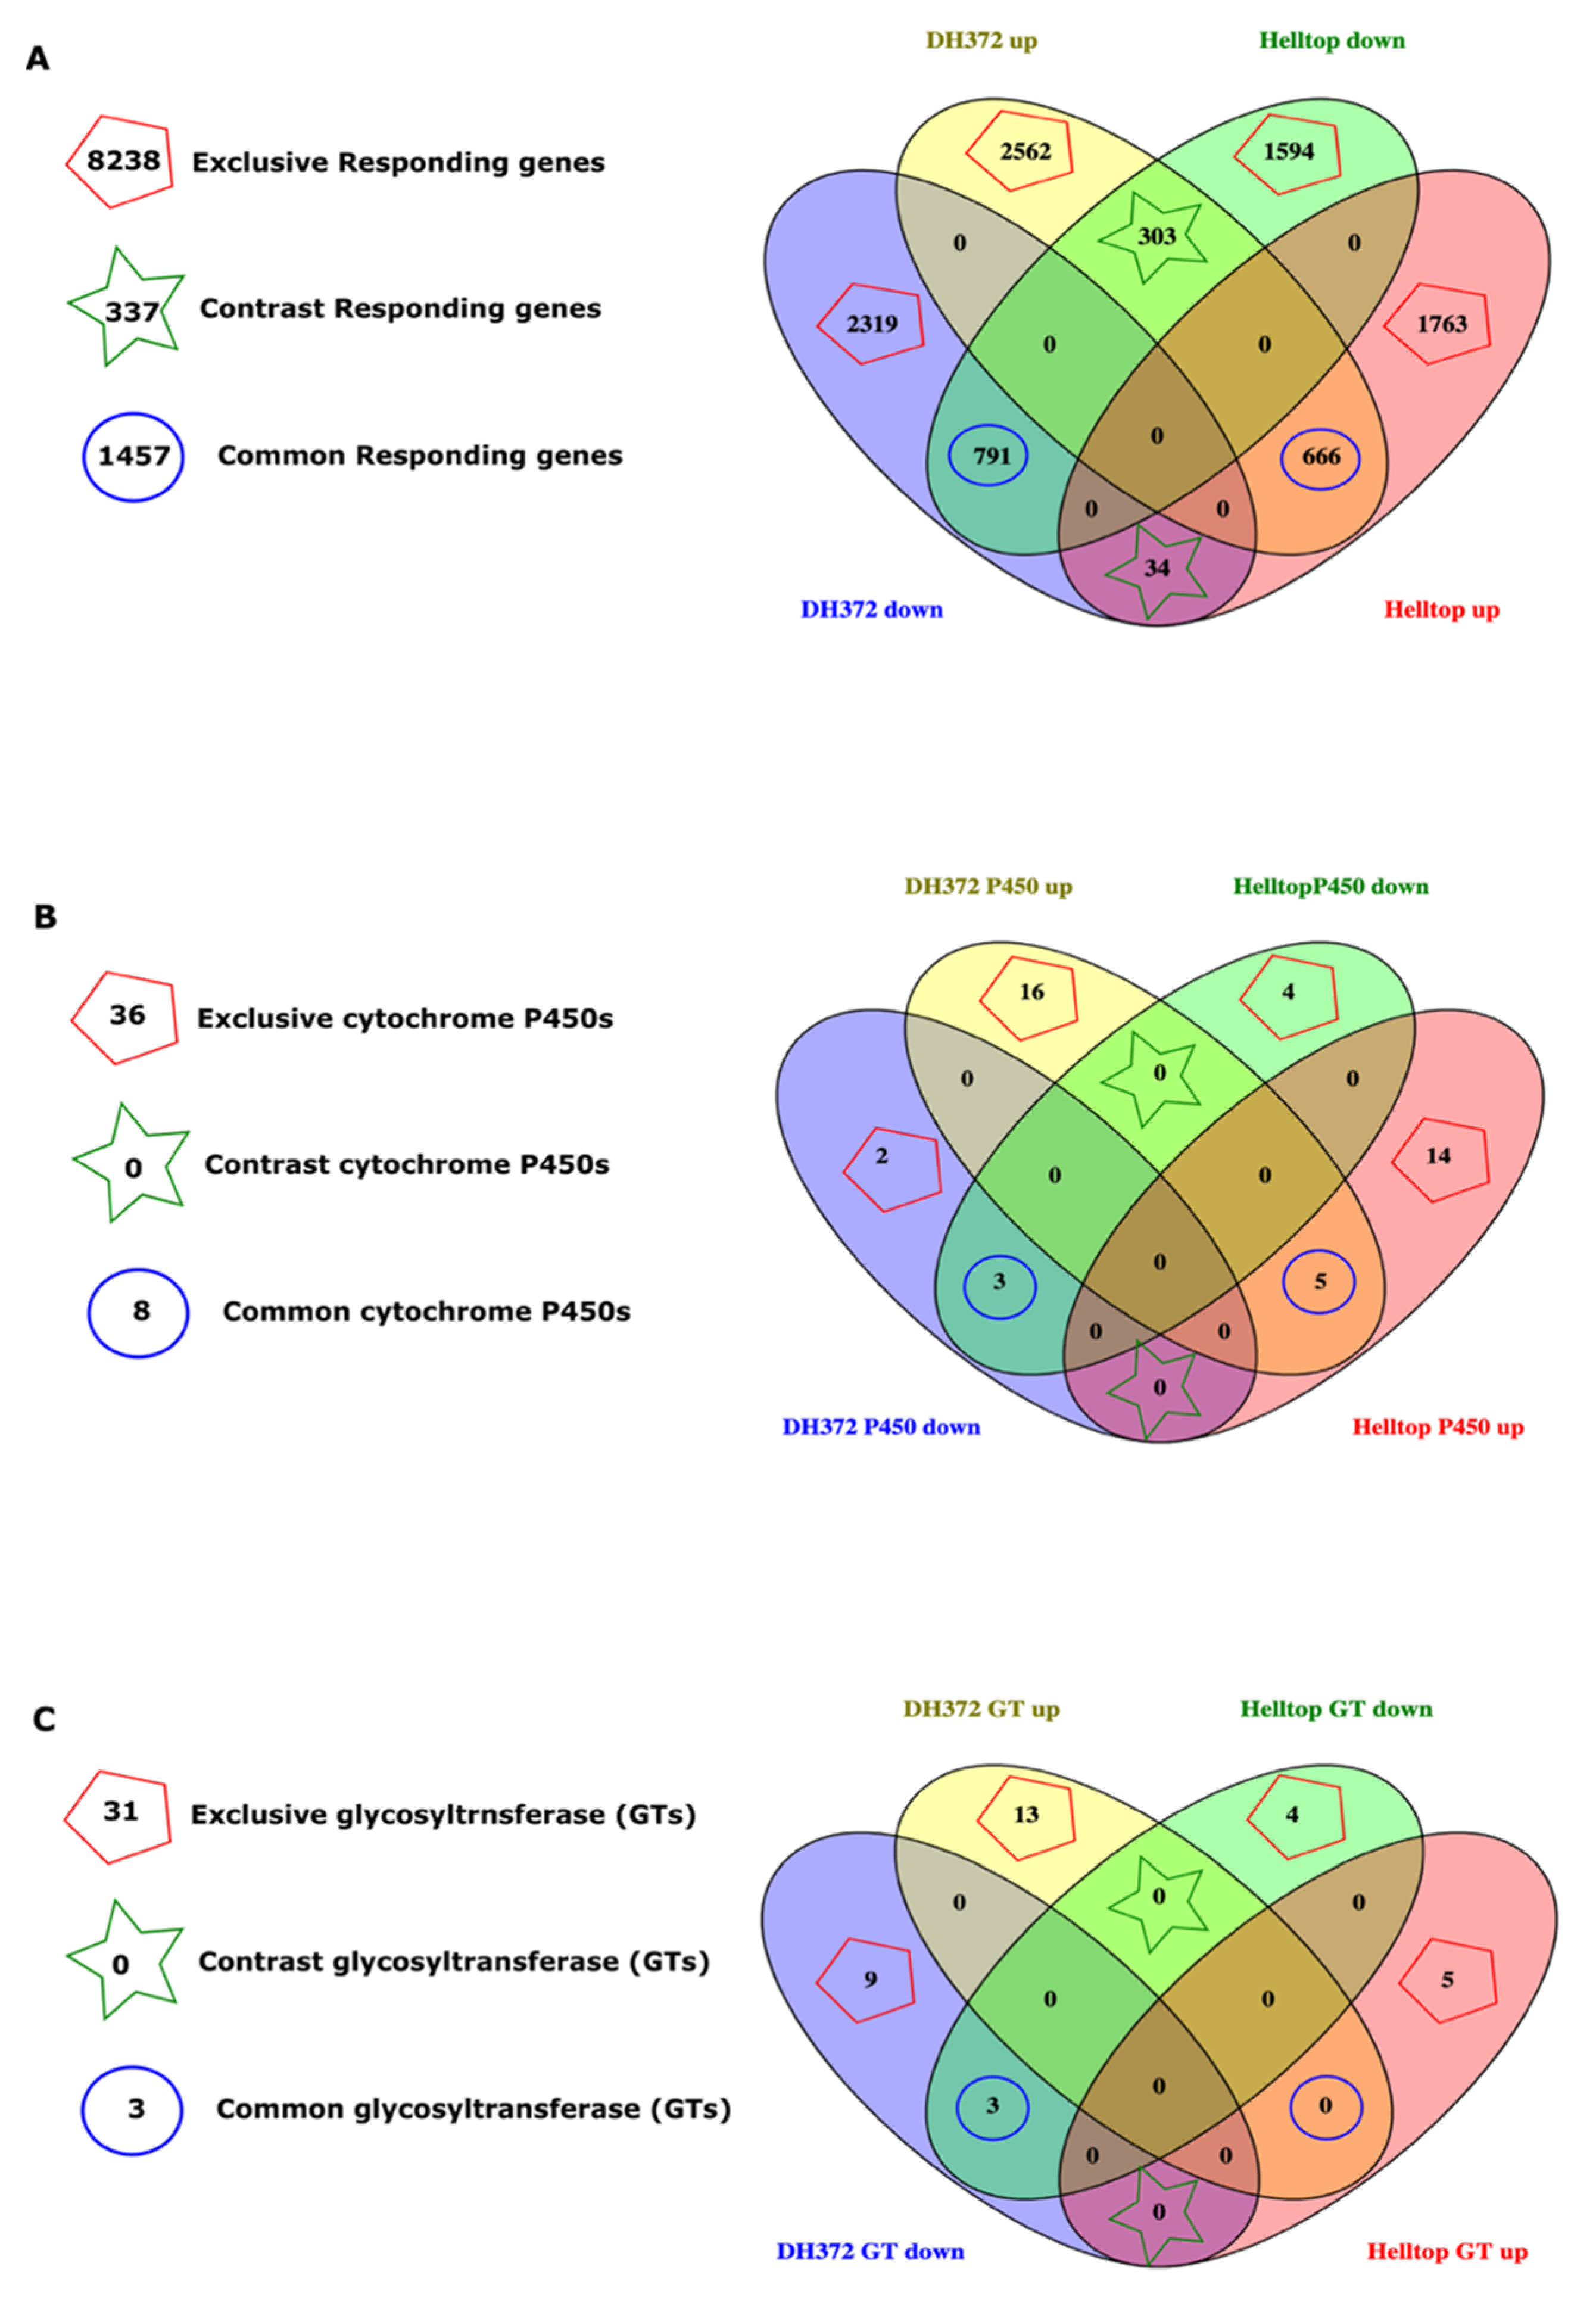
2.4. Dissection of DEGs for Mining of Candidate Genes
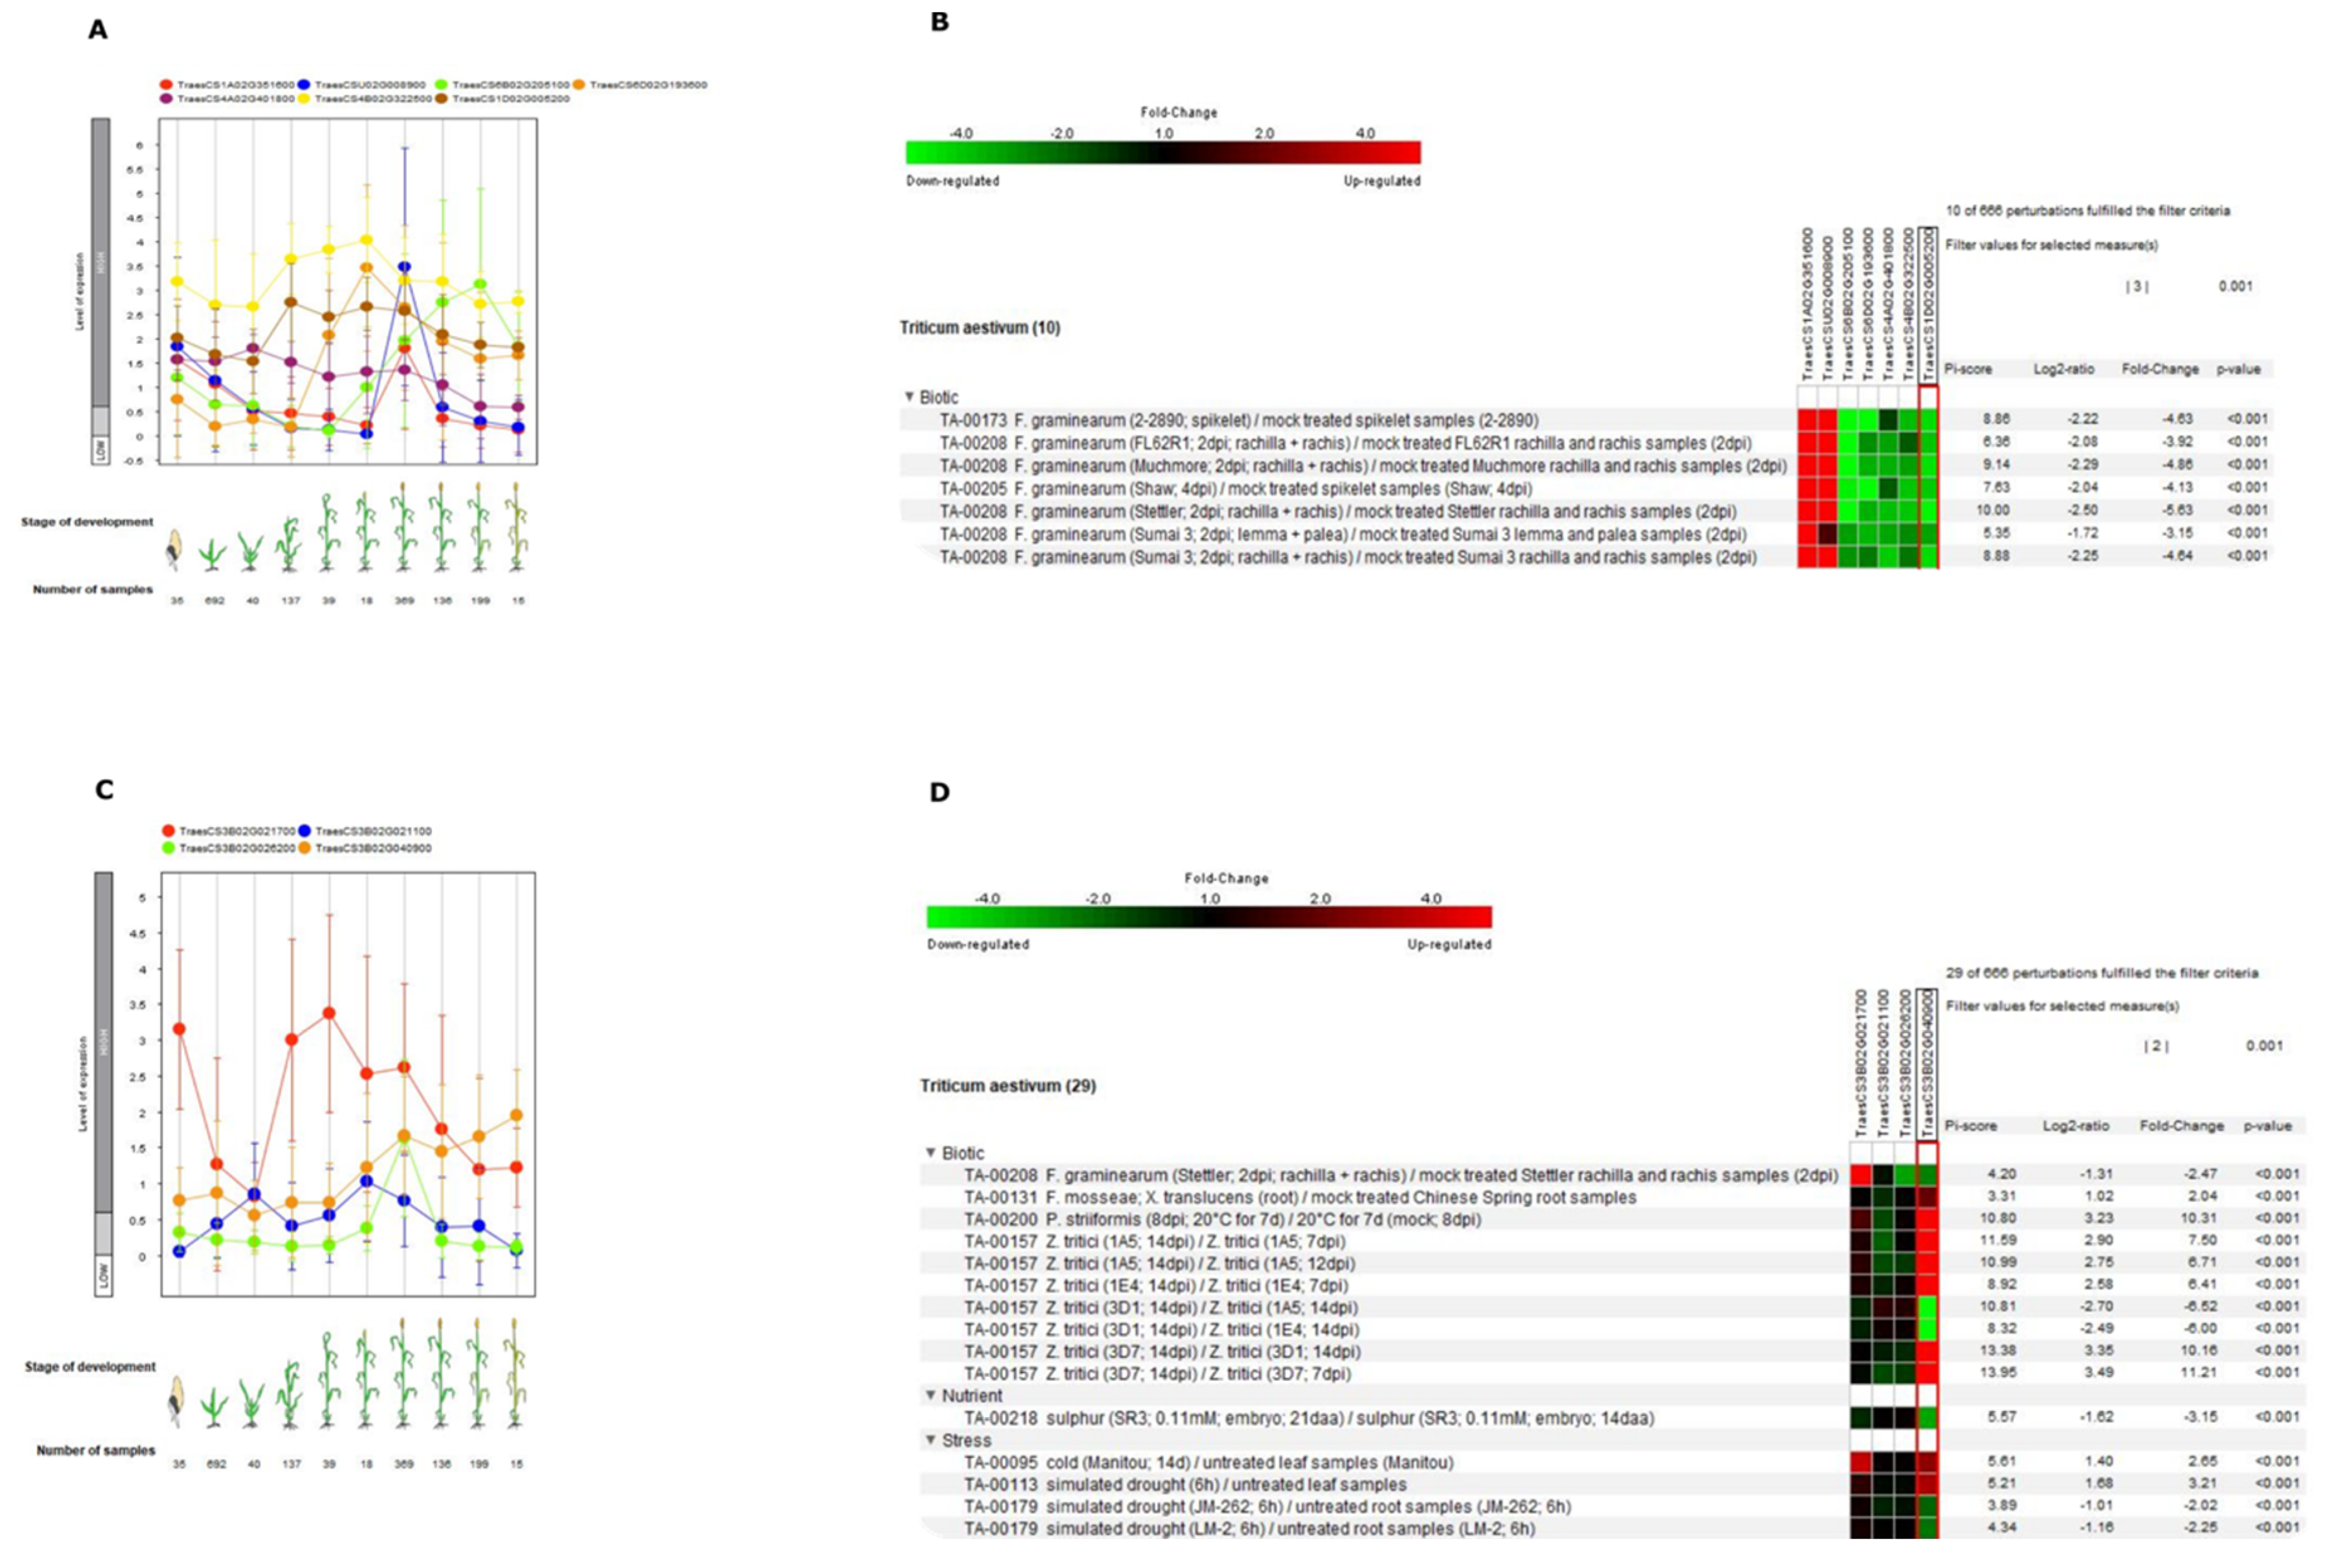
2.5. Gene Expression Profiling of Orthologs of Specific GT and Cytochrome P450s Identified in Common Responding and Exclusive Responding Category
2.6. Cis Motif Identification and Associated Transcription Factors
3. Discussion
4. Conclusions
5. Material Methods
5.1. Rye Hybrids, Inoculation, Field Disease Scoring, and Mycotoxin Analysis
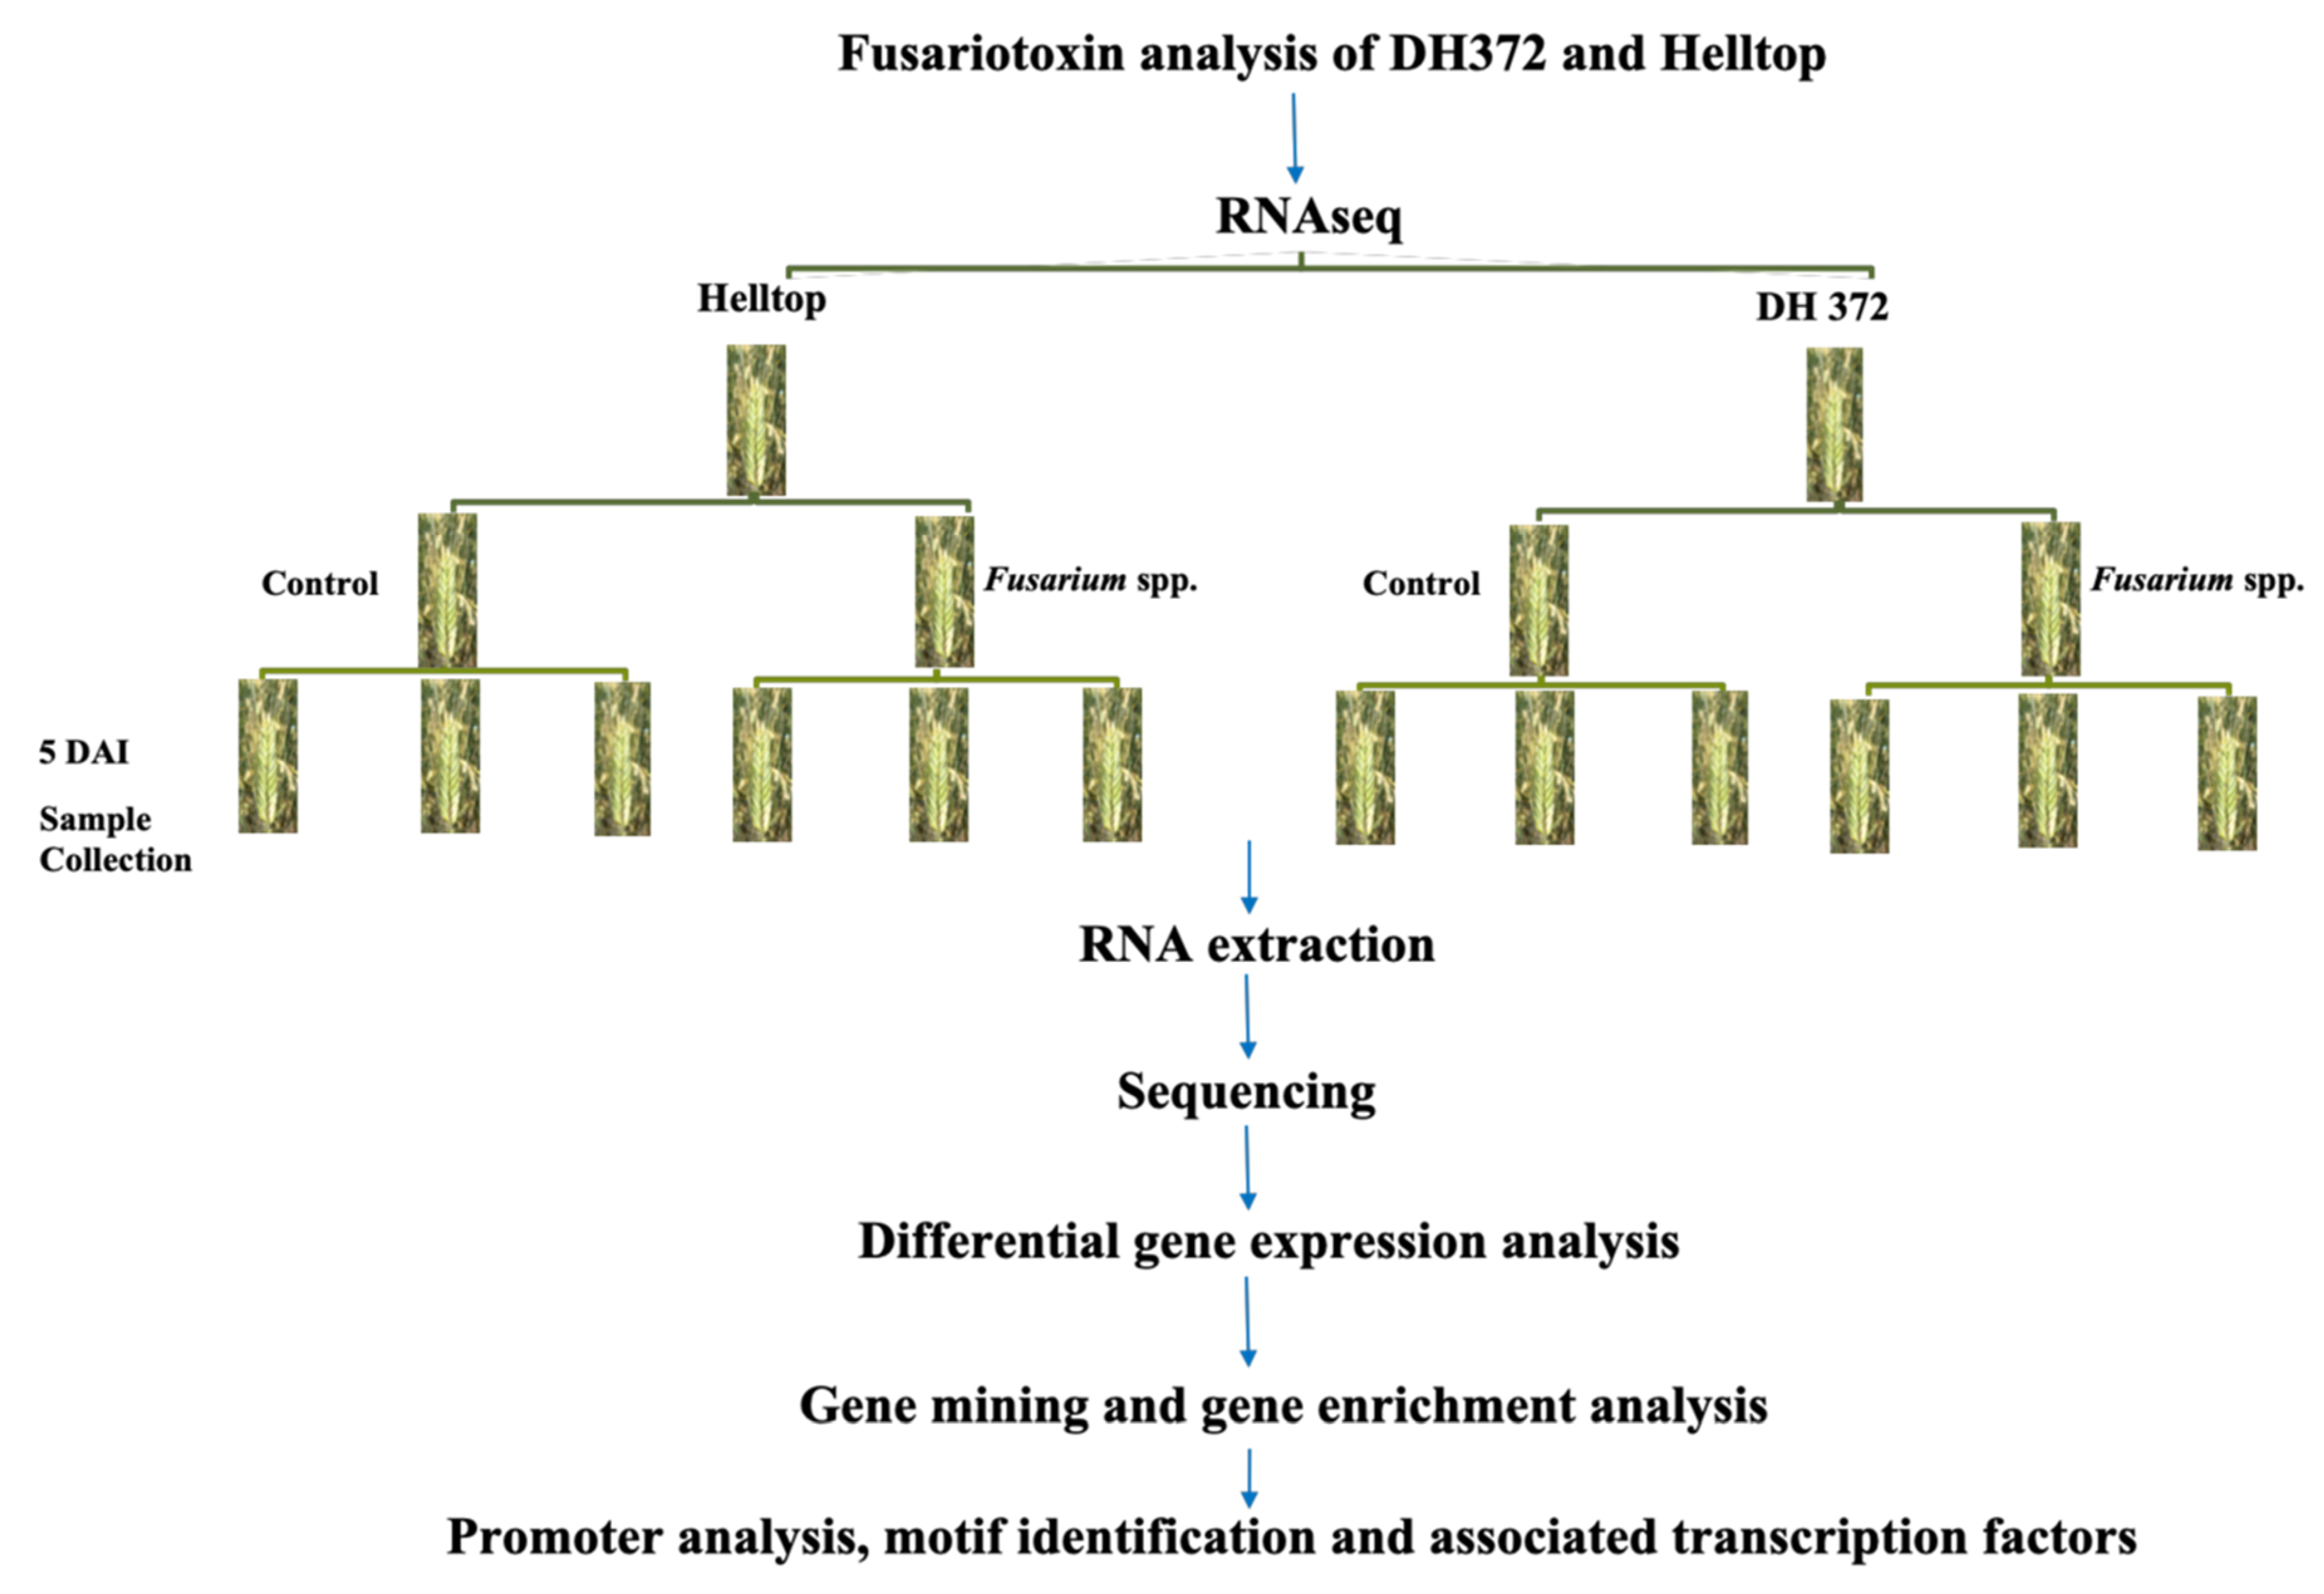
5.2. Plant Growth Conditions and Experimental Setup for Transcriptome Analysis
5.3. RNA Extraction and Sequencing
5.4. Identification of Differentially Expressed Genes, Annotation and Gene Ontology
5.5. In Silico Analysis of Differentially Expressed Genes
5.6. Cis Motif Identification and Occurrence of Transcription Factors in the Promoters of Identified Candidate Genes
Author Contributions
Funding
Acknowledgments
Conflicts of Interest
References
- Pirgozliev, S.R.; Edwards, S.G.; Hare, M.C.; Jenkinson, P. Strategies for the control of Fusarium head blight in cereals. Eur. J. Plant Pathol. 2003, 109, 731–742. [Google Scholar] [CrossRef]
- McMullen, M.; Jones, R.; Gallenberg, D. Scab of wheat and barley: A re-emerging disease of devastating impact. Plant Dis. 1997, 81, 1340–1348. [Google Scholar] [CrossRef] [PubMed] [Green Version]
- Becher, R.; Miedaner, T.; Wirsel, S.G. 8 Biology, diversity, and management of FHB-causing Fusarium species in small-grain cereals. In Agricultural Applications; Springer: Berlin, Germany, 2013; pp. 199–241. [Google Scholar]
- Starkey, D.E.; Ward, T.J.; Aoki, T.; Gale, L.R.; Kistler, H.C.; Geiser, D.M.; Suga, H.; Toth, B.; Varga, J.; O’Donnell, K. Global molecular surveillance reveals novel Fusarium head blight species and trichothecene toxin diversity. Fungal Genet. Biol. 2007, 44, 1191–1204. [Google Scholar] [CrossRef] [PubMed]
- Wegulo, S.N. Factors influencing deoxynivalenol accumulation in small grain cereals. Toxins 2012, 4, 1157–1180. [Google Scholar] [CrossRef]
- Moretti, A.; Pascale, M.; Logrieco, A.F. Mycotoxin risks under a climate change scenario in Europe. Trends Food Sci. Technol. 2019, 84, 38–40. [Google Scholar] [CrossRef]
- Jouany, J.P. Methods for preventing, decontaminating and minimizing the toxicity of mycotoxins in feeds. Anim. Feed Sci. Technol. 2007, 137, 342–362. [Google Scholar] [CrossRef]
- Gunupuru, L.; Perochon, A.; Doohan, F. Deoxynivalenol resistance as a component of FHB resistance. Tropical Plant Pathol. 2017, 42, 175–183. [Google Scholar] [CrossRef] [Green Version]
- Rudd, J.; Horsley, R.; McKendry, A.; Elias, E. Host plant resistance genes for Fusarium head blight. Crop Sci. 2001, 41, 620–627. [Google Scholar] [CrossRef] [Green Version]
- Mesterházy, Á.; Bartók, T.; Mirocha, C.; Komoroczy, R. Nature of wheat resistance to Fusarium head blight and the role of deoxynivalenol for breeding. Plant Breed. 1999, 118, 97–110. [Google Scholar] [CrossRef]
- Mesterhazy, A. Types and components of resistance to Fusarium head blight of wheat. Plant Breed. 1995, 114, 377–386. [Google Scholar] [CrossRef]
- Schroeder, H.; Christensen, J. Factors affecting resistance of wheat to scab caused by Gibberella zeae. Phytopathology 1963, 53, 831–838. [Google Scholar]
- Boutigny, A.-L.; Richard-Forget, F.; Barreau, C. Natural mechanisms for cereal resistance to the accumulation of Fusarium trichothecenes. Eur. J. Plant Pathol. 2008, 121, 411–423. [Google Scholar] [CrossRef]
- Gaikpa, D.S.; Lieberherr, B.; Maurer, H.P.; Longin, C.F.H.; Miedaner, T. Comparison of rye, triticale, durum wheat and bread wheat genotypes for Fusarium head blight resistance and deoxynivalenol contamination. Plant Breed. 2019, 139, 251–262. [Google Scholar] [CrossRef]
- Poppenberger, B.; Berthiller, F.; Lucyshyn, D.; Sieberer, T.; Schuhmacher, R.; Krska, R.; Kuchler, K.; Glössl, J.; Luschnig, C.; Adam, G. Detoxification of the Fusarium mycotoxin deoxynivalenol by a UDP-glucosyltransferase from Arabidopsis thaliana. J. Biol. Chem. 2003, 278, 47905–47914. [Google Scholar] [CrossRef] [PubMed] [Green Version]
- He, Y.; Ahmad, D.; Zhang, X.; Zhang, Y.; Wu, L.; Jiang, P.; Ma, H. Genome-wide analysis of family-1 UDP glycosyltransferases (UGT) and identification of UGT genes for FHB resistance in wheat (Triticum aestivum L.). BMC Plant Biol. 2018, 18, 67. [Google Scholar] [CrossRef] [PubMed]
- Löffler, M.; Schön, C.-C.; Miedaner, T. Revealing the genetic architecture of FHB resistance in hexaploid wheat (Triticum aestivum L.) by QTL meta-analysis. Mol. Breed. 2009, 23, 473–488. [Google Scholar] [CrossRef]
- Somers, D.J.; Fedak, G.; Savard, M. Molecular mapping of novel genes controlling Fusarium head blight resistance and deoxynivalenol accumulation in spring wheat. Genome 2003, 46, 555–564. [Google Scholar] [CrossRef]
- Steiner, B.; Michel, S.; Maccaferri, M.; Lemmens, M.; Tuberosa, R.; Buerstmayr, H. Exploring and exploiting the genetic variation of Fusarium head blight resistance for genomic-assisted breeding in the elite durum wheat gene pool. Theor. Appl. Genet. 2019, 132, 969–988. [Google Scholar] [CrossRef] [Green Version]
- Zhu, H.; Gilchrist, L.; Hayes, P.; Kleinhofs, A.; Kudrna, D.; Liu, Z.; Prom, L.; Steffenson, B.; Toojinda, T.; Vivar, H. Does function follow form? Principal QTLs for Fusarium head blight (FHB) resistance are coincident with QTLs for inflorescence traits and plant height in a doubled-haploid population of barley. Theor. Appl. Genet. 1999, 99, 1221–1232. [Google Scholar] [CrossRef]
- Kalih, R.; Maurer, H.; Miedaner, T. Genetic architecture of Fusarium head blight resistance in four winter triticale populations. Phytopathology 2015, 105, 334–341. [Google Scholar] [CrossRef] [Green Version]
- Schlegel, R.H. Rye: Genetics, Breeding, and Cultivation; Crc Press: New York, NY, USA, 2013; pp. 131–192. [Google Scholar]
- Domański, J.; Marchut-Mikołajczyk, O.; Cieciura-Włoch, W.; Patelski, P.; Dziekońska-Kubczak, U.; Januszewicz, B.; Zhang, B.; Dziugan, P. Production of Methane, Hydrogen and Ethanol from Secale cereale L. Straw Pretreated with Sulfuric Acid. Molecules 2020, 25, 1013. [Google Scholar] [CrossRef] [PubMed] [Green Version]
- Smuga-Kogut, M.; Zgórska, K.; Kogut, T.; Kukiełka, K.; Wojdalski, J.; Kupczyk, A.; Dróżdż, B.; Wielewska, I. The use of ionic liquid pretreatment of rye straw for bioethanol production. Fuel 2017, 191, 266–274. [Google Scholar] [CrossRef]
- Gervais, L.; Dedryver, F.; Morlais, J.-Y.; Bodusseau, V.; Negre, S.; Bilous, M.; Groos, C.; Trottet, M. Mapping of quantitative trait loci for field resistance to Fusarium head blight in an European winter wheat. Theor. Appl. Genet. 2003, 106, 961–970. [Google Scholar] [CrossRef] [PubMed]
- Ma, Z.; Steffenson, B.J.; Prom, L.K.; Lapitan, N.L. Mapping of quantitative trait loci for Fusarium head blight resistance in barley. Phytopathology 2000, 90, 1079–1088. [Google Scholar] [CrossRef] [PubMed] [Green Version]
- Klahr, A.; Zimmermann, G.; Wenzel, G.; Mohler, V. Effects of environment, disease progress, plant height and heading date on the detection of QTLs for resistance to Fusarium head blight in an European winter wheat cross. Euphytica 2007, 154, 17–28. [Google Scholar] [CrossRef]
- Malla, S.; Ibrahim, A.M.; Glover, K.D. Diallel analysis of Fusarium head blight resistance in wheat. J. Crop Improv. 2009, 23, 213–234. [Google Scholar] [CrossRef]
- Miedaner, T.; Schneider, B.; Geiger, H.H. Deoxynivalenol (DON) content and Fusarium head blight resistance in segregating populations of winter rye and winter wheat. Crop Sci. 2003, 43, 519–526. [Google Scholar] [CrossRef]
- Miedaner, T.; Borchardt, D.; Geiger, H. Genetic analysis of inbred lines and their crosses for resistance to head blight (Fusarium culmorum, F. graminearum) in winter rye. Euphytica 1992, 65, 123–133. [Google Scholar] [CrossRef]
- Miedaner, T.; Geiger, H. Estimates of combining ability for resistance of winter rye to Fusarium culmorum head blight. Euphytica 1996, 89, 339–344. [Google Scholar]
- Somers, D.J.; Fedak, G.; Clarke, J.; Cao, W. Mapping of FHB resistance QTLs in tetraploid wheat. Genome 2006, 49, 1586–1593. [Google Scholar] [CrossRef]
- da Silva, C.L.; Fritz, A.; Clinesmith, M.; Poland, J.; Dowell, F.; Peiris, K. QTL mapping of Fusarium head blight resistance and deoxynivalenol accumulation in the Kansas wheat variety ‘Everest’. Mol. Breed. 2019, 39, 35. [Google Scholar] [CrossRef]
- Jiang, P.; Zhang, X.; Wu, L.; He, Y.; Zhuang, W.; Cheng, X.; Ge, W.; Ma, H.; Kong, L. A novel QTL on chromosome 5AL of Yangmai 158 increases resistance to Fusarium head blight in wheat. Plant Pathol. 2020, 69, 249–258. [Google Scholar] [CrossRef]
- Ren, J.; Wang, Z.; Du, Z.; Che, M.; Zhang, Y.; Quan, W.; Wang, Y.; Jiang, X.; Zhang, Z. Detection and validation of a novel major QTL for resistance to Fusarium head blight from Triticum aestivum in the terminal region of chromosome 7DL. Theor. Appl. Genet. 2019, 132, 241–255. [Google Scholar] [CrossRef] [PubMed]
- Holzapfel, J.; Voss, H.-H.; Miedaner, T.; Korzun, V.; Häberle, J.; Schweizer, G.; Mohler, V.; Zimmermann, G.; Hartl, L. Inheritance of resistance to Fusarium head blight in three European winter wheat populations. Theor. Appl. Genet. 2008, 117, 1119–1128. [Google Scholar] [CrossRef] [PubMed]
- Steiner, B.; Buerstmayr, M.; Michel, S.; Schweiger, W.; Lemmens, M.; Buerstmayr, H. Breeding strategies and advances in line selection for Fusarium head blight resistance in wheat. Trop. Plant Pathol. 2017, 42, 165–174. [Google Scholar] [CrossRef] [Green Version]
- Draeger, R.; Gosman, N.; Steed, A.; Chandler, E.; Thomsett, M.; Schondelmaier, J.; Buerstmayr, H.; Lemmens, M.; Schmolke, M.; Mesterhazy, A. Identification of QTLs for resistance to Fusarium head blight, DON accumulation and associated traits in the winter wheat variety Arina. Theor. Appl. Genet. 2007, 115, 617–625. [Google Scholar] [CrossRef]
- Cuthbert, P.A.; Somers, D.J.; Thomas, J.; Cloutier, S.; Brulé-Babel, A. Fine mapping Fhb1, a major gene controlling fusarium head blight resistance in bread wheat (Triticum aestivum L.). Theor. Appl. Genet. 2006, 112, 1465. [Google Scholar] [CrossRef]
- Su, Z.; Bernardo, A.; Tian, B.; Chen, H.; Wang, S.; Ma, H.; Cai, S.; Liu, D.; Zhang, D.; Li, T. A deletion mutation in TaHRC confers Fhb1 resistance to Fusarium head blight in wheat. Nat. Genet. 2019, 51, 1099–1105. [Google Scholar] [CrossRef]
- Venske, E.; Dos Santos, R.S.; Farias, D.d.R.; Rother, V.; Maia, L.C.d.; Pegoraro, C.; Costa De Oliveira, A. Meta-analysis of the QTLome of Fusarium head blight resistance in bread wheat: Refining the current puzzle. Front. Plant Sci. 2019, 10, 727. [Google Scholar] [CrossRef] [Green Version]
- Salvi, S.; Tuberosa, R. The crop QTLome comes of age. Curr. Opin. Biotechnol. 2015, 32, 179–185. [Google Scholar] [CrossRef]
- Chetouhi, C.; Bonhomme, L.; Lasserre-Zuber, P.; Cambon, F.; Pelletier, S.; Renou, J.-P.; Langin, T. Transcriptome dynamics of a susceptible wheat upon Fusarium head blight reveals that molecular responses to Fusarium graminearum infection fit over the grain development processes. Funct. Integr. Genomics 2016, 16, 183–201. [Google Scholar] [CrossRef] [PubMed]
- Li, X.; Zhang, J.; Song, B.; Li, H.; Xu, H.; Qu, B.; Dang, F.; Liao, Y. Resistance to Fusarium head blight and seedling blight in wheat is associated with activation of a cytochrome P450 gene. Phytopathology 2010, 100, 183–191. [Google Scholar] [CrossRef] [PubMed] [Green Version]
- Biselli, C.; Bagnaresi, P.; Faccioli, P.; Hu, X.; Balcerzak, M.; Mattera, M.G.; Yan, Z.; Ouellet, T.; Cattivelli, L.; Valè, G. Comparative transcriptome profiles of near-isogenic hexaploid wheat lines differing for effective alleles at the 2DL FHB resistance QTL. Front. Plant Sci. 2018, 9, 37. [Google Scholar] [CrossRef] [Green Version]
- Langevin, F.; Eudes, F.; Comeau, A. Effect of trichothecenes produced by Fusarium graminearum during Fusarium head blight development in six cereal species. Eur. J. Plant Pathol. 2004, 110, 735–746. [Google Scholar] [CrossRef]
- Maier, F.J.; Miedaner, T.; Hadeler, B.; Felk, A.; Salomon, S.; Lemmens, M.; Kassner, H.; Schaefer, W. Involvement of trichothecenes in fusarioses of wheat, barley and maize evaluated by gene disruption of the trichodiene synthase (Tri5) gene in three field isolates of different chemotype and virulence. Mol. Plant Pathol. 2006, 7, 449–461. [Google Scholar] [CrossRef] [PubMed]
- Brunner, K.; Paris, M.P.K.; Paolino, G.; Bürstmayr, H.; Lemmens, M.; Berthiller, F.; Schuhmacher, R.; Krska, R.; Mach, R.L. A reference-gene-based quantitative PCR method as a tool to determine Fusarium resistance in wheat. Anal. Bioanal. Chem. 2009, 395, 1385–1394. [Google Scholar] [CrossRef]
- Atanasova-Penichon, V.; Barreau, C.; Richard-Forget, F. Antioxidant secondary metabolites in cereals: Potential involvement in resistance to Fusarium and mycotoxin accumulation. Front. Microbiol. 2016, 7, 566. [Google Scholar] [CrossRef] [Green Version]
- Xiao, J.; Jin, X.; Jia, X.; Wang, H.; Cao, A.; Zhao, W.; Pei, H.; Xue, Z.; He, L.; Chen, Q. Transcriptome-based discovery of pathways and genes related to resistance against Fusarium head blight in wheat landrace Wangshuibai. BMC Genomics 2013, 14, 197. [Google Scholar] [CrossRef] [PubMed] [Green Version]
- Kong, L.; Anderson, J.M.; Ohm, H.W. Induction of wheat defense and stress-related genes in response to Fusarium graminearum. Genome 2005, 48, 29–40. [Google Scholar] [CrossRef] [Green Version]
- Jia, H.; Cho, S.; Muehlbauer, G.J. Transcriptome analysis of a wheat near-isogenic line pair carrying fusarium head blight–resistant and–susceptible alleles. Mol. Plant-microbe Interact. 2009, 22, 1366–1378. [Google Scholar] [CrossRef]
- Erayman, M.; Turktas, M.; Akdogan, G.; Gurkok, T.; Inal, B.; Ishakoglu, E.; Ilhan, E.; Unver, T. Transcriptome analysis of wheat inoculated with Fusarium graminearum. Front. Plant Sci. 2015, 6, 867. [Google Scholar] [CrossRef] [Green Version]
- Boddu, J.; Cho, S.; Kruger, W.M.; Muehlbauer, G.J. Transcriptome analysis of the barley-Fusarium graminearum interaction. Mol. Plant-microbe Interact. 2006, 19, 407–417. [Google Scholar] [CrossRef] [PubMed] [Green Version]
- Liu, Y.; Guo, Y.; Ma, C.; Zhang, D.; Wang, C.; Yang, Q. Transcriptome analysis of maize resistance to Fusarium graminearum. BMC Genomics 2016, 17, 477. [Google Scholar]
- Zhou, W.; Eudes, F.; Laroche, A. Identification of differentially regulated proteins in response to a compatible interaction between the pathogen Fusarium graminearum and its host, Triticum aestivum. Proteomics 2006, 6, 4599–4609. [Google Scholar] [CrossRef] [PubMed]
- Gullner, G.; Komives, T.; Király, L.; Schröder, P. Glutathione S-transferase enzymes in plant-pathogen interactions. Front. Plant Sci. 2018, 9, 1836. [Google Scholar] [CrossRef] [Green Version]
- Bienert, M.D.; Baijot, A.; Boutry, M. ABCG transporters and their role in the biotic stress response. In Plant ABC Transporters; Springer: Cham, Switzerland, 2014; pp. 137–162. [Google Scholar]
- Xin, M.; Du, X.-Y.; Liu, G.-J.; Yang, Z.-D.; Hou, W.-Q.; Wang, H.-W.; Feng, D.-S.; Li, A.-F.; Kong, L.-R. Cloning and characterization of a novel UDP-glycosyltransferase gene induced by DON from wheat. J. Integr. Agric. 2015, 14, 830–838. [Google Scholar]
- Oh, B.-J.; Ko, M.K.; Kim, Y.S.; Kim, K.S.; Kostenyuk, I.; Kee, H.K. A cytochrome P450 gene is differentially expressed in compatible and incompatible interactions between pepper (Capsicum annuum) and the anthracnose fungus, Colletotrichum gloeosporioides. Mol. Plant-microbe Interact. 1999, 12, 1044–1052. [Google Scholar] [CrossRef]
- Silveira, R.L.; Stoyanov, S.R.; Gusarov, S.; Skaf, M.S.; Kovalenko, A. Plant biomass recalcitrance: Effect of hemicellulose composition on nanoscale forces that control cell wall strength. J. Am. Chem. Soc. 2013, 135, 19048–19051. [Google Scholar] [CrossRef]
- Zeier, J. New insights into the regulation of plant immunity by amino acid metabolic pathways. Plant Cell Environ. 2013, 36, 2085–2103. [Google Scholar] [CrossRef]
- Yang, S.; Li, X.; Chen, W.; Liu, T.; Zhong, S.; Ma, L.; Zhang, M.; Zhang, H.; Yu, D.; Luo, P. Wheat resistance to fusarium head blight is associated with changes in photosynthetic parameters. Plant Dis. 2016, 100, 847–852. [Google Scholar] [CrossRef]
- Lulin, M.; Yi, S.; Aizhong, C.; Zengjun, Q.; Liping, X.; Peidu, C.; Dajun, L.; Xiu-e, W. Molecular cloning and characterization of an up-regulated UDP-glucosyltransferase gene induced by DON from Triticum aestivum L. cv. Wangshuibai. Mol. Biol. Rep. 2010, 37, 785. [Google Scholar] [CrossRef] [PubMed]
- Shin, S.; Torres-Acosta, J.A.; Heinen, S.J.; McCormick, S.; Lemmens, M.; Paris, M.P.K.; Berthiller, F.; Adam, G.; Muehlbauer, G.J. Transgenic Arabidopsis thaliana expressing a barley UDP-glucosyltransferase exhibit resistance to the mycotoxin deoxynivalenol. J. Exp. Bot. 2012, 63, 4731–4740. [Google Scholar] [CrossRef] [PubMed] [Green Version]
- Xing, L.-P.; He, L.-Q.; Xiao, J.; Chen, Q.-G.; Li, M.-H.; Shang, Y.; Zhu, Y.-F.; Chen, P.-D.; Cao, A.-Z.; Wang, X.-E. An UDP-glucosyltransferase gene from barley confers disease resistance to Fusarium head blight. Plant Mol. Biol. Report. 2017, 35, 224–236. [Google Scholar] [CrossRef]
- Koch, A.; Kumar, N.; Weber, L.; Keller, H.; Imani, J.; Kogel, K.-H. Host-induced gene silencing of cytochrome P450 lanosterol C14α-demethylase–encoding genes confers strong resistance to Fusarium species. Proc. Natl. Acad. Sci. USA 2013, 110, 19324–19329. [Google Scholar] [CrossRef] [PubMed] [Green Version]
- Gunupuru, L.R.; Arunachalam, C.; Malla, K.B.; Kahla, A.; Perochon, A.; Jia, J.; Thapa, G.; Doohan, F.M. A wheat cytochrome P450 enhances both resistance to deoxynivalenol and grain yield. PLoS ONE 2018, 13. [Google Scholar] [CrossRef] [Green Version]
- Rushton, P.J.; Somssich, I.E.; Ringler, P.; Shen, Q.J. WRKY transcription factors. Trends Plant Sci. 2010, 15, 247–258. [Google Scholar] [CrossRef]
- Eulgem, T.; Somssich, I.E. Networks of WRKY transcription factors in defense signaling. Curr. Opin. Plant Biol. 2007, 10, 366–371. [Google Scholar] [CrossRef] [Green Version]
- Zheng, Z.; Qamar, S.A.; Chen, Z.; Mengiste, T. Arabidopsis WRKY33 transcription factor is required for resistance to necrotrophic fungal pathogens. Plant J. 2006, 48, 592–605. [Google Scholar] [CrossRef]
- Bahrini, I.; Sugisawa, M.; Kikuchi, R.; Ogawa, T.; Kawahigashi, H.; Ban, T.; Handa, H. Characterization of a wheat transcription factor, TaWRKY45, and its effect on Fusarium head blight resistance in transgenic wheat plants. Breed. Sci. 2011, 61, 121–129. [Google Scholar] [CrossRef] [Green Version]
- Kage, U.; Yogendra, K.N.; Kushalappa, A.C. TaWRKY70 transcription factor in wheat QTL-2DL regulates downstream metabolite biosynthetic genes to resist Fusarium graminearum infection spread within spike. Sci. Rep. 2017, 7, 1–14. [Google Scholar] [CrossRef] [Green Version]
- Sarowar, S.; Alam, S.T.; Makandar, R.; Lee, H.; Trick, H.N.; Dong, Y.; Shah, J. Targeting the pattern-triggered immunity pathway to enhance resistance to Fusarium graminearum. Mol. Plant Pathol. 2019, 20, 626–640. [Google Scholar] [CrossRef] [PubMed] [Green Version]
- Dubos, C.; Stracke, R.; Grotewold, E.; Weisshaar, B.; Martin, C.; Lepiniec, L. MYB transcription factors in Arabidopsis. Trends Plant Sci. 2010, 15, 573–581. [Google Scholar] [CrossRef] [PubMed]
- Nielsen, L.K.; Jensen, J.D.; Nielsen, G.C.; Jensen, J.E.; Spliid, N.H.; Thomsen, I.K.; Justesen, A.F.; Collinge, D.B.; Jørgensen, L.N. Fusarium head blight of cereals in Denmark: Species complex and related mycotoxins. Phytopathology 2011, 101, 960–969. [Google Scholar] [CrossRef] [PubMed] [Green Version]
- Etzerodt, T.; Gislum, R.; Laursen, B.B.; Heinrichson, K.; Gregersen, P.L.; Jørgensen, L.N.; Fomsgaard, I.S. Correlation of deoxynivalenol accumulation in Fusarium-infected winter and spring wheat cultivars with secondary metabolites at different growth stages. Agric. Food Chem. 2016, 64, 4545–4555. [Google Scholar] [CrossRef] [PubMed]
- Lancashire, P.D.; Bleiholder, H.; Boom, T.v.d.; Langelüddeke, P.; Stauss, R.; WEBER, E.; Witzenberger, A. A uniform decimal code for growth stages of crops and weeds. Ann. Appl. Biol. 1991, 119, 561–601. [Google Scholar] [CrossRef]
- Smart, M.; Roden, L.C. A small-scale RNA isolation protocol useful for high-throughput extractions from recalcitrant plants. S. Afr. J. Bot. 2010, 76, 375–379. [Google Scholar] [CrossRef] [Green Version]
- Bray, N.L.; Pimentel, H.; Melsted, P.; Pachter, L. Near-optimal probabilistic RNA-seq quantification. Nat. Biotech. 2016, 34, 525–527. [Google Scholar] [CrossRef]
- Mahmood, K.; Orabi, J.; Kristensen, P.S.; Sarup, P.; Jørgensen, L.N.; Jahoor, A. De novo transcriptome assembly, functional annotation, and expression profiling of rye (Secale cereale L.) hybrids inoculated with ergot (Claviceps purpurea). Sci. Rep. 2020, 10, 1–16. [Google Scholar] [CrossRef]
- Bauer, E.; Schmutzer, T.; Barilar, I.; Mascher, M.; Gundlach, H.; Martis, M.M.; Twardziok, S.O.; Hackauf, B.; Gordillo, A.; Wilde, P. Towards a whole-genome sequence for rye (Secale cereale L.). Plant J. 2017, 89, 853–869. [Google Scholar] [CrossRef] [Green Version]
- Robinson, M.D.; McCarthy, D.J.; Smyth, G.K. edgeR: A Bioconductor package for differential expression analysis of digital gene expression data. Bioinformatics 2010, 26, 139–140. [Google Scholar] [CrossRef] [Green Version]
- Conesa, A.; Götz, S.; García-Gómez, J.M.; Terol, J.; Talón, M.; Robles, M. Blast2GO: A universal tool for annotation, visualization and analysis in functional genomics research. Bioinformatics 2005, 21, 3674–3676. [Google Scholar] [CrossRef] [PubMed] [Green Version]
- Kanehisa, M.; Goto, S. KEGG: Kyoto encyclopedia of genes and genomes. Nucleic Acids Res. 2000, 28, 27–30. [Google Scholar] [CrossRef] [PubMed]
- Bailey, T.L.; Williams, N.; Misleh, C.; Li, W.W. MEME: Discovering and analyzing DNA and protein sequence motifs. Nucleic Acids Res. 2006, 34, W369–W373. [Google Scholar] [CrossRef] [PubMed]
- Buske, F.A.; Bodén, M.; Bauer, D.C.; Bailey, T.L. Assigning roles to DNA regulatory motifs using comparative genomics. Bioinformatics 2010, 26, 860–866. [Google Scholar] [CrossRef] [Green Version]


| Name | Field Scoring * | NIV (µg kg−1) | DON (µg kg−1) | ZEN (µg kg−1) |
|---|---|---|---|---|
| Helltop | 2 | 107 | 12,500 | 2474 |
| DH372 | 1 | 26 | 1394 | 89 |
| Treatment Comparison | Total DEGs | Downregulated Genes | Upregulated Genes |
|---|---|---|---|
| DH372 FHB vs. DH372 Control | 6675 | 3144 | 3531 |
| Helltop FHB vs. Helltop control | 5151 | 2688 | 2463 |
| Helltop FHB vs. DH372 FHB | 4850 | 2623 | 2227 |
| DH372 control vs. Helltop control | 116 | 72 | 44 |
| Gene | Description | Length | Tags | FC | logFC | logCPM | p-Value | FDR | Wheat Orthologs |
|---|---|---|---|---|---|---|---|---|---|
| DH372 | |||||||||
| XLOC_114701 | cytochrome P450 94B3-like | 1593 | UP | 4 | 1.979 | 4.481 | 0.000 | 0.001 | TraesCS1A02G351600 |
| XLOC_996749 | cytochrome P450 99A2-like | 570 | UP | 4 | 1.852 | 2.031 | 0.001 | 0.002 | TraesCSU02G008900 |
| XLOC_939724 | Cytochrome P450 71D7 | 3143 | DOWN | −284 | −8.148 | 9.684 | 0.000 | 0.000 | TraesCS6B02G205100 |
| XLOC_180117 | cytochrome P450 86B1 | 1530 | DOWN | −27 | −4.735 | 6.473 | 0.000 | 0.000 | TraesCS6D02G193600 |
| XLOC_1029148 | probable glycosyltransferase 7 | 1266 | DOWN | −142 | −7.1 | 9.4 | 0.000 | 0.000 | TraesCS4A02G401800 |
| XLOC_128937 | glycosyltransferase | 6226 | DOWN | −6 | −2.6 | 8.8 | 0.000 | 0.000 | TraesCS4B02G322500 |
| XLOC_1336988 | glycosyltransferase-like At2g41451 | 4488 | DOWN | −3 | −1.4 | 6.5 | 0.000 | 0.000 | TraesCS1D02G005200 |
| Helltop | |||||||||
| XLOC_996749 | cytochrome P450 99A2-like | 570 | UP | 12 | 3.63 | 1.984 | 0.000 | 0.001 | TraesCSU02G008900 |
| XLOC_114701 | cytochrome P450 94B3-like | 1593 | UP | 3 | 1.567 | 2.959 | 0.001 | 0.008 | TraesCS1A02G351600 |
| XLOC_939724 | Cytochrome P450 71D7 | 3143 | DOWN | −473 | −6.193 | 9.81 | 0.000 | 0.000 | TraesCS6B02G205100 |
| XLOC_180117 | cytochrome P450 86B1 | 1530 | DOWN | −3 | −1.44 | 7.042 | 0.002 | 0.014 | TraesCS6D02G193600 |
| XLOC_1029148 | probable glycosyltransferase 7 | 1266 | DOWN | −56 | −5.8 | 8.8 | 0.000 | 0.000 | TraesCS4A02G401800 |
| XLOC_128937 | glycosyltransferase | 6226 | DOWN | −3 | −1.7 | 8.6 | 0.000 | 0.001 | TraesCS4B02G322500 |
| XLOC_1336988 | glycosyltransferase-like At2g41451 | 4488 | DOWN | −2.4 | −1.3 | 6.9 | 0.002 | 0.011 | TraesCS1D02G005200 |
| Gene | Description | Length | Tags | FC | logFC | logCPM | p-Value | FDR | Wheat Orthologs |
|---|---|---|---|---|---|---|---|---|---|
| XLOC_1213553 | Glycosyltransferase, HGA-like, putative, expressed | 2889 | UP | 7 | 2.813 | 4.113 | 0.000 | 0.000 | TraesCS3B02G021100 |
| XLOC_165003 | Cytochrome P450 | 2985 | UP | 5 | 2.248 | 5.423 | 0.000 | 0.000 | TraesCS3B02G026200 |
| XLOC_1267741 | Glycosyltransferase, HGA-like, putative, expressed | 2611 | UP | 2 | 1.132 | 5.569 | 0.000 | 0.001 | TraesCS3B02G021700 |
| XLOC_181573 | Metal tolerance protein 7-like isoform X1 | 4859 | DOWN | −4 | −1.96 | 4.03 | 0.000 | 0.000 | TraesCS3B02G040900 |
| MEME Identified Motif Logo | Consensus Motif in Common Responding Genes | E-Value | Number of GO Terms Identified by GOMO | Role of Motif Identify by GOMO |
|---|---|---|---|---|
1- | DADBTDACCGTTA | 3 × 10³ | 1 | MF transcription factor activity (MYB TFs) |
2- | CAHVGGADGHGDKGTDGGGGDGMGDARKGRDGNABRGDGCA | 1.6 × 10⁻³ | 05 | MF transcription factor activity MF ATP binding CC mitochondrion CC nucleus BP protein import into nucleus |
3- | CCDYCGCTTTCSGGGNGAG | 4.5 × 10⁴ | 2 | CC chloroplast CC mitochondrion |
4- | GDACVCACCYGTCATACTCHT | 6.1 × 10⁴ | 0 | |
5- | AAGGRRCNGCAANGGAMRA | 1.4 × 10⁵ | 03 | CC nucleus MF transcription factor activity CC plasma membrane |
| MEME Identified Motif Logo | Consensus Motif in Common Responding Genes | E-Value | Number of GO Terms Identified by GOMO | Role of Motif Identify by GOMO |
|---|---|---|---|---|
1- | TTWTTTWTYBBYWWSTTTTTBTSTC | 1.1 × 10³ | 05 | MF transcription factor activity CC nucleus CC plasma membrane MF protein binding BP regulation of transcription, |
2- | TTGACY | 3.6 × 10⁴ | 01 | MF transcription factor activity (WRKY TFs) |
3- | TKTADATKTRTSATGRBTGCT | 6.9 × 10⁴ | 0 | |
4- | CTCCATGATTG | 6.1 × 10⁴ | 0 | |
5- | AARCAAVGVAGCMAC | 1.2 × 10⁵ | 0 |
| Gene Name | Description | Length | Tags | FC | logFC | logCPM | p-Value | FDR | Wheat Orthologs |
|---|---|---|---|---|---|---|---|---|---|
| DH372 | |||||||||
| XLOC_130937 | myb family transcription factor EFM | 2785 | [UP] | 9.66 | 3.27 | 3.59 | 0.000 | 0.000 | TraesCS3B02G144100 |
| XLOC_1417787 | Myb family transcription factor APL | 3656 | [UP] | 2.12 | 1.08 | 4.47 | 0.001 | 0.003 | TraesCS7A02G381900 |
| XLOC_181060 | transcriptional activator Myb-like | 2158 | [DOWN] | −8.11 | −3.02 | 3.38 | 0.000 | 0.000 | TraesCS3B02G217100 |
| XLOC_1221063 | transcription factor MYB3R-1-like isoform X1 | 5586 | [DOWN] | −9.48 | −3.25 | 4.98 | 0.000 | 0.000 | TraesCS3B02G180300 |
| XLOC_057451 | transcription factor MYB44-like | 681 | [DOWN] | −10.62 | −3.41 | 3.06 | 0.000 | 0.000 | TraesCS1A02G223600 |
| XLOC_1291741 | transcription factor MYB26-like | 2467 | [DOWN] | −23.54 | −4.56 | 4.14 | 0.000 | 0.000 | TraesCS2D02G234000 |
| Hellttop | |||||||||
| XLOC_130937 | Myb family transcription factor EFM | 2785 | [UP] | 4.90 | 2.29 | 3.08 | 0.000 | 0.001 | TraesCS3B02G144100 |
| XLOC_1417787 | Myb family transcription factor APL | 3656 | [UP] | 2.43 | 1.28 | 5.08 | 0.008 | 0.039 | TraesCS7A02G381900 |
| XLOC_181060 | transcriptional activator Myb-like | 2158 | [DOWN] | −3.98 | −1.99 | 3.25 | 0.002 | 0.013 | TraesCS3B02G217100 |
| XLOC_057451 | transcription factor MYB44-like | 681 | [DOWN] | −12.23 | −3.61 | 2.23 | 0.000 | 0.000 | TraesCS1A02G223600 |
| XLOC_1221063 | transcription factor MYB3R-1-like isoform X1 | 5586 | [DOWN] | −32.43 | −5.02 | 4.79 | 0.000 | 0.000 | TraesCS3B02G180300 |
| XLOC_1291741 | transcription factor MYB26-like | 2467 | [DOWN] | −50.08 | −5.65 | 2.59 | 0.000 | 0.000 | TraesCS2D02G234000 |
| Gene Name | Description | Length | Tags | FC | logFC | logCPM | p-Value | FDR | Wheat Orthologs |
|---|---|---|---|---|---|---|---|---|---|
| XLOC_101792 | WRKY transcription factor WRKY24-like | 3835 | [UP] | 13 | 3.71 | 4.39 | 0.000 | 0.000 | TraesCS3B02G379200 |
| XLOC_1032358 | probable WRKY transcription factor 19 | 2504 | [DOWN] | −5 | −2.22 | 6.13 | 0.000 | 0.000 | TraesCS7D02G234000 |
| XLOC_184351 | WRKY transcription factor 44-like | 780 | [DOWN] | −6 | −2.59 | 4.19 | 0.000 | 0.000 | TraesCS5D02G162000 |
© 2020 by the authors. Licensee MDPI, Basel, Switzerland. This article is an open access article distributed under the terms and conditions of the Creative Commons Attribution (CC BY) license (http://creativecommons.org/licenses/by/4.0/).
Share and Cite
Mahmood, K.; Orabi, J.; Kristensen, P.S.; Sarup, P.; Jørgensen, L.N.; Jahoor, A. A Comparative Transcriptome Analysis, Conserved Regulatory Elements and Associated Transcription Factors Related to Accumulation of Fusariotoxins in Grain of Rye (Secale cereale L.) Hybrids. Int. J. Mol. Sci. 2020, 21, 7418. https://0-doi-org.brum.beds.ac.uk/10.3390/ijms21197418
Mahmood K, Orabi J, Kristensen PS, Sarup P, Jørgensen LN, Jahoor A. A Comparative Transcriptome Analysis, Conserved Regulatory Elements and Associated Transcription Factors Related to Accumulation of Fusariotoxins in Grain of Rye (Secale cereale L.) Hybrids. International Journal of Molecular Sciences. 2020; 21(19):7418. https://0-doi-org.brum.beds.ac.uk/10.3390/ijms21197418
Chicago/Turabian StyleMahmood, Khalid, Jihad Orabi, Peter Skov Kristensen, Pernille Sarup, Lise Nistrup Jørgensen, and Ahmed Jahoor. 2020. "A Comparative Transcriptome Analysis, Conserved Regulatory Elements and Associated Transcription Factors Related to Accumulation of Fusariotoxins in Grain of Rye (Secale cereale L.) Hybrids" International Journal of Molecular Sciences 21, no. 19: 7418. https://0-doi-org.brum.beds.ac.uk/10.3390/ijms21197418