Physicochemical Characterization of Packaging Foils Coated by Chitosan and Polyphenols Colloidal Formulations

Abstract
:
1. Introduction
2. Results and Discussion
2.1. Dispersion Characterization
2.1.1. Particle Size, PDI and Zeta Potential Determination
2.1.2. Encapsulation Efficiency
2.1.3. Total Phenolic Content
2.2. Functional Foils
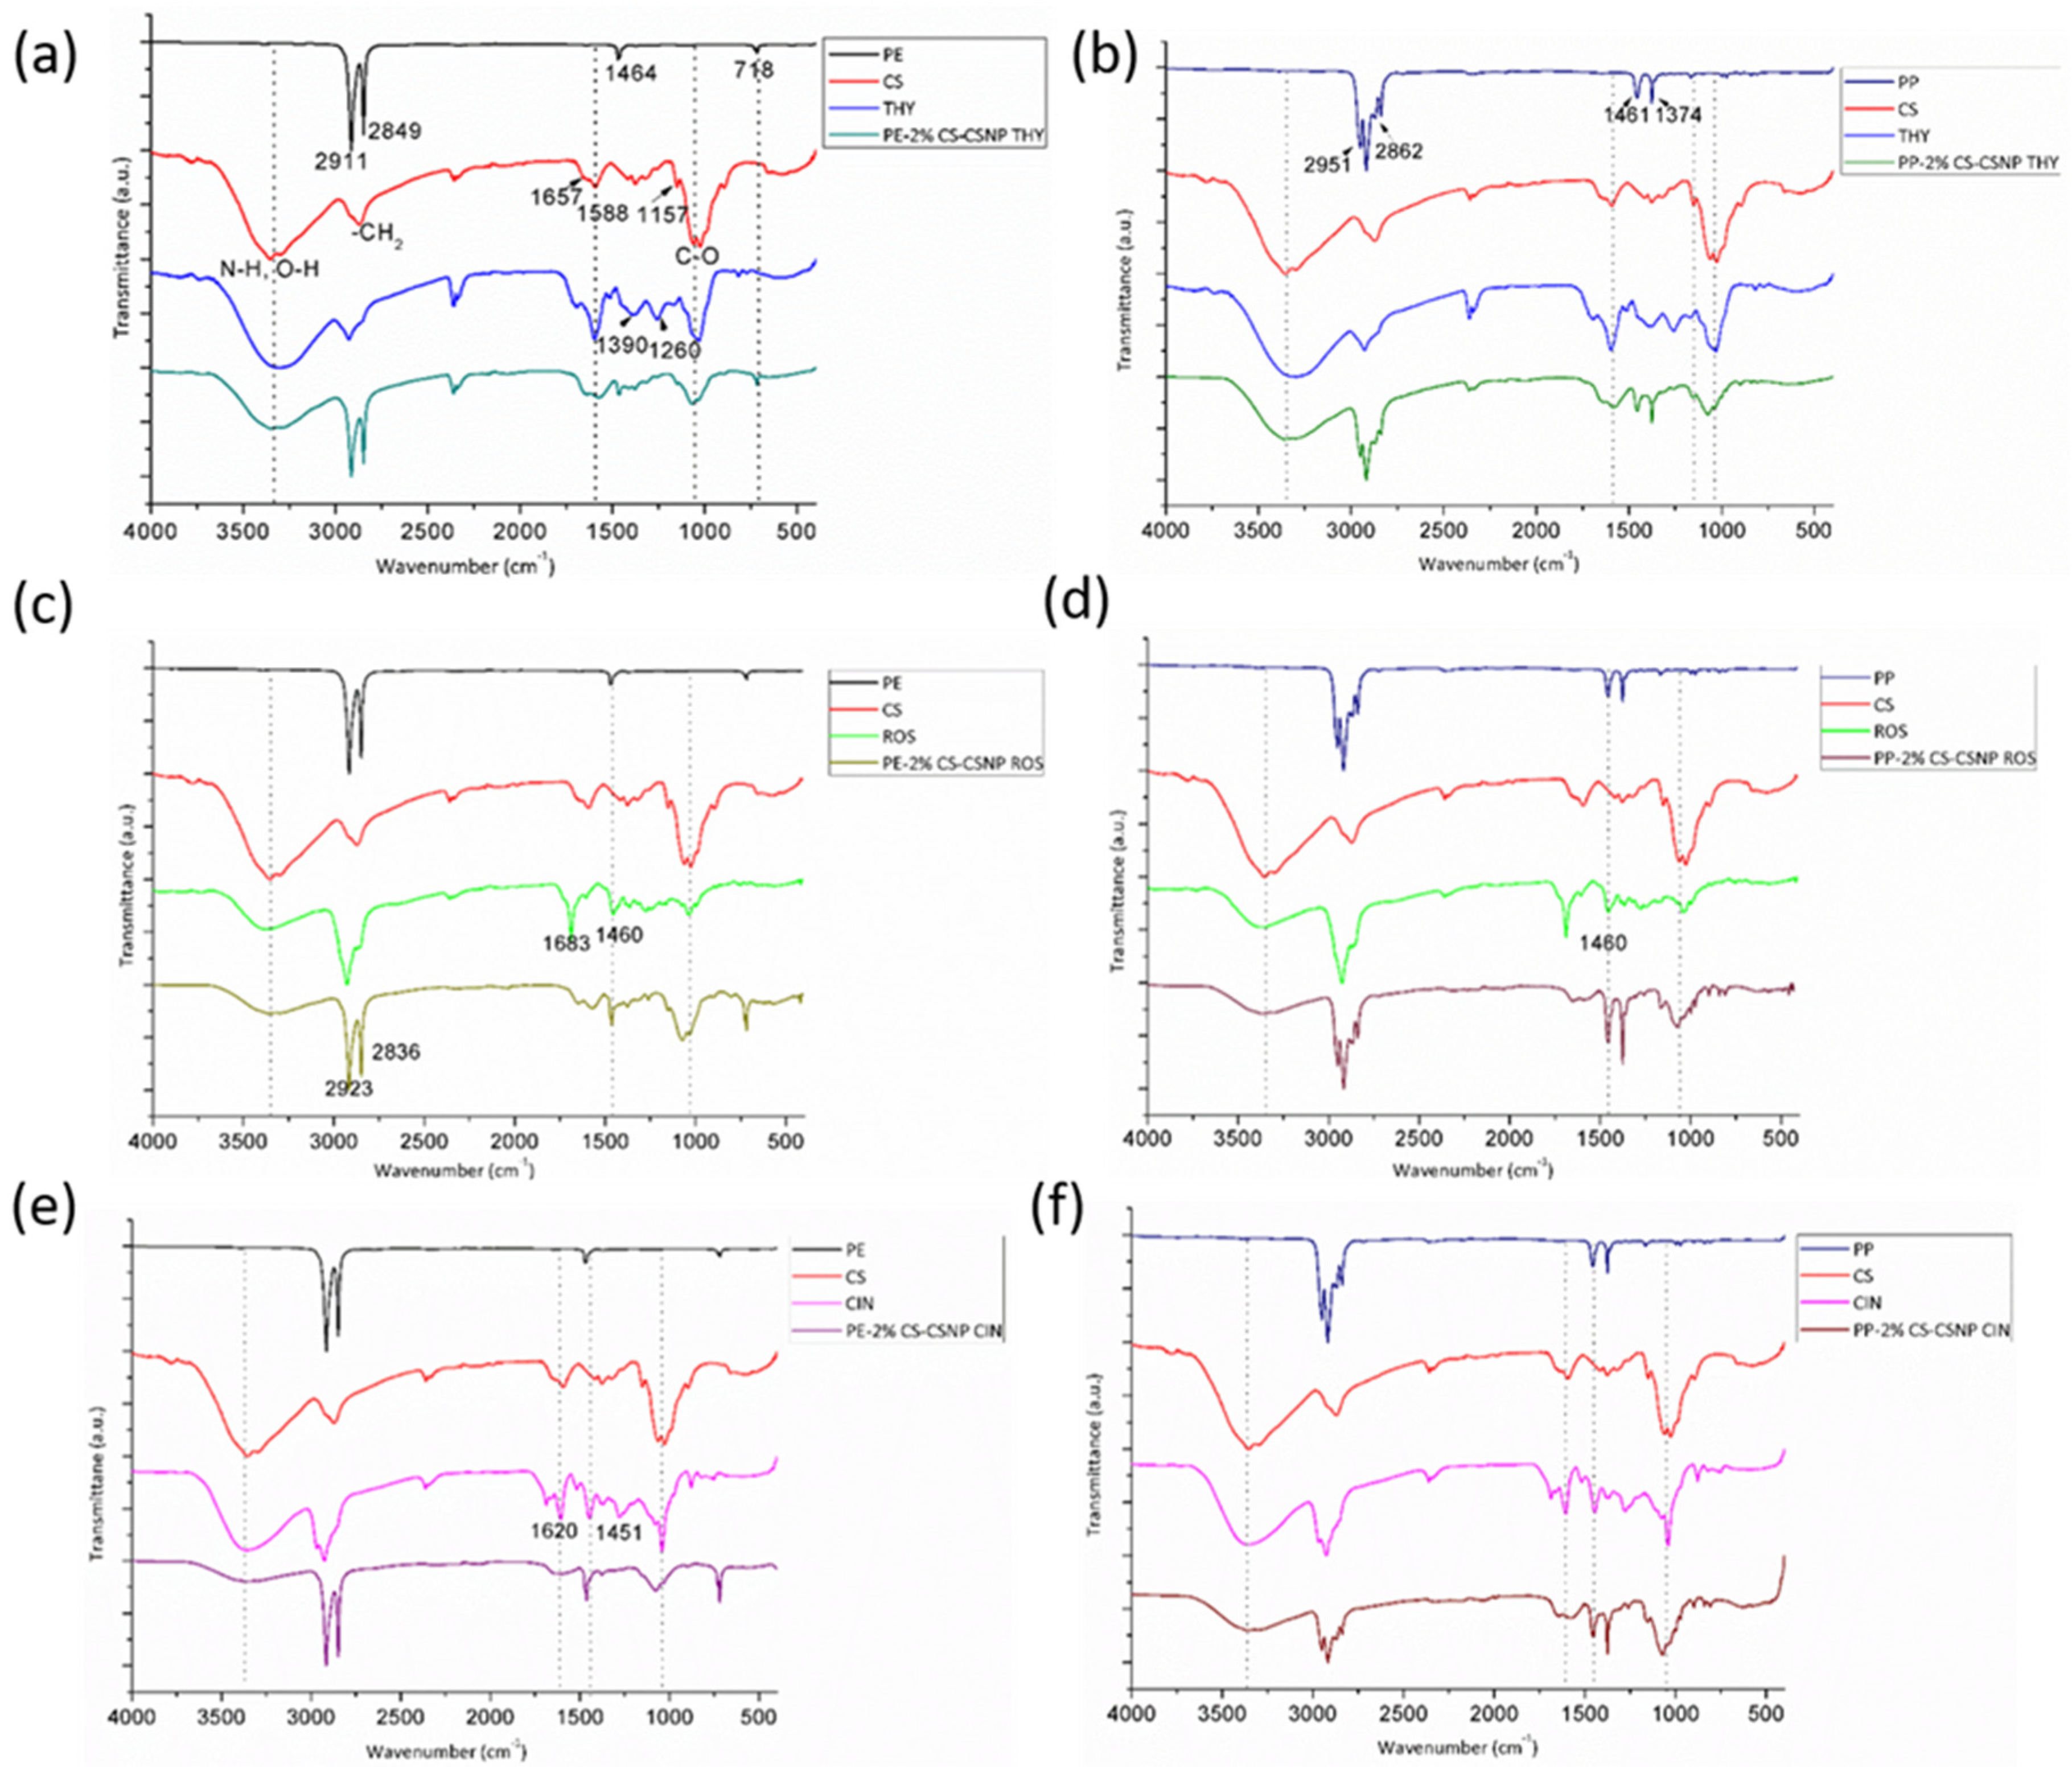
2.2.1. ATR-FTIR Spectroscopy
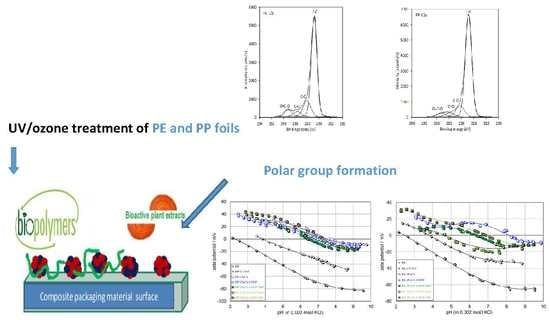
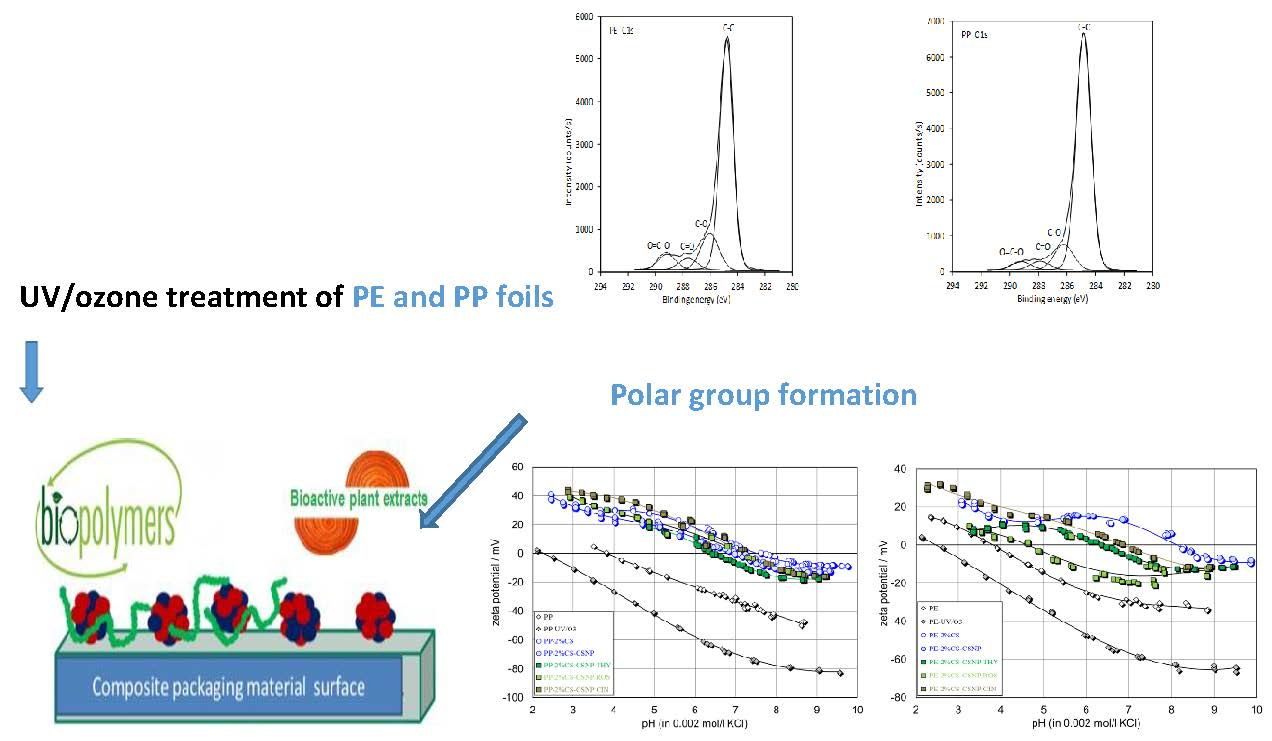
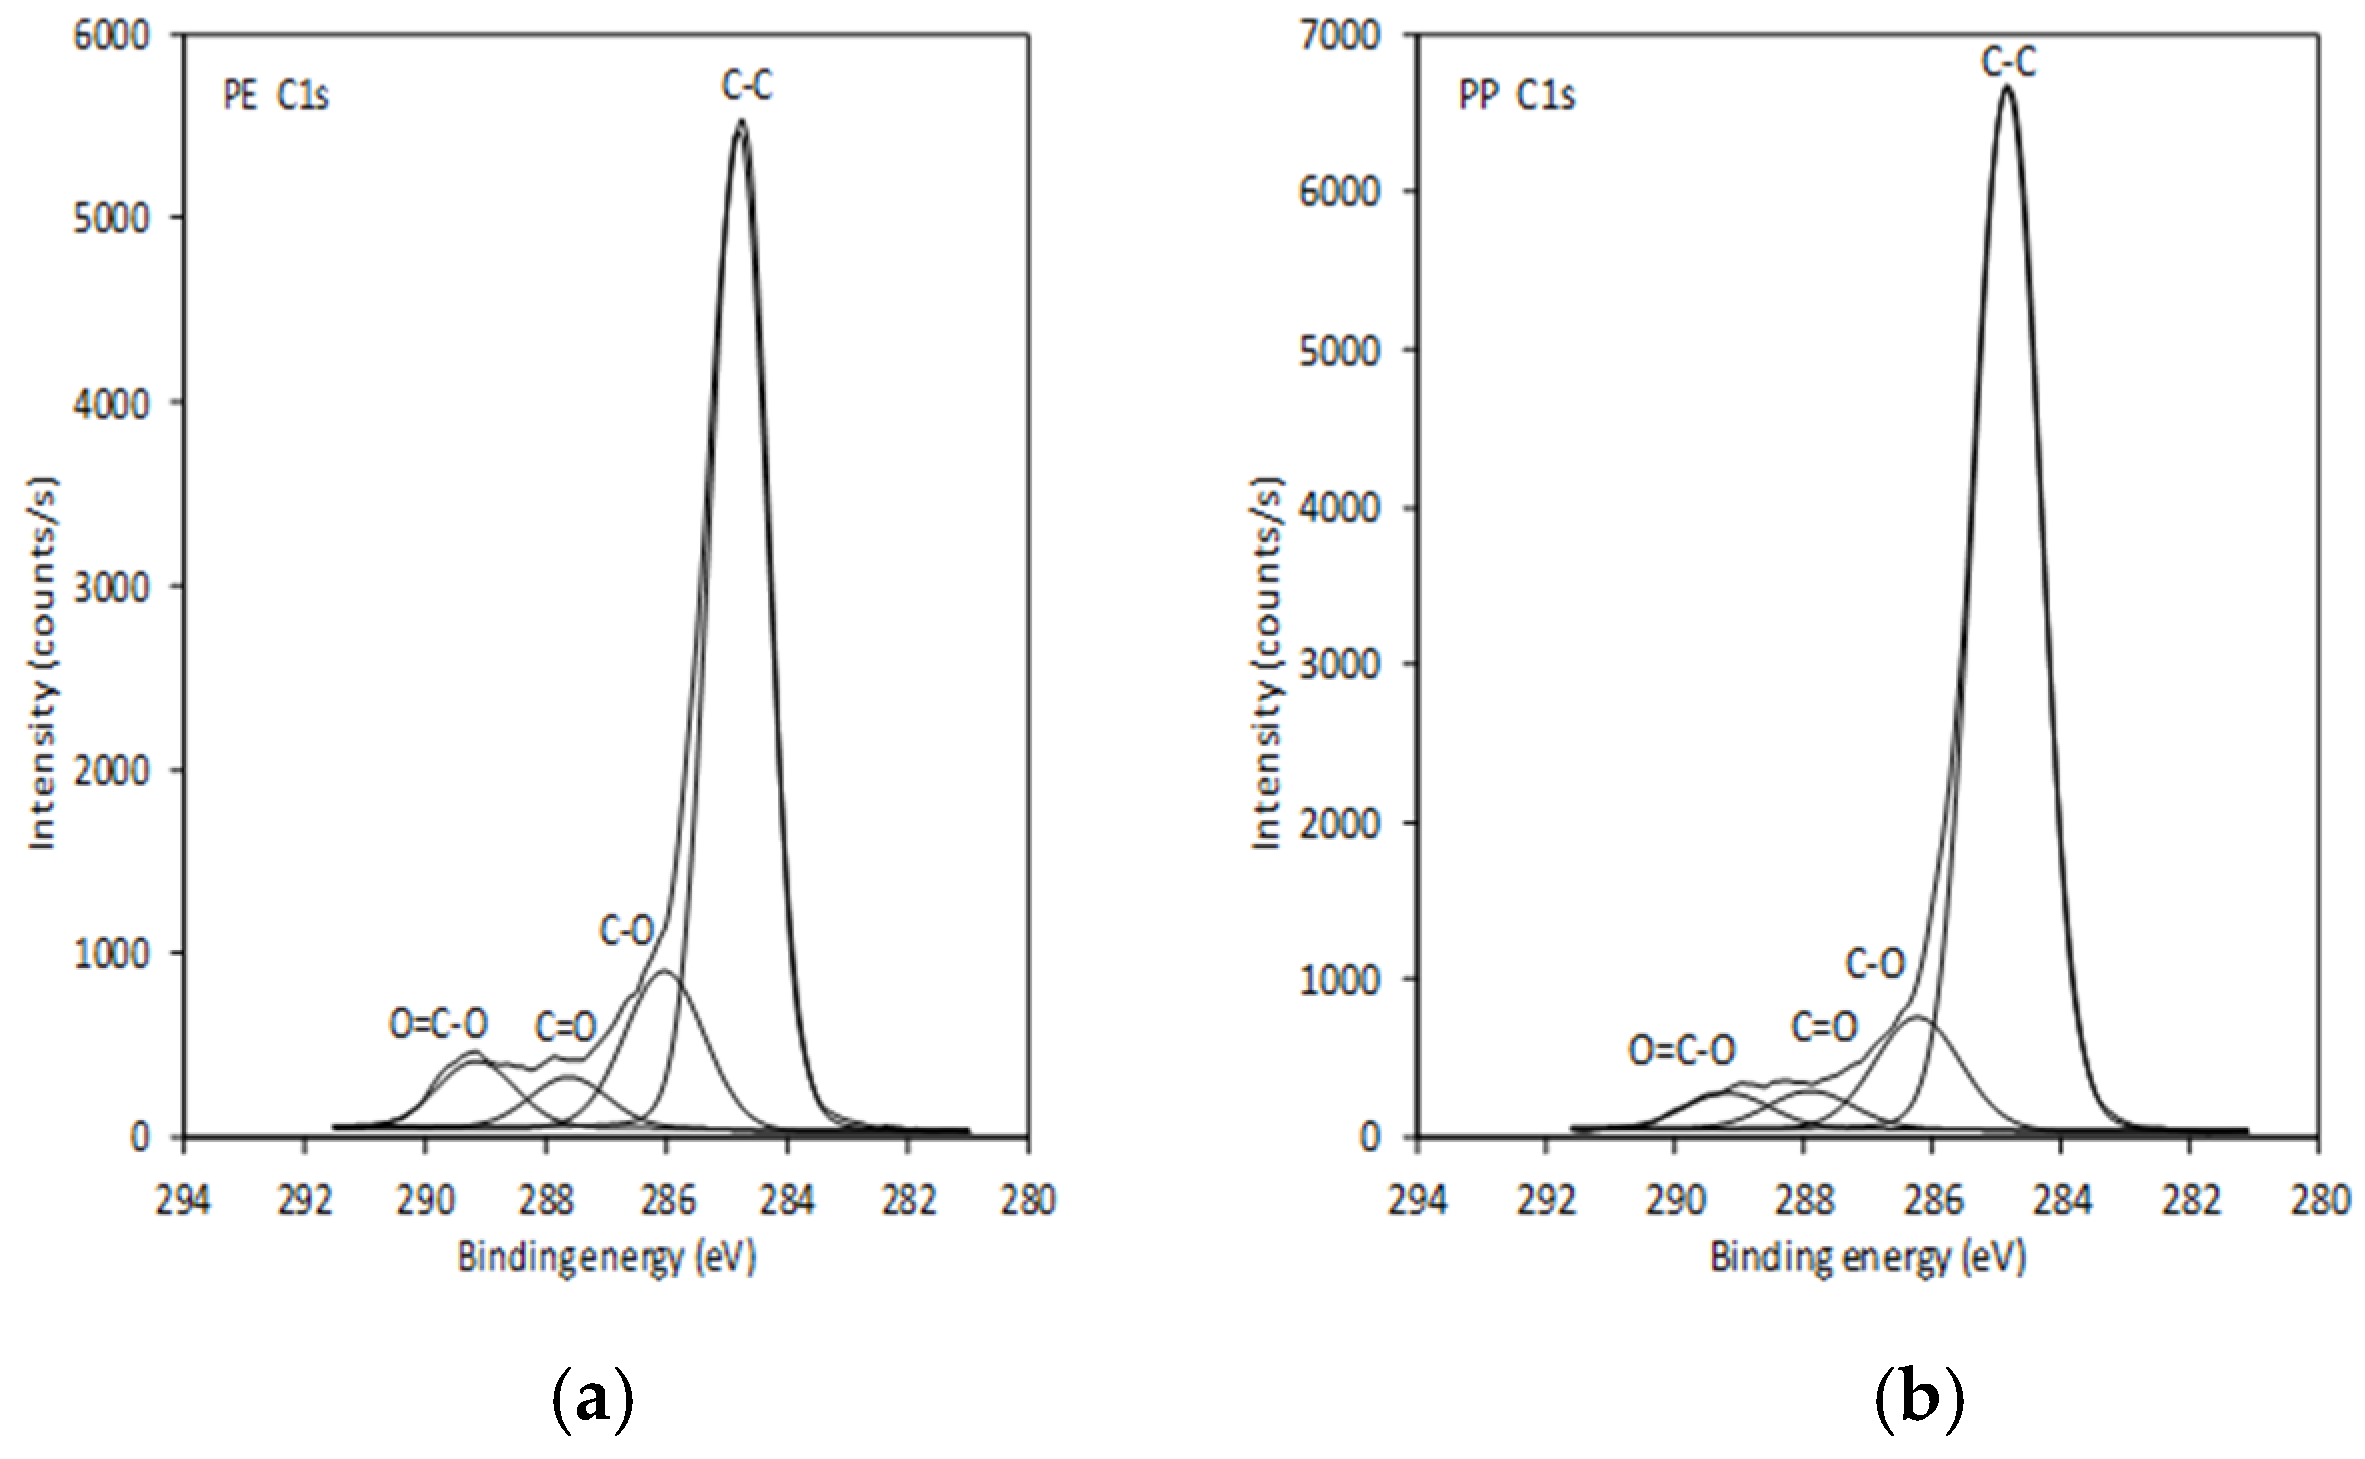
2.2.2. XPS Analysis
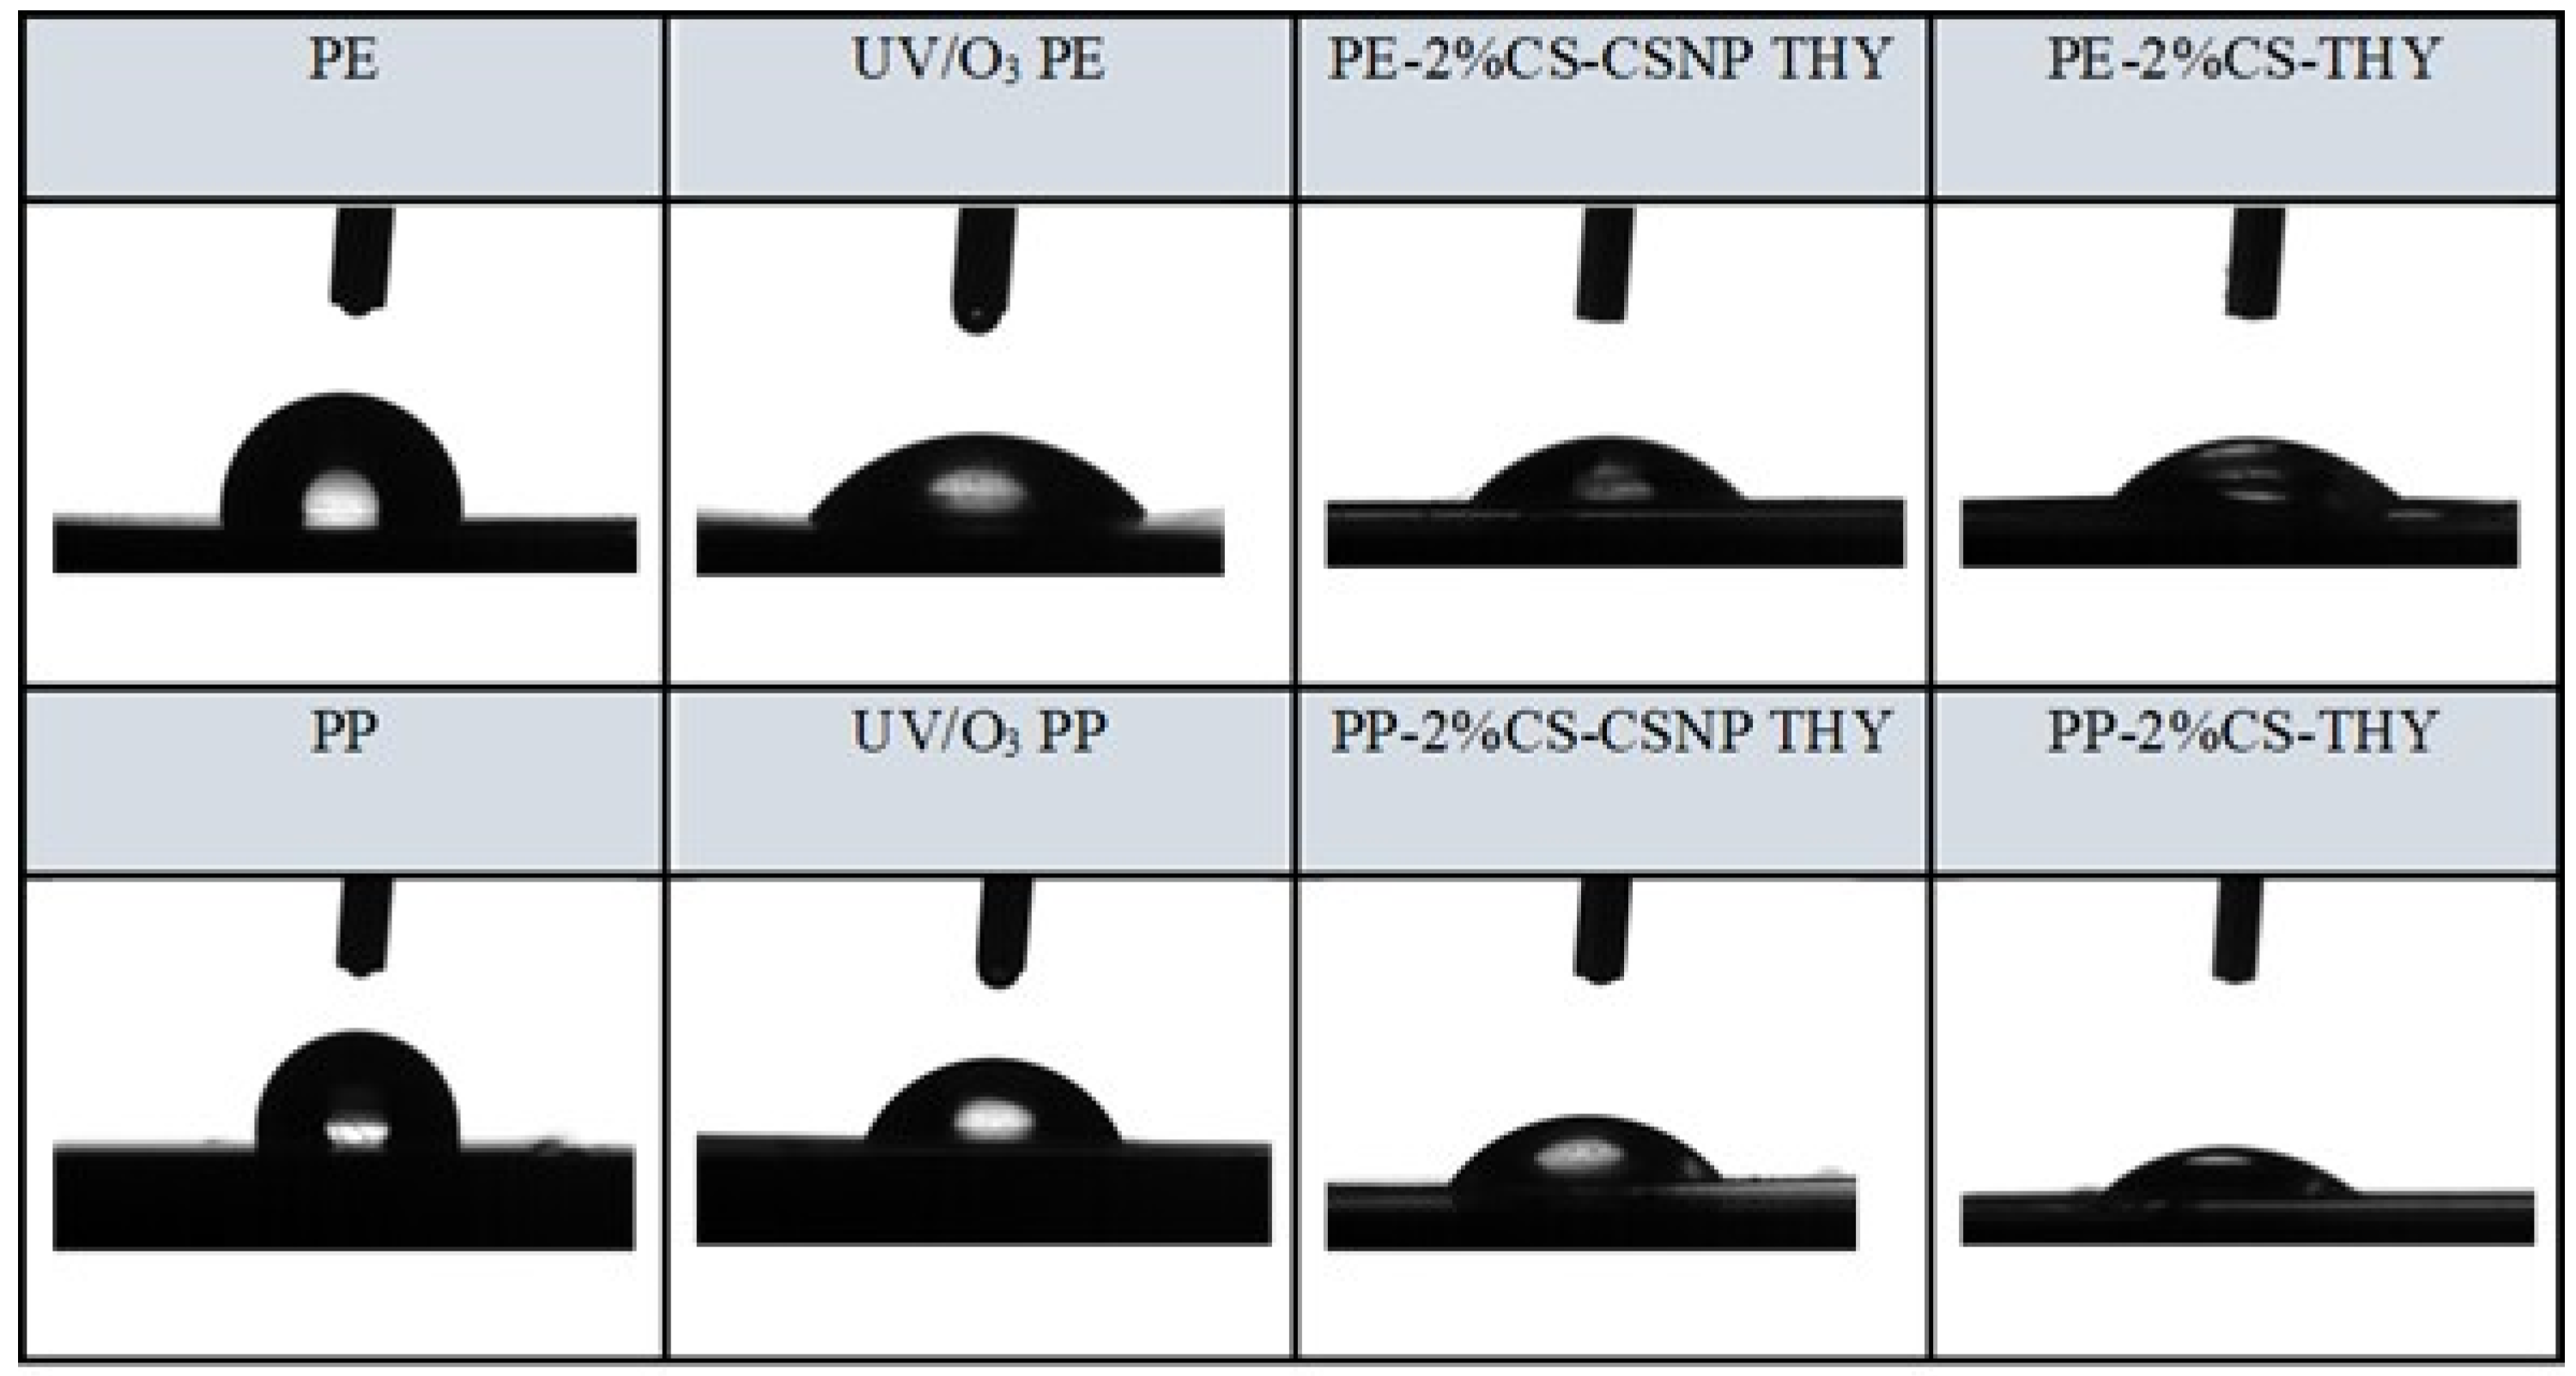
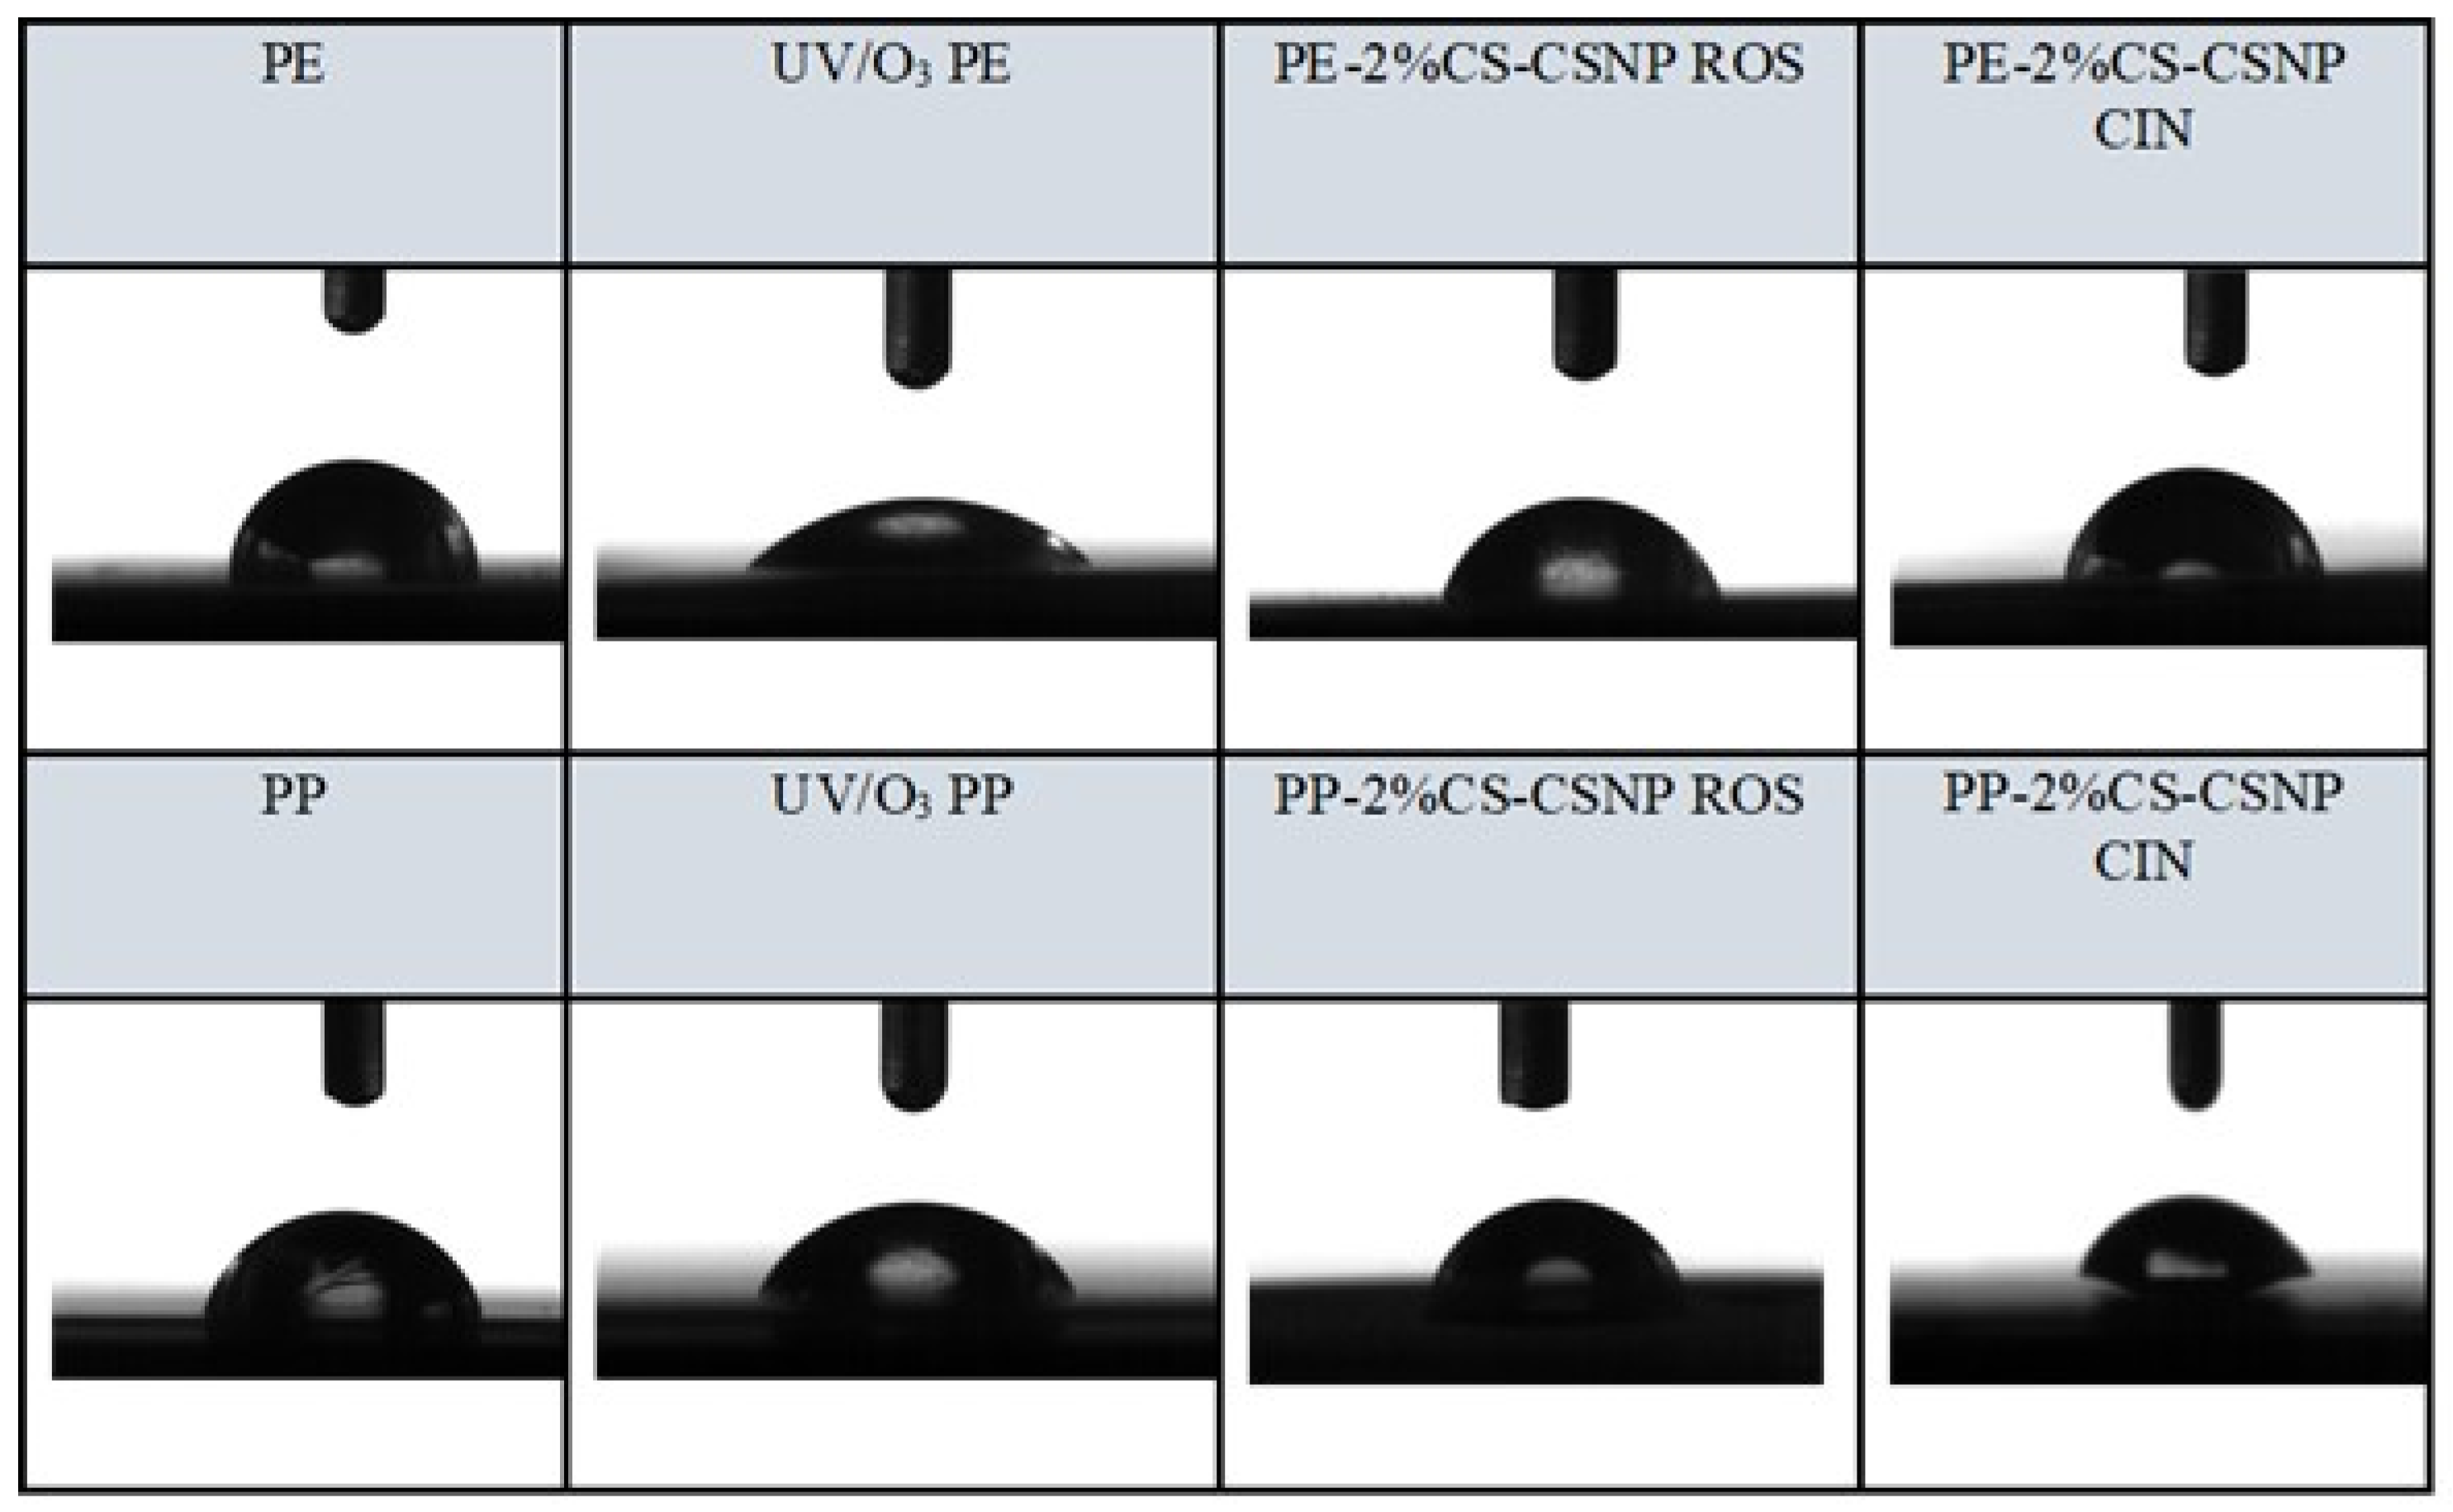
2.2.3. Goniometry
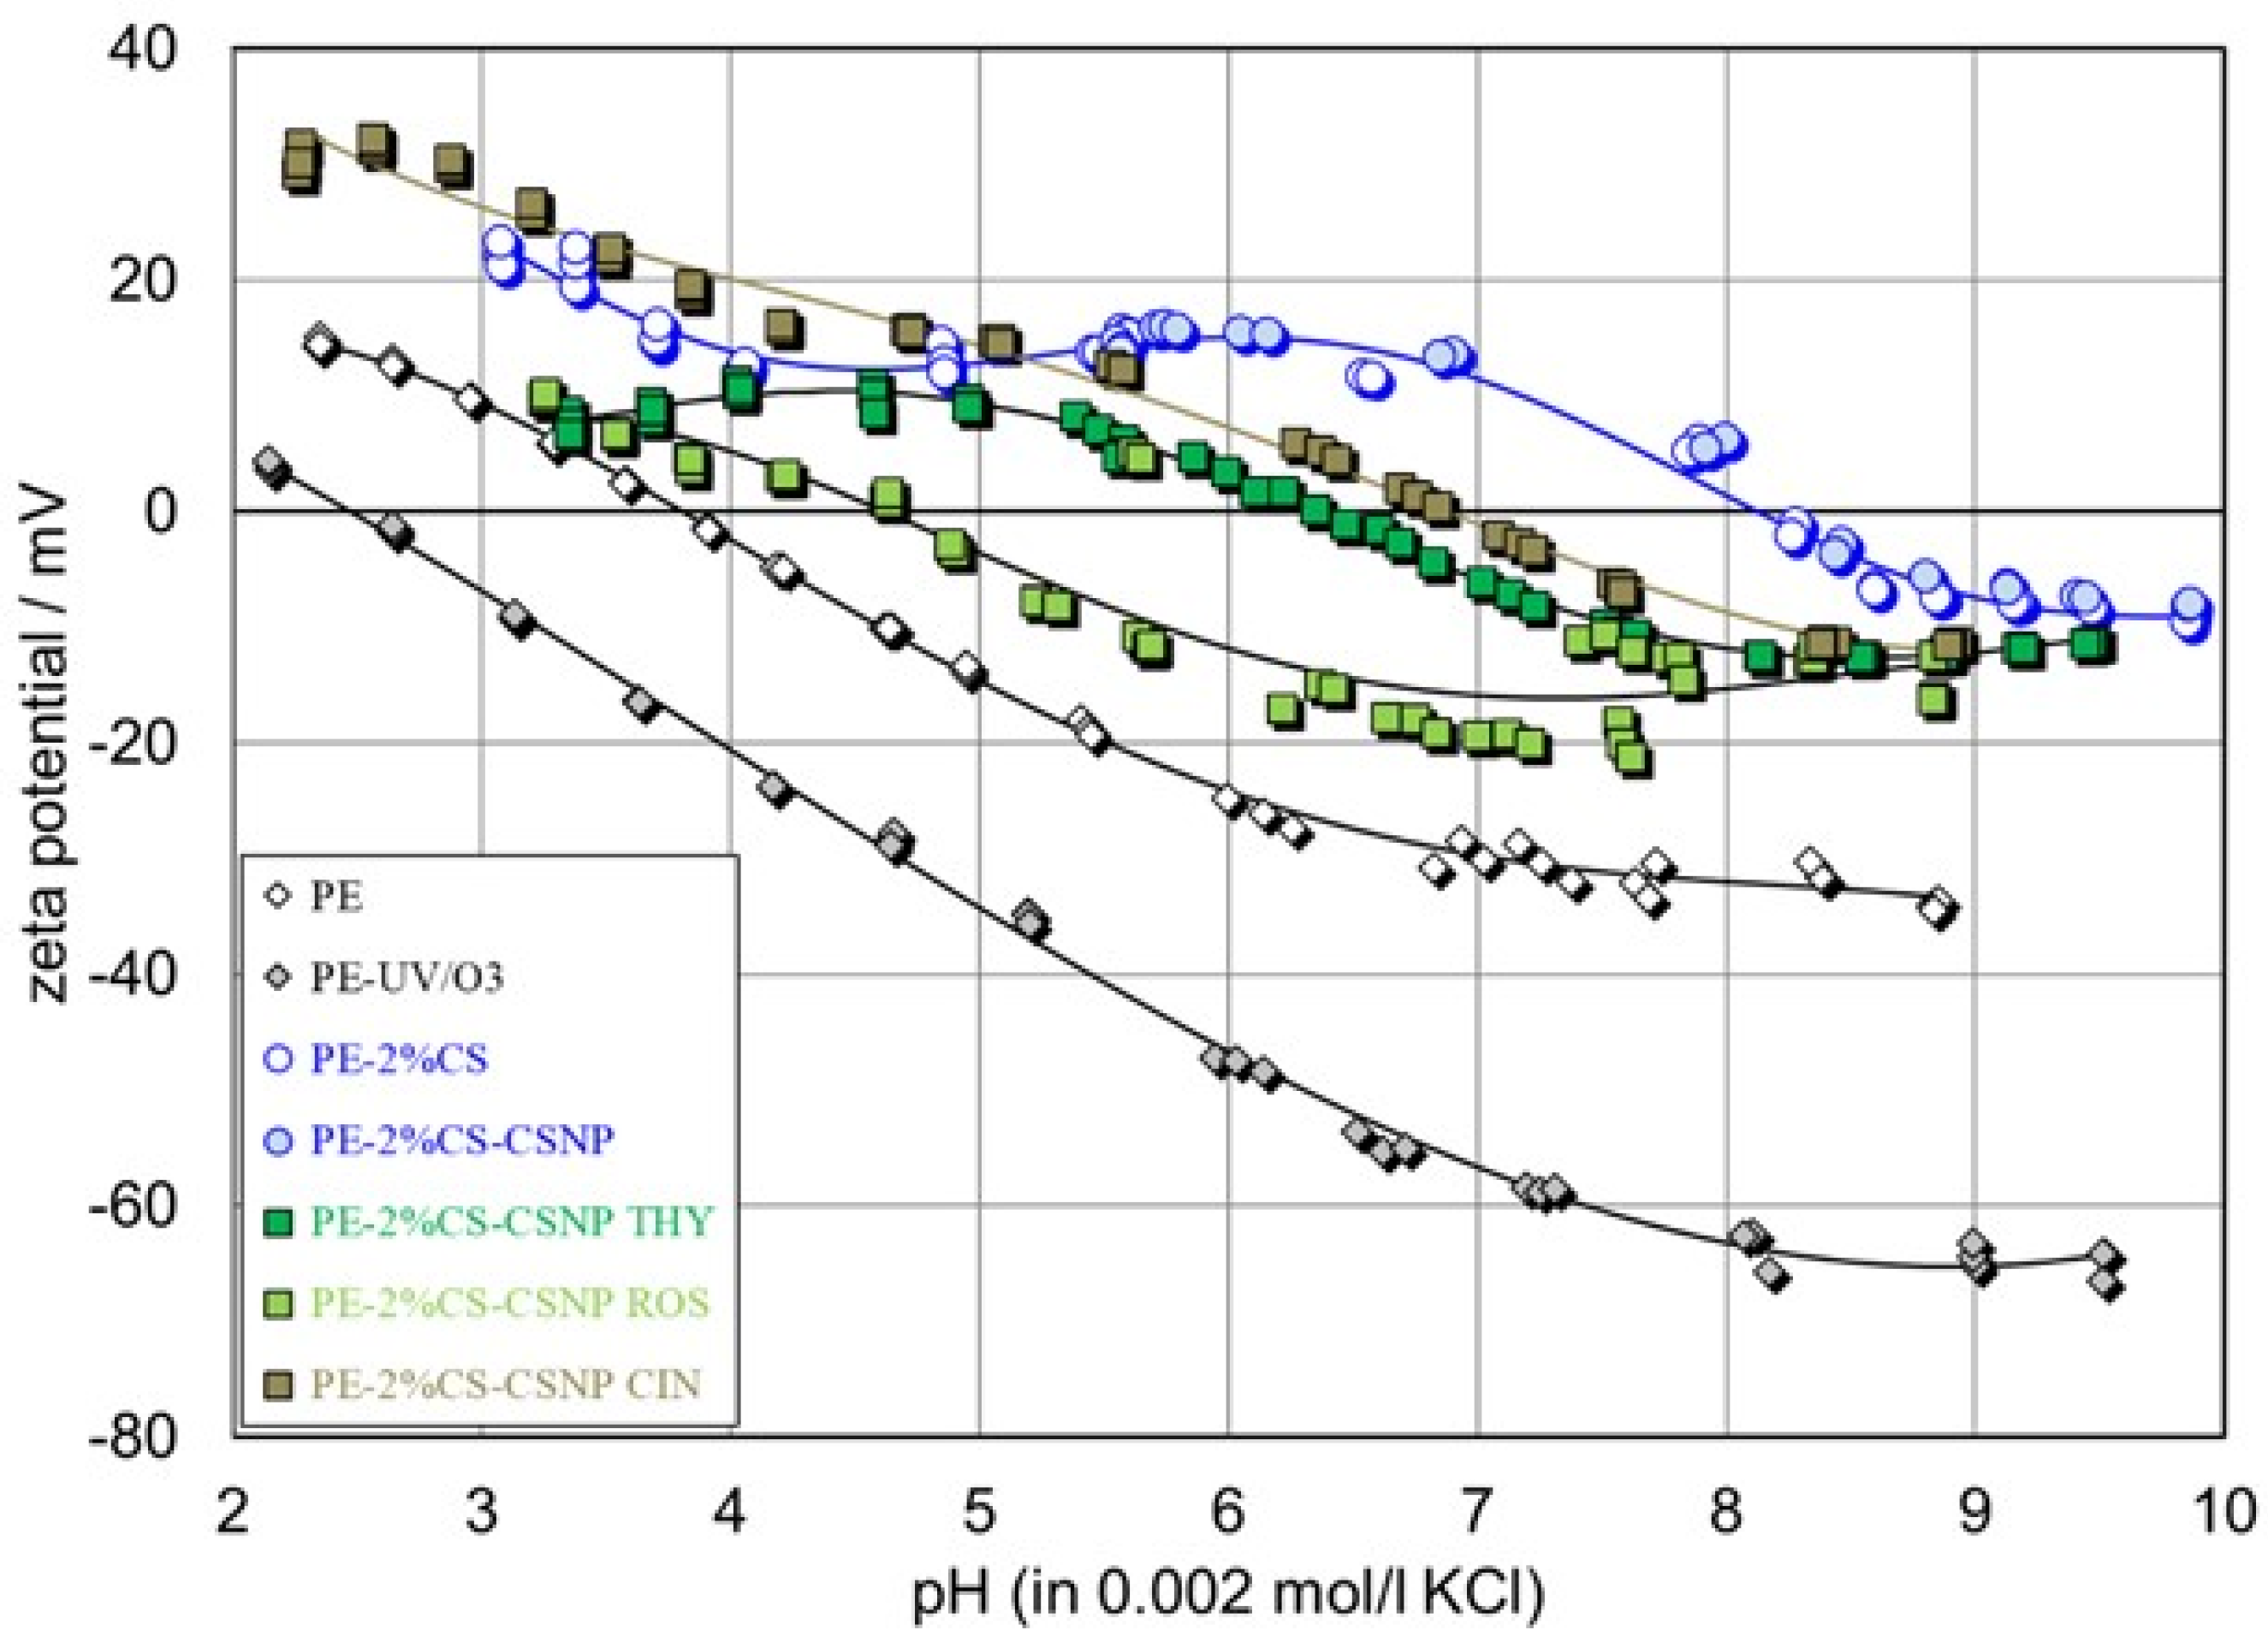
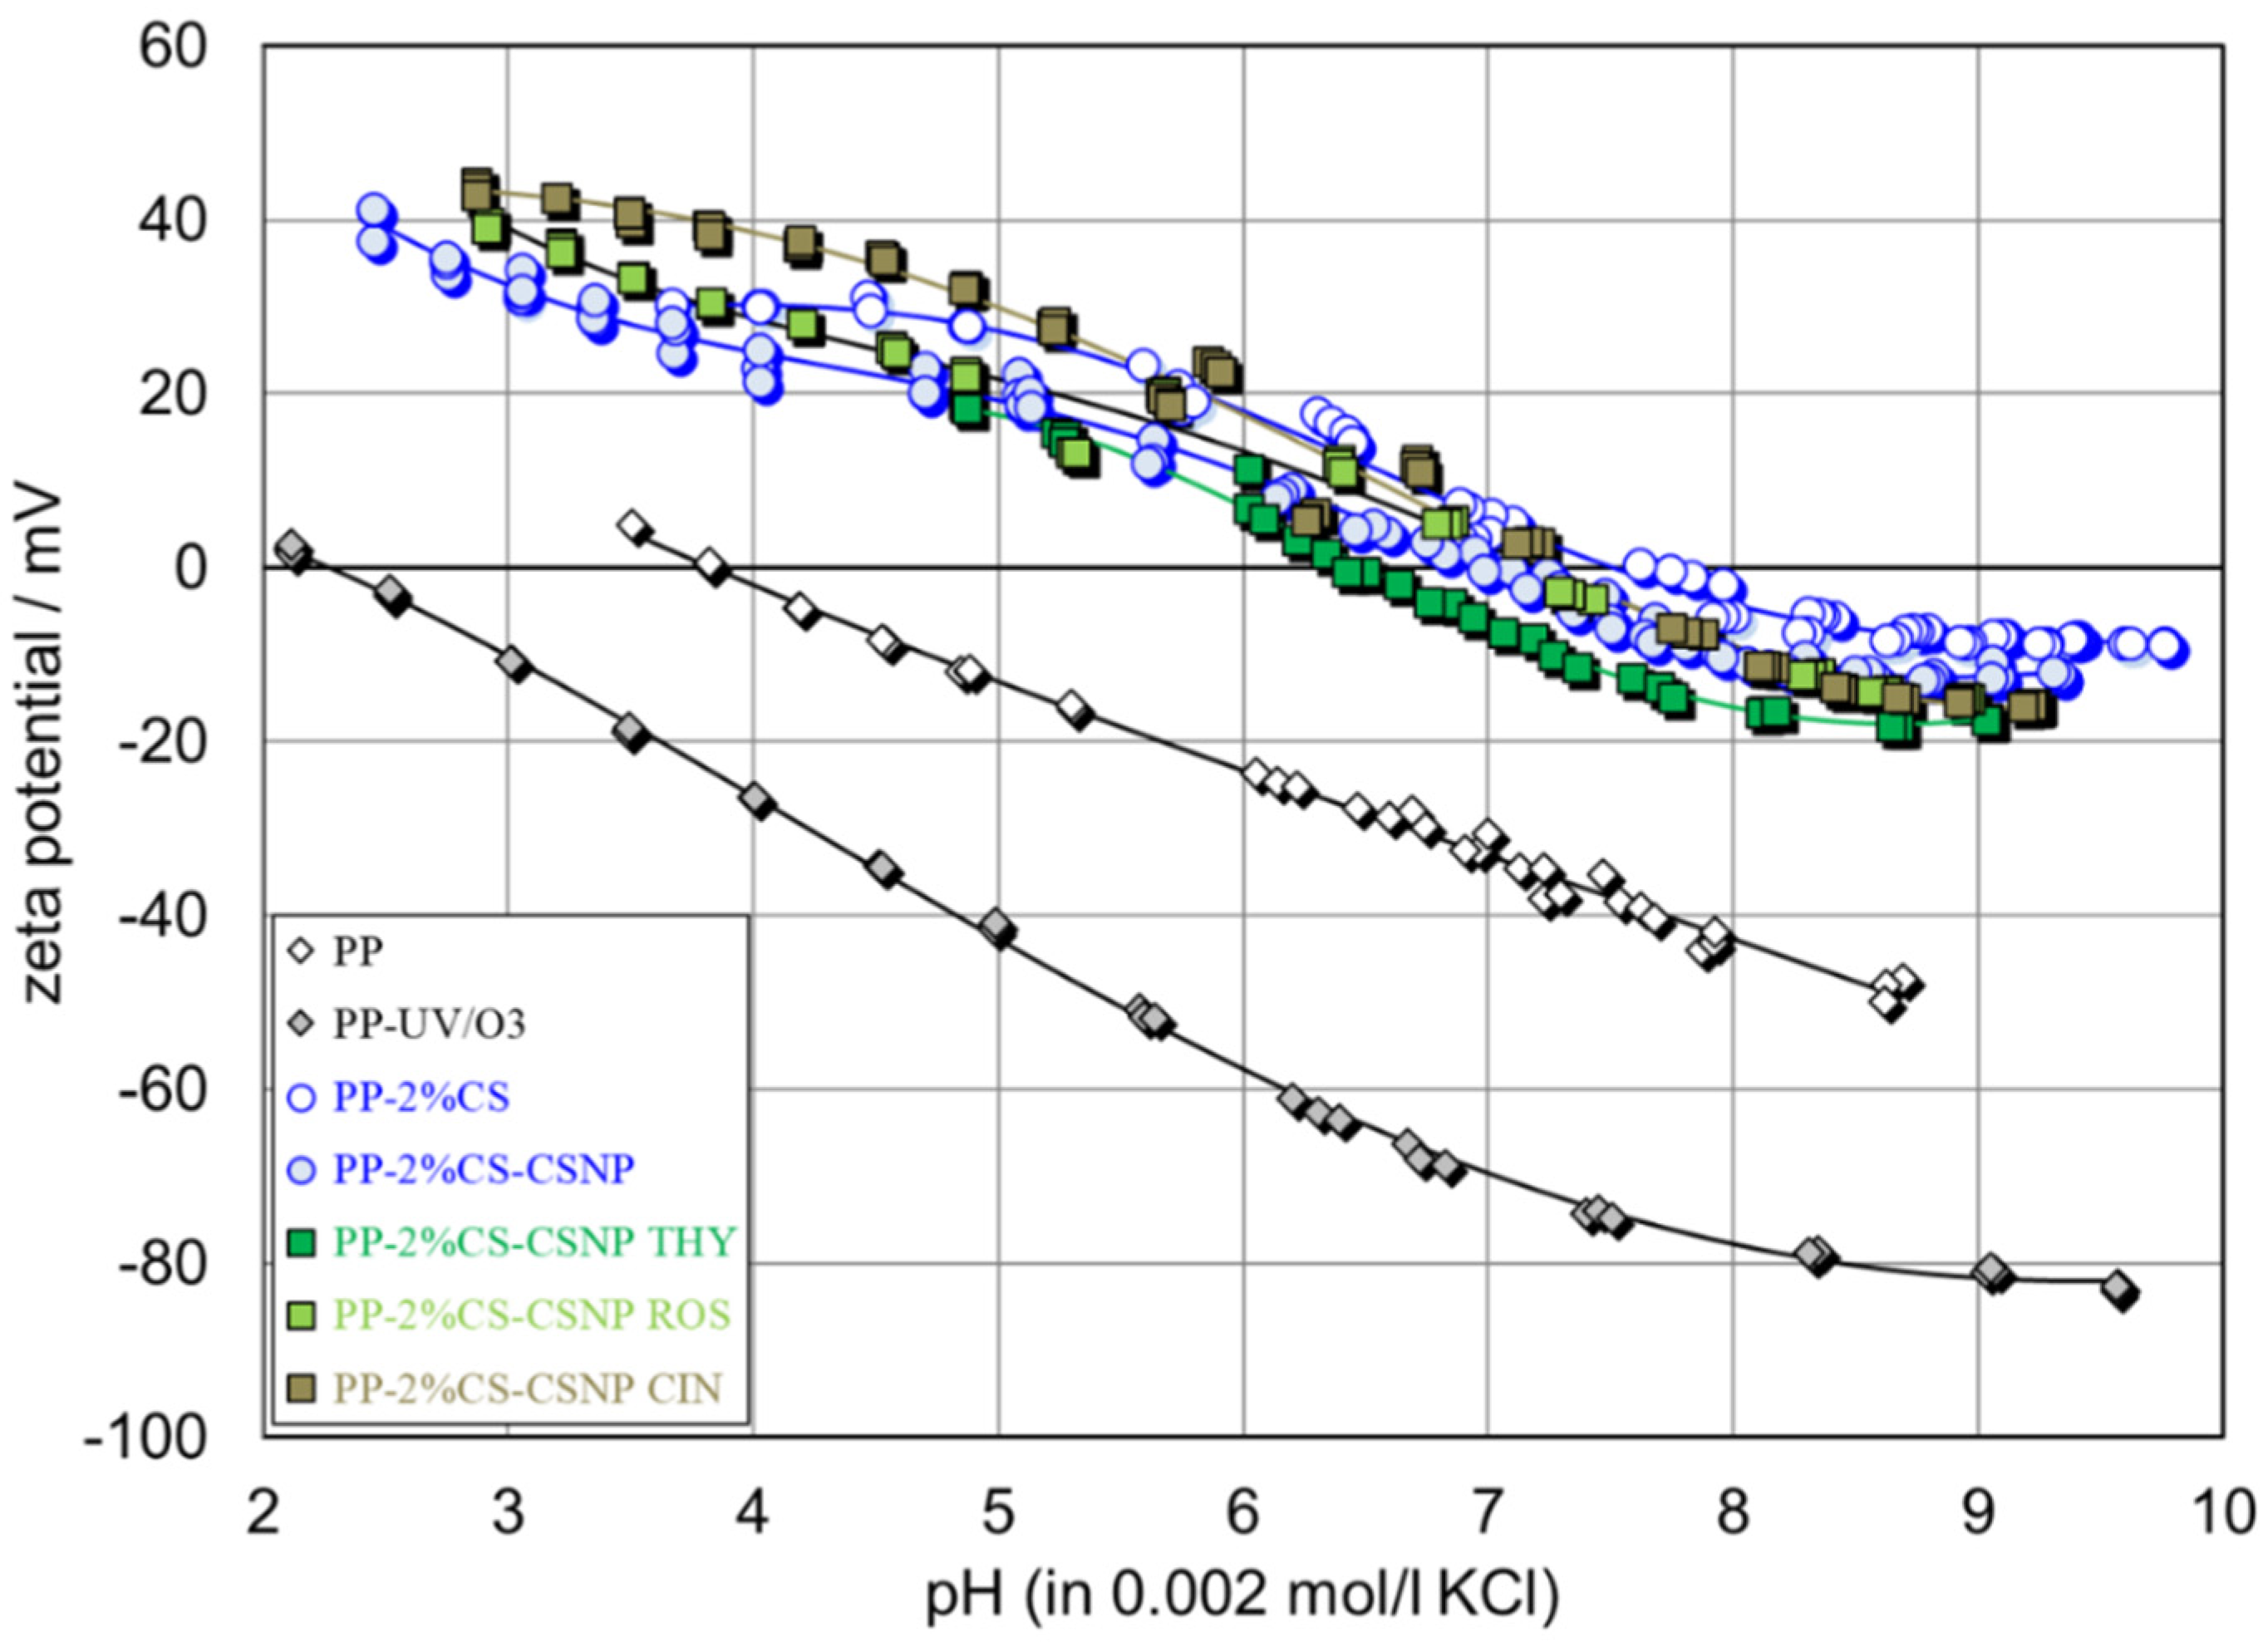
2.2.4. Surface Zeta Potential
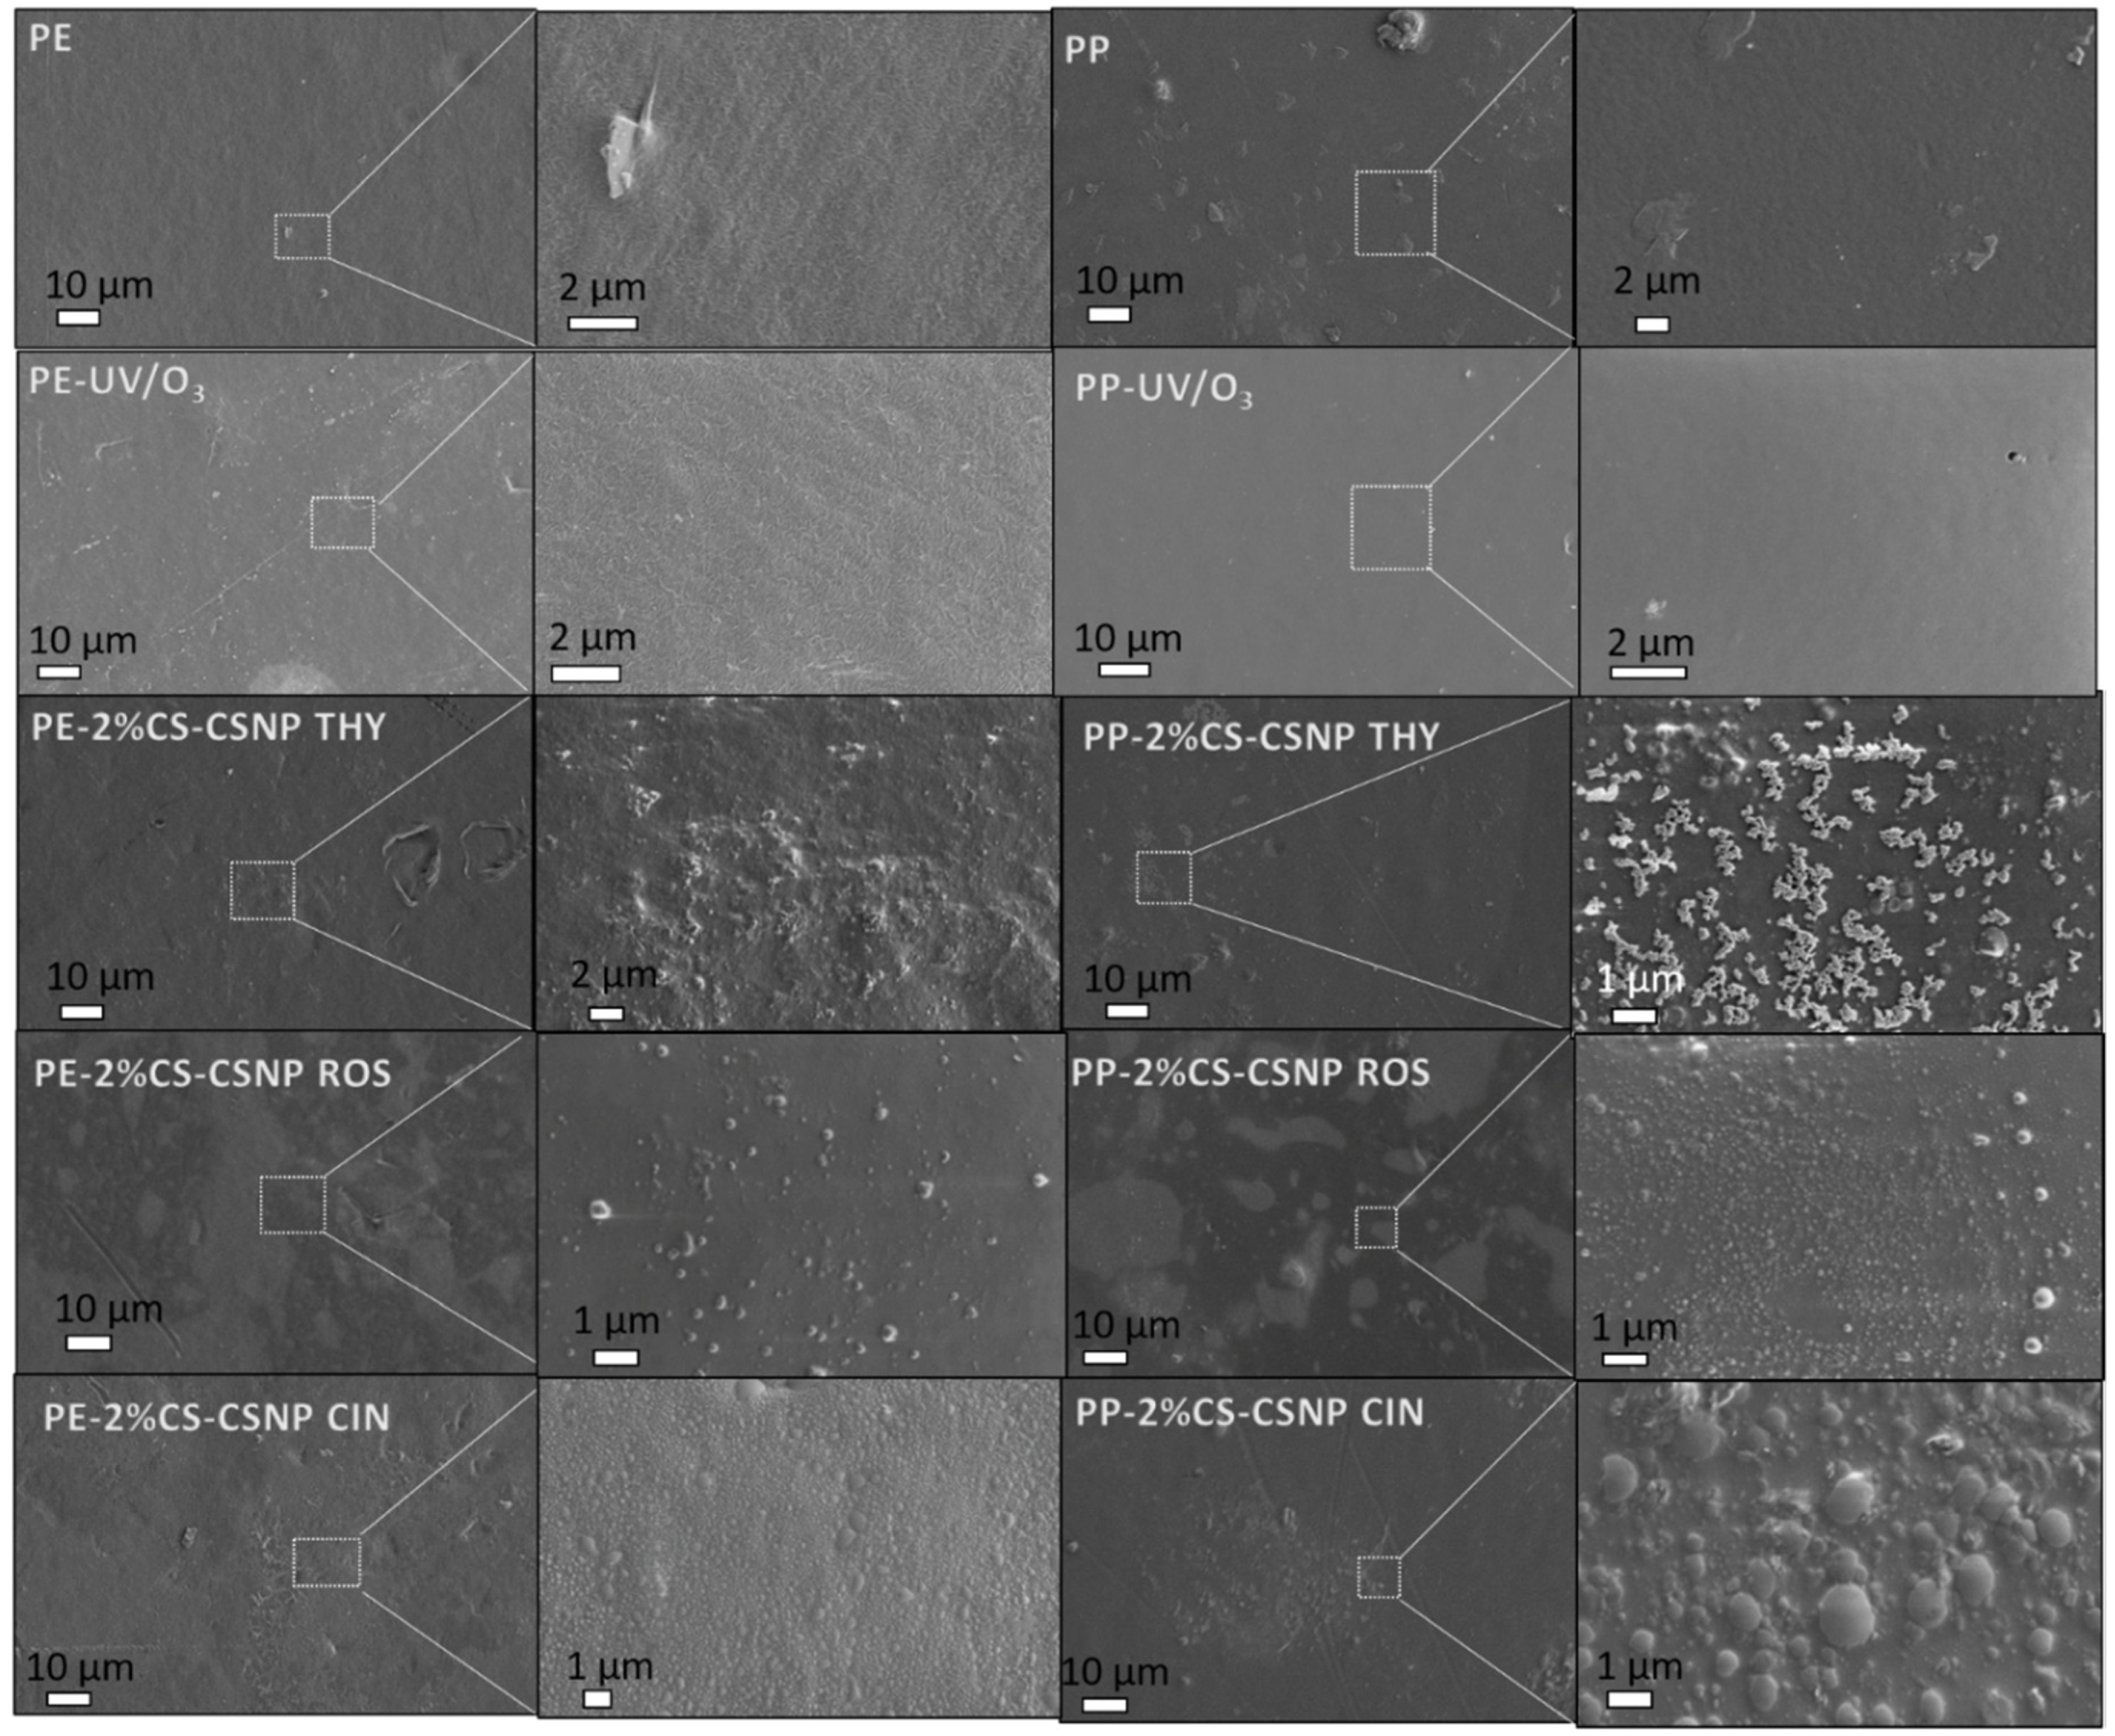
2.2.5. SEM
3. Materials and Methods
3.1. Materials
Extraction of Plant Extracts
3.2. Preparation of Solutions/Dispersions
3.3. Functionalized Foils
3.4. Methods
3.4.1. Particle Size, Polydispersity Index PDI and Zeta Potential Determination
3.4.2. Encapsulation Efficiency
3.4.3. Total Phenols’ Content
3.4.4. Surface Tension Measurements
3.4.5. ATR-FTIR Spectroscopy
3.4.6. X-ray Photoelectron Spectroscopy (XPS) Analysis
3.4.7. Goniometry
3.4.8. Surface Zeta Potential
3.4.9. Scanning Electron Microscopy, SEM Analysis
4. Conclusions
Author Contributions
Funding
Acknowledgments
Conflicts of Interest
References
- Han, J.H. Edible films and coatings: A review. In Innovations in Food Packaging, 2nd ed.; Academic Press: Cambridge, MA, USA, 2013; ISBN 9780123946010. [Google Scholar]
- Yildirim, S.; Röcker, B.; Pettersen, M.K.; Nilsen-Nygaard, J.; Ayhan, Z.; Rutkaite, R.; Radusin, T.; Suminska, P.; Marcos, B.; Coma, V. Active packaging applications for food. Compr. Rev. Food Sci. Food Saf. 2018, 17, 165–199. [Google Scholar] [CrossRef] [Green Version]
- Ahvenainen, R. Novel Food Packaging Techniques; Woodhead Publishing: Sawston, UK, 2003; ISBN 9781855736757. [Google Scholar]
- Lopez-Rubio, A.; Gavara, R.; Lagaron, J.M. Bioactive packaging: Turning foods into healthier foods through biomaterials. Trends Food Sci. Technol. 2006, 17, 567–575. [Google Scholar] [CrossRef]
- Lee, D.S. Packaging containing natural antimicrobial or antioxidative agents. In Innovations in Food Packaging; Academic Press: Cambridge, MA, USA, 2005; pp. 108–122. [Google Scholar]
- Krochta, J.M. Food packaging. In Handbook of Food Engineering, 2nd ed.; CRC Press: Boca Raton, FL, USA, 2006; ISBN 9781420014372. [Google Scholar]
- Ozdemir, M.; Floros, J.D. Active food packaging technologies. Crit. Rev. Food Sci. Nutr. 2004, 44, 185–193. [Google Scholar] [CrossRef]
- Palza, H. Antimicrobial polymers with metal nanoparticles. Int. J. Mol. Sci. 2015, 16, 2099–2116. [Google Scholar] [CrossRef] [Green Version]
- Ebnesajjad, S. Plastic Films in Food Packaging: Materials, Technology and Applications; William Andrew: Norwich, NY, USA, 2012; ISBN 9781455731121. [Google Scholar]
- Appendini, P.; Hotchkiss, J.H. Review of antimicrobial food packaging. Innov. Food Sci. Emerg. Technol. 2002, 3, 113–126. [Google Scholar] [CrossRef]
- Cuq, B.; Gontard, N.; Guilbert, S. Edible films and coatings as active layers. In Active Food Packaging; Springer: Boston, MA, USA, 1995; pp. 111–142. [Google Scholar]
- Arkoun, M.; Ardila, N.; Heuzey, M.-C.; Ajji, A. Chitosan-Based Structures/Coatings with Antibacterial Properties. In Handbook of Antimicrobial Coatings; Elsevier Inc.: Amsterdam, The Netherlands, 2018; ISBN 9780128119822. [Google Scholar]
- Glaser, T.K.; Plohl, O.; Vesel, A.; Ajdnik, U.; Ulrih, N.P.; Hrnčič, M.K.; Bren, U.; Zemljič, L.F. Functionalization of polyethylene (PE) and polypropylene (PP) material using chitosan nanoparticles with incorporated resveratrol as potential active packaging. Materials 2019, 12, 2118. [Google Scholar] [CrossRef] [Green Version]
- Chouhan, S.; Sharma, K.; Guleria, S. Antimicrobial activity of some essential oils—Present status and future perspectives. Medicines 2017, 4, 58. [Google Scholar] [CrossRef] [Green Version]
- de Souza, V.B.; Thomazini, M.; Echalar Barrientos, M.A.; Nalin, C.M.; Ferro-Furtado, R.; Genovese, M.I.; Favaro-Trindade, C.S. Functional properties and encapsulation of a proanthocyanidin-rich cinnamon extract (Cinnamomum zeylanicum) by complex coacervation using gelatin and different polysaccharides. Food Hydrocoll. 2018, 77, 297–306. [Google Scholar] [CrossRef]
- Andrade, M.A.; Ribeiro-Santos, R.; Costa Bonito, M.C.; Saraiva, M.; Sanches-Silva, A. Characterization of rosemary and thyme extracts for incorporation into a whey protein based film. LWT 2018, 92, 497–508. [Google Scholar] [CrossRef]
- Lee, K.H.; Lee, J.S.; Kim, E.S.; Lee, H.G. Preparation, characterization, and food application of rosemary extract-loaded antimicrobial nanoparticle dispersions. LWT 2019, 101, 138–144. [Google Scholar] [CrossRef]
- Dávila-Rodríguez, M.; López-Malo, A.; Palou, E.; Ramírez-Corona, N.; Jiménez-Munguía, M.T. Antimicrobial activity of nanoemulsions of cinnamon, rosemary, and oregano essential oils on fresh celery. LWT 2019, 112, 108247. [Google Scholar] [CrossRef]
- Vahedikia, N.; Garavand, F.; Tajeddin, B.; Cacciotti, I.; Jafari, S.M.; Omidi, T.; Zahedi, Z. Biodegradable zein film composites reinforced with chitosan nanoparticles and cinnamon essential oil: Physical, mechanical, structural and antimicrobial attributes. Colloids Surf. B Biointerfaces 2019, 177, 25–32. [Google Scholar] [CrossRef] [PubMed]
- Mousavi Khaneghah, A.; Hashemi, S.M.B.; Limbo, S. Antimicrobial agents and packaging systems in antimicrobial active food packaging: An overview of approaches and interactions. Food Bioprod. Process. 2018, 111, 1–19. [Google Scholar] [CrossRef]
- Fasihi, H.; Noshirvani, N.; Hashemi, M.; Fazilati, M.; Salavati, H.; Coma, V. Antioxidant and antimicrobial properties of carbohydrate-based films enriched with cinnamon essential oil by Pickering emulsion method. Food Packag. Shelf Life 2019, 19, 147–154. [Google Scholar] [CrossRef]
- Sofi, S.A.; Singh, J.; Rafiq, S.; Ashraf, U.; Dar, B.N.; Nayik, G.A. A comprehensive review on antimicrobial packaging and its use in food packaging. Curr. Nutr. Food Sci. 2018, 14, 305–312. [Google Scholar] [CrossRef]
- Malhotra, B.; Keshwani, A.; Kharkwal, H. Antimicrobial food packaging: Potential and pitfalls. Front. Microbiol. 2015, 6, 1–9. [Google Scholar] [CrossRef] [Green Version]
- Zemljič, L.F.; Peršin, Z.; Šauperl, O.; Rudolf, A.; Kostić, M. Medical textiles based on viscose rayon fabrics coated with chitosan-encapsulated iodine: antibacterial and antioxidant properties. Text. Res. J. 2018, 88, 2519–2531. [Google Scholar] [CrossRef]
- Ristić, T.; Hribernik, S.; Fras-Zemljič, L. Electrokinetic properties of fibres functionalised by chitosan and chitosan nanoparticles. Cellulose 2015, 22, 3811–3823. [Google Scholar] [CrossRef]
- Fras-Zemljič, L.; Kosalec, I.; Munda, M.; Strnad, S.; Kolar, M.; Bračič, M.; Šauperl, O. Antimicrobial efficiency evaluation by monitoring potassium efflux for cellulose fibres functionalised by chitosan. Cellulose 2015, 22, 1933–1942. [Google Scholar] [CrossRef]
- Fras-Zemljič, L.; Kokol, V.; Čakara, D. Antimicrobial and antioxidant properties of chitosan-based viscose fibres enzymatically functionalized with flavonoids. Text. Res. J. 2011, 81, 1532–1540. [Google Scholar] [CrossRef]
- Topala, C.M.; Tataru, L.D. ATR-FTIR Study of thyme and rosemary oils extracted by supercritical carbon dioxide. Rev. Chim. 2016, 67, 842–846. [Google Scholar]
- Hamelian, M.; Varmira, K.; Veisi, H. Green synthesis and characterizations of gold nanoparticles using Thyme and survey cytotoxic effect, antibacterial and antioxidant potential. J. Photochem. Photobiol. B Biol. 2018, 184, 71–79. [Google Scholar] [CrossRef] [PubMed]
- Li, Y.Q.; Kong, D.X.; Wu, H. Analysis and evaluation of essential oil components of cinnamon barks using GC-MS and FTIR spectroscopy. Ind. Crops Prod. 2013, 41, 269–278. [Google Scholar] [CrossRef]
- Wen, P.; Zhu, D.H.; Wu, H.; Zong, M.H.; Jing, Y.R.; Han, S.Y. Encapsulation of cinnamon essential oil in electrospun nanofibrous film for active food packaging. Food Control 2016, 59, 366–376. [Google Scholar] [CrossRef]
- Currie, H.A.; Perry, C.C. Silica in plants: Biological, biochemical and chemical studies. Ann. Bot. 2007, 100, 1383–1389. [Google Scholar] [CrossRef]
- Yu, Q.; Wu, Z.; Chen, H. Dual-function antibacterial surfaces for biomedical applications. Acta Biomater. 2015, 16, 1–13. [Google Scholar] [CrossRef]
- Junter, G.A.; Thébault, P.; Lebrun, L. Polysaccharide-based antibiofilm surfaces. Acta Biomater. 2016, 30, 13–25. [Google Scholar] [CrossRef]
- Hunter, R.J. Zeta Potential in Colloid Science: Principles and Applications; Academic Press: Cambridge, MA, USA, 1981. [Google Scholar]
- Temmel, S.; Kern, W.; Luxbacher, T. Zeta potential of photochemically modified polymer surfaces. Prog. Colloid Polym. Sci. 2006, 132, 54–61. [Google Scholar]
- Zimmermann, R.; Freudenberg, U.; Schweiß, R.; Küttner, D.; Werner, C. Hydroxide and hydronium ion adsorption—A survey. Curr. Opin. Colloid Interface Sci. 2010, 15, 196–202. [Google Scholar] [CrossRef]
- Tkavc, T.; Petrinič, I.; Luxbacher, T.; Vesel, A.; Ristić, T.; Zemljič, L.F. Influence of O2 and CO2 plasma treatment on the deposition of chitosan onto polyethylene terephthalate (PET) surfaces. Int. J. Adhes. Adhes. 2014, 48, 168–176. [Google Scholar] [CrossRef]
- Matsumoto, H.; Yako, H.; Minagawa, M.; Tanioka, A. Characterization of chitosan nanofiber fabric by electrospray deposition: Electrokinetic and adsorption behavior. J. Colloid Interface Sci. 2007, 310, 678–681. [Google Scholar] [CrossRef]
- Behary, N.; Perwuelz, A.; Campagne, C.; Lecouturier, D.; Dhulster, P.; Mamede, A.S. Adsorption of surfactin produced from Bacillus subtilis using nonwoven PET (polyethylene terephthalate) fibrous membranes functionalized with chitosan. Colloids Surf. B Biointerfaces 2012, 90, 137–143. [Google Scholar] [CrossRef] [PubMed]
- Nagata, T.; Oh, S.; Chikyow, T.; Wakayama, Y. Effect of UV-ozone treatment on electrical properties of PEDOT:PSS film. Org. Electron. 2011, 12, 279–284. [Google Scholar] [CrossRef]
- Ristić, T.; Lasič, S.; Kosalec, I.; Bračič, M.; Fras-Zemljič, L. The effect of chitosan nanoparticles onto Lactobacillus cells. React. Funct. Polym. 2015, 97, 56–62. [Google Scholar] [CrossRef]
- Jayaprakasha, G.K.; Singh, R.P.; Sakariah, K.K. Antioxidant activity of grape seed (Vitis vinifera) extracts on peroxidation models in vitro. Food Chem. 2001, 73, 285–290. [Google Scholar] [CrossRef]
- Chun, M.S.; Lee, S.Y.; Yang, S.M. Estimation of zeta potential by electrokinetic analysis of ionic fluid flows through a divergent microchannel. J. Colloid Interface Sci. 2003, 266, 120–126. [Google Scholar] [CrossRef]


| Dispersion | Size (nm) | PDI | ZP (mV) |
|---|---|---|---|
| CSNP | 293 ± 80 | 0.871 | 37 ± 2 |
| CSNP THY | 1138 ± 93 | 0.917 | 39 ± 3 |
| CSNP ROS | 6627 ± 353 | 0.642 | 39 ± 5 |
| CSNP CIN | 2993 ± 435 | 1.000 | 40 ± 4 |
| Dispersion | Degree of Encapsulation (%) |
|---|---|
| CSNP THY | 77.93 ± 2.85 |
| CSNP ROS | 83.51 ± 1.76 |
| CSNP CIN | 86.03 ± 4.25 |
| Sample | Concentration of GA in Extract Solution, WGA (mg/g) |
|---|---|
| THY | 64.00 |
| ROS | 154.00 |
| CIN | 214.00 |
| CSNP THY | 4.50 |
| CSNP ROS | 4.31 |
| CSNP CIN | 5.38 |
| Sample | C | N | O | Si | S | Cl | K |
|---|---|---|---|---|---|---|---|
| PE-UV/O3 | 80.3 | / | 19.4 | ||||
| PP-UV/O3 | 84.9 | / | 15.1 | ||||
| PE-THY | 67.0 | 1.4 | 29.4 | 0.8 | 0.1 | 0.4 | 1.0 |
| PP-THY | 63.7 | 1.1 | 32.1 | 1.7 | 0.1 | 0.3 | 1.0 |
| Thyme coated on silicon wafer | 69.9 | 0.8 | 27.6 | 0.1 | 0.1 | 0.6 | 1.1 |
| Difference (%) * PE | −13.3 | 1.4 | 10 | 0.8 | 0.1 | 0.4 | 1.0 |
| PP | −21.2 | 1.1 | 17 | 1.7 | 0.1 | 0.3 | 1.0 |
| Sample | C | N | O | Na | Si | P | S | Cl |
|---|---|---|---|---|---|---|---|---|
| PE-UV/O3 | 80.3 | / | 19.4 | |||||
| PP-UV/O3 | 84.9 | / | 15.1 | |||||
| PE-2%CS-CSNP THY | 62.2 | 4.1 | 31.5 | 0.3 | 1.2 | 0.6 | 0.1 | 0.1 |
| PP-2%CS-CSNP THY | 59.3 | 4.8 | 33.4 | 0.1 | 1.0 | 1.1 | 0.2 | 0.1 |
| Difference (%) PE | −18.1 | 4.1 | 12.1 | 0.3 | 1.2 | 0.6 | 0.1 | 0.1 |
| PP | −25.6 | 4.8 | 18.3 | 0.1 | 1.0 | 1.1 | 0.2 | 0.1 |
| Sample | C | N | O | Si |
|---|---|---|---|---|
| PE-UV/O3 | 80.3 | / | 19.4 | |
| PP-UV/O3 | 84.9 | / | 15.1 | |
| PE-ROS | 81.1 | 0.6 | 17.9 | 0.4 |
| PP-ROS | 75.4 | 0.3 | 22.7 | 1.6 |
| Difference (%) PE | 0.8 | 0.6 | −1.5 | 0.4 |
| PP | −9.5 | 0.3 | 7.6 | 1.6 |
| Sample | C | N | O | Na | Si | P |
|---|---|---|---|---|---|---|
| PE-UV/O3 | 80.3 | / | 19.4 | |||
| PP-UV/O3 | 84.9 | / | 15.1 | |||
| PE-2%CS-CSNP ROS | 66.7 | 4.0 | 26.8 | 0.4 | 1.9 | 0.2 |
| PP-2%CS-CSNP ROS | 62.0 | 3.8 | 27.8 | 0.3 | 5.9 | 0.3 |
| Difference (%) PE | −13.6 | 4.0 | 7.4 | 0.4 | 1.9 | 0.2 |
| PP | −22.9 | 3.8 | 12.7 | 0.3 | 5.9 | 0.3 |
| Sample | C | N | O | Si |
|---|---|---|---|---|
| PE-UV/O3 | 80.3 | / | 19.4 | |
| PP-UV/O3 | 84.9 | / | 15.1 | |
| PE-CIN | 77.1 | 0.5 | 21.1 | 1.3 |
| PP-CIN | 75.3 | / | 23.6 | 1.1 |
| Difference (%) PE | −3.2 | 0.5 | 1.7 | 1.3 |
| PP | −9.6 | 0 | 8.5 | 1.1 |
| Sample | C | N | O | Na | Si | P | Cl |
|---|---|---|---|---|---|---|---|
| PE-UV/O3 | 80.3 | / | 19.4 | ||||
| PP-UV/O3 | 84.9 | / | 15.1 | ||||
| PE-2%CS-CSNP CIN | 63.3 | 4.0 | 27.4 | 0.7 | 4.3 | 0.3 | / |
| PP-2%CS-CSNP CIN | 62.2 | 3.2 | 28.4 | 0.2 | 5.7 | 0.1 | 0.2 |
| Difference (%) PE | −17.0 | 4.0 | 8.0 | 0.7 | 4.3 | 0.3 | / |
| PP | −22.7 | 3.2 | 13.3 | 0.2 | 5.7 | 0.1 | 0.2 |
| Sample | Average Angle (α/°) | Difference (%) |
|---|---|---|
| PE | 92.54° | / |
| PP | 100.60° | / |
| PE-UV/O3 | 48.67° | 47.4 |
| PP-UV/O3 | 65.89° | 34.5 |
| PE-2%CS-CSNP THY | 51.00° | 44.9 |
| PP-2%CS-CSNP THY | 56.30° | 44.0 |
| PE-2%CS-CSNP ROS | 74.85° | 17.7 |
| PP-2%CS-CSNP ROS | 73.45° | 27.2 |
| PE-2%CS-CSNP CIN | 82.30° | 10.2 |
| PP-2%CS-CSNP CIN | 65.40° | 35.2 |
| Sample Notation | Description of Sample |
|---|---|
| PE | polyethylene foil |
| PP | polypropylene foil |
| PE-UV/O3 | PE foil treated with a UV/OZONE system |
| PP-UV/O3 | PP foil treated with a UV/OZONE system |
| CS | chitosan powder |
| THY | thyme extract- Thymus vulgaris L. |
| ROS | rosemary extract |
| CIN | cinnamon extract |
| CSNP | chitosan nanoparticles’ dispersion |
| CSNP THY | chitosan nanoparticles with encapsulated thyme extract dispersion |
| CSNP ROS | chitosan nanoparticles with encapsulated rosemary extract dispersion |
| CSNP CIN | chitosan nanoparticles with encapsulated cinnamon extract dispersion |
| PE-2%CS-CSNP THY | UV/O3 treated PE foil, coated with 2% CS and CSNP THY |
| PP-2%CS-CSNP THY | UV/O3 treated PP foil, coated with 2% CS and CSNP THY |
| PE-2%CS-THY | UV/O3 treated PE foil, coated with 2% CS and thyme extract solution |
| PP-2%CS-THY | UV/ O3 treated PP foil, coated with 2% CS and thyme extract solution |
| PE-THY | UV/O3 treated PE foil, coated with thyme extract solution |
| PP-THY | UV/O3 treated PP foil, coated with thyme extract solution |
| PE-2%CS-CSNP ROS | UV/O3 treated PE foil, coated with 2% CS and CSNP ROS |
| PP-2%CS-CSNP ROS | UV/O3 treated PP foil, coated with 2% CS and CSNP ROS |
| PE-ROS | UV/O3 treated PE foil, coated with rosemary extract solution |
| PP-ROS | UV/O3 treated PP foil, coated with rosemary extract solution |
| PE-2%CS-CSNP CIN | UV/O3 treated PE foil, coated with 2% CS and CSNP CIN |
| PP-2%CS-CSNP CIN | UV/O3 treated PP foil, coated with 2% CS and CSNP CIN |
| PE-CIN | UV/O3 treated PE foil, coated with cinnamon extract solution |
| PP-CIN | UV/O3 treated PP foil, coated with cinnamon extract solution |
| PE-2%CS | PE foil treated with UV/O3, applicated with 2% CS solution |
| PP-2%CS | PP foil treated with UV/O3, applicated with 2% CS solution |
| PE-2%CS-CSNP | PE foil treated with UV/O3, applicated with 2% CS solution and CSNP |
| PP-2%CS-CSNP | PE foil treated with UV/O3, applicated with 2% CS solution and CSNP |
© 2020 by the authors. Licensee MDPI, Basel, Switzerland. This article is an open access article distributed under the terms and conditions of the Creative Commons Attribution (CC BY) license (http://creativecommons.org/licenses/by/4.0/).
Share and Cite
Zemljič, L.F.; Plohl, O.; Vesel, A.; Luxbacher, T.; Potrč, S. Physicochemical Characterization of Packaging Foils Coated by Chitosan and Polyphenols Colloidal Formulations. Int. J. Mol. Sci. 2020, 21, 495. https://0-doi-org.brum.beds.ac.uk/10.3390/ijms21020495
Zemljič LF, Plohl O, Vesel A, Luxbacher T, Potrč S. Physicochemical Characterization of Packaging Foils Coated by Chitosan and Polyphenols Colloidal Formulations. International Journal of Molecular Sciences. 2020; 21(2):495. https://0-doi-org.brum.beds.ac.uk/10.3390/ijms21020495
Chicago/Turabian StyleZemljič, Lidija Fras, Olivija Plohl, Alenka Vesel, Thomas Luxbacher, and Sanja Potrč. 2020. "Physicochemical Characterization of Packaging Foils Coated by Chitosan and Polyphenols Colloidal Formulations" International Journal of Molecular Sciences 21, no. 2: 495. https://0-doi-org.brum.beds.ac.uk/10.3390/ijms21020495