Article

Glioblastoma Exhibits Inter-Individual Heterogeneity of TSPO and LAT1 Expression in Neoplastic and Parenchymal Cells

1
Neurosurgical Research, Department of Neurosurgery, University Hospital, LMU Munich, 81377 Munich, Germany
2
Department of Neurosurgery, University Hospital, LMU Munich, 81377 Munich, Germany
3
German Cancer Consortium (DKTK), Partner Site Munich and German Cancer Research Center (DKFZ), 69120 Heidelberg, Germany
4
Walter Brendel Center of Experimental Medicine, Faculty of Medicine, LMU Munich, 81377 Munich, Germany
*
Author to whom correspondence should be addressed.
These authors contributed equally to this work.
Int. J. Mol. Sci. 2020, 21(2), 612; https://0-doi-org.brum.beds.ac.uk/10.3390/ijms21020612
Submission received: 26 December 2019 / Revised: 11 January 2020 / Accepted: 13 January 2020 / Published: 17 January 2020
(This article belongs to the Special Issue Advances of Molecular Biology and Translational Aspects in CNS Tumors)

Abstract

:
Molecular imaging is essential for diagnosis and treatment planning for glioblastoma patients. Positron emission tomography (PET) with tracers for the detection of the solute carrier family 7 member 5 (SLC7A5; also known as the amino acid transporter light chain L system, LAT1) and for the mitochondrial translocator protein (TSPO) is successfully used to provide additional information on tumor volume and prognosis. The current approaches for TSPO-PET and the visualization of tracer ([18F] Fluoroethyltyrosine, FET) uptake by LAT1 (FET-PET) do not yet exploit the full diagnostic potential of these molecular imaging techniques. Therefore, we investigated the expression of TSPO and LAT1 in patient glioblastoma (GBM) samples, as well as in various GBM mouse models representing patient GBMs of different genetic subtypes. By immunohistochemistry, we found that TSPO and LAT1 are upregulated in human GBM samples compared to normal brain tissue. Next, we orthotopically implanted patient-derived GBM cells, as well as genetically engineered murine GBM cells, representing different genetic subtypes of the disease. To determine TSPO and LAT1 expression, we performed immunofluorescence staining. We found that both TSPO and LAT1 expression was increased in tumor regions of the implanted human or murine GBM cells when compared to the neighboring mouse brain tissue. While LAT1 was largely restricted to tumor cells, we found that TSPO was also expressed by microglia, tumor-associated macrophages, endothelial cells, and pericytes. The Cancer Genome Atlas (TCGA)-data analysis corroborates the upregulation of TSPO in a bigger cohort of GBM patient samples compared to tumor-free brain tissue. In addition, AIF1 (the gene encoding for the myeloid cell marker Iba1) was also upregulated in GBM compared to the control. Interestingly, TSPO, as well as AIF1, showed significantly different expression levels depending on the GBM genetic subtype, with the highest expression being exhibited in the mesenchymal subtype. High TSPO and AIF1 expression also correlated with a significant decrease in patient survival compared to low expression. In line with this finding, the expression levels for TSPO and AIF1 were also significantly higher in (isocitrate-dehydrogenase wild-type) IDHWT compared to IDH mutant (IDHMUT) GBM. LAT1 expression, on the other hand, was not different among the individual GBM subtypes. Therefore, we could conclude that FET- and TSPO-PET confer different information on pathological features based on different genetic GBM subtypes and may thus help in planning individualized strategies for brain tumor therapy in the future. A combination of TSPO-PET and FET-PET could be a promising way to visualize tumor-associated myeloid cells and select patients for treatment strategies targeting the myeloid compartment.

1. Introduction

Glioblastoma (GBM) represents the majority of primary central nervous system (CNS) neoplasms in adults [1]. The prognosis of GBM is poor and has not been significantly improved in decades due to its high malignancy, immunosuppressive tumor microenvironment, and heterogeneity. Prognostic factors, such as the IDHMUT and MGMT-promotor-methylation status, have been described in the past and allow for individualized treatment [2,3,4,5]. In order to address the inter-individual heterogeneity, molecular criteria were developed to stratify GBM patients into distinct genetic-subgroups (proneural, classical, and mesenchymal) [3,6]. The evolutionary dynamics of GBM, however, can generate intratumoral heterogeneity [7,8]. It is not feasible to characterize this on a genetic level, as it would require repeated extensive biopsies. Therefore, there is an urgent need for a noninvasive way to classify GBM. It was previously established that O-(2-[18F] fluoroethyl)-L-tyrosine-positron emission tomography (FET-PET) provides information on pathology in GBM patients and improves the visualization of GBM cells [9,10,11]. FET uptake is mediated by the amino acid transporter light chain L system (LAT1 and LAT2) [9,10]. The amino acid transporter LAT1 is overexpressed by tumor cells [12]. The exact mechanism of incorporation of 18F-FET into tumor cells is not fully understood. FET becomes internalized by the amino acid transporter, but not incorporated into proteins, and is therefore a pure amino acid transport tracer [13,14] with the ability to provide valuable information about the tumor cell [11]. However, in addition to tumor cells, the tumor microenvironment is composed of immune cells, astrocytes, oligodendrocytes, neurons, endothelial cells, pericytes, and tumor-associated myeloid cells (TAM), which support tumorigenesis and tumor expansion [15,16]. Among them, TAM constitutes up to 30% of the tumor mass [16,17]. Other than FET-PET, mitochondrial translocator protein (TSPO)-PET can visualize not only a tumor mass, but also microglial activation in TAM and potentially additional inflammatory components of GBM [18]. Translocator Protein 18kDa (TSPO) is highly expressed in myeloid cells and tumor cells, while a normal brain shows only a moderate expression. FET-PET has a good specificity for imaging tumors [12]. Therefore, the combination of both methods could provide noninvasive information about the composition of the tumor stroma and infiltrating immune cells. The tracer uptake in GBM patients for TSPO- and FET-PET has been reported to only partially overlap [19]. Some tumor areas are exclusively positive in one of the modalities [19]. Little is known about the underlying expression of TSPO and LAT1 in GBM tumor tissue and associated inflammation in the surrounding area. This study explores TSPO and LAT1 expression in human and murine GBM tissue from different GBM subtypes (Table A1). GBM stem-like cells (GSCs) were derived from human GBM of different genetic subtypes, namely proneural [20,21] and classical [22], and were cultured as spheroids until xenografting them into immunodeficient mouse brains to produce GBM. Mouse transgenic GSCs used to model genetic GBM subtypes were derived from transgenic neural precursor cells that were additionally transduced to carry typical driver mutations for proneural (p53KOPDGFB) or classical (cdkn2aKOEGFRvIII) GBM subtypes [23,24] and were kept under stem cell-like conditions until orthotopic implantation into immunocompetent mice. By the immunostaining of GBM patient samples, patient-derived xenografts, and murine genetic subtype models, we show that TSPO expression is detected in tumor cells, as well as the tumor microenvironment, especially tumor-associated myeloid cells, pericytes, and endothelial cells, while LAT1 seems to be restricted to the tumor cells themselves. We found that the TSPO level differs significantly in the various subtypes, while the LAT1 levels remain the same. In addition, we also investigated the RNA expression level for AIF1, the gene encoding for the myeloid cell marker protein Iba1. This analysis showed that high TSPO levels correlate with high AIF1 levels and increased patient survival. Together, we established mouse GBM models that will allow us to study combined FET/TSPO-PET imaging to increase our understanding of the biological meaning of the patient images obtained and to unleash its prognostic potential.

2. Results

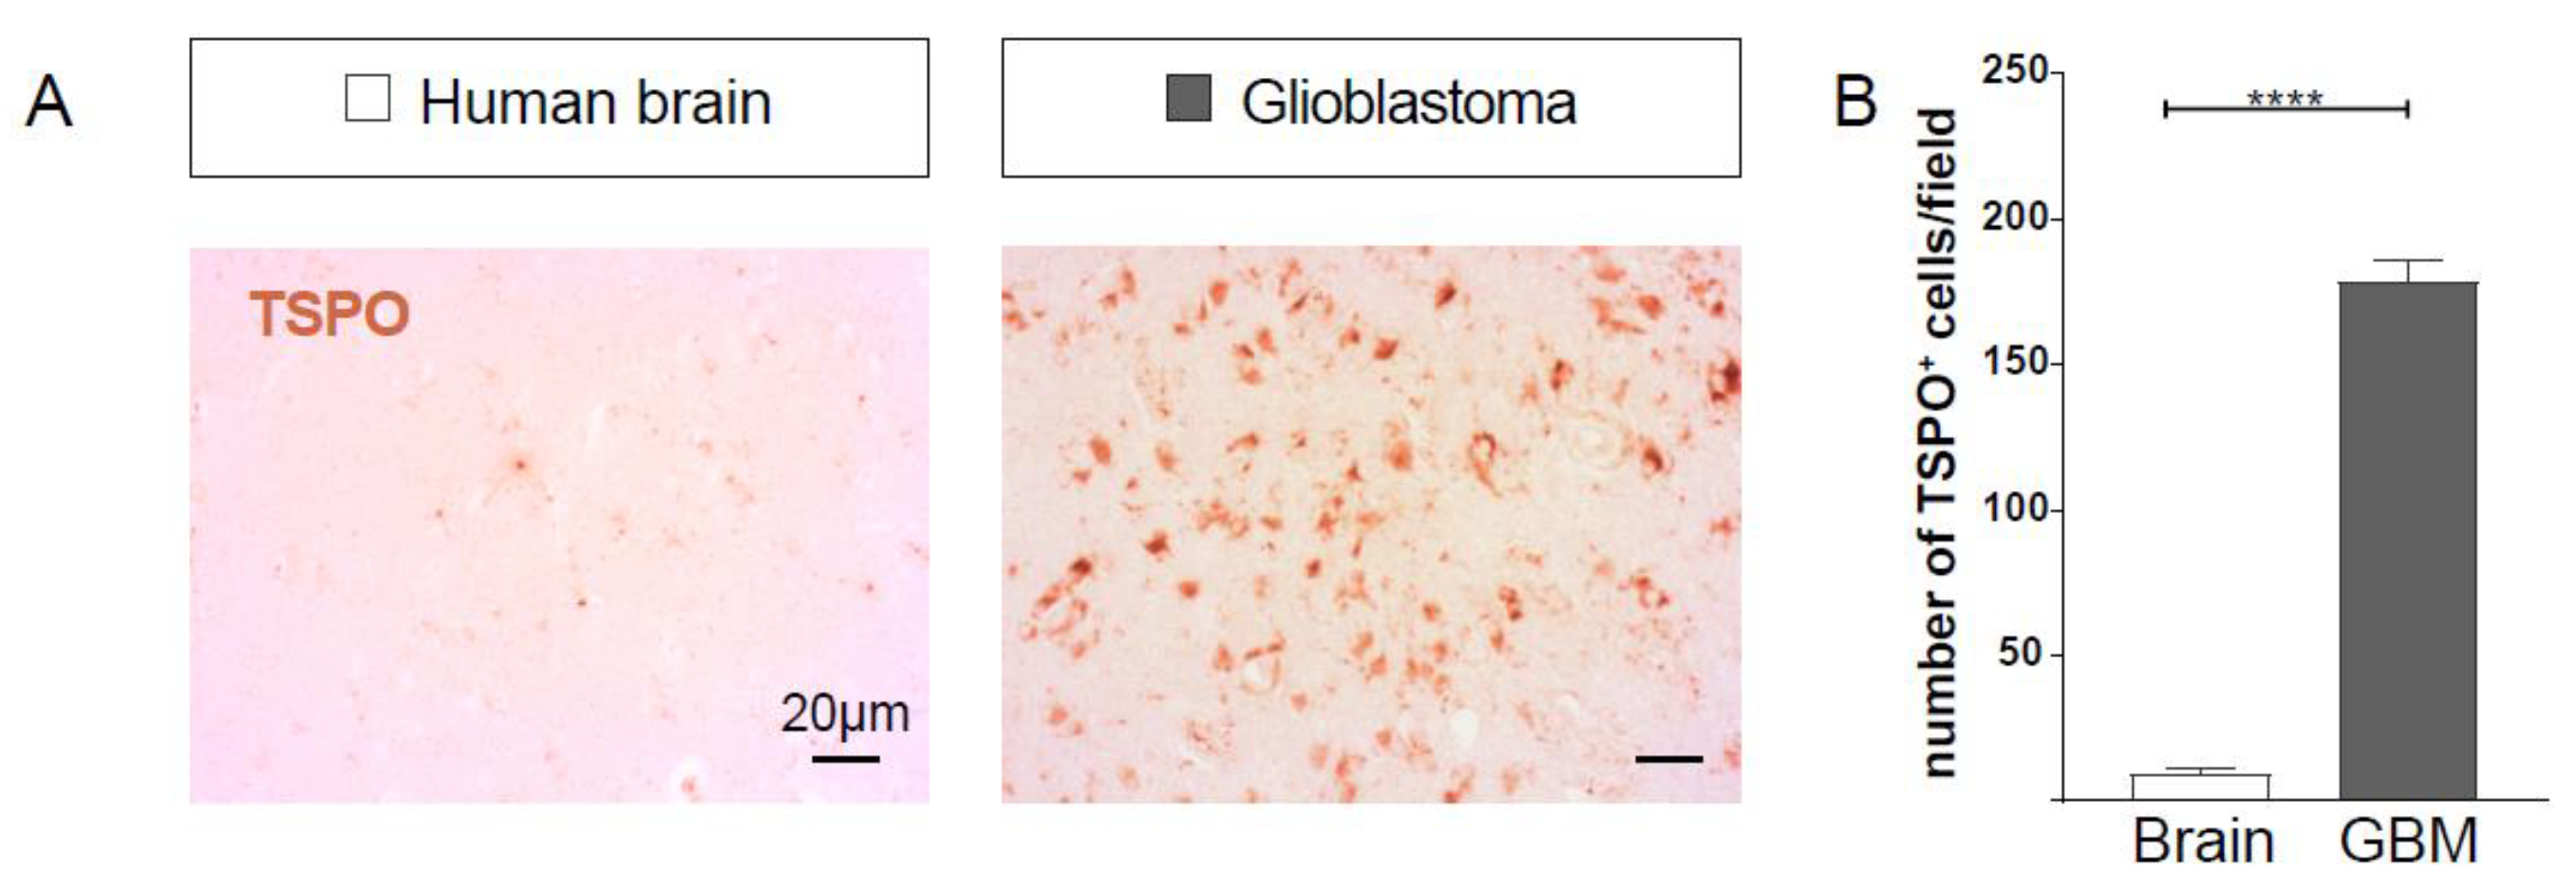
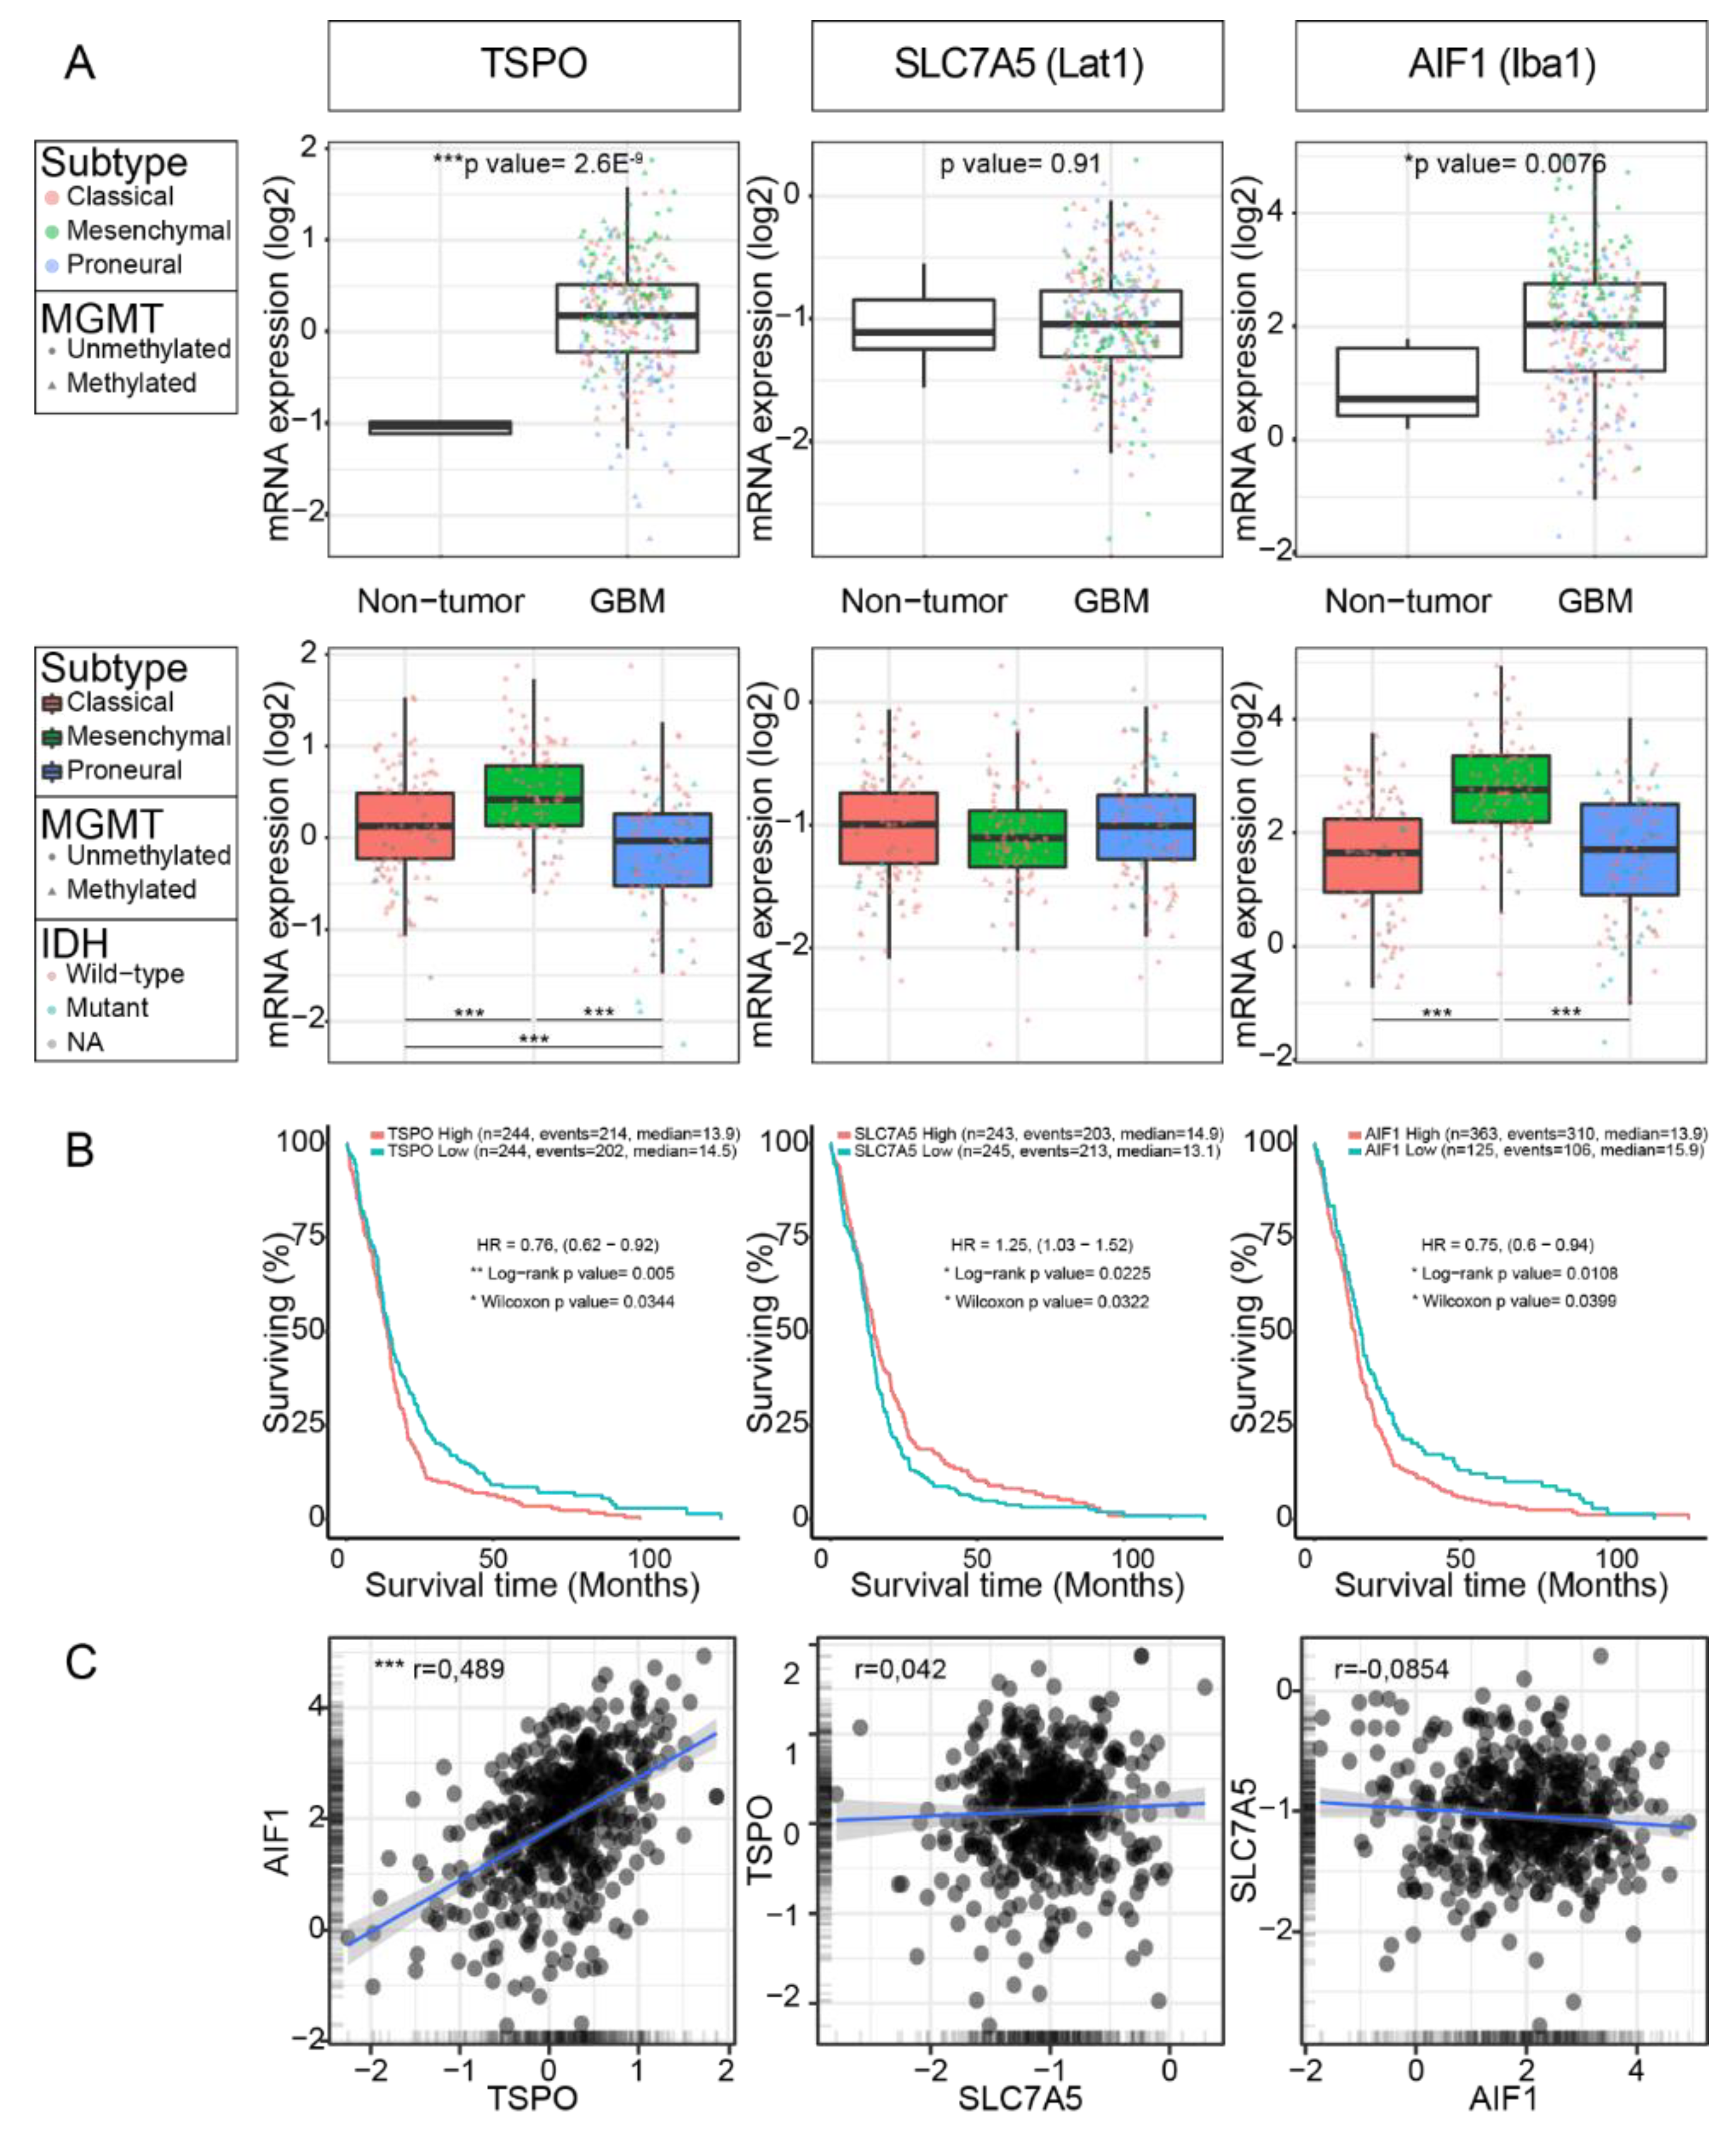
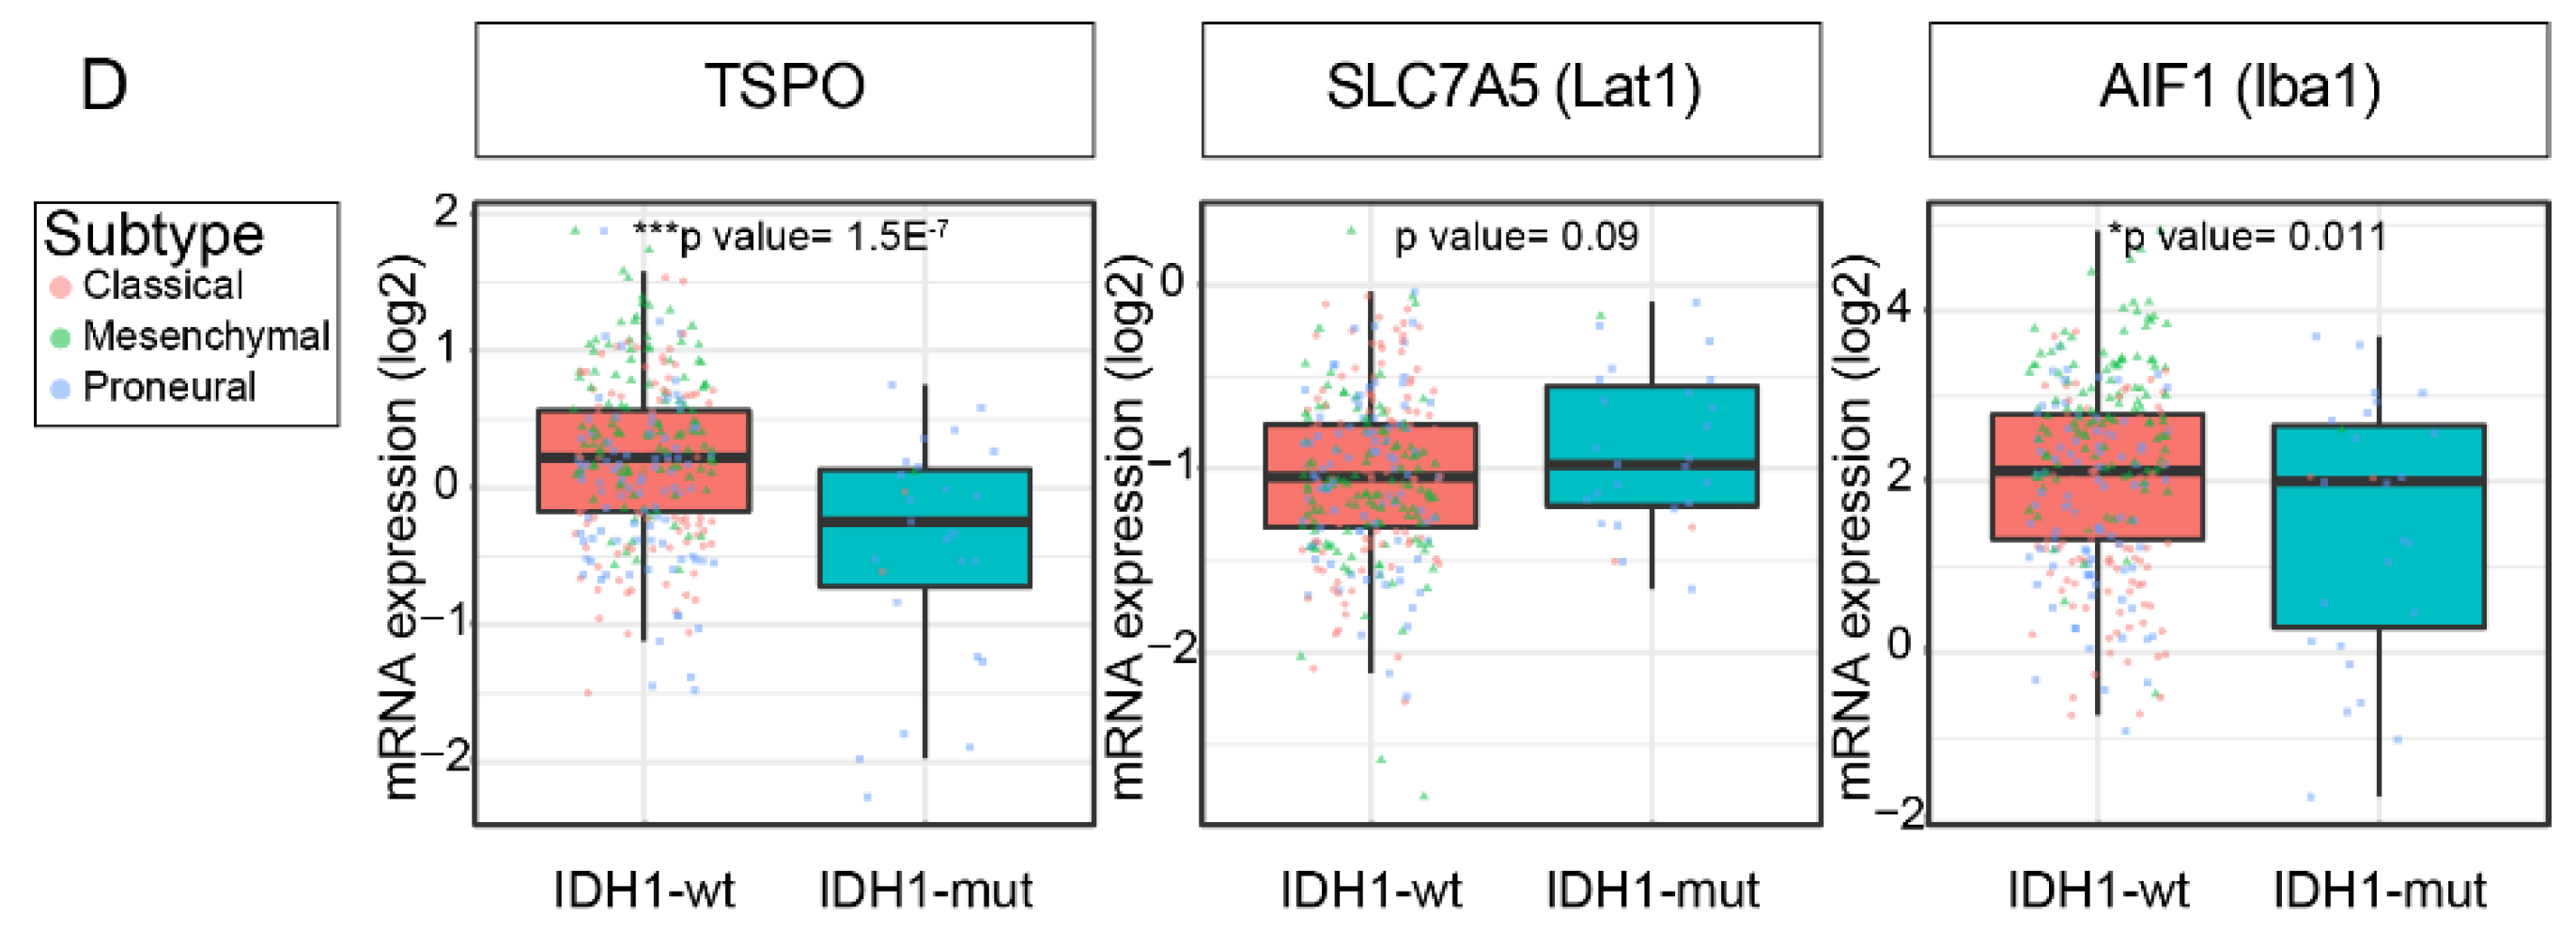
2.1. TSPO Expression is Upregulated in GBM

To investigate the specificity of TSPO for tumor tissue, we first analyzed patient GBM samples and compared them to those from a normal human brain. We found that in tumor-free brain tissue from epilepsy patients, few cells expressed TSPO (Figure 1A). However, the number of TSPO-positive cells largely increased in GBM tumor tissue (as seen in Figure 1A and quantified in Figure 1B).
To investigate the expression in different GBM subtypes, we next used a panel of GBM cultures from human biopsies, which were maintained under stem-like conditions and thus preserved features of GBM stem-like cells (GSCs). The respective GBM subtype of the paternal GBM biopsies was previously determined (Table A1) [20,21,22].
The implantation of these human GSCs produced patient-derived xenografts (PDX) with a high expression of TSPO in the tumor area (Figure 2A) for the classical human GBM (GBM2), as well as for the proneural human GBM (GBM14 and NCH644). In the tumor, border dispersed cells strongly positive for TSPO were visible (Figure 2A, arrows in the tumor border), likely showing invading cells and macrophages, while in the tumor-free regions, these expression patterns were weaker (Figure 2A, arrows in tumor-free areas). Next, we used a panel of genetically engineered mouse GBM cells that faithfully recapitulate the key pathological features for each GBM subtype (Table A1) [24]. By immunofluorescent staining against TSPO, the distinction between tumor-free brain and tumor samples became obvious when using murine Gl261, as well as the classical cdkn2aKOEGFRvIII or proneural 53KOPDGFB GSCs (Figure 2B). In addition, in the murine GBM models, evenly dispersed TSPO-positive cells could be observed in tumor border and tumor-free areas (Figure 2B, arrows).

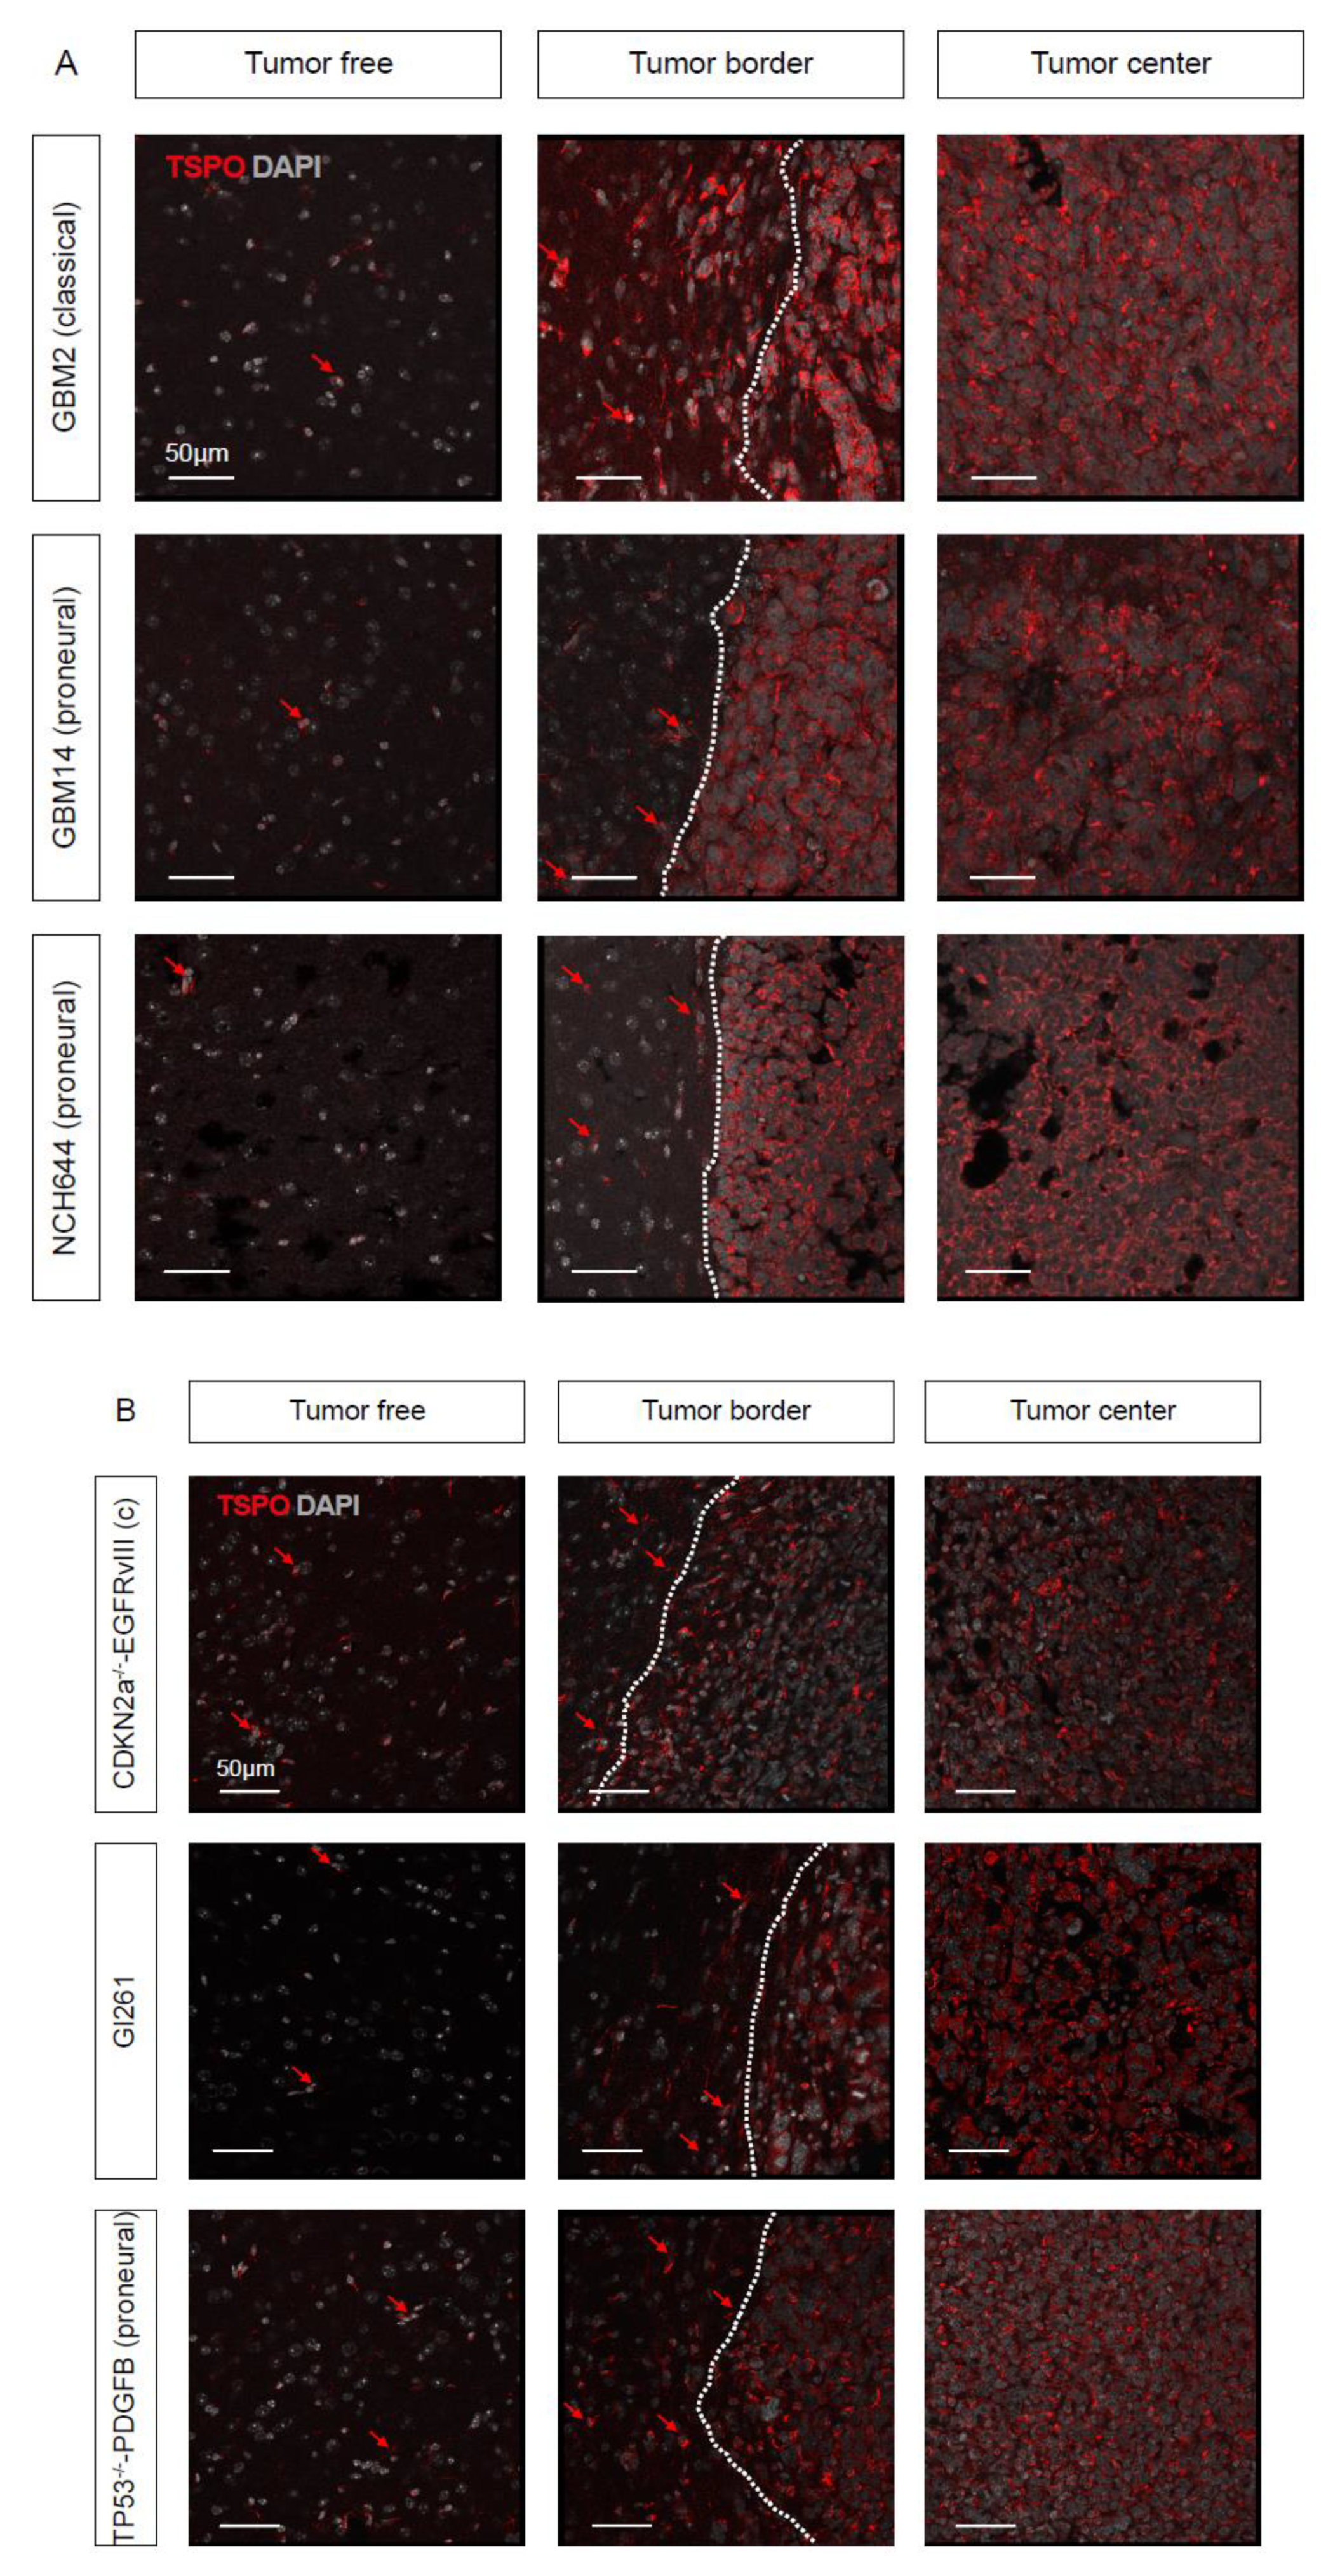
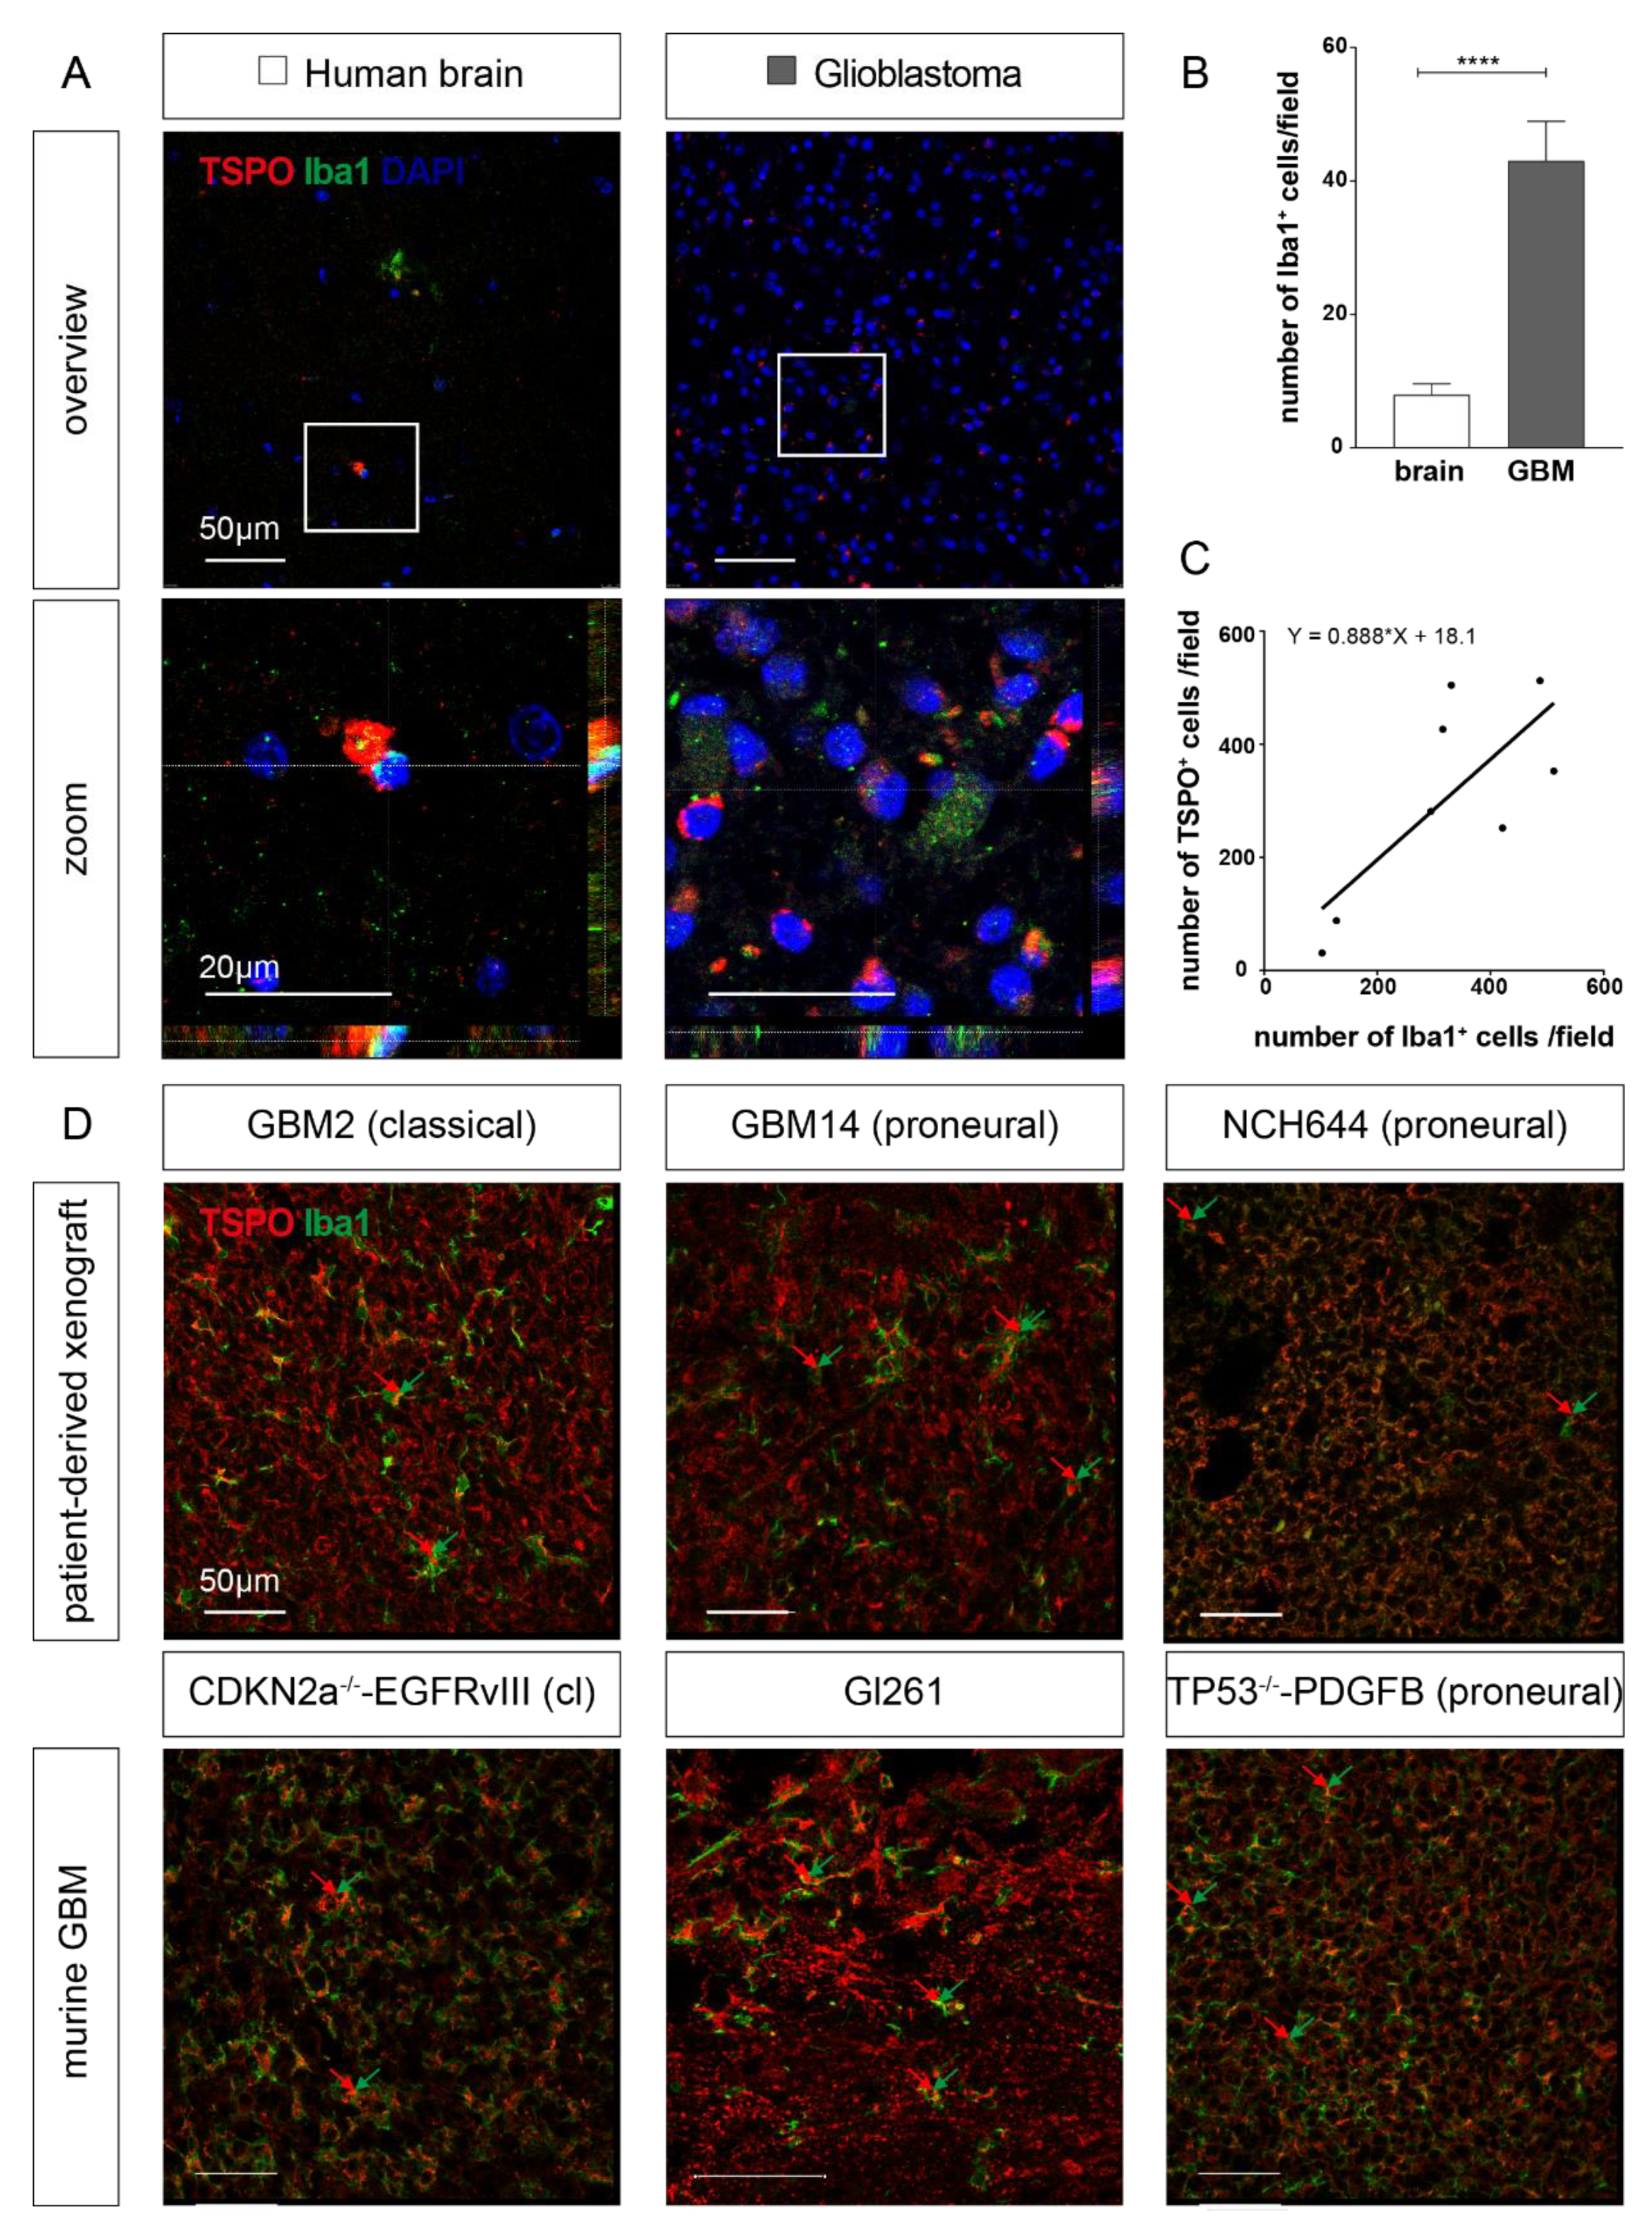
2.2. TSPO is Expressed in Parenchymal Cells of GBM

To further investigate the identity of the cells expressing TSPO in the tumor microenvironment, we performed immunofluorescent co-staining against CD31 and PDGFRB. Interestingly, we found TSPO expression in CD31-positive endothelial cells, as well as in PDGFRB-positive pericytes attached to the newly forming vasculature within the tumor region (Figure 3A). Using the transgenic pericyte-reporter strain PDGFRB::CreERT2,R26-tdTomato [25,26], we confirmed the TSPO positivity of tdTomato-expressing pericytes (Figure 3B). Next, we also tested whether TSPO is expressed in Iba1-positive microglia and macrophages in our GBM mouse models (Figure 3C). Indeed, we found, by immunofluorescent staining, that TSPO was expressed in tumor-associated myeloid cells marked by Iba1 expression. Again, we confirmed this finding by using transgenic mice expressing a green fluorescent protein (GFP) reporter under the fractalkine receptor (CX3CR1) promotor [27,28]. Moreover, in the CX3CR1-GFP mouse, we found that microglia within the tumor expressed TSPO (Figure 3D). Next, we tested whether TSPO can also be detected in myeloid cells of patient GBM samples, as well as in the different murine and human GBM models of the various genetic subtypes. In patient GBM samples, the numbers of Iba1-positive cells were significantly higher in the tumor area compared to the tumor-free brain, as quantified on the immunohistological micrographs (Figure 4A,B). In addition, we performed an immunohistochemical analysis of GBM patient samples and counted the cell numbers for TSPO- and Iba1-expressing cells in consecutive sections. Concordantly, Figure 4C shows a strong correlation of Iba1-positive and TSPO-positive cells among human GBM. Co-staining with Iba1- and TSPO-antibodies showed that TSPO was also expressed in Iba1-positive microglia/macrophages in the tumor (Figure 4A). In the patient-derived xenografts (PDX) and murine GBMs of different genetic subtypes, a high expression of TSPO in Iba1-positive tumor-associated cells could be found (Figure 4D, arrows).
In summary, we found that TSPO expression is increased in patient GBM samples compared to normal brain tissue. The expression of TSPO can be detected in tumor cells of different experimental mouse models, as well as in tumor parenchymal cells, such as endothelial cells and pericytes of the tumor neo-vasculature, and tumor-associated myeloid cells, independent of the GBM genetic subtype.

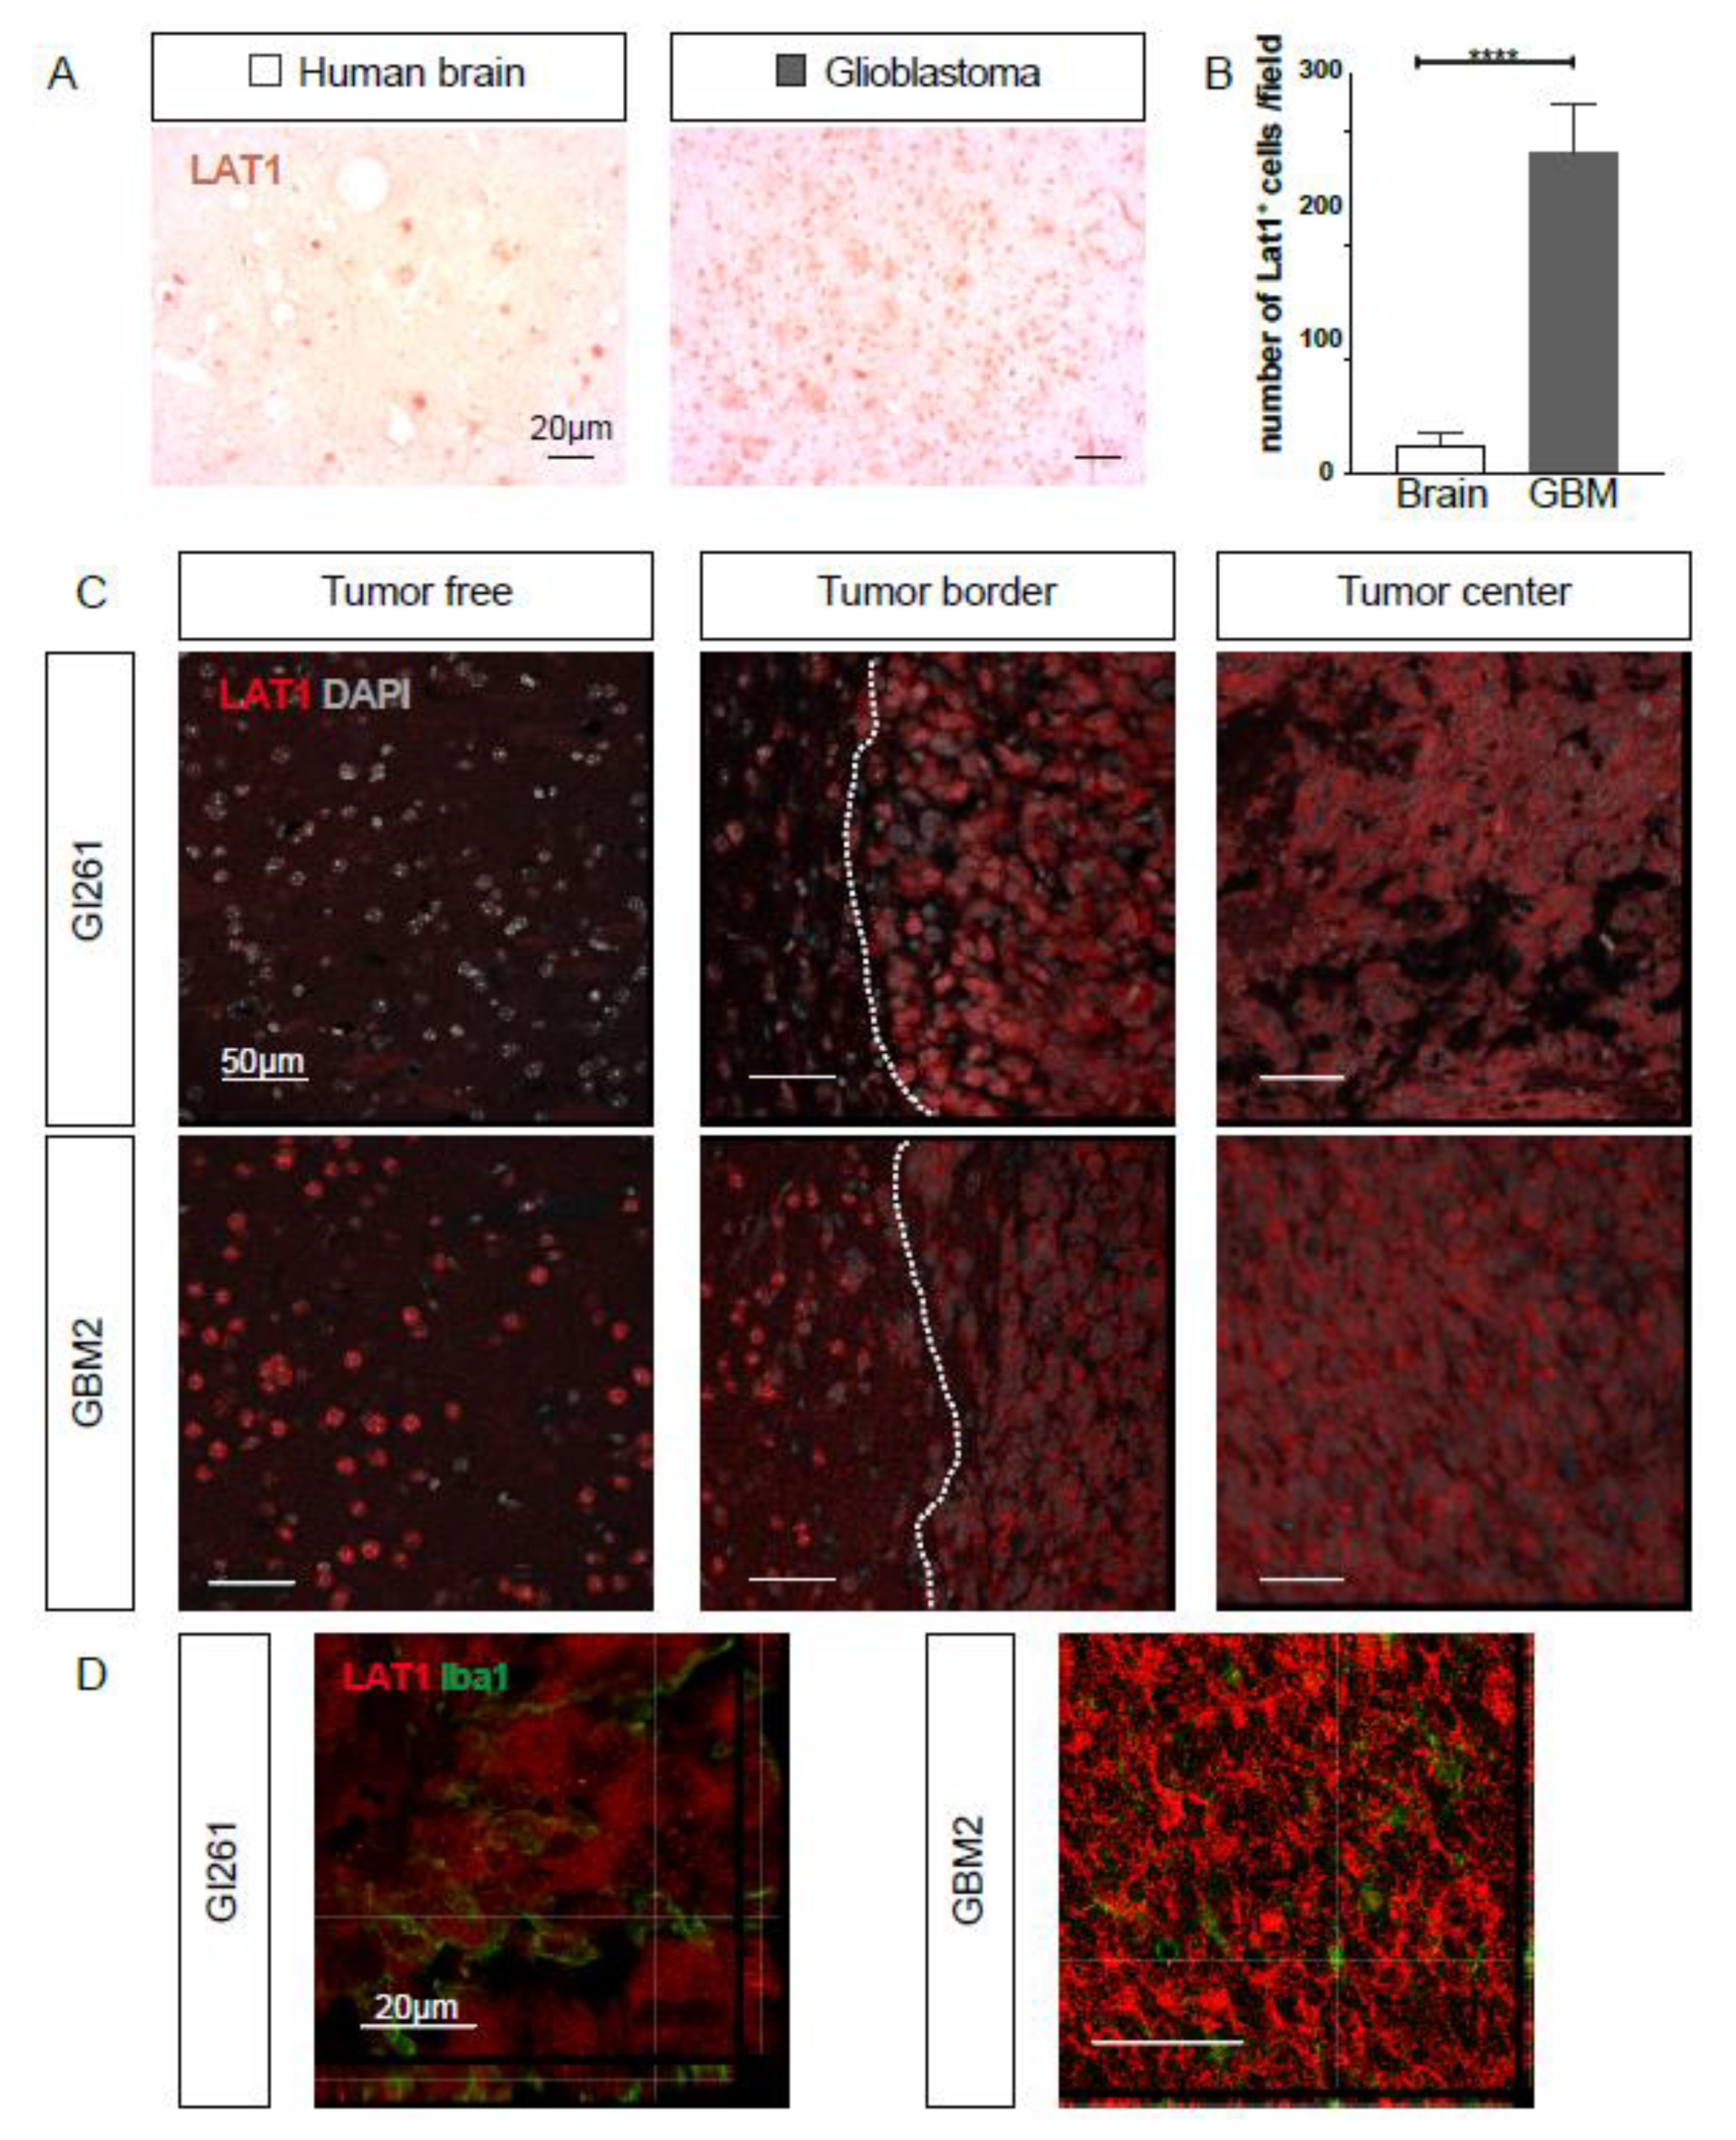
2.3. LAT1 Expression is Upregulated in GBM

To be able to correlate the expression pattern of TSPO with the most commonly used target for radiolabeled FET tracer for GBM, we next performed an immunohistological analysis for LAT1 (SLC7A5). We found that LAT1 is expressed in tumor-free human brain tissue (Figure 5A); however, the number of LAT1-positive cells is highly increased in human GBM tissue (Figure 5A quantified in Figure 5B). In orthotopically implanted murine Gl261 tumors and human GBM2 xenografts, a high expression of LAT1 could also be detected in the tumor cells, while only moderate staining outside the tumor area was visible (Figure 5C). Immunofluorescent co-staining of Iba1- and LAT1-protein in murine and human GBMs did not indicate the co-expression of LAT1 in Iba1-positive myeloid cells within the tumor area (Figure 5D).

2.4. TSPO and LAT1 Expression do not Correlate in a Big Cohort of GBM Patient Samples

The TCGA glioblastoma dataset was analysed for the expression of TSPO and SLC7A5 (=LAT1), encoding for the molecular targets of TSPO- and FET-PET, and for AIF1, as we found a high TSPO level in microglia and macrophages. By conducting this analysis, we found a significant increase in the gene expression of TSPO and AIF1 in GBM compared to that of healthy brain tissue (Figure 6A). Within the GBM subtypes (as defined by Wang et al. [6]), significant differences in the expression of TSPO and AIF1 genes could be found (Figure 6A). Interestingly, Lat1 expression over the many GBMs in the TCGA dataset was not significantly changed compared to that of the non-tumor area (Figure 6A) and no variation in expression could be detected in the different genetic subtypes. Looking at patient survival, we found that high TSPO or AIF1 expression was associated with significantly shorter survival, while high SLC7A5 (=LAT1) levels were correlated with an increased survival (Figure 6B). Based on this finding, we analysed an additional GBM cohort consisting of 12 patient samples by immunohistochemistry for TSPO- or Iba1-positive cells and quantified numbers (Supplementary Figure S1A,B). In line with the TCGA data, we found that patients with a shorter survival (less than 2 years) showed a higher number of TSPO- or Iba1-positive cells. Next, we also performed a correlation analysis of the expression levels of the three genes TSPO, SLC7A5, and AIF1 in the TCGA GBM dataset and identified a significant positive correlation between TSPO and AIF1 (Figure 6C). When performing the same analysis by different genetic subtypes, this positive correlation was also significant (data not shown). Finally, we also investigated the levels of TSPO and AIF1 expression in GBMs in the TCGA dataset that were IDH WT or IDHMUT (Figure 6D). Interestingly, we found that the IDHWT GBMs also showed significantly higher expression levels in TSPO and AIF1.

3. Discussion

In this study, we performed an expression analysis of TSPO and LAT1—the target structures of molecular imaging modalities—in patient GBM samples, as well as in orthotopic GBM mouse models, from patient-derived and murine transgenic GBM cells, modeling the different GBM genetic subtypes. TSPO has been shown to be a robust and sensitive biomarker for microglial activation in neurodegenerative conditions [30] and increased TSPO levels in PET were found in the progression of mild cognitive impairment and Alzheimer’s disease [31,32]. In human addiction studies of methamphetamine use, an increased TSPO-PET signal was found and correlated with TSPO upregulation in reactive glial cells and activated microglia [33]. Additionally, in almost all types of CNS pathologies, TSPO levels are increased, and in some psychiatric disorders, such as schizophrenia, the TSPO signal in PET is decreased [34]. Although TSPO ligands are widely used in molecular imaging in all sorts of CNS pathologies, little is known about the role of TSPO expression and neuroinflammation in glioblastoma patients and PET imaging with TSPO radioligands is not yet standard for the imaging of brain tumor patients [18,19,35,36,37]. In this study, we could show that the expression of TSPO is higher in brain tumor samples compared to those from epilepsy patients. In patient-derived xenograft and transgenic murine GBM models, TSPO is strongly upregulated in the tumor area compared to normal brain regions. The highest TSPO intensity was observed in the tumor cells themselves in several human and murine GBM models. Interestingly, TSPO was found to be expressed in Nestin-positive neural stem/progenitor cells in the subventricular zone and at the base of the rostral migratory stream in mice [38]. TSPO expression also co-localizes at low levels with glial fibrillary acidic protein (GFAP) in neural stem/progenitor cells in the subventricular zone, confirming the presence of TSPO in neural stem/progenitor cells [38]. As neural stem/progenitor cells are the putative source of GBM cells, this may be one reason why our patient-derived GBM cells and murine transgenic GBM cells (derived from NPCs) uniformly express TSPO. TSPO expression per se may not be a discriminating criterion, but high TSPO expression may be informative.
However, not only tumor cells express TSPO; microglia/macrophages, endothelial cells, and pericytes were also strongly positive for TSPO in the tumor regions of our GBM models. This finding is in line with previous studies that detected the expression of TSPO in vascular structures of a normal brain [38]. TSPO ligands bind in larger blood vessel walls [39] and the co-localization of TSPO with PDGFRB-positive pericytes and smooth muscle cells was observed [38,40]. The association with CD31-positive endothelial cells was also previously observed in vessels of different sizes down to capillaries [38]. TSPO-positive vasculature was present in brains, regardless of disease, suggesting that endothelial TSPO might be constitutive [40]. This observation is important because it relates to the binding and distribution of TSPO ligands in the brain parenchyma [40]. In our study, the highest TSPO levels were seen in the parenchymal cells in the tumor regions, indicating an upregulation of TSPO in the tumor neo-vasculature and tumor-associated myeloid cells.
Besides the representation of GBM-patient heterogeneity by genetic subtypes, our novel murine GBM models provide the advantage that immunocompetent mice can be inoculated, in contrast to T-cell deficient mice used for patient-derived GBM cells (24). Although GBM are notoriously low in immunogenicity, this difference could impact TSPO expression levels and is worth studying in the future. For example, our models can be employed to investigate the effect that an immune therapy treatment might have on TSPO-PET imaging.
Studies have also described that TSPO was not detectable in oligodendrocytes stained by anti-MBP-antibody or CD11b-positive microglia of a healthy brain [38,41]. Increased TSPO expression, however, was detected in a pro-inflammatory brain environment [42]. For example, in acute multiple sclerosis (MS), the majority of TSPO-positive cells were macrophages and microglia. Additionally, in Alzheimer’s Disease (AD), most TSPO-positive cells were also Iba1-positive [40]. In HIV encephalitis, many TSPO-positive cells were co-stained with CD68, a macrophage-lineage marker [40]. High TSPO expression in astrocytoma has been shown to correlate with shorter survival and higher proliferation [43]. In astrocytoma, TSPO is expressed in Iba1+ cells, but not GFAP+ astrocytes [44], while reactive astrocytes can contribute to the signal, in addition to reactive microglia [41]. In chronic silent MS lesions, reactive astrocytes can also express TSPO [40]. In this study, we show (after the quantification of immunohistochemical data) a strong correlation between the expression of TSPO and Iba1 in a small patient cohort. These findings are in line with our conclusion from the analysis of the TCGA GBM dataset. Most interestingly, high expressions of both molecules emerged as unfavourable prognostic markers. As IDHWT GBM tumors have a less favourable prognosis than IDHMUT GBM, we interrogated the TCGA GBM dataset for the expression levels of our markers in IDHWT against IDHMUT GBM. TSPO and AIF1 expression levels were significantly increased in IDHWT compared to IDHMUT GBM.
Immunostaining for LAT1 produced a less intense and more punctate staining pattern compared to immunofluorescence for TSPO. The expression of LAT1 protein was higher in GBM than in healthy brain tissue, although gene expression in TCGA data was not altered. The highest LAT1 intensity was observed in the tumor cells themselves in the various human and murine GBM models studied here. It has previously been shown that LAT1 is expressed in tumor cells and in proximity to the vascular endothelium [45,46]. LAT1 mRNA and protein expression varies in GBM [47] and the expression of LAT1 was reported to be higher in infiltrating glioma cells than in cells located in the tumor center [46]. A strong positive correlation between LAT1 and Ki67 [48] and a correlation between high LAT1 protein expression with poor survival were demonstrated [49]. This contrasts with our analysis of the TCGA dataset, which showed a favorable outcome for high LAT1 mRNA expression. Even though the prognostic value of LAT1 is not conclusive, the fact that FET concentrates in malignant cells, possibly due to asymmetrical recognition by the LAT1 transporter [12], has made it a valuable target for clinical PET imaging [11].
While LAT1 is mainly expressed in tumor cells, we and others have found that TSPO is expressed not only by tumor cells, but additionally in microglia/macrophages, endothelial cells, and pericytes of the tumor microenvironment. Therefore, the combination of FET-PET and TSPO-PET might be a promising way to visualize not only the tumor, but also the reactive tumor microenvironment, such as the tumor-infiltrating myeloid cells and the tumor neo-vasculature. Additionally, the TSPO level might show prognostic relevance, specifically in IDHWT GBM. For that group of patients, our results would propose that a high expression of TSPO could be a marker for decreased survival. Further studies using the novel GBM models described here, in combination with a prospective GBM patient cohort, will allow the interpretation of molecular imaging data to be improved and different PET-signals with pathological features of individual tumors and the inter-patient and intratumoral GBM heterogeneity to be related.

4. Materials and Methods

4.1. Cell Culture

GSCs were derived from human glioblastoma biopsies, as previously described for NCH644 [20] and GBM14 [21]. Murine transgenic cdkn2aKOEGFRvIII and p53KOPDGFB GBM cells were previously generated [24]. All cells were cultured as spheroids in DMEM-F12 (Cat. 11320-074, ThermoFisher Scientific, Waltham, MA, USA) supplemented with 1× B27 (Cat. 17504-044, ThermoFisher Scientific, Waltham, MA, USA), 1% penicillin-streptomycin (Cat. 151140-122, ThermoFisher Scientific, Waltham, MA, USA), 10 ng/mL epidermal growth factor (EGF; Cat. 236-EG; Biotechne; Minneapolis, MN, USA), and 10 ng/mL fibroblast growth factor (FGF; Cat. 100-18B PeproTech, Hamburg, Germany). Murine Gl261 glioma cells were obtained from the National Cancer Institute, NCI-Frederick (Tumor Cell Repository), and maintained under adherent conditions in DMEM containing 1× MEM non-essential amino acids (Cat. 11140-035, ThermoFisher Scientific, Waltham, MA, USA), 1% penicillin-streptomycin, and 10% fetal bovine serum (Cat. 102270-106, ThermoFisher Scientific, Waltham, MA, USA). Human GBM2 GSCs were cultured as spheroids with Neurocult Basal Medium (Cat. #05700, StemCell, Grenoble, France) with 10% Neurocult Proliferation Supplement (Cat. #05701, StemCell, Grenoble, France), 1% penicillin-streptomycin, 10ng/mL hFGP, and 10ng/mL hEGF [22]. All cells were maintained at 37 °C in a humidified atmosphere of 95% O2 and 5% CO2. GSCs were validated repeatedly by short tandem repeat (STR) fingerprinting (Eurofins Medignomix Forensik, Munich, Germany) and were regularly tested for mycoplasma contamination by PCR.

4.2. Animal Experiments

All experiments were conducted in accordance with the National Guidelines for Animal Protection Germany, with approval of the local animal care committee of the Government of Oberbayern (projects 55.2-2532-2012/2018). Pericyte reporter mice PDGFRB::CreERT2,R26-tdTomato were created by cross breeding B6.cg_Tg(pdgfb-cre/ERT2)6096Rha/J mice [50] expressing a fusion protein of cre-recombinase and a modified estrogen-receptor (cre-ER2) under the PDGFRB promotor with a cre-reporter line (B6.Cg-Gt(ROSA)26Sortm9(CAG-tdTomato)Hze/J) [26]. Mice containing a knock-in of green fluorescent protein (GFP) in the gene (CX3CR1) encoding for the fractalkine receptor (B6.129P2(Cg)-Cx3cr1tm1Litt/J) [27] were used to label the myeloid cells in the brain. All mice were purchased from the Jackson Laboratory, bred on C57Bl/6J background, and genotyping was performed as previously described. Immunodeficient Foxn1nu/nu or B6.129S6-Rag2tm1Fwa mice were used for the xenografting of human GBM cells, as described previously [24]. Animals were kept in suitable cages with ad libitum access to water and food in a 12-h light/dark cycle at the standardized animal house of the Walter Brendel Centre for Experimental Medicine, LMU Munich. Mice were sacrificed at defined presymptomatic time points.

4.3. Tumor Inoculation

Mice received i.p. 7 µL/g body weight of a mixture of 0.1% xylazine (Rompun 2%; Bayer, Leverkusen, Germany) and 1.5% ketamine (Ketavet; Zoetis, Berlin, Germany) in 0.9% NaCl. Their corneas were covered with a moisturizing cream (Bepanthen; Bayer). After disinfection with 10% potassium iodide solution, a midline incision was made in the skin of the skull with a scalpel. Mice were immobilized on a stereotactic frame (David Kopf Instruments, Tujunga, CA, USA). After drilling a hole into the skull with a 23G needle tip at the puncture point 1.5 mm anterior and 1.5 mm right of the bregma, 1 μL PBS or GBM cells (1 × 10⁵ Gl261 or human GBM cells/µL and 5 × 10⁴ murine GBM cells/µL) was slowly injected into the mouse brain at a 3 mm depth within 2 min using a 22G Hamilton syringe (Hamilton, Bonaduz, Switzerland). Afterwards, the syringe was removed in 1 mm steps per minute and the skin was sutured. Tumors were grown for 3 weeks for murine cells and for up to 6 weeks for human GBM cells, as previously reported [24].

4.4. Mouse Brain Tissue Preparation

Mice were transcardially perfused with 1 x PBS followed be 4% PFA solution under anesthesia. The mouse brain was collected and fixed in 4% for 24 h at 4 °C and was then dehydrated in 30% sucrose for ≥24 h at 4 °C. Next, the brain was embedded in Cryomatrix® (Cat. 6769006; ThermoFisher Scientific) and gently frozen in isopentane to −80 °C. Tissue samples were prepared as horizontal sections (40-μm-thick) using a horizontal sliding microtome. Floating sections were stored at −20 °C in cryoprotectant (ethylene glycol, glycerol, and 0.1 M PO4 buffer in a 1:1:2 solution at pH 7.4) protected from light.

4.5. Fluorescent Immunohistochemistry and Confocal Microscopy

Floating sections were washed three times for 5 min with PBST (0.1% Tween-20 in PBS), and the endogenous peroxidase was blocked with Dako endogenous enzyme block (Dako S2003) for 10 min at room temperature, washed with PBST three times, and blocked for 1 h at room temperature in 5% normal donkey serum (NDS; Cat. 017-000-121; Jackson Immuno-Research, Westgrove, PA, USA) and 0.3% Triton-X (Cat. 93418; Fluka) in PBS or Protein Blocking Reagent (Cat. X0909, Dako, Agilent Technologies, Santa Clara, CA, USA). The sections were then incubated overnight at 4 °C with the primary antibodies (Table A2) diluted in Dako antibody diluent (Cat. S3002, Dako, Agilent Technologies, Santa Clara, CA, USA). The next day, after washing the sections, they were incubated for 2 h at room temperature with the secondary antibodies (Table A2) diluted in Dako antibody diluent. After washing sections, they were incubated with fluorophore coupled streptavidin (Table A2) for 2 h at room temperature. Nuclei were stained with 2 µg/mL DAPI (Cat. 32670; Fluka). Finally, sections were mounted on glass slides (SuperfrostTM Plus, R. Langenbrinck GmbH, Emmendingen, Germany) and air dried for 10 min. Tissue was mounted in Fluorescent Mounting Medium (Cat. S3023; Dako) and covered (high-precision microscope cover glasses No1.5H, Schott, Germany). Confocal microscopy was performed at the bioimaging core facility of the Biomedical Center (LMU Munich) with a Leica SP8X WLL microscope, equipped with a 405 nm laser, WLL2 laser (470–670 nm), and acusto-optical beam splitter. Images were acquired with a 63 × 1.4 objective for the visualization of single cells and subcellular structures, and the image pixel size was 80 nm. Conversely, they were acquired with a 40 × 1.3 objective for the visualization of changes at the tumor border, and the image pixel size was 80 nm. The following fluorescence settings were used: DAPI (excitation 405; emission 410–470), GFP (489; 492–550), Cy3 (558; 560–600), and Cy5 (650; 652–700). Recording was sequentially conducted to avoid bleed-through. For each experiment, imaging was administrated with appropriate settings based on the standardized negative and positive groups. Images were processed with Leica Application Suite X (LAS X) Version 3.4.1 (Leica Microsystems, Wetzlar, Germany) and Fiji [51].

4.6. Immunohistochemistry of Human Specimens

HOPE-embedded human tissue was obtained from the Neurosurgery Department of the University Hospital, LMU Munich (project 18-304), cut into 15 µm thick slices, and mounted on slides. Deparaffinization and rehydration were performed with Roti-Histol (Carl Roth, Germany) and graded alcohol, fixation in acetone at −20 °C for 10 min, and cooking at 100 °C in Citrate Buffer (1.8 mM Citric acid, and 8.2 mM tri-Natriumcitrate-Dihydrate, adjusted to PH 6.0 with 2 mM NaOH) for 20 min. Endogenous peroxidase was blocked with the Dako endogenous enzyme block (Dako S2003) for 10 min at room temperature. Incubation with the primary antibody was performed as described above. The next day, after three washes in PBS to remove unbound antibodies, the sections were incubated with secondary biotin donkey anti-rabbit, anti-rat, or anti-mouse antibodies (Table A2) for 3 h and then for 1 h at room temperature with streptavidin-conjugated horseradish peroxidase (1:200, Cat. SA25 5004, Vector Laboratories). After being washed in PBS, the sections were stained with DAB substrate, according to the manufacturer’s instructions (Cat. DC137C100DCS, Innovative Diagnostik-Systeme, Hamburg, Germany). The slides were then rinsed with tap water, dehydrated with a graded series of ethanol (70%, 80%, 96%, and 100%), cleared two times with xylene, and covered with Roti® Histokit II mounting medium (Cat. 6640.1, Carl Roth GmbH, Karlsruhe, Germany). A Breukoven BMS D1-223A light microscope was used for inspecting and taking images after IHC staining. Cell numbers were counted under a 20X objective lens with the light microscope or ImageJ/Fiji, and Java-based open source software was used for automated cell counting. This software provides efficient and customizable quantification methods for microscopy images [52].

4.7. GlioVis Analysis

Data from The Cancer Genome Atlas (TCGA) Project was analyzed using GlioVis (http://gliovis.bioinfo.cnio.es/), a web application for data visualization and analysis, to explore previously published brain tumor gene expression datasets [29]. We only included adult patients from the TCGA-GBM dataset whose tumors had Agilent-4502A RNA expression data for our genes of interest available. Tukey’s Honest Significant Difference (HSD) test was performed. P-values of the pairwise comparisons are indicated as *** p < 0.001; ** p < 0.01; * p < 0.05; and ns, not significant.

4.8. Statistical Analysis

GraphPad PRISM 5 was used for all statistical analysis of immunohistochemistry. The number of individuals, replicates, and or repetitions of independent experiments are indicated in the text of figures. When comparing two groups, values are reported as the mean ± SD and an unpaired, non-parametric Student’s t test was used to determine statistical significance. Statistical significance was assumed if p < 0.05; P-values are indicated in figures as *** p < 0.001; ** p < 0.01; * p < 0.05; and N.S.: no significance.

Supplementary Materials

Supplementary materials can be found at https://0-www-mdpi-com.brum.beds.ac.uk/1422-0067/21/2/612/s1.

Author Contributions

Conceptualization, R.G. and R.E.K.; formal analysis, L.C., S.V.K., M.L., R.G. and R.E.K.; funding acquisition, S.V.K., J.-C.T., R.G. and R.E.K.; investigation, L.C., S.V.K., D.Z., M.L., R.G. and R.E.K.; methodology, L.C., S.V.K., D.Z., M.L., R.G. and R.E.K.; project administration, R.G. and R.E.K.; resources, J.-C.T. and R.G.; supervision, R.G. and R.E.K.; validation, L.C., S.V.K., M.L., R.G. and R.E.K.; visualization, L.C. and S.V.K.; writing—original draft, S.V.K.; writing—review and editing, L.C., S.V.K., J.-C.T., R.G. and R.E.K. All authors have read and agreed to the published version of the manuscript.

Funding

This research was funded by the DFG (GL691/2; SFB824), the “Wilhelm Sander-Stiftung“, the “Anni-Hofmann Stiftung“, the “Verein zur Förderung von Wissenschaft und Forschung an der Medizinischen Fakultät der LMU München“ (WiFoMed), the Curt Bohnewandt Fonds, the “Friedrich-Baur-Stiftung“, and the “Familie Mehdorn Stiftung“. L.C. and M.L. were supported by a China Scholarship Council (CSC) graduate scholarship.

Acknowledgments

We would like to thank Stefanie Lange for the great technical support throughout the experiments and PD Steffen Dietzel and Andreas Thomae (Core Facility Bioimaging, Biomedical Center, LMU München) for the expert assistance in confocal microscopy. The results shown here are are partly based upon data generated by the TCGA Research Network: https://www.cancer.gov/tcga.

Conflicts of Interest

The authors declare no conflicts of interest.

Abbreviations

AIF1Allograft inflammatory factor-1 (also known as Iba1)
CX3CR1C-X3-C Motif Chemokine Receptor 1 (also known as fractalkine receptor)
GBMGlioblastoma
GSCGlioblastoma stem-like cell
IHCImmunohistochemistry
Iba1Ionized calcium-binding adapter molecule 1 (encoded by the gene AIF1)
LAS XLeica Application Suite X
LAT1Amino acid transporter light chain L system (encoded by the gene SLC7A5)
PBRPeripheral benzodiazepine receptor (encoded by the gene TSPO)
PDGFRBPlatelet-derived growth factor receptor beta
PETPositron emission tomography
SLC7A5Solute carrier family 7 member 5 (also known as LAT1)
TAMTumor-associated myeloid cell
TCGAThe Cancer Genome Atlas
TSPOTranslocator protein of 18 kDa (also known as PBR)

Appendix A

Table A1. Glioblastoma stem-like cell (GSC) cultures.
Glioma Cell Line and GSC Cultures1SpeciesGBM Subtype
Gl261 glioma cell linemurine
cdkn2aKOEGFRvIII GBM-murineclassical
p53KOPDGFB GBMmurineproneural
GBM#2humanclassical
GBM#14humanproneural
NCH644humanproneural
1 Generation is described in [20,21,22,24].
Table A2. Antibodies.
TargetLabelSpeciesCatalogCompanyConcentration
anti-TSPO rabbitab109497abcam1:250
anti-LAT1 rabbitLS-C415524Biozol1:100
anti-Iba1 goatab5076abcam1:400
anti-CD31 ratcat. 550274BD Biosciences1:50
anti-PDGFRβ goatAF1042R&D Systems1:100
anti-rabbitbiotindonkeyCat. 711-065-152Jackson Immuno-Research1:250
anti-rabbitAF488donkeyCat. A-21206ThermoFisher Scientific1:500
anti-goatbiotindonkeyB7024Sigma1:250
anti-goatAF488donkeyCat. 705-545-147Jackson Immuno-Research1:500
anti-goatAF647donkeyCat. 705-605-003Jackson Immuno-Research1:500
anti-rabbitAF594donkeyCat. A-21207ThermoFisher Scientific1:500
anti-ratbiotindonkeyCat. 712-065-150Jackson Immuno-Research1:250
streptavidinAF488 Cat. 016-540-084Jackson Immuno-Research1:500
streptavidinAF594 Cat. 016-580-084Jackson Immuno-Research1:500

References

  1. Ostrom, Q.T.; Gittleman, H.; Truitt, G.; Boscia, A.; Kruchko, C.; Barnholtz-Sloan, J.S. CBTRUS Statistical Report: Primary Brain and Other Central Nervous System Tumors Diagnosed in the United States in 2011–2015. NeuroOncology 2018, 20, iv1–iv86. [Google Scholar] [CrossRef] [PubMed] [Green Version]
  2. Leibetseder, A.; Ackerl, M.; Flechl, B.; Wohrer, A.; Widhalm, G.; Dieckmann, K.; Kreinecker, S.S.; Pichler, J.; Hainfellner, J.; Preusser, M.; et al. Outcome and molecular characteristics of adolescent and young adult patients with newly diagnosed primary glioblastoma: A study of the Society of Austrian Neurooncology (SANO). NeuroOncology 2013, 15, 112–121. [Google Scholar] [CrossRef] [PubMed]
  3. Verhaak, R.G.; Hoadley, K.A.; Purdom, E.; Wang, V.; Qi, Y.; Wilkerson, M.D.; Miller, C.R.; Ding, L.; Golub, T.; Mesirov, J.P.; et al. Integrated genomic analysis identifies clinically relevant subtypes of glioblastoma characterized by abnormalities in PDGFRA, IDH1, EGFR, and NF1. Cancer Cell 2010, 17, 98–110. [Google Scholar] [CrossRef] [PubMed] [Green Version]
  4. Karsy, M.; Guan, J.; Cohen, A.L.; Jensen, R.L.; Colman, H. New Molecular Considerations for Glioma: IDH, ATRX, BRAF, TERT, H3 K27M. Curr. Neurol. Neurosci. Rep. 2017, 17, 19. [Google Scholar] [CrossRef]
  5. Brito, C.; Azevedo, A.; Esteves, S.; Marques, A.R.; Martins, C.; Costa, I.; Mafra, M.; Bravo Marques, J.M.; Roque, L.; Pojo, M. Clinical insights gained by refining the 2016 WHO classification of diffuse gliomas with: EGFR amplification, TERT mutations, PTEN deletion and MGMT methylation. BMC Cancer 2019, 19, 968. [Google Scholar] [CrossRef] [Green Version]
  6. Wang, Q.; Hu, B.; Hu, X.; Kim, H.; Squatrito, M.; Scarpace, L.; deCarvalho, A.C.; Lyu, S.; Li, P.; Li, Y.; et al. Tumor Evolution of Glioma-Intrinsic Gene Expression Subtypes Associates with Immunological Changes in the Microenvironment. Cancer Cell 2017, 32, 42–56. [Google Scholar] [CrossRef] [Green Version]
  7. Sottoriva, A.; Spiteri, I.; Piccirillo, S.G.; Touloumis, A.; Collins, V.P.; Marioni, J.C.; Curtis, C.; Watts, C.; Tavare, S. Intratumor heterogeneity in human glioblastoma reflects cancer evolutionary dynamics. Proc. Natl. Acad. Sci. USA 2013, 110, 4009–4014. [Google Scholar] [CrossRef] [Green Version]
  8. Bhat, K.P.L.; Balasubramaniyan, V.; Vaillant, B.; Ezhilarasan, R.; Hummelink, K.; Hollingsworth, F.; Wani, K.; Heathcock, L.; James, J.D.; Goodman, L.D.; et al. Mesenchymal differentiation mediated by NF-kappaB promotes radiation resistance in glioblastoma. Cancer Cell 2013, 24, 331–346. [Google Scholar] [CrossRef] [Green Version]
  9. Albert, N.L.; Winkelmann, I.; Suchorska, B.; Wenter, V.; Schmid-Tannwald, C.; Mille, E.; Todica, A.; Brendel, M.; Tonn, J.C.; Bartenstein, P.; et al. Early static (18)F-FET-PET scans have a higher accuracy for glioma grading than the standard 20-40 min scans. Eur. J. Nucl. Med. Mol. Imaging 2016, 43, 1105–1114. [Google Scholar] [CrossRef]
  10. Holzgreve, A.; Brendel, M.; Gu, S.; Carlsen, J.; Mille, E.; Boning, G.; Mastrella, G.; Unterrainer, M.; Gildehaus, F.J.; Rominger, A.; et al. Monitoring of Tumor Growth with [(18)F]-FET PET in a Mouse Model of Glioblastoma: SUV Measurements and Volumetric Approaches. Front. Neurosci. 2016, 10, 260. [Google Scholar] [CrossRef]
  11. Suchorska, B.; Albert, N.L.; Tonn, J.C. Usefulness of PET Imaging to Guide Treatment Options in Gliomas. Curr. Treat. Options Neurol. 2016, 18, 4. [Google Scholar] [CrossRef]
  12. Habermeier, A.; Graf, J.; Sandhofer, B.F.; Boissel, J.P.; Roesch, F.; Closs, E.I. System L amino acid transporter LAT1 accumulates O-(2-fluoroethyl)-L-tyrosine (FET). Amino Acids 2015, 47, 335–344. [Google Scholar] [CrossRef] [PubMed]
  13. Popperl, G.; Kreth, F.W.; Mehrkens, J.H.; Herms, J.; Seelos, K.; Koch, W.; Gildehaus, F.J.; Kretzschmar, H.A.; Tonn, J.C.; Tatsch, K. FET PET for the evaluation of untreated gliomas: Correlation of FET uptake and uptake kinetics with tumour grading. Eur. J. Nucl. Med. Mol. Imaging 2007, 34, 1933–1942. [Google Scholar] [CrossRef] [PubMed]
  14. Wester, H.J.; Herz, M.; Weber, W.; Heiss, P.; Senekowitsch-Schmidtke, R.; Schwaiger, M.; Stocklin, G. Synthesis and radiopharmacology of O-(2-[18F]fluoroethyl)-L-tyrosine for tumor imaging. J. Nucl. Med. 1999, 40, 205–212. [Google Scholar] [PubMed]
  15. Broekman, M.L.; Maas, S.L.N.; Abels, E.R.; Mempel, T.R.; Krichevsky, A.M.; Breakefield, X.O. Multidimensional communication in the microenvirons of glioblastoma. Nat. Rev. Neurol. 2018, 14, 482–495. [Google Scholar] [CrossRef] [PubMed]
  16. Glass, R.; Synowitz, M. CNS macrophages and peripheral myeloid cells in brain tumours. Acta Neuropathol. 2014, 128, 347–362. [Google Scholar] [CrossRef] [Green Version]
  17. Aldape, K.; Zadeh, G.; Mansouri, S.; Reifenberger, G.; von Deimling, A. Glioblastoma: Pathology, molecular mechanisms and markers. Acta Neuropathol. 2015, 129, 829–848. [Google Scholar] [CrossRef]
  18. Albert, N.L.; Unterrainer, M.; Fleischmann, D.F.; Lindner, S.; Vettermann, F.; Brunegraf, A.; Vomacka, L.; Brendel, M.; Wenter, V.; Wetzel, C.; et al. TSPO PET for glioma imaging using the novel ligand 18F-GE-180: First results in patients with glioblastoma. Eur. J. Nucl. Med. Mol. Imaging 2017. [Google Scholar] [CrossRef]
  19. Zinnhardt, B.; Pigeon, H.; Theze, B.; Viel, T.; Wachsmuth, L.; Fricke, I.B.; Schelhaas, S.; Honold, L.; Schwegmann, K.; Wagner, S.; et al. Combined PET Imaging of the Inflammatory Tumor Microenvironment Identifies Margins of Unique Radiotracer Uptake. Cancer Res. 2017, 77, 1831–1841. [Google Scholar] [CrossRef] [Green Version]
  20. Campos, B.; Wan, F.; Farhadi, M.; Ernst, A.; Zeppernick, F.; Tagscherer, K.E.; Ahmadi, R.; Lohr, J.; Dictus, C.; Gdynia, G.; et al. Differentiation therapy exerts antitumor effects on stem-like glioma cells. Clin. Cancer Res. 2010, 16, 2715–2728. [Google Scholar] [CrossRef] [Green Version]
  21. Drachsler, M.; Kleber, S.; Mateos, A.; Volk, K.; Mohr, N.; Chen, S.; Cirovic, B.; Tuttenberg, J.; Gieffers, C.; Sykora, J.; et al. CD95 maintains stem cell-like and non-classical EMT programs in primary human glioblastoma cells. Cell Death Dis. 2016, 7, e2209. [Google Scholar] [CrossRef] [PubMed]
  22. Binda, E.; Visioli, A.; Giani, F.; Trivieri, N.; Palumbo, O.; Restelli, S.; Dezi, F.; Mazza, T.; Fusilli, C.; Legnani, F.; et al. Wnt5a Drives an Invasive Phenotype in Human Glioblastoma Stem-like Cells. Cancer Res. 2017, 77, 996–1007. [Google Scholar] [CrossRef] [PubMed] [Green Version]
  23. Jones, T.S.; Holland, E.C. Animal models for glioma drug discovery. Expert Opin. Drug Discov. 2011, 6, 1271–1283. [Google Scholar] [CrossRef] [PubMed]
  24. Mastrella, G.; Hou, M.; Li, M.; Stoecklein, V.M.; Zdouc, N.; Volmar, M.N.M.; Miletic, H.; Reinhard, S.; Herold-Mende, C.C.; Kleber, S.; et al. Targeting APLN/APLNR Improves Antiangiogenic Efficiency and Blunts Proinvasive Side Effects of VEGFA/VEGFR2 Blockade in Glioblastoma. Cancer Res. 2019, 79, 2298–2313. [Google Scholar] [CrossRef] [PubMed] [Green Version]
  25. Gerl, K.; Nolan, K.A.; Karger, C.; Fuchs, M.; Wenger, R.H.; Stolt, C.C.; Willam, C.; Kurtz, A.; Kurt, B. Erythropoietin production by PDGFR-beta(+) cells. Pflug. Arch. 2016, 468, 1479–1487. [Google Scholar] [CrossRef] [PubMed]
  26. Madisen, L.; Zwingman, T.A.; Sunkin, S.M.; Oh, S.W.; Zariwala, H.A.; Gu, H.; Ng, L.L.; Palmiter, R.D.; Hawrylycz, M.J.; Jones, A.R.; et al. A robust and high-throughput Cre reporting and characterization system for the whole mouse brain. Nat. Neurosci. 2010, 13, 133–140. [Google Scholar] [CrossRef] [Green Version]
  27. Jung, S.; Aliberti, J.; Graemmel, P.; Sunshine, M.J.; Kreutzberg, G.W.; Sher, A.; Littman, D.R. Analysis of fractalkine receptor CX(3)CR1 function by targeted deletion and green fluorescent protein reporter gene insertion. Mol. Cell Biol. 2000, 20, 4106–4114. [Google Scholar] [CrossRef] [Green Version]
  28. Wieghofer, P.; Knobeloch, K.P.; Prinz, M. Genetic targeting of microglia. Glia 2015, 63, 1–22. [Google Scholar] [CrossRef]
  29. Bowman, R.L.; Wang, Q.; Carro, A.; Verhaak, R.G.; Squatrito, M. GlioVis data portal for visualization and analysis of brain tumor expression datasets. NeuroOncology 2017, 19, 139–141. [Google Scholar] [CrossRef] [Green Version]
  30. Ghadery, C.; Best, L.A.; Pavese, N.; Tai, Y.F.; Strafella, A.P. PET Evaluation of Microglial Activation in Non-neurodegenerative Brain Diseases. Curr. Neurol. Neurosci. Rep. 2019, 19, 38. [Google Scholar] [CrossRef] [Green Version]
  31. Bradburn, S.; Murgatroyd, C.; Ray, N. Neuroinflammation in mild cognitive impairment and Alzheimer’s disease: A meta-analysis. Ageing Res. Rev. 2019, 50, 1–8. [Google Scholar] [CrossRef] [PubMed]
  32. Chaney, A.; Williams, S.R.; Boutin, H. In vivo molecular imaging of neuroinflammation in Alzheimer’s disease. J. Neurochem. 2019, 149, 438–451. [Google Scholar] [CrossRef] [PubMed] [Green Version]
  33. Kohno, M.; Link, J.; Dennis, L.E.; McCready, H.; Huckans, M.; Hoffman, W.F.; Loftis, J.M. Neuroinflammation in addiction: A review of neuroimaging studies and potential immunotherapies. Pharm. Biochem. Behav. 2019, 179, 34–42. [Google Scholar] [CrossRef] [PubMed]
  34. Guilarte, T.R. TSPO in diverse CNS pathologies and psychiatric disease: A critical review and a way forward. Pharm. Ther. 2019, 194, 44–58. [Google Scholar] [CrossRef]
  35. Unterrainer, M.; Fleischmann, D.F.; Diekmann, C.; Vomacka, L.; Lindner, S.; Vettermann, F.; Brendel, M.; Wenter, V.; Ertl-Wagner, B.; Herms, J.; et al. Comparison of (18)F-GE-180 and dynamic (18)F-FET PET in high grade glioma: A double-tracer pilot study. Eur. J. Nucl. Med. Mol. Imaging 2019, 46, 580–590. [Google Scholar] [CrossRef]
  36. Pigeon, H.; Peres, E.A.; Truillet, C.; Jego, B.; Boumezbeur, F.; Caille, F.; Zinnhardt, B.; Jacobs, A.H.; Le Bihan, D.; Winkeler, A. TSPO-PET and diffusion-weighted MRI for imaging a mouse model of infiltrative human glioma. NeuroOncology 2019. [Google Scholar] [CrossRef] [Green Version]
  37. Jensen, P.; Feng, L.; Law, I.; Svarer, C.; Knudsen, G.M.; Mikkelsen, J.D.; de Nijs, R.; Larsen, V.A.; Dyssegaard, A.; Thomsen, G.; et al. TSPO Imaging in Glioblastoma Multiforme: A Direct Comparison Between 123I-CLINDE SPECT, 18F-FET PET, and Gadolinium-Enhanced MR Imaging. J. Nucl. Med. 2015, 56, 1386–1390. [Google Scholar] [CrossRef] [Green Version]
  38. Betlazar, C.; Harrison-Brown, M.; Middleton, R.J.; Banati, R.; Liu, G.J. Cellular Sources and Regional Variations in the Expression of the Neuroinflammatory Marker Translocator Protein (TSPO) in the Normal Brain. Int. J. Mol. Sci. 2018, 19, 2707. [Google Scholar] [CrossRef] [Green Version]
  39. Turkheimer, F.E.; Edison, P.; Pavese, N.; Roncaroli, F.; Anderson, A.N.; Hammers, A.; Gerhard, A.; Hinz, R.; Tai, Y.F.; Brooks, D.J. Reference and target region modeling of [11C]-(R)-PK11195 brain studies. J. Nucl. Med. 2007, 48, 158–167. [Google Scholar]
  40. Cosenza-Nashat, M.; Zhao, M.L.; Suh, H.S.; Morgan, J.; Natividad, R.; Morgello, S.; Lee, S.C. Expression of the translocator protein of 18 kDa by microglia, macrophages and astrocytes based on immunohistochemical localization in abnormal human brain. Neuropathol. Appl. Neurobiol. 2009, 35, 306–328. [Google Scholar] [CrossRef] [Green Version]
  41. Lavisse, S.; Guillermier, M.; Herard, A.S.; Petit, F.; Delahaye, M.; Van Camp, N.; Ben Haim, L.; Lebon, V.; Remy, P.; Dolle, F.; et al. Reactive astrocytes overexpress TSPO and are detected by TSPO positron emission tomography imaging. J. Neurosci. 2012, 32, 10809–10818. [Google Scholar] [CrossRef] [PubMed] [Green Version]
  42. Beckers, L.; Ory, D.; Geric, I.; Declercq, L.; Koole, M.; Kassiou, M.; Bormans, G.; Baes, M. Increased Expression of Translocator Protein (TSPO) Marks Pro-inflammatory Microglia but Does Not Predict Neurodegeneration. Mol. Imaging Biol. 2018, 20, 94–102. [Google Scholar] [CrossRef] [PubMed] [Green Version]
  43. Vlodavsky, E.; Soustiel, J.F. Immunohistochemical expression of peripheral benzodiazepine receptors in human astrocytomas and its correlation with grade of malignancy, proliferation, apoptosis and survival. J. NeuroOncol. 2007, 81, 1–7. [Google Scholar] [CrossRef] [PubMed]
  44. Roncaroli, F.; Su, Z.; Herholz, K.; Gerhard, A.; Turkheimer, F.E. TSPO expression in brain tumours: Is TSPO a target for brain tumour imaging? Clin. Transl. Imaging 2016, 4, 145–156. [Google Scholar] [CrossRef] [PubMed] [Green Version]
  45. Jung, T.Y.; Jung, S.; Kim, I.Y.; Moon, K.S.; Jang, W.Y.; Park, S.J.; Kim, Y.H.; Kim, H.S.; Min, J.J.; Kim, J. Pathologic analysis of glioblastoma via multiple stereotactic biopsies of active tumor and necrosis. Oncol. Rep. 2012, 27, 707–713. [Google Scholar] [CrossRef] [PubMed] [Green Version]
  46. Nawashiro, H.; Otani, N.; Uozumi, Y.; Ooigawa, H.; Toyooka, T.; Suzuki, T.; Katoh, H.; Tsuzuki, N.; Ohnuki, A.; Shima, K.; et al. High expression of L-type amino acid transporter 1 in infiltrating glioma cells. Brain Tumor Pathol. 2005, 22, 89–91. [Google Scholar] [CrossRef] [PubMed]
  47. Youland, R.S.; Kitange, G.J.; Peterson, T.E.; Pafundi, D.H.; Ramiscal, J.A.; Pokorny, J.L.; Giannini, C.; Laack, N.N.; Parney, I.F.; Lowe, V.J.; et al. The role of LAT1 in (18)F-DOPA uptake in malignant gliomas. J. NeuroOncol. 2013, 111, 11–18. [Google Scholar] [CrossRef]
  48. Nedergaard, M.K.; Kristoffersen, K.; Michaelsen, S.R.; Madsen, J.; Poulsen, H.S.; Stockhausen, M.T.; Lassen, U.; Kjaer, A. The use of longitudinal 18F-FET MicroPET imaging to evaluate response to irinotecan in orthotopic human glioblastoma multiforme xenografts. PLoS ONE 2014, 9, e100009. [Google Scholar] [CrossRef]
  49. Nawashiro, H.; Otani, N.; Shinomiya, N.; Fukui, S.; Ooigawa, H.; Shima, K.; Matsuo, H.; Kanai, Y.; Endou, H. L-type amino acid transporter 1 as a potential molecular target in human astrocytic tumors. Int. J. Cancer 2006, 119, 484–492. [Google Scholar] [CrossRef]
  50. Gerl, M.; Vockl, J.; Kurt, B.; van Veen, T.A.; Kurtz, A.; Wagner, C. Inducible deletion of connexin 40 in adult mice causes hypertension and disrupts pressure control of renin secretion. Kidney Int. 2015, 87, 557–563. [Google Scholar] [CrossRef] [Green Version]
  51. Schindelin, J.; Arganda-Carreras, I.; Frise, E.; Kaynig, V.; Longair, M.; Pietzsch, T.; Preibisch, S.; Rueden, C.; Saalfeld, S.; Schmid, B.; et al. Fiji: An open-source platform for biological-image analysis. Nat. Methods 2012, 9, 676–682. [Google Scholar] [CrossRef] [PubMed] [Green Version]
  52. Healy, S.; McMahon, J.; Owens, P.; Dockery, P.; FitzGerald, U. Threshold-based segmentation of fluorescent and chromogenic images of microglia, astrocytes and oligodendrocytes in FIJI. J. Neurosci. Methods 2018, 295, 87–103. [Google Scholar] [CrossRef] [PubMed]
Figure 1. Mitochondrial translocator protein (TSPO) expression is increased in human glioblastoma compared to tumor-free brain tissue. (A) Immunohistochemistry of epilepsy (n = 4) and glioblastoma (GBM) patient samples (n = 4) was performed. Scale size is indicated in individual micrographs. (B) Number of TSPO-positive cells per field of view under a 20× objective was counted in all immunostained samples. In human GBM, significantly more cells were TSPO-positive compared to a tumor-free brain. Statistical significance (t-test) is indicated. **** p < 0.0001.
Ijms 21 00612 g001
Figure 2. TSPO is expressed in mouse models of different GBM subtypes; (A) Human GBM stem-like cells (GSCs) were orthotopically xenografted in immunodeficient mice. Immunofluorescent staining against TSPO (red) and nuclear counterstaining for DAPI (gray) shows a high level of expression in classical (GBM2) and proneural (GBM14 and NCH644) human GBM subtypes. (B) TSPO immunofluorescent staining (red) and nuclear counterstaining (gray) of murine Gl261 and the classical (cdkn2aKOEGFRvIII) and proneural (p53KOPDGFB) murine GBMs. (A,B) Scale size is indicated in individual micrographs. A representative image from a cohort of five mice per experimental group is shown.
Ijms 21 00612 g002
Figure 3. TSPO is expressed in tumor endothelia, pericytes, and myeloid cells. (A) Gl261 tumors grown for 3 weeks were co-stained by immunofluorescence for-anti-TSPO- (red), anti-CD31- (green), and anti-PDGFRB-antibodies (cyan) showing TSPO expression (red) in endothelia (green) and pericytes (cyan). (B) From Gl261 implants of PDGFRB::CreERT2,R26-tdTomato (red), mice immunofluorescent co-staining was performed using anti-CD31 (cyan) and TSPO (green), demonstrating the co-expression of TSPO in tdTomato-expressing pericytes (red). (C) Fluorescence staining with anti-Iba1 (green) and anti-TSPO (red) antibodies shows co-expression in tumor-associated myeloid cells. (D) TSPO immunofluorescence in the GL261 implant in CX3CR1-GFP mice confirms the co-expression of TSPO (red) in GFP (green)-positive microglia. (AD) DAPI nuclear counterstaining is shown in gray; scale-size is indicated in the individual micrographs.
Ijms 21 00612 g003
Figure 4. Microglia express TSPO, independent of the genetic GBM subtype. (A) Immunofluorescence staining of epilepsy and GBM patients. Co-staining for Iba1 (green) and TSPO (red) indicated the co-expression of both proteins in cells (zoom). (B) The number of Iba1-positive cells per field of view at 20x was counted. In the tumor area, significantly more Iba1-positive microglia could be found. The p-value of Student’s t test is indicated as **** p < 0.0001. (C) Immunohistochemical analysis of human GBM samples was performed and the number of positive cells was determined. A strong positive correlation between the amount of Iba1-positive cells and TSPO-positive cells was observed (n = 8). (D) Immunofluorescent staining of patient-derived xenografts (PDX) and orthotopic murine GBM implants was performed using anti-Iba1 (green) and anti-TSPO antibodies (red). In all models, TSPO-positive (red) and myeloid (green) cells were detected (arrows). (A,D) Scale size is indicated in individual micrographs.
Ijms 21 00612 g004
Figure 5. Amino acid transporter light chain L system (LAT1) expression is increased in human and murine GBM. (A) Immunohistochemistry of epilepsy (n = 4) and GBM patient samples (n = 4) was performed. LAT1 expression is more prominent in cells in the GBM sample compared to the control brain. (B) Number of LAT1-positive cells per field of view under a 20× objective was counted in all immunostained samples. In human GBM, significantly more cells were LAT1-positive compared to the tumor-free brain. Statistical significance (t-test) is indicated. **** p < 0.0001. (C) Immunofluorescent staining was performed against LAT1 in orthotop murine GBM (Gl261) or patient-derived xenografts (GBM2). LAT1 (red) expression was strong in the tumor boarder, while a weaker expression was visible outside the tumor area. (D) Immunofluorescent co-staining of orthotop murine glioblastoma (Gl261) or human xenograft (GBM2) for LAT1 (red) and Iba1 (green) shows no co-expression of LAT1 in myeloid cells. Scale size is indicated in individual micrographs.
Ijms 21 00612 g005
Figure 6. TSPO, solute carrier family 7 member 5 (SLC7A5), and AIF1 expression analysis in a TCGA GBM cohort. Patient GBM samples of the TCGA database were analyzed using GlioVis [29]. (A) Gen expression levels in GBM compared to the tumor-free brain showed that expression levels for TSPO and AIF1 were significantly higher in GBM. P-value of Student’s t test is indicated (upper panel). Significant differences between the gene expression of TSPO and AIF1 were also detected for GBM subtypes. Statistical significance (Tukey’s Honest Significant Difference) is indicated, *** p < 0.0005 (lower panel). (B) Survival of patients with a high or low expression of TSPO, SLC7A5, or AIF1 was analyzed. High TSPO or AIF1 expression was associated with significantly shorter survival, while high SLC7A5 expression levels were favorable for survival. Patient number indicated in graph. (C) A correlation between the genes TSPO, SLC7A5, and AIF1 was performed. A significant positive correlation between TSPO and AIF1 (Pearson’s r = 0.489) was observed, while no correlation between the other pairs could be seen. (D) Expression levels for TSPO and AIF1 were significantly higher in IDHWT GBM than in IDHMUT. P-value of Student’s t-test is indicated.
Ijms 21 00612 g006aIjms 21 00612 g006b

