Increased Skeletal Muscle Fiber Cross-Sectional Area, Muscle Phenotype Shift, and Altered Insulin Signaling in Rat Hindlimb Muscles in a Prenatally Androgenized Rat Model for Polycystic Ovary Syndrome


Abstract
:1. Introduction
2. Results
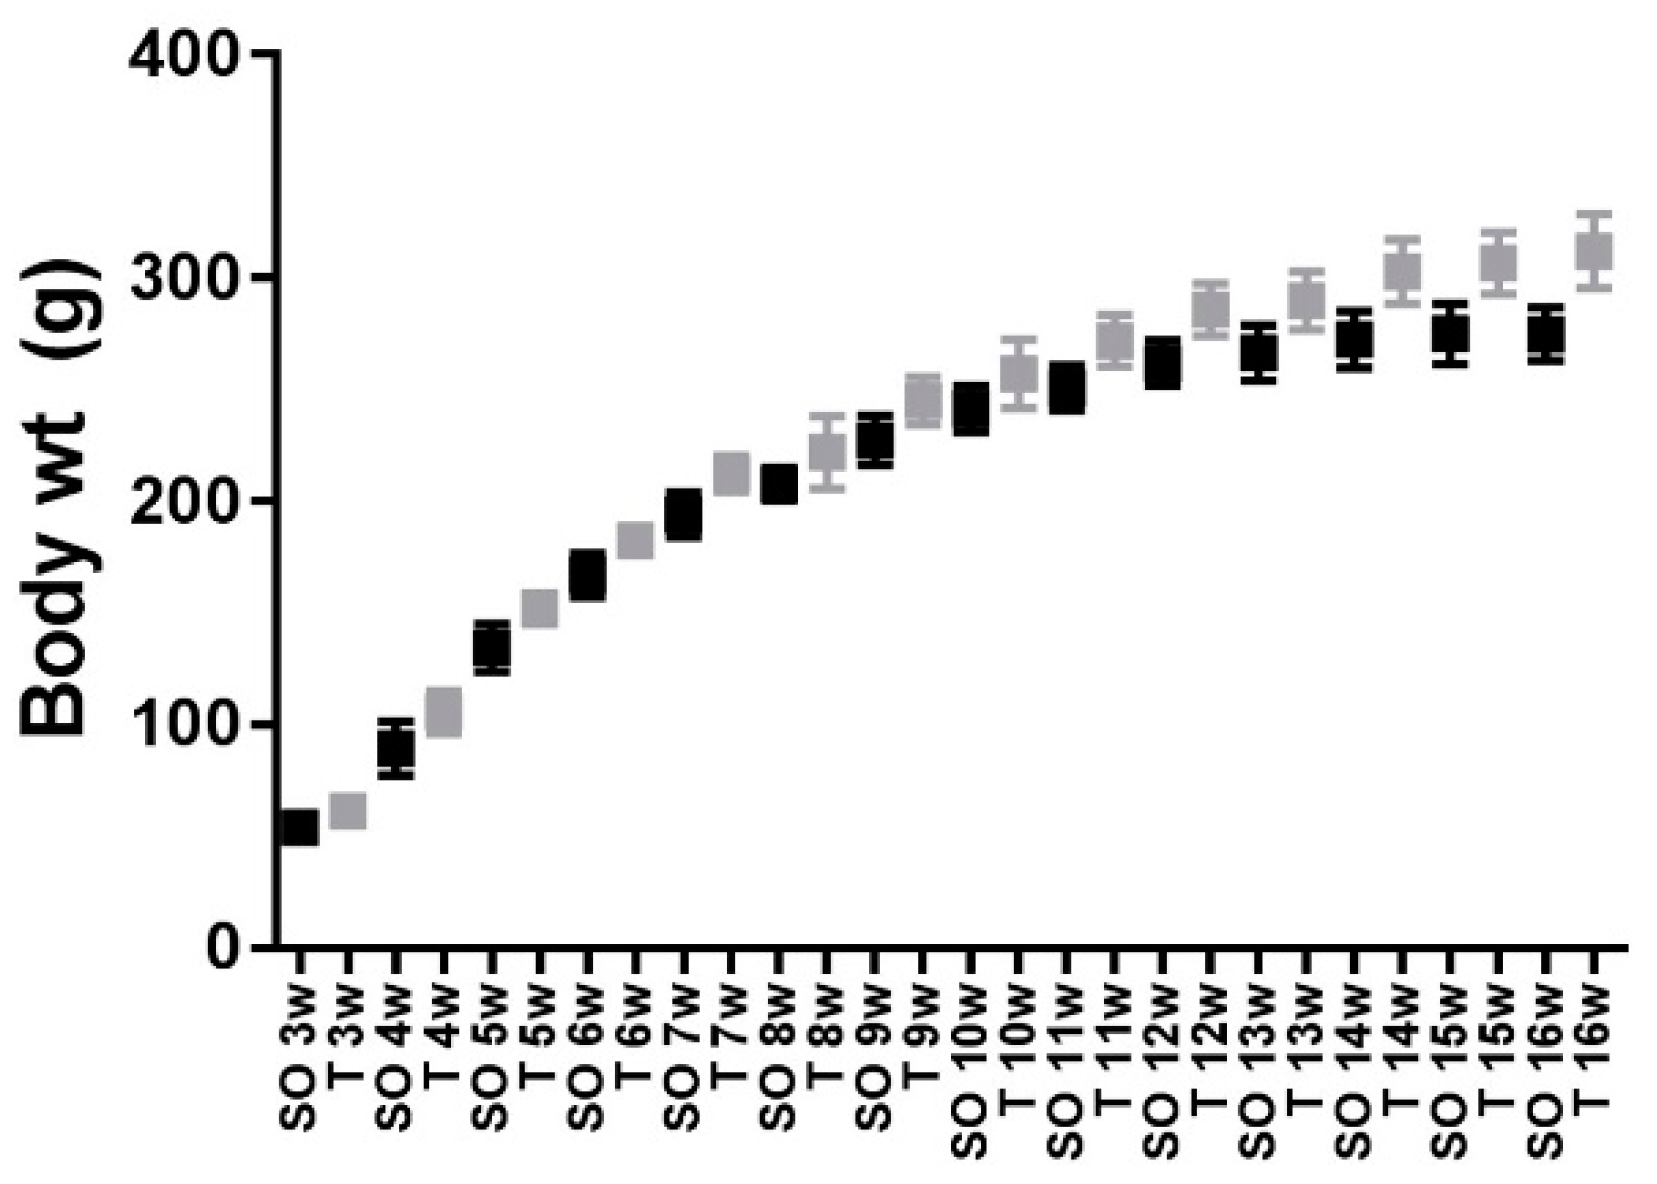
2.1. Body Weight
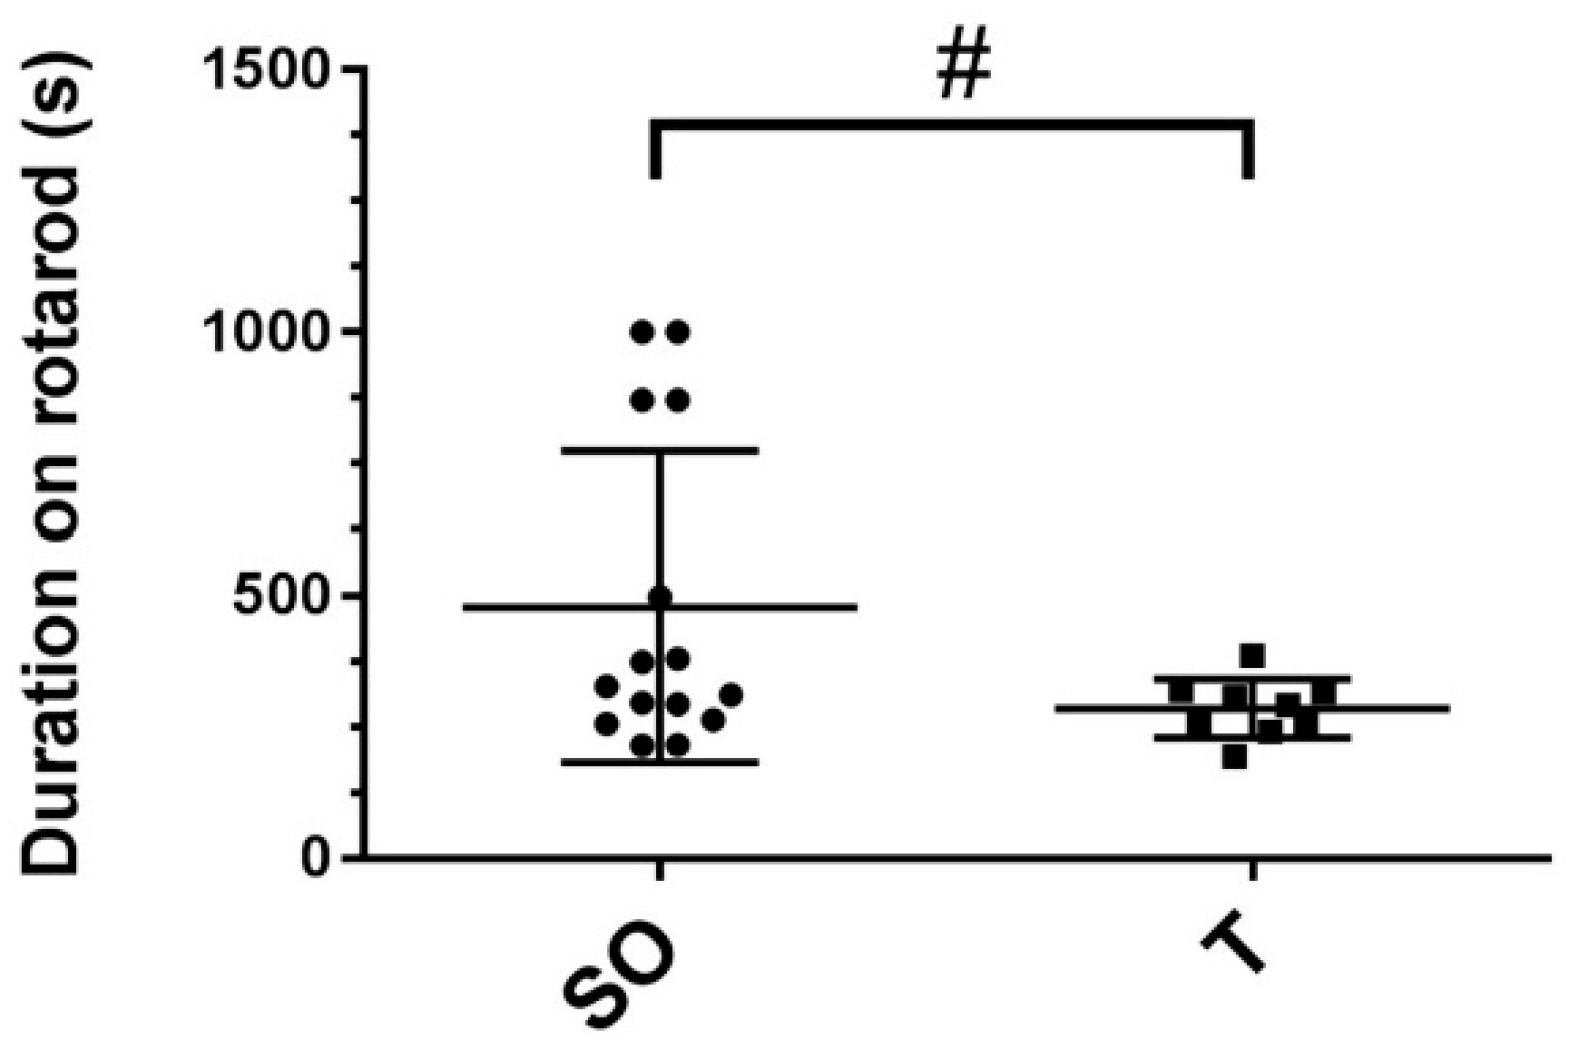
2.2. Rota-Rod Time Trials
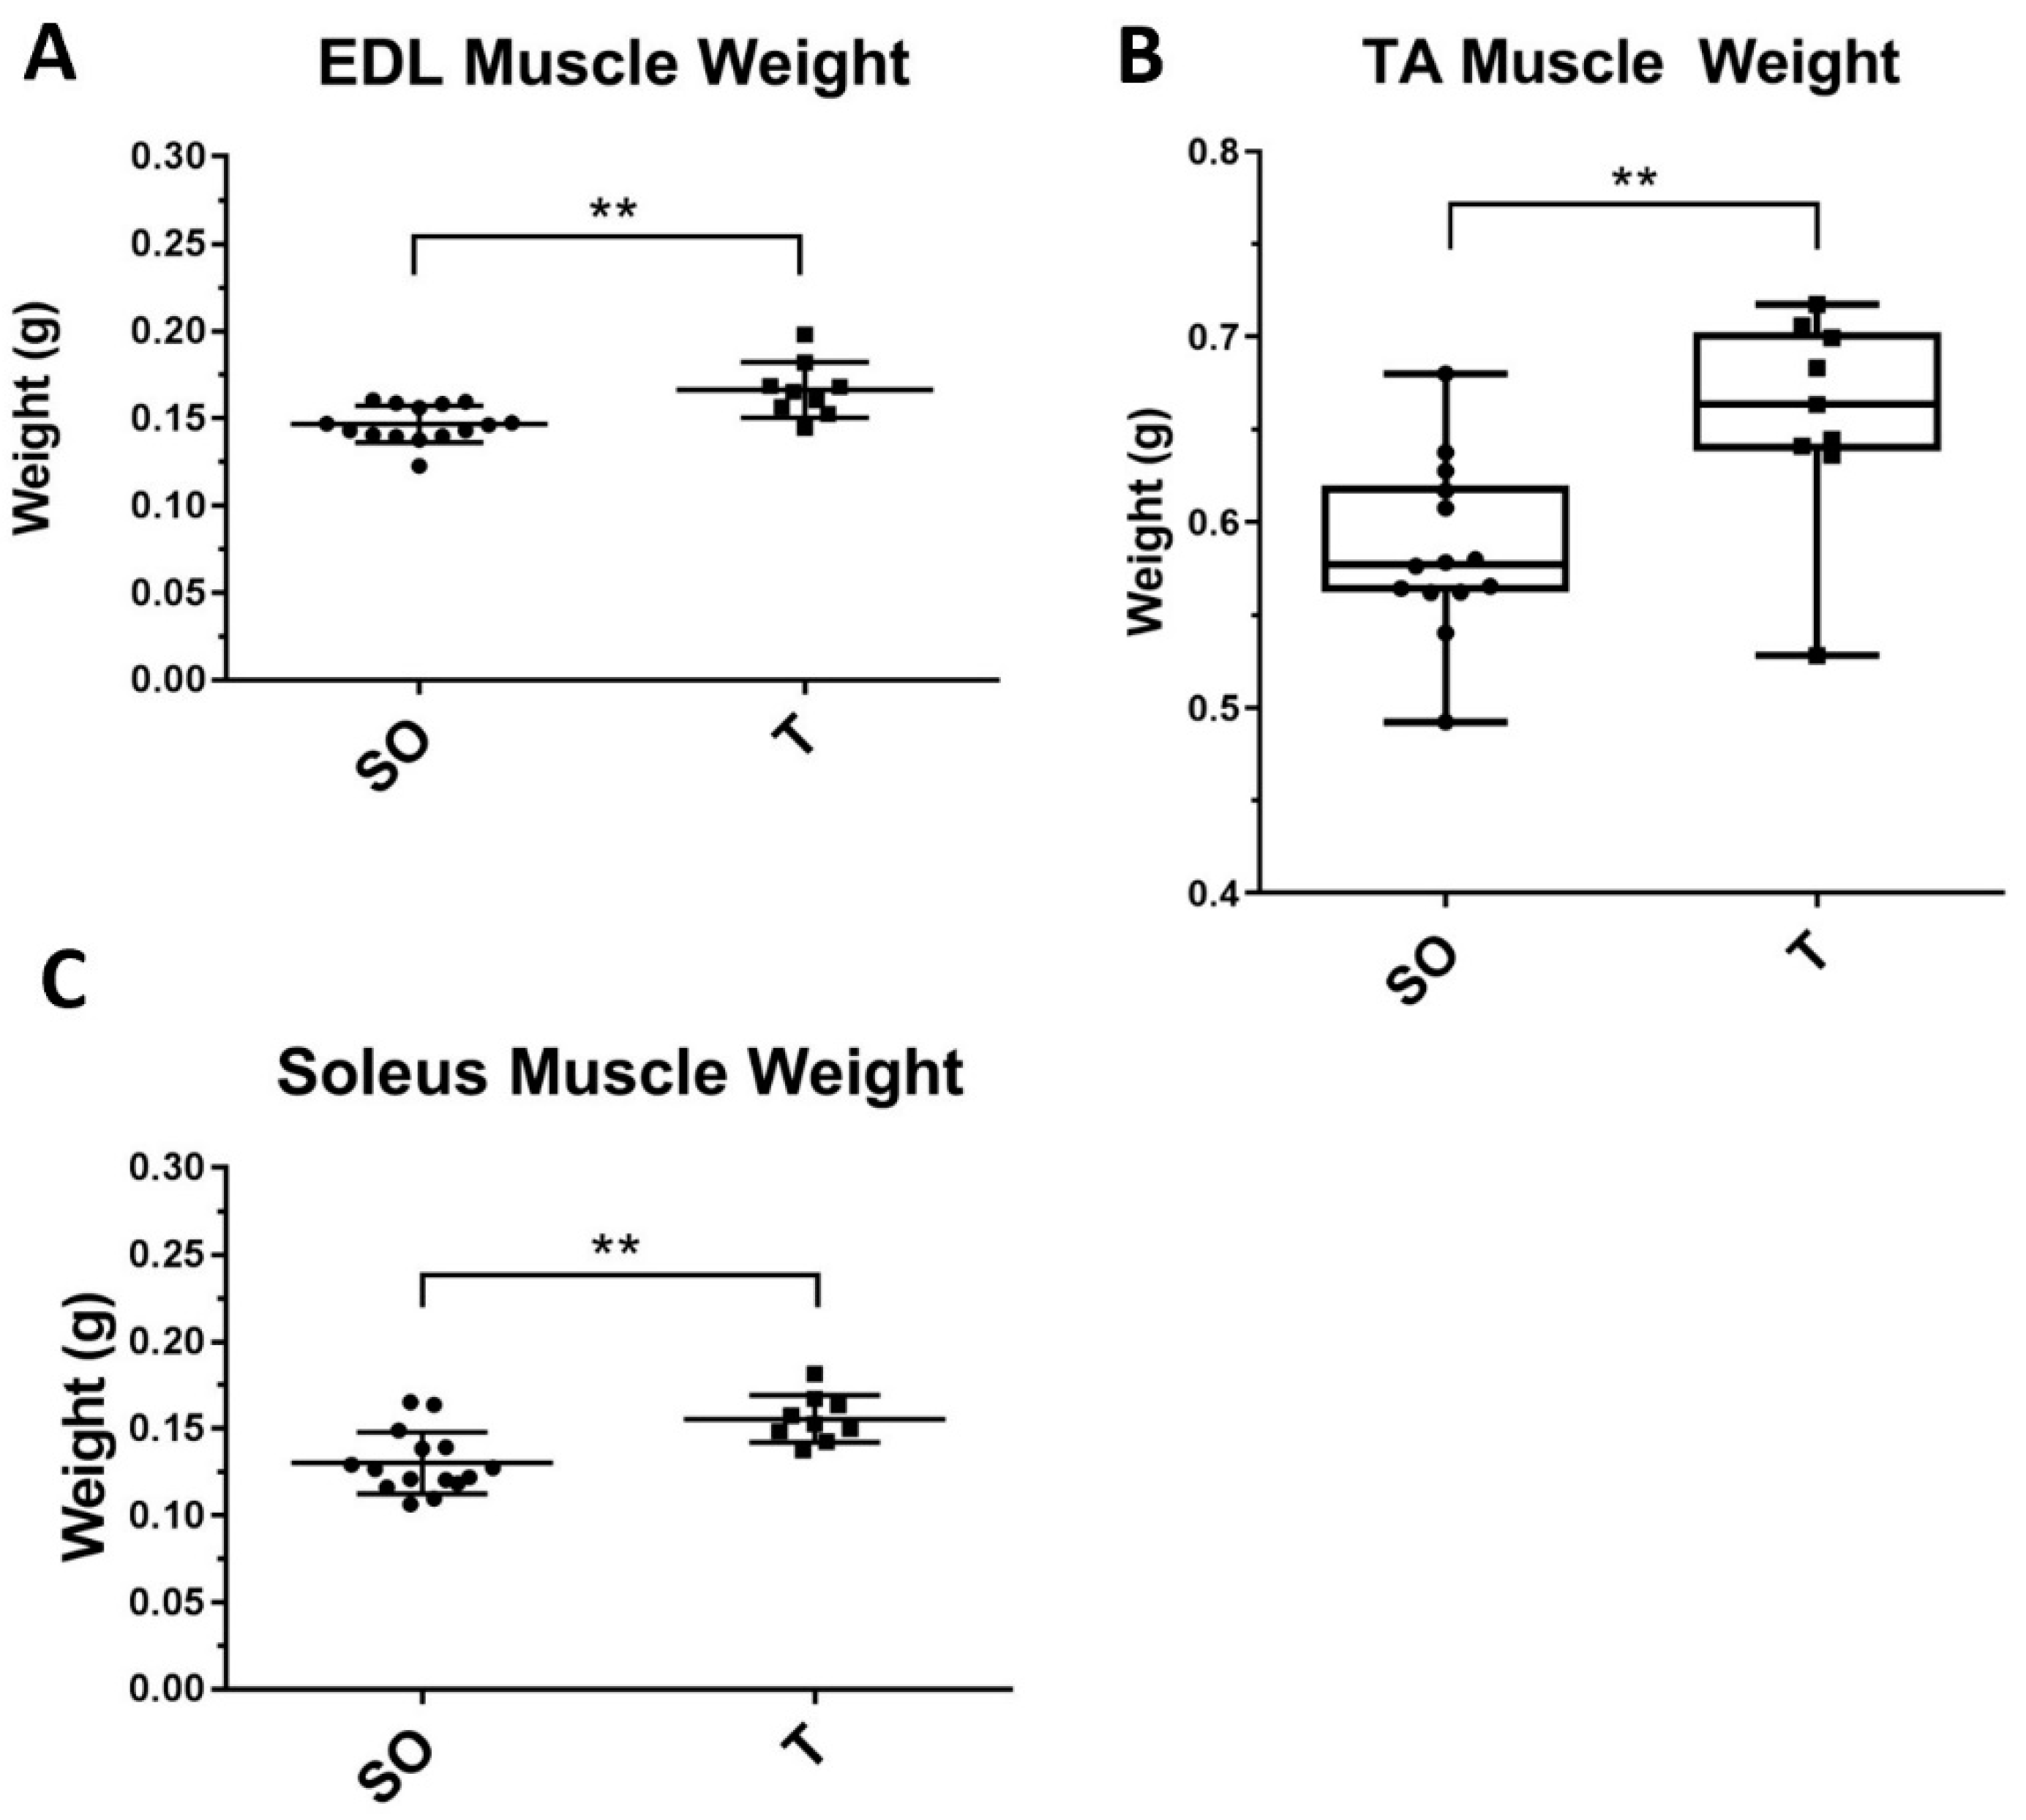
2.3. Hindlimb Muscle Weights
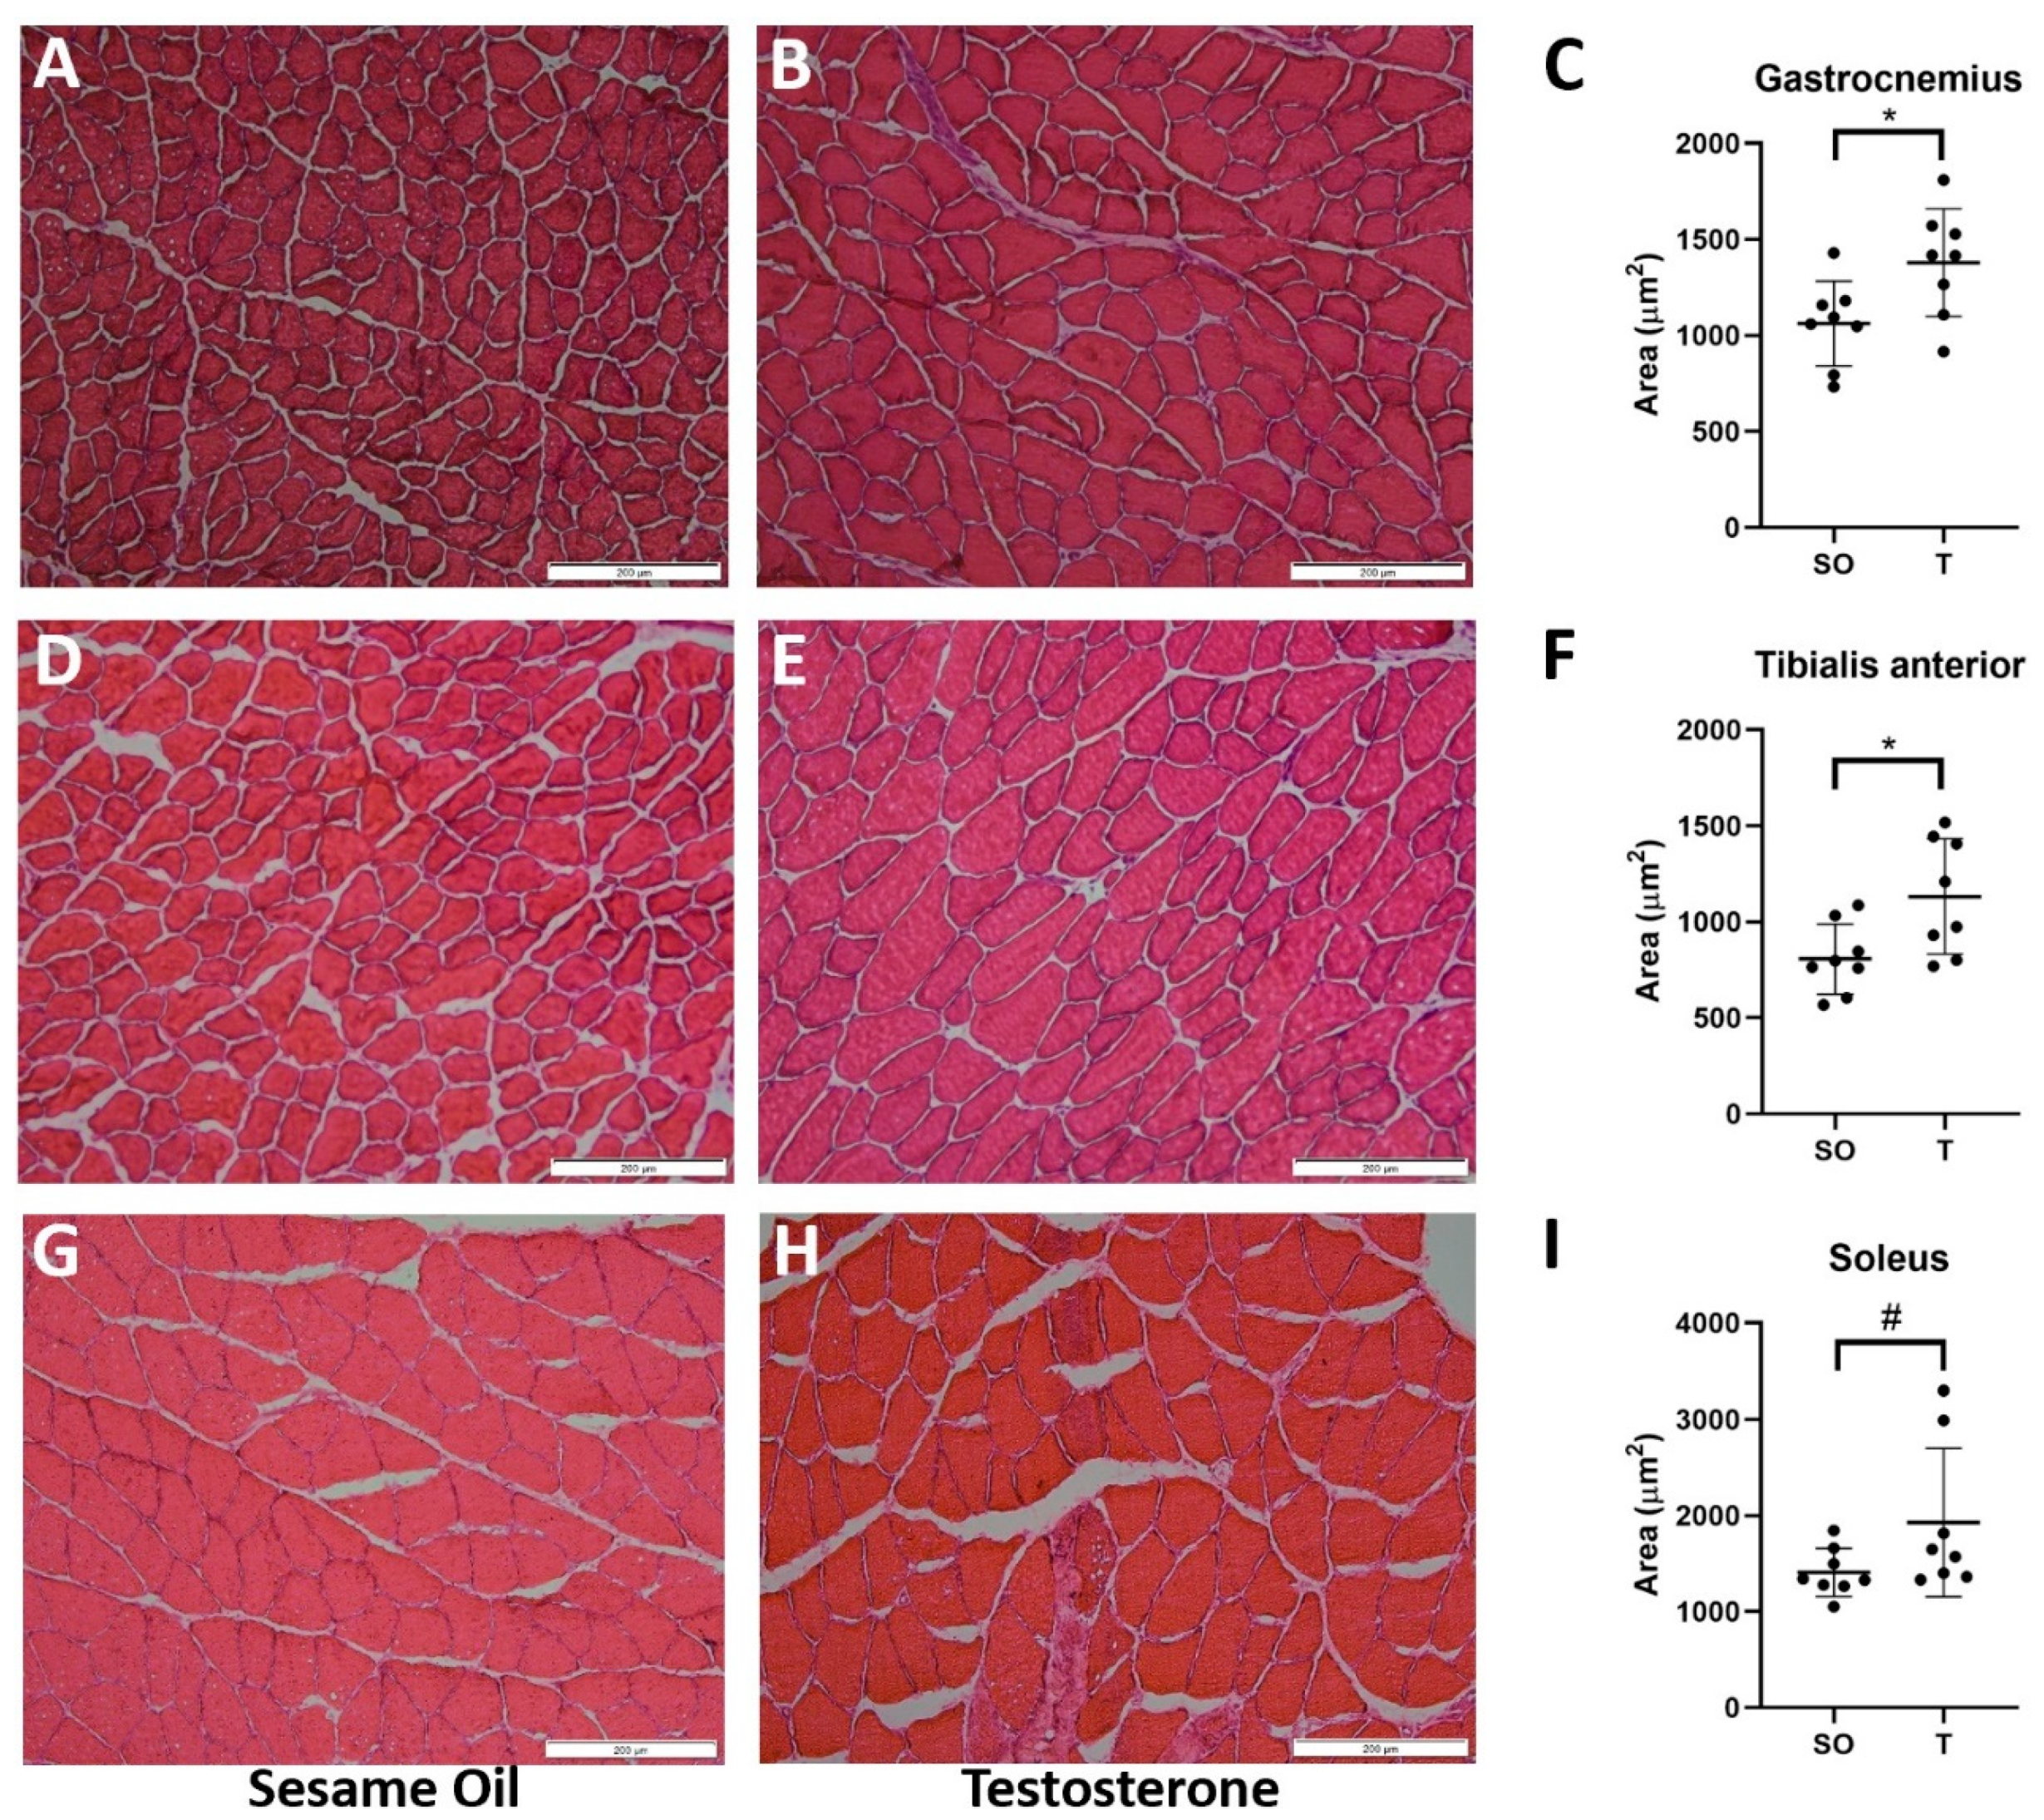
2.4. Hindlimb Muscle Fiber Cross-Sectional Area
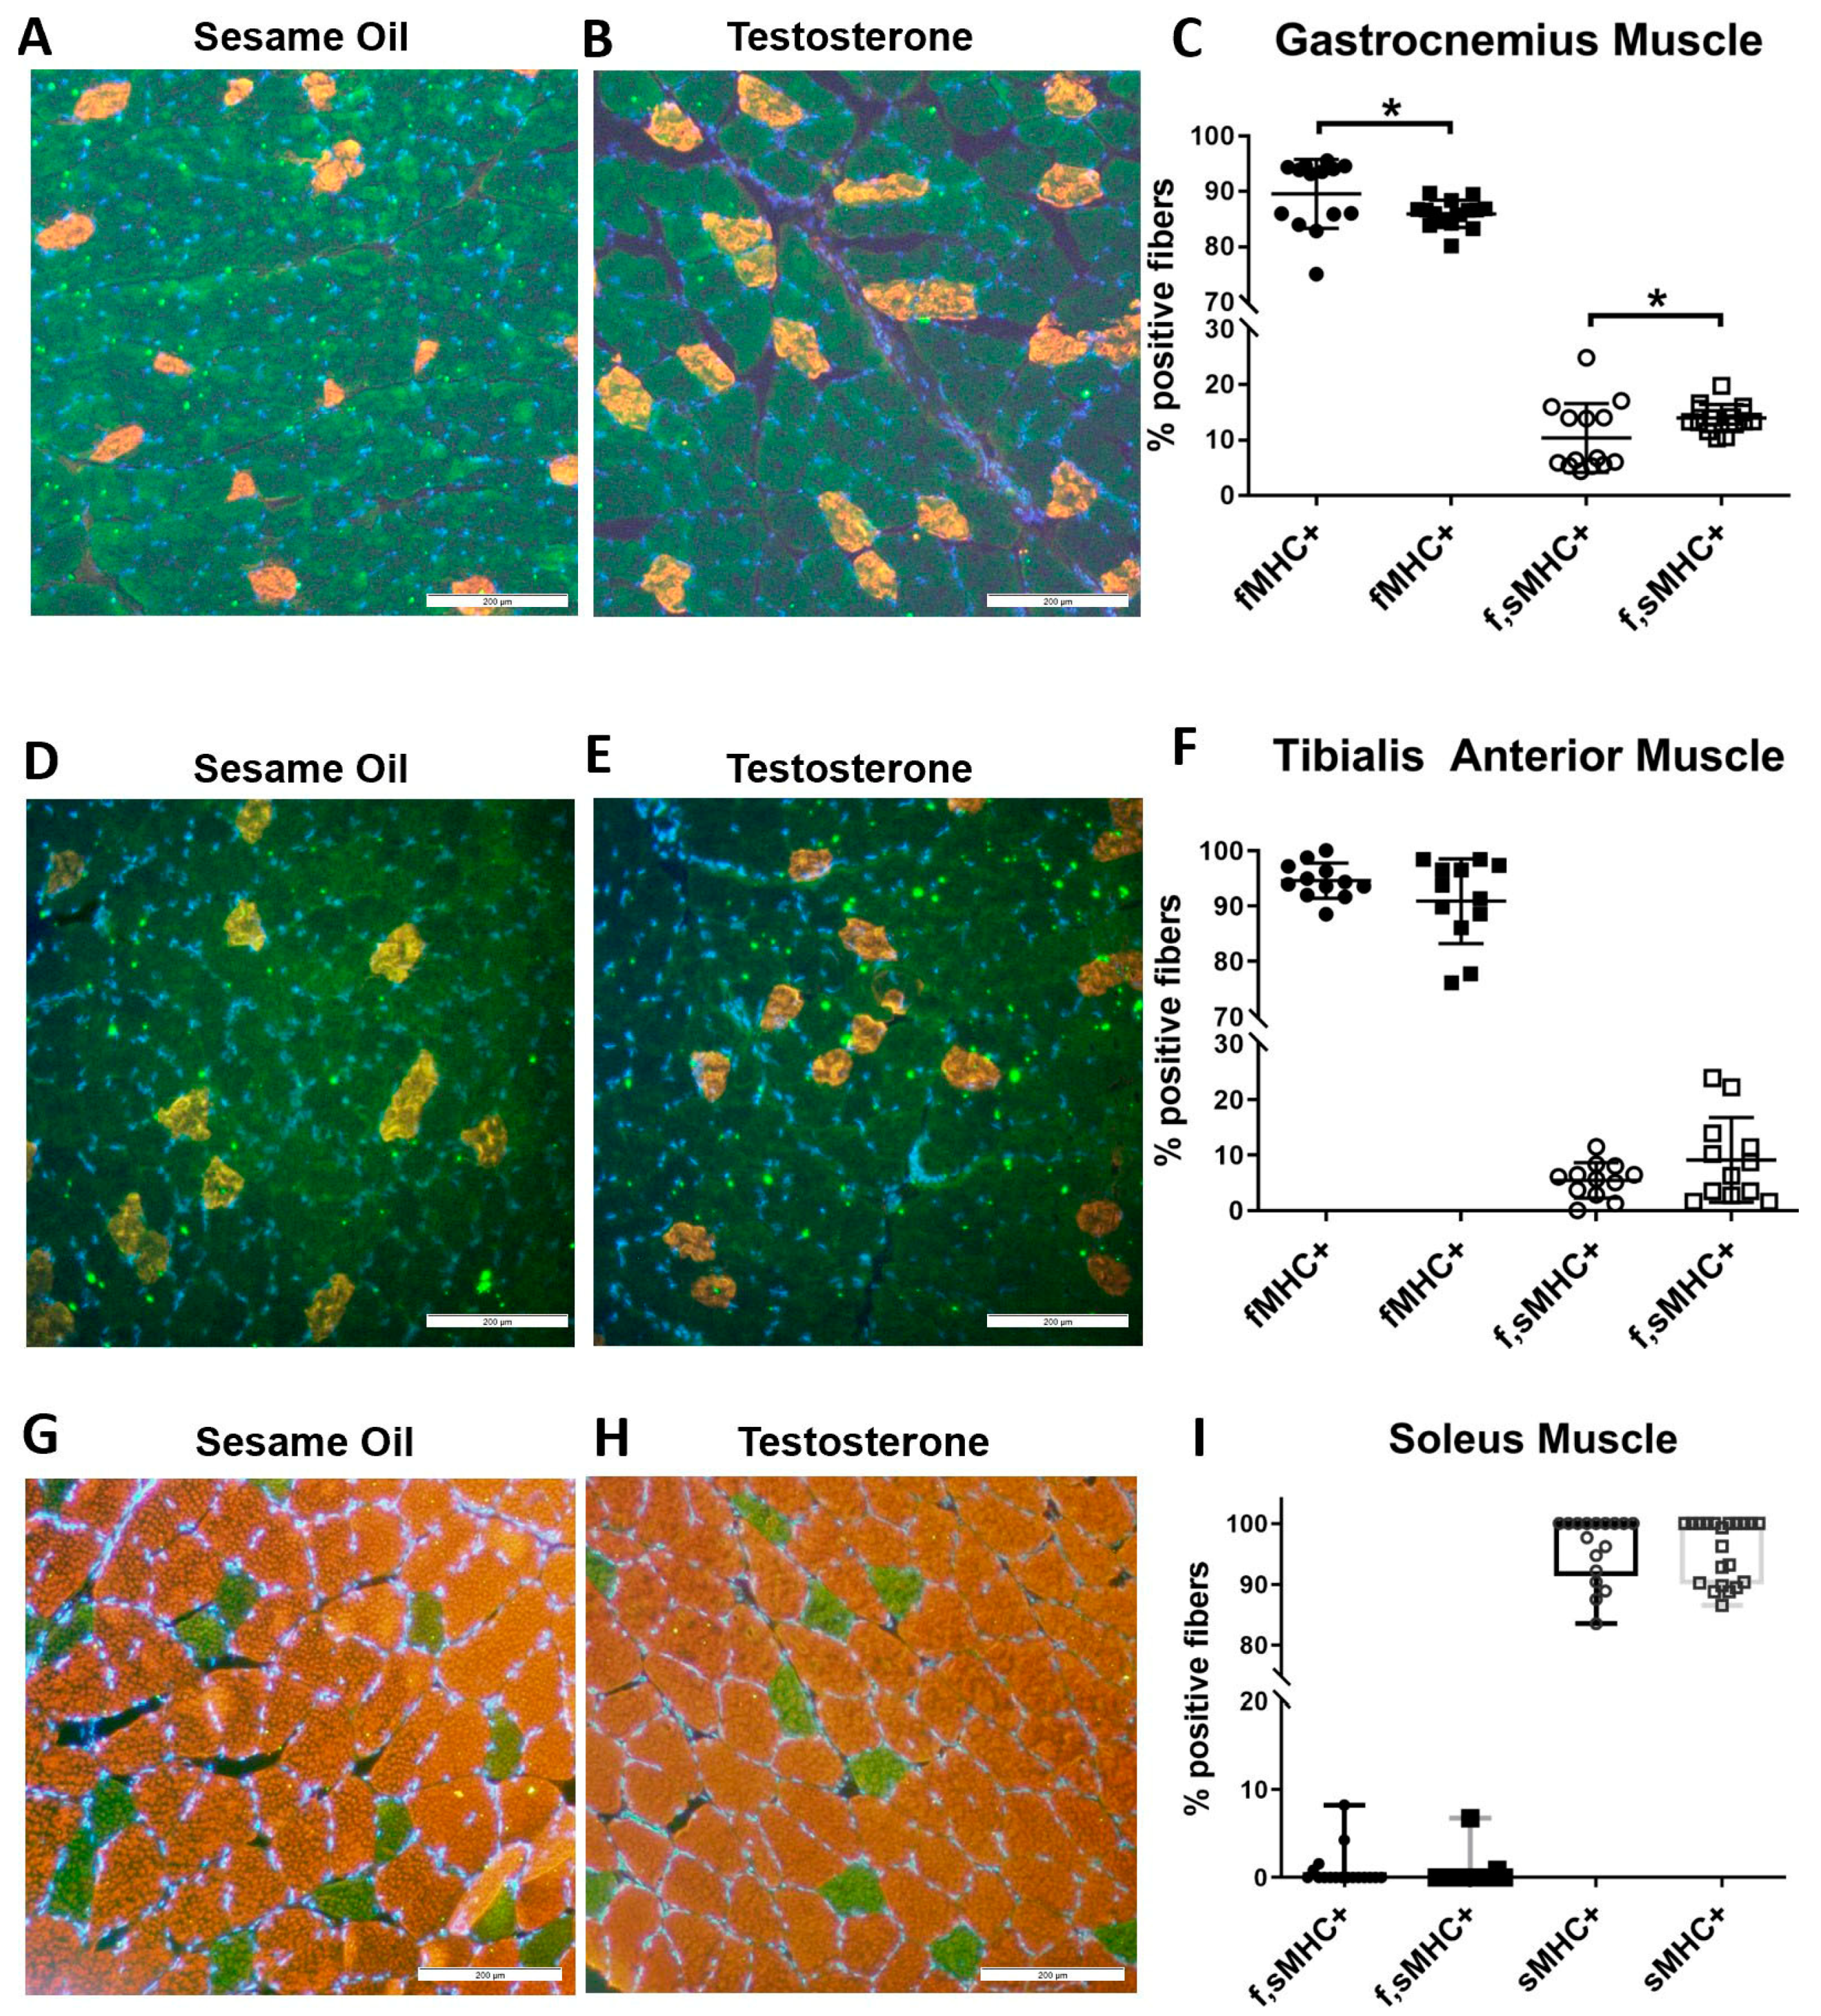
2.5. Hindlimb Muscle Fiber Composition
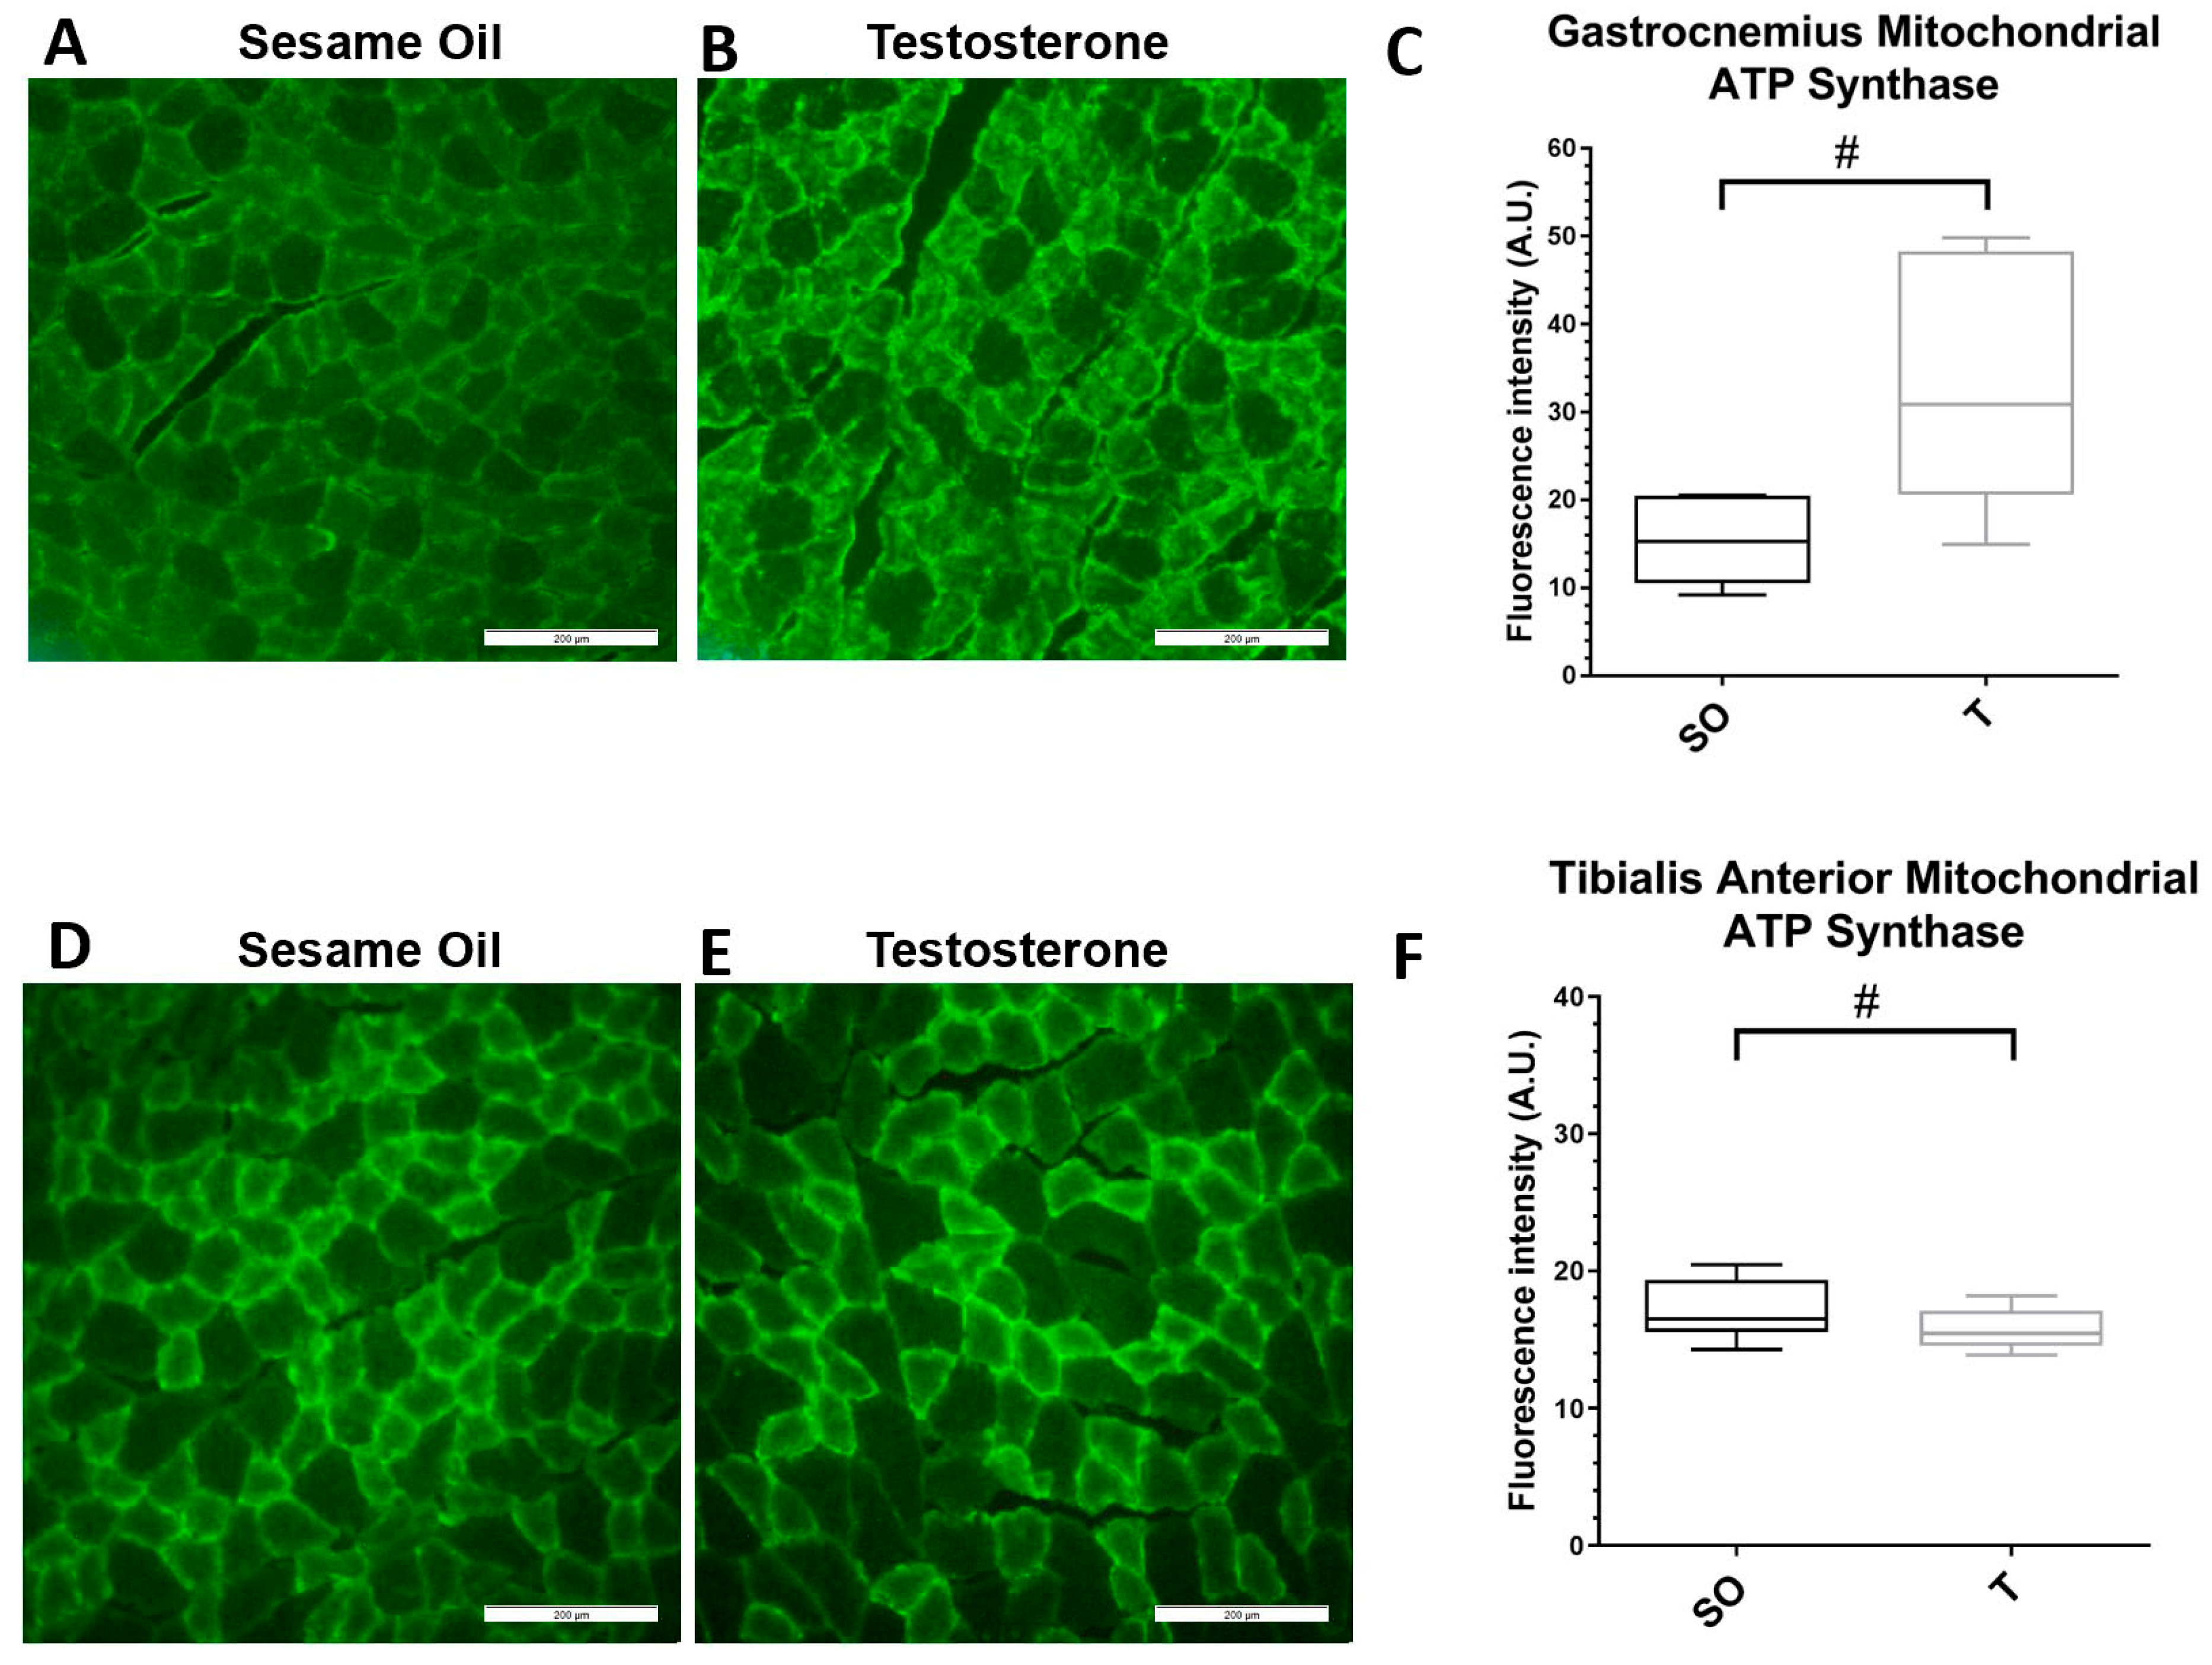
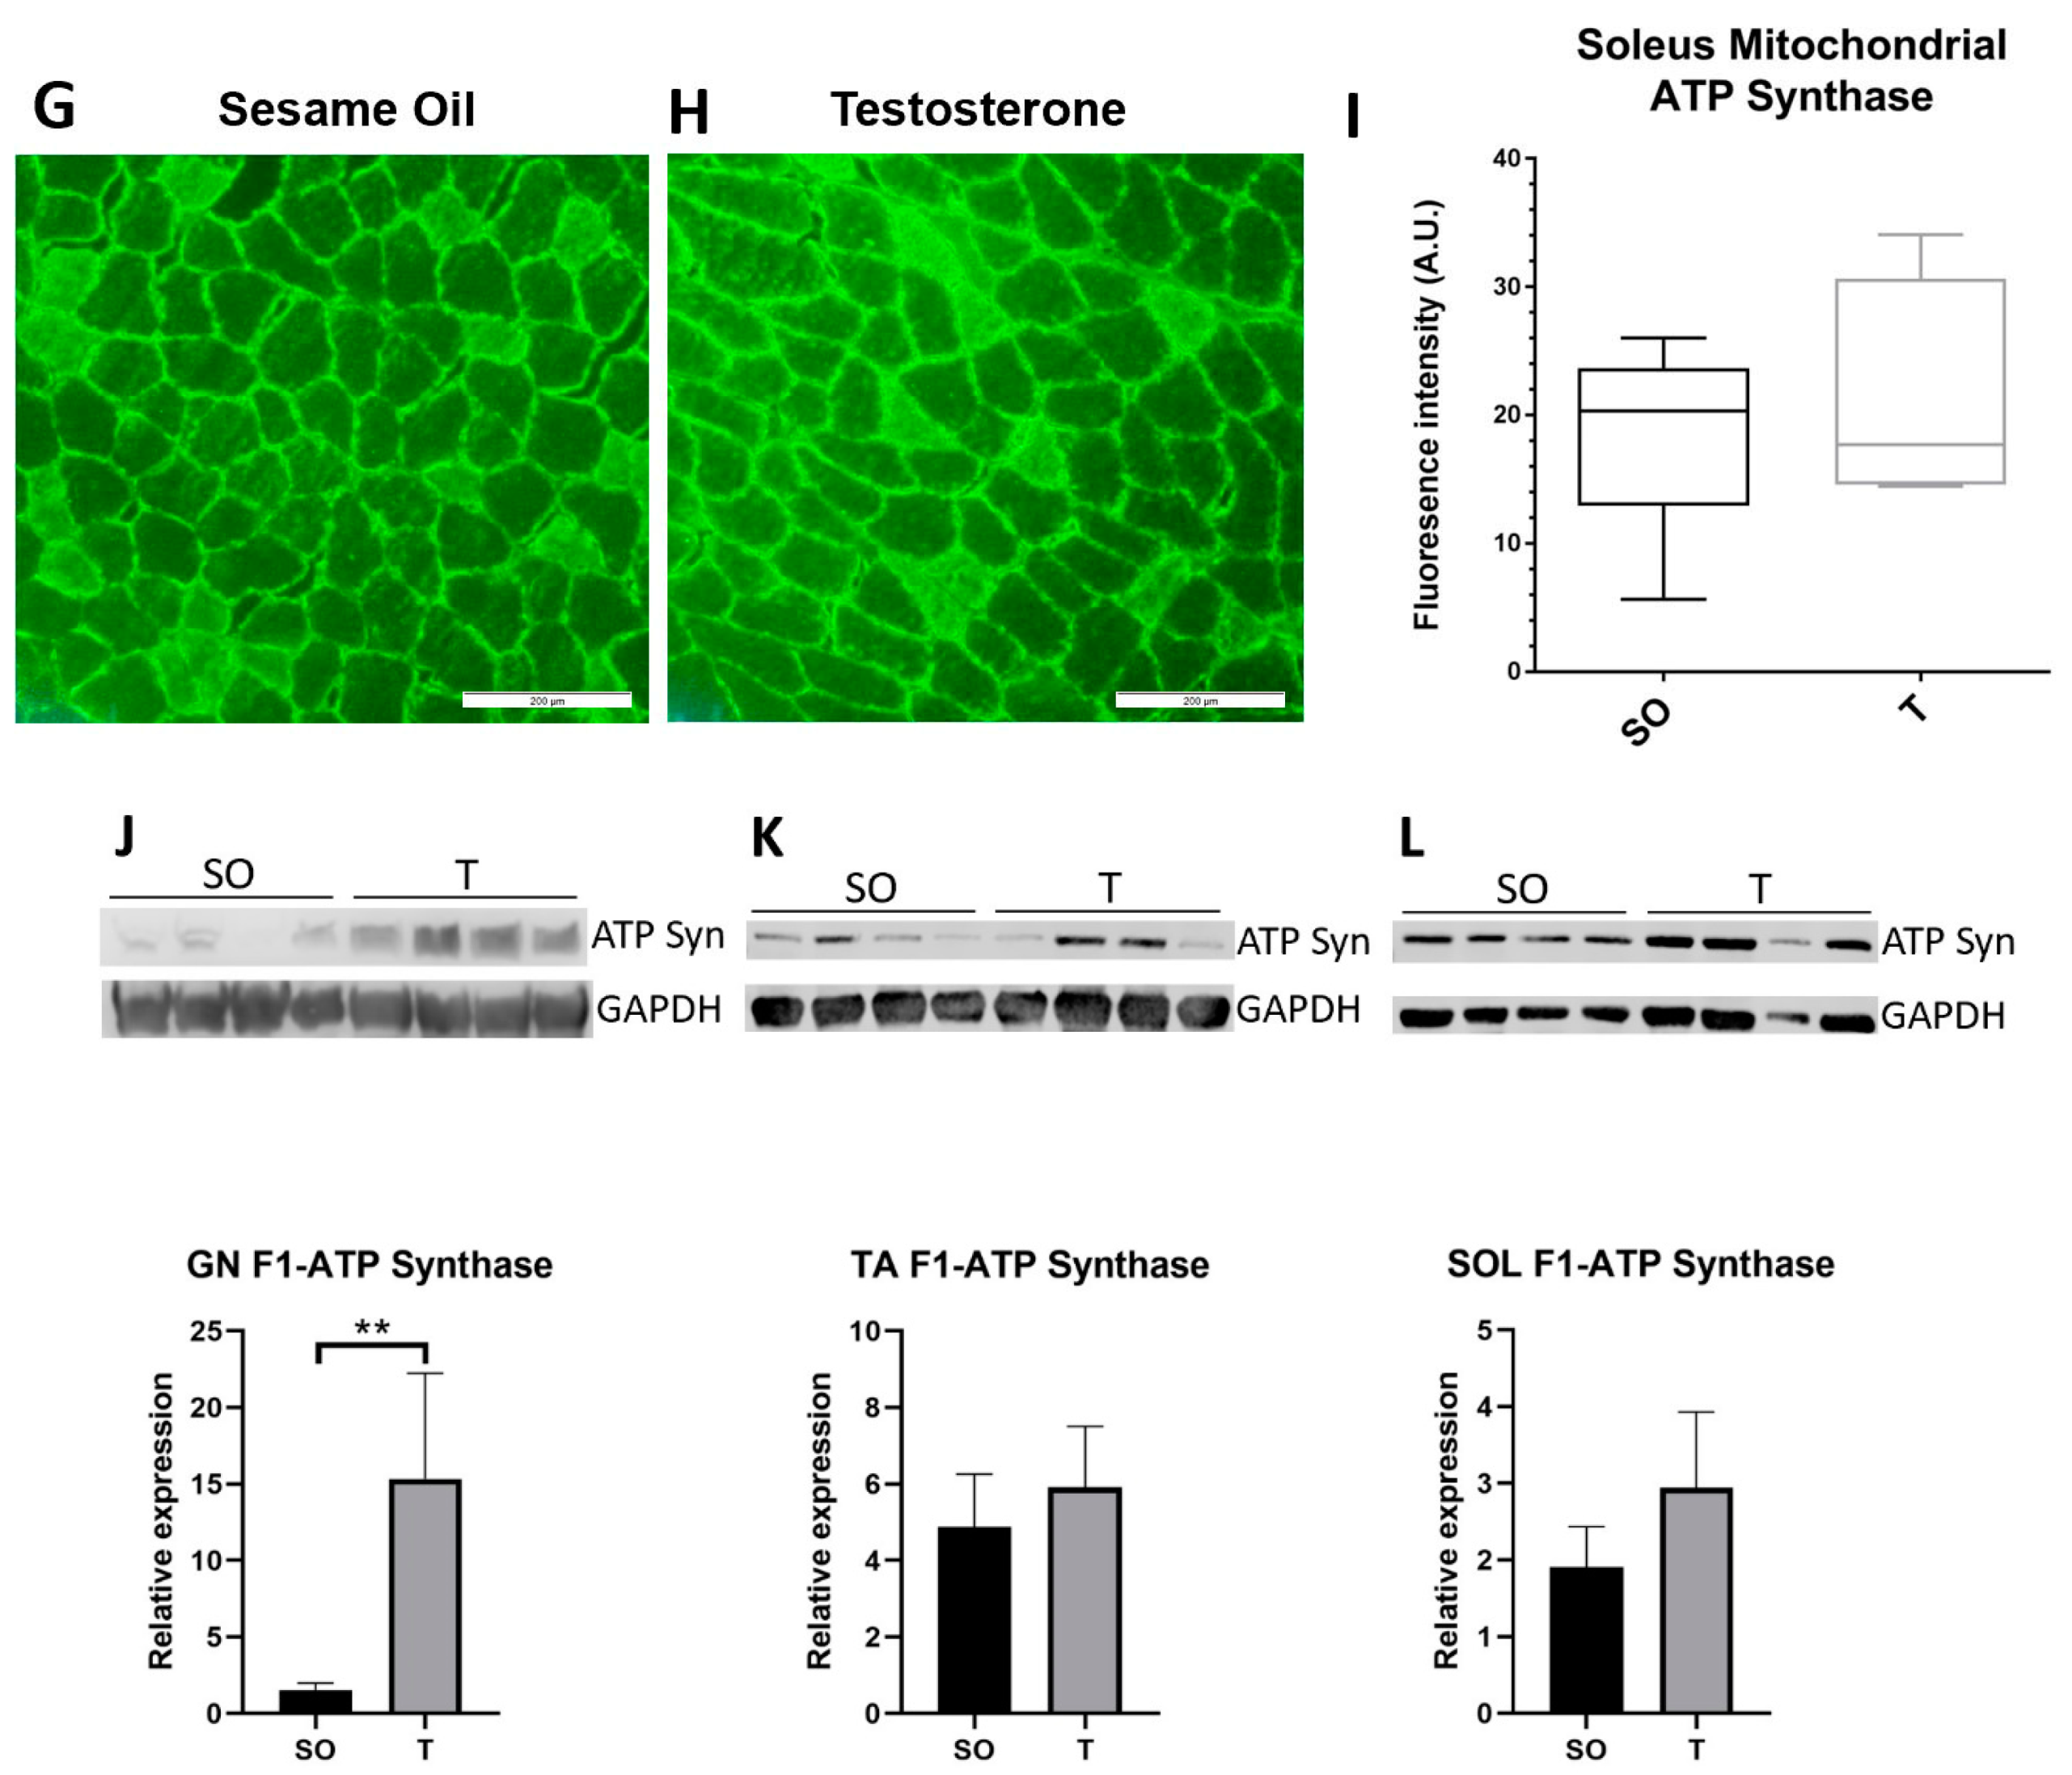
2.6. Mitochondrial Marker ATP Synthase Expression in Hindlimb Muscle
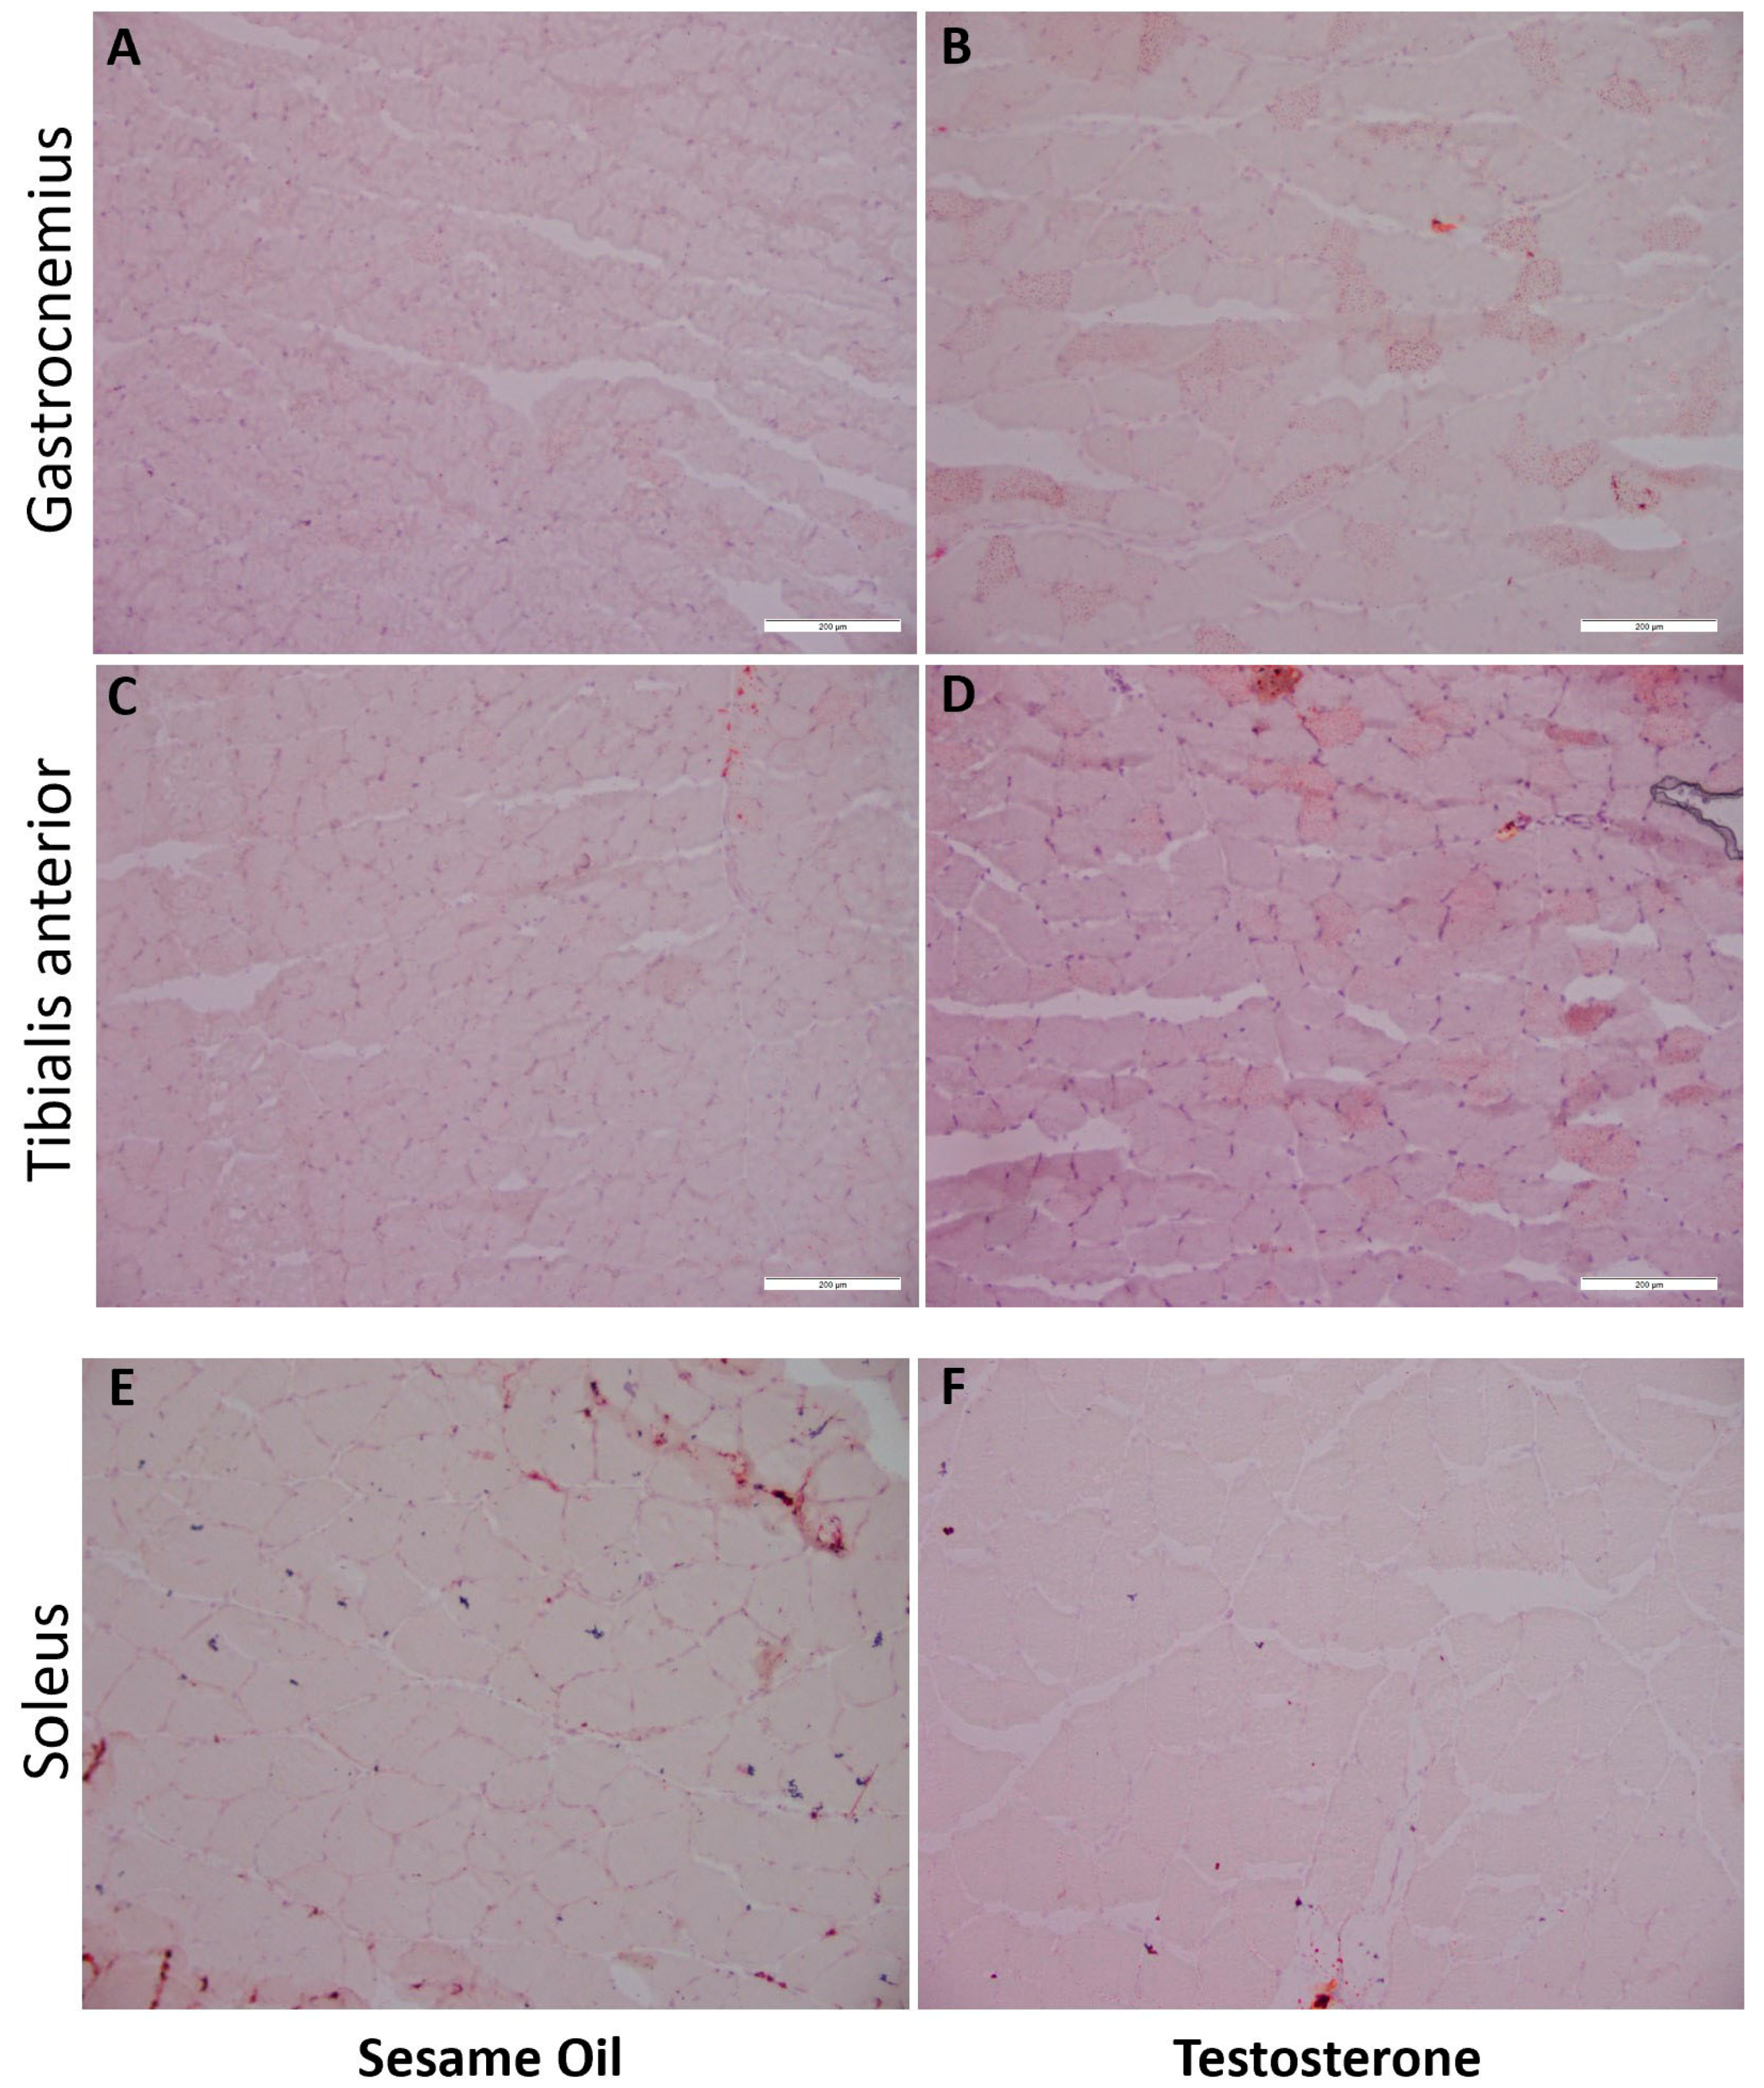
2.7. Lipid Content in Hindlimb Muscle
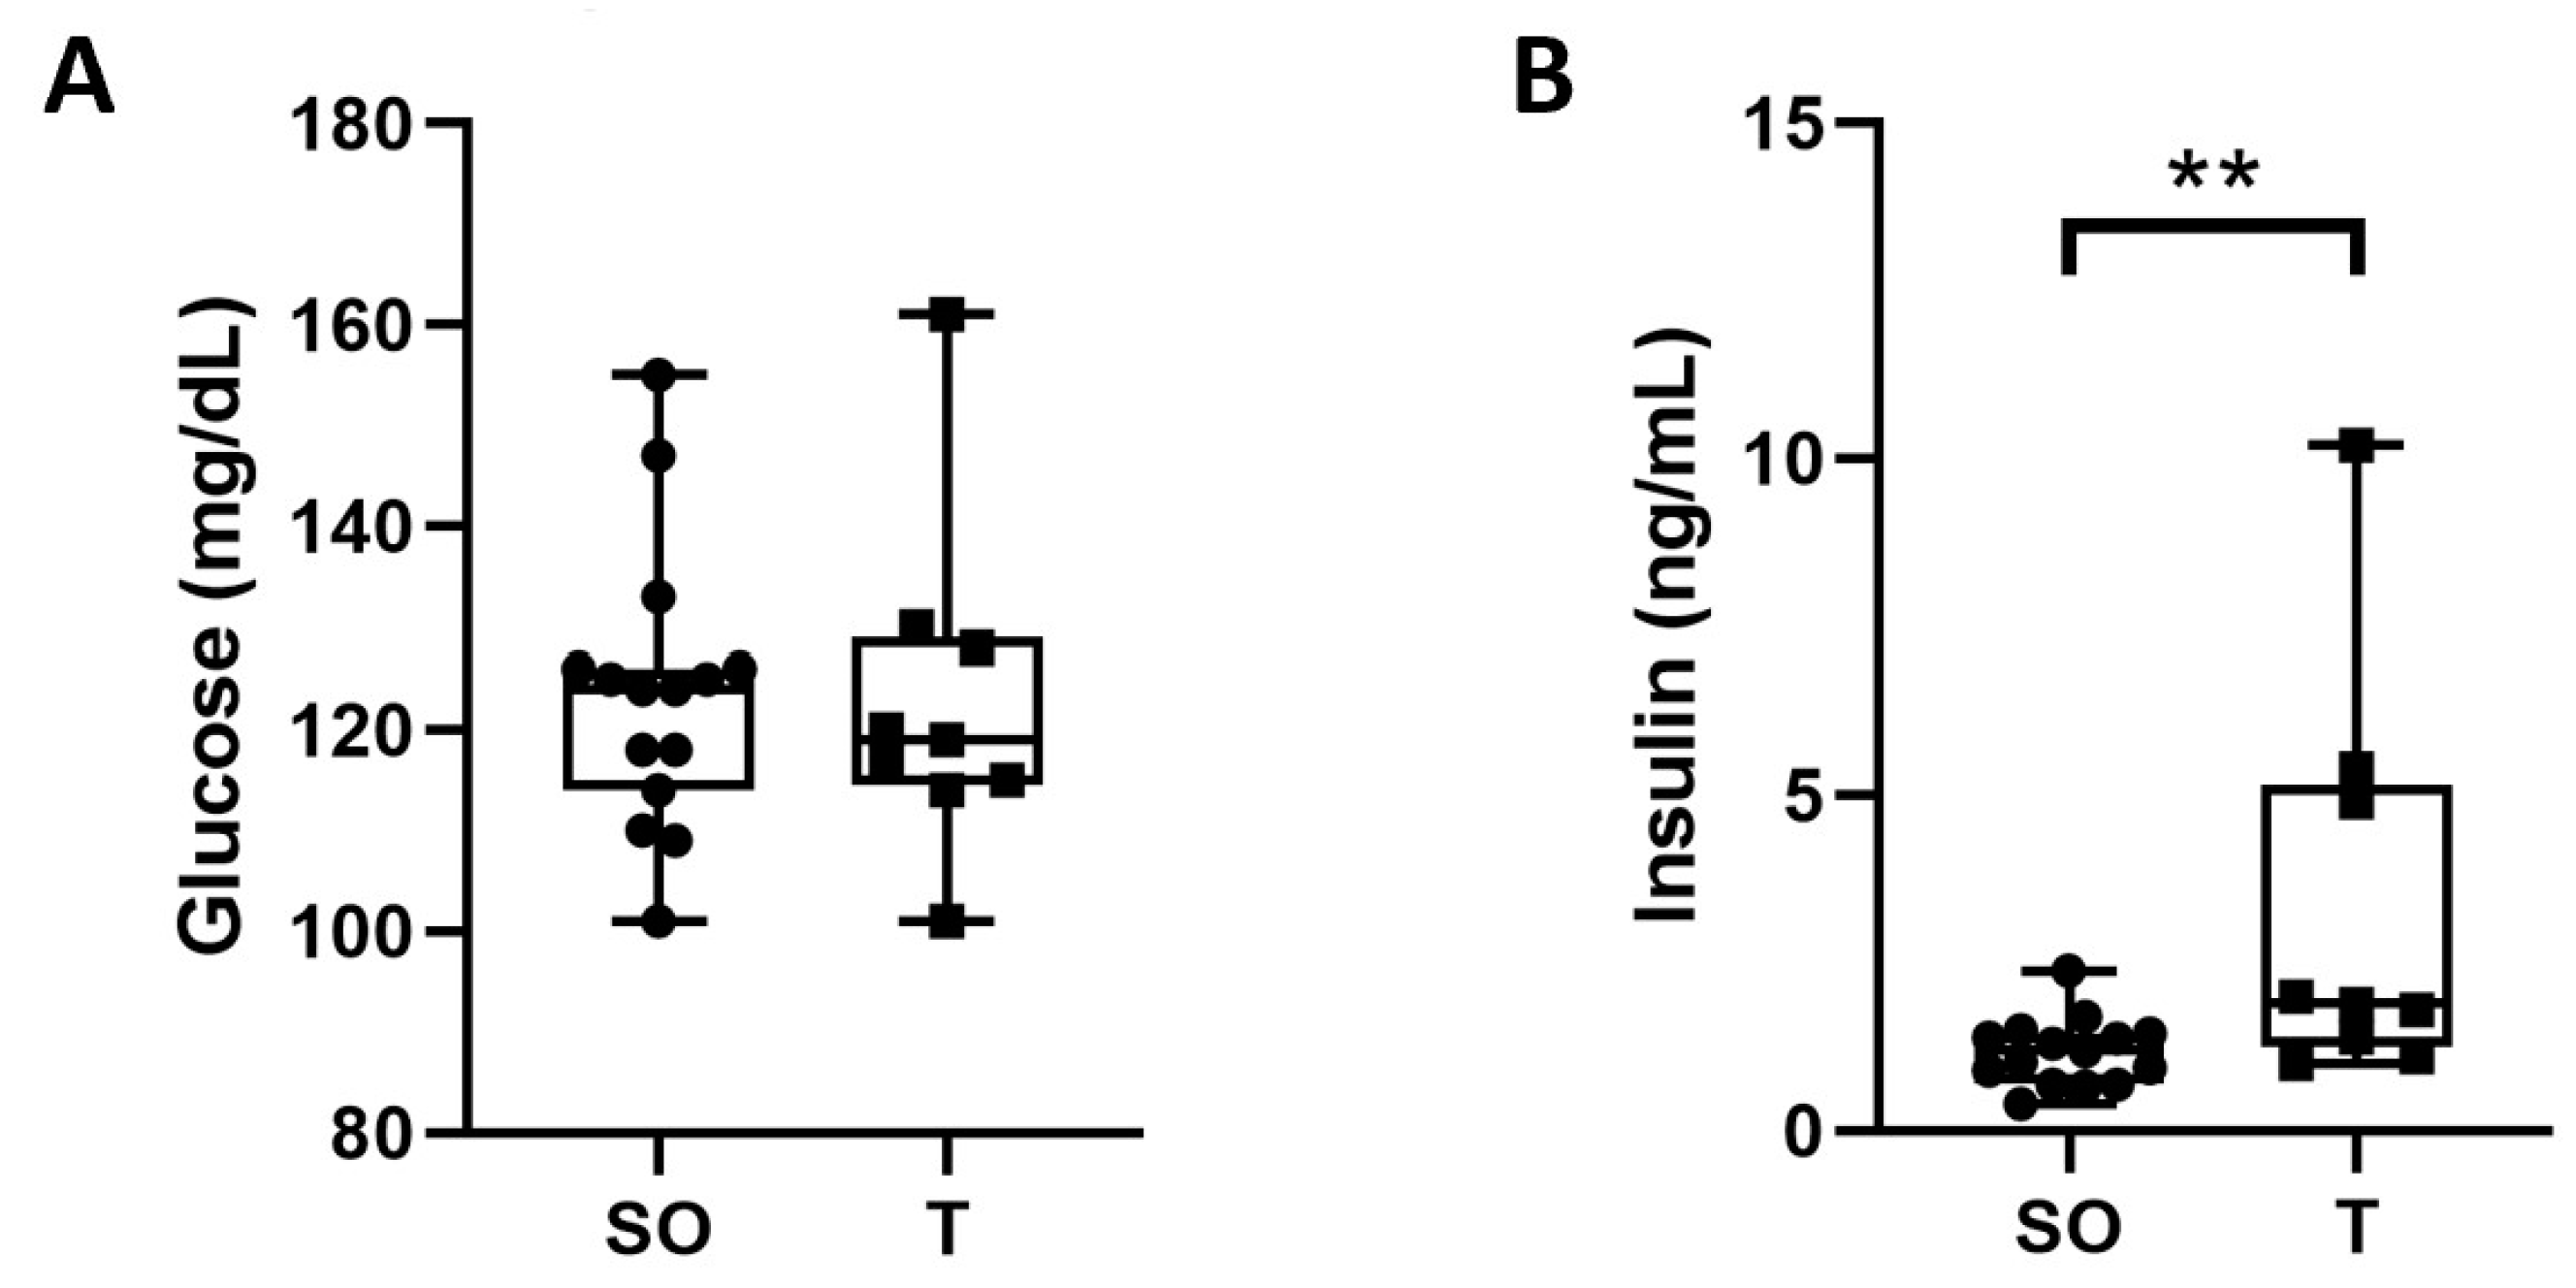
2.8. Fasting Blood Glucose and Serum Insulin
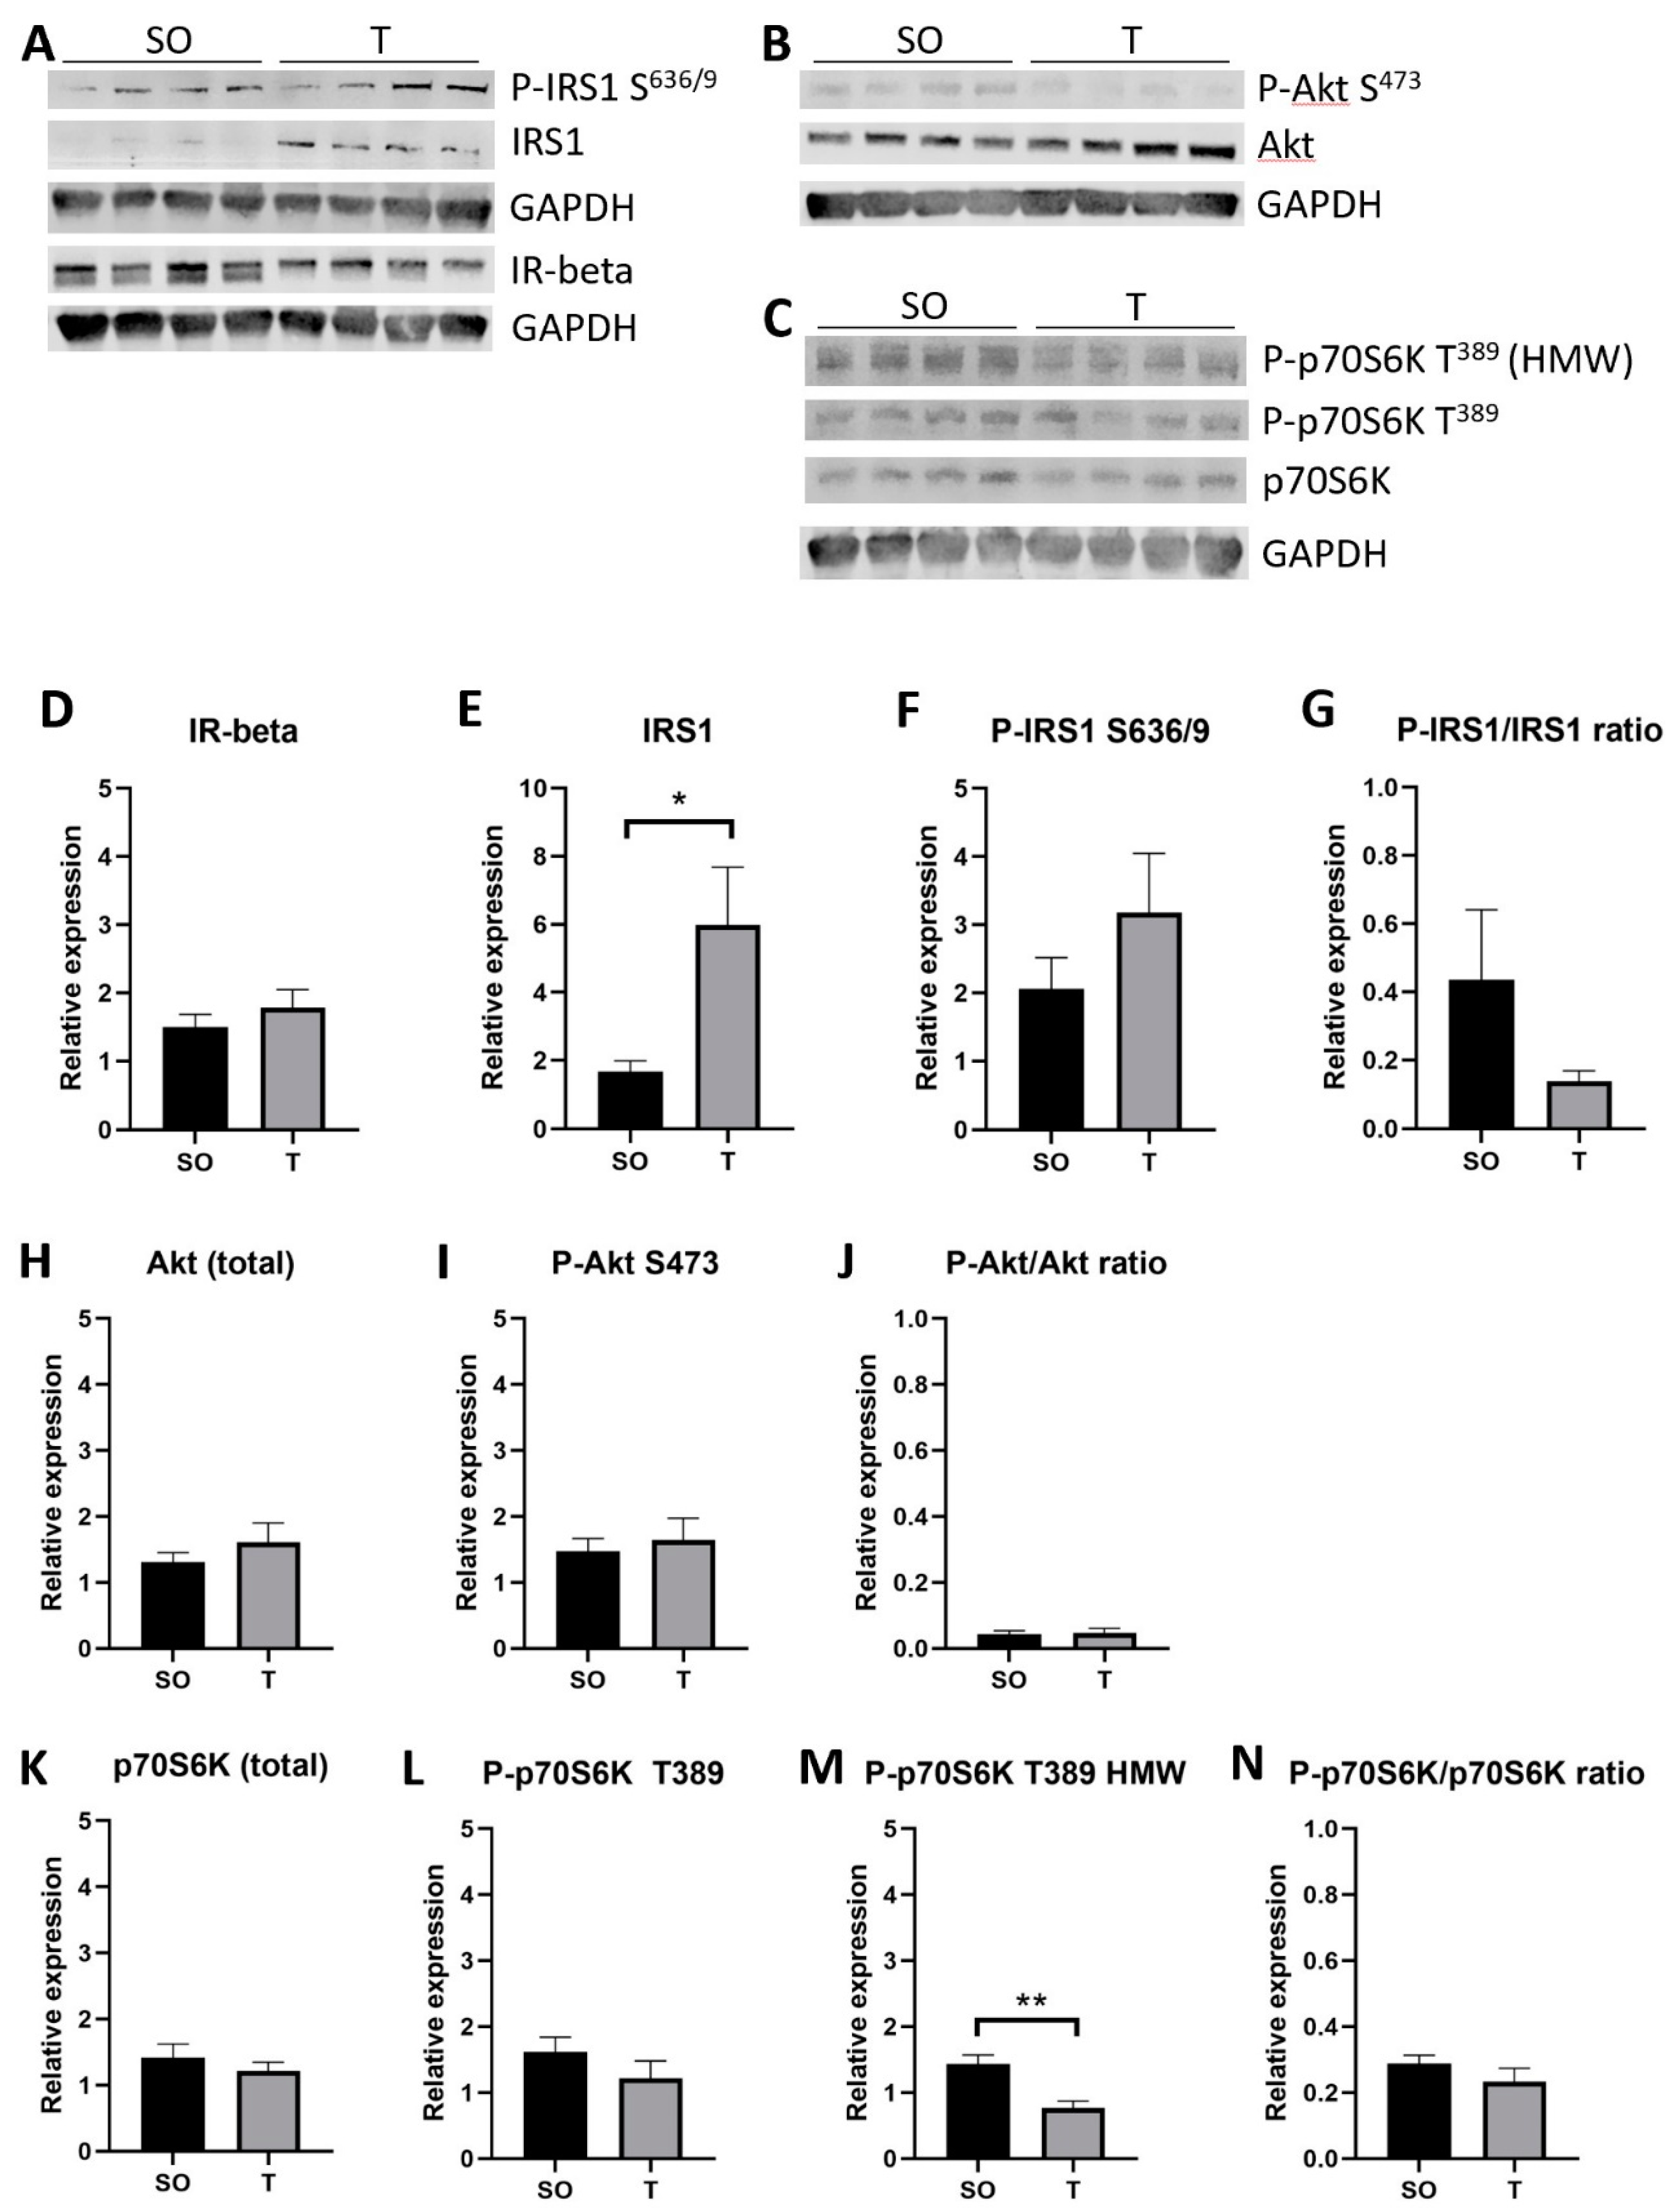
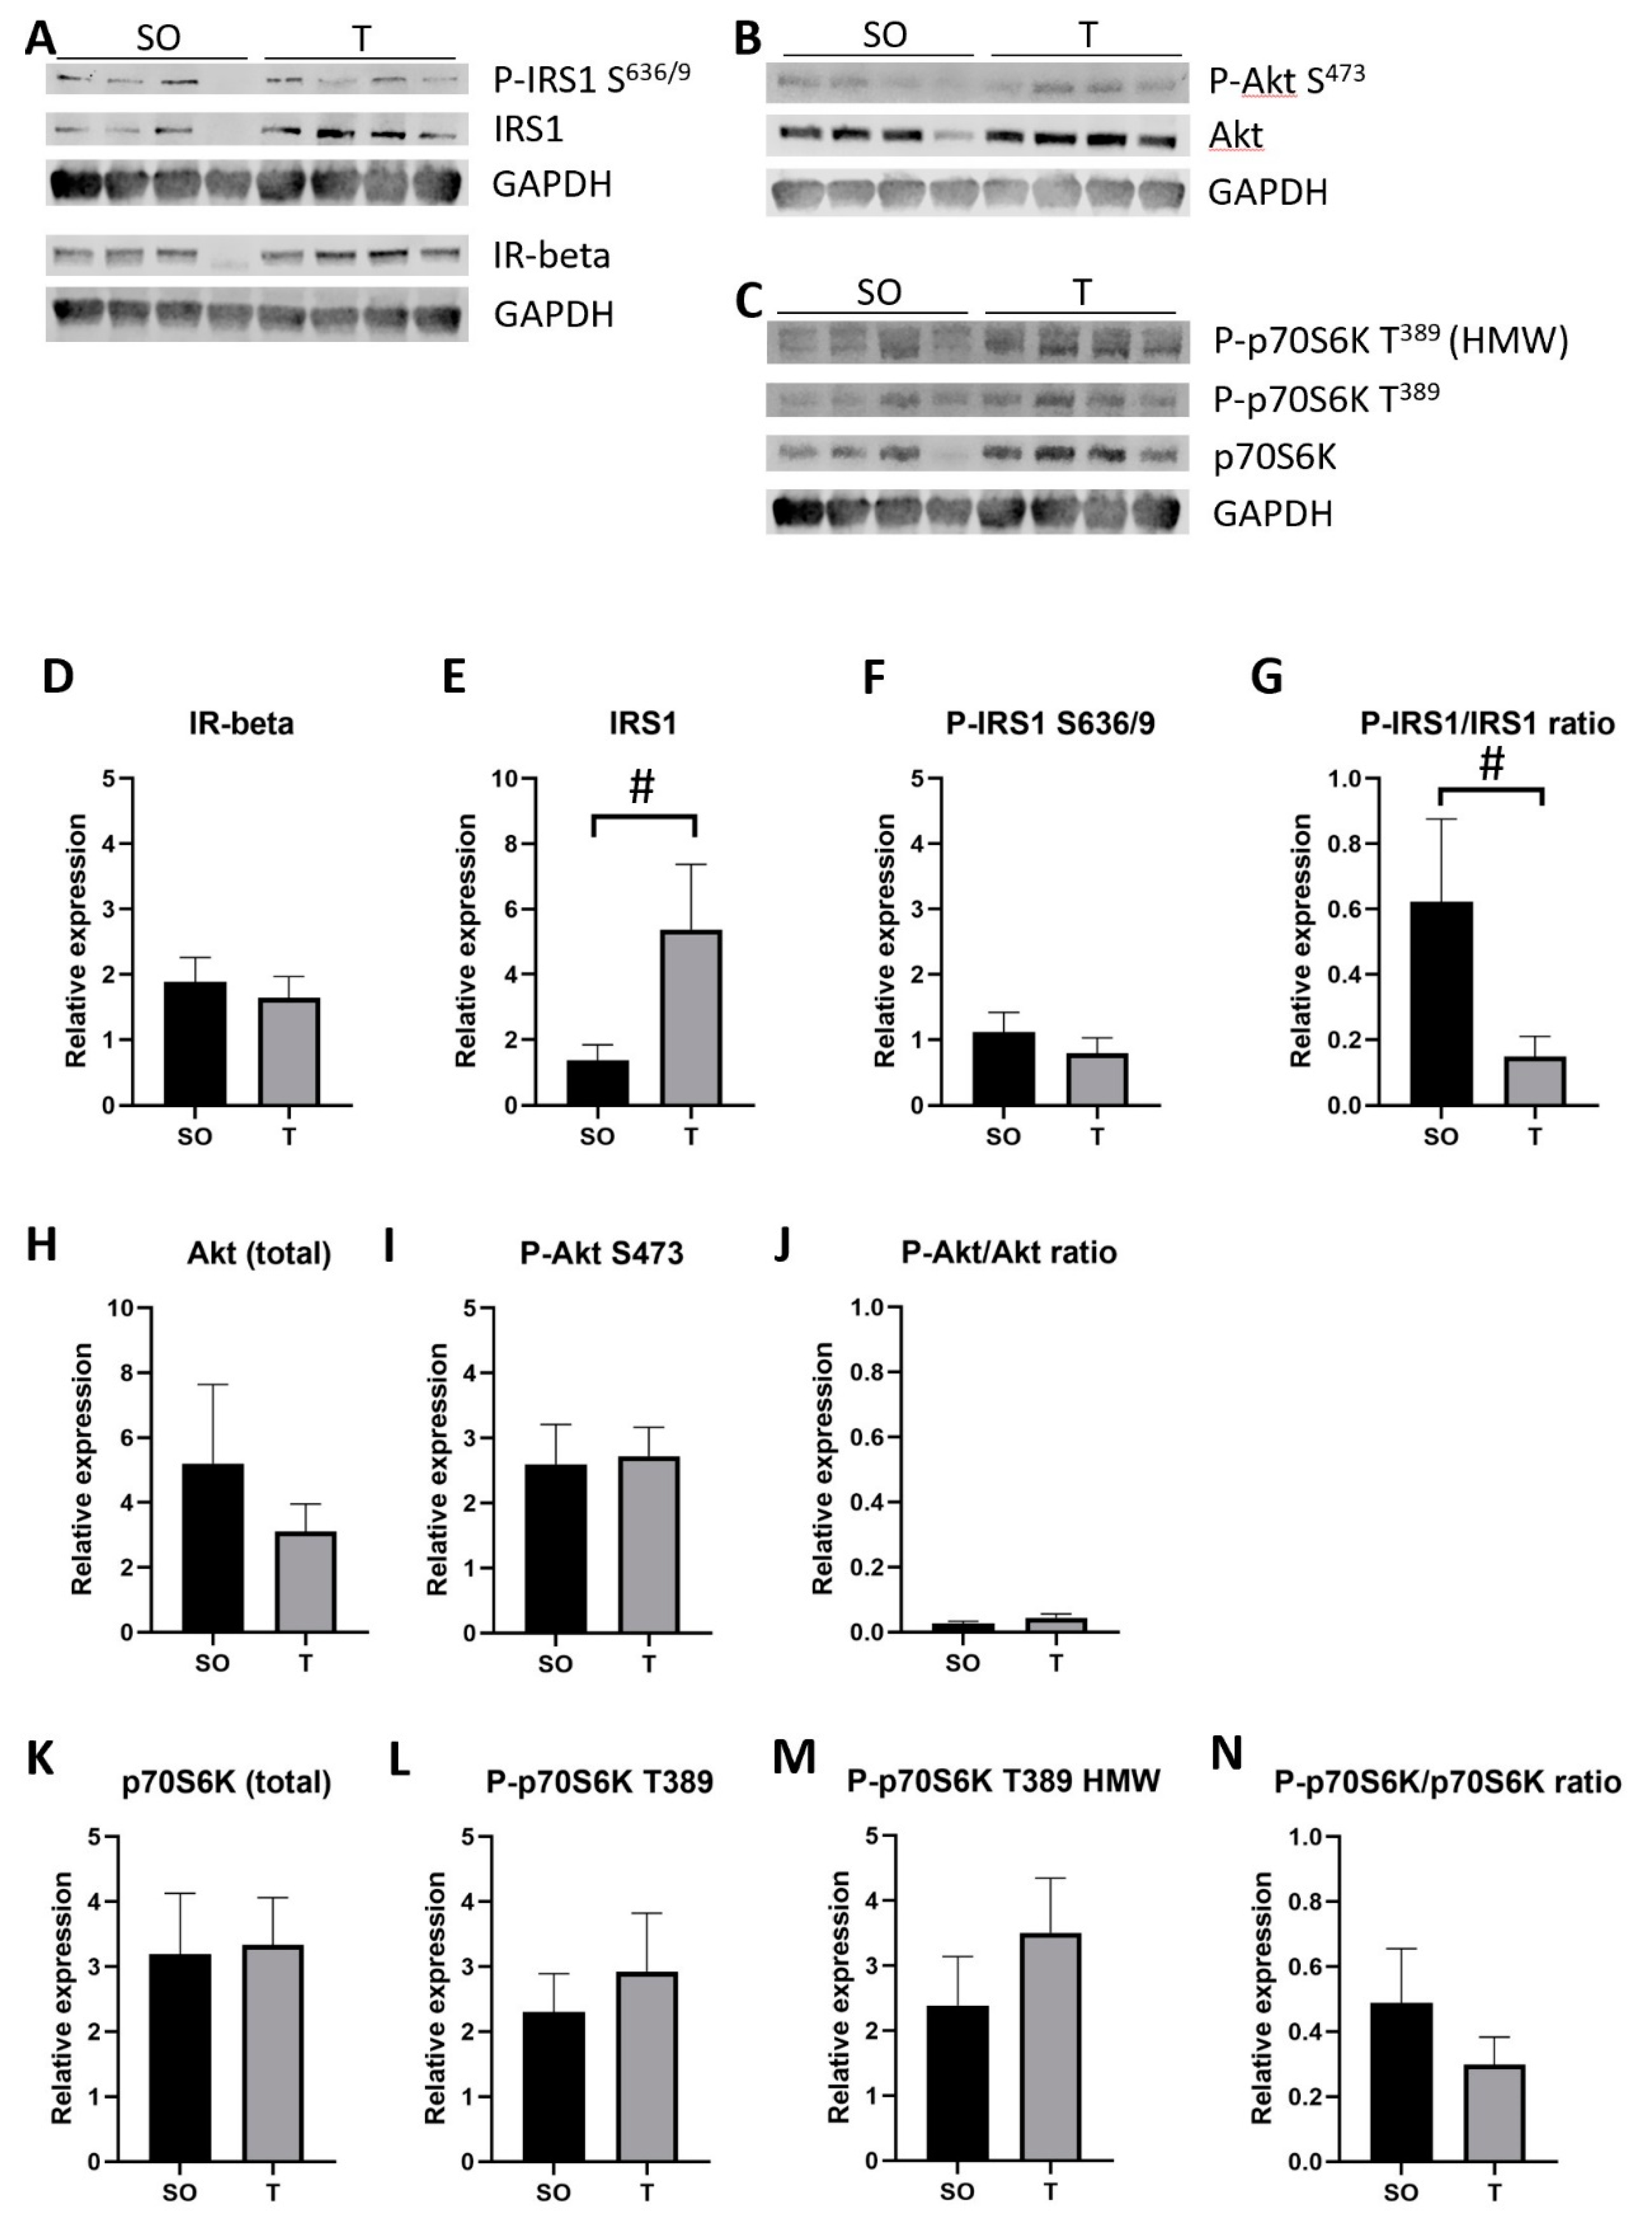
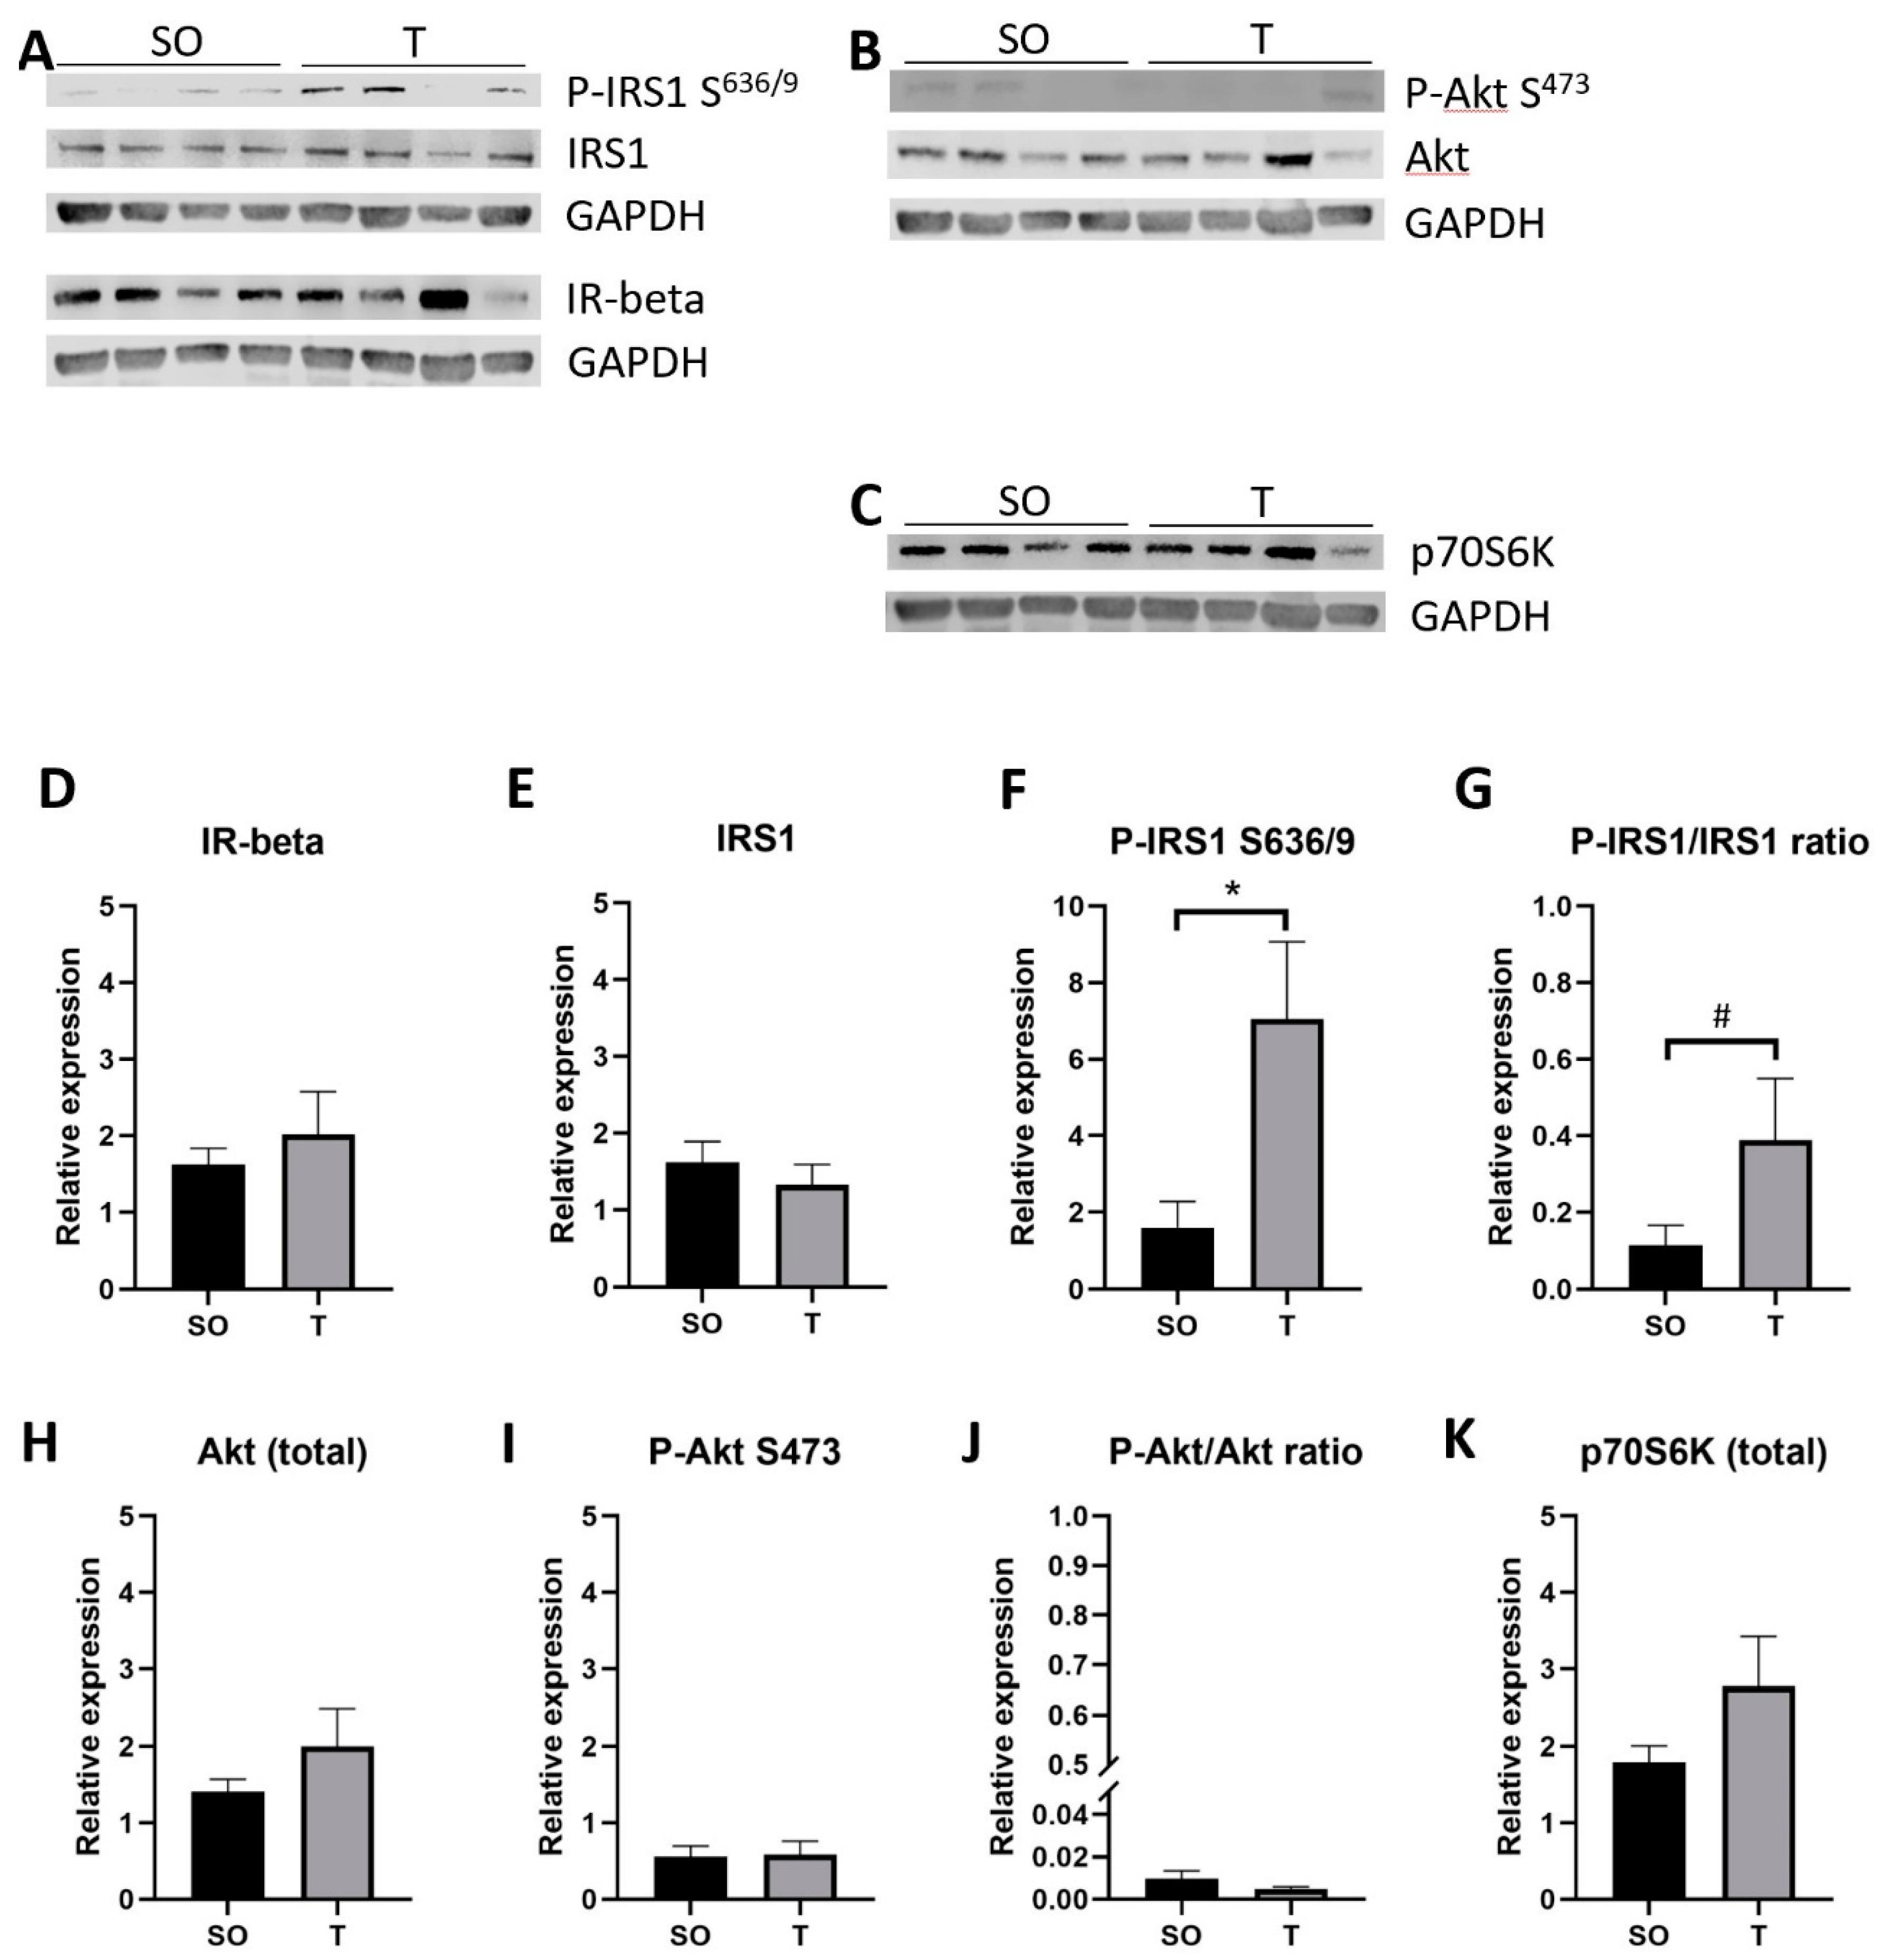
2.9. Expression of Insulin Signaling Proteins in Hindlimb Muscle
3. Discussion
3.1. Body Composition, Muscle Structure, and Function in PCOS
3.2. Exercise in Humans with, and Animal Models for, PCOS
3.3. Muscle Fiber Composition and Metabolic Disorders
3.4. Hyperinsulinemia and Insulin Resistance in PCOS
3.5. Summary and Future Perspectives
4. Materials and Methods
4.1. Materials
4.2. Animals
4.3. Prenatal Androgenization of Rats
4.4. Weekly Body Weight Measurements
4.5. Rota-Rod Treadmill Test
4.6. Blood Collection and Fasting Blood Glucose
4.7. Insulin ELISA
4.8. Tissue Collection
4.9. Histological Examination of Skeletal Muscles
4.10. Measurement of Skeletal Muscle Fiber Cross-Sectional Area
4.11. Immunolabeling and Microscopy
4.12. Skeletal Muscle Fiber Typing
4.13. Oil Red O Staining of Lipids
4.14. Western Blot Analysis
4.15. Statistical Analysis
5. Conclusions
Author Contributions
Funding
Acknowledgments
Conflicts of Interest
Abbreviations
| CSA | cross-sectional area |
| EDL | extensor digitorum longus |
| fMHC | fast isoform of myosin heavy chain |
| fMHC+ | positive for fast isoform of myosin heavy chain |
| GN | gastrocnemius |
| HOMA-IR | homeostatic model assessment of insulin resistance |
| MHC | myosin heavy chain |
| PCOS | polycystic ovary syndrome |
| PNA | prenatally androgenized |
| sMHC | slow isoform of myosin heavy chain |
| sMHC+ | positive for slow isoform of myosin heavy chain |
| SO | sesame oil |
| SOL | soleus |
| T | testosterone |
| TA | tibialis anterior |
References
- Franks, S. Polycystic ovary syndrome. N. Engl. J. Med. 1995, 333, 853–861. [Google Scholar] [CrossRef] [PubMed] [Green Version]
- Teede, H.; Deeks, A.; Moran, L. Polycystic ovary syndrome: A complex condition with psychological, reproductive and metabolic manifestations that impacts on health across the lifespan. BMC Med. 2010, 8, 41. [Google Scholar] [CrossRef] [PubMed] [Green Version]
- Welt, C.K.; Carmina, E. Clinical review: Lifecycle of polycystic ovary syndrome (PCOS): From in utero to menopause. J. Clin. Endocrinol. Metab. 2013, 98, 4629–4638. [Google Scholar] [CrossRef] [PubMed] [Green Version]
- Azziz, R.; Carmina, E.; Dewailly, D.; Diamanti-Kandarakis, E.; Escobar-Morreale, H.F.; Futterweit, W.; Janssen, O.E.; Legro, R.S.; Norman, R.J.; Taylor, A.E.; et al. The Androgen Excess and PCOS Society criteria for the polycystic ovary syndrome: The complete task force report. Fertil. Steril. 2009, 91, 456–488. [Google Scholar] [CrossRef]
- Abbott, D.H.; Tarantal, A.F.; Dumesic, D.A. Fetal, infant, adolescent and adult phenotypes of polycystic ovary syndrome in prenatally androgenized female rhesus monkeys. Am. J. Primatol. 2009, 71, 776–784. [Google Scholar] [CrossRef] [PubMed] [Green Version]
- Abbott, D.H.; Bruns, C.R.; Barnett, D.K.; Dunaif, A.; Goodfriend, T.L.; Dumesic, D.A.; Tarantal, A.F. Experimentally induced gestational androgen excess disrupts glucoregulation in rhesus monkey dams and their female offspring. Am. J. Physiol. Endocrinol. Metab. 2010, 299, E741–E751. [Google Scholar] [CrossRef] [PubMed] [Green Version]
- Roland, A.V.; Nunemaker, C.S.; Keller, S.R.; Moenter, S.M. Prenatal androgen exposure programs metabolic dysfunction in female mice. J. Endocrinol. 2010, 207, 213–223. [Google Scholar] [CrossRef] [Green Version]
- Tyndall, V.; Broyde, M.; Sharpe, R.; Welsh, M.; Drake, A.J.; McNeilly, A.S. Effect of androgen treatment during foetal and/or neonatal life on ovarian function in prepubertal and adult rats. Reproduction 2012, 143, 21–33. [Google Scholar] [CrossRef] [Green Version]
- Nohara, K.; Waraich, R.S.; Liu, S.; Ferron, M.; Waget, A.; Meyers, M.S.; Karsenty, G.; Burcelin, R.; Mauvais-Jarvis, F. Developmental androgen excess programs sympathetic tone and adipose tissue dysfunction and predisposes to a cardiometabolic syndrome in female mice. Am. J. Physiol. Endocrinol. Metab 2013, 304, E1321–E1330. [Google Scholar] [CrossRef] [Green Version]
- Wu, X.Y.; Li, Z.L.; Wu, C.Y.; Liu, Y.M.; Lin, H.; Wang, S.H.; Xiao, W.F. Endocrine traits of polycystic ovary syndrome in prenatally androgenized female Sprague-Dawley rats. Endocr. J. 2010, 57, 201–209. [Google Scholar] [CrossRef] [Green Version]
- Mannerås, L.; Cajander, S.; Holmäng, A.; Seleskovic, Z.; Lystig, T.; Lönn, M.; Stener-Victorin, E. A new rat model exhibiting both ovarian and metabolic characteristics of polycystic ovary syndrome. Endocrinology 2007, 148, 3781–3791. [Google Scholar] [CrossRef] [PubMed] [Green Version]
- Tenover, J.S. Effects of testosterone supplementation in the aging male. J. Clin. Endocrinol. Metab. 1992, 75, 1092–1098. [Google Scholar] [CrossRef] [PubMed]
- Griggs, R.C.; Kingston, W.; Jozefowicz, R.F.; Herr, B.E.; Forbes, G.; Halliday, D. Effect of testosterone on muscle mass and muscle protein synthesis. J. Appl. Physiol. 1989, 66, 498–503. [Google Scholar] [CrossRef] [PubMed] [Green Version]
- Katznelson, L.; Finkelstein, J.S.; Schoenfeld, D.A.; Rosenthal, D.I.; Anderson, E.J.; Klibanski, A. Increase in bone density and lean body mass during testosterone administration in men with acquired hypogonadism. J. Clin. Endocrinol. Metab. 1996, 81, 4358–4365. [Google Scholar] [CrossRef] [PubMed] [Green Version]
- Carmina, E.; Guastella, E.; Longo, R.A.; Rini, G.B.; Lobo, R.A. Correlates of increased lean muscle mass in women with polycystic ovary syndrome. Eur. J. Endocrinol. 2009, 161, 583–589. [Google Scholar] [CrossRef] [Green Version]
- Mario, F.M.; do Amarante, F.; Toscani, M.K.; Spritzer, P.M. Lean muscle mass in classic or ovulatory PCOS: Association with central obesity and insulin resistance. Exp. Clin. Endocrinol. Diabetes 2012, 120, 511–516. [Google Scholar] [CrossRef]
- Aydogdu, A.; Tasci, I.; Kucukerdonmez, O.; Tapan, S.; Aydogdu, S.; Aydogan, U.; Sonmez, A.; Yazici, M.; Azal, O. Increase in subcutaneous adipose tissue and fat free mass in women with polycystic ovary syndrome is related to impaired insulin sensitivity. Gynecol. Endocrinol. 2013, 29, 152–155. [Google Scholar] [CrossRef]
- Kogure, G.S.; Silva, R.C.; Picchi Ramos, F.K.; Miranda-Furtado, C.L.; Lara, L.A.; Ferriani, R.A.; Dos Reis, R.M. Women with polycystic ovary syndrome have greater muscle strength irrespective of body composition. Gynecol. Endocrinol. 2015, 31, 237–242. [Google Scholar] [CrossRef]
- Kogure, G.S.; Piccki, F.K.; Vieira, C.S.; Martins, W.e.P.; dos Reis, R.M. Analysis of muscle strength and body composition of women with polycystic ovary syndrome. Rev. Bras. Ginecol. Obstet. 2012, 34, 316–322. [Google Scholar] [CrossRef]
- Kogure, G.S.; Silva, R.C.; Miranda-Furtado, C.L.; Ribeiro, V.B.; Pedroso, D.C.C.; Melo, A.S.; Ferriani, R.A.; Reis, R.M.D. Hyperandrogenism Enhances Muscle Strength After Progressive Resistance Training, Independent of Body Composition, in Women With Polycystic Ovary Syndrome. J. Strength Cond. Res. 2018, 32, 2642–2651. [Google Scholar] [CrossRef]
- Douchi, T.; Yamamoto, S.; Oki, T.; Maruta, K.; Kuwahata, R.; Nagata, Y. Serum androgen levels and muscle mass in women with polycystic ovary syndrome. Obstet. Gynecol. 1999, 94, 337–340. [Google Scholar] [PubMed]
- Douchi, T.; Oki, T.; Yamasaki, H.; Kuwahata, R.; Nakae, M.; Nagata, Y. Relationship of androgens to muscle size and bone mineral density in women with polycystic ovary syndrome. Obstet. Gynecol. 2001, 98, 445–449. [Google Scholar] [PubMed]
- The Amsterdam ESHRE/ASRM-Sponsored 3rd PCOS Consensus Workshop Group. Consensus on women’s health aspects of polycystic ovary syndrome (PCOS). Hum. Reprod. 2012, 27, 14–24. [Google Scholar] [CrossRef] [PubMed]
- Dunaif, A.; Segal, K.R.; Futterweit, W.; Dobrjansky, A. Profound peripheral insulin resistance, independent of obesity, in polycystic ovary syndrome. Diabetes 1989, 38, 1165–1174. [Google Scholar] [CrossRef]
- Legro, R.S. Insulin resistance in polycystic ovary syndrome: Treating a phenotype without a genotype. Mol. Cell Endocrinol. 1998, 145, 103–110. [Google Scholar] [CrossRef]
- Ciaraldi, T.P.; el-Roeiy, A.; Madar, Z.; Reichart, D.; Olefsky, J.M.; Yen, S.S. Cellular mechanisms of insulin resistance in polycystic ovarian syndrome. J. Clin. Endocrinol. Metab. 1992, 75, 577–583. [Google Scholar] [CrossRef]
- Comerford, K.B.; Almario, R.U.; Kim, K.; Karakas, S.E. Lean mass and insulin resistance in women with polycystic ovary syndrome. Metabolism 2012, 61, 1256–1260. [Google Scholar] [CrossRef]
- Krotkiewski, M. Role of muscle morphology in the development of insulin resistance and metabolic syndrome. Presse Med. 1994, 23, 1393–1399. [Google Scholar]
- Stuart, C.A.; McCurry, M.P.; Marino, A.; South, M.A.; Howell, M.E.; Layne, A.S.; Ramsey, M.W.; Stone, M.H. Slow-twitch fiber proportion in skeletal muscle correlates with insulin responsiveness. J. Clin. Endocrinol. Metab. 2013, 98, 2027–2036. [Google Scholar] [CrossRef] [Green Version]
- Yan, X.; Dai, X.; Wang, J.; Zhao, n.; Cui, Y.; Liu, J. Prenatal androgen excess programs metabolic derangements in pubertal female rats. J. Endocrinol. 2013, 217, 119–129. [Google Scholar] [CrossRef]
- Tehrani, F.R.; Noroozzadeh, M.; Zahediasl, S.; Piryaei, A.; Azizi, F. Introducing a rat model of prenatal androgen-induced polycystic ovary syndrome in adulthood. Exp. Physiol. 2014, 99, 792–801. [Google Scholar] [CrossRef] [PubMed]
- Demissie, M.; Lazic, M.; Foecking, E.M.; Aird, F.; Dunaif, A.; Levine, J.E. Transient prenatal androgen exposure produces metabolic syndrome in adult female rats. Am. J. Physiol. Endocrinol. Metab. 2008, 295, E262–E268. [Google Scholar] [CrossRef] [PubMed] [Green Version]
- Shah, A.B.; Nivar, I.; Speelman, D.L. Elevated androstenedione in young adult but not early adolescent prenatally androgenized female rats. PLoS ONE 2018, 13, e0196862. [Google Scholar] [CrossRef] [PubMed] [Green Version]
- Foecking, E.M.; Szabo, M.; Schwartz, n.B.; Levine, J.E. Neuroendocrine consequences of prenatal androgen exposure in the female rat: Absence of luteinizing hormone surges, suppression of progesterone receptor gene expression, and acceleration of the gonadotropin-releasing hormone pulse generator. Biol. Reprod. 2005, 72, 1475–1483. [Google Scholar] [CrossRef]
- Morrison, S.A.; Goss, A.M.; Azziz, R.; Raju, D.A.; Gower, B.A. Peri-muscular adipose tissue may play a unique role in determining insulin sensitivity/resistance in women with polycystic ovary syndrome. Hum. Reprod. 2017, 32, 185–192. [Google Scholar] [CrossRef] [Green Version]
- Goodarzi, M.O.; Dumesic, D.A.; Chazenbalk, G.; Azziz, R. Polycystic ovary syndrome: Etiology, pathogenesis and diagnosis. Nat. Rev. Endocrinol. 2011, 7, 219–231. [Google Scholar] [CrossRef] [PubMed]
- Livadas, S.; Pappas, C.; Karachalios, A.; Marinakis, E.; Tolia, N.; Drakou, M.; Kaldrymides, P.; Panidis, D.; Diamanti-Kandarakis, E. Prevalence and impact of hyperandrogenemia in 1,218 women with polycystic ovary syndrome. Endocrine 2014, 47, 631–638. [Google Scholar] [CrossRef]
- Pinola, P.; Piltonen, T.T.; Puurunen, J.; Vanky, E.; Sundström-Poromaa, I.; Stener-Victorin, E.; Ruokonen, A.; Puukka, K.; Tapanainen, J.S.; Morin-Papunen, L.C. Androgen Profile Through Life in Women With Polycystic Ovary Syndrome: A Nordic Multicenter Collaboration Study. J. Clin. Endocrinol. Metab. 2015, 100, 3400–3407. [Google Scholar] [CrossRef] [Green Version]
- Douchi, T.; Yoshimitsu, N.; Nagata, Y. Relationships among serum testosterone levels, body fat and muscle mass distribution in women with polycystic ovary syndrome. Endocr. J. 2001, 48, 685–689. [Google Scholar] [CrossRef] [Green Version]
- Thomson, R.L.; Buckley, J.D.; Moran, L.J.; Noakes, M.; Clifton, P.M.; Norman, R.J.; Brinkworth, G.D. Comparison of aerobic exercise capacity and muscle strength in overweight women with and without polycystic ovary syndrome. BJOG 2009, 116, 1242–1250. [Google Scholar] [CrossRef]
- Homa, L.D.; Burger, L.L.; Cuttitta, A.J.; Michele, D.E.; Moenter, S.M. Voluntary Exercise Improves Estrous Cyclicity in Prenatally Androgenized Female Mice Despite Programming Decreased Voluntary Exercise: Implications for Polycystic Ovary Syndrome (PCOS). Endocrinology 2015, 156, 4618–4628. [Google Scholar] [CrossRef] [PubMed]
- Eleftheriadou, M.; Michala, L.; Stefanidis, K.; Iliadis, I.; Lykeridou, A.; Antsaklis, A. Exercise and sedentary habits among adolescents with PCOS. J. Pediatr. Adolesc. Gynecol. 2012, 25, 172–174. [Google Scholar] [CrossRef] [PubMed]
- Cosar, E.; Köken, G.; Sahin, F.K.; Akgün, L.; Uçok, K.; Genç, A.; Yilmazer, M. Resting metabolic rate and exercise capacity in women with polycystic ovary syndrome. Int. J. Gynaecol. Obstet. 2008, 101, 31–34. [Google Scholar] [CrossRef] [PubMed]
- Orio, F.; Giallauria, F.; Palomba, S.; Cascella, T.; Manguso, F.; Vuolo, L.; Russo, T.; Tolino, A.; Lombardi, G.; Colao, A.; et al. Cardiopulmonary impairment in young women with polycystic ovary syndrome. J. Clin. Endocrinol. Metab. 2006, 91, 2967–2971. [Google Scholar] [CrossRef] [Green Version]
- Stuart, C.A.; Howell, M.E.; Yin, D. Overexpression of GLUT5 in diabetic muscle is reversed by pioglitazone. Diabetes Care 2007, 30, 925–931. [Google Scholar] [CrossRef] [Green Version]
- Mårin, P.; Andersson, B.; Krotkiewski, M.; Björntorp, P. Muscle fiber composition and capillary density in women and men with NIDDM. Diabetes Care 1994, 17, 382–386. [Google Scholar] [CrossRef]
- Grulet, H.; Hecart, A.C.; Delemer, B.; Gross, A.; Sulmont, V.; Leutenegger, M.; Caron, J. Roles of LH and insulin resistance in lean and obese polycystic ovary syndrome. Clin. Endocrinol. 1993, 38, 621–626. [Google Scholar] [CrossRef]
- Zhu, S.; Tian, Z.; Torigoe, D.; Zhao, J.; Xie, P.; Sugizaki, T.; Sato, M.; Horiguchi, H.; Terada, K.; Kadomatsu, T.; et al. Aging- and obesity-related peri-muscular adipose tissue accelerates muscle atrophy. PLoS ONE 2019, 14, e0221366. [Google Scholar] [CrossRef] [Green Version]
- Khan, I.M.; Perrard, X.Y.; Brunner, G.; Lui, H.; Sparks, L.M.; Smith, S.R.; Wang, X.; Shi, Z.Z.; Lewis, D.E.; Wu, H.; et al. Intermuscular and perimuscular fat expansion in obesity correlates with skeletal muscle T cell and macrophage infiltration and insulin resistance. Int. J. Obes. 2015, 39, 1607–1618. [Google Scholar] [CrossRef] [Green Version]
- Goss, A.M.; Gower, B.A. Insulin sensitivity is associated with thigh adipose tissue distribution in healthy postmenopausal women. Metabolism 2012, 61, 1817–1823. [Google Scholar] [CrossRef] [Green Version]
- Goodpaster, B.H.; Thaete, F.L.; Kelley, D.E. Thigh adipose tissue distribution is associated with insulin resistance in obesity and in type 2 diabetes mellitus. Am. J. Clin. Nutr. 2000, 71, 885–892. [Google Scholar] [CrossRef] [PubMed] [Green Version]
- Komiya, H.; Mori, Y.; Yokose, T.; Kurokawa, N.; Horie, N.; Tajima, N. Effect of intramuscular fat difference on glucose and insulin reaction in oral glucose tolerance test. J. Atheroscler. Thromb. 2006, 13, 136–142. [Google Scholar] [CrossRef] [PubMed] [Green Version]
- Van der Kolk, B.W.; Goossens, G.H.; Jocken, J.W.; Blaak, E.E. Altered skeletal muscle fatty acid handling is associated with the degree of insulin resistance in overweight and obese humans. Diabetologia 2016, 59, 2686–2696. [Google Scholar] [CrossRef] [Green Version]
- Ingram, K.H.; Hill, H.; Moellering, D.R.; Hill, B.G.; Lara-Castro, C.; Newcomer, B.; Brandon, L.J.; Ingalls, C.P.; Penumetcha, M.; Rupp, J.C.; et al. Skeletal muscle lipid peroxidation and insulin resistance in humans. J. Clin. Endocrinol. Metab. 2012, 97, E1182–E1186. [Google Scholar] [CrossRef] [Green Version]
- Pillon, n.J.; Croze, M.L.; Vella, R.E.; Soulère, L.; Lagarde, M.; Soulage, C.O. The lipid peroxidation by-product 4-hydroxy-2-nonenal (4-HNE) induces insulin resistance in skeletal muscle through both carbonyl and oxidative stress. Endocrinology 2012, 153, 2099–2111. [Google Scholar] [CrossRef] [PubMed]
- Soulage, C.O.; Sardón Puig, L.; Soulère, L.; Zarrouki, B.; Guichardant, M.; Lagarde, M.; Pillon, N.J. Skeletal muscle insulin resistance is induced by 4-hydroxy-2-hexenal, a by-product of n-3 fatty acid peroxidation. Diabetologia 2018, 61, 688–699. [Google Scholar] [CrossRef] [Green Version]
- Prasannarong, M.; Santos, F.R.; Hooshmand, P.; Giovannini, F.J.; Henriksen, E.J. The lipid peroxidation end-product and oxidant 4-hydroxynonenal induces insulin resistance in rat slow-twitch skeletal muscle. Arch. Physiol. Biochem. 2014, 120, 22–28. [Google Scholar] [CrossRef]
- Noroozzadeh, M.; Ramezani Tehrani, F.; Sedaghat, K.; Godini, A.; Azizi, F. The impact of prenatal exposure to a single dose of testosterone on insulin resistance, glucose tolerance and lipid profile of female rat’s offspring in adulthood. J. Endocrinol. Investig. 2015, 38, 489–495. [Google Scholar] [CrossRef]
- Ressler, I.B.; Grayson, B.E.; Ulrich-Lai, Y.M.; Seeley, R.J. Diet-induced obesity exacerbates metabolic and behavioral effects of polycystic ovary syndrome in a rodent model. Am. J. Physiol. Endocrinol. Metab. 2015, 308, E1076–E1084. [Google Scholar] [CrossRef] [Green Version]
- Kauffman, A.S.; Thackray, V.G.; Ryan, G.E.; Tolson, K.P.; Glidewell-Kenney, C.A.; Semaan, S.J.; Poling, M.C.; Iwata, N.; Breen, K.M.; Duleba, A.J.; et al. A Novel Letrozole Model Recapitulates Both the Reproductive and Metabolic Phenotypes of Polycystic Ovary Syndrome in Female Mice. Biol. Reprod. 2015, 93, 69. [Google Scholar] [CrossRef]
- Padmanabhan, V.; Veiga-Lopez, A.; Abbott, D.H.; Recabarren, S.E.; Herkimer, C. Developmental programming: Impact of prenatal testosterone excess and postnatal weight gain on insulin sensitivity index and transfer of traits to offspring of overweight females. Endocrinology 2010, 151, 595–605. [Google Scholar] [CrossRef] [PubMed] [Green Version]
- Skarra, D.V.; Hernández-Carretero, A.; Rivera, A.J.; Anvar, A.R.; Thackray, V.G. Hyperandrogenemia Induced by Letrozole Treatment of Pubertal Female Mice Results in Hyperinsulinemia Prior to Weight Gain and Insulin Resistance. Endocrinology 2017, 158, 2988–3003. [Google Scholar] [CrossRef] [PubMed]
- Diamanti-Kandarakis, E. Insulin resistance in PCOS. Endocrine 2006, 30, 13–17. [Google Scholar] [CrossRef]
- Manco, M.; Castagneto-Gissey, L.; Arrighi, E.; Carnicelli, A.; Brufani, C.; Luciano, R.; Mingrone, G. Insulin dynamics in young women with polycystic ovary syndrome and normal glucose tolerance across categories of body mass index. PLoS ONE 2014, 9, e92995. [Google Scholar] [CrossRef]
- Barbieri, R.L.; Smith, S.; Ryan, K.J. The role of hyperinsulinemia in the pathogenesis of ovarian hyperandrogenism. Fertil. Steril. 1988, 50, 197–212. [Google Scholar]
- Franks, S.; Gilling-Smith, C.; Watson, H.; Willis, D. Insulin action in the normal and polycystic ovary. Endocrinol. Metab. Clin. N. Am. 1999, 28, 361–378. [Google Scholar] [CrossRef]
- Barbieri, R.L.; Makris, A.; Randall, R.W.; Daniels, G.; Kistner, R.W.; Ryan, K.J. Insulin stimulates androgen accumulation in incubations of ovarian stroma obtained from women with hyperandrogenism. J. Clin. Endocrinol. Metab. 1986, 62, 904–910. [Google Scholar] [CrossRef]
- Mauras, n.; Welch, S.; Rini, A.; Haymond, M.W. Ovarian hyperandrogenism is associated with insulin resistance to both peripheral carbohydrate and whole-body protein metabolism in postpubertal young females: A metabolic study. J. Clin. Endocrinol. Metab. 1998, 83, 1900–1905. [Google Scholar] [CrossRef] [PubMed] [Green Version]
- Nestler, J.E. Insulin regulation of human ovarian androgens. Hum. Reprod. 1997, 12 (Suppl. 1), 53–62. [Google Scholar] [CrossRef] [Green Version]
- Eriksen, M.; Pørneki, A.D.; Skov, V.; Burns, J.S.; Beck-Nielsen, H.; Glintborg, D.; Gaster, M. Insulin resistance is not conserved in myotubes established from women with PCOS. PLoS ONE 2010, 5, e14469. [Google Scholar] [CrossRef]
- Allemand, M.C.; Irving, B.A.; Asmann, Y.W.; Klaus, K.A.; Tatpati, L.; Coddington, C.C.; Nair, K.S. Effect of testosterone on insulin stimulated IRS1 Ser phosphorylation in primary rat myotubes--a potential model for PCOS-related insulin resistance. PLoS ONE 2009, 4, e4274. [Google Scholar] [CrossRef] [PubMed] [Green Version]
- Ciaraldi, T.P.; Aroda, V.; Mudaliar, S.; Chang, R.J.; Henry, R.R. Polycystic ovary syndrome is associated with tissue-specific differences in insulin resistance. J. Clin. Endocrinol. Metab. 2009, 94, 157–163. [Google Scholar] [CrossRef] [PubMed] [Green Version]
- Corbould, A.; Dunaif, A. The adipose cell lineage is not intrinsically insulin resistant in polycystic ovary syndrome. Metabolism 2007, 56, 716–722. [Google Scholar] [CrossRef] [PubMed] [Green Version]
- Corbould, A.; Kim, Y.B.; Youngren, J.F.; Pender, C.; Kahn, B.B.; Lee, A.; Dunaif, A. Insulin resistance in the skeletal muscle of women with PCOS involves intrinsic and acquired defects in insulin signaling. Am. J. Physiol. Endocrinol. Metab. 2005, 288, E1047–E1054. [Google Scholar] [CrossRef] [Green Version]
- Dantas, W.S.; Murai, I.H.; Perandini, L.A.; Azevedo, H.; Moreira-Filho, C.A.; Camara, N.O.; Roschel, H.; Gualano, B. Acute exercise elicits differential expression of insulin resistance genes in the skeletal muscle of patients with polycystic ovary syndrome. Clin. Endocrinol. 2017, 86, 688–697. [Google Scholar] [CrossRef]
- Højlund, K.; Glintborg, D.; Andersen, N.R.; Birk, J.B.; Treebak, J.T.; Frøsig, C.; Beck-Nielsen, H.; Wojtaszewski, J.F. Impaired insulin-stimulated phosphorylation of Akt and AS160 in skeletal muscle of women with polycystic ovary syndrome is reversed by pioglitazone treatment. Diabetes 2008, 57, 357–366. [Google Scholar] [CrossRef] [Green Version]
- Glintborg, D.; Højlund, K.; Andersen, N.R.; Hansen, B.F.; Beck-Nielsen, H.; Wojtaszewski, J.F. Impaired insulin activation and dephosphorylation of glycogen synthase in skeletal muscle of women with polycystic ovary syndrome is reversed by pioglitazone treatment. J. Clin. Endocrinol. Metab. 2008, 93, 3618–3626. [Google Scholar] [CrossRef] [Green Version]
- Corbould, A.; Zhao, H.; Mirzoeva, S.; Aird, F.; Dunaif, A. Enhanced mitogenic signaling in skeletal muscle of women with polycystic ovary syndrome. Diabetes 2006, 55, 751–759. [Google Scholar] [CrossRef] [Green Version]
- Ozes, O.N.; Akca, H.; Mayo, L.D.; Gustin, J.A.; Maehama, T.; Dixon, J.E.; Donner, D.B. A phosphatidylinositol 3-kinase/Akt/mTOR pathway mediates and PTEN antagonizes tumor necrosis factor inhibition of insulin signaling through insulin receptor substrate-1. Proc. Natl. Acad. Sci. USA 2001, 98, 4640–4645. [Google Scholar] [CrossRef] [Green Version]
- Dufner, A.; Thomas, G. Ribosomal S6 kinase signaling and the control of translation. Exp. Cell Res. 1999, 253, 100–109. [Google Scholar] [CrossRef]
- Weng, Q.P.; Kozlowski, M.; Belham, C.; Zhang, A.; Comb, M.J.; Avruch, J. Regulation of the p70 S6 kinase by phosphorylation in vivo. Analysis using site-specific anti-phosphopeptide antibodies. J. Biol. Chem. 1998, 273, 16621–16629. [Google Scholar] [CrossRef] [PubMed] [Green Version]
- ThermoFisher Scientific. Available online: https://www.thermofisher.com/antibody/product/ATP5A1-Antibody-clone-7H10BD4F9-Monoclonal/459240 (accessed on 24 October 2020).
- Abcam. Available online: https://www.abcam.com/slow-skeletal-myosin-heavy-chain-antibody-noq754d-ab11083.html (accessed on 24 October 2020).
- Vector Laboratories. Available online: https://vectorlabs.com/dylight-488-goat-anti-rabbit-igg-antibody.html (accessed on 24 October 2020).
- Vector Laboratories. Available online: https://vectorlabs.com/dylight-488-horse-anti-mouse-igg-antibody.html (accessed on 24 October 2020).
- Vector Laboratories. Available online: https://vectorlabs.com/dylight-549-horse-anti-mouse-igg-antibody.html (accessed on 24 October 2020).
- Vector Laboratories. Available online: https://vectorlabs.com/dylight-549-goat-anti-rabbit-igg-antibody.html (accessed on 24 October 2020).
- ABclonal. Available online: https://abclonal.com/catalog-antibodies/GAPDHMousemAb/AC002 (accessed on 24 October 2020).
- Cell Signaling Technology. Available online: https://www.cellsignal.com/products/primary-antibodies/phospho-irs-1-ser636-639-antibody/2388?Ntk=Products&Ntt=2388 (accessed on 24 October 2020).
- Cell Signaling Technology. Available online: https://www.cellsignal.com/products/primary-antibodies/irs-1-antibody/2382?Ntk=Products&Ntt=2382 (accessed on 24 October 2020).
- Cell Signaling Technology. Available online: https://www.cellsignal.com/products/primary-antibodies/insulin-receptor-b-4b8-rabbit-mab/3025?Ntk=Products&Ntt=3025 (accessed on 24 October 2020).
- Cell Signaling Technology. Available online: https://www.cellsignal.com/products/primary-antibodies/phospho-akt-ser473-antibody/9271?Ntk=Products&Ntt=9271 (accessed on 24 October 2020).
- Cell Signaling Technology. Available online: https://www.cellsignal.com/products/primary-antibodies/akt-antibody/9272?Ntk=Products&Ntt=9272 (accessed on 24 October 2020).
- Cell Signaling Technology. Available online: https://www.cellsignal.com/products/primary-antibodies/phospho-p70-s6-kinase-thr389-antibody/9205?Ntk=Products&Ntt=9205 (accessed on 24 October 2020).
- Cell Signaling Technology. Available online: https://www.cellsignal.com/products/primary-antibodies/p70-s6-kinase-antibody/9202?Ntk=Products&Ntt=9202 (accessed on 24 October 2020).
- Li-Cor, Inc. Available online: https://www.licor.com/bio/reagents/irdye-680rd-donkey-anti-mouse-igg-secondary-antibody (accessed on 24 October 2020).
- Li-Cor, Inc. Available online: https://www.licor.com/bio/reagents/irdye-800cw-donkey-anti-rabbit-igg-secondary-antibody (accessed on 24 October 2020).


Publisher’s Note: MDPI stays neutral with regard to jurisdictional claims in published maps and institutional affiliations. |
© 2020 by the authors. Licensee MDPI, Basel, Switzerland. This article is an open access article distributed under the terms and conditions of the Creative Commons Attribution (CC BY) license (http://creativecommons.org/licenses/by/4.0/).
Share and Cite
DeChick, A.; Hetz, R.; Lee, J.; Speelman, D.L. Increased Skeletal Muscle Fiber Cross-Sectional Area, Muscle Phenotype Shift, and Altered Insulin Signaling in Rat Hindlimb Muscles in a Prenatally Androgenized Rat Model for Polycystic Ovary Syndrome. Int. J. Mol. Sci. 2020, 21, 7918. https://0-doi-org.brum.beds.ac.uk/10.3390/ijms21217918
DeChick A, Hetz R, Lee J, Speelman DL. Increased Skeletal Muscle Fiber Cross-Sectional Area, Muscle Phenotype Shift, and Altered Insulin Signaling in Rat Hindlimb Muscles in a Prenatally Androgenized Rat Model for Polycystic Ovary Syndrome. International Journal of Molecular Sciences. 2020; 21(21):7918. https://0-doi-org.brum.beds.ac.uk/10.3390/ijms21217918
Chicago/Turabian StyleDeChick, Auryana, Rebecca Hetz, Jack Lee, and Diana L. Speelman. 2020. "Increased Skeletal Muscle Fiber Cross-Sectional Area, Muscle Phenotype Shift, and Altered Insulin Signaling in Rat Hindlimb Muscles in a Prenatally Androgenized Rat Model for Polycystic Ovary Syndrome" International Journal of Molecular Sciences 21, no. 21: 7918. https://0-doi-org.brum.beds.ac.uk/10.3390/ijms21217918